Review

Investigating Metal Solidification with X-ray Imaging

Department of Materials, University of Oxford, Oxford OX1 3PH, UK
*
Authors to whom correspondence should be addressed.
These authors contributed equally to this work.
Metals 2022, 12(3), 395; https://doi.org/10.3390/met12030395
Submission received: 2 February 2022 / Revised: 16 February 2022 / Accepted: 19 February 2022 / Published: 24 February 2022

Abstract

:
In the last two decades, X-ray imaging techniques have been used increasingly to study metal solidification in real-time as, thanks to advances in X-ray sources (synchrotron and laboratory-based) and detector technology, images can now be obtained with spatio-temporal resolutions sufficient to record key phenomena and extract quantitative information, primarily relating to crystal growth. This paper presents an overview of the research conducted at the University of Oxford over the last 6 years as a partner in the UK’s Future Liquid Metal Engineering (LiME) Manufacturing Hub. The focus is on in situ X-ray radiography to investigate the solidification of Al alloys, including the formation of primary α -Al crystals, and the formation and growth of secondary intermetallic phases. Technologically, the thrust is to understand how to control as-cast phases, structures and element distributions, particularly elements associated with recycling, as a means to facilitate greater recirculation of aluminium alloys. We first present studies on refinement of primary α -Al, including extrinsic grain refinement using inoculation and intrinsic refinement based on dendrite fragmentation. Second, we describe studies on intermetallic phase formation and growth, because intermetallic fraction, morphology and distribution are frequently a limiting factor of alloy mechanical properties and recyclability. Then we present some of the latest progress in studying liquid flow during solidification and associated hot tear formation. Finally, future research directions are described.

1. Introduction

The mechanical properties of Al alloy components are frequently controlled by the microstructure that develops during solidification, because it is often impractical, impossible or not cost-effective to manipulate the as-cast microstructure (for example, by recrystallisation) via downstream, solid-state thermomechanical processing. Key microstructral features that evolve during solidification include the size and morphology of primary α -Al and secondary intermetallic compounds (IMCs), spatial segregation (re-distribution) of alloying elements, and solidification defects. Although some control of these features has been achieved by the Al industry, more options to manipulate the as-cast structure continue to be sought. For example, additions of a small amount of insoluble, micro-scale particles such as TiB 2 and TiC in the form of Al-Ti-B and Al-Ti-C master alloys are used to effectively change coarse, elongated columnar α -Al grains to a finer, equiaxed grain morphology, which in turn promotes more isotropic mechanical properties [1,2]. If the underlying mechanisms of this grain refinement effect were more fully understood and controllable, strategies for more efficient grain refinement, or even refinement of secondary solidification phases, might be developed.
Additional motivation to gain greater control over solidification and arising microstructures comes from the need to advance the recycling and recirculation of end-of-life Al products, to reduce energy consumption and associated carbon emissions. Aluminium alloy recirculation tends to lead to the accumulation of impurity elements (such as Fe and Si) at each cycle, reaching concentrations that are progressively potentially more harmful to final properties [3,4]. Many metallic impurities have relatively low solubility in solid Al and tend to segregate during solidification and eventually precipitate as coarse, faceted IMCs that downgrade the alloy mechanical performance. As a result, most current Al solidification processing relies on dilution of recycled alloys with smelted, virgin Al. If greater control over the formation and growth behaviour of IMCs might be achieved, it may allow the manipulation of IMC size, morphology and distribution in such a way as to enable a new generation of more impurity-tolerant processes and alloys.
Knowledge of the dynamics of Al alloy solidification, for both α -Al and IMCs, has primarily come from interpretation of post-solidification structures, combining microscopy, chemical analysis, diffraction, calorimetry, etc. [5,6,7,8,9,10,11]. Recently, with the advent of high-energy, high-brilliance synchrotrons and better laboratory-based X-ray sources, together with more efficient X-ray detectors, X-ray imaging techniques have been increasingly used to investigate solidification processes in real time. These techniques have allowed important dynamic information to be obtained such as crystal formation rate [12,13,14,15,16,17,18], estimates of nucleation undercoolings [12,19], instantaneous solute distributions [12,14,15,16,20], crystal fragmentation [21,22,23,24,25,26], and thermo-solutal convection patterns [17,20,27,28,29]. In this paper, we give an overview of our research work using in situ X-ray radiography of Al solidification. The work is divided into three themes: (a) grain refinement of primary α -Al dendrites, (b) nucleation and growth of Al-based IMCs, and (c) fluid flow during solidification, including both thermo-solutal convection and shrinkage-induced flow, and the resulting effects on microstructure.

2. Materials and Methods

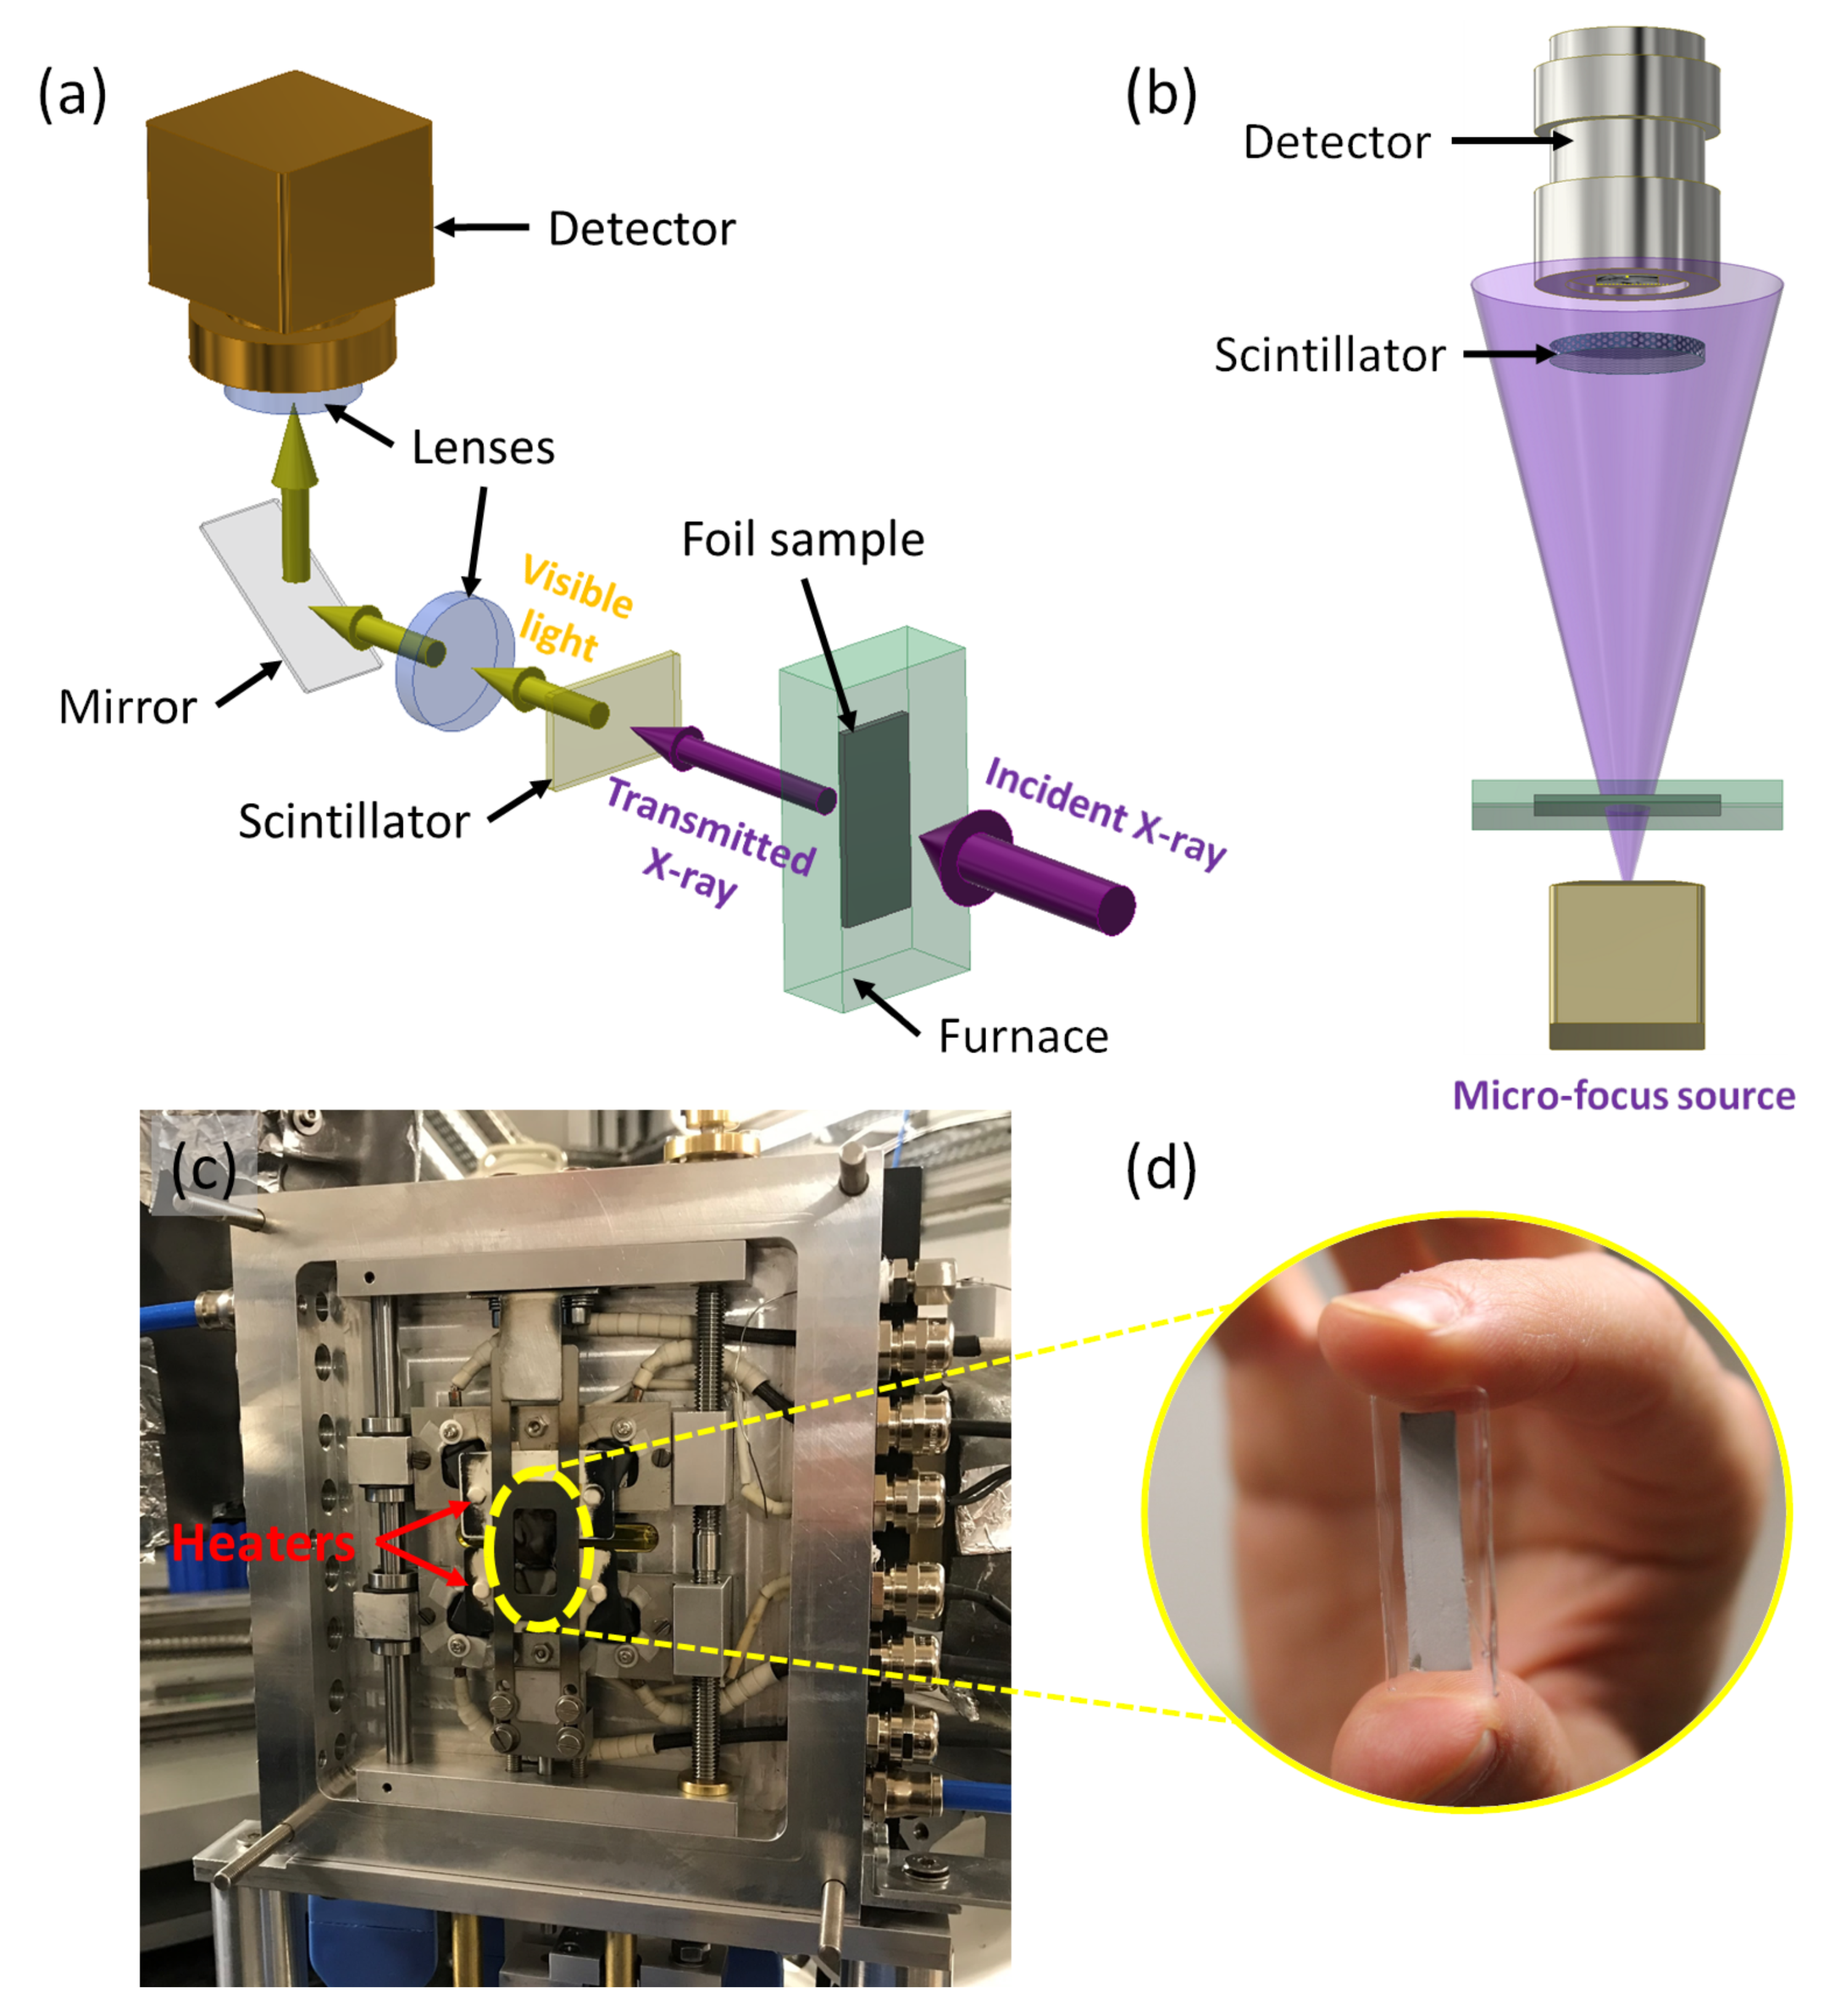
2.1. X-ray Radiography

In situ X-ray radiography experiments were carried out at the Diamond Light Source (UK), European Synchrotron Radiation Facility (ESRF, France), Soleil (France) and Petra III (Germany), and using laboratory-based apparatus in collaboration with the Norwegian University of Science and Technology (NTNU). Figure 1a,b show schematically the set-up for synchrotron and laboratory-based radiography experiments, respectively.
In the synchrotron set-up, a parallel incident X-ray beam illuminates a vertically mounted foil sample (150 to 300 μ m thick) in a Bridgeman furnace with controlled atmosphere (Ar). The transmitted X-ray is captured by a scintillator coupled with an optical system (mirrors and objective lenses), and projected onto a metal oxide semiconductor (CMOS) detector [12,21,30] (Figure 1a). The latest version of our bespoke solidification furnace for radiography experiments is shown in Figure 1c. The furnace comprises two vertically aligned plate heaters with a gap of ∼ 4 m m between them over which the sample is placed and through which X-rays pass. The heating/cooling of each heater is controlled by a PID algorithm and monitored by K-type thermocouples.
The laboratory-based X-ray apparatus comprises a microfocus Mo-anode X-ray tube, a Bridgman furnace (XRMON-GF), and a charge-coupled device (CCD) detector (Vosskuhler DXI11000) with a Scint-X CsI scintillator. More detailed description of the apparatus can be found in [31,32,33]. Different from the parallel beam used at sysnchrotrons, a laboratory-based X-ray source produces a conical beam and relies on the beam divergence to provide magnification. The magnification is controlled by the ratio between the source-detector distance and source-sample distance. Although the beam flux and stability is not yet comparable with third-generation synchrotrons, laboratory-based X-ray imaging offers the advantage of horizontal solidification (Figure 1b), which removes any gravity effects from the imaging field of view, for example leading to significantly reduced liquid convection [33].

2.2. Sample Preparation

Preparation of all radiography samples followed a three-step procedure. First, bulk alloy ingots in a cylindrical shape of ∼ 30 m m diameter and ∼ 35 m m height were cast using a water cooled copper mould. The small casting geometry and therefore relatively fast cooling helped to suppress any significant elemental macro-segregation. Second, the ingots were sectioned into thin slices, which were ground with SiC paper (800, 1200, 2500 and 4000 grit) and then polished with diamond suspension (3 μ m and 1 μ m ) to thickness of 200 ± 5 μ m , with a final surface finish of 1 μ m . Finally, each polished foil sample was encapsulated in an X-ray transparent cell made of BN, glassy carbon or quartz (with an example shown in Figure 1d).

3. Results and Discussion

3.1. Grain Refinement of α -Al

As described earlier, a fine, equiaxed and homogeneous as-cast grain structure promotes alloy yield strength and toughness [6]; it also facilitates a uniform deformation response in any subsequent thermomechanical process. There are principally two approaches of grain refinement: an extrinsic approach using additions of insoluble inoculant particles that act as heterogeneous nucleation sites for grains/crystals; and an intrinsic approach that relies on fragmentation of existing columnar grains/crystals by applying external fields, also known as grain multiplication.

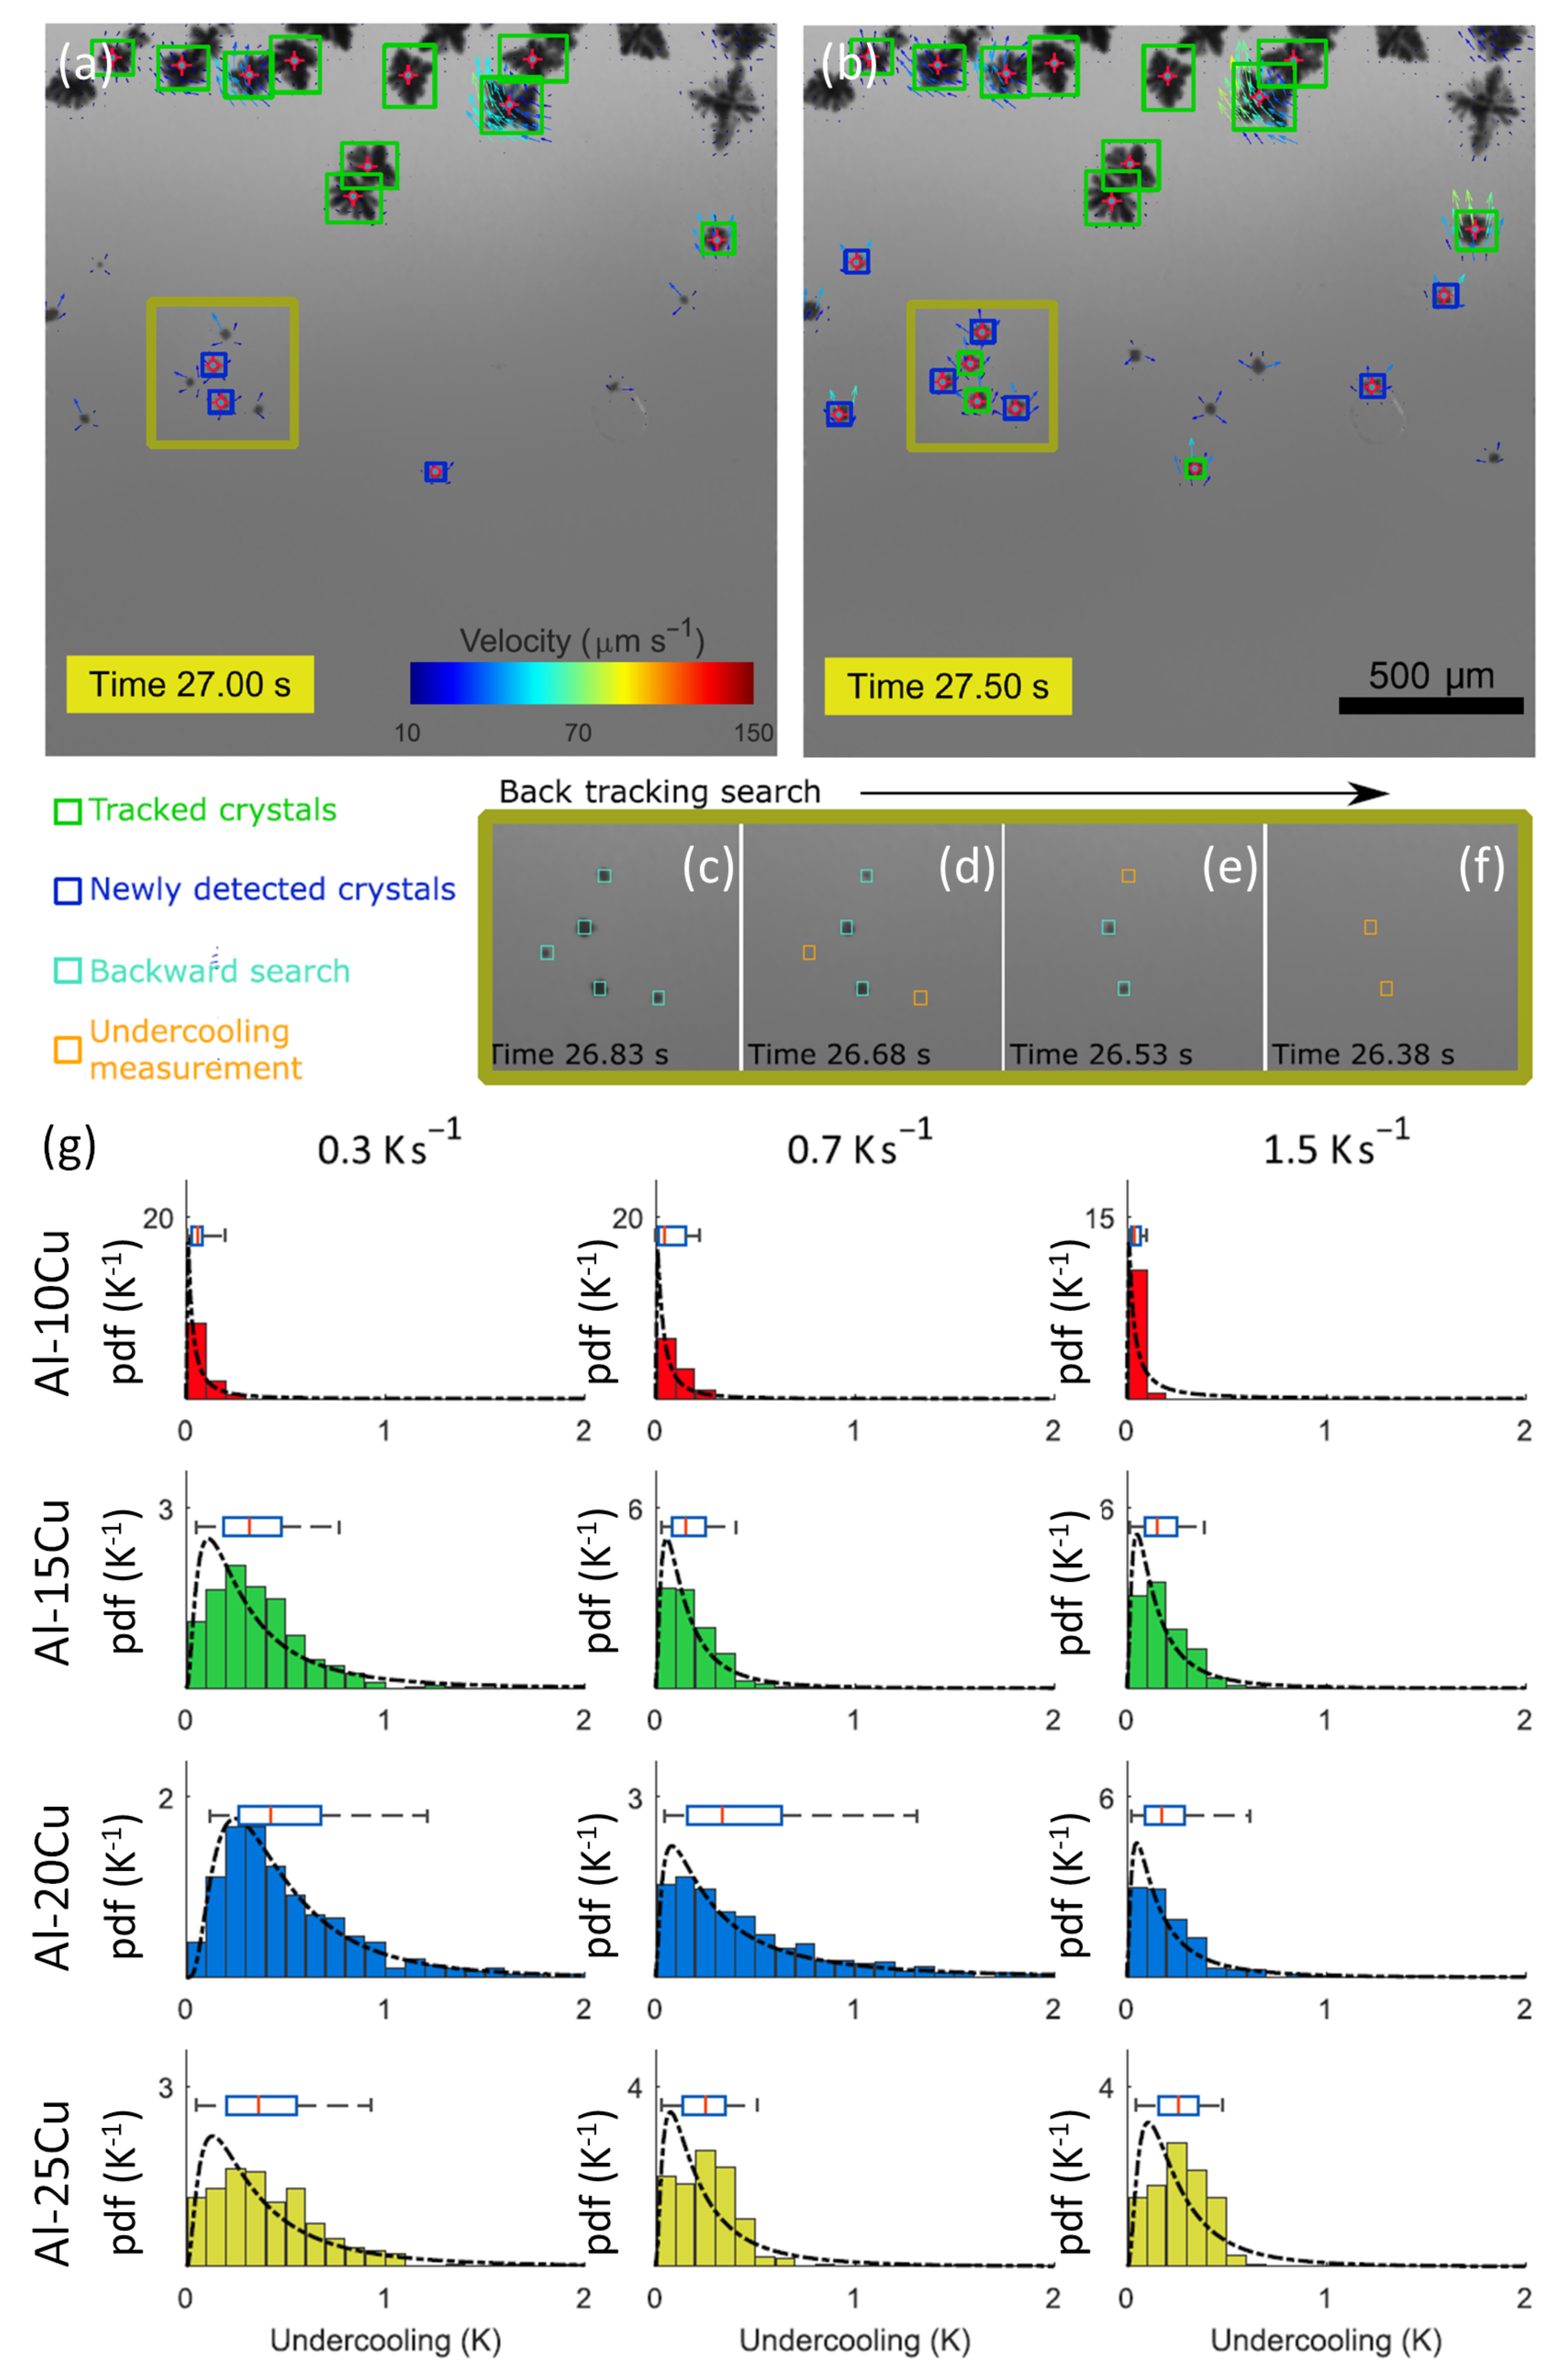
3.1.1. Extrinsic Refinement: Inoculation

Although additions of insoluble inoculants (such as TiB 2 and TiC) are the most widespread and effective method of reducing primary α -Al grain size in both commercial wrought and cast aluminium alloys, the efficiency is actually rather low in practice, with less than 1% of the added inoculant particles catalysing new grain formation [2]. Although this can be ascribed to the greater efficiency of the larger diameter inoculants (according to the free growth model of nucleation [34]) within the range of inoculant diameters used in practice, practical uncertainties remain. These include the effect of dynamic conditions on grain formation such as cooling rate and convection, and the influence of solute fields and alloy composition. Therefore, effort has been directed to understanding further the factors that control the solidification of α -Al [34,35,36,37,38,39,40,41,42,43], including through the application of radiography and tomography. However, the majority of these studies have concerned growth of pre-existing primary α -Al crystals, including morphological instability [44,45,46,47,48], dendrite fragmentation [21,23,27,49] and growth dynamics [50,51,52], rather than grain nucleation and formation. This is because the spatial and temporal resolution constraints have, until recently, been insufficient to capture the micro-scale crystals at their embryonic stage.
In our work, we combined high-resolution in situ X-ray radiography with machine learning techniques to provide a new, automated approach to identify multiple crystal formation events, and to estimate the associated local temperature. We have used this approach to reveal the effect of cooling rate, alloy composition and evolving solute fields on the formation behaviour of equiaxed α -Al dendrites [12]. So far, we have not resolved individual inoculant particles or the instant of α -Al nucleation on these particles, and so we use the term formation rather than nucleation. In this approach, first, we automatically recorded the location and instant of over 14,000 individual new crystals as they appeared. Then by tracking and extrapolating “backwards” in the video sequences with high temporal resolution, to the point immediately before each crystal appeared, we estimated the instantaneous Cu concentration at that point, based on the carefully calibrated extent of X-ray attenuation (Figure 2a–f). Using the Al-Cu phase diagram to convert liquid composition to temperature, Figure 2g presents the probability density functions (pdf) of the estimated formation undercoolings for four TiB 2 inoculated Al-Cu alloy compositions, each at three cooling rates. The distributions of undercoolings were asymmetric and fitted closely to a log-normal distribution (dotted line in Figure 2g). The mean undercooling for all the twelve experimental conditions was between 0.2 and 0.5 K, consistent with the high efficiency of TiB 2 inoculation. Overall, the measured undercoolings showed good agreement with the free growth model of heterogeneous nucleation and undercooling measurements obtained by calorimetry [34,53].
New insights were also revealed: crystal formation proceeded in repeating bursts in the time domain. Figure 3a–c show an example radiograph sequence of Al formation bursts in a TiB 2 inoculated Al-25wt.%Cu alloy, where the α -Al dendrites appeared in 3 distinct bands (labelled 1 to 3 across the frames). The corresponding time-resolved formation rate in Figure 3d confirmed the distinct bursts (yellow curve), whereas similar data for a more dilute Al-10wt.%Cu alloy showed much weaker bursts (red curve). The magnitude of the formation bursts was associated with the alloy composition via a solute-suppression mechanism. By mapping the Cu concentration in the liquid in the entire field of view, we showed that at the same solid fraction, the more concentrated alloy contained a significantly larger fraction of solute-rich liquid (Figure 3e). In this case, we conjectured that the more potent, larger diameter TiB 2 particles (but which were few in number) were increasingly likely to be located in these regions of solute suppressed nucleation. Therefore, the nucleation and formation of new crystals would tend to rely on the relatively less potent (requiring more available undercooling) but more populous, smaller diameter TiB 2 particles. This resulted in the distinct crystal formation bursts at slightly higher undercooling, leading to an overall enhanced nucleation efficiency [12]. This finding could lead to new approaches to grain refinement: deliberately less potent inoculants are designed in order to increase the achievable undercooling before α -Al crystal formation is catalysed, and consequently formation takes place as a pronounced and potent burst.

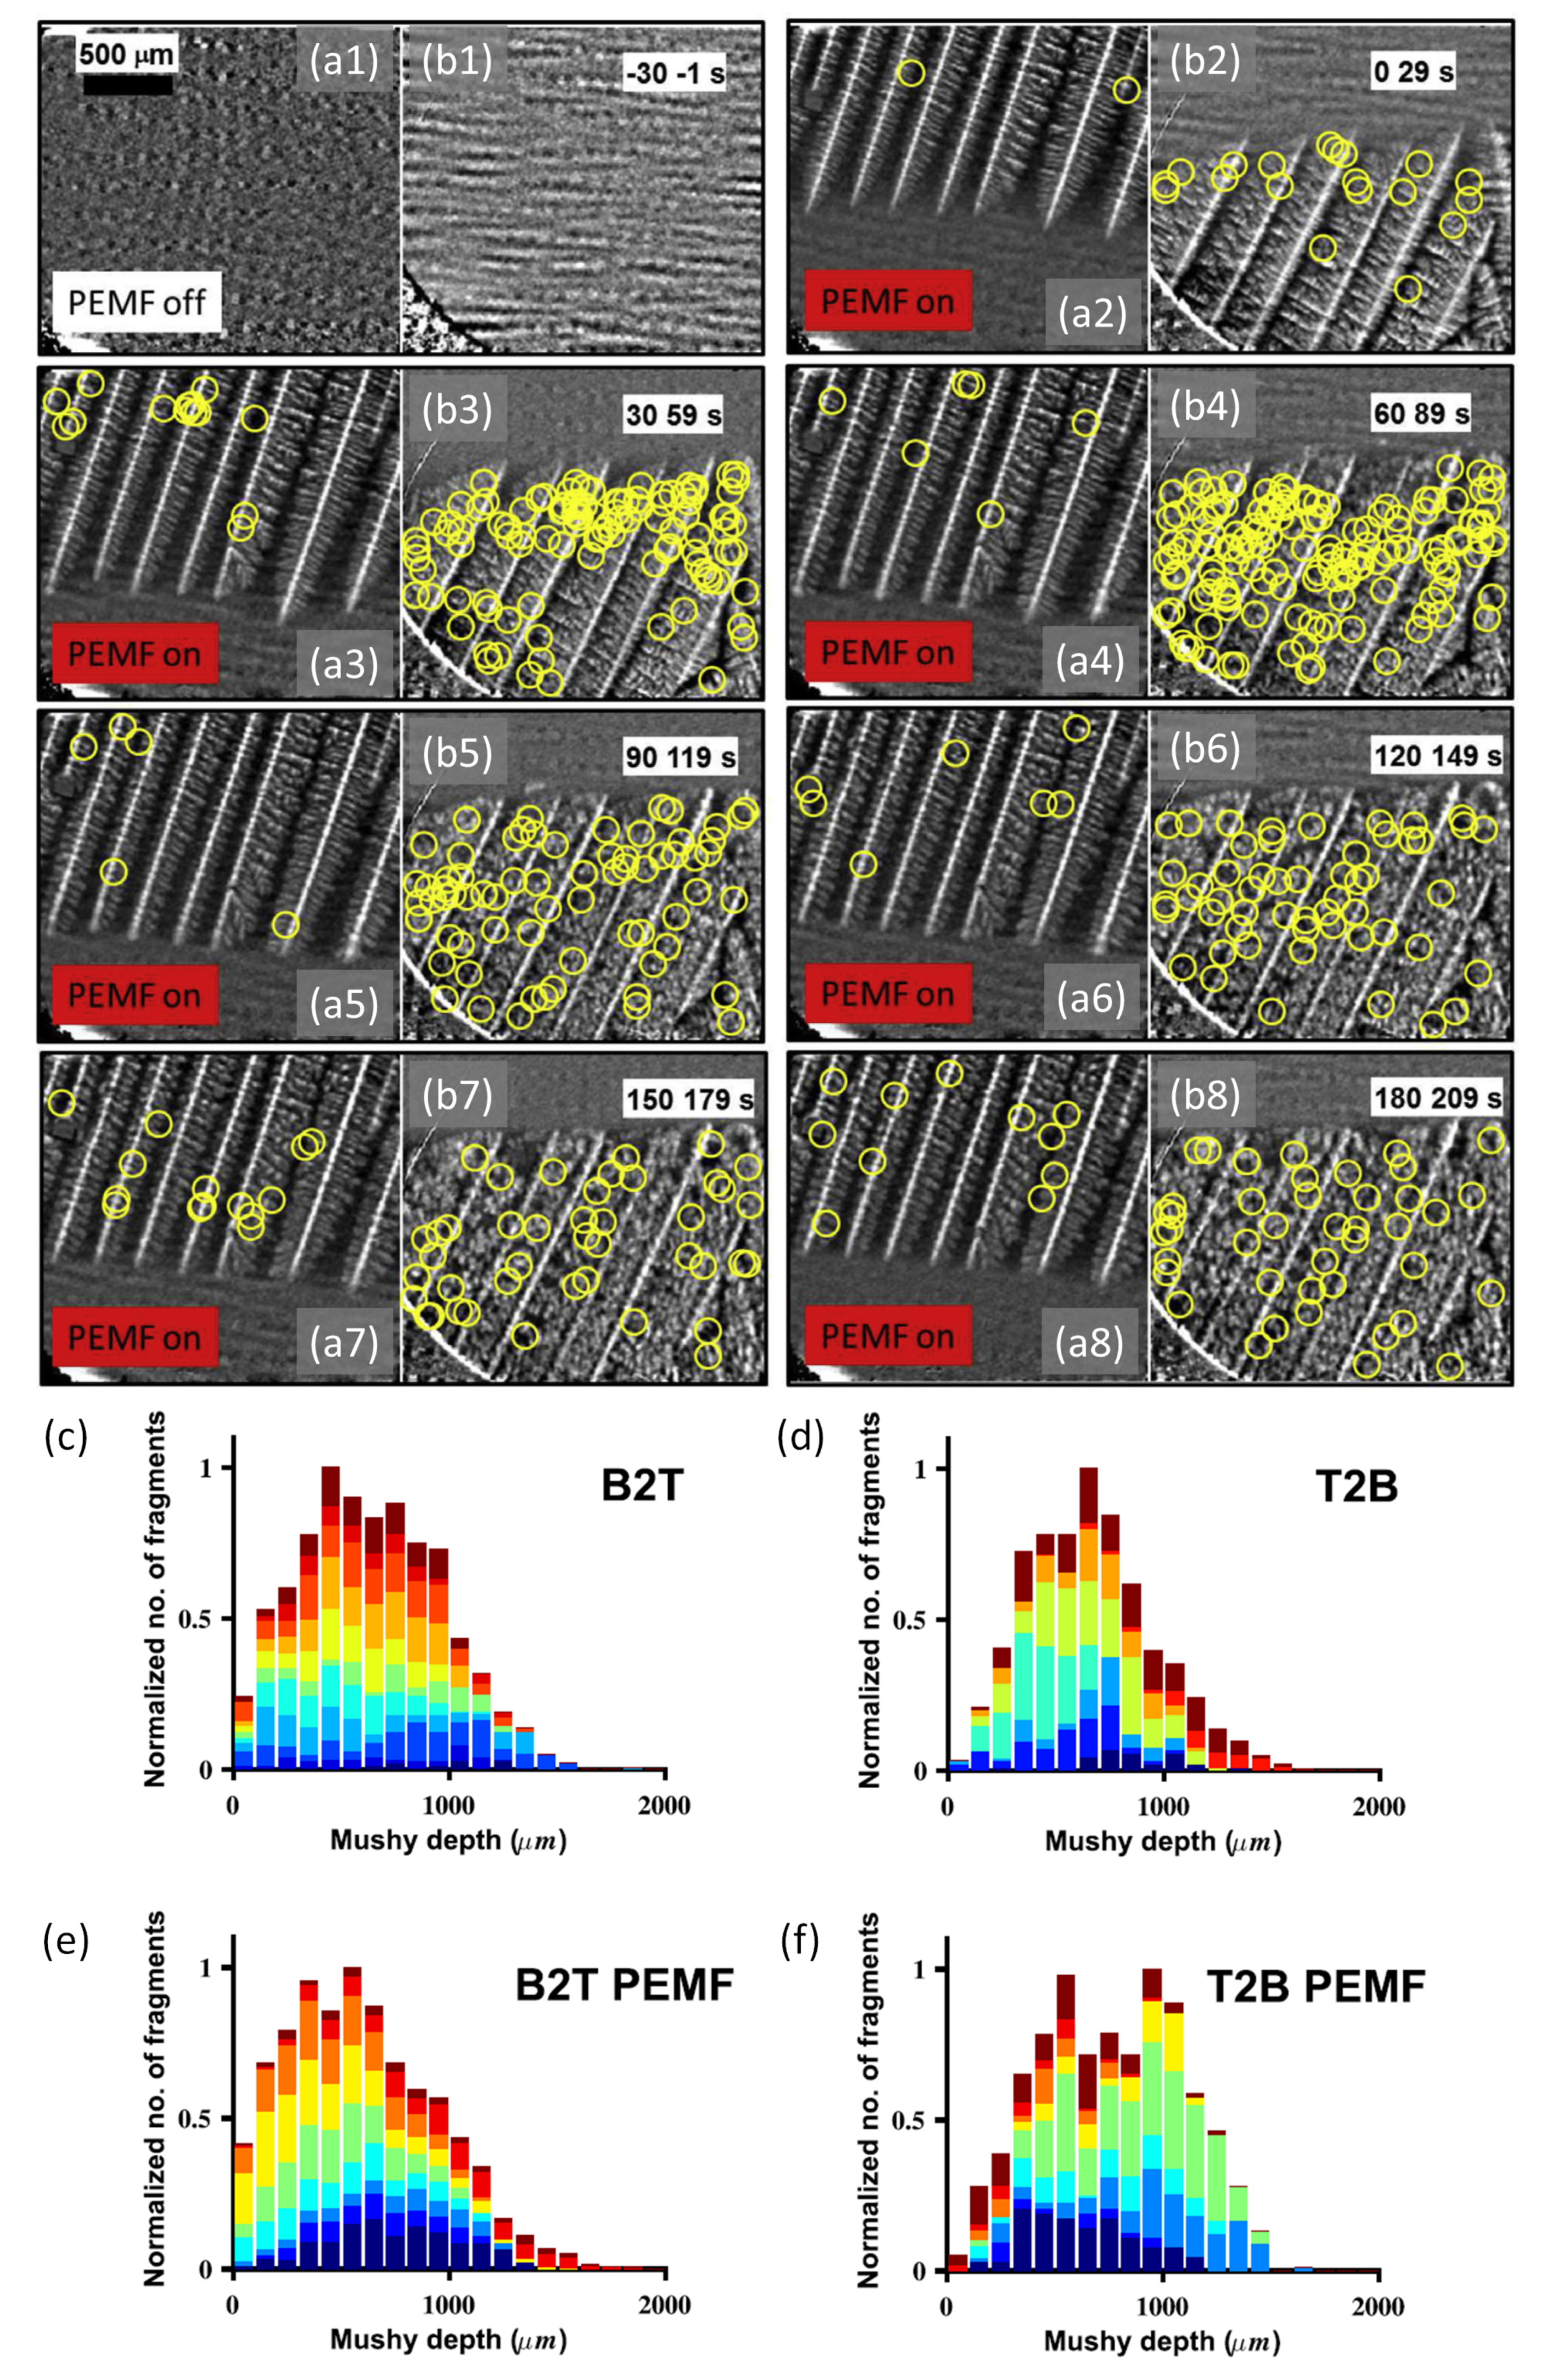
3.1.2. Intrinsic Refinement: Dendrite Fragmentation

A grain refinement effect can also be contrived by fragmentation of growing, pre-existing crystals, typically via the application of stirring or by external fields, such as a pulsed electromagnetic fields (PEMF). The resulting solid fragments are transported around the melt by convection and act as potent nucleation seeds and embryonic grains, leading to grain refinement. This approach is an important alternative to extrinsic grain refinement in alloy systems where the addition of potent nucleating particles is either unavailable, ineffective or prohibited by melt cleanliness requirements. Once again, although the practical effects of grain fragmentation and multiplication are well-known, some aspects of the underlying mechanisms are the subject of ongoing debate.
We investigated the spatial and temporal distribution of dendrite fragmentation during directional solidification of Al-Cu alloys, as a function of the magnitude of an applied PEMF [23]. Figure 4(a1–a8,b1–b8) show side-by-side two radiograph sequences of dendrite fragmentation for top-to-bottom (T2B, left paired image) and bottom-to-top (B2T, right paired image) solidification of an Al-15wt.%Cu alloy, under an external PEMF. Time t = 0 s was set when the columnar dendrites were contrived by the solidification conditions to be stationary, and the PEMF was then first applied. The yellow circles superimposed on each image indicate the location of manually identified fragmentation events within a time window of 30 s. The number of fragmentation events was relatively low in both B2T and T2B arrangements for the first 30 s. Subsequently, there was a rapid increase in the fragmentation rate for B2T solidification, whereas the fragmentation rate for T2B solidification showed no significant change, and remained significantly lower than the B2T arrangement. This difference suggested that direct mechanical action of the induced Lorentz force on dendrites was not the principal cause of dendrite fragmentation because this mechanism could reasonably be assumed to be insensitive to dendrite orientation. Quantifying the fragmentation events in all 24 experiments, Figure 4c–f show the normalised number fraction of dendrite fragments as a function of depth into the mushy zone (i.e., distance away from the dendrite tip front). The shape of the distributions were qualitatively similar despite the difference in solidification conditions. When best-fitted to a Gaussian distribution, the peak fragmentation rate was shown to occur at a depth of 500 μ m to 800 μ m into the mushy zone.
Instead of direct mechanical action, perturbation of the liquid solute concentration gradient in inter-dendritic channels was identified as the primary driving force for dendrite fragmentation. Figure 5a shows that the fragmentation rate increased approximately linearly with increasing local solute concentration gradient (Figure 5b). To explain this relationship, a solute-driven model of dendrite root re-melting was proposed that related the fragmentation rate to local concentration gradient of Cu: an environment with a steeper solute concentration gradient, when perturbed by PEMF-enhanced liquid convection, was more likely to lead to destabilisation of the local equilibrium between temperature, liquid composition and solid curvature. The consequence of this thermo-solutal perturbation was local re-melting of relatively high curvature solid regions, such as vulnerable dendrite roots (Figure 5c) [23].

3.2. Nucleation and Growth of IMCs in Al Alloys

X-ray imaging has more recently also been applied to study the nucleation/formation and growth of minority, ordered intermetallic compounds (IMCs), which are an important feature of most Al alloys [15,18,54,55,56,57,58,59,60]. Fe-rich Al IMCs, such as Al 13 Fe 4 , are not always desirable and may grow into coarse (∼10 μ m to several millimetres [61]), plate-like secondary phases in both cast and wrought alloys. The IMCs can act as strain concentrators that undermine alloy ductility and toughness [62,63]. Consequently understanding and controlling their nucleation and growth could have significant practical benefits. However, in situ study of Fe-rich IMCs presents particular challenges, primarily because of their low volume fraction (<2%), relatively small size, and the presence of a majority fraction of pre-formed α -Al.

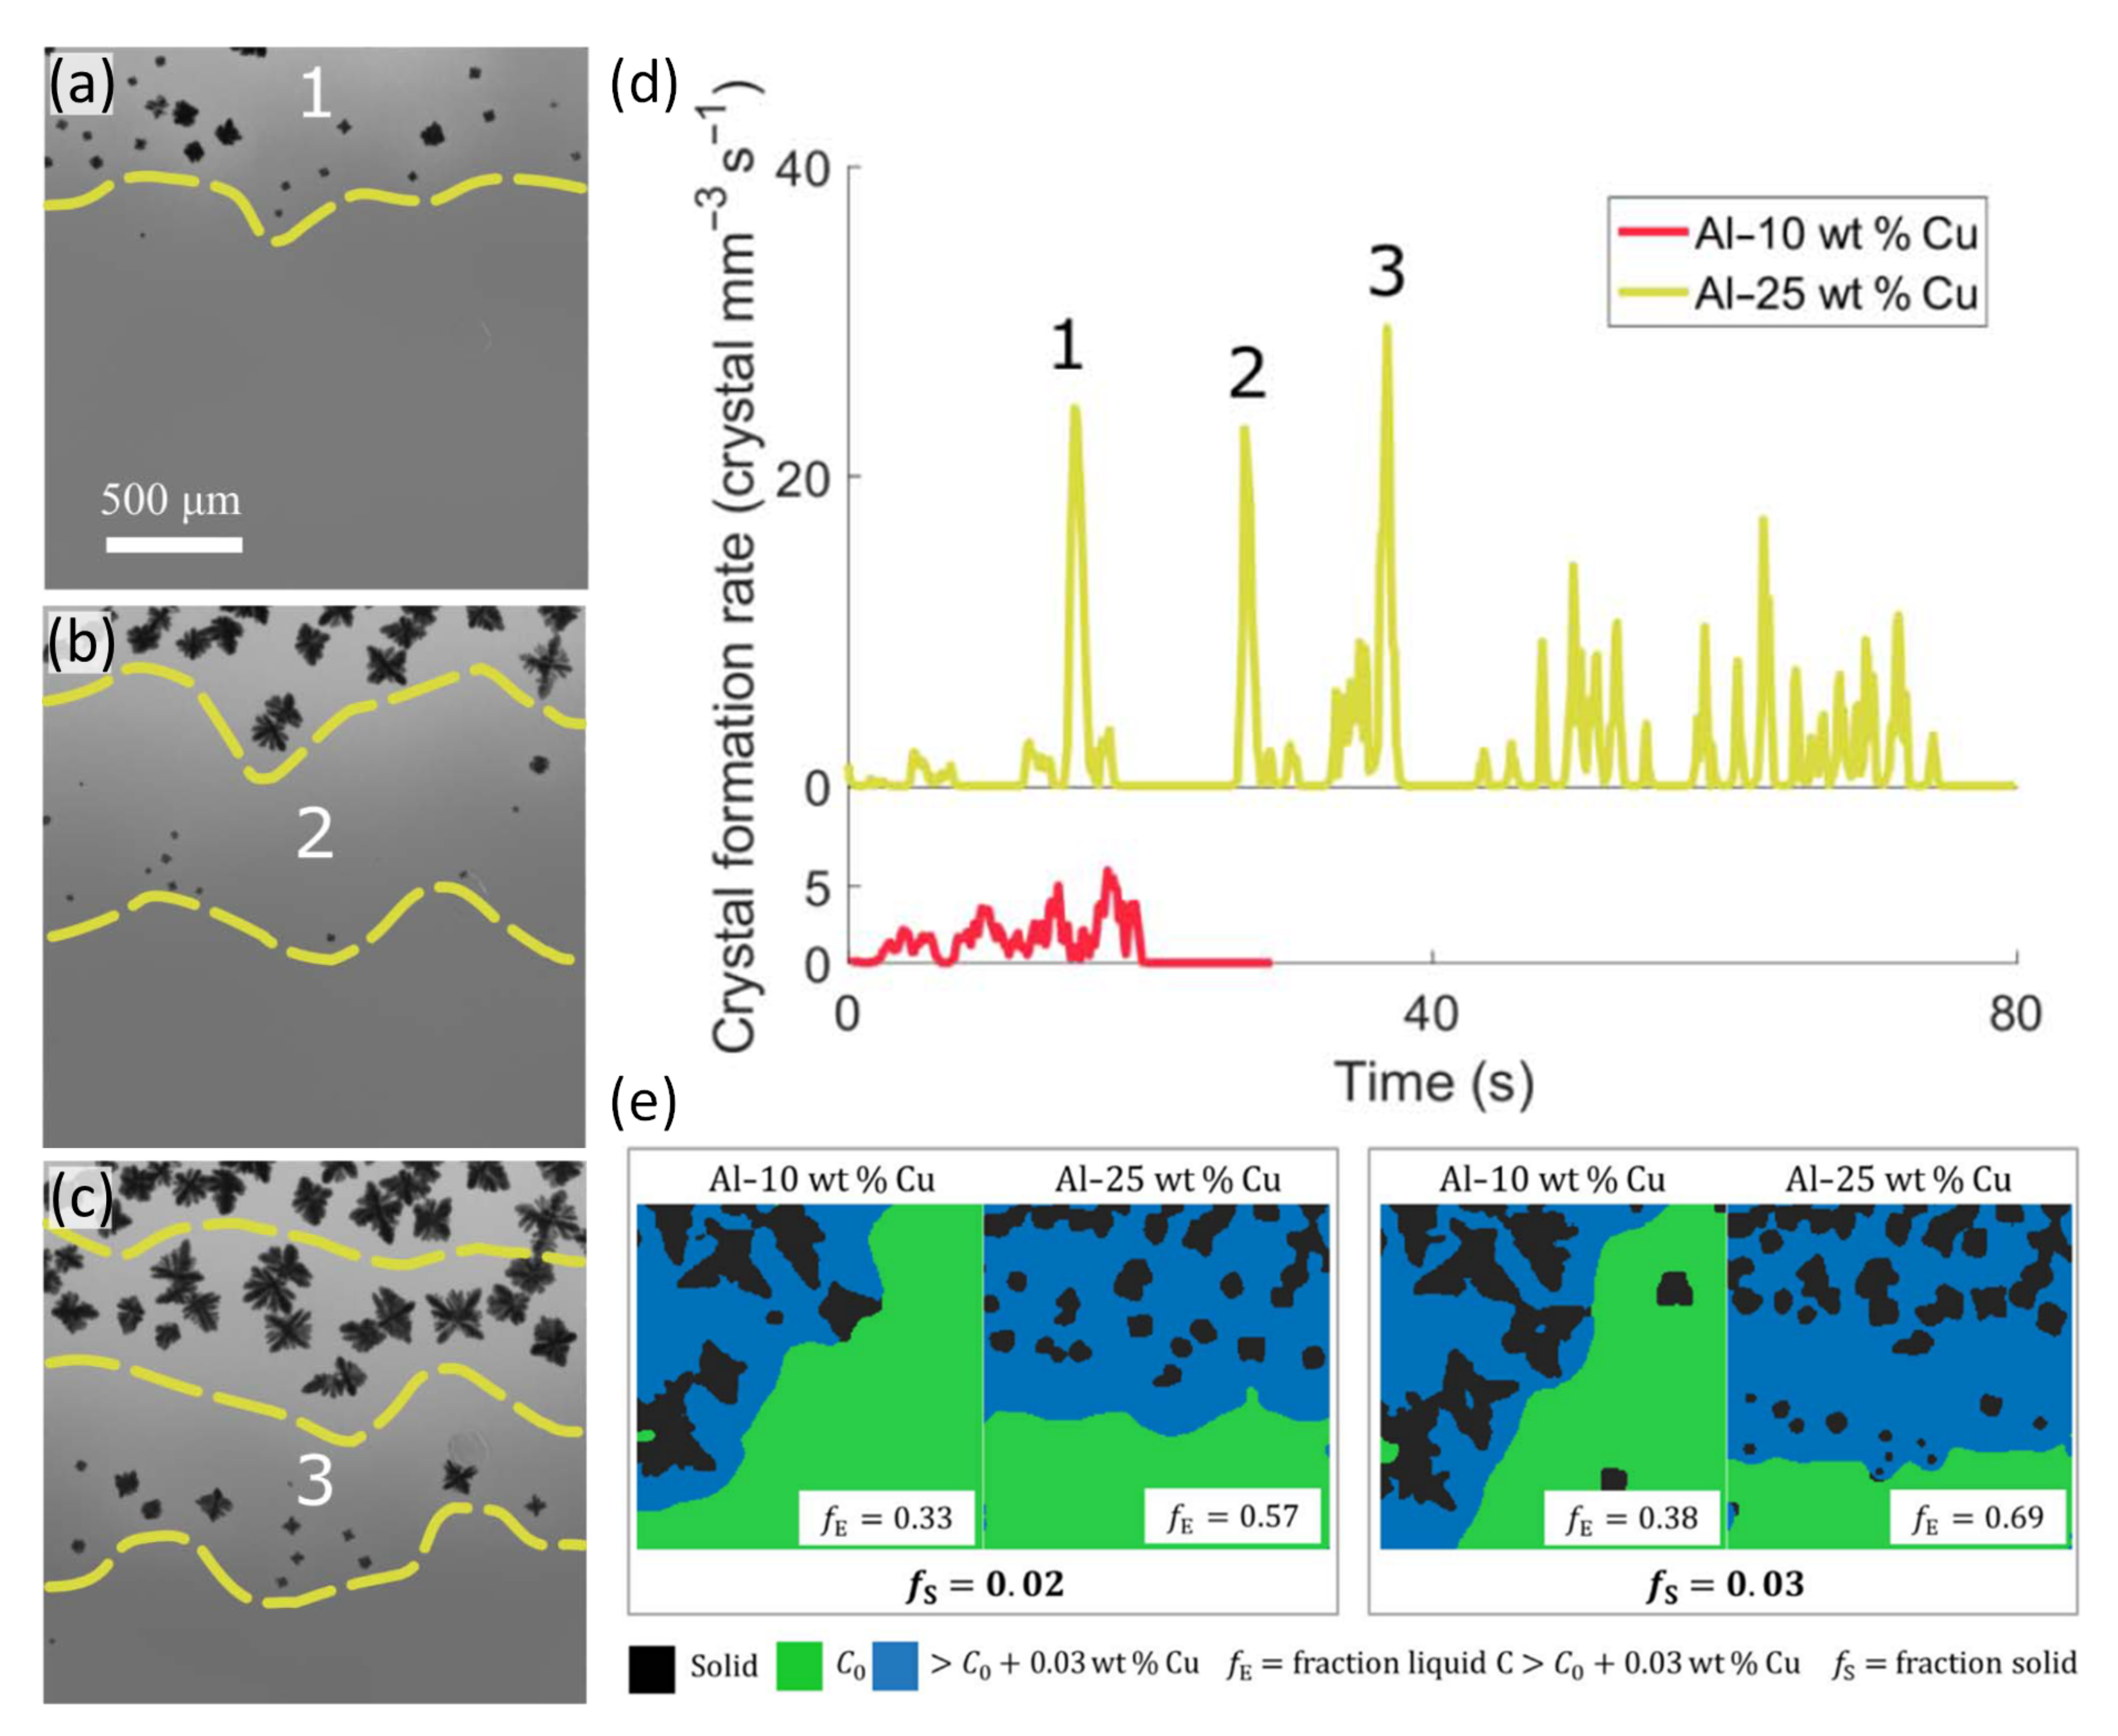
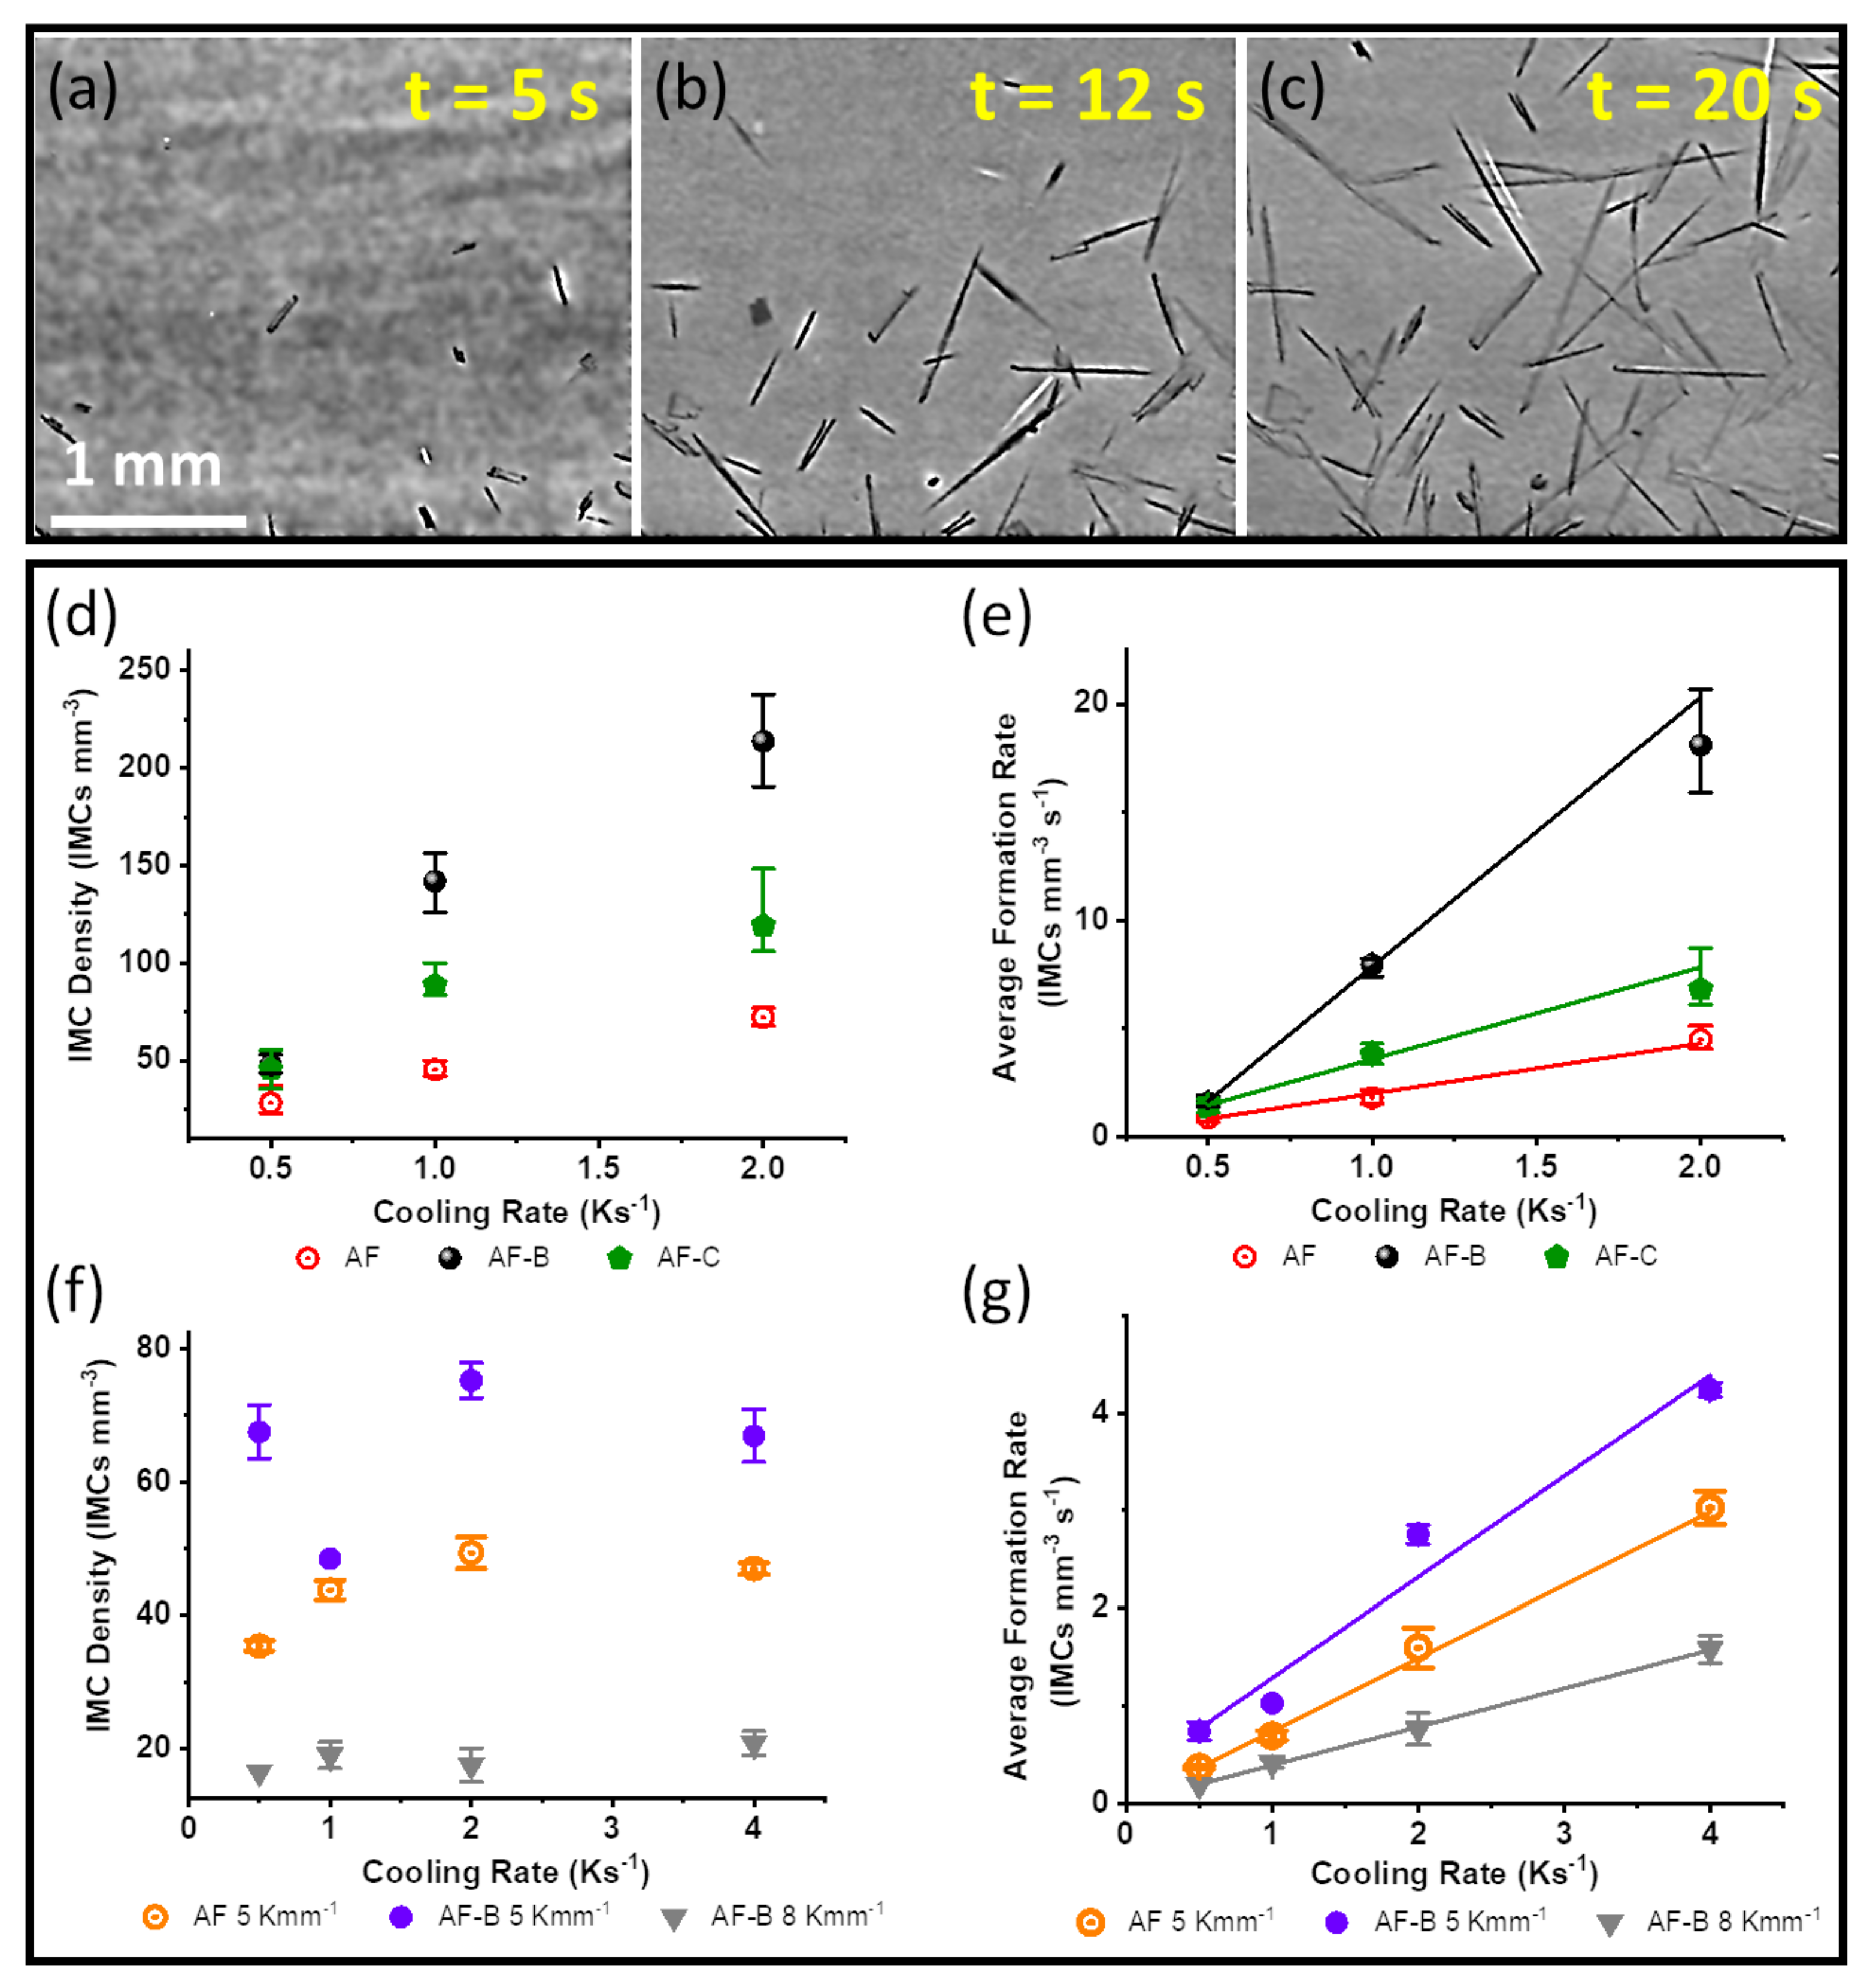
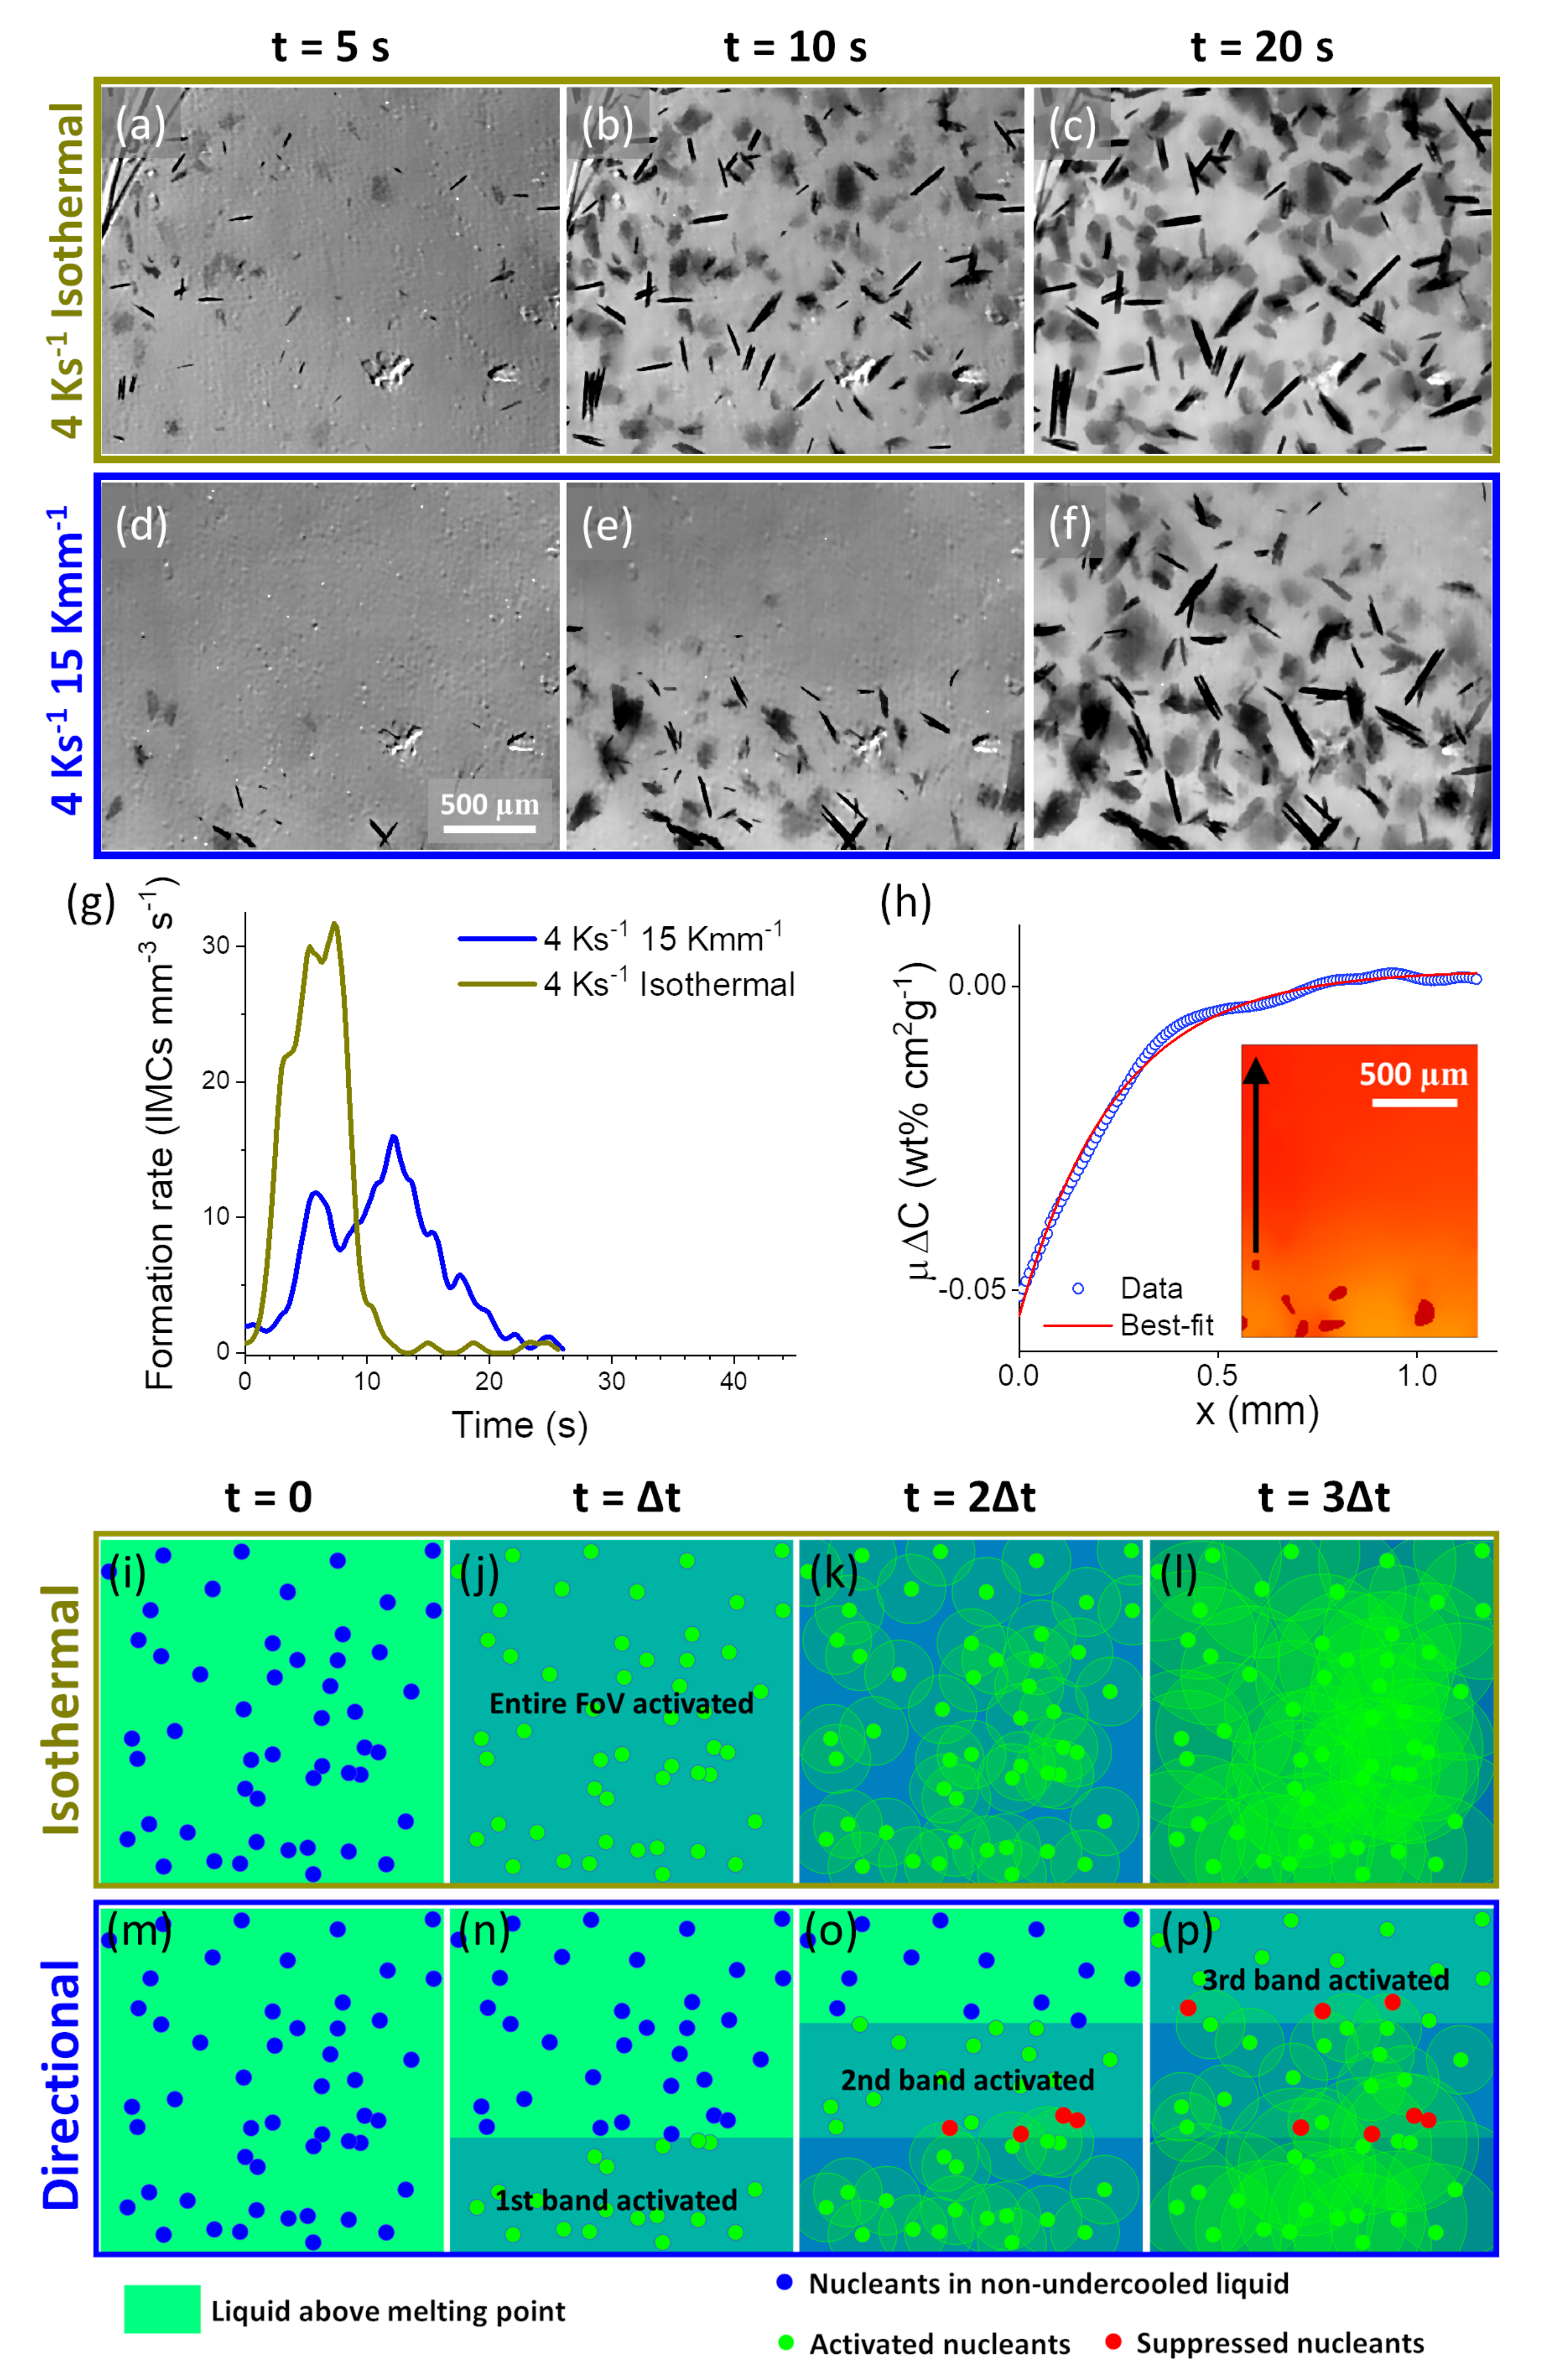
3.2.1. Nucleation of IMCs in Al Alloys

The formation of Al 13 Fe 4 was investigated using both synchrotron and laboratory X-ray facilities as the primary phase (first to form from the liquid) in a hypereutectic Al-3wt.%Fe alloy [15]. The objective was to study the kinetics of IMC formation under both directional and near-isothermal solidification conditions, along with any effect of TiB 2 and TiC inoculant additions that are commonly added to commercial Al alloys. Figure 6a–c present an example radiograph sequence of primary Al 13 Fe 4 forming in a TiB 2 inoculated Al-3wt.%Fe alloy during directional solidification at 2 K s 1 and 5 K m 1 . Formation of plate-like IMC crystals started near the bottom of the field of view and proceeded towards the top. Analysis of over 4500 crystal formation events showed that TiB 2 and TiC consistently increased the IMC number density (Figure 6d–f) and formation rate (Figure 6e–g) under all solidification conditions studied. The work also revealed a dominant effect of thermal gradient on the IMC number density and formation rate. For the TiB 2 inoculated alloy that solidified at 2 K s 1 , the IMC number density decreased sharply from 214 ± 24 IMCs mm 3 under isothermal conditions (Figure 6d) to 17 ± 3 IMCs mm 3 at the highest thermal gradient of 8 K m m 1 (Figure 6f), and the corresponding average formation rate dropped from 18 ± 3 IMCs mm 3 s 1 (Figure 6e) to <1 IMC mm 3 s 1 (Figure 6g). A model of IMC formation was proposed that explained the effect of thermal gradient and cooling rate on the final IMC number density and formation rate, by considering the volume of the undercooled liquid and the magnitude of undercooling within this volume. However, detection of the very earliest stages of the crystal formation and time-resolved measurement of the solute affect zone around growing IMCs were challenging due to limitations in X-ray absorption contrast and image quality [15].
To facilitate investigation of the IMC formation at an earlier stage and the associated solute effects, a model Al-Pt-Er alloy was designed, inoculated with TiB 2 particles, and formed a large fraction of a faceted Pt-rich Al 24 Pt 9 Er 4 IMC that is morphologically closely related to Al 13 Fe 4 [18]. Although an apparently strange alloy choice, the composition was designed to maximise X-ray absorption contrast between the solid Pt-rich IMCs and the corresponding Pt-depleted surrounding liquid. This would enable early detection of IMC formation events along with resolution of the associated solute diffusion fields. Similarly to α -Al, formation bursts were again observed. Under isothermal cooling (Figure 7a–c and the gold curve in Figure 7g), almost all IMC crystals formed uniformly across the field of view in 10 s (Figure 7a,b), followed by crystal growth (Figure 7c). When the alloy was solidified with a thermal gradient of 15 K m m 1 (Figure 7d–f and the blue curve in Figure 7g), IMC formation proceeded more progressively from bottom to top over ∼20 s. Overall, isothermal cooling (Figure 7a–c) led to a larger IMC number density of 197 IMCs mm 3 compared with 160 IMCs mm 3 in directional cooling.
To explain these trends, Figure 7h shows a plot of the micro-segregation of Pt, measured in the liquid ahead of a typical growing IMC, along the black arrow in the inset radiograph of the Pt diffusion field. Pt was depleted in the vicinity of the solid/liquid interface ( x = 0 ) as a result of its preferential segregation into the Pt-rich IMC, leading to reduced local liquid undercooling near the interface. The red curve in Figure 7h represents a best-fit to the best known and simplest theory of micro-segregation [64]. Figure 7i–p show schematics that describe the interaction of the Pt solute field with potential potent nuclei in the remaining liquid, for ideally isothermal (Figure 7i–l) and directional solidification (Figure 7m–p).
At time t = 0 , all the liquid is above the alloy melting point, and it is assumed that there are 50 potent nucleants (indicated by the blue dots in Figure 7i–m) distributed randomly in the field of view. At time t = Δ t in isothermal cooling, when the liquid is now sufficiently undercooled, all similar nucleants are activated to catalyse crystal formation simultaneously (coloured green in Figure 7j); for directional cooling at the same instant, only nucleants near the (cooler) bottom experience sufficient undercooling to become activated (Figure 7n). At the following time instants of t = 2 Δ t and t = 3 Δ t , there are no new nucleation events under isothermal cooling (Figure 7k,l), because all the potent nucleants have already been activated, and any remaining slightly less efficient nucleants are now sitting in solute-depleted liquid (green discs in the figures). At the same instants for directional cooling, the liquid in the middle and the top is undercooled successively (Figure 7o,p). However, due to the same solute depletion and undercooling reduction effect caused by the growth of the earlier formed crystals and the rapid development of a surrounding diffusion field, potential potent nucleants encompassed by the green discs are dormant (red dots). Overall, 7 out of 50 (14%) nucleants, activated under isothermal cooling, are suppressed due to solute depleted liquid under directional cooling.
Taking our crystal formation investigations of primary α -Al and Al-based IMCs together, we see that the formation of both α -Al and IMCs proceeded in bursts (or waves), especially for isothermal cooling, because of the interaction of solute fields with potential catalysing nucleants in the remaining liquid. However, when comparing the details of this solute suppression effect for disordered α -Al (Section 3.1.1) and ordered IMCs, there were differences: solute suppression promoted the formation of α -Al crystals but led to less IMC crystals. This difference arises due to the relatively small energy barrier for α -Al to nucleate on TiB 2 but relatively high nucleation barrier for the ordered, faceted IMCs related to the greater difficulty of atom attachment onto IMC facets, reflected in their higher entropy of fusion [65,66]. Although not measured in our experiments, previous work suggests IMC nucleation undercoolings can lie in the range 10 K to 30 K [67]. Consequently, we speculate that IMCs likely formed only on the largest, most efficient catalysing TiB 2 particles (with diameter > 6 μ m ), which accounted for only ∼0.5% of the total TiB 2 number density added. Unlike α -Al which is formed at undercoolings < 1 K and which can easily form, even on slightly less efficient nucleants, IMCs tended to coarsen as cooling proceeded rather than form new IMC crystals on less efficient nucleants, especially under conditions of solute suppression.

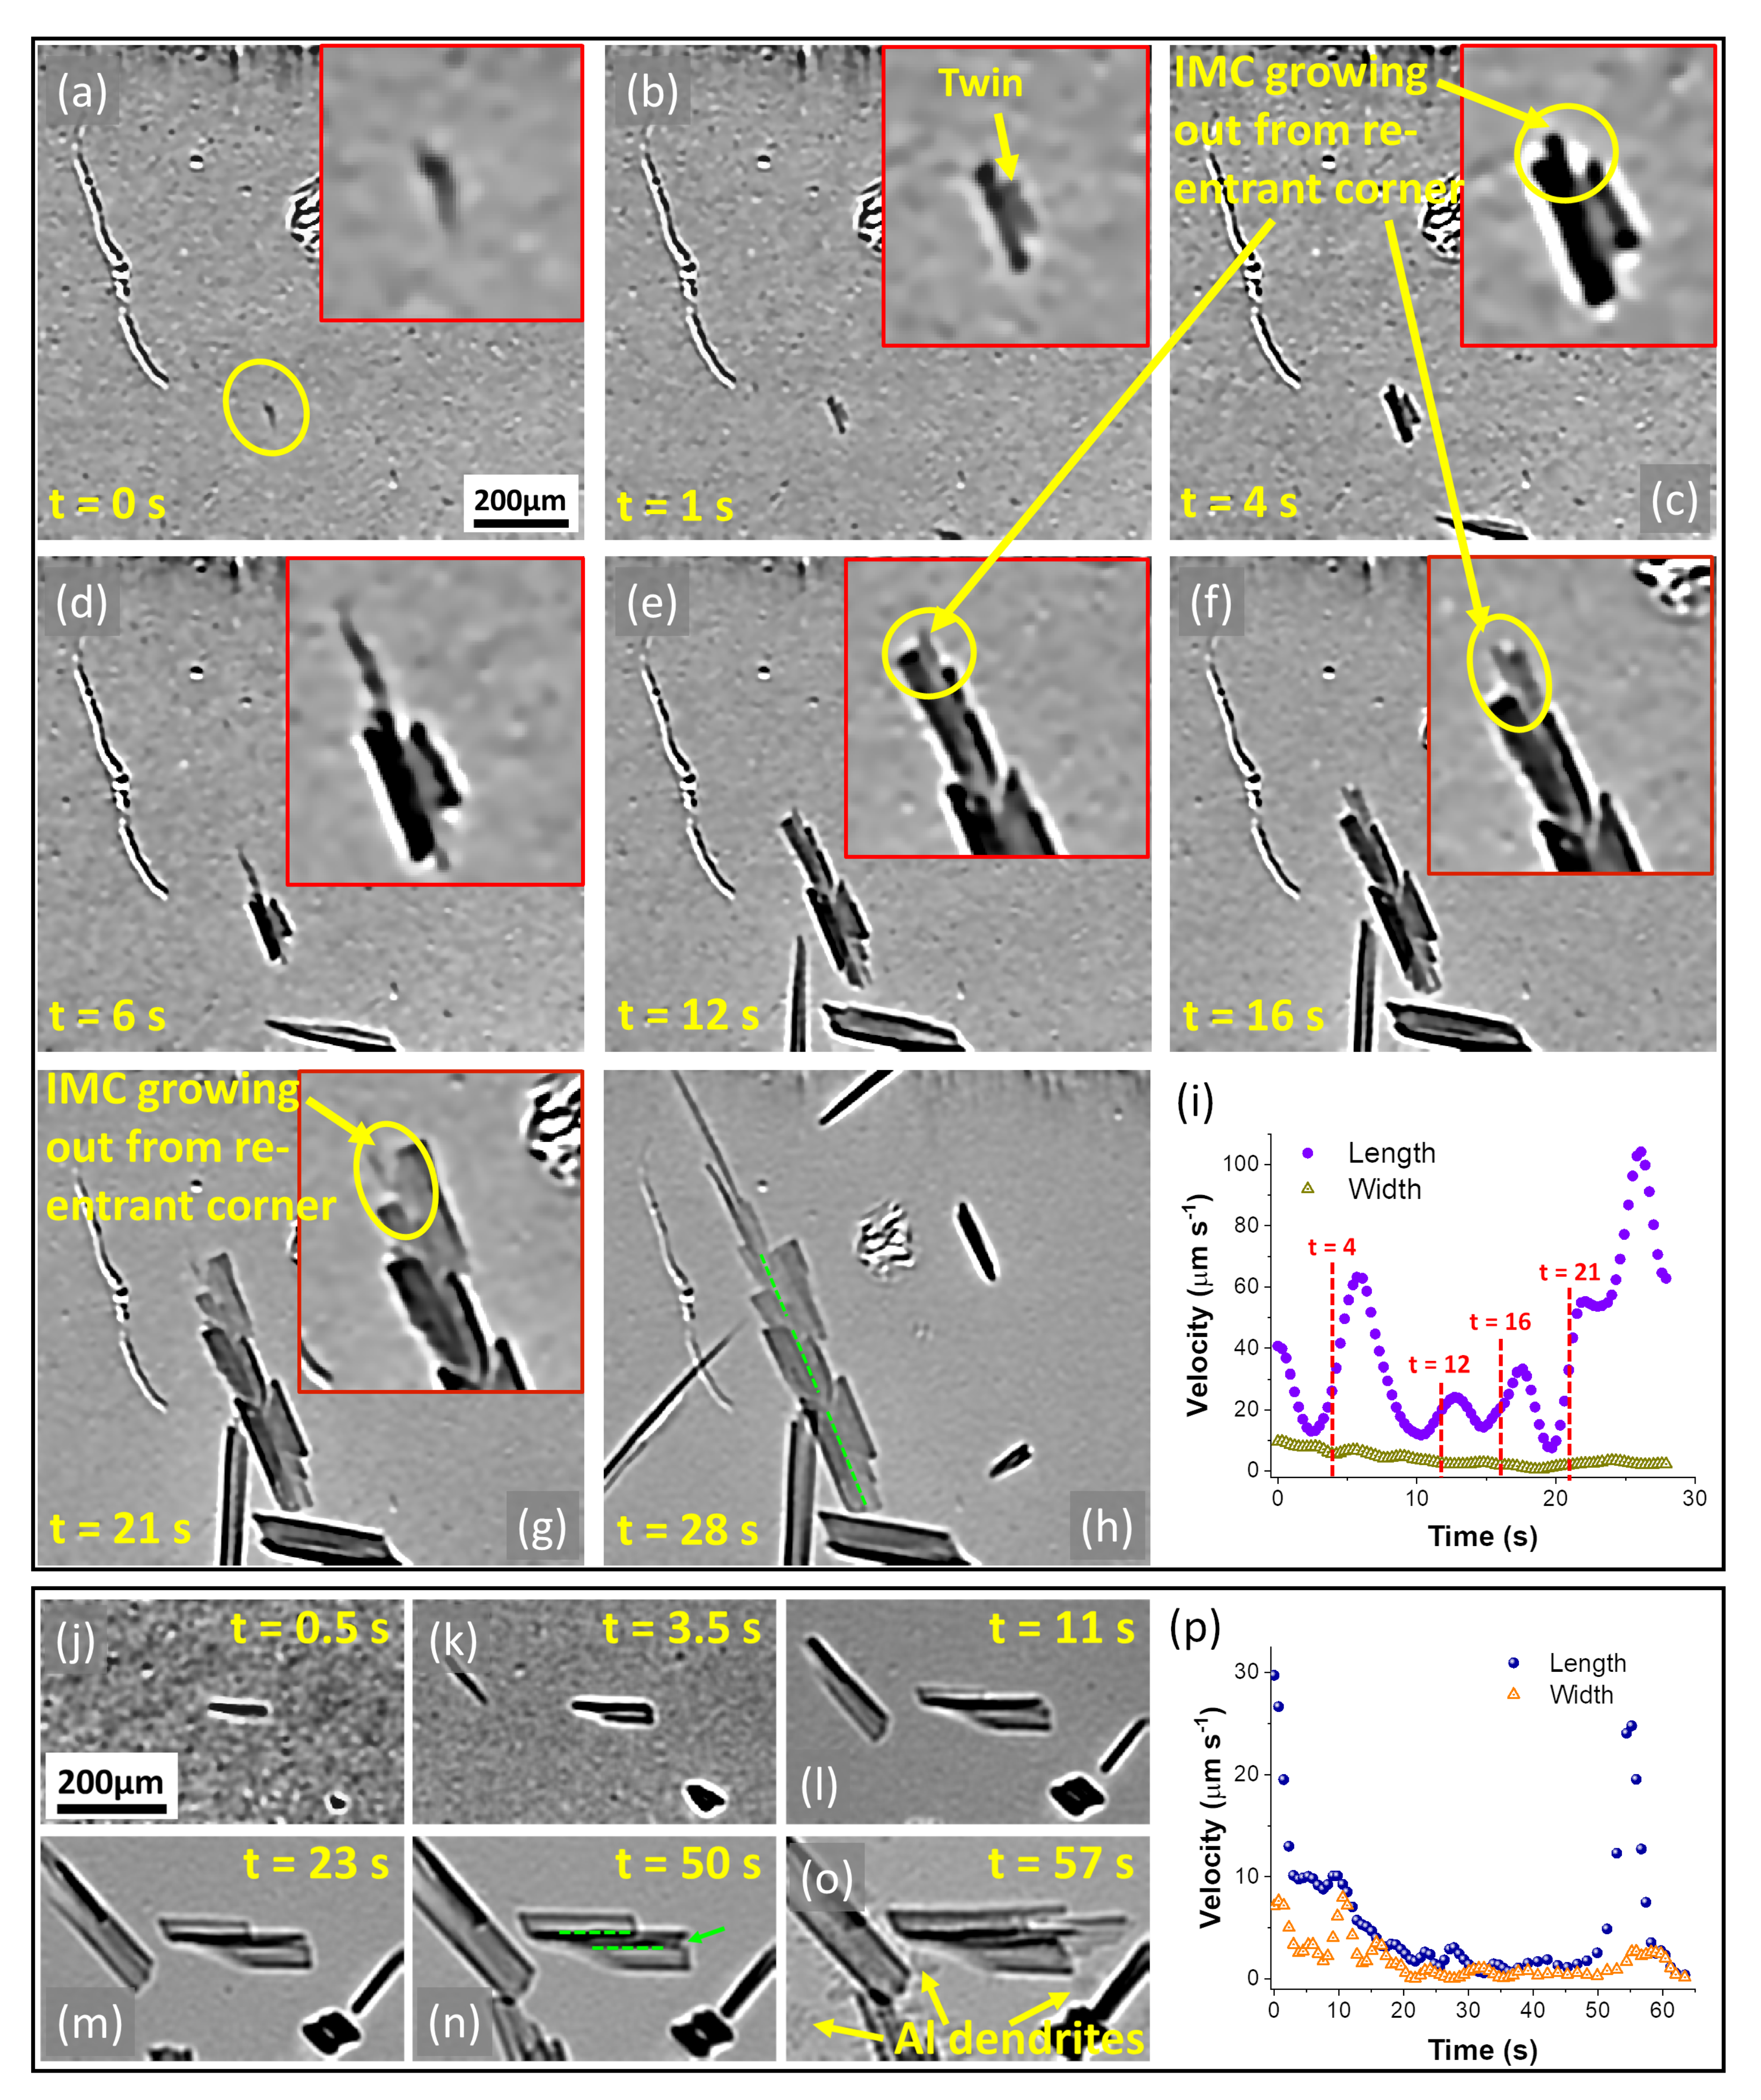
3.2.2. Faceted Growth of IMCs

We applied X-ray imaging to understand the subsequent growth behaviour of IMC crystals, combined with detailed post-solidification microscopy, particularly using high-resolution electron back-scattered diffraction (EBSD) analysis [57]. Microscopic twins were frequently observed in situ during the growth of Al 13 Fe 4 (Figure 8a–h), which were then confirmed by EBSD. IMCs grew via a twin plane re-entrant (TPRE) mechanism in which repeated twinning generated re-entrant corners and relatively low energy sites that facilitated comparatively easy atom attachment and rapid anisotropic crystal growth. When not constrained, this TPRE growth led to highly elongated IMC plates, typical of Figure 8h, and consistent with the hypothesis of Adam and Hogan [66]. Plate growth velocities showed a periodic fluctuation (Figure 8i), and there was always a peak in growth velocity following the development of a re-entrant corner (the time instants of which are labelled in Figure 8i). When TPRE growth was physically constrained by its surrounding crystals (typical of Figure 8j–o), growth velocities reduced (Figure 8p), and the formation of layered twins perpendicular to the preferential direction was promoted. These constrained IMCs had lower final aspect ratios, which can be expected to be less deleterious to tensile properties. A significant re-acceleration was commonly observed towards the end of crystal growth (typical of t = 26 s in Figure 8i and t = 55 s in Figure 8p). This was because the formation and growth of Al dendrites in the final eutectic reaction and the growth of existing primary Al 13 Fe 4 crystals (rather than cooperative Al 13 Fe 4 / α -Al eutectic growth).

3.3. Fluid Flow during Solidification

Fluid flow is known to have a profound effect on the way a cast microstructure evolves during solidification, affecting not only the nucleation and growth behaviour of primary and secondary phases but also macro-scale aspects, such as voids, hot tearing and long-range elemental inhomogeneity (macro-segregation). Liquid flow will occur naturally via thermo-solutal convection due to density differences arising from the inevitable temperature and solute gradients in the melt, liquid-to-solid volume changes (shrinkage) or be generated by processing such as direct mechanical stirring and magnetic stirring. As an example, Figure 9a–c are three frames of solidifying grain refined Al-15wt.%Cu showing the movement of Al grains due to shrinkage induced flow. Overall, the dendrite front as a whole moved left to right as new grains formed but individual crystals moved in the opposite direction at ∼ 0.2 / s . Analysis of 24 video sequences revealed that this crystal movement depended on crystal size, alloy composition and solidification conditions. However, it was not possible to measure the fluid flow acting on the crystals directly, only to infer liquid flow behaviour qualitatively from its effect on the crystals. Therefore more recently, we developed a new experimental methodology that disperses small, X-ray absorbing tracer droplets into liquid Al to map the liquid flow. For example, 1 wt.%Pb added to Al separates in the liquid phase to form a fine-scale emulsion of micron-scale Pb droplets. By tracking the movement of thousands of these Pb droplets, we were able to calculate and map liquid metal velocity, even through inter-dendritic regions and across the entire field of view [29].
Figure 9d–f show the flow of Pb droplets in a region ahead of a solid/liquid front (Figure 9d), close to the front (Figure 9e) and within the mushy zone (Figure 9f) of Al-1wt.%Pb. Liquid flow was due to a combination of thermo-solutal convection and liquid-to-solid shrinkage, as schematically represented in Figure 9g. Thermo-solutal convection, caused by density differences due to thermal and solutal gradients, was dominant in the bulk liquid far from the dendrite front, and velocities were >1 m m s 1 . Closer to the dendrite front, the influence of shrinkage induced flow towards the front became progressively dominant. Within the mushy zone itself behind the dendrite front, flow was much more complex due to the geometric constraint of the inter-dendritic channels and entirely driven by shrinkage as residual liquid transformed to solid. For a columnar morphology, liquid velocities were highest in the narrowest channels between primary arms. For an equiaxed morphology, liquid velocities were more evenly distributed, and overall, liquid velocities lay in the range 0.15 m m s 1 –0.6 m m s 1 . We are now applying this technique more systematically to link liquid flow in the final stages of solidification to defect formation such as hot tears.

4. Conclusions

Supported by the UK’s Engineering and Physical Sciences Research Council (EPSRC) through its Future Liquid Metal Engineering Manufacturing Hub, we have developed and used in situ X-ray radiography to study some fundamentals of Al alloy solidification. Insights have been obtained relating to the burst formation, growth and stability of α -Al crystals; the formation and growth behaviour of Al-based IMCs; and the thermo-solutal and shrinkage-induced liquid flow.
Improvements in spatial-temporal resolution offered by synchrotron sources and detectors has allowed crystals at their embryonic stage to be resolved along with the instantaneous solute concentration at the moment of formation. At the other end of the solidification sequence, techniques have been developed to estimate liquid flow, which may lead to better understanding of the factors controlling hot tear formation.
The ongoing development of detectors used in X-ray imaging will continue to offer improved spatial and temporal resolution for radiography. In addition, fluorescence based imaging offers the prospect of resolving the dynamics of multi-element spatial re-distribution during solidification simultaneously, albeit with reduced resolution compared with radiography. Combining radiography (or tomography) with fluorescence imaging—and with diffraction—may offer the opportunity to move away from model (usually binary) alloy systems where image contrast relies solely on composition and absorption differences between liquid and solid. Instead, elemental segregation and phase evolution in more scientifically interesting and commercially relevant multi-element alloys could be studied [68].
Technologically, the increasing capability of sources and detectors will also allow “faster”, higher cooling rate and further from equilibrium solidification conditions to be studied, such as those found in additive manufacture of metals and alloys. Highly dynamic processes including high speed liquid flow, mass transfer and evolution of fine scale crystals will be resolved. In terms of solidification fundamentals, it is likely that the application X-ray imaging will increasingly be used to probe the very earliest stage of crystal formation that has been relatively neglected, and the final stages of solidification at low liquid fraction when critical terminal eutectic or similar phases and defects are formed. Here, the challenges are in capturing and quantifying low volume fraction, highly disperse and geometrically complex events in such a way that robust scientific generalisations of behaviour may be formulated.
To allow such quantitative information to be robustly obtained from large data sets, automated data processing and information extraction will play an increasingly important role in the future research.

Author Contributions

Writing—original draft preparation, S.F. and E.L.; writing—review and editing, E.L., P.S.G., I.H. and A.L.; technical support, R.V. and G.R.; supervision, P.S.G. and E.L.; funding acquisition, P.S.G. All authors have read and agreed to the published version of the manuscript.

Funding

This work was funded by EPSRC (UK) under grant number EP/N007638/1 (Future Liquid Metal Engineering Hub).

Institutional Review Board Statement

Not applicable.

Informed Consent Statement

Not applicable.

Data Availability Statement

Not applicable.

Conflicts of Interest

The authors declare no conflict of interest.

References

  1. Greer, A.L.; Cooper, P.S.; Meredith, M.W.; Schneider, W.; Schumacher, P.; Spittle, J.A.; Tronche, A. Grain refinement of aluminium alloys by inoculation. Adv. Eng. Mater. 2003, 5, 81–91. [Google Scholar] [CrossRef]
  2. Greer, A.L. Grain refinement of alloys by inoculation of melts. Philos. Trans. R. Soc. Lond. Ser. A Math. Phys. Eng. Sci. 2003, 361, 479–495. [Google Scholar] [CrossRef]
  3. Kevorkjjan, V. The recycling of standard quality wrought aluminum alloys from low-grade contaminated scrap. JOM 2010, 62, 37–42. [Google Scholar] [CrossRef]
  4. Kevorkijan, V. Challenges and advantages of recycling wrought aluminium alloys from lower grades of metallurgically clean scrap. Mater. Tehnol. 2013, 47, 13–23. [Google Scholar]
  5. Mohanty, P.S.; Gruzleski, J.E. Mechanism of grain refinement in aluminium. Acta Metall. Mater. 1995, 43, 2001–2012. [Google Scholar] [CrossRef]
  6. Murty, B.S.; Kori, S.A.; Chakraborty, M. Grain refinement of aluminium and its alloys by heterogeneous nucleation and alloying. Int. Mater. Rev. 2002, 47, 3–29. [Google Scholar] [CrossRef]
  7. Han, Y.; Shu, D.; Wang, J.; Sun, B. Microstructure and grain refining performance of Al-5Ti-1B master alloy prepared under high-intensity ultrasound. Mater. Sci. Eng. A 2006, 430, 326–331. [Google Scholar] [CrossRef]
  8. Li, H.T.; Wang, Y.; Fan, Z. Mechanisms of enhanced heterogeneous nucleation during solidification in binary Al–Mg alloys. Acta Mater. 2012, 60, 1528–1537. [Google Scholar] [CrossRef] [Green Version]
  9. Fan, Z.; Wang, Y.; Zhang, Y.; Qin, T.; Zhou, X.R.; Thompson, G.E.; Pennycook, T.; Hashimoto, T. Grain refining mechanism in the Al/Al-Ti-B system. Acta Mater. 2015, 84, 292–304. [Google Scholar] [CrossRef]
  10. Lui, A.; Grant, P.S.; Stone, I.C.; O’Reilly, K.A.Q. The Role of Grain Refiner in the Nucleation of AlFeSi Intermetallic Phases During Solidification of a 6xxx Aluminum Alloy. Metall. Mater. Trans. A 2019, 50, 5242–5252. [Google Scholar] [CrossRef] [Green Version]
  11. Que, Z.; Mendis, C.L. Heterogeneous nucleation and phase transformation of Fe-rich intermetallic compounds in Al–Mg–Si alloys. J. Alloys Compd. 2020, 836, 155515. [Google Scholar] [CrossRef]
  12. Liotti, E.; Arteta, C.; Zisserman, A.; Lui, A.; Lempitsky, V.; Grant, P.S. Crystal nucleation in metallic alloys using x-ray radiography and machine learning. Sci. Adv. 2018, 4, eaar4004. [Google Scholar] [CrossRef] [PubMed] [Green Version]
  13. Xu, Y.; Casari, D.; Mathiesen, R.H.; Li, Y. Revealing the heterogeneous nucleation behavior of equiaxed grains of inoculated Al alloys during directional solidification. Acta Mater. 2018, 149, 312–325. [Google Scholar] [CrossRef] [Green Version]
  14. Jia, Y.; Huang, H.; Fu, Y.; Zhu, G.; Shu, D.; Sun, B.; StJohn, D. An in situ investigation of the solute suppressed nucleation zone in an Al-15Cu alloy inoculated by Al-Ti-B. Scr. Mater. 2019, 167, 6–10. [Google Scholar] [CrossRef]
  15. Feng, S.; Liotti, E.; Lui, A.; Wilson, M.D.; Connolley, T.; Mathiesen, R.H.; Grant, P.S. In-situ X-ray radiography of primary Fe-rich intermetallic compound formation. Acta Mater. 2020, 196, 759–769. [Google Scholar] [CrossRef]
  16. Jia, Y.; Song, D.; Zhou, N.; Zheng, K.; Fu, Y.; Shu, D. In Situ Investigation of Si-Poisoning Effect in Al–Cu–Si Alloys Inoculated by Al–5Ti–1B. Acta Metall. Sin. (Engl. Lett.) 2021, 1, 1–11. [Google Scholar] [CrossRef]
  17. Tang, Y.; Wu, Y.; Zhang, Y.; Dai, Y.; Dong, Q.; Han, Y.; Zhu, G.; Zhang, J.; Fu, Y.; Sun, B. Intermittent nucleation and periodic growth of grains under thermo-solutal convection during directional solidification of Al-Cu alloy. Acta Mater. 2021, 212, 116861. [Google Scholar] [CrossRef]
  18. Feng, S.; Liotti, E.; Lui, A.; Wilson, M.D.; Grant, P.S. Nucleation bursts of primary intermetallic crystals in a liquid Al alloy studied using in situ synchrotron X-ray radiography. Acta Mater. 2021, 221, 117389. [Google Scholar] [CrossRef]
  19. Xu, Y.; Casari, D.; Du, Q.; Mathiesen, R.H.; Arnberg, L.; Li, Y. Heterogeneous nucleation and grain growth of inoculated aluminium alloys: An integrated study by in-situ X-radiography and numerical modelling. Acta Mater. 2017, 140, 224–239. [Google Scholar] [CrossRef]
  20. Wang, N.; Tang, Y.; Wu, Y.; Zhang, Y.; Dai, Y.; Zhang, J.; Zhang, R.; Xu, Y.; Sun, B. Dynamic evolution of microstructure morphology in thin-sample solidification: Deep learning assisted synchrotron X-ray radiography. Mater. Charact. 2021, 181, 111451. [Google Scholar] [CrossRef]
  21. Liotti, E.; Lui, A.; Vincent, R.; Kumar, S.; Guo, Z.; Connolley, T.; Dolbnya, I.P.; Hart, M.; Arnberg, L.; Mathiesen, R.H.; et al. A synchrotron X-ray radiography study of dendrite fragmentation induced by a pulsed electromagnetic field in an Al–15Cu alloy. Acta Mater. 2014, 70, 228–239. [Google Scholar] [CrossRef]
  22. Salloum-Abou-Jaoude, G.; Nguyen-Thi, H.; Reinhart, G.; Mathiesen, R.H.; Zimmermann, G.; Voss, D. Characterization of motion of dendrite fragment by X-ray radiography on Earth and under microgravity environment. Mater. Sci. Forum 2014, 790–791, 311–316. [Google Scholar] [CrossRef]
  23. Liotti, E.; Lui, A.; Kumar, S.; Guo, Z.; Bi, C.; Connolley, T.; Grant, P.S. The spatial and temporal distribution of dendrite fragmentation in solidifying Al-Cu alloys under different conditions. Acta Mater. 2016, 121, 384–395. [Google Scholar] [CrossRef]
  24. Wang, F.; Eskin, D.; Mi, J.; Wang, C.; Koe, B.; King, A.; Reinhard, C.; Connolley, T. A synchrotron X-radiography study of the fragmentation and refinement of primary intermetallic particles in an Al-35 Cu alloy induced by ultrasonic melt processing. Acta Mater. 2017, 141, 142–153. [Google Scholar] [CrossRef]
  25. Zhao, Y.; Lin, B.; Song, D.; Zheng, D.; Sun, Z.; Xie, C.; Zhang, W. Effect of Compound Fields of Ultrasonic Vibration and Applied Pressure on the 3D Microstructure and Tensile Properties of Recycled Al-Cu-Mn-Fe-Si Alloys. Materials 2019, 12, 3904. [Google Scholar] [CrossRef] [Green Version]
  26. Zhang, Z.; Wang, C.; Koe, B.; Schlepütz, C.M.; Irvine, S.; Mi, J. Synchrotron X-ray imaging and ultrafast tomography in situ study of the fragmentation and growth dynamics of dendritic microstructures in solidification under ultrasound. Acta Mater. 2021, 209, 116796. [Google Scholar] [CrossRef]
  27. Nelson, T.; Cai, B.; Warnken, N.; Lee, P.; Boller, E.; Magdysyuk, O.; Green, N. Gravity effect on thermal-solutal convection during solidification revealed by four-dimensional synchrotron imaging with compositional mapping. Scr. Mater. 2020, 180, 29–33. [Google Scholar] [CrossRef]
  28. Reinhart, G.; Grange, D.; Abou-Khalil, L.; Mangelinck-Noël, N.; Niane, N.; Maguin, V.; Guillemot, G.; Gandin, C.A.; Nguyen-Thi, H. Impact of solute flow during directional solidification of a Ni-based alloy: In-situ and real-time X-radiography. Acta Mater. 2020, 194, 68–79. [Google Scholar] [CrossRef]
  29. Liotti, E.; Lui, A.; Connolley, T.; Grant, P.S. Probing interdendritic flow and hot tearing during solidification using real time X-ray imaging and droplet tracking. Acta Mater. 2021. submitted. [Google Scholar]
  30. Mathiesen, R.H.; Arnberg, L.; Nguyen-Thi, H.; Billia, B. In Situ X-Ray Video Microscopy as a Tool in Solidification Science. JOM 2012, 64, 76–82. [Google Scholar] [CrossRef]
  31. Rakete, C.; Baumbach, C.; Goldschmidt, A.; Samberg, D.; Schroer, C.G.; Breede, F.; Stenzel, C.; Zimmermann, G.; Pickmann, C.; Houltz, Y.; et al. Compact x-ray microradiograph for in situ imaging of solidification processes: Bringing in situ x-ray micro-imaging from the synchrotron to the laboratory. Rev. Sci. Instrum. 2011, 82, 105108. [Google Scholar] [CrossRef] [PubMed]
  32. Murphy, A.G.; Browne, D.J.; Mirihanage, W.U.; Mathiesen, R.H. Combined in situ X-ray radiographic observations and post-solidification metallographic characterisation of eutectic transformations in Al–Cu alloy systems. Acta Mater. 2013, 61, 4559–4571. [Google Scholar] [CrossRef]
  33. Nguyen-Thi, H.; Reinhart, G.; Salloum Abou Jaoude, G.; Mathiesen, R.H.; Zimmermann, G.; Houltz, Y.; Voss, D.; Verga, A.; Browne, D.J.; Murphy, A.G. XRMON-GF: A novel facility for solidification of metallic alloys with in situ and time-resolved X-ray radiographic characterization in microgravity conditions. J. Cryst. Growth 2013, 374, 23–30. [Google Scholar] [CrossRef]
  34. Greer, A.L.; Bunn, A.M.; Tronche, A.; Evans, P.V.; Bristow, D.J. Modelling of inoculation of metallic melts: Application to grain refinement of aluminium by Al-Ti-B. Acta Mater. 2000, 48, 2823–2835. [Google Scholar] [CrossRef]
  35. Fisher, J.C.; Hollomon, J.H.; Turnbull, D. Nucleation. J. Appl. Phys. 1948, 19, 775–784. [Google Scholar] [CrossRef]
  36. Turnbull, D.; Fisher, J.C. Rate of nucleation in condensed systems. J. Chem. Phys. 1949, 17, 71–73. [Google Scholar] [CrossRef]
  37. Turnbull, D. Kinetics of heterogeneous nucleation. J. Chem. Phys. 1950, 18, 198–203. [Google Scholar] [CrossRef]
  38. Hollomon, J.H.; Turnbull, D. Nucleation. Prog. Met. Phys. 1953, 4, 333–388. [Google Scholar] [CrossRef]
  39. Turnbull, D. Theory of catalysis of nucleation by surface patches. Acta Metall. 1953, 1, 8–14. [Google Scholar] [CrossRef]
  40. Maxwell, I.; Hellawell, A. A simple model for grain refinement during solidification. Acta Metall. 1975, 23, 229–237. [Google Scholar] [CrossRef]
  41. Cantor, B.; Doherty, R.D. Heterogeneous nucleation in solidifying alloys. Acta Metall. 1979, 27, 33–46. [Google Scholar] [CrossRef]
  42. Shu, D.; Sun, B.; Mi, J.; Grant, P.S. A quantitative study of solute diffusion field effects on heterogeneous nucleation and the grain size of alloys. Acta Mater. 2011, 59, 2135–2144. [Google Scholar] [CrossRef]
  43. Stjohn, D.H.; Qian, M.; Easton, M.A.; Cao, P. The Interdependence Theory: The relationship between grain formation and nucleant selection. Acta Mater. 2011, 59, 4907–4921. [Google Scholar] [CrossRef]
  44. Buffet, A.; Thi, H.N.; Bogno, A.; Schenk, T.; Mangelinck-Noel, N.; Reinhart, G.; Bergeon, N.; Billia, B.; Baruchel, J. Measurement of solute profiles by means of synchrotron X-ray radiography during directional solidification of Al-4 wt% Cu alloys. Mater. Sci. Forum 2010, 649, 331–336. [Google Scholar] [CrossRef]
  45. Bogno, A.; Nguyen-Thi, H.; Buffet, A.; Reinhart, G.; Billia, B.; Mangelinck-Noël, N.; Bergeon, N.; Baruchel, J.; Schenk, T. Analysis by synchrotron X-ray radiography of convection effects on the dynamic evolution of the solid–liquid interface and on solute distribution during the initial transient of solidification. Acta Mater. 2011, 59, 4356–4365. [Google Scholar] [CrossRef]
  46. Reinhart, G.; Mangelinck-Noël, N.; Nguyen-Thi, H.; Schenk, T.; Gastaldi, J.; Billia, B.; Pino, P.; Härtwig, J.; Baruchel, J. Investigation of columnar–equiaxed transition and equiaxed growth of aluminium based alloys by X-ray radiography. Mater. Sci. Eng. A 2005, 413, 384–388. [Google Scholar] [CrossRef]
  47. Mathiesen, R.H.; Arnberg, L.; Bleuet, P.; Somogyi, A. Crystal fragmentation and columnar-to-equiaxed transitions in Al-Cu studied by synchrotron X-ray video microscopy. Metall. Mater. Trans. A 2006, 37, 2515–2524. [Google Scholar] [CrossRef]
  48. Dong, Q.; Zhang, J.; Dong, J.; Xie, H.; Li, Z.; Dai, Y.; Liu, Y.; Sun, B. In situ observation of columnar-to-equiaxed transition in directional solidification using synchrotron X-radiation imaging technique. Mater. Sci. Eng. A 2011, 530, 271–276. [Google Scholar] [CrossRef]
  49. Ruvalcaba, D.; Mathiesen, R.H.; Eskin, D.G.; Arnberg, L.; Katgerman, L. In situ observations of dendritic fragmentation due to local solute-enrichment during directional solidification of an aluminum alloy. Acta Mater. 2007, 55, 4287–4292. [Google Scholar] [CrossRef]
  50. Bogno, A.; Nguyen-Thi, H.; Reinhart, G.; Billia, B.; Baruchel, J. Growth and interaction of dendritic equiaxed grains: In situ characterization by synchrotron X-ray radiography. Acta Mater. 2013, 61, 1303–1315. [Google Scholar] [CrossRef]
  51. Murphy, A.G.; Mirihanage, W.U.; Browne, D.J.; Mathiesen, R.H. Equiaxed dendritic solidification and grain refiner potency characterised through in situ X-radiography. Acta Mater. 2015, 95, 83–89. [Google Scholar] [CrossRef]
  52. Murphy, A.; Mathiesen, R.; Houltz, Y.; Li, J.; Lockowandt, C.; Henriksson, K.; Zimmermann, G.; Melville, N.; Browne, D. XRMON-SOL: Isothermal equiaxed solidification of a grain refined Al–20 wt%Cu alloy. J. Cryst. Growth 2016, 440, 38–46. [Google Scholar] [CrossRef]
  53. Quested, T.; Greer, A. The effect of the size distribution of inoculant particles on as-cast grain size in aluminium alloys. Acta Mater. 2004, 52, 3859–3868. [Google Scholar] [CrossRef]
  54. Bjurenstedt, A.; Casari, D.; Seifeddine, S.; Mathiesen, R.H.; Dahle, A.K. In-situ study of morphology and growth of primary α-Al(FeMnCr)Si intermetallics in an Al-Si alloy. Acta Mater. 2017, 130, 1–9. [Google Scholar] [CrossRef]
  55. Feng, S.; Liotti, E.; Lui, A.; Kumar, S.; Mahadevegowda, A.; O’Reilly, K.A.Q.; Grant, P.S. An in-situ method to estimate the tip temperature and phase selection of secondary Fe-rich intermetallics using synchrotron X-ray radiography. Scr. Mater. 2018, 149, 44–48. [Google Scholar] [CrossRef]
  56. Cai, B.; Kao, A.; Lee, P.; Boller, E.; Basevi, H.; Phillion, A.; Leonardis, A.; Pericieous, K. Growth of β intermetallic in an Al-Cu-Si alloy during directional solidification via machine learned 4D quantification. Scr. Mater. 2019, 165, 29–33. [Google Scholar] [CrossRef]
  57. Feng, S.; Cui, Y.; Liotti, E.; Lui, A.; Gourlay, C.M.; Grant, P.S. In-situ X-ray radiography of twinned crystal growth of primary Al13Fe4. Scr. Mater. 2020, 184, 57–62. [Google Scholar] [CrossRef]
  58. Zhao, Y.; Zhang, W.; Koe, B.; Du, W.; Wang, M.; Wang, W.; Boller, E.; Rack, A.; Sun, Z.; Shu, D.; et al. Multiscale characterization of the nucleation and 3D structure of Al3Sc phases using electron microscopy and synchrotron X-ray tomography. Mater. Charact. 2020, 164, 110353. [Google Scholar] [CrossRef]
  59. Zhao, Y.; Zhang, W.; Song, D.; Lin, B.; Shen, F.; Zheng, D.; Xie, C.X.; Sun, Z.; Fu, Y.; Li, R. Nucleation and growth of Fe-rich phases in Al-5Ti-1B modified Al-Fe alloys investigated using synchrotron X-ray imaging and electron microscopy. J. Mater. Sci. Technol. 2021, 80, 84–99. [Google Scholar] [CrossRef]
  60. Song, Z.; Magdysyuk, O.V.; Tang, L.; Sparks, T.; Cai, B. Growth dynamics of faceted Al13Fe4 intermetallic revealed by high-speed synchrotron X-ray quantification. J. Alloys Compd. 2021, 861, 158604. [Google Scholar] [CrossRef]
  61. Taylor, J.A. Iron-Containing Intermetallic Phases in Al-Si Based Casting Alloys. Procedia Mater. Sci. 2012, 1, 19–33. [Google Scholar] [CrossRef] [Green Version]
  62. Sha, G.; O’Reilly, K.A.Q.; Cantor, B.; Titchmarsh, J.M.; Hamerton, R. Quasi-peritectic solidification reactions in 6xxx series wrought Al alloys. Acta Mater. 2003, 51, 1883–1897. [Google Scholar] [CrossRef]
  63. Ji, S.; Yang, W.; Gao, F.; Watson, D.; Fan, Z. Effect of Iron in Al-Mg-Si-Mn Ductile Diecast Alloy. Light Met. 2013, 564, 130–139. [Google Scholar]
  64. Tiller, W.; Jackson, K.; Rutter, J.; Chalmers, B. The redistribution of solute atoms during the solidification of metals. Acta Metall. 1953, 1, 428–437. [Google Scholar] [CrossRef]
  65. Jackson, K.; Uhlmann, D.; Hunt, J. On the nature of crystal growth from the melt. J. Cryst. Growth 1967, 1, 1–36. [Google Scholar] [CrossRef]
  66. Adam, C.M.; Hogan, L.M. Crystallography of the Al-Al3 Fe eutectic. Acta Metall. 1975, 23, 345–354. [Google Scholar] [CrossRef]
  67. Que, Z.P.; Zhou, Y.P.; Wang, Y.; Fan, Z. Composition Templating for Heterogeneous Nucleation of Intermetailic Compounds. In Proceedings of the 6th Decennial International Conference on Solidification Processing, Old Windsor, UK, 25–28 July 2017; pp. 158–161. [Google Scholar]
  68. Feng, S.; Liotti, E.; Wilson, M.D.; Jowitt, L.; Grant, P.S. In situ mapping of chemical segregation using synchrotron x-ray imaging. MRS Bull. 2020, 45, 934–942. [Google Scholar] [CrossRef]
Figure 1. (a) Schematic of synchrotron X-ray radiography set-up for solidification experiments. (b) Schematic showing a typical set-up of laboratory-based X-ray radiography, where the foil sample is solidified horizontally (i.e., with gravity perpendicular to the sample surface). (c) The Bridgeman furnace for radiography experiments (with the front lid removed). (d) A foil radiography sample encapsulated in a quartz cell.
Metals 12 00395 g001
Figure 2. (a,b) Radiographs at t = 27 s and t = 27.5 s showing the crystallisation of a TiB 2 inoculated Al-25wt.%Cu alloy. The green boxes indicate grains already identified in earlier frames, blue boxes indicate grains identified for the first time. (cf) A magnified radiograph sequence in reverse time of a cluster of five crystals highlighted by the dark yellow box in (a,b), demonstrating the back tracking method for undercooling measurement. (g) Distributions of undercooling probability density functions (pdf) for four alloy compositions, each studied at three cooling rates. The box plot in each graph shows the position of the median undercooling (red line), the second and third quartiles (blue box), and the 5 to 95 percentiles (whiskers). The dotted line represents a best-fit log-normal distribution. The data set includes 6200 validated measurements [12].
Metals 12 00395 g002
Figure 3. (ac) A radiograph sequence showing the solidification of a TiB 2 inoculated Al-25wt.%Cu alloy at a constant cooling rate of 0.3 K s 1 . Image frames time t = 16, 29, and 38 s showing, respectively, three successive formation waves (time t = 0 s was set when a crystal first appeared). (d) Crystal formation rate as a function of time for the experiment shown in (ac) (yellow curve), showing more pronounced formation bursts than the Al-10wt.%Cu counterpart (red curve). (e) Fraction of the Cu-rich liquid ( f E , coloured in blue) at fraction solid f S of 0.02 and 0.03 during the solidification of Al-10wt.%Cu and Al-25wt.%Cu [12].
Metals 12 00395 g003
Figure 4. (a1a8,b1b8) Two radiograph sequences side-by-side showing dendrite fragmentation for top-to-bottom (T2B, left paired image) and bottom-to-top (B2T, right paired image) solidification of an Al-15wt.%Cu alloy at a thermal gradient of G = ± 48 K m m 1 and under an external PEMF ( F = ± 0.3 m N ). (cf) Normalised total number of fragments as a function of distance into the mushy zone, measured from the tip of the longest dendrite, for four different experimental conditions in Al-15wt.%Cu. The bar colours correspond to the relative contribution of an individual experiment to the overall distribution [23] (Reprinted with permission from [23]. Copyright 2016 Elsevier).
Metals 12 00395 g004
Figure 5. (a) A radiograph superimposed with a horizontal solute gradient contour map within the inter-dendritic channels of a solidifying Al-25wt.%Cu alloy. (b) The local dendrite fragmentation rate as a function of the maximum local inter-dendritic solute gradient in the liquid. The red dashed line represents a linear best-fit. (c) A schematic arrangement of two secondary dendrite arms attached to a primary arm showing regions that are more vulnerable to re-melting when the thermo-solute is perturbed due to their relatively high local curvature [23] (Reprinted with permission from [23]. Copyright 2016 Elsevier).
Metals 12 00395 g005
Figure 6. (ac) An example radiograph sequence showing the formation of primary Al 13 Fe 4 in a TiB 2 inoculated Al-3wt.%Fe alloy during directional solidification at 2 K / s 1 and 5 K m m 1 . Each image was obtained by subtracting frame f n 15 from frame f n . (d) IMC number density and (e) average formation rate in isothermal conditions (AF: Al-3wt.%Fe base alloy; AF-B: TiB 2 inoculated; AF-C: TiC inoculated). (f) IMC number density and (g) average formation rate in directional conditions. The solid lines in (e,g) represent a linear best-fit of the average formation rate as a function of cooling rate [15] (Reprinted with permission from [15]. Copyright 2020 Elsevier).
Metals 12 00395 g006
Figure 7. (ac) A radiograph sequence showing the formation of primary IMC crystals at 4 K s 1 under isothermal cooling. (df) A radiograph sequence at 4 K s 1 and 15 K m m 1 . (g) Corresponding time resolved IMC formation rate for the two sequences. (h) The micro-segregation of Pt ahead of a typical IMC, measured along the black arrow in the inset radiograph of the Pt diffusion field, with a best-fit to equation y = a + b e c x ( R 2 = 0.994 ). μ is the X-ray mass attenuation coefficient of Pt (constant), and Δ C is the difference between the local Pt concentration ahead of a growing IMC and the bulk Pt concentration. Schematics illustrating the nucleants activated at each time instant under (il) ideally isothermal, and (mp) directional solidification [18] (Reprinted with permission from [18]. Copyright 2021 Elsevier).
Metals 12 00395 g007
Figure 8. (ah) A radiograph sequence of growth of an elongated Al 13 Fe 4 crystal at 0.5 K s 1 , showing repeated microscopic twins and re-entrant corners. t = 0 s was set at the beginning of the size measurement. Inset images with red frames provide a magnified view. The green dashed lines in (h) highlight the boundaries between the microscopic twins. (i) Corresponding time resolved growth velocities along the length and width. The time instants when a new plate appeared at the re-entrant corners ( t = 4 s, t = 12 s, t = 16 s and t = 21 s) are labelled. (jo) A radiograph sequence showing the growth of an Al 13 Fe 4 crystal whose preferential growth was constrained by surrounding IMCs. The green dashed lines in (n) highlight the boundaries between layered twins, and the green arrow denotes a re-entrant corner. (p) Corresponding time resolved growth velocities [57].
Metals 12 00395 g008
Figure 9. (ac) A radiograph sequence of the solidification of a grain refined Al-15wt.%Cu alloy cooled at 0.3 K s 1 , showing the movement of equiaxed grains due to shrinkage induced flow. (df) Radiographs showing the movement of immiscible Pb droplets in an Al-1wt.%Pb alloy, within the bulk liquid (d), near the solid liquid interface (e) and in the mushy zone (f). (g) schematic representation of the natural convective flow caused by thermo-solutal effects on liquid density (red) and solidification shrinkage induced flow (yellow). Z 1 —convection dominates; Z 2 —shrinkage and convection; and Z 3 —shrinkage dominates.
Metals 12 00395 g009
Publisher’s Note: MDPI stays neutral with regard to jurisdictional claims in published maps and institutional affiliations.

