Article

Heterogeneous Nucleation and Grain Initiation on a Single Substrate

Brunel Centre for Advanced Solidification Technology (BCAST), Brunel University London, Uxbridge UB8 3Ph, UK
*
Authors to whom correspondence should be addressed.
Metals 2022, 12(9), 1454; https://doi.org/10.3390/met12091454
Submission received: 1 August 2022 / Revised: 21 August 2022 / Accepted: 24 August 2022 / Published: 30 August 2022

Abstract

:
Recently, we have proposed a new framework for early stages solidification, in which heterogeneous nucleation and grain initiation have been treated as separate processes. In this paper, we extend our atomic-level understanding of heterogeneous nucleation to spherical cap formation for grain initiation on a single substrate using molecular dynamics calculations. We first show that heterogeneous nucleation can be generally described as a three-layer mechanism to generate a two-dimensional (2D) nucleus under a variety of atomic arrangements at the solid/substrate interface. We then introduce the atomistic concept of spherical cap formation at different grain initiation undercoolings (ΔTgi) relative to nucleation undercooling (ΔTn). When ΔTn < ΔTgi, the spherical cap formation is constrained by the curvature of the liquid/solid interface, produces a dormant cap, and further growth is only made possible by increasing undercooling to overcome an energy barrier. However, when ΔTn > ΔTgi, spherical cap formation becomes barrierless and undergoes three distinctive stages: heterogeneous nucleation to produce a 2D nucleus with radius, rn; unconstrained growth to deliver a hemisphere of rN (substrate radius); and spherical growth beyond rN. This is followed by a theoretical analysis of the three-layer nucleation mechanism to bridge between three-layer nucleation, grain initiation and classical nucleation theory.

1. Introduction

Nucleation in its widest sense occurs in nearly all the technological and natural processes [1,2]. Therefore, the understanding and controlling of nucleation play a critical role in advancing sciences and developing technologies. However, our current understanding of nucleation has been dominated by the classical nucleation theory (CNT) for over a century [1] with little progress of significance being made [3]. It is very desirable to see a breakthrough from this bottleneck of scientific advance and technological development.
The CNT was postulated over a century ago. Based on Gibb’s ideas of nucleation [4], the first complete theory of homogeneous nucleation was formulated by Volmer and Weber [5], improved by Becker and Döring [6], and further improved by Zeldovich [7]. The homogeneous CNT was extended to heterogeneous nucleation later (see reviews in Refs. [1,2,8]). In the homogeneous CNT, an embryo of the solid (S) of radius r is formed in the liquid (L) through structural fluctuation, and a liquid/solid (L/S) interface is created as a by-product (Figure 1a) [1]. Based on its capillarity approximation, the homogeneous CNT applies continuum thermodynamics to determine the critical nucleus size (r*) and the energy barrier for its formation (ΔG*Hom) through balancing the volume term and the interfacial term (Figure 1c):
Δ G n = 4 π 3 r 3 Δ G v + 4 π r 2 γ LS
where ΔGn is the total free energy change during nucleation, ΔGv is the free energy change per volume due to solidification, and γLS is the interfacial energy of the liquid/solid (L/S) interface. Through first-order differentiation, one has:
r * = 2 γ LS Δ G *
Δ G Hom * = 16 π 3 γ LS 3 Δ G v 2 .
In the heterogeneous CNT, a spherical cap of the solid (S) is formed on a substrate (N) with a contact angle θ defined by the Young’s equation (Figure 1b):
γ LN = γ SN + γ LS cos θ
where γLN is the interfacial energy for the liquid/substrate (L/N) interface, and γSN is the interfacial energy for the solid/substrate (S/N) interface. Although the critical radius of the nucleus (r*) is the same for the homogeneous and heterogeneous nucleation given by Equation (2), the energy barrier for heterogeneous nucleation (ΔG*Het) is only a fraction of that for homogeneous nucleation (Figure 1c):
Δ G Het * = Δ G Hom * f ( θ )
f ( θ ) = 1 4 ( 2 3 cos θ + cos 3 θ ) .
It is important to note that θ is meaningfully defined only when γLNγSN + γLS.
The homogeneous CNT is conceptually simple, mathematically rigorous, and widely applied to describe qualitatively many phase transformations and has dominated our thinking for more than a century. However, the spherical cap model of the heterogeneous CNT has been facing difficulties while dealing with cases of most interests where the contact angle θ is small. Conceptually, the spherical cap model breaks down when θ ≤ 10°, since the cap height would be less than one atomic layer thick [8]. In addition, Cantor and co-workers [9,10,11,12] investigated the undercooling required for the onset of solidification in the entrained liquid droplets. They found that when θ ≥ 40° (corresponding to ΔT > 50 K), the spherical cap model provides a reasonable fit to the observed kinetics [9,10], while when θ < 40°, the spherical cap model is unable to fit the experimentally observed kinetics with reasonable parameters [11,12]. As early as 1934, Stranski [13] realised that for heterogeneous nucleation in systems with small θ, it is better to be described as a formation of monolayer disks rather than spherical caps. Richard [14] suggested that such a crystalline disk might be formed through adsorption on the substrate surface. Coudurier et al. [15] later proposed that heterogeneous nucleation might be treated as the adsorption of a solid layer on the substrate, and this approach was considered by Cantor and Kim [16,17] to interpret their results from entrained droplets. Furthermore, this solid layer approach was further extended in the so-called hypernucleation theory by Jones [18,19], where the formation of a quasi-solid layer on the TiB2 substrate surface is envisaged to be possible even above the alloy liquidus. This insightful hypothesis has now been validated by experimental observations using the state-of-the-art electron microscopy in many cases, such as the segregation of Ti, Zr, Si and Cu at the Al/TiB2 interface [20,21,22], Y, Ca, and Sn at the Mg/MgO interface [23], and Y and La at the Al/Al2O3 interface [24]. More importantly, the general existence of ordered atoms at the liquid/substrate interface has been confirmed by atomistic simulations [3,25,26,27], which has been described as substrate-induced atomic ordering at the liquid/substrate interface or more generally named as prenucleation [25].
For nucleation systems involving potent substrate (i.e., small nucleation undercooling), Greer et al. [28] made the connection between the substrate radius (rN) and the critical radius of nucleus (r*) in CNT and developed the free growth criterion based on Equation (2):
Δ T gi = 2 γ LS Δ S v r N ,
where ΔTgi is the grain initiation undercooling for free growth, and ΔSv is the entropy change of fusion per unit volume. Considering the Gibbs–Thompson coefficient Γ = γLSSv, one has:
Δ T gi r N = 2 Γ .
Free growth has been treated as effective nucleation [28,29], and it has been successfully used to predict the grain size of solidified microstructures by several researchers [30,31,32,33,34]. In addition, one of the interesting implications of the free growth criterion is the formation of dormant spherical caps, which has now been confirmed by Gránásy and co-workers [35] through phase field crystal modelling and by Fujinaga and Shibuta [36] with large-scale molecular dynamics (MD) simulations.
In recent years, Fan and co-workers [3,25,37,38,39,40] have proposed a new framework for understanding early stages of solidification in which the initial stages of formation of the solid on a substrate is defined as heterogeneous nucleation to generate a 2D nucleus [3], while the subsequent growth through spherical cap formation is treated as grain initiation [38]. Although this separation of heterogeneous nucleation from grain initiation is completely different from the conventional treatment of the subject, it may hold the potential to unify the different schools of thoughts on the subject. In addition, to understand the collective grain initiation behaviour of a population of nucleant particles, we have identified two distinctive modes of grain initiation: progressive and explosive [39], which has successfully led to the development of both grain initiation maps and grain refinement maps [39,40].
The objective of this paper is to extend our atomic-level understanding of heterogeneous nucleation to spherical cap formation for grain initiation on a single substrate using molecular dynamics calculations. We will start with an overview of the three-layer nucleation mechanisms under a variety of atomic arrangements at the solid/substrate interface. We then introduce the atomistic concept of spherical cap formation at different undercoolings relative to the nucleation undercooling, i.e., constrained and unconstrained spherical cap formations. This is followed by a theoretical analysis of the three-layer nucleation mechanism, with the intention to bridge between the three-layer nucleation, grain initiation and classical nucleation theory.

2. Simulation Approaches

A generic system was created to simulate the heterogeneous nucleation process to make the simulation results generally applicable. This generic nucleation system consists of a generic liquid and a generic fcc substrate with a <111> surface orientation, with the z-axis being normal to the {111} plane of the substrate. We chose aluminium as the generic liquid as it is representative of many simple metals in terms of liquid structures. The generic fcc substrate lattice was built using pinned aluminium atoms with a specified lattice parameter to pre-set the lattice misfit [25]. This generic system has two major advantages: (1) it allows the simulation of nucleation systems with substrates with high melting temperatures (Tl) that are similar to the nucleant particles used in industrial practice (e.g., TiB2 with Tl = 3498 K), and (2) this makes it possible to simulate the effect of lattice misfit alone without interference from the chemical interaction between the liquid and the substrate and/or the substrate surface roughness at the atomic level [41,42]. For simplicity, we have used the generic terms “the liquid” and “the substrate” in this paper.
We used a variety of simulation systems with varying simulation cell sizes, being from 5040 to 80,000. Since the melting temperature (Tm) may change slightly with the size of the simulation systems, in this paper, we only use undercooling (ΔT) as an indicator of temperature, and ΔT = TmT.
Periodic boundary conditions were imposed in the x( [ 11 2 - ] )- and y( [ 1 - 10 ] )-directions. A vacuum region was inserted with periodic boundary conditions in the z-direction, and the extent of the vacuum region was 60 Å. The initial configuration of the fcc materials has a lattice parameter a = 4.126 Å, which corresponds to the value for aluminium obtained at its calculated melting point. The substrate was assigned to a varied lattice misfit with the solid aluminium, both negative and positive.
The EAM (embedded atom method) potential for aluminium, developed by Zope and Mishin to model interatomic interactions [43], was used in this work. The predicted melting temperature for pure Al is 870 ± 4 K with this potential [43]. During the simulation, the liquid atoms above the substrate were allowed to move freely under the effect of the interatomic potential. The substrate atoms were excluded from the equations of motion, but the forces they exert on the adjacent atoms were included. All the MD simulations were performed using the DL_POLY_4.08 MD package [44]. The equations of motion were integrated by means of the Verlet algorithm with a time step of 0.001 ps and the Berendsen NVT ensemble was used for the temperature control. The liquid was prepared by heating the system to a temperature of 1400 K with steps of 50 K, each lasting 100,000 MD steps.
The nucleation temperature, Tn, for each specified nucleation system was determined using the variable step search method. The equilibrated configuration of the liquid at 1400 K was cooled to a desired temperature with a step of 50 K and at each temperature step, and the system was allowed to run for 1,000,000 MD time steps to equilibrate. The initial nucleation temperature, T1, was determined by monitoring the variation in total energy and trajectory of the system during the equilibration. This means that exact nucleation occurred in the temperature interval between T1 and T1 + 50 K. A more accurate nucleation temperature, T2, was determined by a finer search in this reduced temperature interval with a temperature step of 5 K. Finally, the nucleation temperature, Tn, was determined by an even finer search between T2 and T2 + 5 K with a temperature step of 1 K. This approach allows the nucleation temperature to be determined within an error of ±1 K.
The atomic arrangement in the liquid adjacent to the interface during the simulation is characterized by the time-averaged atomic positions [45] and local bond-order analysis [46]. The time-averaged atomic positions in the individual layers of the liquid within 10 ps were taken from the trajectory of the simulation. With this approach, the solid atoms can be distinguished from the liquid atoms, where the solid atoms usually vibrate at their equilibrium positions, and the liquid atoms can move more than one atomic spacing [45]. The local bond-order analysis is another approach widely used in atomistic simulations to distinguish the solid atoms from the liquid atoms in the bulk liquid [47]. To perform the local bond-order analysis, the local bond-order parameter, ql(i), was calculated as: [46]
q l ( i ) = ( 4 π 2 l + 1 m = l l | q lm ( i ) | 2 ) 1 / 2 ,
where the (2l + 1) dimensional complex vector qlm(i) is the sum of spherical harmonics, Ylm(rij), over all the nearest neighbouring atoms of the atom i. Two neighbouring atoms i and j can be recognised to be connected if the correlation function, q6(iq6(j), of the vector q6 of neighbouring atoms i and j exceeds a certain threshold, which is 0.1 in this study. To distinguish the solid atoms from the liquid atoms, a threshold on the number of connections that an atom has with its neighbours is set to 6.

3. Heterogeneous Nucleation on a Single Substrate

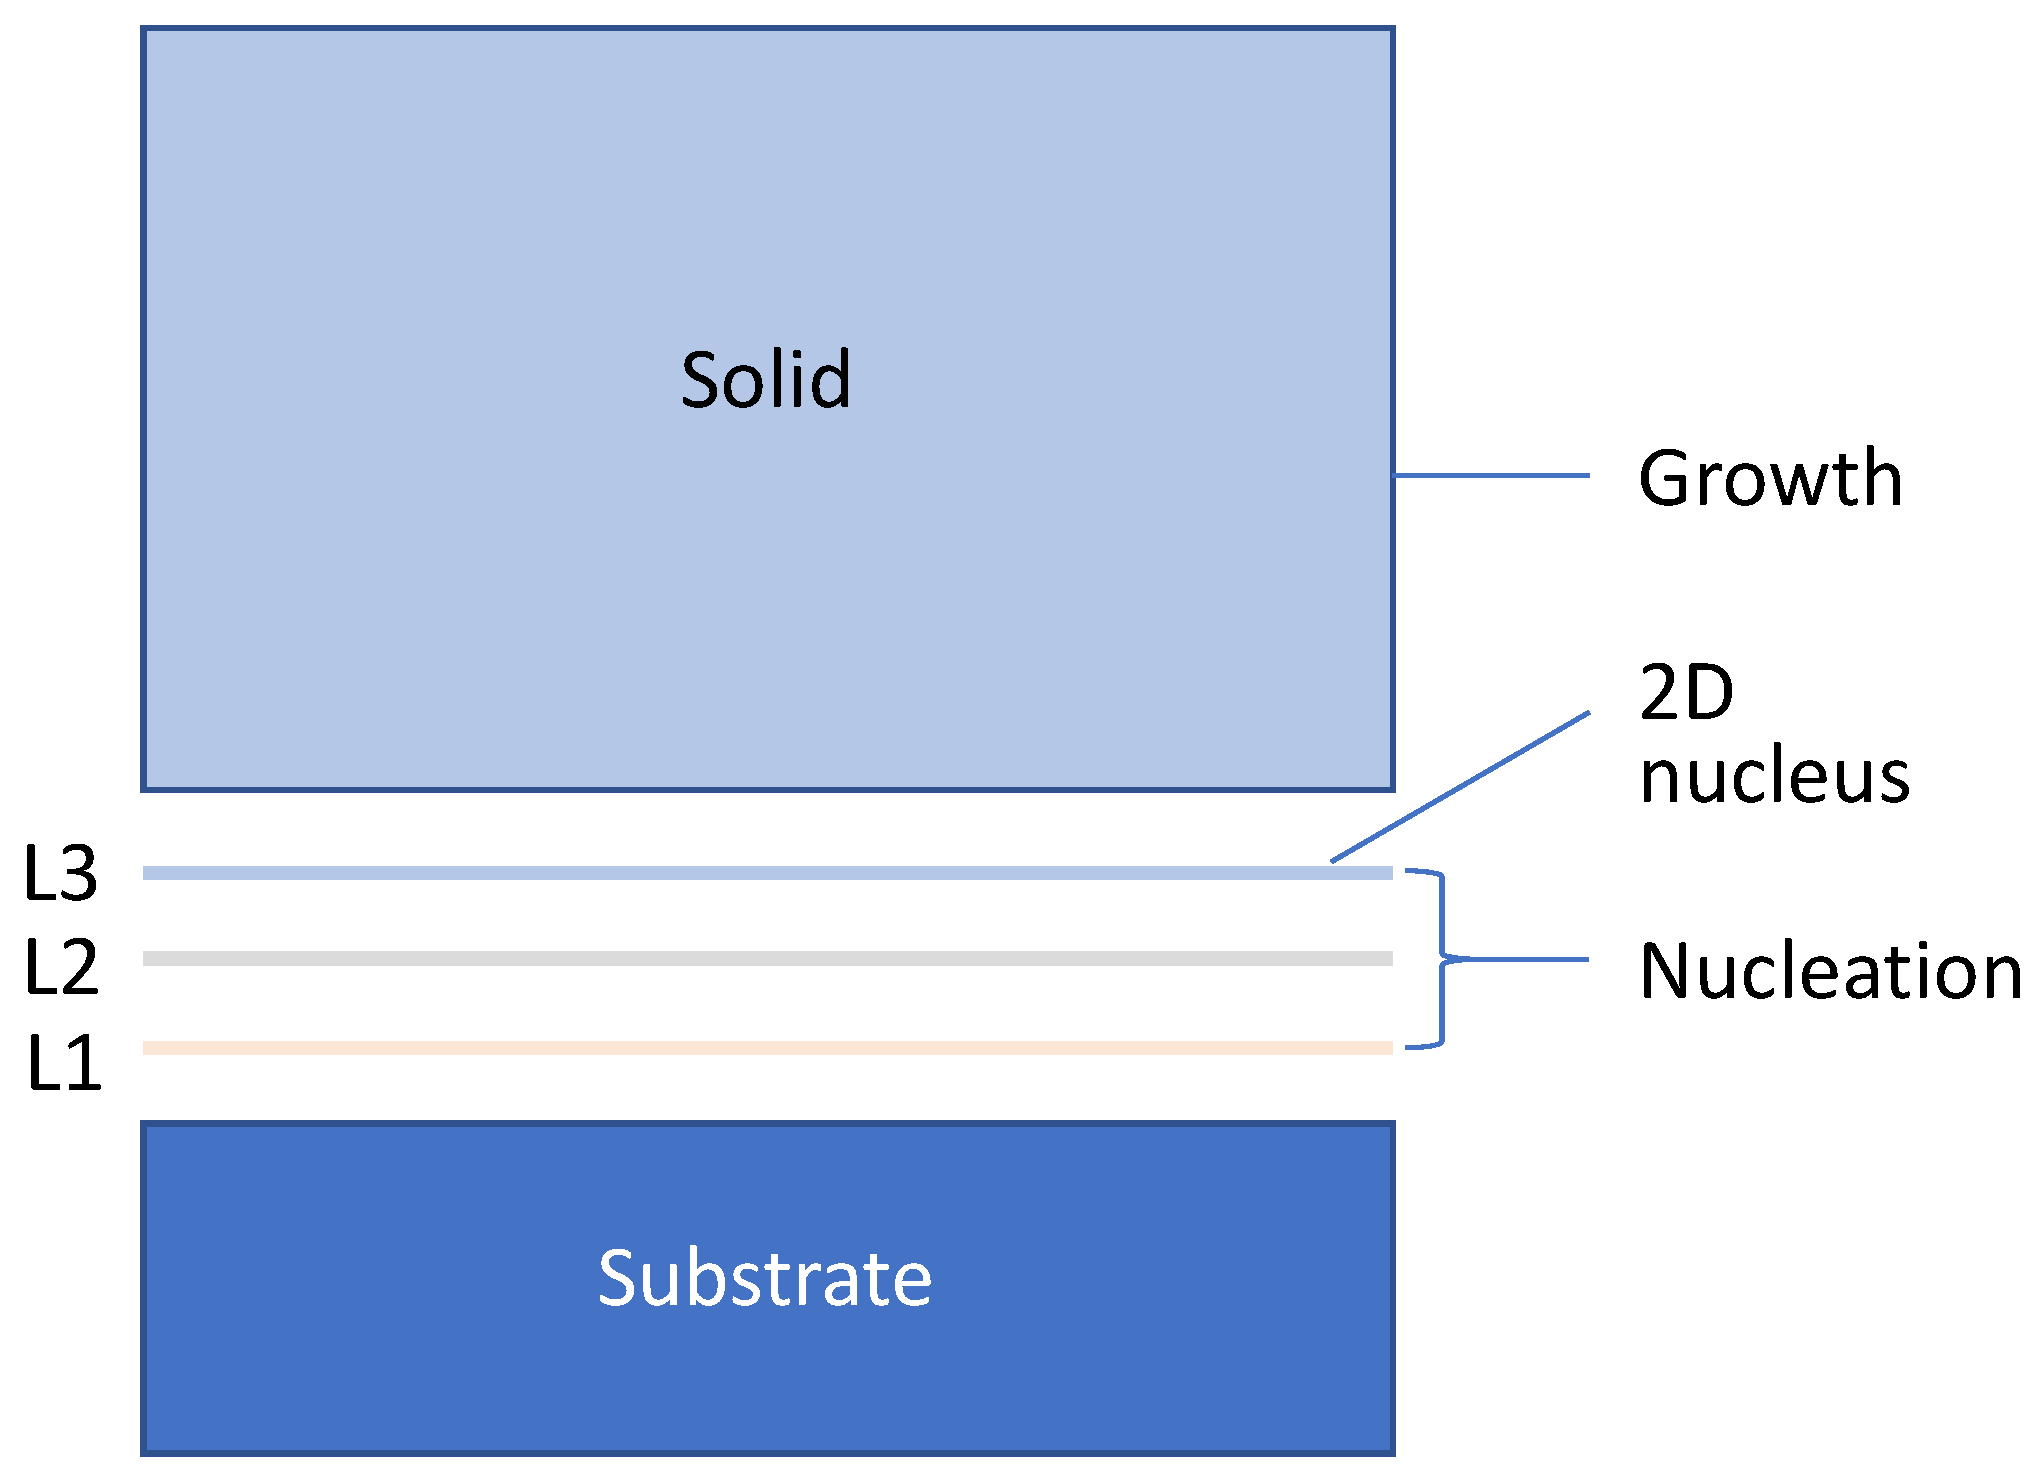
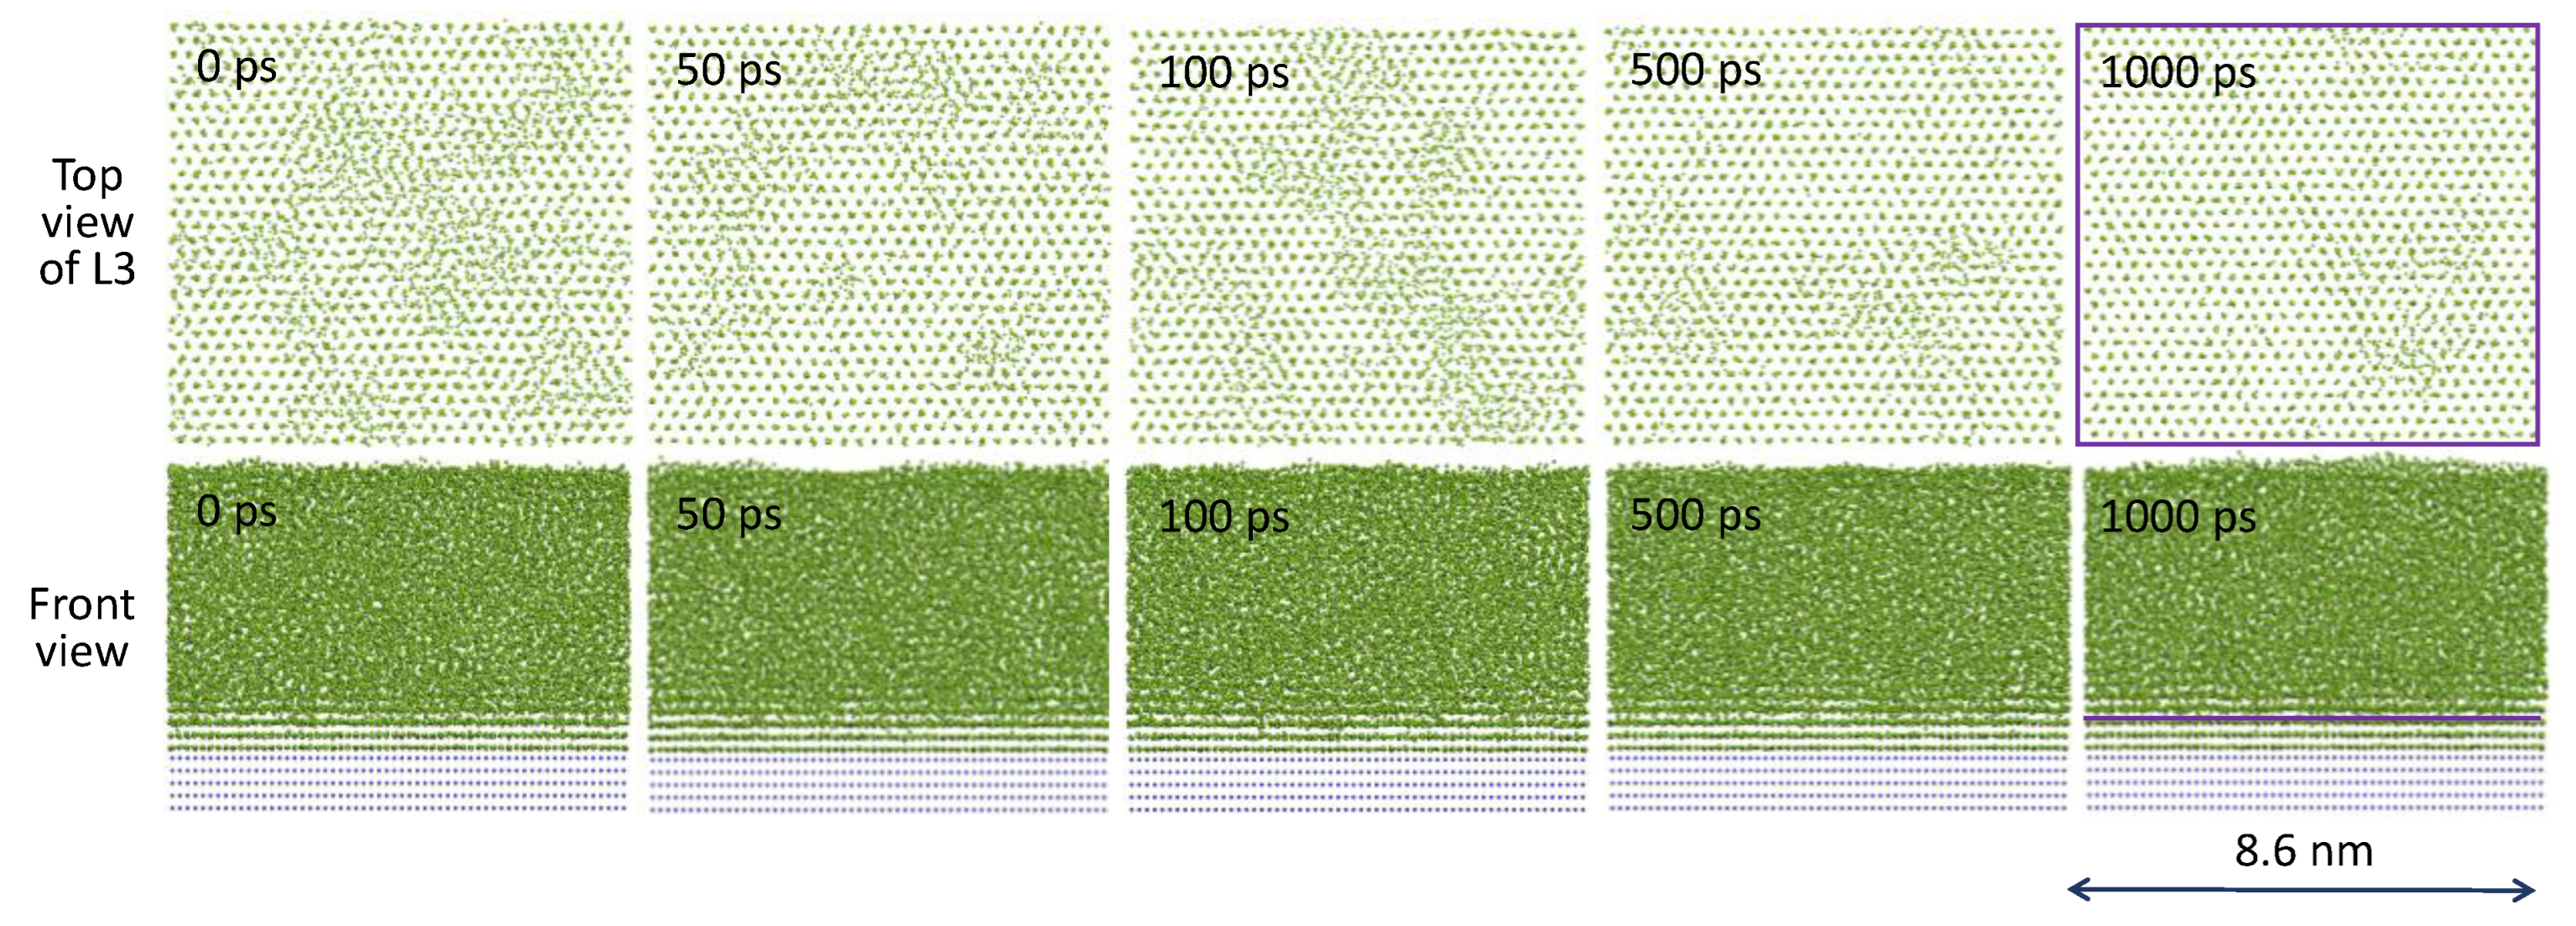
3.1. Three-Layer Nucleation Mechanism

The recent advance in understanding of early stages of solidification [3,25,37,38,39,40] has led to new definitions for prenucleation [25], heterogeneous nucleation [3], and grain initiation [39,40]. Prenucleation refers to the phenomenon of atomic ordering in the liquid adjacent to a crystalline substrate. The outcome of prenucleation is a precursor for the subsequent heterogeneous nucleation, which has the highest atomic ordering and the lowest liquid/substrate interfacial energy prior to nucleation. Upon realising that the essential mechanism for both heterogeneous nucleation and crystal growth is structural templating [3,38], we have redefined heterogenous nucleation as a process that creates a 2D nucleus with a radius of rn (effectively a crystal plane of the solid) that can template further growth [3]. Further growth of the solid proceeds by spherical cap formation, although an energy barrier may exist for free growth (see Figure 2). More importantly, we found that heterogeneous nucleation completes within the first three atomic layers, with the 3rd layer being the 2D nucleus [3,26,27] (Figure 3). In this section, we describe briefly the three-layer mechanism for heterogeneous nucleation under different interfacial conditions in terms of atomic matching across the solid (S)/substrate (N) interface (the S/N interface).
Our atomistic investigation using MD simulations has established a three-layer nucleation mechanism [38]. We found that building on the precursor created by the prenucleation process heterogeneous nucleation proceeds layer-by-layer and completes within the first three layers to provide a 2D nucleus. Depending on the nature of lattice misfit between the solid and the substrate, different mechanisms are operational for accommodating the misfit: dislocation mechanism for systems with small negative misfit (−12.5% < f < 0); vacancy mechanism for systems with small positive misfit (0 < f < 12.5%); and the formation of a coincidence site lattice (CSL) as the new substrate at the stage of prenucleation for the systems with large misfit to reduce the misfit to |f| < 12.5% and then follow the mechanisms for systems of small misfit.

3.2. Effect of Substrate Size

Our earlier MD simulations of heterogeneous nucleation were mainly carried out on small systems with a relatively small substrate size [3]. Such simulation systems mainly represent the cases for rn > rN, where the 2D nucleus covers the entire substrate surface (Figure 4a). More recently, our MD simulations have been extended to larger systems with a relatively large substrate size. We found that in many cases, the 2D nucleus only covers partially the substrate surface, i.e., rn < rN (Figure 4b,c). Here, we choose two specific systems to demonstrate these two typical scenarios.
We first consider heterogeneous nucleation in the case of rNrn. Figure 5 presents the front view of time-averaged atomic positions of the system and top views of L3 in the simulation system with 2% misfit during heterogeneous nucleation at ΔTn = 40 K, showing the process of creating the 2D nucleus. The ordered region in L3 extends in size with increasing simulation time and covers the entire substrate surface to provide the 2D nucleus at t = 1000 ps, which has the same atomic arrangement as in a perfect {111} plane of fcc Al. For this system, nucleation occurs at ΔTn = 40 K (corresponding to 2rn = 14.1 nm from Equation (2) on a substrate of 2rN = 8.6 nm (corresponding to ΔTgi = 66 K from Equation (7), representing a typical case for rn > rN as depictured in Figure 4a.
We now consider heterogeneous nucleation in the case of rN > rn. Figure 6 shows the nucleation process of a system with −8% lattice misfit demonstrating a typical case for rN > rn, as depictured in Figure 4b. At the stage of prenucleation (t < 0 ps, see Figure 6a), there exist unstable ordered atomic clusters in L3, and a precursor is created at t = 0 ps, when one of the ordered atomic clusters becomes stabilised (not to disappear with time) as marked by the red dashed circle in L3 at t = 0 ps (Figure 6b). During heterogeneous nucleation (Figure 6b,c), this stabilized cluster grows in size with time to create the 2D nucleus at t = 40 ps as marked by the purple dashed circle at t = 40 ps. For this system, nucleation occurs at ΔTn = 136 K (2rn = 4.2 nm) on a substrate of 2rN = 15.7 nm (ΔTgi = 36 K), representing a typical case for rn < rN as depictured in Figure 4b. This is similar to the patch nucleation concept proposed by Turnbull in the 1950s [48,49].
Although in the cases of rN > rn, the 2D nucleus only covers partially the substrate surface, the essential features of heterogeneous nucleation are the same as in the cases where rNrn, as demonstrated in Figure 7. For the system with 8% misfit, the crystalline lattice in the 2D nucleus has no twist relative to the substrate lattice (Figure 7a), while for the system with −8% misfit, the 2D nucleus has a 6° twist relative to the substrate as indicated by the red line (Figure 7b).
Figure 8 is a plot of the nucleation undercoolings (ΔTn) against the radii of the 2D nuclei (rn) obtained from all the simulations systems conducted in our recent work in comparison with the theoretical predictions by the classical nucleation theory (Equation (2)). It is interesting to note that the MD data agree well with the homogeneous CNT predictions, being particularly well for the data obtained from large simulation systems. The CNT predictions by Equation (2) are for 3D nuclei (r*) obtained by homogeneous nucleation, while the MD data represent the relationship between ΔTn and rn for the 2D nuclei of heterogeneous nucleation. This good agreement in Figure 8 will be discussed further in Section 5.

4. Grain Initiation on a Single Substrate

After the three-layer nucleation, the 2D nucleus will template further growth, and the solidification enters the growth stage. However, as discussed in the previous sections, further growth of the 2D nucleus may need to overcome an energy barrier before it can grow isothermally (i.e., grain initiation). This energy barrier originates from the structural templating mechanism, in which solid atoms (not liquid atoms) may provide low energy positions for growing the next layer, as illustrated in Figure 9. A consequence of structural templating is that the number of atoms in the atomic layers along the growth direction will decrease during the growth. This is how the curvature is developed after nucleation. It is well understood in the literature that curvature will cause constrain to further growth, and further undercooling may be required to overcome such constraint [50]. In this section, we use MD simulations to investigate the curvature effect on grain initiation behaviour.

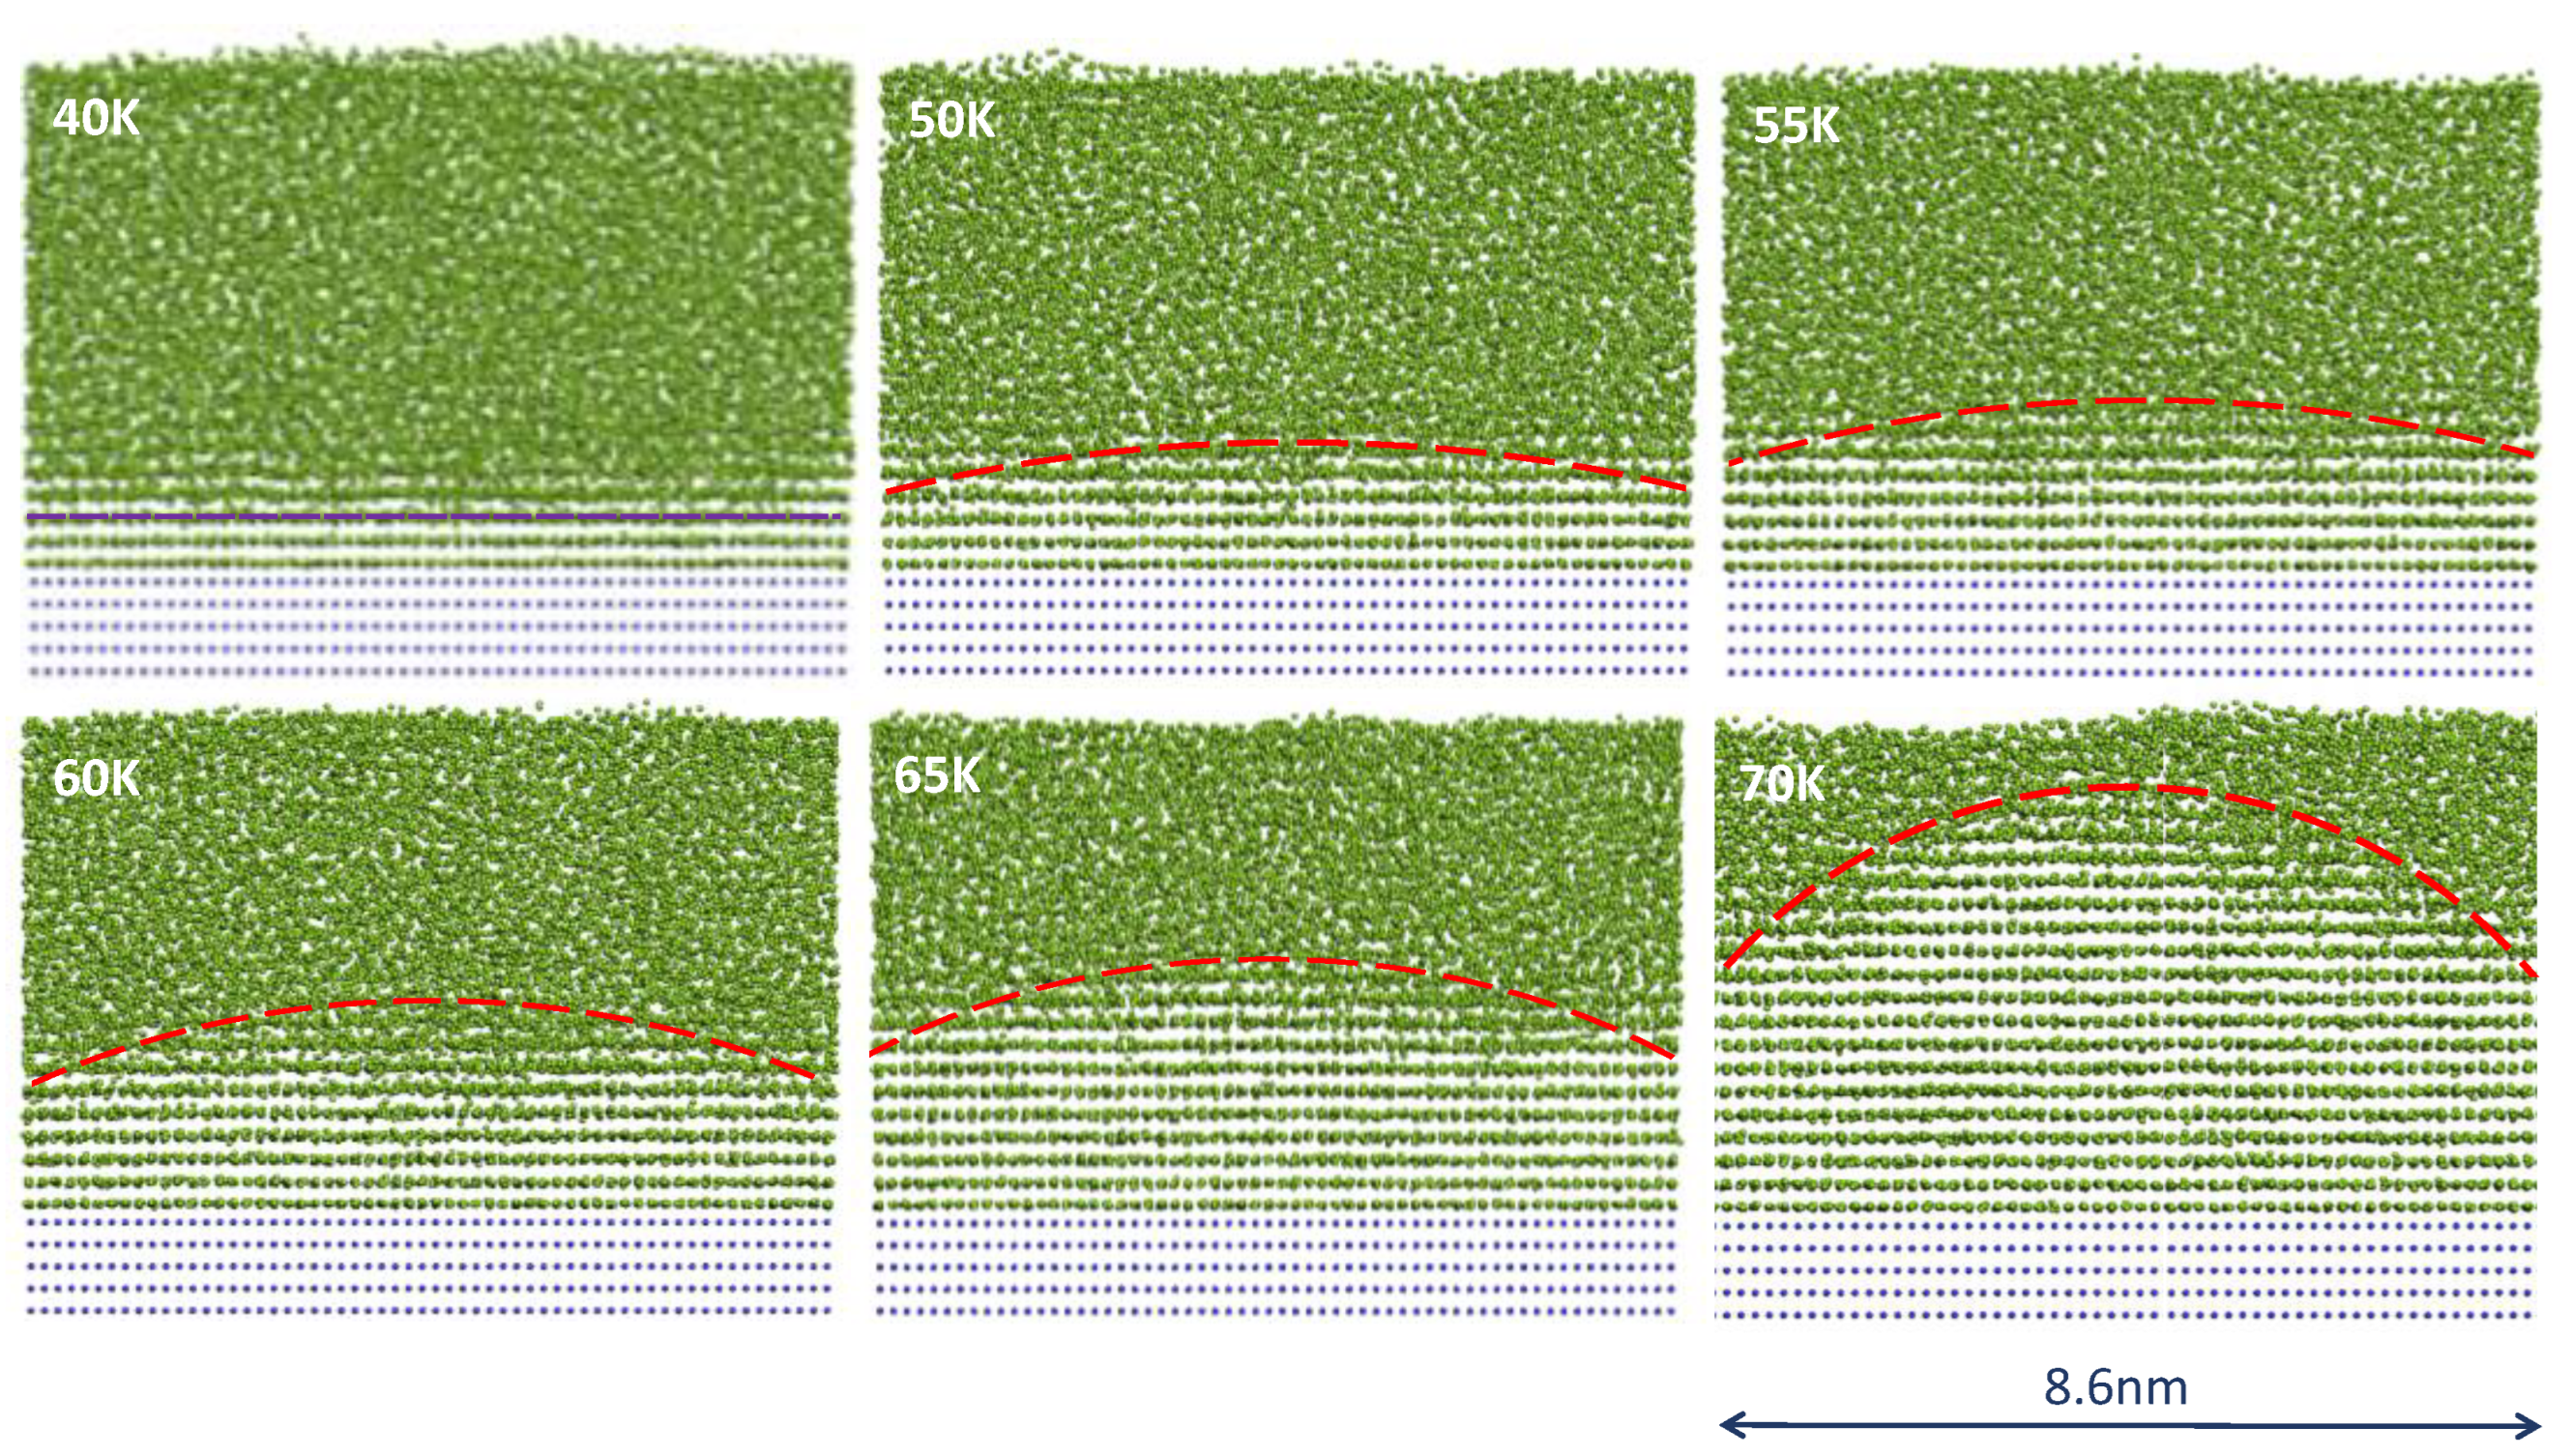
4.1. Constrained Grain Initiation

We use MD simulation results obtained from the systems with 2% misfit to demonstrate the concept of constrained grin initiation. It was identified that this system requires a nucleation undercooling of ΔTn = 40 K to create the 2D nucleus at t = 1000 ps on a substrate of 2rN = 8.6 nm, which corresponds to ΔTgi = 66 K (see Figure 5). We observed that no further growth was possible with prolonged simulation time after nucleation. The system was then subjected to increased undercoolings for further growth (Figure 10). It was found that further growth takes the form of spherical caps. For each increase in undercooling, the solid grows quickly to a certain cap height with a specific curvature (rLS, the curvature of the L/S interface) and then becomes stagnant with time. Analogous to Equations (2) and (8), one has the following equation for rLS:
Δ T r LS = 2 Γ ,
where ΔT is the undercooling required to deliver the dormant cap with a curvature of rLS.
This growth behaviour needs further explanation. After nucleation, further growth will develop curvature which represents a constraint (or energy barrier) to further growth (Figure 9). Further undercooling is required to overcome such a curvature constraint. Figure 11a schematically illustrates the free energy change during nucleation and further growth for three different undercoolings as a function of the total number of solidified atoms with the relative positions of the relevant temperatures being shown in Figure 11b. As shown in our previous work [3], three-layer nucleation is a spontaneous down-hill process. However, further growth (e.g., at T1) leads to the increase in free energy (ΔG) due to the creation of curvature, and the ΔG curve has a maximum corresponding to an energy barrier (ΔG*). A further decrease in temperature (or increase in undercooling) results in a decrease in the energy barrier due to the reduced curvature constraint. At each temperature, the solid and liquid reaches a metastable equilibrium to define the metastable curvature given by Equation (2). Thus, for each increase in undercooling, there will be some further growth of the cap limited by the new curvature creased under this undercooling (see Figure 11c). However, when ΔT reaches ΔTgi, the system reaches an equilibrium state, where the driving force for growth (free energy decrease due to solidification) balances the curvature constraint, as described by Equation (7). When ΔT > ΔTgi, the system becomes unstable, isothermal growth will be barrierless, and the system enters the free growth stage.

4.2. Unconstrained Grain Initiation

In the previous case, nucleation occurs at an undercooling of ΔTn = 40 K on a substrate with ΔTgi = 66 K. We have concluded that when ΔTn < ΔTgi, the spherical cap formation is a constrained growth process in which further growth requires an increase in undercooling to overcome an energy barrier. However, when ΔTn > ΔTgi, after nucleation, further growth becomes barrierless, and the spherical cap formation becomes an unconstrained process. In this section, we use MD simulation results to demonstrate such an unconstrained spherical cap formation process.
We turn to the system with 2% misfit again. Heterogeneous nucleation takes place in this system under an undercooling ΔTn = 40 K to create a 2D nucleus at t = 1000 ps that covers the entire substrate surface (Figure 5), but there is no further growth observed afterwards. The system was then subjected to growth at an undercooling of ΔT = 90 K, which is greater than its grain initiation undercooling (ΔTgi = 66 K). Figure 12 shows the spherical cap formation process under isothermal conditions (ΔT = 90 K) as a function of time. It is interesting to note that instead of growing layer-by-layer, the system grows a spherical cap with a base size corresponding to the 2D nucleus size of 2rn = 6.3 nm. The cap height increases with time under isothermal condition, suggesting that such spherical cap formation is barrierless and hence unconstrained. In addition, Figure 12 suggests that spherical cap formation is a process inherent to crystal growth at a given undercooling and has little to do with the nature of the substrate, since the existence of the 2D nucleus formed at ΔT = 40 K has made no difference to the spherical cap formation process.
Another example of unconstrained spherical cap formation is given in Figure 13. For the system with 8% misfit, the nucleation occurred at ΔTn = 131 K on a substrate of 2rN = 8.9 nm (ΔTgi = 64 K) to provide a 2D nucleus of 2rn = 4.3 nm marked by the purple dashed circle at t = 40 ps in Figure 13. With increasing time, the 2D nucleus grows isothermally initially into a spherical cap (t = 50 ps) and then hemispheres with increasing radius (t > 60 ps). Due to the large undercooling (or small 2D nucleus size), the spherical cap formation process is rather short (less than 20 ps). An interesting phenomenon observed is that after spherical cap formation (formation of the first hemisphere), further growth takes the form of hemispheres until the radius of the hemisphere reaches that of the substrate.
Similar results were obtained in the system with −8% misfit. Figure 14 shows the growth process in this system after heterogeneous nucleation at t = 40 ps. This system grows faster than the system with 8% misfit (Figure 13). The spherical cap formation process occurs within 10 ps and does not even show in the time interval in Figure 14. However, the hemisphere growth process after spherical cap formation is the same in both systems.
Such unconstrained spherical cap formation behaviour can be understood with the help of the schematic illustration in Figure 15. When ΔTn > ΔTgi, both the nucleation and growth processes become barrierless (Figure 15a). In such cases, although the free growth criterion is satisfied early at higher temperature, nucleation and spherical cap formation can only occur isothermally at the nucleation temperature, which is lower than the temperature required for free growth (Figure 15b). Solidification under such conditions proceeds isothermally through the following steps without any energy barriers (Figure 15c):
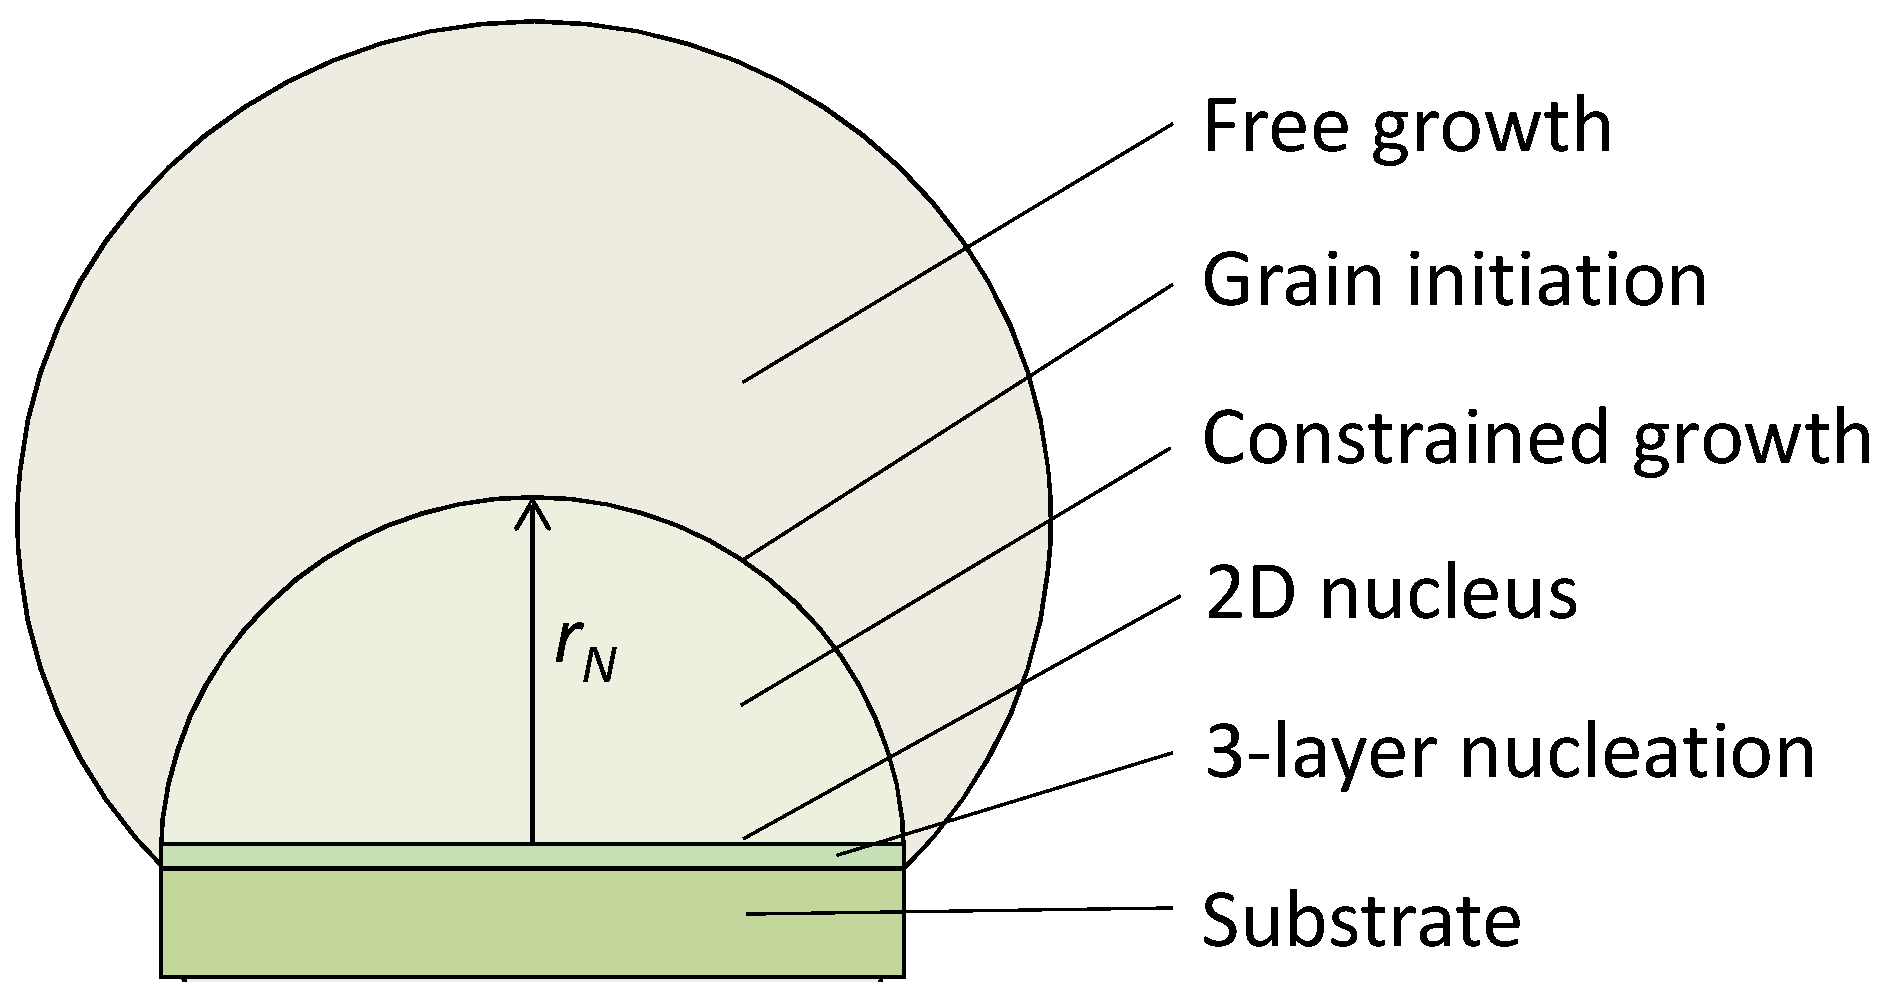
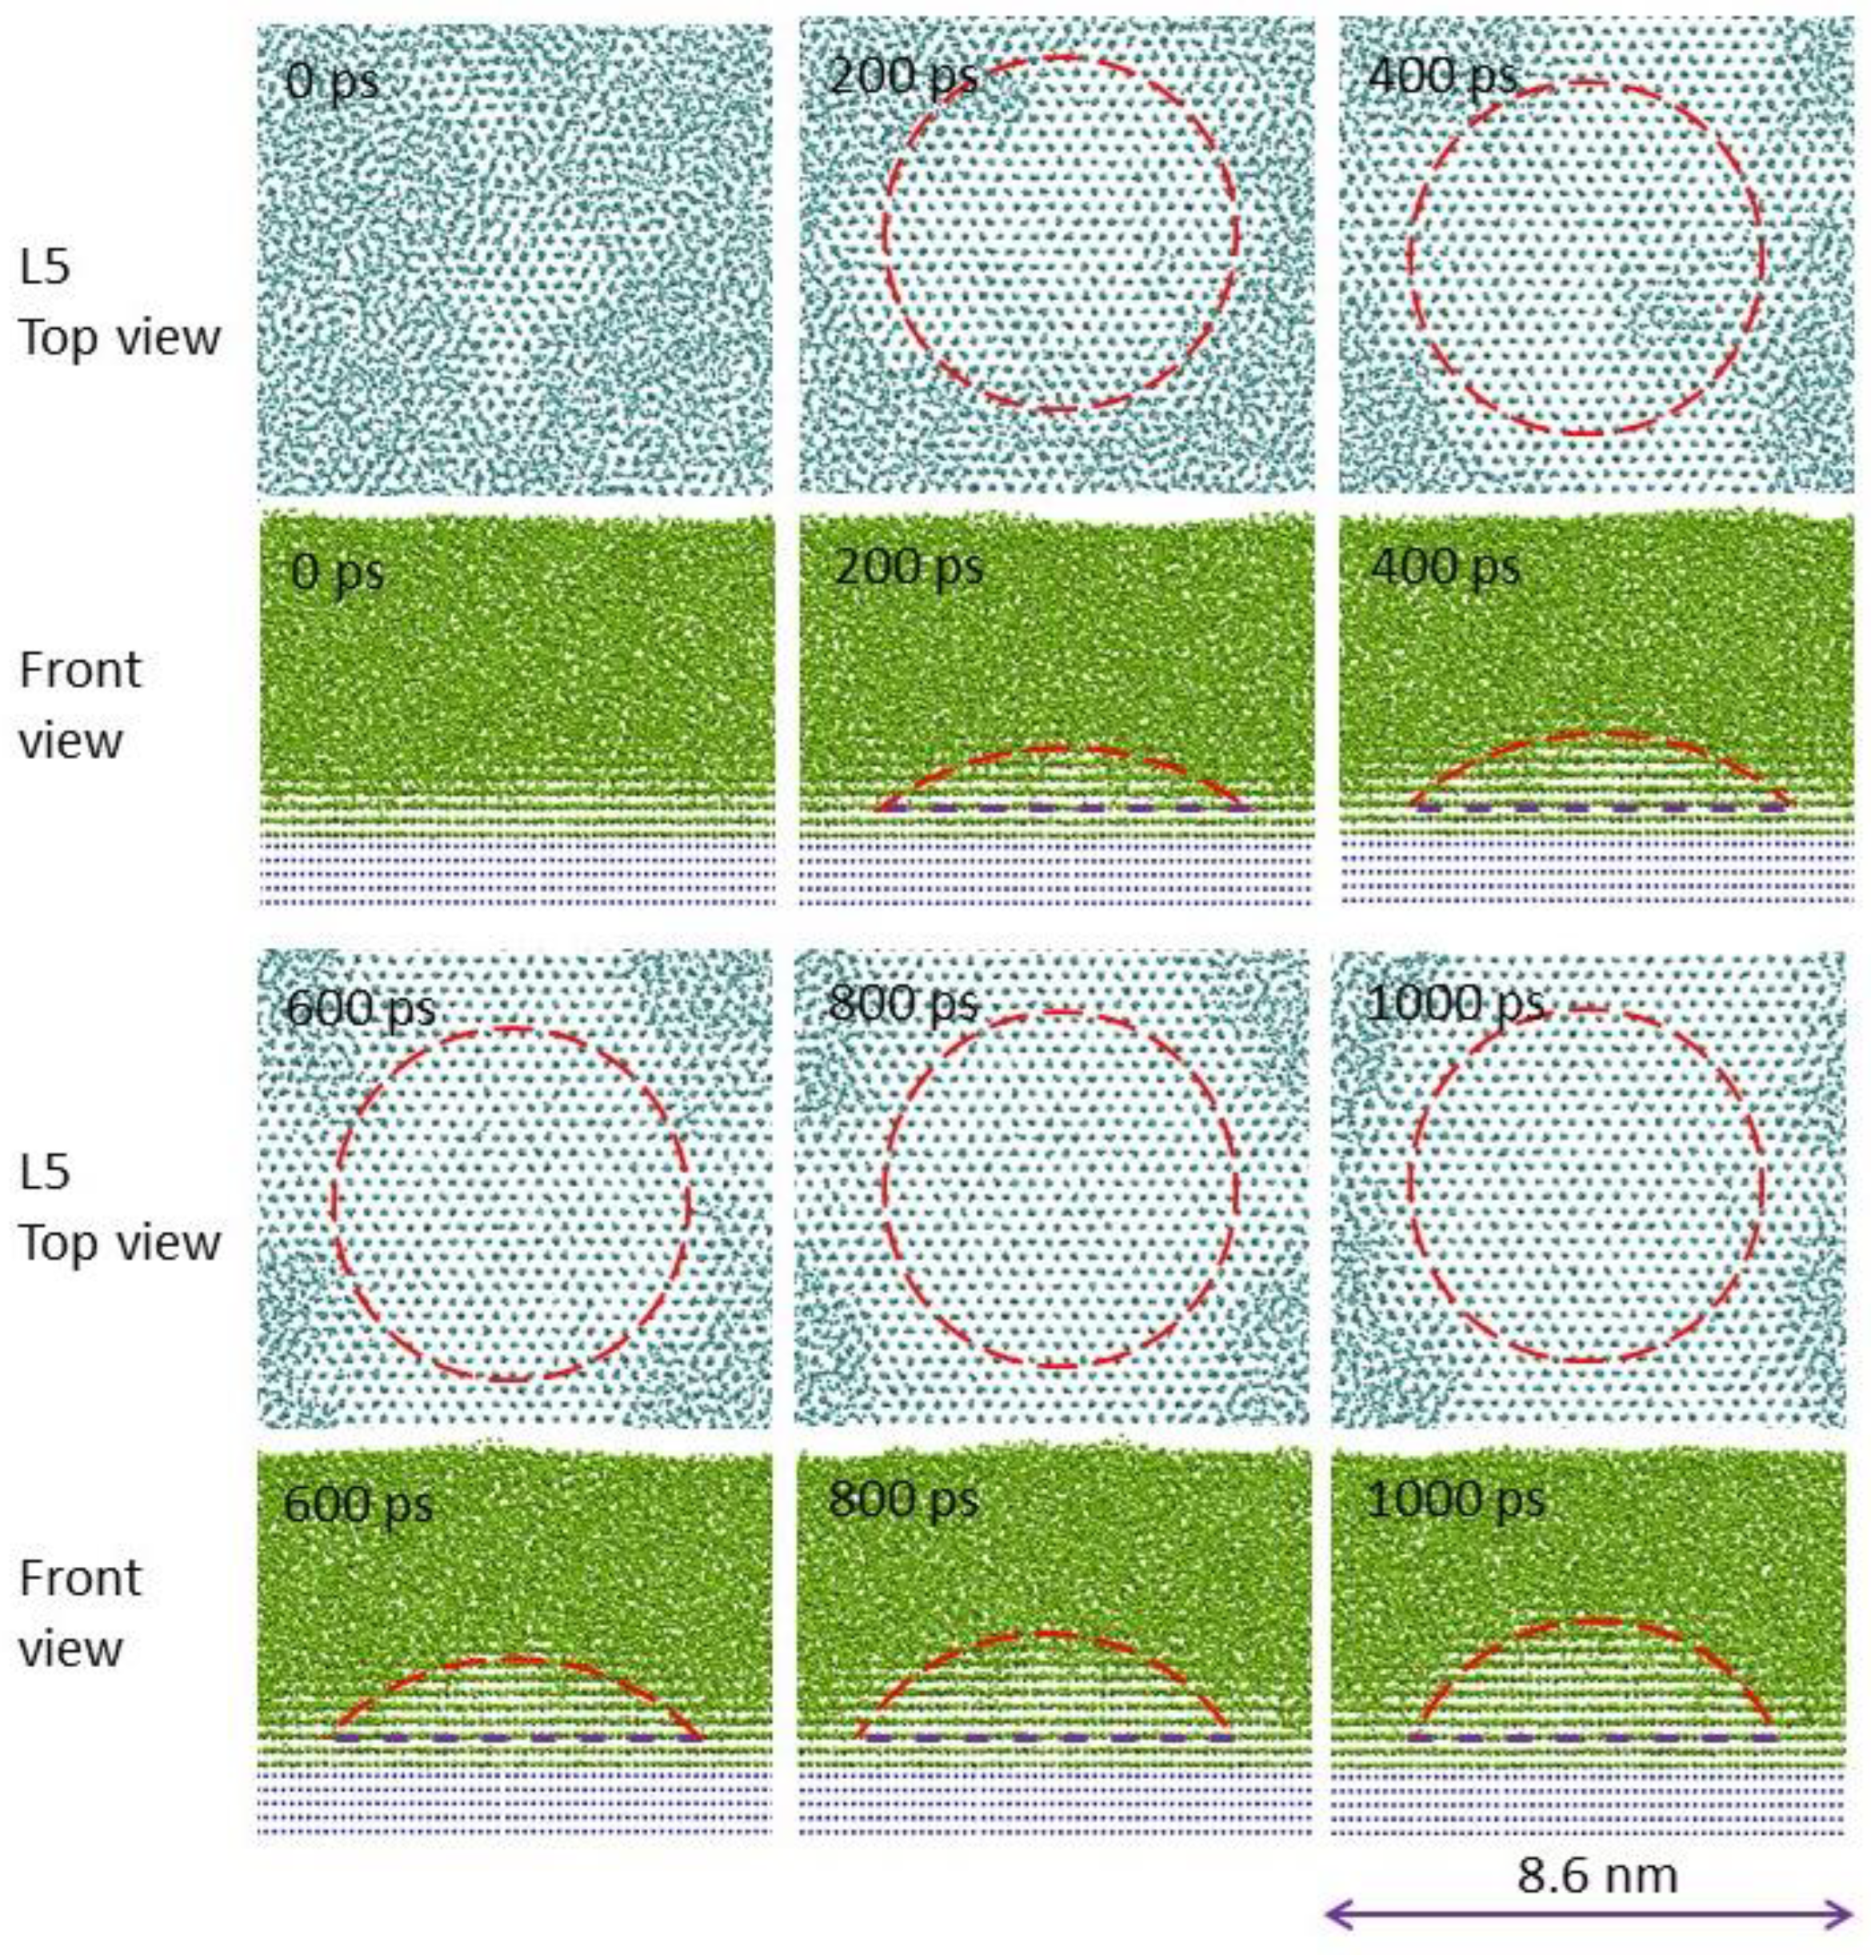
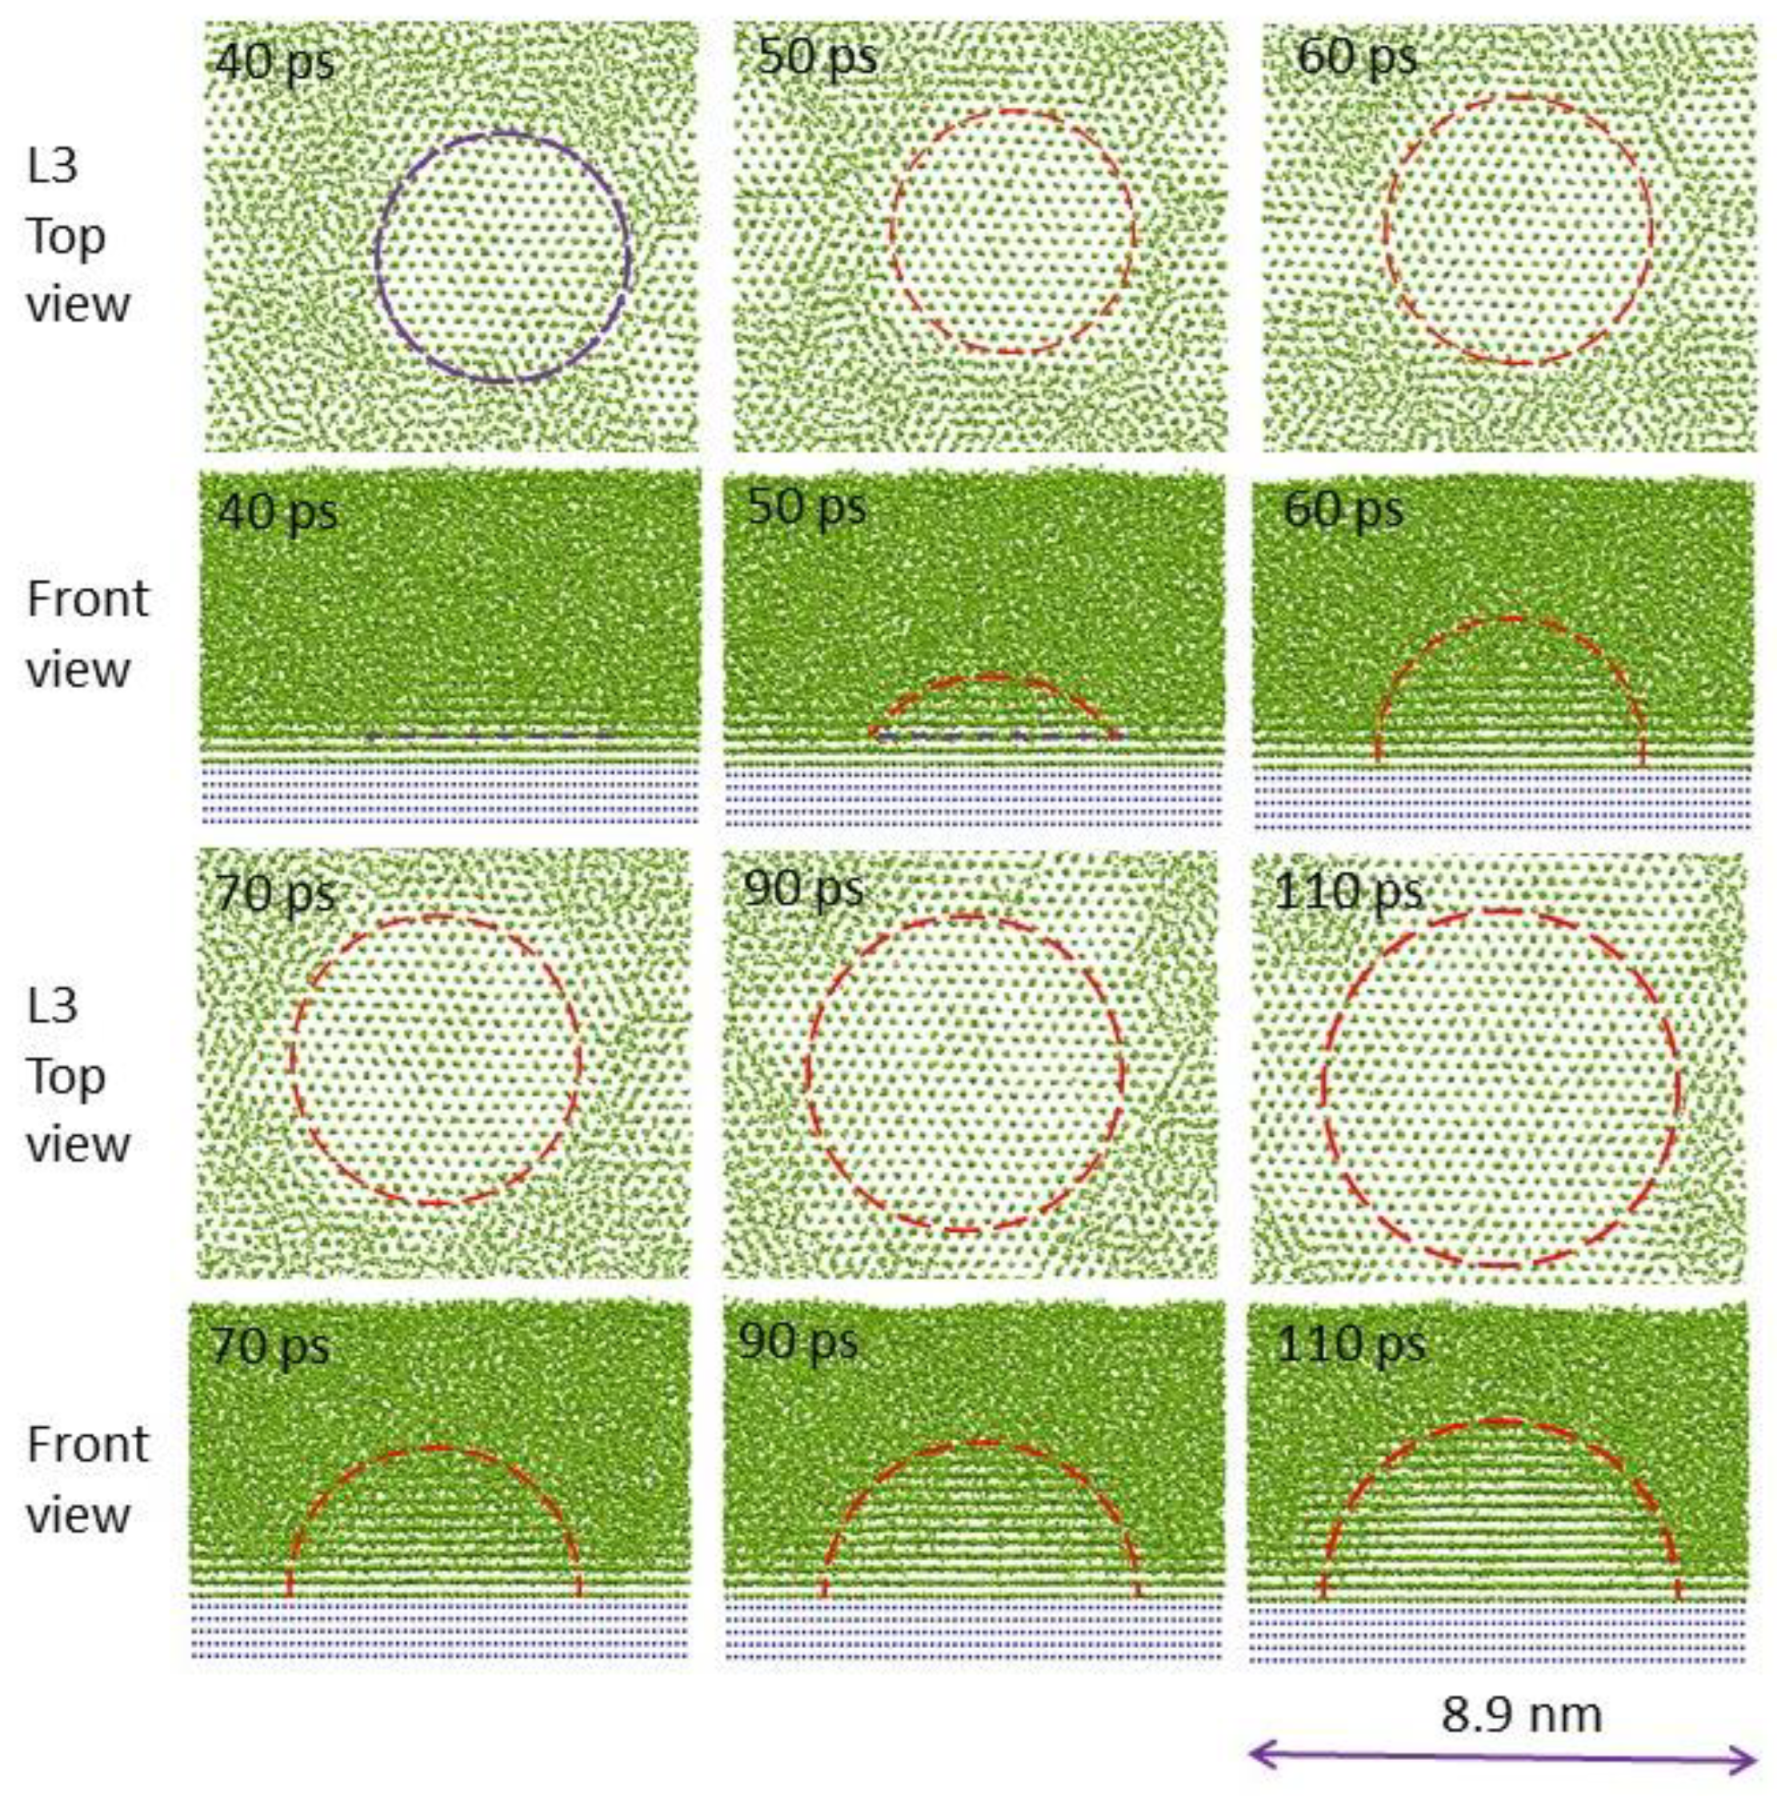
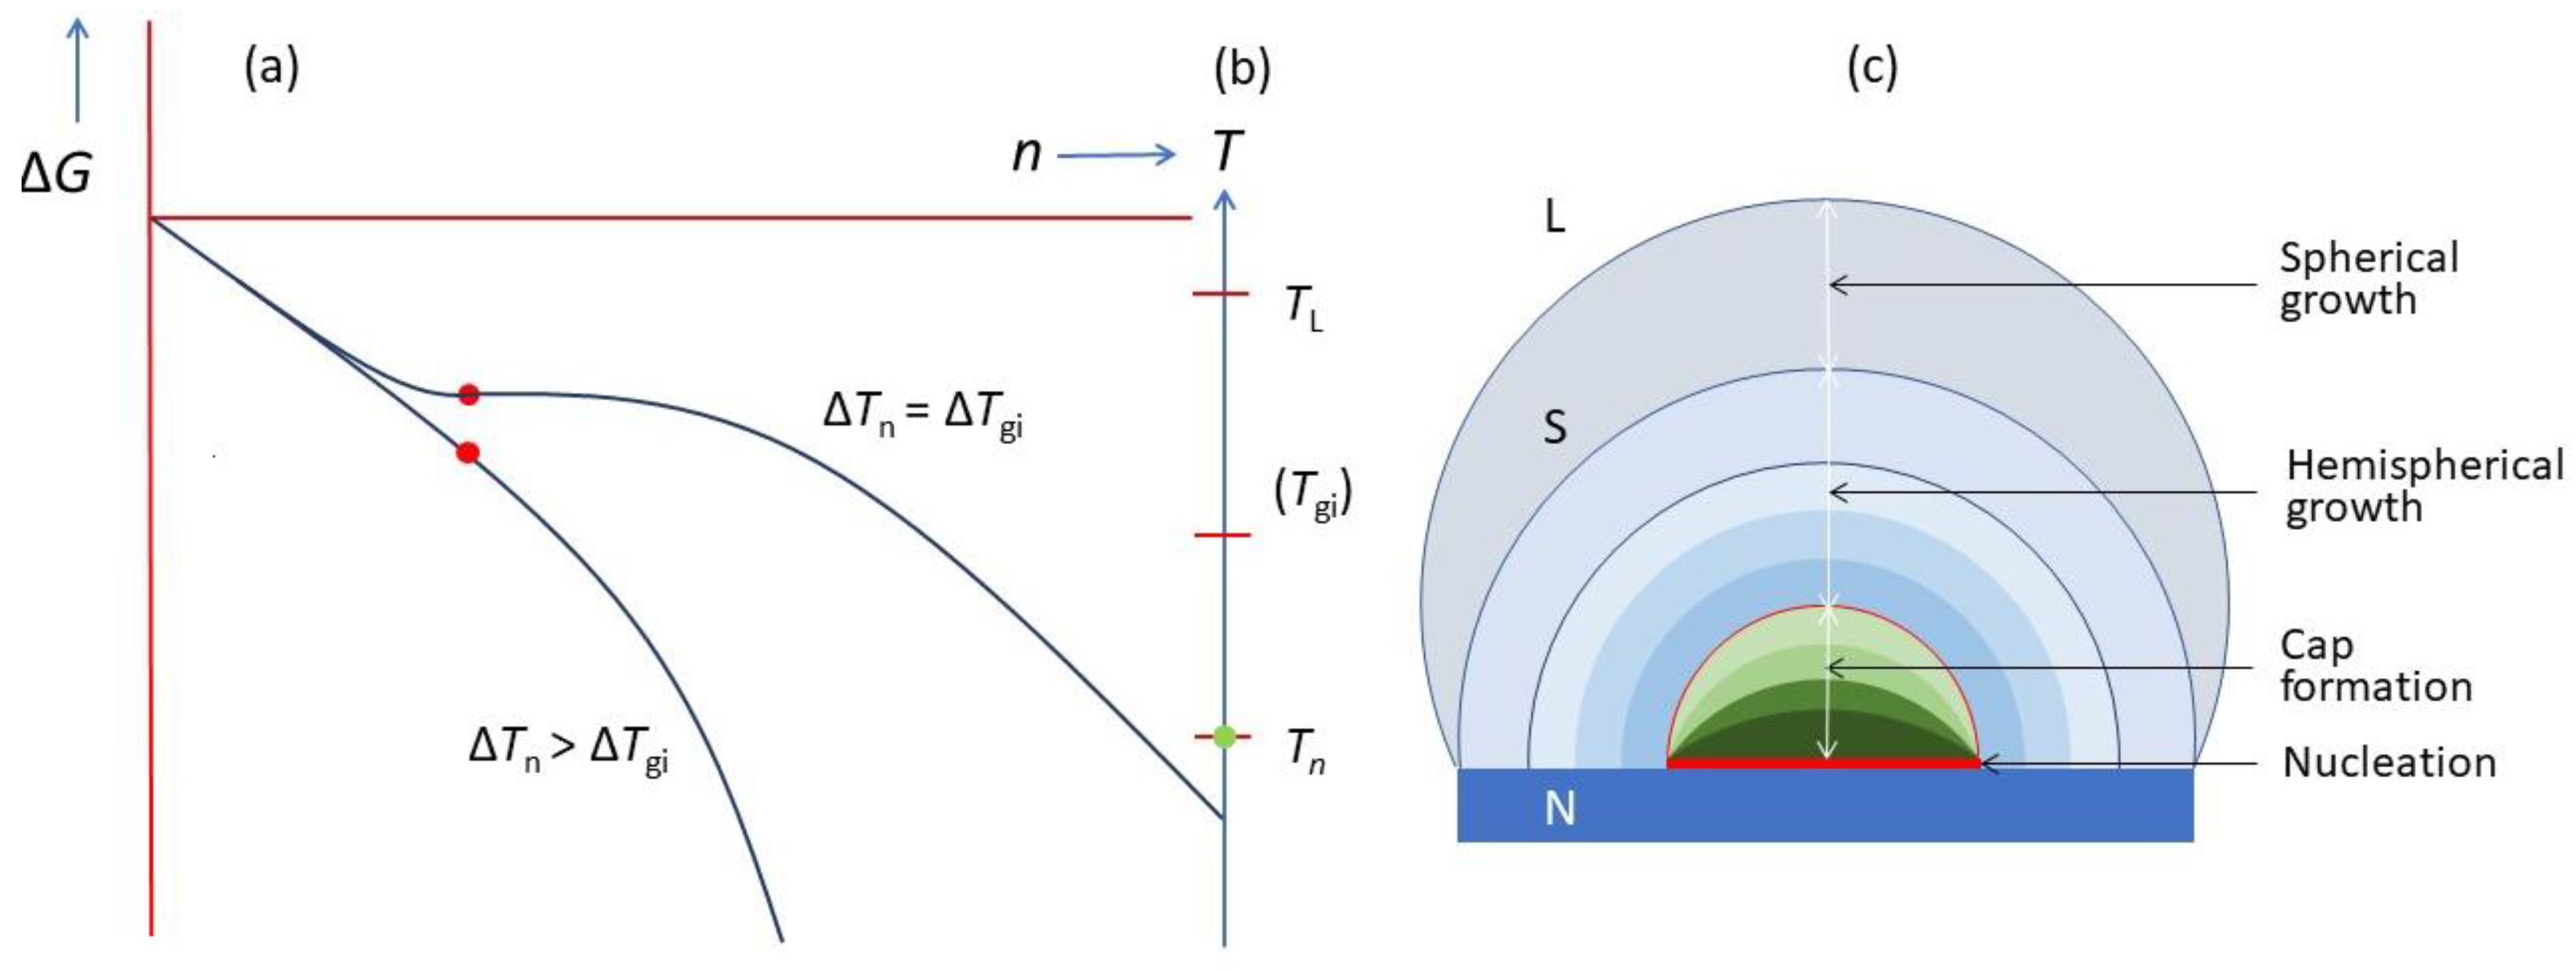
  • Heterogeneous nucleation through the three-layer mechanism to generate 2D nucleus with rn being defined by the nucleation undercooling (ΔTn).
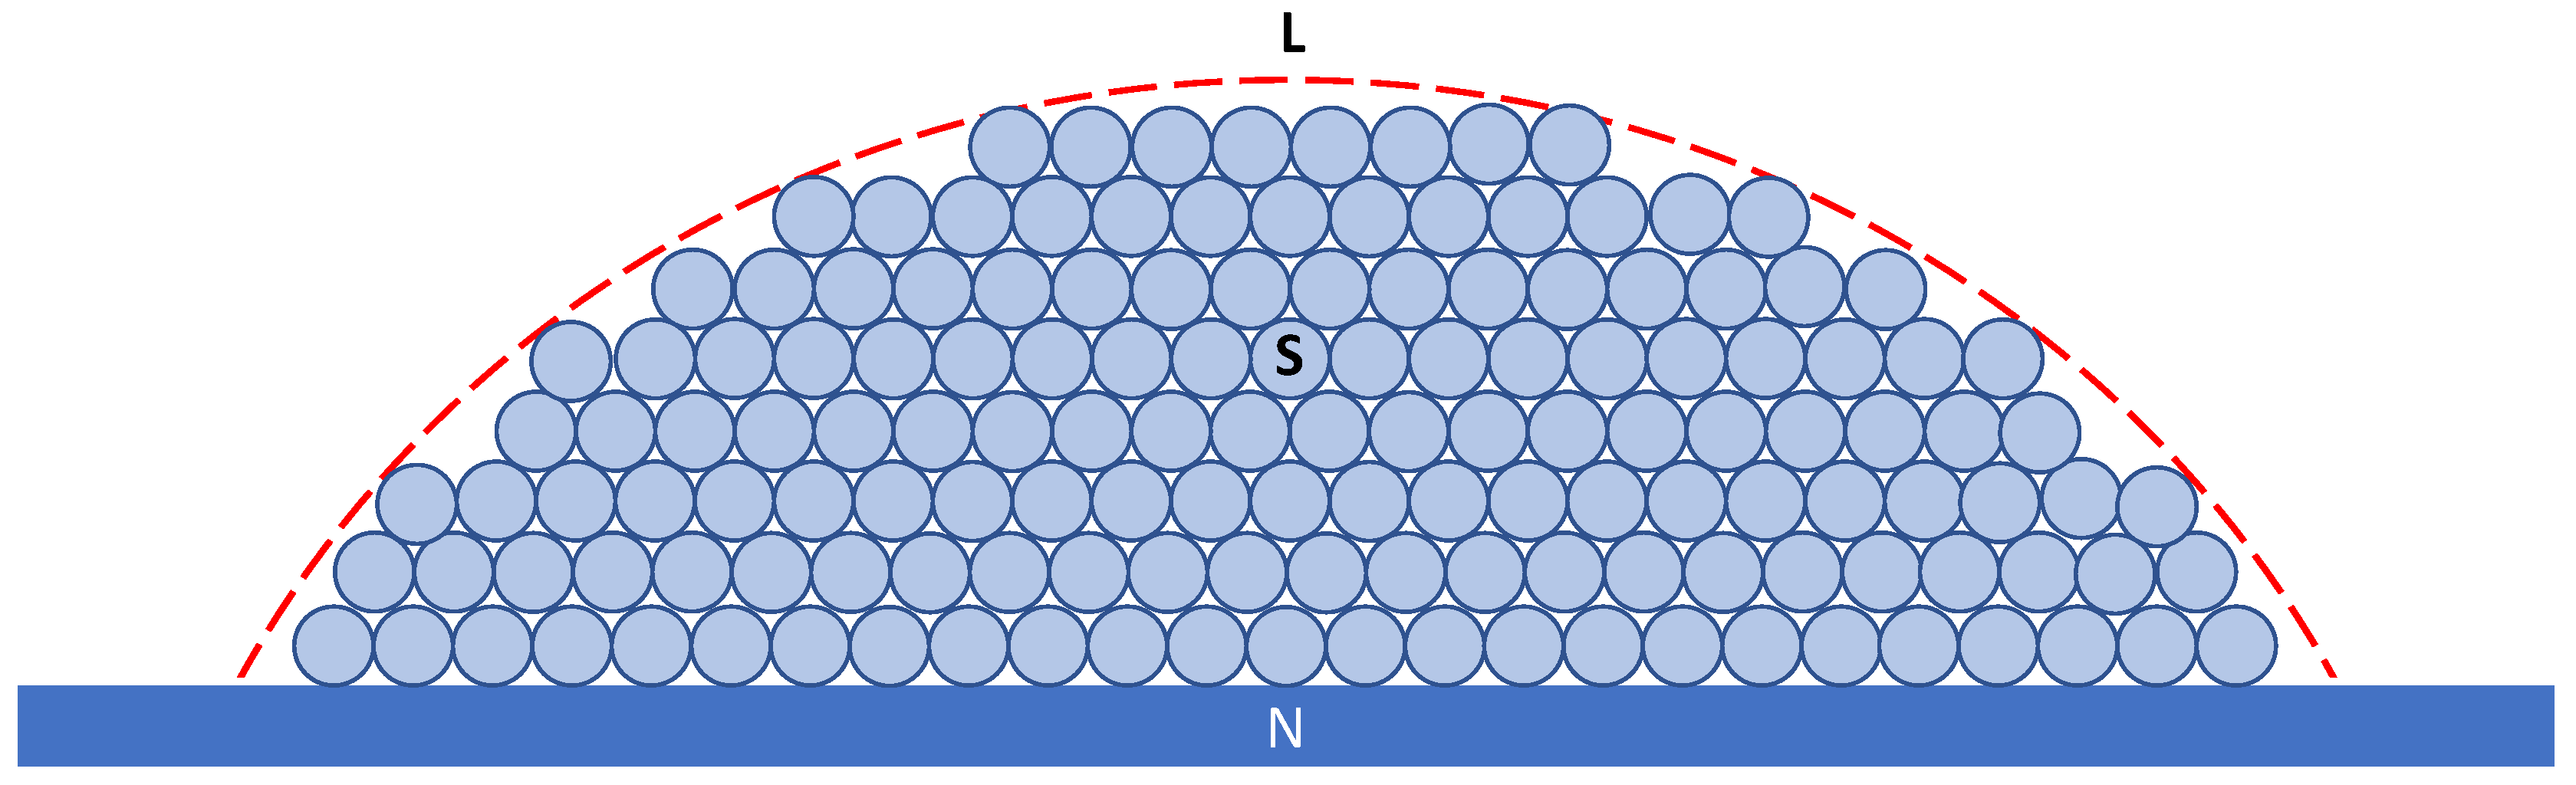
  • Barrierless spherical cap formation to create a hemisphere with a radius of rn.
  • Hemispherical growth with an increasing radius to deliver a hemisphere with rLS = rN.
  • Spherical growth beyond the hemisphere with rLS > rN.
Although the spherical growth in Step 4 was not observed in our MD simulation due to the limited size of the system we used, such spherical growth beyond the hemisphere was indeed observed in the phase-field crystal modelling by Gránásy and co-workers [35] and in super MD simulation systems (over 1 million atoms) conducted by Fujinaga and Shibuta [36].

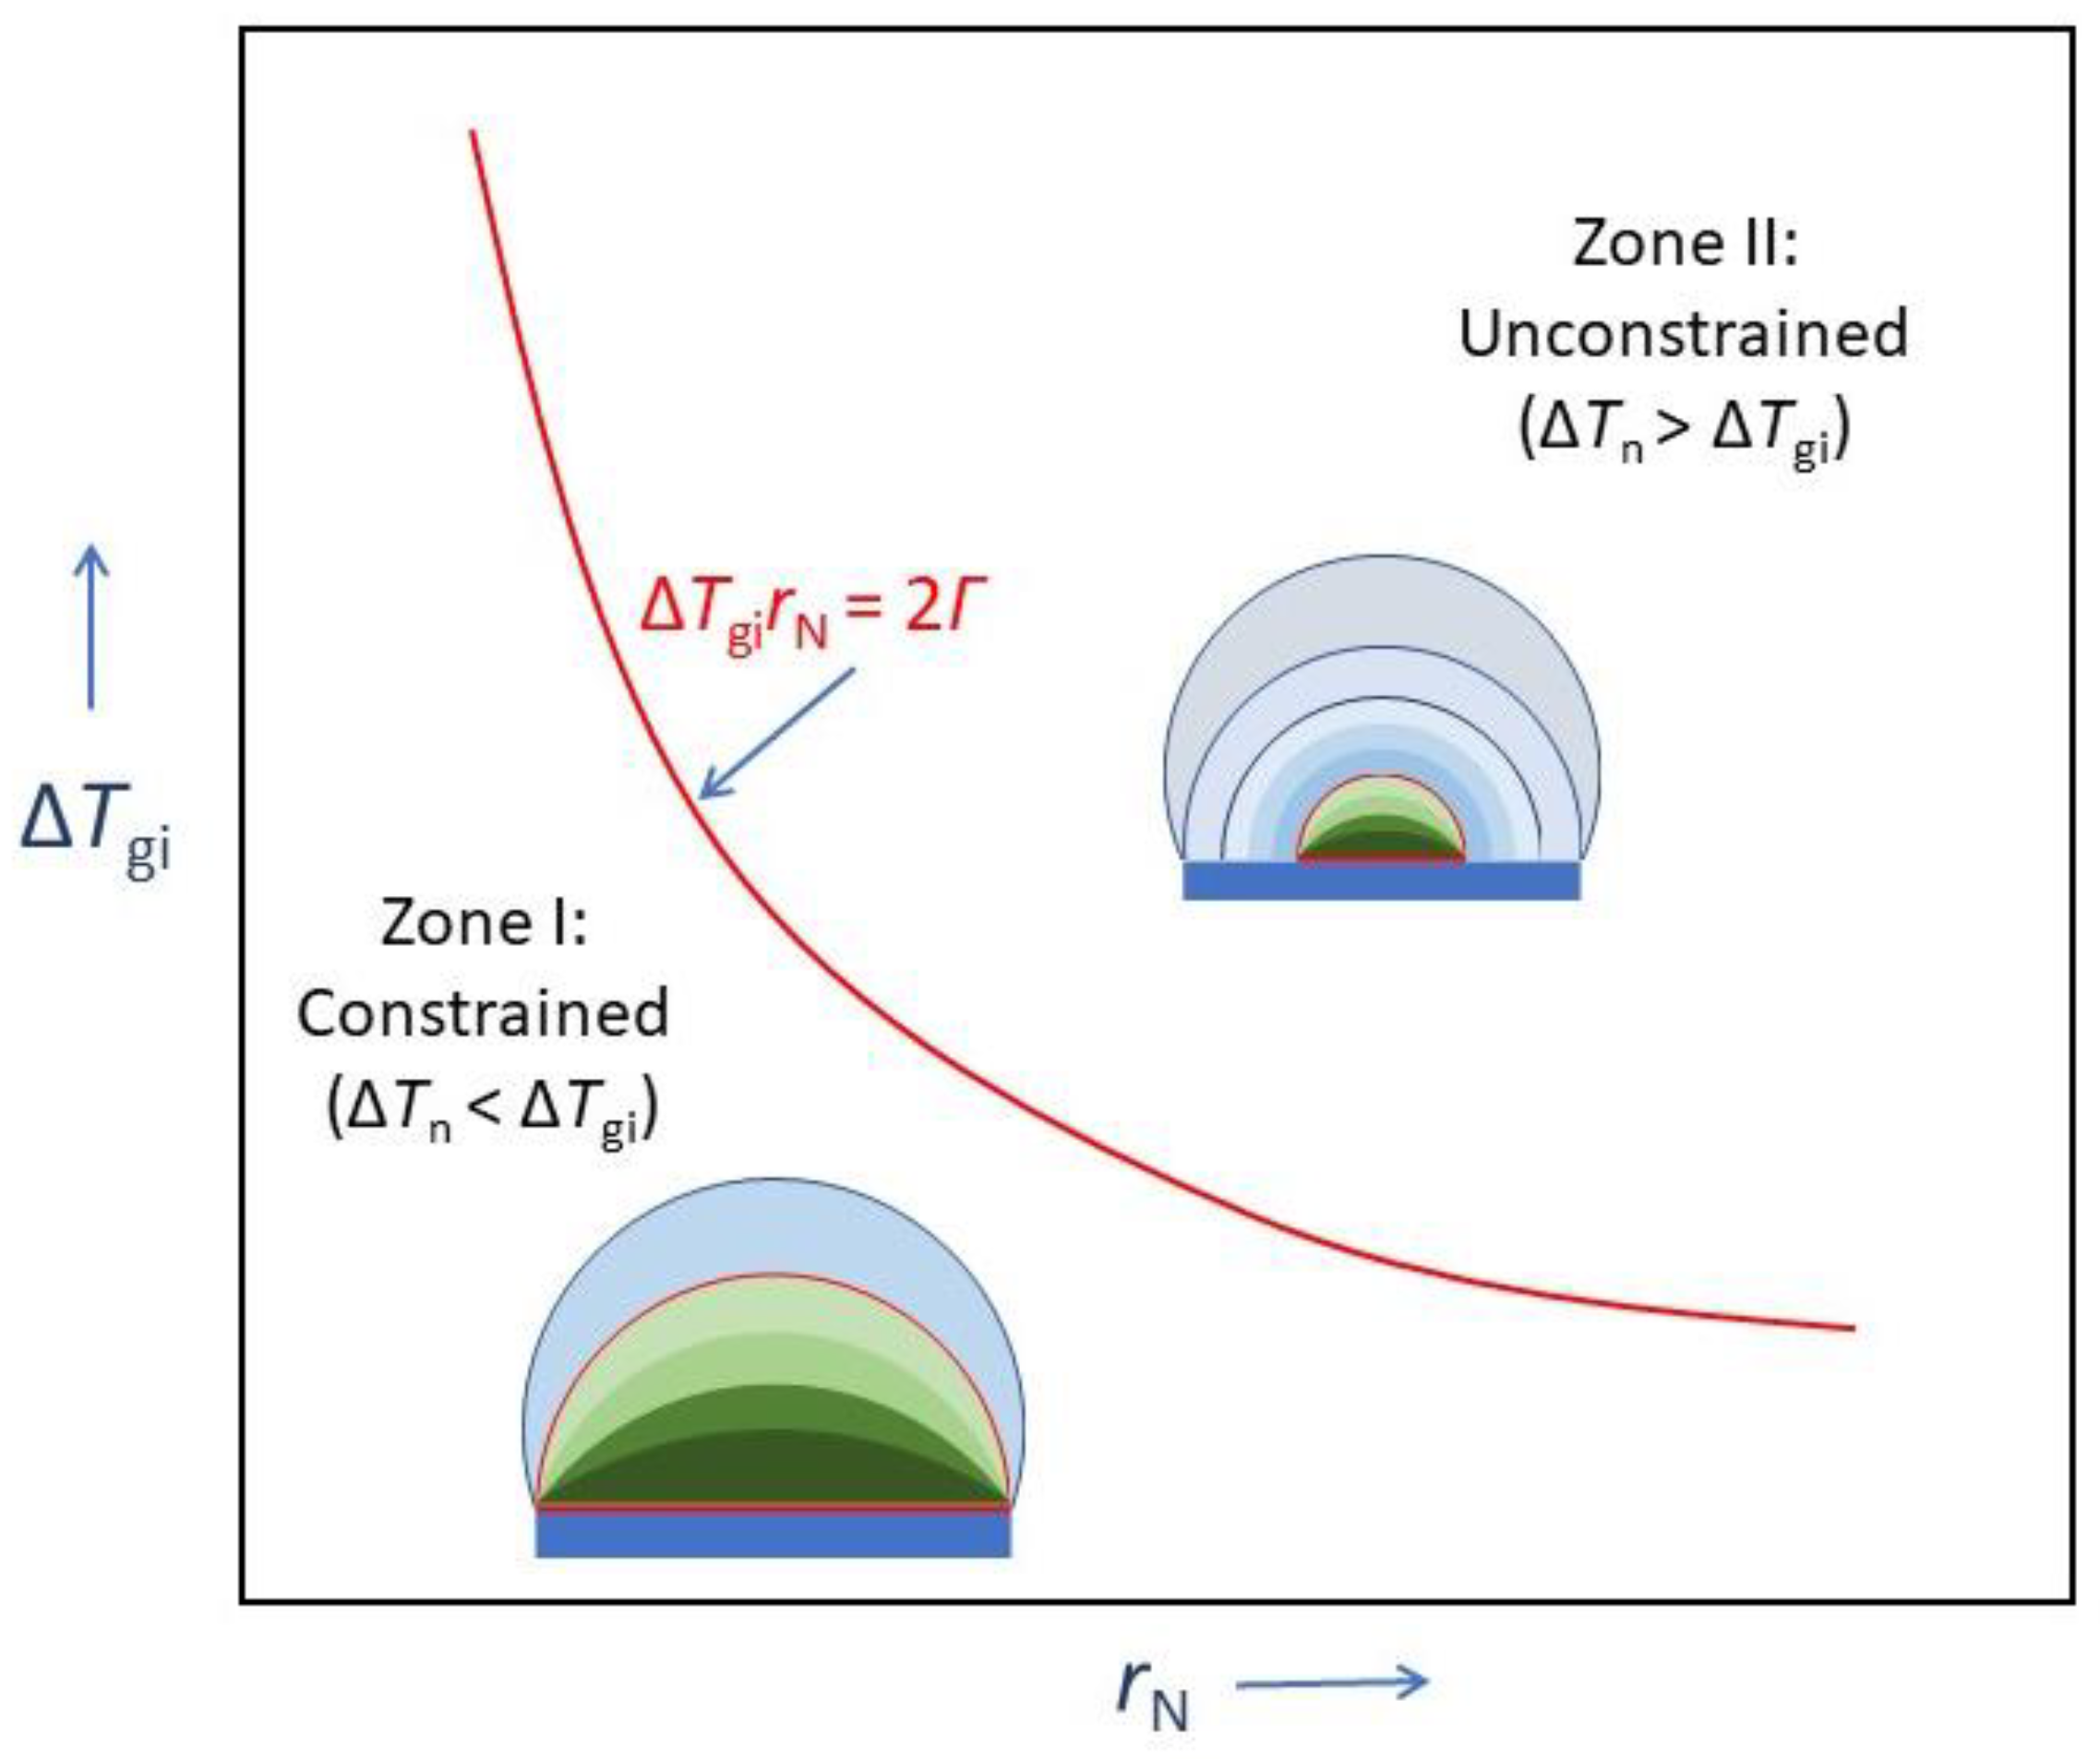
4.3. Grain Initiation Map

Based on our MD simulation results presented previously, it is concluded that grain initiation on a single substrate can be divided into two categories: grain initiation through constrained spherical cap formation and grain initiation through unconstrained spherical cap formation. Such grain initiation behaviour is best presented by a grain initiation map (i.e., a ΔTgirN plot), as schematically illustrated in Figure 16. The free growth criterion, ΔTgirN = 2Γ (the solid red line), divides the ΔTgirN plot into two zones:
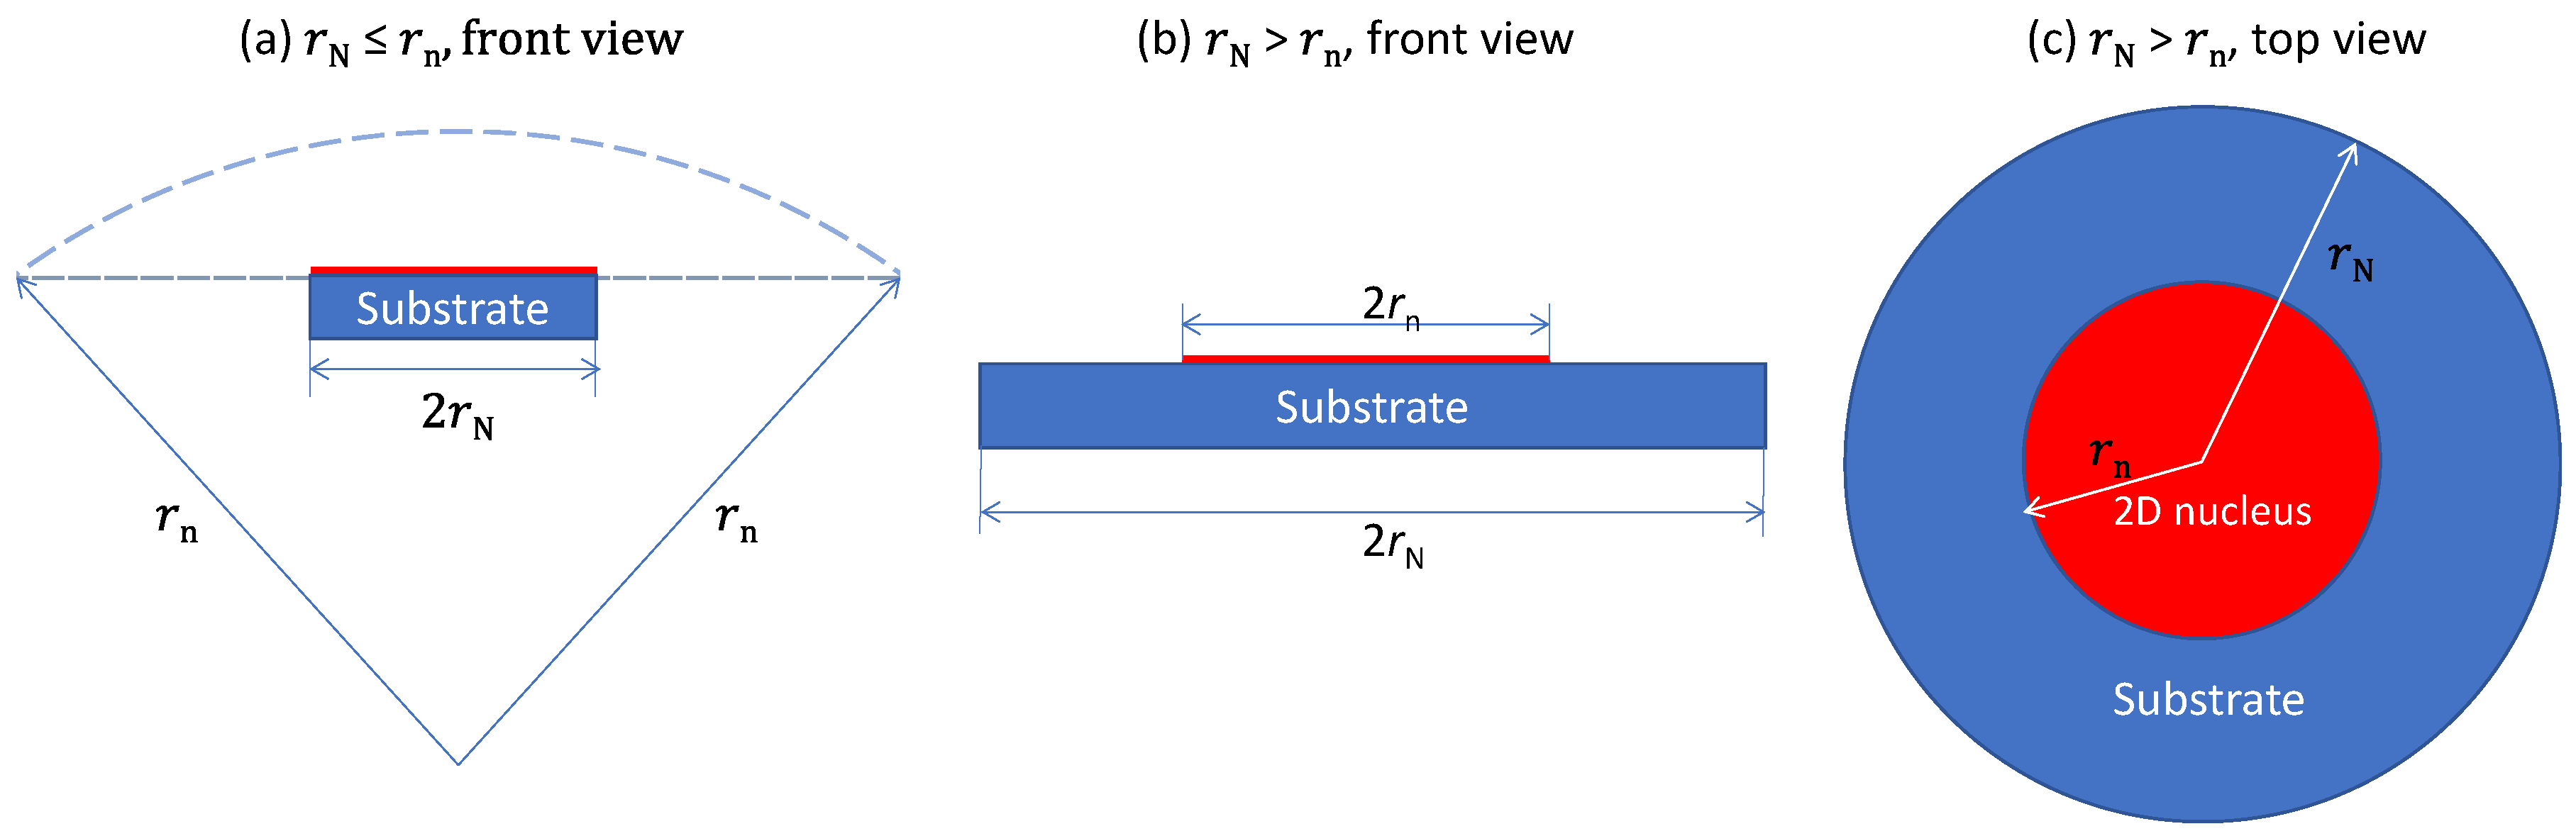
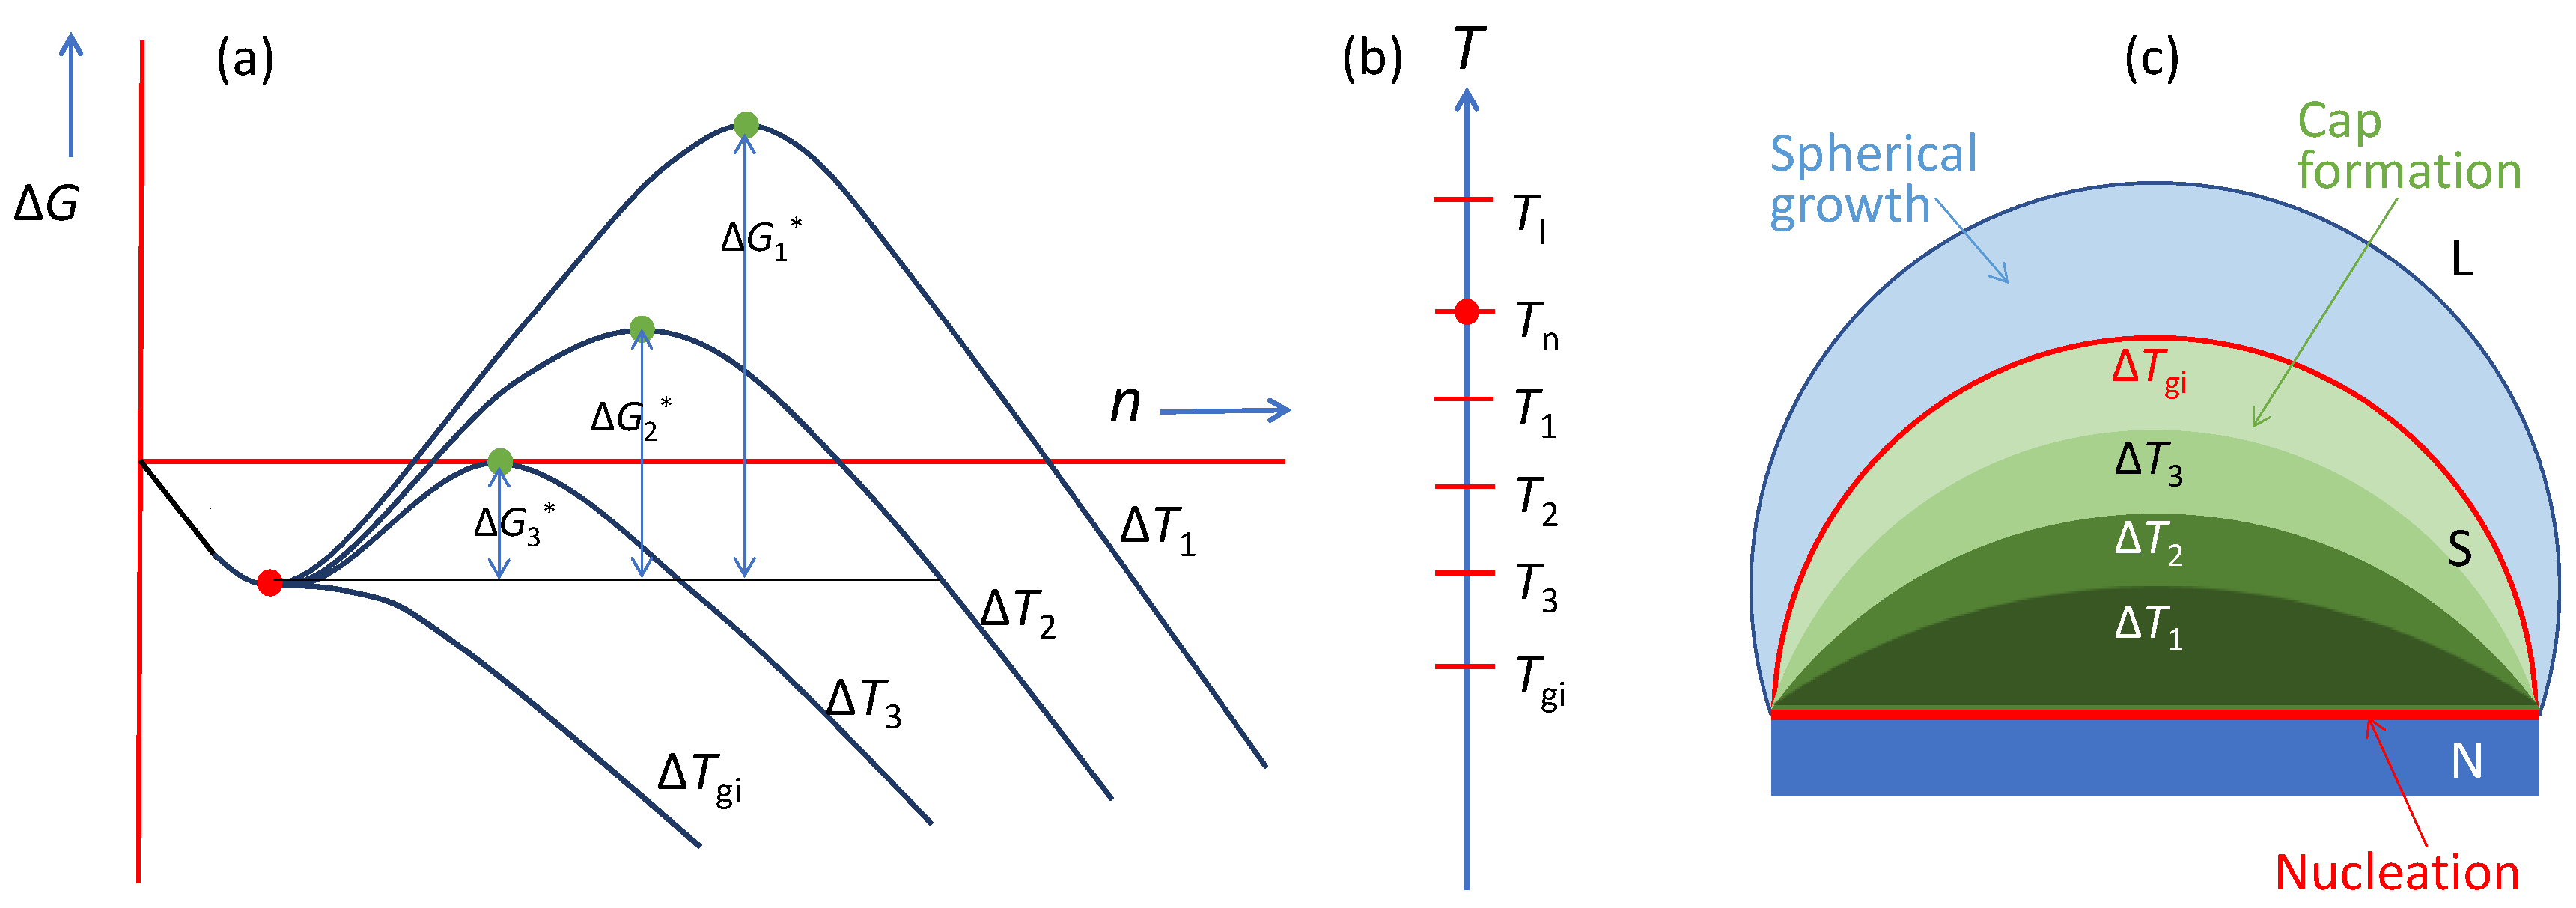
  • Zone I: grain initiation through constrained spherical cap formation. Grain initiation in this zone is characterised by ΔTgirN < 2Γ. Thus, in this zone, we have ΔTn < ΔTgi, or equivalently, rn > rN. The metastable cap formed at a particular temperature is dormant, and further growth can only be made possible by increasing the undercooling to overcome the energy barrier.
  • Zone II: grain initiation through unconstrained spherical cap formation. Grain initiation in this zone is characterised by ΔTgirN > 2Γ. Thus, in this zone, we have ΔTn > ΔTgi, or equivalently rn < rN. Grain initiation in this zone becomes barrierless.

5. Modelling of Heterogeneous Nucleation and Grain Initiation

5.1. Modelling of Heterogeneous Nucleation

The heterogeneous nucleation process described in Section 3 starts with a precursor that is the outcome of prenucleation and presented by the L/N interface (six atomic layers) and finished with three layers of solid (L1, L2 and L3) with L3 being the 2D nucleus and an L/S interface (six atomic layers). This process can be analysed from two different angles: (1) free energy change due to the increased fraction of solid atoms; and (2) free energy change due to the change in interfacial energies.
From the viewpoint of interfacial energy change, at the nucleation temperature, the free energy change of heterogeneous nucleation (ΔGn) can be expressed as:
Δ G n = ( γ SN + γ SL γ LN ) n L A a
where γSN is the interfacial energy of the S/N interface; γSL is the interfacial energy of the L/S interface; γLN is the interfacial energy of the L/N interface; nL is the number of atoms in one atomic layer; and Aa is the projected area of an atom. Thus, nLAa represents the area covered by the 2D nucleus. For simplicity, we assume that at the stage of three-layer nucleation, all three interfaces have the same area of nLAa. This also means that the system under analysis has nine atomic layers (three for the S/N interface and six for the S/L interface) between the substrate and the bulk liquid.
From the viewpoint of increase in solid atom fraction during nucleation, ΔGn can be expressed by the following equation:
Δ G n = 9 n L ( f nf f ns ) ( g S g L )
where fns is the solid atom fraction at the starting point of nucleation; fnf is the solid atom fraction at the finishing point of nucleation; gS is the free energy per solid atom at Tn; and gL is the free energy per liquid atom at Tn. From Equations (11) and (12), we have:
( γ SN + γ SL γ LN ) n L A a = 9 n L ( f nf f ns ) ( g S g L )
In consideration of Aa = πr2a and letting Δγ = γSN + γLSγLN, Δfs = fnffns and Δg = gsgl, one has:
Δ g = π r a 2 Δ γ 9 Δ f s
For pure Al, according to the Pandat Al database [51], Δ g can be approximated as a linear function of ΔT (Figure 17):
Δ g = 1.9 × 10 23 Δ T n   ( J / atom )
Considering the volume of an atom V a = 4 3 r a 3 , and ra = 1.4 Å for Al, the free energy change per volume (ΔGv) is given by the following equation:
Δ G v = Δ g V a = 1.65 × 10 6 Δ T n   ( Jm 3 ) .
Considering the linear relationship in Equation (15) for Al, ΔGv can be generally approximated as [52]:
Δ G v = Δ S v Δ T
where ΔSv is the entropy of fusion per unit volume. Hence, Equation (16) suggests that for pure Al ΔSv = 1.65 × 10⁶ Jm−3 K, which is close to 1.112 × 10⁶ Jm−3 K, which is a value frequently used in the literature [28].
In the general cases, combining Equations (14), (16) and (17), one has:
Δ T n = Δ γ 12 Δ f s Δ S v r a  
It is important to note that both Δγ and Δfs are functions of lattice misfit. Unfortunately, the relevant parameters are not available to test the validity of Equation (18).

5.2. Understanding of Grain Initiation

Although grain initiation has been used interchangeably with heterogeneous nucleation in the literature [29], it is distinctively different from heterogeneous nucleation. As will be discussed in depth later, it is not only theoretically desirable but practically beneficial to treat heterogeneous nucleation and grain initiation as two separate processes.
In the literature, grain initiation is well described by the free growth criterion (Equations (7) and (8)) developed by Greer et al. [28]. Grain initiation on a substrate of rN is only possible when ΔTgirN > 2Γ. It is clear from Equation (8) that grain initiation is about free growing a solid particle and has nothing to do with the substrate except the substrate size (rN). In this sense, the free growth criterion should be written more appropriately as:
Δ T r S = 2 Γ
where r S is the radius of a solid sphere. This means a solid particle with rS can grow isothermally under an undercooling ΔT if ΔTrS > 2Γ. The replacement of rS in Equation (19) by rN in Equation (8) has made it possible for grain size prediction, but Equation (8) is only applicable to the case of constrained spherical cap formation.
Here, we offer some further insights into the difference between heterogeneous nucleation and grain initiation:
  • Δ T gi is a physical property of a substrate of r N when ΔTn < ΔTgi. However, when ΔTn > ΔTgi, Equation (8) is no longer applicable. In this case, the grain initiation criterion becomes ΔTnrn = 2Γ. Grain initiation becomes possible when rN > rn.
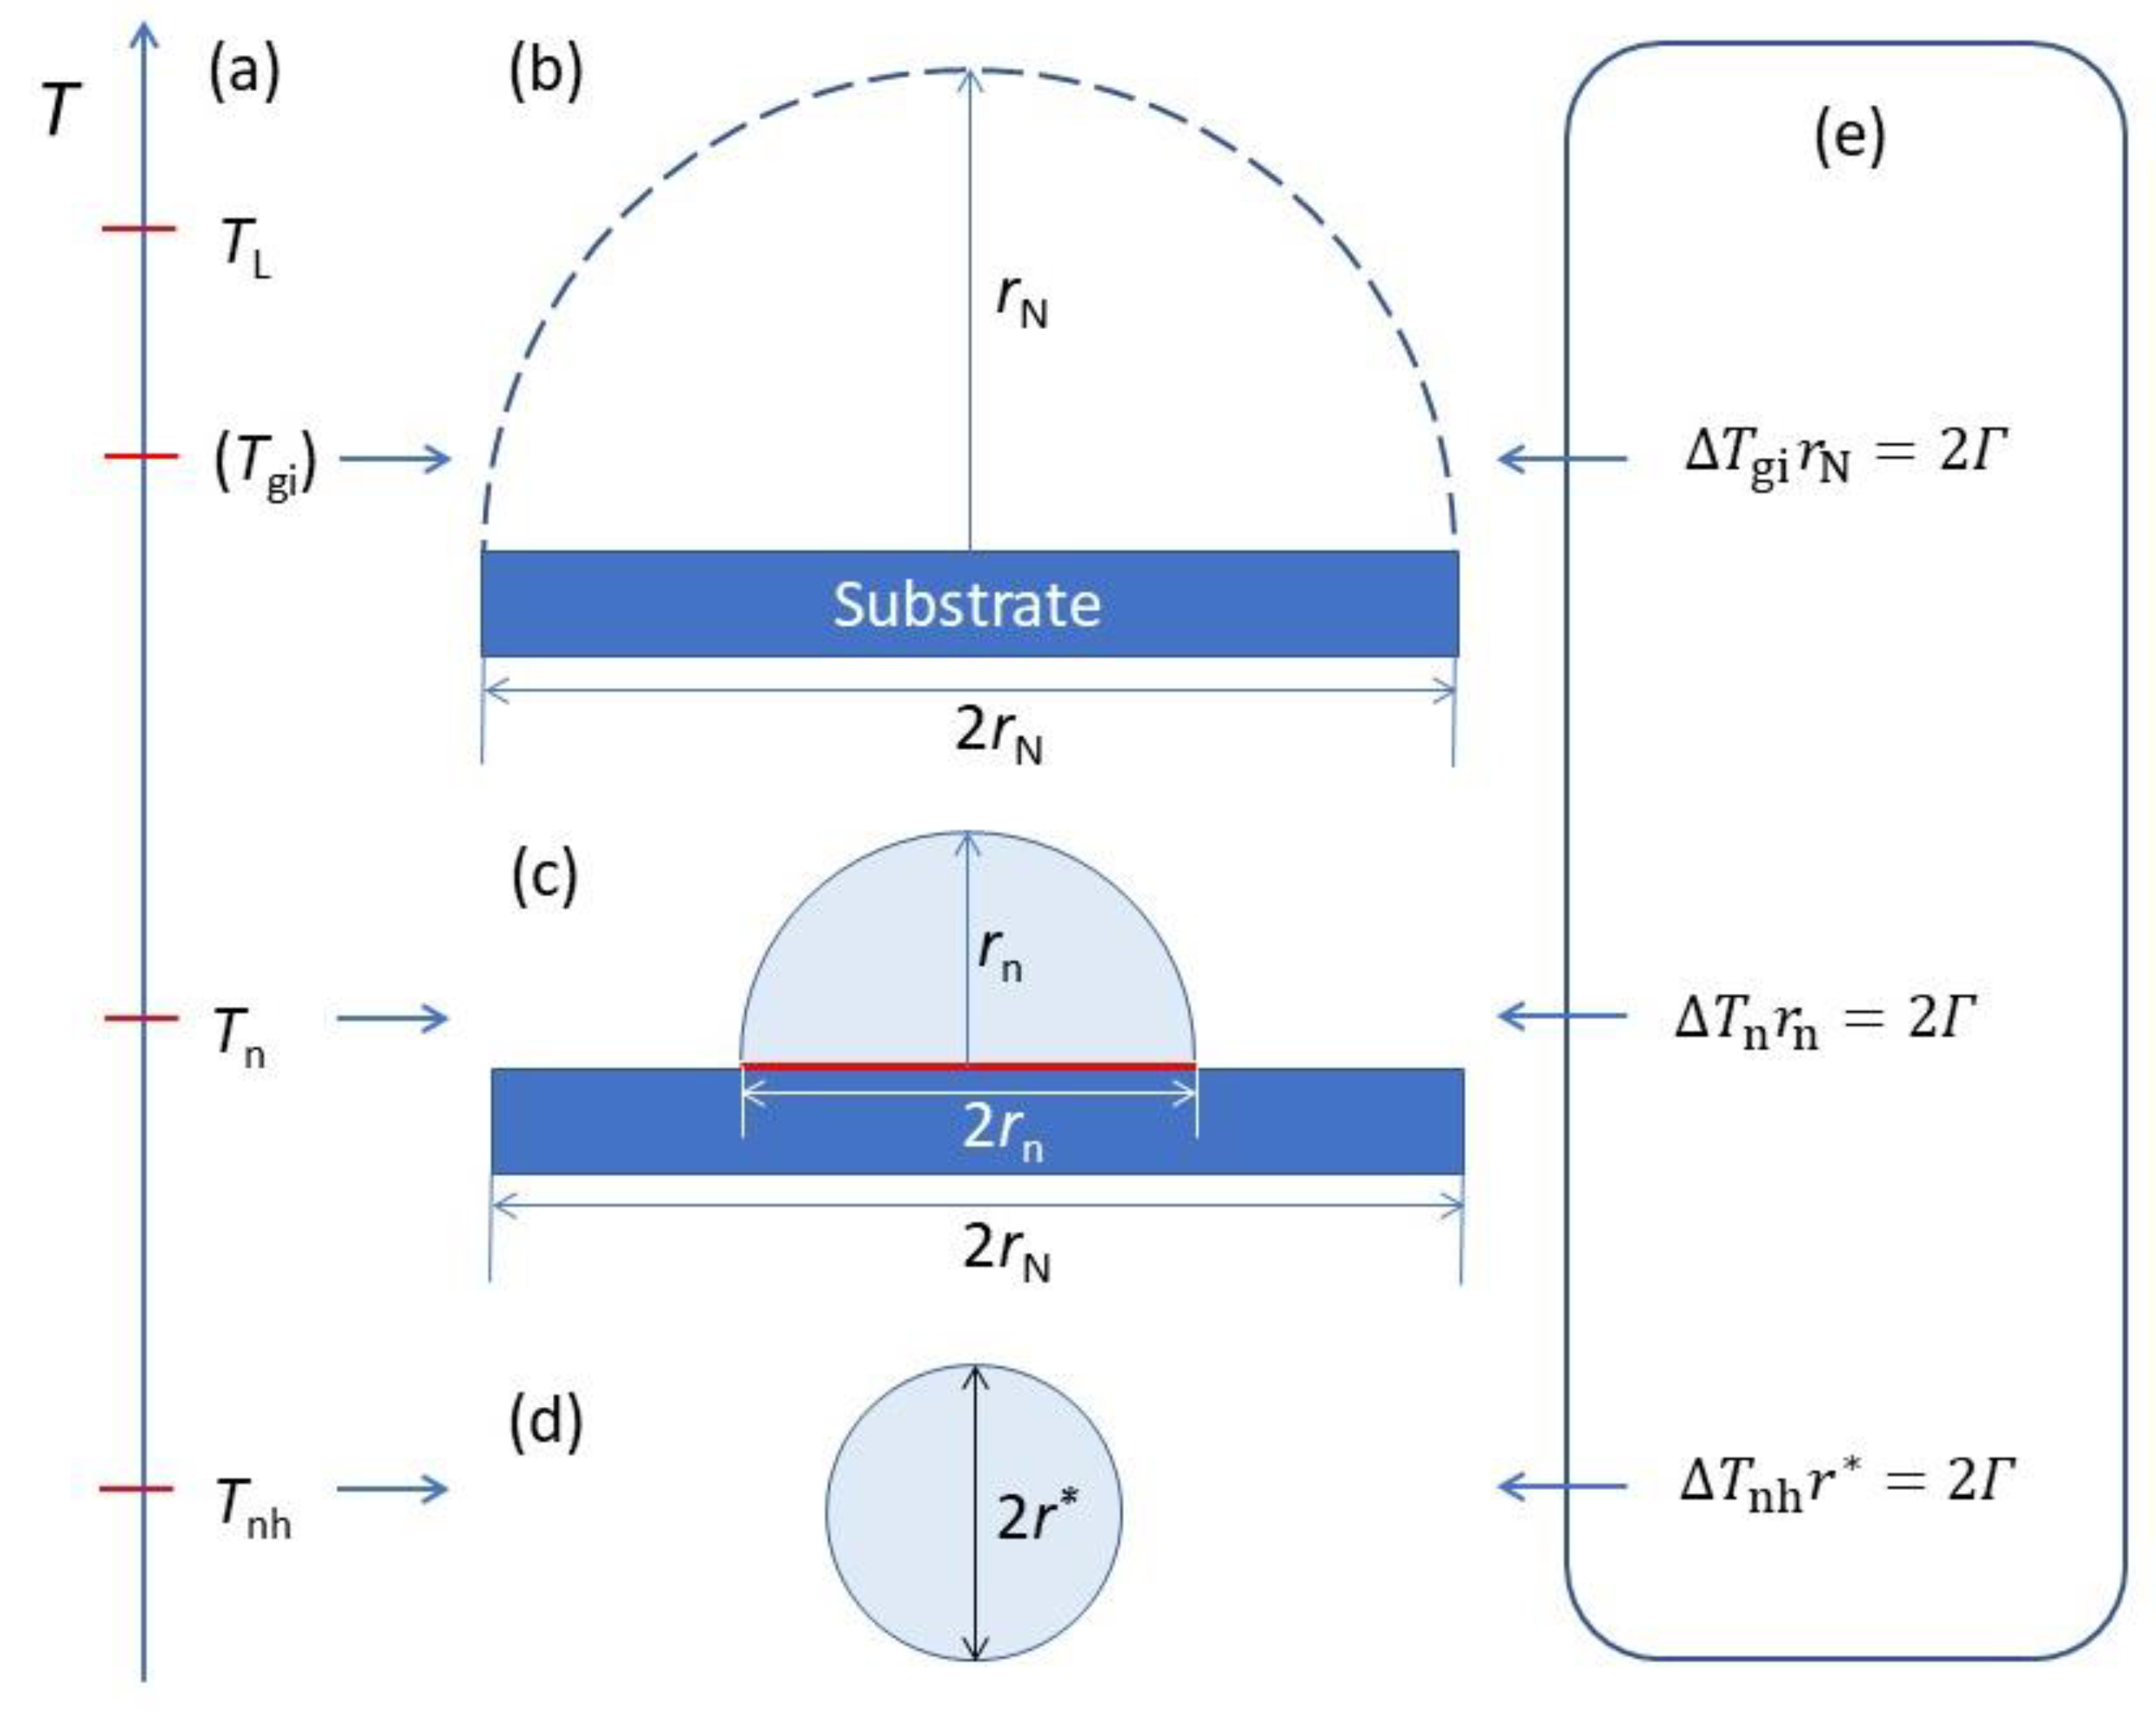
  • ΔTnhr* = 2Γ vs. ΔTnrn = 2Γ vs. ΔTgirN = 2Γ: It is important to realise that ΔTnhr* = 2Γ describes the homogeneous nucleation process (3D), ΔTnrn = 2Γ describes the three-layer nucleation process (2D), while ΔTgirN = 2Γ describes the hemisphere formation (3D) on a substrate of rN, as depictured in Figure 18. The origin of the similarity between these equations is that they all describe balancing the volume free energy change with a change in interfacial energies.
  • Grain initiation is about free growing isothermally a solid particle which is not directly connected to physical properties of the substrate, while heterogeneous nucleation is dictated by the physical properties of the substrate.

6. Summary

Upon realising that heterogeneous nucleation and grain initiation are two distinctively different processes, we have investigated the grain initiation behaviour on a single substrate with MD simulations. Our MD simulation results have revealed a complex grain initiation behaviour. When ΔTn < ΔTgi, spherical cap formation is constrained by the curvature of the L/S interface, a spherical cap is dormant, and further growth requires an increase in undercooling to overcome an energy barrier; grain initiation occurs only when the spherical cap grows beyond the hemisphere. However, when ΔTn > ΔTgi, spherical cap formation becomes an unconstrained process, which can proceed isothermally without an energy barrier. Grain initiation through unconstrained spherical cap formation has three distinctive stages: (1) spherical cap formation to deliver a hemisphere of radius rn on the 2D nucleus; (2) hemispherical growth to laterally spread the solid over the substrate surface to eventually provide a hemisphere with radius of r N ; and (3) spherical growth with a curvature beyond rN.
Our analysis has revealed that homogeneous nucleation (r*), heterogeneous nucleation (rn) and grain initiation (rN) all follow the same form of governing equations (ΔTr = 2Γ). The physical origin for this interesting coincidence is the fact that all these three processes are consequences of balancing the volume free energy and the interfacial free energy but at different levels of undercooling. This offers the potential to bridge the atomistic mechanisms for heterogeneous nucleation and grain initiation with the classical nucleation theory.
In addition, through further analysis and discussions, we can provide the following additional new insights into solidification processes:
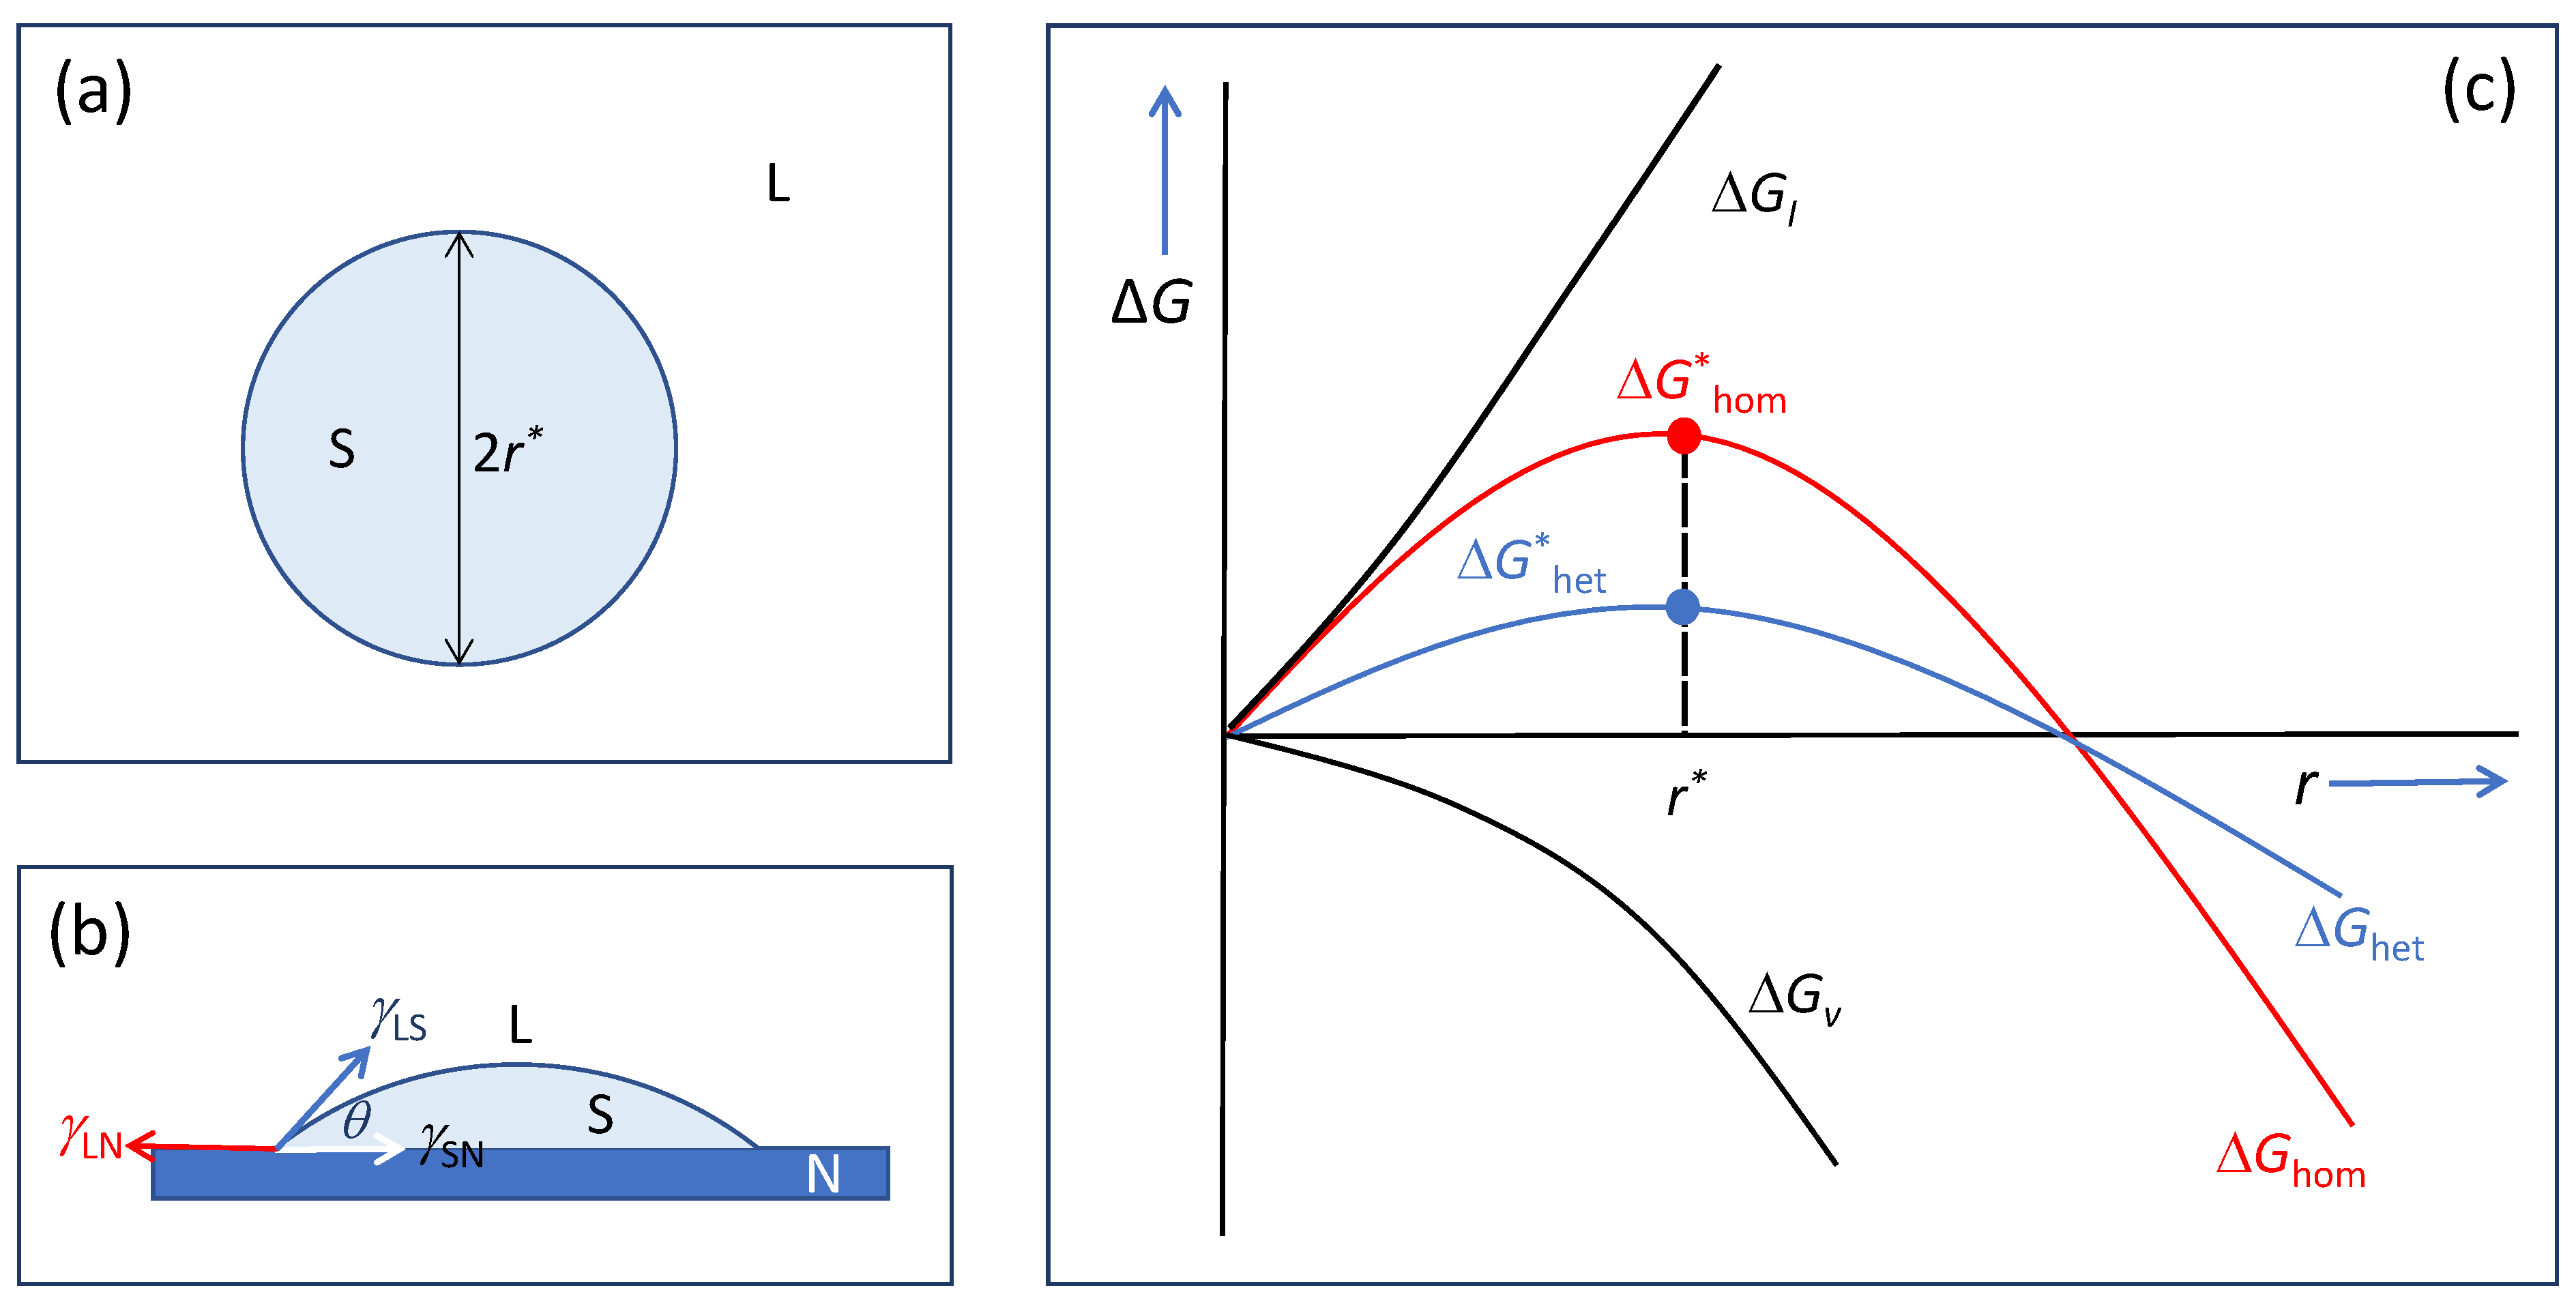
  • A substrate wetted completely by the liquid can always induce some ordered atoms in the liquid adjacent to the liquid/substrate interface and hence can act as a nucleation site regardless of the nucleation undercooling. Under such conditions, we have γLNγSN + γLS, suggesting that Young’s equation (Equation (4)) is inapplicable to any cases for heterogeneous nucleation. Therefore, describing heterogeneous nucleation as a spherical cap formation process may not be a useful approach, since it masks some critical phenomena, such as prenucleation, formation of 2D nucleus, and constrained/unconstrained spherical cap formation.
  • As a theoretical model, homogeneous nucleation theory that describes a stochastic process for the creation of a nucleus is conceptually simple and mathematically rigorous. However, it is challengeable to extend homogeneous nucleation theory to heterogeneous nucleation, which is a deterministic process. At least classical heterogeneous nucleation theory has not been helpful to generate much useful new insight except the reduction in nucleation barrier by the substrate.
  • The basic atomistic mechanism for both heterogeneous nucleation and crystal growth is structural templating, which requires that any solid atom needs to be supported by the solid atoms in the layer underneath it. This fact has made us realise that curvature formation is a consequence of structural templating.

Author Contributions

Z.F. conducted conceptualisation of the research, development of the research approach, funding acquisition, supervision and original draft writing; H.M. conducted MD simulations and visualisation, and Z.F. and H.M. contributed to review and editing of the manuscript. All authors have read and agreed to the published version of the manuscript.

Funding

This work has been funded by the EPSRC of the UKRI under the grant number EP/N007638/1.

Data Availability Statement

All data are available in the main text.

Conflicts of Interest

The authors declare no conflict of interest.

References

  1. Kelton, K.F.; Greer, A.L. Nucleation in Condensed Mater: Applications in Materials and Biology; Elsevier: Oxford, UK, 2010. [Google Scholar]
  2. Kashchiev, D. Nucleation: Theory with Applications; Butterworth-Heinemann: Oxford, UK, 2000. [Google Scholar]
  3. Fan, Z.; Men, H.; Wang, Y.; Que, Z.P. A new atomistic mechanism for heterogeneous nucleation in the systems with negative lattice misfit: Creating a 2D template for crystal growth. Metals 2021, 11, 478. [Google Scholar] [CrossRef]
  4. Gibbs, J.W. On the equilibrium of heterogeneous substances. Am. J. Sci. 1879, 16, 441–458. [Google Scholar] [CrossRef]
  5. Volmer, M.; Weber, A.Z. Nucleus formation in supersaturated systems. Z. Für Phys. Chem. 1926, 119, 277–301. [Google Scholar]
  6. Becker, R.; Döring, W. Kinetic treatment of nucleation in supersaturated vapors. Ann. Phys. 1935, 24, 719–752. [Google Scholar] [CrossRef]
  7. Zeldovich, J.B. On the theory of new phase formation. Cavitation. Acta Physicochim. USSR 1943, 18, 1–22. [Google Scholar]
  8. Cantor, B. Heterogeneous nucleation and adsorption. Philos. Trans. R. Soc. Lond. 2003, 361, 409–417. [Google Scholar] [CrossRef]
  9. Kim, W.T.; Zhang, D.L.; Cantor, B. Nucleation of solidification in liquid droplets. Metall. Trans. A 1991, 22A, 2487–2501. [Google Scholar] [CrossRef]
  10. Kim, W.T.; Cantor, B. Solidification of tin droplets embedded in an aluminium matrix. J. Mater. Sci. 1991, 26, 2868–2878. [Google Scholar] [CrossRef]
  11. Kim, W.T.; Cantor, B. Solidification behaviour of Pb droplets embedded in a Cu matrix. Acta Metall. 1992, 40, 3339–3347. [Google Scholar] [CrossRef]
  12. Kim, W.T.; Cantor, B. Heterogeneous nucleation of Al2Cu in Al-Cu eutectic liquid droplets embedded in an Al matrix. Acta Metall. Mater. 1994, 42, 3045–3053. [Google Scholar] [CrossRef]
  13. Stranski, I.; Kaischew, R. Über den mechanismus des gleichgewichtes kleiner kriställchen I. Z. Phys. Chem. B 1934, 26, 100–113. [Google Scholar] [CrossRef]
  14. Richards, W.T. The persistence and development of crystal nuclei above the melting temperature. J. Am. Chem. Soc. 1932, 54, 479–495. [Google Scholar] [CrossRef]
  15. Coudurier, L.; Eustathopoulos, N.; Desré, P.; Passerone, A. Rugosite atomique et adsorption chimique aux interfaces solide-liquide des systems metalliques binaires. Acta Metall. 1978, 26, 465–475. [Google Scholar] [CrossRef]
  16. Cantor, B. Embedded droplet measurements and an adsorption model of the heterogeneous nucleation of solidification. Mater. Sci. Eng. A 1994, 178, 225–231. [Google Scholar] [CrossRef]
  17. Kim, W.T.; Cantor, B. An adsorption model of the heterogeneous nucleation of solidification. Acta Metall. Mater. 1994, 42, 3115–3127. [Google Scholar] [CrossRef]
  18. Jones, G.P. Solidification Technology in the Foundry and Cast House; The Metals Society: London, UK, 1983; pp. 112–114. [Google Scholar]
  19. Jones, G.P. Solidification Processing 1987; Beech, J., Jones, H., Eds.; The Institute of Metals: London, UK, 1988; pp. 496–499. [Google Scholar]
  20. Fan, Z.; Wang, Y.; Zhang, Y.; Qin, T.; Zhou, X.R.; Thompson, G.E.; Pennycook, T.; Hashimoto, T. Grain refining mechanism in the Al/Al-Ti-B system. Acta Mater. 2015, 84, 292–304. [Google Scholar] [CrossRef]
  21. Wang, Y.; Fang, C.M.; Zhou, L.; Hashimoto, T.; Zhou, X.; Ramasse, Q.M.; Fan, Z. Mechanism for Zr poisoning of Al-Ti-B based grain refiners. Acta Mater. 2019, 164, 428–439. [Google Scholar] [CrossRef]
  22. Wang, Y.; Que, Z.P.; Hashimoto, T.; Zhou, X.R.; Fan, Z. Mechanism for Si poisoning of Al-Ti-B grain refiners in Al alloys. Metall. Mater. Trans. A 2020, 51, 5743–5757. [Google Scholar] [CrossRef]
  23. Wang, S.H.; Wang, F.; Wang, Y.; Ramasse, Q.M.; Fan, Z. Segregation of Ca at the Mg/MgO interface and its effect on grain refinement of Mg alloys. IOP Conf. Ser. Mater. Sci. Eng. 2019, 529, 012048. [Google Scholar] [CrossRef]
  24. Fan, Z.; Wang, S.H.; Niu, Z.C. Modification of γ-Al2O3/Al interface through La interfacial segregation: A strategy to harness native γAl2O3 for grain refinement. Acta Mater 2002. submitted. [Google Scholar]
  25. Men, H.; Fan, Z. Prenucleation induced by crystalline substrates. Metall. Mater. Trans. A 2018, 49, 2766–2777. [Google Scholar] [CrossRef]
  26. Fan, Z.; Men, H. A molecular dynamics study of heterogeneous nucleation in generic liquid/substrate systems with positive lattice misfit. Mater. Res. Express 2020, 7, 126501. [Google Scholar] [CrossRef]
  27. Men, H.; Fan, Z. Heterogeneous nucleation mechanisms in systems with large lattice misfit demonstrated by the Pb(l)/Cu(s) system. Metals 2022. submitted. [Google Scholar]
  28. Greer, A.L.; Bunn, A.M.; Tronche, A.; Evans, P.V.; Bristow, D.J. Modelling of inoculation of metallic melts: Application to grain refinement of aluminium by Al-Ti-B. Acta Mater. 2000, 48, 2823–2835. [Google Scholar] [CrossRef]
  29. Quested, T.E.; Greer, A.L. Athermal heterogeneous nucleation of solidification. Acta Mater. 2005, 53, 2683–2692. [Google Scholar] [CrossRef]
  30. Quested, T.E.; Greer, A.L. The effect of the size distribution of inoculant particles on as-cast grain size in aluminium alloys. Acta Mater. 2004, 52, 3859–3868. [Google Scholar] [CrossRef]
  31. Shu, D.; Sun, B.D.; Mi, J.; Grant, P.S. A quantitative study of solute diffusion field effects on heterogeneous nucleation and the grain size of alloys. Acta Mater. 2011, 59, 2135–2144. [Google Scholar] [CrossRef]
  32. Du, Q.; Li, Y.J. An extension of the Kampmann–Wagner numerical model towards as-cast grain size prediction of multicomponent aluminium alloys. Acta. Mater. 2014, 71, 380–389. [Google Scholar] [CrossRef]
  33. Men, H.; Jiang, B.; Fan, Z. Mechanisms of grain refinement by intensive shearing of AZ91 alloy melt. Acta Mater. 2010, 58, 6526–6534. [Google Scholar] [CrossRef]
  34. Men, H.; Fan, Z. Effects of solute content on grain refinement in an isothermal melt. Acta Mater. 2011, 59, 2704–2712. [Google Scholar] [CrossRef]
  35. Tóth, G.I.; Tegze, G.; Pusztai, T.; Gránásy, L. Heterogeneous crystal nucleation: The effect of lattice mismatch. Phys. Rev. Lett. 2012, 108, 025502. [Google Scholar] [CrossRef]
  36. Fujinaga, T.; Shibuta, Y. Molecular dynamics simulation of athermal heterogeneous nucleation of solidification. Comput. Mater. Sci. 2019, 164, 74–81. [Google Scholar] [CrossRef]
  37. Fan, Z. An epitaxial model for heterogeneous nucleation on potent substrates. Metall. Mater. Trans. A 2013, 44, 1409–1418. [Google Scholar] [CrossRef]
  38. Fan, Z.; Men, H. An overview of recent advances on understanding of atomistic mechanisms of heterogeneous nucleation. Metals 2022. submitted. [Google Scholar]
  39. Fan, Z.; Gao, F.; Jiang, B.; Que, Z.P. Impeding nucleation for more significant grain refinement. Sci. Rep. 2020, 10, 9448. [Google Scholar] [CrossRef] [PubMed]
  40. Fan, Z.; Gao, F. Grain initiation and grain refinement: An overview. Metals 2022. submitted. [Google Scholar]
  41. Fang, C.M.; Men, H.; Fan, Z. Effect of substrate chemistry on prenucleation. Metall. Mater. Trans. A 2018, 49, 6231–6242. [Google Scholar] [CrossRef]
  42. Jiang, B.; Men, H.; Fan, Z. Atomic ordering in the liquid adjacent to an atomic-level rough substrate surface. Comput. Mater. Sci. 2018, 153, 73–81. [Google Scholar] [CrossRef]
  43. Zope, R.R.; Mishin, Y. Interatomic potentials for atomistic simulations of the Ti-Al system. Phys. Rev. B 2003, 68, 024102. [Google Scholar] [CrossRef]
  44. Todorov, I.T.; Smith, W.; Trachenko, K.; Dove, M.T. Interatomic potentials for atomistic simulations of the Ti-Al system. J. Mater. Chem. 2006, 16, 1911–1918. [Google Scholar] [CrossRef]
  45. Jackson, K.A. The interface kinetics of crystal growth processes. Interface Sci. 2002, 10, 159–169. [Google Scholar] [CrossRef]
  46. Steinhardt, P.J.; Nelson, D.R.; Ronchetti, M. Bond-orientational order in liquids and glasses. Phys. Rev. B 1983, 28, 784–805. [Google Scholar] [CrossRef]
  47. Baumgartner, J.; Dey, A.; Bomans, P.H.H.; Coadou, C.L.; Fratzl, P.; Sommerdijk, N.A.J.M.; Faivre, D. Nucleation and growth of magnetite from solution. Nat. Mater. 2013, 12, 310–314. [Google Scholar] [CrossRef]
  48. Turnbull, D. Kinetics of solidification of supercooled liquid mercury droplets. J. Chem. Phys. 1952, 20, 411–424. [Google Scholar] [CrossRef]
  49. Turnbull, D. Theory of catalysis of nucleation by surface patches. Acta Metall. 1953, 1, 8–14. [Google Scholar] [CrossRef]
  50. Kurz, W.; Herlach, D.M. Solidification and Crystallization; Wiley: Hoboken, NJ, USA, 2006. [Google Scholar]
  51. Pandat with Pan Al Database Version 2021. Available online: www.computherm.com (accessed on 6 December 2021).
  52. Boettinger, W.J.; Banerjee, D.K. Solidification. In Physical Metallurgy, 5th ed.; Laughlin, D., Hono, K., Eds.; Elsevier Science & Technology: Amsterdam, The Netherlands, 2014; p. 667. [Google Scholar]
Figure 1. Schematic illustration of the classical nucleation theory (CNT). (a) Formation of the spherical nucleus of the solid (S) with a critical radius of r* from the liquid (L) during homogeneous nucleation; (b) formation of spherical solid cap on a substrate (N) with a wetting angle of θ during heterogeneous nucleation; and (c) free energy change (ΔG) as a function of cluster size (r) showing the formation of nuclei (r*) during homogeneous and heterogeneous nucleation processes by overcoming the energy barriers (ΔG*hom, ΔG*het), which is a consequence of balancing the interfacial energy change (ΔGi) and volume free energy change (ΔGv).
Metals 12 01454 g001
Figure 2. Schematic illustration of early stages of solidification processes on a single substrate. Heterogeneous nucleation through the three-layer nucleation mechanism delivers a 2D nucleus. However, further growth is constrained by the curvature of the liquid/solid interface and can only occur by increasing undercooling. Grain initiation is completed by growing the solid beyond the hemisphere where free growth is possible isothermally.
Metals 12 01454 g002
Figure 3. Schematic illustration of the three-layer nucleation mechanism. At the nucleation temperature, heterogeneous nucleation starts with a precursor created by prenucleation, proceeds layer-by-layer through a structural templating mechanism, and completes within three atomic layers (marked as L1, L2 and L3) to provide a 2D nucleus (a crystal plane of the solid) which can template further growth of the solid.
Metals 12 01454 g003
Figure 4. Schematic illustration of substrate size effect on heterogeneous nucleation behaviour. (a) when rNrn the 2D nucleus covers the entire substrate surface; and (b) when rN > rn the 2D nucleus only covers partially the substrate surface, as shown in (c).
Metals 12 01454 g004
Figure 5. Demonstration of heterogeneous nucleation process in the case of rNrn. Time-averaged atomic positions of a simulation system with 2% lattice misfit showing the evolution of atomic arrangement in the simulation system (front view) and in L3 (the top view) during the heterogeneous nucleation process. Nucleation is completed at t = 1000 ps to provide a 2D nucleus (L3), which is a crystal plane of the solid (marked in purple). For this system, nucleation occurs at ΔTn = 40 K (2rn = 14.1 nm) on a substrate of 2rN = 8.6 nm (ΔTgi = 66 K).
Metals 12 01454 g005
Figure 6. Demonstration of heterogeneous nucleation in the case of rN > rn. Time-averaged atomic positions of a system with −8% lattice misfit showing the evolution of atomic arrangement in L3 (top view) and in the system (front view) during heterogeneous nucleation process. (a) at the prenucleation stage (t < 0 ps), there exists dynamically unstable ordered atomic clusters; and (b,c) nucleation occurs at ΔTn = 136 K, starts at t = 0 ps and finishes at t = 40 ps to provide a 2D nucleus with 2rn = 4.2 nm on a substrate of 2rN = 15.7 nm (ΔTgi = 36 K).
Metals 12 01454 g006
Figure 7. Time-averaged atomic positions in L3 of the simulation systems with (a) 8% lattice misfit; and (b) −8% lattice misfit showing the atomic arrangement in the 2D nuclei relative to that in the substrate. There is no lattice twist in the system with 8% lattice misfit, while there is a 6° twist in the system with −8% lattice misfit. The red lines mark the <110> direction of the 2D nuclei, and the <110> direction of the substrate is parallel to the bottom edge of the images.
Metals 12 01454 g007
Figure 8. The 2D nucleus size (2rn) obtained in different simulation systems plotted as a function of nucleation undercooling (ΔTn) in comparison with 2r* predicted by the classical nucleation theory (Equation (2), the dashed line). The small systems have 5400 atoms; the large systems have about 80,000 atoms; “Am-Hetero” denotes heterogeneous nucleation on a 2D amorphous substrate; and Am-homo” denotes homogeneous nucleation with the presence of a 3D amorphous substrate.
Metals 12 01454 g008
Figure 9. Schematic illustration of curvature formation (the red dashed line) as a consequence of structural templating during the formation of a spherical solid cap (S) on a substrate (N) from the liquid (L). Structural templating requires a solid atom to be supported only by solid atoms in the next solid layer underneath it. This means that during both nucleation and growth, a new solid layer always contains a smaller numbers of atoms than its previous layer.
Metals 12 01454 g009
Figure 10. Time-averaged atomic positions of a simulation system with 2% lattice misfit showing the constrained cap formation process. After nucleation at ΔTn = 40 K, further growth of the solid can only be made possible by increasing the undercooling. For this system, nucleation occurs at ΔTn = 40 K (2rn = 14.2 nm) on a substrate of 2rN = 8.6 nm (ΔTgi = 66 K), and the system was then subject to growth under increased undercooling that is marked by the data on each image.
Metals 12 01454 g010
Figure 11. Schematic illustration of the constrained cap formation process. (a) Free energy change (ΔG) as a function of the number of solid atoms (n) at different undercoolings (ΔT); (b) relative position of different temperatures (T); and (c) the constrained cap formation process with decreasing temperature. The red dot marks the nucleation finishing point, and the green dots mark the maximum ΔG which defines the energy barrier for free growth at each undercooling.
Metals 12 01454 g011
Figure 12. Time-averaged atomic positions of a simulation system with 2% lattice misfit demonstrating the unconstrained cap formation process after nucleation at a higher temperature. Nucleation occurred at ΔTn = 40 K on a substrate of 2rN = 8.6 nm to provide the 2D nucleus that covers the entire substrate surface (see Figure 5). The system was then allowed to solidify at ΔT = 90 K (corresponding to 2rn = 6.3 nm, as marked by the purple dashed lines in the front views). With increasing time, the 2D nucleus grows into spherical caps with increasing cap height. The top views of L5 are used to demonstrate that the cap grows in height without lateral spreading, as shown by the stable size of the crystalline regions indicated by the red circles.
Metals 12 01454 g012
Figure 13. Time-averaged atomic positions of a simulation system with 8% lattice misfit demonstrating the unconstrained cap formation process at a constant temperature. Nucleation occurred at ΔTn = 131 K on a substrate of 2rN = 8.9 nm to provide the 2D nucleus of 2rn = 4.3 nm (the purple dashed circle at t = 40 ps). With increasing time, the 2D nucleus grows isothermally initially into a spherical cap (t = 50 ps) and then hemispheres with increasing radius (t > 60 ps).
Metals 12 01454 g013
Figure 14. Time-averaged atomic positions of a simulation system with −8% lattice misfit demonstrating the unconstrained cap formation process at a constant temperature. Nucleation occurred at ΔTn = 136 K on a substrate of 2rN = 15.7 nm (ΔTgi = 36.2 K) to provide the 2D nucleus of 2rn = 4.2 nm (the purple dashed circle at t = 40 ps; see Figure 6). With increasing time, the 2D nucleus grows isothermally initially into a spherical cap (40 ps < t < 50 ps) and then hemispheres with increasing radius (t > 50 ps). (a) Cap formation L3 (top view); (b) Cap formation (front view).
Metals 12 01454 g014
Figure 15. Schematic illustration of the unconstrained cap formation process. (a) Free energy change (ΔG) as a function of number of solid atoms (n) at different undercoolings (ΔT); (b) relative position of different temperatures (T); and (c) the unconstrained cap formation process under isothermal condition. The red dot marks the nucleation finishing point. When ΔTn > ΔTgi, there is no energy barrier for grain initiation.
Metals 12 01454 g015
Figure 16. Schematic illustration of grain initiation behaviour on a single substrate. The free growth criterion, ΔTgirN = 2Γ (the solid red line), divides the ΔTgirN plot into two regions: (I) where ΔTgirN < 2Γ, grain initiation has an energy barrier and occurs through constrained cap formation; and (II) where ΔTgirN > 2Γ, grain initiation has no energy barrier and occurs through unconstrained cap formation.
Metals 12 01454 g016
Figure 17. Free energy of pure Al as a function of temperature. (a) Free energy per Al atom (g) as a function of temperature (T); (b) free energy change (from liquid to solid) per Al atom (Δg) as a function of undercooling (ΔT). Source data: Pandat Al-DAT [51]. Although the free energy of both liquid and solid Al is a non-linear function of temperature (a), the free energy change for solidification is a linear function of undercooling (b).
Metals 12 01454 g017
Figure 18. Schematic illustration of the relationships between grain initiation, heterogeneous nucleation and homogeneous nucleation. (a) Relative positions of the relevant temperatures; (b) constrained grain initiation; (c) heterogeneous nucleation and unconstrained grain initiation; (d) homogeneous nucleation; and (e) the corresponding governing equations. The dark blue rectangles represent substrates; the red rectangle is the 2D nucleus; and the light blue circles denote the solid.
Metals 12 01454 g018
Publisher’s Note: MDPI stays neutral with regard to jurisdictional claims in published maps and institutional affiliations.

