Article

Effect of Corrugated Sheet Diameter on Structural Behavior under Cryogenic Temperature and Hydrodynamic Load

1
Department of Naval Architecture and Ocean Engineering, Pusan National University, Busan 46241, Korea
2
Hydrogen Ship Technology Center, Pusan National University, Busan 46241, Korea
*
Authors to whom correspondence should be addressed.
Metals 2022, 12(3), 521; https://doi.org/10.3390/met12030521
Submission received: 1 January 2022 / Revised: 10 March 2022 / Accepted: 14 March 2022 / Published: 18 March 2022
(This article belongs to the Special Issue Low-Temperature Behavior of Metals)

Abstract

:
The most important technical issue in the shipbuilding industry regarding liquefied natural gas (LNG) carrier cargo containment systems (CCS) is securing the structural reliability of the primary barrier, which is in direct contact with the LNG. Fracture of the primary barrier by the hydrodynamic load of the LNG CCS may lead to disasters because it is difficult to implement immediate safety measures in the marine environment, unlike on land. Hence, structural reliability of the LNG membrane is the most critical issue in LNG carrier CCSs, where thin and corrugated 304L stainless steel is often used as the primary barrier to prevent repeated thermal deformation from the temperature difference during loading (−163 °C) and unloading (20 °C) of the LNG. However, plastic deformation of the 1.2 mm-thick corrugated membrane of the LNG CCS has been reported continuously owing to its vulnerability to cryogenic hydrodynamic loads. In the present study, we conducted a parametric analysis to investigate the effects of the corrugation shape as a preliminary study of the primary barrier. Finite element analysis was conducted with a simplified plate to focus on the effects of corrugation. Furthermore, a two-step validation was conducted using the above experimental results to ensure reliability of the structural analysis. The results show that optimizing the corrugation shape could ensure better structural safety than the conventional design.

1. Introduction

Natural gas combustion emits relatively few pollutants, such as sulfur and nitrogen oxides, and hence is widely preferred in many industries to ensure compliance with environmental regulations [1,2,3]. The steady increase in demand for natural gas has generated considerable interest in liquefied natural gas (LNG) carriers for bulk transport [4]. Natural gas is transported in a liquid state using LNG carriers for improved storage efficiency under a special cargo containment system (CCS). The LNG CCS is exposed to extremely low temperature (−163 °C) owing to the liquefaction point of natural gas [5]. Therefore, it is constructed using two barriers to improve its structural reliability and insulation performance at cryogenic temperature. As shown in Figure 1a, the primary barrier is in direct contact with LNG. It comprises a corrugated sheet to control the thermal deformation owing to temperature variation during the loading (−163 °C) and unloading (20 °C) procedures [6]. The corrugated form of the primary barrier reduces the in-plane stiffness, thus relieving the thermal stress induced by the temperature gradient [7]. However, the low in-plane stiffness makes the primary barrier vulnerable under hydrodynamic pressures, such as that caused by sloshing, which is one of the major load components [8]. If the hydrodynamic load were to exceed the strength of the primary barrier, the failure of the LNG CCS could threaten human life and the environment. Therefore, several studies have been performed to analyze the structural behavior of the primary barrier under external load conditions.
Lee et al. evaluated the deformation of the primary barrier knot area and determined the direction of maximum deformation under uniform-pressure conditions [10]. Similarly, Jeong et al. conducted a uniform pressure test with a custom-built facility and numerically analyzed the deformation characteristics of the corrugated sheet via finite element analysis (FEA) [10]. Kim et al. investigated the plastic structural behavior of the primary barrier under repeated impact conditions at a large-scale weight drop facility [11]. Brossel et al. conducted a full-scale wave test on a corrugated membrane used in an LNG CCS and analyzed the structural characteristics of the primary barrier [12]. Likewise, Wang et al. performed FEA with a corrugated sheet under sloshing conditions and confirmed the structural integrity of the LNG CCS [13]. Kwon et al. used FEA to evaluate the fatigue life of the primary barrier and calculated the location of the maximum principal stress [14]. Although many studies have focused on the primary barrier, the effect of the corrugation radius has rarely been analyzed.
In previous studies, significant deformation was observed under hydrodynamic pressure in the corrugation area rather than the knot area [9,12,13]. However, it is necessary to minimize deformation in the corrugated area because severe plastic deformation decreases its structural strength. There are many ways of minimizing deformation, such as by controlling the corrugation radius [15]. Therefore, this study was conducted to investigate the effect of corrugation on structural behavior as a preliminary study of the primary barrier by parametric analysis. In addition, a simplified model was used to analyze one factor in more detail; otherwise, there would be too many geometric variables to evaluate simultaneously. As shown in Figure 1b, a plate with only one corrugation was used, with only the two most important variables being included: the radius of corrugation, which is related to the plastic deformation, and the central angle of the fillet, which is related to the stress concentration [9].
Furthermore, we used a numerical analysis to evaluate these effects under cryogenic conditions, which are unfavorable to experimentation. Notably, most previous experiments were conducted at room temperature. Moreover, the FEA was conducted for the corrugated sheet only, thus excluding other LNG CCS composite materials such as plywood. The boundary conditions of the LNG CCS primary barrier were applied to improve the structural behavior under LNG vessel operating conditions. Likewise, the load conditions were set by considering LNG CCS operating conditions. As shown in Figure 1c, LNG waves are generated by the ship’s motion against the flat plate of the primary barrier in the LNG CCS. A jet stream created by the collision of the breaking wave applies two types of load to the primary barrier [16]. The first is symmetric hydrodynamic pressure, which is applied over many areas, such as the bottom of the LNG CCS. The other is asymmetric hydrodynamic pressure, which induces more severe deformation [17]. Accordingly, the numerical analysis considered two types of hydrodynamic loads at −163 °C to evaluate the pressure resistance of the corrugation in the impact direction. Furthermore, we considered thermal contraction owing to the temperature differences during loading and unloading in the FEA. The reliability of the analysis was established via two-step validation with experimentation. The simulations revealed the effect of corrugation on the structural behavior of the corrugated sheet under hydrodynamic load at cryogenic temperature.

2. Finite Element Analysis

2.1. Scenario and Material Properties

In the present study, three types of FEAs were conducted with a simplified primary barrier (SPB) and considering realistic LNG CCS operation conditions: symmetric hydrodynamic pressure, asymmetric hydrodynamic pressure, and thermal contraction. Furthermore, FEA was performed using ABAQUS software [18]. Figure 2a,b show the details of the corrugated shape with regard to the radius and the fillet angle. The length and width of the SPB model are both 340 mm, which is the same as the conventional primary barrier pitch in LNG CCSs [19]. In addition, the flat plate of SPB is at a tangent to the fillet, and the fillet and corrugation are in contact tangentially in Figure 2b. As the length and width of the SPB were fixed, two parameters were herein considered: the corrugation radius © and central angle of the fillet (θ). Table 1 presents the FEA scenario of the SPB model according to corrugation radius and fillet angle. To account for the conventional shape of the corrugated membrane, we set one model (R is 0.1 L and θ 82.4°). After that, we changed the corrugation radius by 0.01 L to observe the effect of R on the structural behavior. In addition, the central angle was adjusted by 0.04°, which induced a change of 8% in the fillet radius. To reduce the computation time for the numerical analysis, two different FEA models were adopted. As shown in Figure 2c,d, the half-length SPB model was used to perform the asymmetric hydrodynamic pressure, whereas a quarter SPB model was used to perform the symmetric hydrodynamic pressure and thermal shrinkage analysis [20].
The SPB was made of AISI 304L austenitic stainless steel, which is widely used as the primary barrier in LNG CCSs owing to its high strength and ductility at a low temperature [21,22]. Figure 3a shows the stress–strain relationship of AISI 304L considering quasi-static loading conditions and cryogenic test temperature [23]. From it, we adopted an elastic modulus of 203 888 MPa and a yield stress of 421 MPa, which was determined with a 0.2% offset for the FEA [24]. A true stress–true strain curve for the FEA was obtained from the plastic region. Figure 3b shows the measured thermal expansion coefficient of AISI 304L between room and cryogenic temperatures. Herein, the thermal expansion coefficient of AISI 304L was determined using a thermomechanical analyzer in accordance with ASTM E831. The thermal expansion coefficients at room temperature (20 °C) and cryogenic temperature (−163 °C) are 15.2 and 12.3 K−1, respectively.

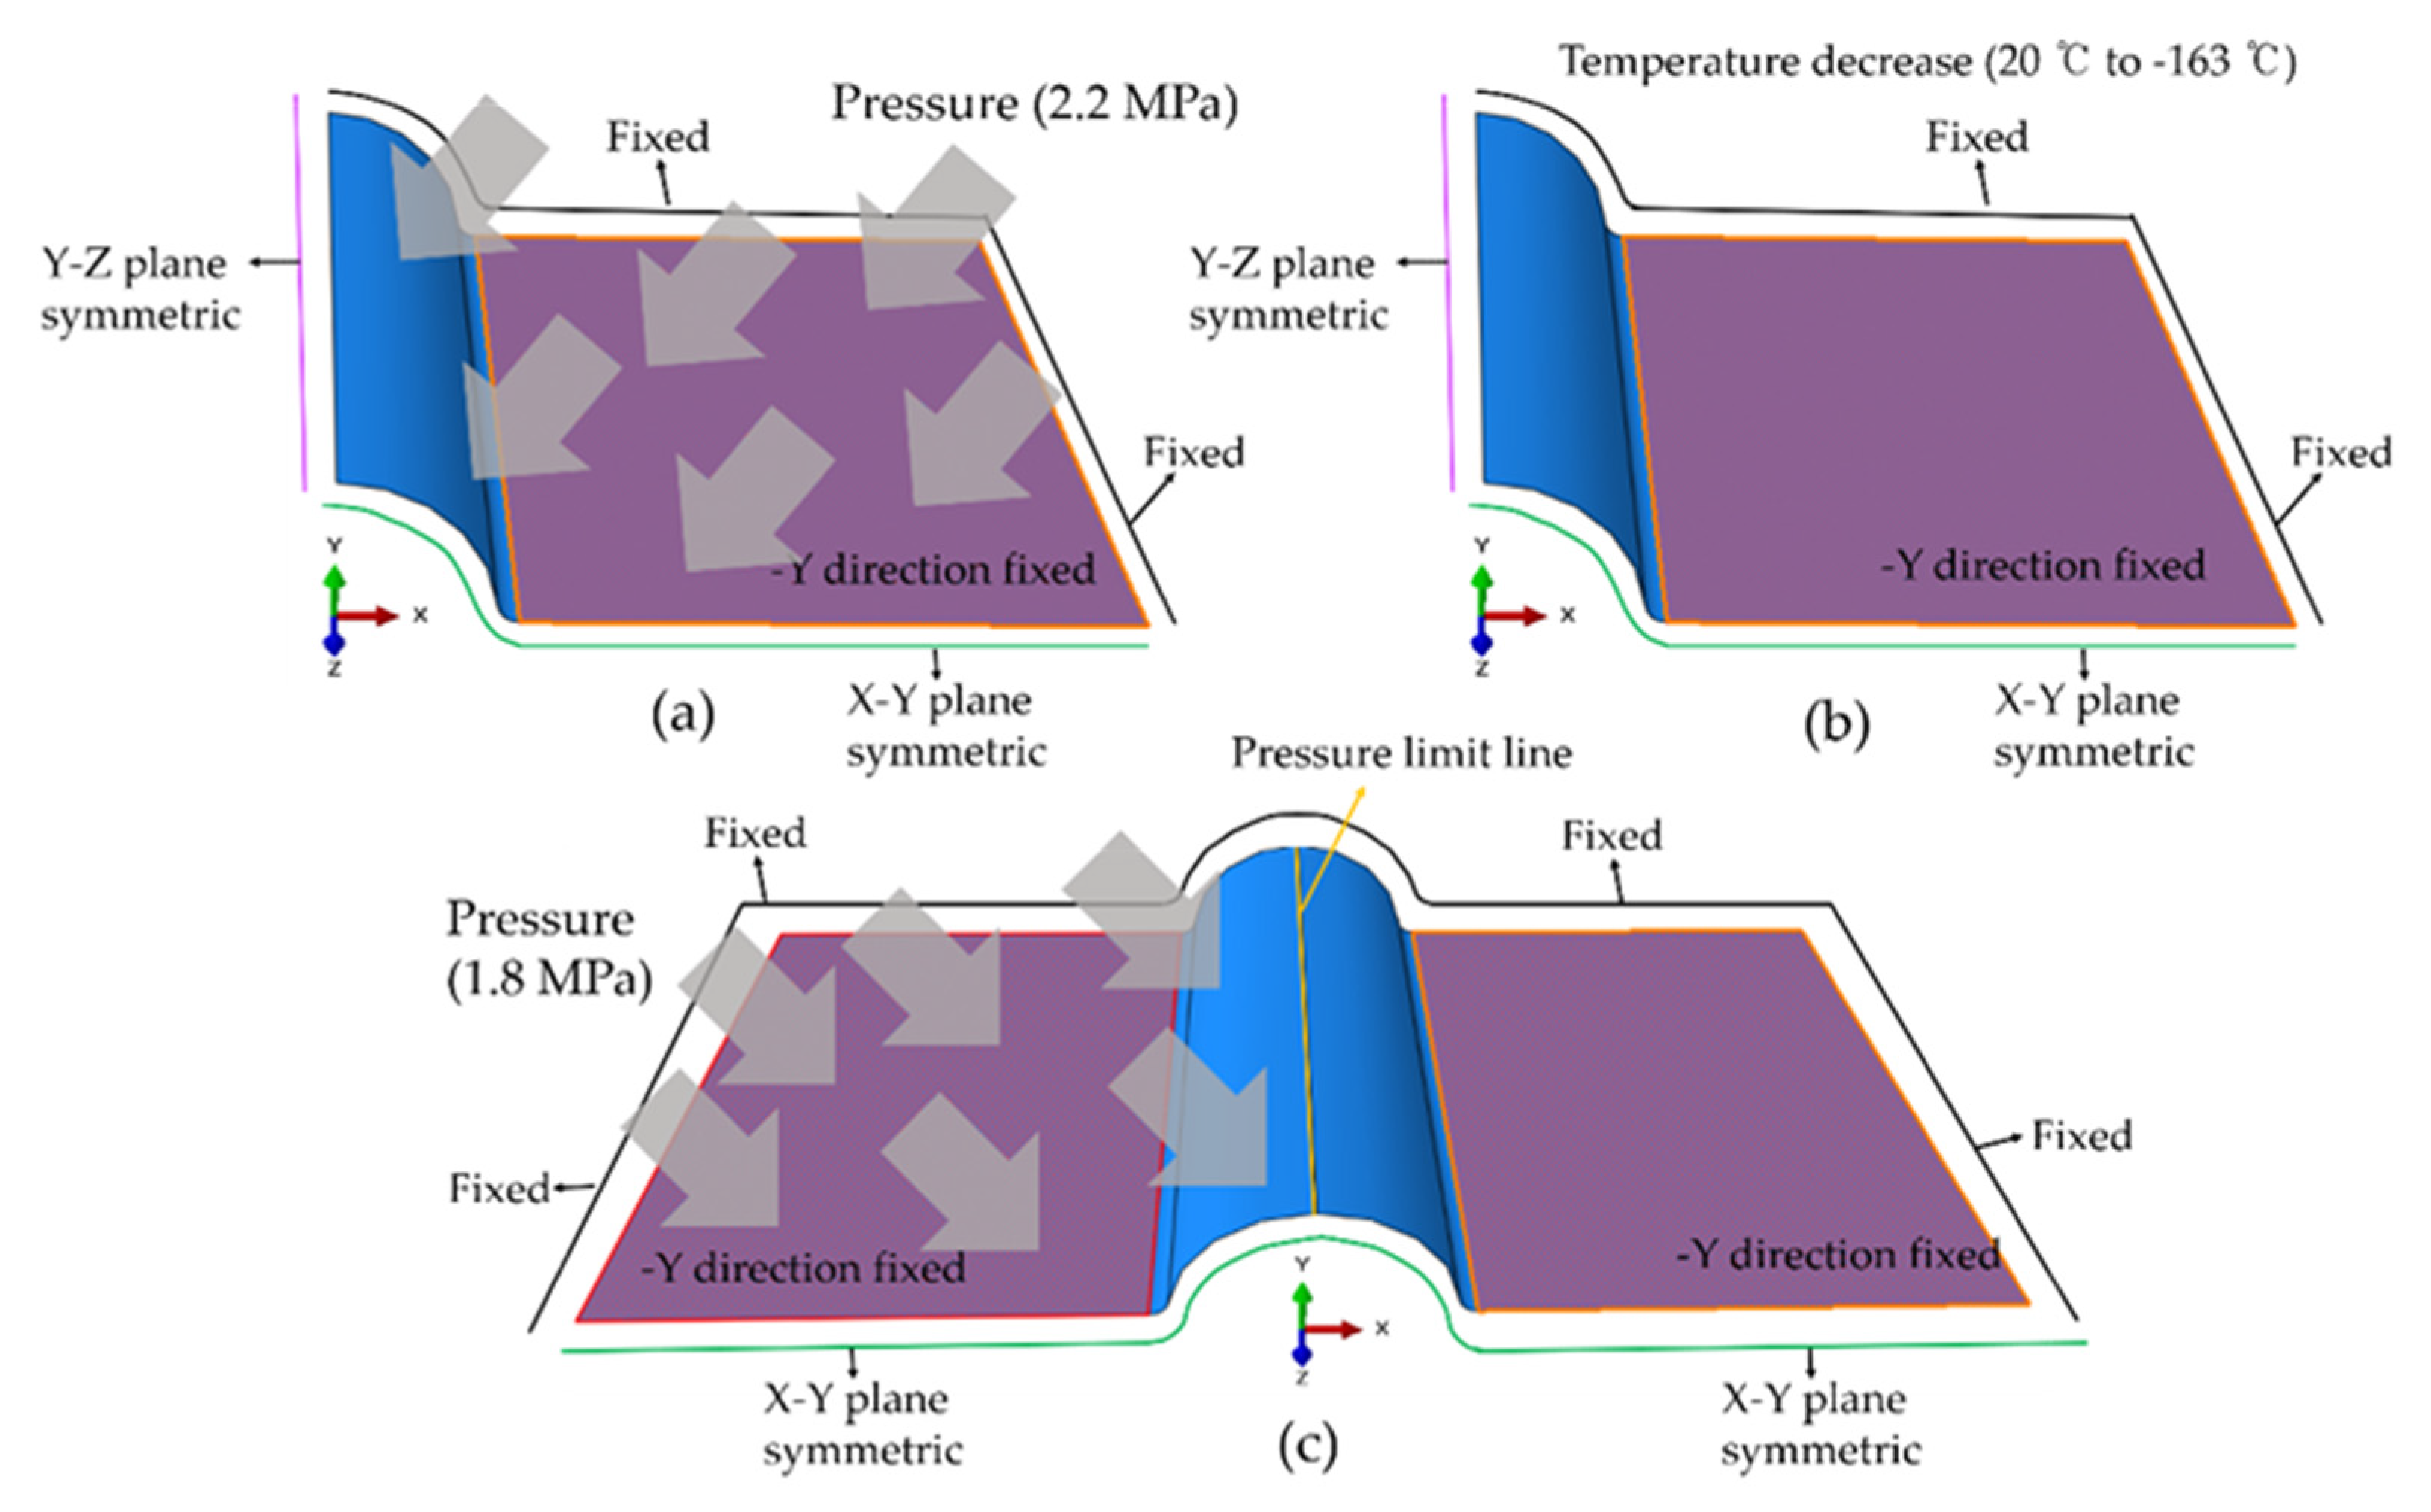
2.2. Loading and Boundary Conditions

Figure 4 shows the loading and boundary conditions of each scenario. For the shell element, the 1.2 mm thickness of the SPB was adopted, which is extremely small compared to the length and width of 340 mm [25]. The element type adopted depended on the target structure type. The symmetric and asymmetric hydrodynamic pressure analysis adopted the 4-node shell element (S4R), and the thermal shrinkage analysis adopted a 4-node shell element with coupled temperature–displacement (S4RT). The symmetric hydrodynamic pressure was set to 2.2 MPa because plastic deformation occurs at 2.2–2.6 MPa [9]. In the asymmetric hydrodynamic pressure analysis, the external pressure was set to 1.8 MPa because the jet stream load is 82% [12]. The pressure only affected half the SPB in the width direction inside the pressure limit line, as shown in Figure 4c. Finally, a temperature change (from 20 °C to −163 °C), rather than external pressure, was applied in the thermal shrinkage analysis.
The specific boundary conditions were set considering the actual contact condition of the primary barrier. The LNG CCS comprises an assembly of continuous primary barriers, which are called “primary membranes.” The two primary membranes overlap each other at the end and are welded to an anchoring strip screwed to the fixed plywood panel [26]. It was assumed that the target primary barrier was located in the middle of the primary membrane to exclude other variables, such as LNG CCS composite materials. Thus, the sides of the SPB were restricted in all directions in each analysis; the end of the primary barrier was connected as an intact plate with other sheets at the end-fixed primary membrane. Similarly, the flat bottom of the SPB was restricted in the negative y-direction considering the contact condition of the primary barrier on the fixed plywood [27]. In addition, one or two symmetric boundary conditions were applied to realize a whole-shape SPB condition from the quarter and half model, respectively.

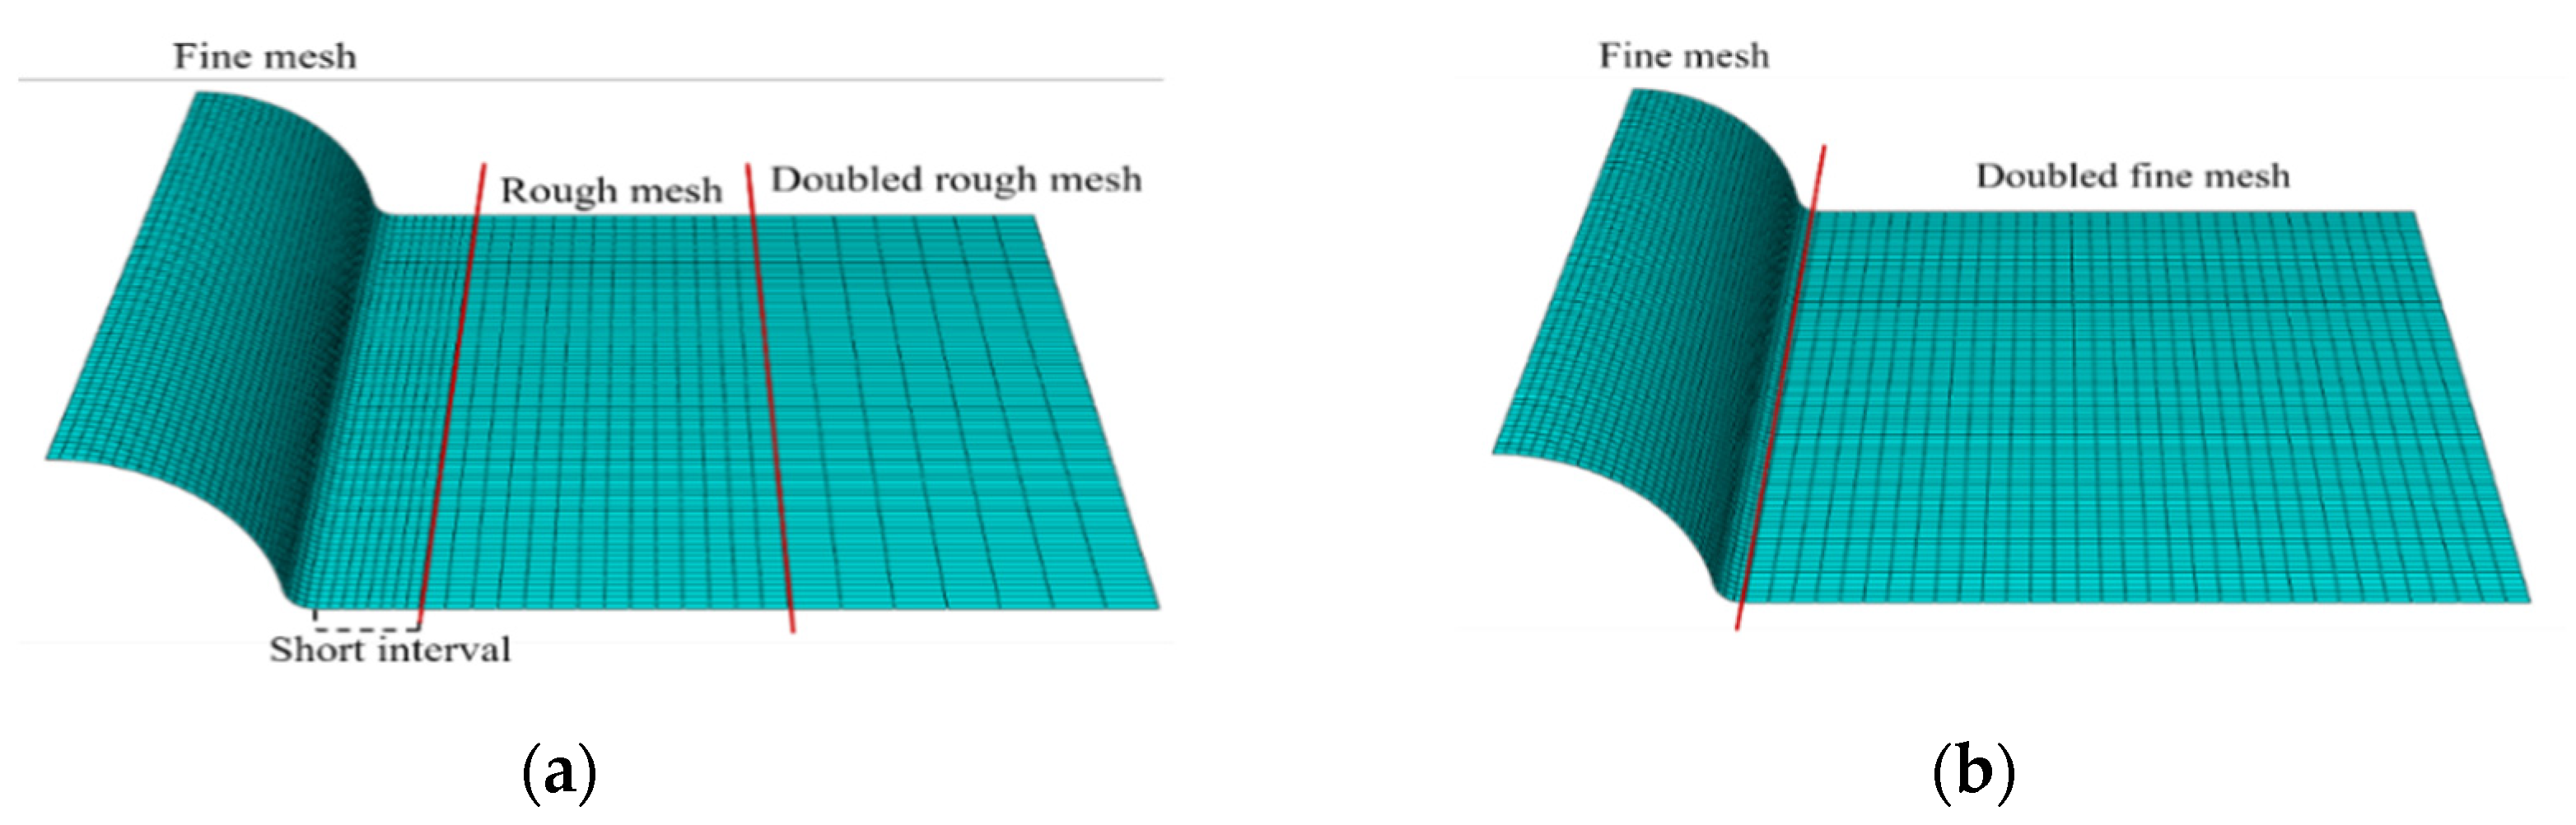
2.3. Mesh Convergence Study

A suitable mesh size must be determined to ensure the best FEA results [28]. In general, an accurate result can be achieved with a fine mesh; however, this is time-consuming [29]. Thus, the optimal number of elements was obtained by finding the convergence point of maximum deformation according to the mesh size. The mesh study was conducted for case No. 32, which best matches the primary barrier. First, preliminary simulations were performed in each test with a square mesh to approximate the structural behavior. The results indicate negligible stress and deformation in the flat bottom of the SPB in both the symmetric and asymmetric hydrodynamic pressure analysis. However, in the thermal shrinkage analysis, the flat bottom of the SPB was more vulnerable. Hence, the mesh size of the flat bottom was set to twice that of the fine mesh in the thermal shrinkage analysis, as shown in Figure 5b. By contrast, there were three complex mesh regions in the symmetric and asymmetric hydrodynamic pressure analysis, as shown in Figure 5a. The fine-mesh region consisted of the corrugation, fillet, and short interval, whose length was 10 times that of the tiny mesh. This space acted as a special cushion and prevented drastic stress variations in the critical regions, which results from the size differences between the fine and rough meshes. The remaining region of the flat bottom was divided in half to create a rough mesh and double-length mesh. This large mesh was arbitrarily adjusted to reduce unnecessary calculations in unimportant parts, thus lowering computation costs.
Figure 6 shows the maximum deformation according to the number of elements in each test on a log scale. The maximum deformation noticeably increased and converged with an increasing number of elements in the hydrodynamic pressure analysis. At the onset of convergence, the size of the rough mesh was 4 mm in the two tests. In contrast, the fine-mesh size was 0.4 mm in the symmetric pressure analysis, but convergence seemingly corresponded to a 0.5 mm fine mesh in the asymmetric test. However, the maximum dwindling deformation was not significantly affected by the number of elements. Therefore, the fine-mesh size was set to 1.25 mm; the maximum deformation was less than 0.2% compared to those of the smaller lengths.

3. Result and Discussion

3.1. Validation

To verify the effectiveness of the proposed numerical procedure, a comparative study was conducted based on the strain history of the primary barrier. Notably, performing experiments at cryogenic temperature while considering hydrodynamic factors affecting the corrugated membrane involves difficulties such as data measurement and preparation of experimental apparatus. Therefore, a comparative study between the experiment and numerical analysis was performed at room temperature on a conventional primary barrier [9]. The cited experiment was conducted with a specially custom-built chamber to evaluate the pressure resistance performance of the primary barrier under the hydrodynamic pressure conditions. The experimental specimen is very similar to Figure 1a. The width and length are each 340 mm, and the corrugation radius and central angle of the fillet differ less than 1% from the experimental specimen. Figure 7a shows the experimental apparatus. The first step of the experiment involved fixing the specimen in the chamber as per the boundary conditions in Figure 4a (both sides of the primary barrier are fixed, and the bottom is fixed in the y-direction). Thereafter, oil was sprayed over the LNG primary barrier placed on the floor, and the primary barrier was subjected to oil pressure. The temperature was maintained at ambient conditions (20 °C). In addition, the pressure, which was originally at 0, increased up to 2.2 MPa, which is equal to that considered in this study. After remaining at the maximum value for about 3 min, the pressure decreased gradually; this process was recorded in the time history using a three-axis rosette-type strain gage. Figure 7b shows the strain measurement points on the corrugated sheet. The strain history was measured five times at two points near the small pressing, whose shape was similar to that of the SPB.
Figure 7c shows the material properties of the AISI 304L stainless steel at room temperature that were used in the numerical analysis [30]. We also conducted elastic–plastic FE analyses for this validation as plastic deformation was observed during the experimental analysis of the SPB. For the plastic region of the stress–strain relationship, the Ramberg–Osgood equation was adopted to evaluate the plastic behavior of ductile material [31]. The plastic strain ( ε ˜ p ) is given in Equation (1) by the Ramberg–Osgood equation [32].
ε ˜ p = ( σ ˜ H ) 1 n     ( σ ˜ σ ˜ y )
where σ ˜ is the true stress, σ ˜ y is the yield stress, H is the strength coefficient, and n is the strain-hardening exponent. Table 2 shows the tensile properties of AISI 304L at room temperature. Notably, H and n were calculated using the method of least squares from the true stress–strain curve.
Figure 7d shows the results of the numerical simulation and experiment. The FEA strain was calculated at the same point, i.e., the top of the corrugation, 45 mm away from the center. Although it is difficult to obtain identical results for the strain–time relationship of the experiment and simulation results, the overall strain history of FEA performed at room temperature agreed with the experimental results [21,30,33]. Even though the overall strain history of FEA results agreed with the experimental findings, exactly accurate results could not be obtained. Possible causes include phase transformation and initial imperfections in the austenitic stainless steel. Additionally, similar strain histories were obtained for the results of two different temperatures of FEA. Hence, the FEA is a suitable substitute for cryogenic hydrodynamic pressure experimentation.

3.2. Overall Structural Behavior

The three FEA tests on 16 model cases indicated similarities in structural characteristics in the numerical simulations. Therefore, we selected just one case (No. 32) for further investigation to analyze the general trend in the structural response of the SPB models and explain the results conveniently. Figure 8 shows the stress distribution for case No. 32 in each test. To study the behavior of the SPB intuitively, it was modeled as a whole shape (i.e., not as a quarter or half shape) via symmetric pressure analysis. In addition, the asymmetric structural behavior is shown in the side views in Figure 8c. The stress in each element was calculated from the von Mises stress based on the plastic deformation model.
As shown in Figure 8a,c, the maximum stress in the symmetric and asymmetric hydrodynamic pressure analysis occurred at the SPB fillet, as found in a previous study [34]. Moreover, low stress occurred at the flat bottom of the SPB. In the symmetric pressure analysis, the lower part of the corrugation was more vulnerable to pressure than the top, in agreement with the asymmetric pressure analysis. However, there was a wide high-stress region on the top of the corrugation. By contrast, the thermal shrinkage analysis yielded different results. The maximum stress occurred on a fillet near the fixed side boundary (not in the central length of the SPB). Furthermore, there was a wide stress distribution with more than half the maximum stress in the overall SPB, including in the flat bottom.
Figure 9 shows the deformed shape for case No. 32 in each simulation. Under the von Mises criterion (which is known as the maximum distortion energy criterion), the plastic deformation occurred when the equivalent stress exceeded the material yield strength [35,36]. The maximum deformation occurred in the center of the corrugation despite the different heights in all tests. Moreover, the deformation shape of the SPB under pressure was similar to that involving the actual primary barrier in the previous experiment, as shown in Figure 9a,c [17].
In the thermal shrinkage analysis, the deformation propagated gradually from the center outward. In addition, unlike in the pressure analysis, severe deformation was observed on the fillet near the center along the length. Figure 10 shows the deformation direction of the SPB on the x–y plane from the length–middle section view. In the thermal shrinkage analysis, the upper corrugation sagged, and the lower side stretched horizontally. By contrast, the top of the corrugation stretched in the symmetric pressure analysis. Moreover, the side became concave, as shown in Figure 10a. In the asymmetric test, the corrugation under pressure was similarly bent, and the opposite side became convex. Despite the similar structural characteristics under asymmetric pressure conditions, there was a difference in the severity of the deformation at the convex side, which depended on the corrugation diameter. As shown in Figure 11, which represents a constant θ, the deformation of the nonpressure side was more severe than the maximum deformation with decreasing R.

3.3. Effect of Corrugation Shape under Pressure

3.3.1. Effect of Corrugation Radius

We investigated the effect of the two variables in each numerical analysis. As shown in Figure 2b, R, the corrugation radius, determines the margin of the corrugated sheet for mitigating drastic thermal deformation [6]. θ, the central angle of the fillet, is related to the fillet curvature radius; it tended to decrease by approximately 6% for each case with increasing θ. The maximum stress and deformation were investigated to analyze the effect of R and θ under two types of pressure, as shown in Figure 12. The effect of the corrugation radius is determined by comparing the y-axis differences in the graph. Overall, the maximum stress increased with the corrugation diameter. This could have been due to the effect of corrugation radius on surface area. The maximum stress occurred at the fillet (not the corrugation), as shown in Figure 9. The fillet acted as a fixing support for the corrugation against external forces, similar to the boundary under severe stress. Thus, high stress occurred at the SPB fillet with a large corrugation radius because the external force was proportional to the corrugation surface area. This contradicts the notion of the maximum deformation increasing with corrugation diameter. Presumably, corrugations with a bigger radius are more sensitive to the deformation [37]. This resulted in a relatively large change in the maximum deformation due to the maximum stress. For example, there was a 1.7-fold difference in the maximum stresses between 0.08 R/L and 0.11 R/L in the symmetric pressure analysis when θ was 82.4. Similarly, there was a 1.5-fold difference in the asymmetric pressure analysis. Nevertheless, there was a 2.5-fold difference in the maximum deformation in the asymmetric analysis. Specifically, this gap soared by 16 times in the symmetric test. Hence, it is necessary to minimize the corrugation radius against the hydrodynamic pressure for small plastic deformation. Additionally, it is essential to reduce the corrugation radius at the lower part of the primary membrane, where the symmetric load is applied. If the primary barrier is exposed to asymmetric pressure, it is possible to use a corrugated sheet with a large corrugation because the difference in radius is relatively small. However, there was a sharp increase in the difference between 0.10 R/L and 0.11 R/L in all fillet central angles compared to that in other cases. Seemingly, the corrugation radius should be less than 0.1 L under hydrodynamic pressure conditions. Alternatively, a large fillet angle could be used for a big corrugation because there was a small increase in stress relative to that of a small fillet angle (see Figure 12).

3.3.2. Effect of Fillet Angle

The effect of the central angle on the structural behavior is evidenced by the change in horizontal direction in Figure 12. The maximum stress and deformation decreased noticeably with increasing θ in the symmetric and asymmetric hydrodynamic pressure analysis except in the 0.09 R/L case in Figure 12b. In this case, the gap between the peak and lowest point was only approximately 1%. Presumably, the stress decrease is attributable to the cylinder stress under inner pressure conditions. Thin-walled cylinder stress occurs in three directions in the cylindrical coordinate system; two of the stress components tend to be proportional to the diameter [38]. Hence, low maximum stress occurred in the SPB at a large θ because the curvature radius of the fillet was inversely proportional to the central angle. Additionally, it is inefficient to adjust the central angle of the fillet when stress at the fillet is low. By contrast, there was a relatively larger difference in the maximum deformation at a constant corrugation radius. Presumably, the small fillet corresponding to a large θ acted as a strong fixing support for the SPB against pressure because the maximum deformation occurred in the corrugation (see Figure 9). Furthermore, the maximum deformation became more sensitive to the symmetric pressure as θ increased; there was a 15% to 25% decrease in the maximum deformation in the symmetric test and a 5% to 15% decrease in the asymmetric test. Hence, the central angle of the fillet needs to be larger for a lower corrugation deformation.

3.4. Effect of Corrugated Dimension under Temperature Gradient

3.4.1. Effect of Corrugation Radius

The structural characteristics under a temperature gradient, with regard to the corrugation radius and fillet central angle, are shown in Figure 13. The effect of the corrugation radius was characterized by the horizontal direction in Figure 13. Overall, the characteristics were relatively unaffected by R and θ in the same graph scale of the symmetric and asymmetric hydrodynamic pressure analysis. Hence, the y-axis of the graph was enlarged 25 times so the thermal contraction characteristics could be observed in more detail. In Figure 13a, there is no noticeable change in the maximum stress even in the enlarged region; for the same θ, the difference between the highest and lowest value was less than 1%. In addition, the difference in the maximum deformation (6%) was significantly less than that in the pressure analysis. Furthermore, the reason for the maximum stress seems to be the fixed boundary condition of FEA; this makes it impossible to analyze the effect of the radius. Therefore, we chose one node, the top of the corrugation in the middle, to observe the difference as per radius. It seems that thermal stress decreases with a larger corrugation radius. Additionally, the maximum deformation tended to increase and decrease with R; the inflection point was 0.09 R/L, as shown in Figure 13b. Seemingly, the 0.08 L corrugation radius was too small to produce a significant deformation in the y-direction due to the thermal contraction of the SPB. The thermal contraction in the flat bottom was accompanied by the expansion of the corrugation with decreasing temperature. By contrast, the top of the corrugation sagged owing to the expansion in the width direction, as shown in Figure 10c. Furthermore, the thermal contraction length was roughly constant in all cases owing to the fixed 340 mm width. Hence, the partial deformation of the corrugation decreased when R increased to 0.09 L because the overall corrugation compensated for the decrease in length. However, the corrugation with a small radius (such as 0.08 L) became tighter following the small y-direction deformation, which was attributed to the limited perimeter of the corrugation. Thus, the residual stress in the corrugation with the small radius increased, as demonstrated in the numerical analysis. Hence, it feasible to increase the corrugation radius to address the drastic variation in temperature. However, the corrugation radius can be reduced, considering deformation under hydrodynamic load, if the residual pressure is acceptably lower than standard pressure.

3.4.2. Effect of Fillet Angle

Figure 13 shows the effect of θ on the maximum stress and deformation under temperature change based on a constant R (from top to bottom of the graph for the same R). Apparently, the maximum stress remained relatively constant irrespective of the parameters because the difference in stress was less than 0.5%. The maximum stress occurred at the intersection of the fillet and fixed side boundary, as shown in Figure 8b. Like the other parts, the fillet was deformed under thermal contraction; the corrugation did not offer fixing-support conditions. Moreover, the SPB fillet was only slightly deformed owing to its small size, although the increase in θ induced an approximate change of 6% in the fillet curvature radius. Hence, the maximum stress was not significantly affected by the fillet angle. Likewise, the maximum deformation decreased slightly, by less than 1%, for a large fillet angle. Therefore, we believe that the corrugation radius is more important than the fillet angle when designing the primary barrier to withstand cryogenic temperature variations. However, increasing the central angle of the fillet whenever possible is recommended because it reduces corrugation thermal deformation and has a positive effect under pressure conditions.

4. Conclusions

Herein, the effects of the corrugation radius and fillet angle on the structural characteristics of a simplified LNG primary barrier were investigated via FEA. We studied the response of the SPB under loading and boundary conditions corresponding to those of the LNG CCS operating conditions. Moreover, the FEA results were validated by comparing them to those of a previous experiment. The main results are as follows:
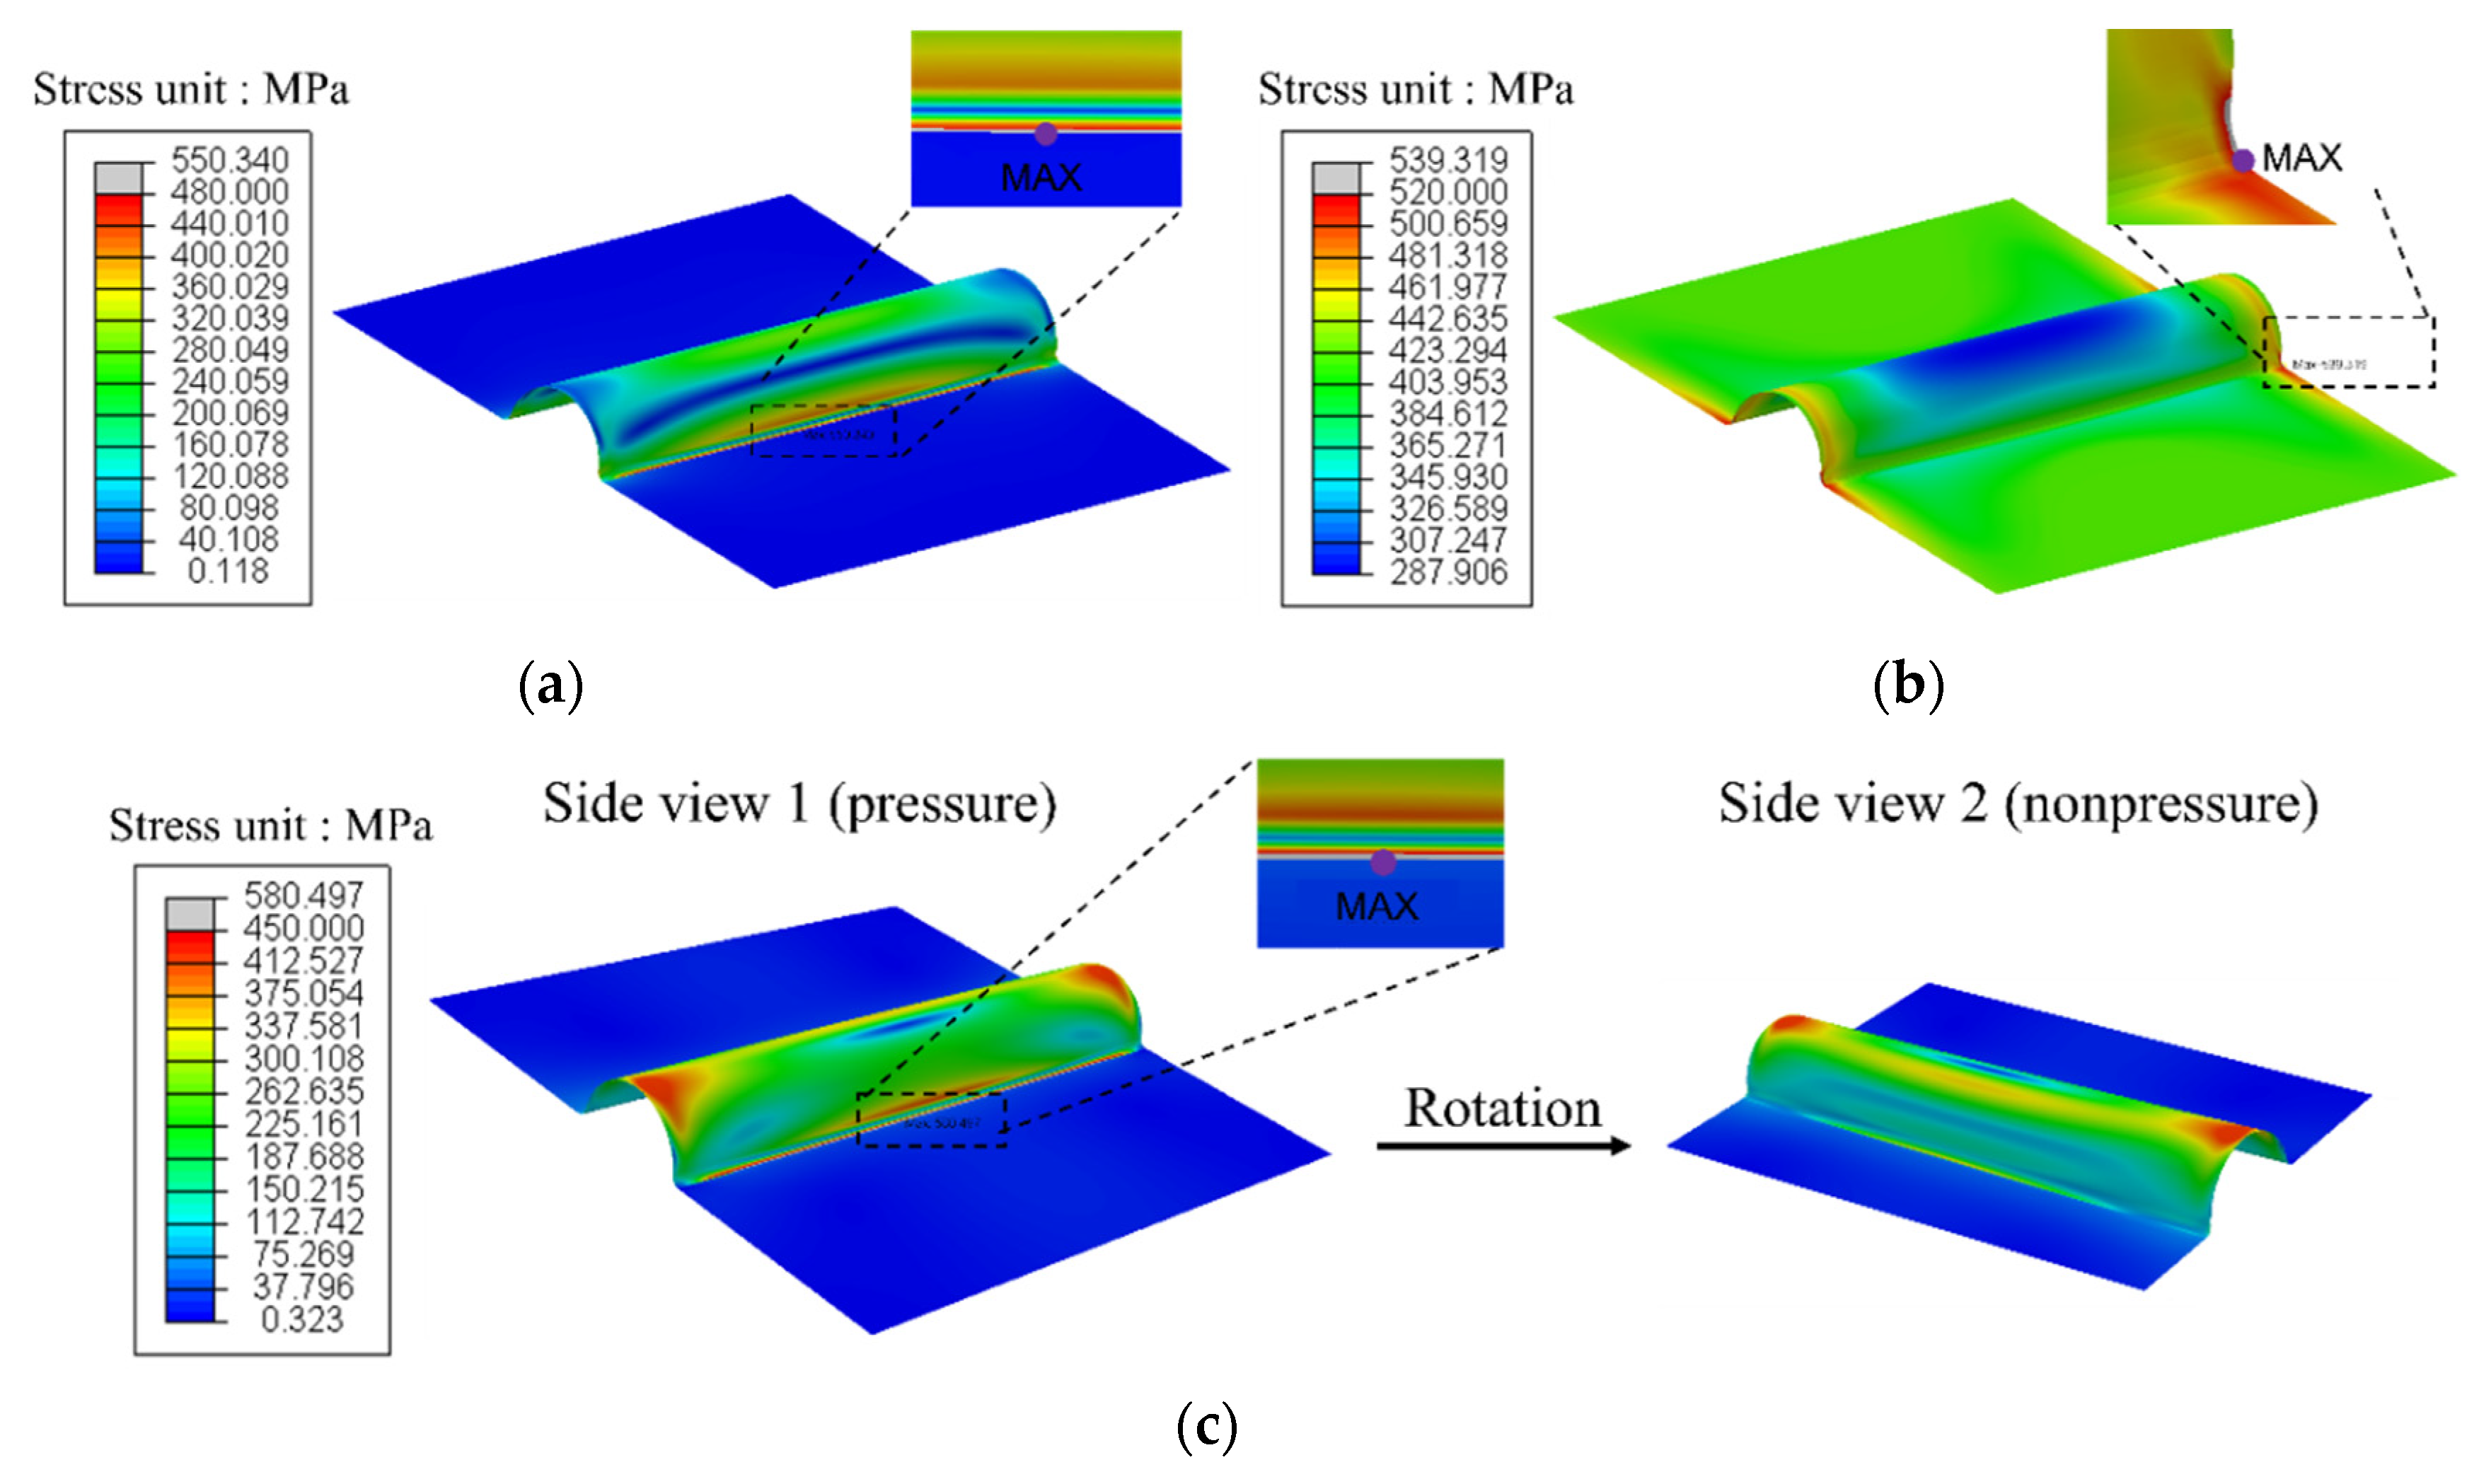
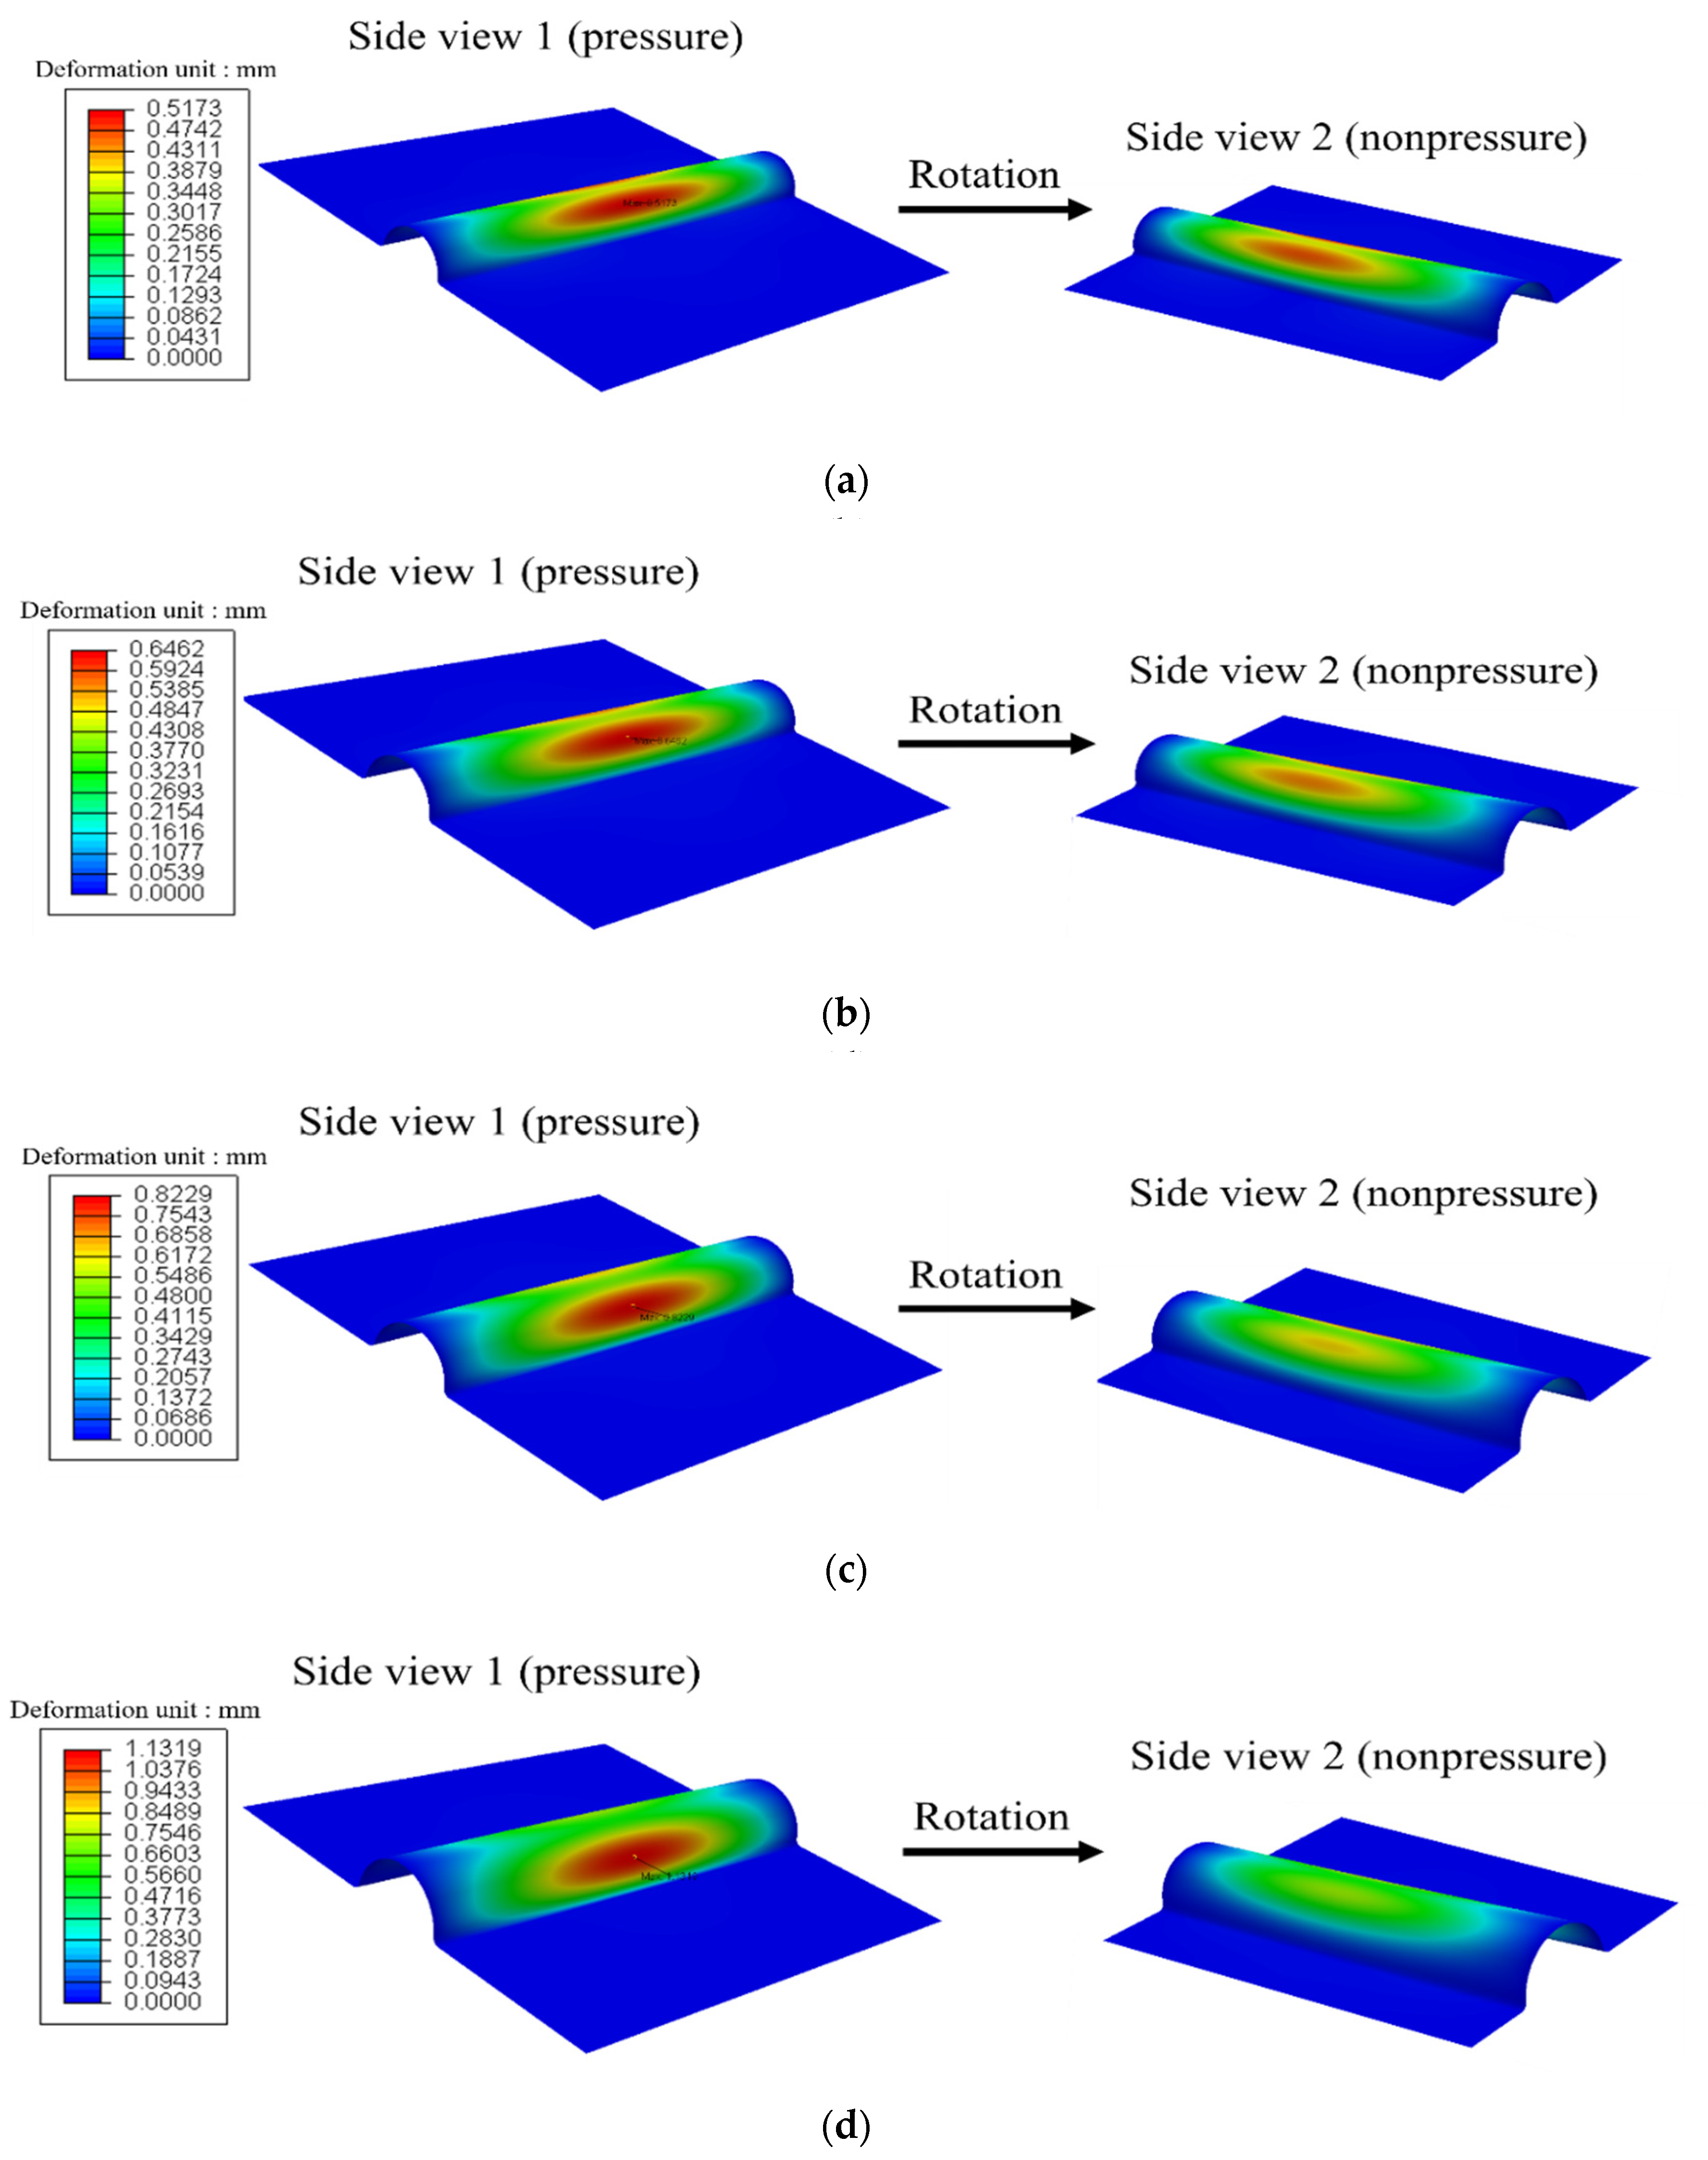
  • In the pressure analysis, the maximum stress occurs at the intersection of the fillet along the middle of the longitudinal direction. In addition, the maximum deformation occurs at the center of the corrugation for different heights based on the load conditions.
  • In the hydrodynamic pressure analysis, the maximum stress and deformation increase as the radius of the corrugation increases. In particular, the corrugation radius should not exceed 0.11 L because it would induce severe deformation compared to that of the 0.1 L corrugation radius.
  • In the pressure load condition, the maximum stress and deformation decrease with increasing fillet angle. The sensitivity is greater in the symmetric pressure analysis, where the maximum deformation decreases by 15% to 25% based on the fillet angle.
  • In the thermal contraction condition, the effect of the fillet angle on the structural behavior is less than 1%. However, there exists an inflection point at which the maximum deformation increases or decreases depending on the corrugation radius. Furthermore, a short corrugation radius induces more residual stress in the corrugation.
  • From the analysis results, the optimum corrugation radius and fillet angle were determined as 0.09 L and 82.4°, respectively. The fillet angle is a more important factor under hydrodynamic loading than thermal contraction conditions. Therefore, a larger fillet angle is recommended for reducing corrugation deformation.
The authors believe that a design incorporating the new optimal corrugation shape would result in an LNG primary barrier with better structural characteristics than the conventional design under hydrodynamic pressure and cryogenic thermal contraction.

Author Contributions

Conceptualization, Data curation, Formal analysis, Investigation, Methodology, Validation, Visualization, Writing—original draft, J.-S.P.; Conceptualization, Data curation, Formal analysis, Investigation, Methodology, Validation, Y.-C.J.; Investigation, Methodology, Writing—review & editing, H.-T.K. and S.-K.K.; Funding acquisition, Project administration, Resources, Supervision, Writing—review & editing, J.-H.K. and J.-M.L. All authors have read and agreed to the published version of the manuscript.

Funding

This research was a part of a project titled “Development of the safety standards for marine hydrogen storage vessels and fuel supply systems”, funded by the Ministry of Oceans and Fisheries, Korea. This work was supported by the R&D Platform Establishment of Eco-Friendly Hydrogen Propulsion Ship Program (No. 20006644) funded by the Ministry of Trade, Industry and Energy (MOTIE, Korea).

Institutional Review Board Statement

Not applicable.

Informed Consent Statement

Not applicable.

Data Availability Statement

The data presented in this study are available on request from corresponding author.

Conflicts of Interest

The authors declare no conflict of interest.

References

  1. Kumar, S.; Kwon, H.T.; Choi, K.H.; Lim, W.; Cho, J.H.; Tak, K.; Moon, I. LNG: An eco-friendly cryogenic fuel for sustainable development. Appl. Energy 2011, 88, 4264–4273. [Google Scholar] [CrossRef]
  2. Kim, J.H.; Park, D.H.; Lee, C.S.; Park, K.J.; Lee, J.M. Effects of cryogenic thermal cycle and immersion on the mechanical characteristics of phenol-resin bonded plywood. Cryogenics 2015, 72, 90–102. [Google Scholar] [CrossRef]
  3. Kim, T.W.; Kim, S.K.; Kim, J.H.; Lee, J.M. Effects of Environmental Conditions on the Mechanical and Degradation Behavior of Polyurethane Foam Subjected to Various Deformation Histories. J. Mater. Eng. Perform. 2019, 28, 5063–5075. [Google Scholar] [CrossRef]
  4. Lee, D.H.; Ha, M.K.; Kim, S.Y.; Shin, S.C. Research of design challenges and new technologies for floating LNG. Int. J. Nav. Archit. Ocean Eng. 2014, 6, 307–322. [Google Scholar] [CrossRef] [Green Version]
  5. Hasan, M.M.F.; Zheng, A.M.; Karimi, I.A. Minimizing boil-off losses in liquefied natural gas transportation. Ind. Eng. Chem. Res. 2009, 48, 9571–9580. [Google Scholar] [CrossRef]
  6. Kim, J.H.; Lee, C.S.; Kim, M.H.; Lee, J.M. Prestrain-dependent viscoplastic damage model for austenitic stainless steel and implementation to ABAQUS user-defined material subroutine. Comput. Mater. Sci. 2013, 67, 273–281. [Google Scholar] [CrossRef]
  7. Choe, J.H.; Kim, K.H.; Lee, D.Y.; Bang, C.S.; Lee, D.G. Glass composite vibration isolating structure for the LNG cargo containment system. Compos. Struct. 2014, 107, 469–475. [Google Scholar] [CrossRef]
  8. Park, S.B.; Choi, S.W.; Kim, J.H.; Bang, C.S.; Lee, J.M. Effect of the blowing agent on the low-temperature mechanical properties of CO2- and HFC-245fa-blown glass-fiber-reinforced polyurethane foams. Compos. Part B Eng. 2016, 93, 317–327. [Google Scholar] [CrossRef]
  9. Lee, D.Y.; Kim, K.H.; Choi, I.B.; Lee, D.G. Pressure-resisting capability of the knot area of the primary barrier for a LNG containment system. Ocean Eng. 2015, 95, 128–133. [Google Scholar] [CrossRef]
  10. Jeong, Y.J.; Kim, H.T.; Kim, S.K.; Kim, J.H.; Kim, Y.T.; Heo, W.S.; Lee, J.M. Evaluation of the pressure-resisting capability of membrane-type corrugated sheet under hydrodynamic load. Thin-Walled Struct. 2021, 106, 107388. [Google Scholar] [CrossRef]
  11. Kim, M.S.; Kim, J.H.; Kim, S.K.; Lee, J.M. Experimental investigation of structural response of corrugated steel sheet subjected to repeated impact loading: Performance of LNG cargo Containment System. Appl. Sci. 2019, 9, 1558. [Google Scholar] [CrossRef] [Green Version]
  12. Brosset, L.; Lafeber, W.; Bogaert, H.; Marhem, M.; Carden, P.; Maguire, J. A mark III panel subjected to a flip-through wave impact: Results from the Sloshel project. In Proceedings of the Twenty-First International Offshore and Polar Engineering Conference, Maui, HI, USA, 19–24 June 2011. [Google Scholar]
  13. Wang, B.; Shin, Y. Full-scale test and FE analysis of LNG MK III containment system under sloshing loads. In Proceedings of the Twenty-First International Offshore and Polar Engineering Conference, Maui, HI, USA, 19–24 June 2011. [Google Scholar]
  14. Kwon, S.B.; Kim, M.S.; Lee, J.M. A numerical study on the fatigue evaluation of mark-III LNG primary barrier. J. Korean Soc. Mar. Eng. 2017, 4, 337–344. [Google Scholar] [CrossRef]
  15. Xiong, J.; Feng, L.; Ghosh, R.; Wu, H.; Wu, L.; Ma, L.; Vaziri, A. Fabrication and mechanical behavior of carbon fiber composite sandwich cylindrical shells with corrugated cores. Compos. Struct. 2016, 156, 307–319. [Google Scholar] [CrossRef] [Green Version]
  16. Bogaert, H.; Kaminski, M.L.; Brosset, L. Full and large scale wave impact tests for a better understanding of sloshing—Results of the Sloshel project. In Proceedings of the ASME 2011 30th International Conference on Ocean, Offshore and Arctic Engineering, Rotterdam, The Netherlands, 19–24 June 2011. [Google Scholar]
  17. Kim, B.C.; Yoon, S.H.; Lee, D.G. Pressure resistance of the corrugated stainless steel membranes of LNG carriers. Ocean Eng. 2011, 38, 592–608. [Google Scholar]
  18. Abaqus, Version 6.14 Documentation; Dassault Systemes Simulia Corporation: Providence, RI, USA, 2014.
  19. Song, C.Y.; Cho, D.Y. Cryogenic compressive strength and thermal deformation of reinforced polyurethane foam material for membrane type LNG carrier. Key Eng. Mater. 2018, 773, 30–39. [Google Scholar] [CrossRef]
  20. Sorohan, S.; Constantinescu, D.M.; Sandu, M.; Sandu, A. Using point symmetry in finite element analyses. Mater. Today Proc. 2020, 32, 139–147. [Google Scholar] [CrossRef] [Green Version]
  21. Kim, J.H.; Kim, S.K.; Kim, M.H.; Lee, J.M. Numerical model to predict deformation of corrugated austenitic stainless steel sheet under cryogenic temperatures for design of liquefied natural gas insulation system. Mater. Des. 2014, 57, 26–39. [Google Scholar] [CrossRef]
  22. Kim, J.H.; Park, W.S.; Chun, M.S.; Kim, J.J.; Bae, J.H.; Kim, M.H.; Lee, J.M. Effect of pre-straining on low-temperature mechanical behavior of AISI 304L. Mater. Sci. Eng. A 2012, 543, 50–57. [Google Scholar] [CrossRef]
  23. Kim, S.K.; Kim, J.H.; Kim, J.H.; Lee, J.M. Numerical model for mechanical nonlinearities of high manganese steel based on the elastoplastic damage model. Metals 2018, 8, 680. [Google Scholar] [CrossRef] [Green Version]
  24. Sadok, L.; Luksza, J.; Majta, J. Inhomogeneity of mechanical properties in stainless steel rods after drawing. J. Mater. Process. Technol. 1994, 44, 129–141. [Google Scholar] [CrossRef]
  25. Chieslar, J.D.; Ghali, A. Solid to shell element geometric transformation. Comput. Struct. 1987, 25, 451–455. [Google Scholar] [CrossRef]
  26. Ehlers, S.; Guiard, M.; Kubiczek, J.; Höderath, A.; Sander, F.; Sopper, R.; Charbonnier, P.; Marhem, M.; Darie, I.; von Selle, H.; et al. Experimental and numerical analysis of a membrane cargo containment system for liquefied natural gas. Ships Offshore Struct. 2017, 12, S257–S267. [Google Scholar] [CrossRef]
  27. Choi, S.W.; Li, M.; Lee, W.I.; Kim, H.S. Analysis of buckling load of glass fiber/epoxy-reinforced plywood and its temperature dependence. J. Compos. Mater. 2014, 48, 2191–2206. [Google Scholar] [CrossRef]
  28. Turon, A.; Dávila, C.G.; Camanho, P.P.; Costa, J. An engineering solution for mesh size effects in the simulation of delamination using cohesive zone models. Eng. Fract. Mech. 2007, 74, 1665–1682. [Google Scholar] [CrossRef]
  29. Cichanski, A. Mesh size dependency on notch radius for FEM analysis of notched round bars under tension. AIP Conf. Proc. 2017, 1822, 020004. [Google Scholar]
  30. Kim, S.K.; Lee, C.S.; Kim, J.H.; Kim, M.H.; Lee, J.M. Computational evaluation of resistance of fracture capacity for SUS304L of liquefied natural gas insulation system under cryogenic temperatures using ABAQUS user-defined material subroutine. Mater. Des. 2013, 50, 522–532. [Google Scholar] [CrossRef]
  31. Patwardhan, P.S.; Nalavde, R.A.; Kujawski, D. An estimation of Ramberg-Osgood constants for materials with and without luder’s strain using yield and ultimate strengths. Procedia Struct. Integr. 2019, 17, 750–757. [Google Scholar] [CrossRef]
  32. Li, T.; Zheng, J.; Chen, Z. Description of full-range strain hardening behavior of steels. Springerplus 2016, 5, 1316. [Google Scholar] [CrossRef] [Green Version]
  33. Lee, C.S.; Yoo, B.M.; Kim, M.H.; Lee, J.M. Viscoplastic damage model for austenitic stainless steel and its application to the crack propagation problem at cryogenic temperatures. Int. J. Damage Mech. 2012, 22, 95–115. [Google Scholar] [CrossRef]
  34. Sohn, J.M.; Bae, D.M.; Bae, S.Y.; Paik, J.K. Nonlinear structural behaviour of membrane-type LNG carrier cargo containment systems under impact pressure loads at −163 °C. Ships Offshore Struct. 2017, 12, 722–733. [Google Scholar] [CrossRef]
  35. Sano, H.; Wakabayashi, I.; Itoi, E. Stress distribution in the supraspinatus tendon with partial-thickness tears: An analysis using two-dimensional finite element model. J. Shoulder Elb. Surg. 2006, 15, 100–105. [Google Scholar] [CrossRef]
  36. Martín-Martín, A.; Avella, M.; Iiguez, M.P.; Jiménez, J.; Oudart, M.; Nagle, J. Thermomechanical model for the plastic deformation in high power laser diodes during operation. J. Appl. Phys. 2009, 106, 073105. [Google Scholar] [CrossRef]
  37. El-Mahdy, G.M. Parametric study of the structural and in-plane buckling analysis of ogee arches. HBRC J. 2014, 10, 108–116. [Google Scholar] [CrossRef] [Green Version]
  38. Wibawa, L.A.N. Numerical Study of The Effect of Wall Thickness and Internal Pressure on Von Mises Stress and Safety Factor of Thin-Walled Cylinder for Rocket Motor Case. JST 2020, 9, 30–38. [Google Scholar] [CrossRef]
Figure 1. (a) Photograph of the primary barrier. (b) Simplified primary barrier without knot area for FEA. (c) Schematic of hydrodynamic loading caused by ship motion. The black arrow represents the flow direction. (d) Schematic of the membrane-type LNG CCS [9].
Metals 12 00521 g001
Figure 2. (a) Detailed SPB drawing: (b) front view of SPB, (c) half-length model, and (d) quarter model.
Metals 12 00521 g002
Figure 3. (a) Stress–strain curve of AISI 304L tensile test at −163 °C; (b) thermal expansion coefficient of AISI 304L at room and cryogenic temperature.
Metals 12 00521 g003
Figure 4. Loading and boundary conditions in (a) symmetric hydrodynamic pressure, (b) thermal shrinkage, and (c) asymmetric hydrodynamic pressure analysis. The red rectangles represent the flat bottom of the SPB, and each line represents a side of the SPB. Furthermore, the gray arrows indicating the pressure direction do not cross the yellow pressure limit line.
Metals 12 00521 g004
Figure 5. Schematic of mesh size distribution in (a) symmetric and asymmetric hydrodynamic pressure analysis and (b) thermal shrinkage analysis.
Metals 12 00521 g005
Figure 6. Maximum deformation according to the number of elements in (a) pressure tests and (b) thermal shrinkage analysis. The red dashed line connotes deformation convergence.
Metals 12 00521 g006
Figure 7. Photographs of the (a) experimental apparatus and (b) strain measurement points at the primary barrier; graphs depicting the (c) tensile properties of AISI 304L at room temperature and (d) experimental and FEA time–strain histories [9].
Metals 12 00521 g007
Figure 8. Stress distribution for case No. 32 in (a) symmetric pressure analysis, (b) thermal shrinkage analysis, and (c) asymmetric pressure analysis. The black dashed rectangle and purple dot represent the points under maximum stress. Side view 1 (pressure) represents the pressure side, and side view 2 (nonpressure) represents the opposite case.
Metals 12 00521 g008
Figure 9. Deformed shapes for case No. 32 in (a) symmetric pressure analysis, (b) thermal shrinkage analysis, and (c) asymmetric pressure analysis. The black dashed rectangle represents the area of maximum deformation; side view 1 (pressure) shows the face exposed to pressure, and side view 2 (nonpressure) represents the opposite case.
Metals 12 00521 g009
Figure 10. Deformation direction of the SPB on the length–middle section in the (a) symmetric pressure analysis, (b) asymmetric pressure analysis, and (c) thermal shrinkage analysis. The black arrows represent the deformation direction of the node from the red line to the blue dashed line.
Metals 12 00521 g010
Figure 11. Deformed SPB shapes of 82.8° fillet angle under asymmetric pressure in (a) case No. 12, (b) case No. 22, (c) case No. 32, and (d) case No. 42.
Metals 12 00521 g011
Figure 12. Maximum SPB stress and deformation according to the fillet angle in each test (a,c) symmetric pressure analysis and (b,d) asymmetric pressure analysis.
Metals 12 00521 g012aMetals 12 00521 g012b
Figure 13. Maximum (a) stress, stress on the center corrugation, and (b) deformation of SPB according to the fillet angle in thermal shrinkage analysis. The dashed line represents the enlarged region of the graphs.
Metals 12 00521 g013
Table 1. FEA scenario according to corrugation radius and fillet angle.
R/LCase No.θ (°)
0.081182.4
1282.8
1383.2
1483.6
0.092182.4
2282.8
2383.2
2483.6
0.103182.4
3282.8
3383.2
3483.6
0.114182.4
4282.8
4383.2
4483.6
Table 2. The tensile properties of AISI 304L at room temperature [30].
Yield Stress
( σ y ,   MPa )
Young’s Modulus
(E, MPa)
Strength Coefficient
(H, MPa)
Strain Hardening Exponent
(n)
331.3206,3871678.80.46
Publisher’s Note: MDPI stays neutral with regard to jurisdictional claims in published maps and institutional affiliations.

