Article

Mössbauer Spectroscopy for Additive Manufacturing by Selective Laser Melting

1
Department of Experimental Physics, Faculty of Science, Palacký University, 17, Listopadu 1192/12, 77900 Olomouc, Czech Republic
2
Science and Technology Park, Palacký University, Šlechtitelů 21, 78371 Olomouc, Czech Republic
3
Research Institute of Physics, Southern Federal University, Stachki av. 194, 344090 Rostov-on-Don, Russia
*
Author to whom correspondence should be addressed.
Metals 2022, 12(4), 551; https://doi.org/10.3390/met12040551
Submission received: 11 February 2022 / Revised: 17 March 2022 / Accepted: 18 March 2022 / Published: 24 March 2022

Abstract

:
Selective laser melting (SLM) is a technology of layer-by-layer additive manufacturing using a laser. This technology allows one to get complex-shaped, three-dimensional (3D) specimens directly from metal powder. In this technology, various metal powders are used, including different steels. Stainless steel 1.4404 (CL20ES) and maraging steel 1.2709 (CL50WS) have been investigated. The surface of samples manufactured from CL20ES and CL50WS powders by SLM (with and without combination sandblasting and annealing) was studied by conversion X-ray Mössbauer spectroscopy (CXMS) and conversion electron Mössbauer spectroscopy (CEMS). The surface morphology, elemental composition, and structure were examined by scanning electron microscopy (SEM), energy-dispersive X-ray spectroscopy (EDS), and X-ray powder diffraction (XRD). Samples with sandblasted (corundum powder) and non-sandblasted surfaces were annealed at 540 °C (CL50WS) or 550 °C (CL20ES) for 6 h in air. Oxidation processes on surfaces of samples manufactured from both initial powders were observed after post-process annealing by CEMS and CXMS, as well as confirmed by XRD. The transformation of the austenitic to ferritic phase was observed in a sandblasted and annealed CL20ES sample by CEMS and XRD.

1. Introduction

Selective laser melting (SLM) is one of the fastest-developing technologies in additive manufacturing. Currently, one of the applications of this technology in the industry is the creation of objects with high geometric complexity. The geometry of the required object is set using computer-aided design (CAD). At the beginning of the process, the digital 3D model of the part is divided into layers so that each layer, which has a thickness of 20–100 microns, is visualized in 2D. The metal powder is applied to manufacture a component, which is fixed to the construction platform, and the laser beam scans the cross section of the product layer. During the process, the metal powder particles are completely melted. The platform is lowered into the well to a depth that is the same as the thickness of the layer. A new layer of powder is applied to the top, and the process repeats until the required object is finished [1,2,3].
Currently, different types of metal powders are used for selective laser melting, depending on the requirements for the finished object. The materials used in SLM include metal powders based on Ti or Cr, stainless steel metal powder, maraging steel metal powder, etc. The application of additive manufacturing can be used in the aerospace, biomedical, and automotive industries [4,5].
Thermal effects and physical mechanisms affecting the sample may occur during the manufacture of the sample by the SLM method. The interaction of the material and the laser has been studied in various works [6,7,8].
One of the methods of studying iron-based samples is 57Fe Mössbauer spectroscopy (MS) [9]; however, a small number of works are devoted to the study of steel components and their surfaces made by SLM using MS. Using this method with the detection of conversion electrons (CEMS) and conversion X-ray (CXMS), it is possible to study changes in the phase composition of surface layers after mechanical and thermal treatment at different depths (0.3 μm for CEMS and 10 μm for CXMS) [9,10,11,12,13,14]. During laser melting, there may be a change in the phase composition, which differs from the initial powder. The difference in the phase composition of the initial CL50WS metal powder and the parts made with SLM technology was observed in [10,11]. After the sample is manufactured using SLM, sandblasting and temperature annealing are applied, which can affect the surface quality and morphology of the sample. Morphological changes and oxidation of surface layers related to sandblasting and annealing of parts produced by SLM technology from CL20ES stainless steel powder and CL50WS maraging steel powder were observed in [13,15,16].
The purpose of this work is to study the surface of samples made from CL20ES and CL50WS powders by SLM using CEMS and CXMS. X-ray diffraction (XRD) and scanning electron microscopy (SEM) were also used to study the phase composition and the surface morphology. The elemental composition was checked by energy-dispersive X-ray spectroscopy (EDS).

2. Materials and Methods

Eight prism-shaped samples with a cubic shape (25 × 25 × 25 mm3) were made using a Concept Laser M2-cusing system (GE Additive, Cincinnati, OH, USA). Four samples of CL20ES steel powder and four samples of CL50WS powder were prepared separately. The chemical composition of these metal powders is presented in Table 1. The SLM system makes use of a Yb:YAG diode-pumped fiber optical laser that has a wavelength of 1070 nm and a maximum power of 400 W. The low laser power was chosen on the authors’ experience. Typically, when a higher laser power is used, mechanical deformations of the manufactured parts often occur because of insufficient heat dissipation. During the laser production process, the laser power was set to 200 W and the maximum scanning rate was set to 1800 mm/s.
After SLM manufacturing, some samples were left in their original state, while others were sandblasted (corundum powder) and annealed. The samples were annealed in air at a temperature of 540 °С (CL50WS) or at 550 °C (CL20ES) for 6 h. The identification of the samples according to their processing is presented in Table 2.
Transmission and backscattering of 57Fe Mössbauer spectrometer (Department of Experimental Physics of Palacky University, Olomouc, Czech Republic) operating in constant acceleration mode and equipped with a 57Co (Rh) source and MS96 Mössbauer spectrometer software [17] were used to accumulate transmission and backscattering of 57Fe Mössbauer spectra at room temperature. Spectra were recorded in 512 channels. A proportional gas counter detecting 14.4 keV γ-rays and 6.4 keV X-rays was used for the registration of transmission Mössbauer spectra (TMS) and conversion X-ray Mössbauer spectra (CXMS), respectively. Conversion electron Mössbauer spectra (CEMS) were measured with an air scintillation detector [18]. Least-square fitting of the lines using the MossWinn 4.0 software program (Budapest, Hungary) [19,20] performed the calculation and evaluation of the Mössbauer spectra. The isomer shift values were referred to the centroid of the spectrum, recorded from an α-Fe foil (thickness 30 µm) at room temperature.
The crystal structure and phase composition of the samples were analyzed by XRD. The Diffractometer D8 ADVANCE (Bruker, Billerica, MA, USA) with a Co Kα X-ray source and LYNXEYE position-sensitive detector was operated in the Bragg–Brentano parafocusing geometry. The X-ray tube voltage of 35 kV and current of 40 mA were used. On the primary beam path, the instrument was equipped with a 0.6 mm divergence slit and 2.5° axial Soller slits. On the secondary beam path, a 20 µm Fe Kβ filter and 2.5° axial Soller slits were installed. XRD patterns were acquired in the 2θ range of 20–130° with a step size of 0.03°. The expected X-ray penetration and the analysis depth is up to 20 μm.
A scanning electron microscope, VEGA3 LMU (TESCAN, Brno, Czech Republic), with a secondary electron detector of Everhart–Thornley type (TESCAN, Brno, Czech Republic) and XFlash silicon drift detector 410-M (Bruker Nano GmbH, Berlin, Germany) was used to image the CL20ES and CL50WS powder, the surfaces of the final component, and for elemental analysis by energy-dispersive X-ray spectroscopy (EDS).

3. Results and Discussion

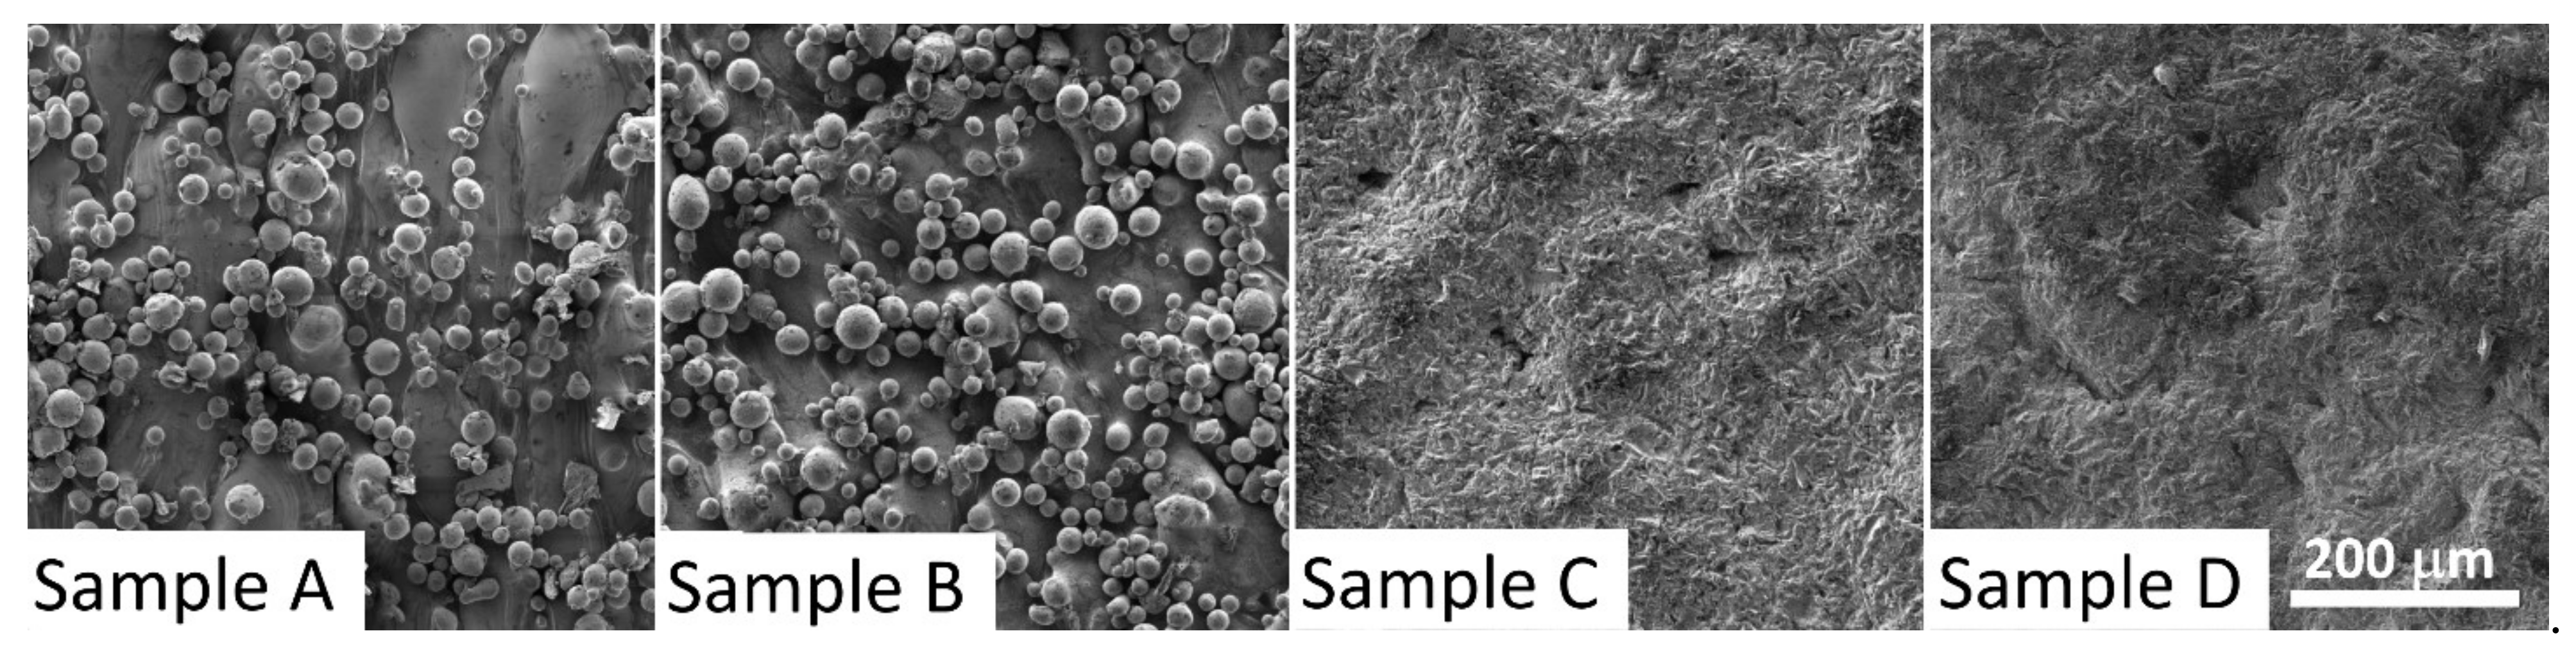
3.1. Scanning Electron Microscopy

Scanning electron microscopy (SEM) was used to characterize the morphology of the surface of the samples. The images obtained by SEM are shown in Figure 1 for samples made with stainless steel metal powder CL20ES and in Figure 2 for samples made with maraging steel metal powder CL50WS. According to the images obtained, there are welded spherical particles of the initial powder on the samples that were not annealed and sandblasted (Figure 1—Sample A and Figure 2—Sample E). It can also be noted that annealing of the studied samples does not lead to the removal of powder particles from the sample surface (Figure 1—Sample B and Figure 2—Sample F). The spherical particles of the initial powder are completely removed only after sandblasting (Figure 1—Samples C,D and Figure 2—Samples G,H).

3.2. Energy-Dispersive X-ray Spectroscopy

EDS was used to determine the elemental composition of the surface layers of sandblasted samples. The elemental composition was monitored to observe the surface diffusion of the elements due to post-process annealing. A change in the elemental composition of steel can cause phase transformations (γ to α) [21,22,23]. The experiments were carried out to track changes in the amount of Fe, Cr, and Ni for CL20ES samples, and the amount of Fe, Ni, Co, Mo, and Ti for CL50WS samples. These elements are present in greater quantities in the initial powder (Table 1). The acceleration voltages were 11 kV and 20 kV, which, according to Castaing’s formula [24], allows one to obtain information from depths of 0.3 and 1.4 μm, respectively. The effect of annealing on the elemental composition of the surface layers was observed for both steels. In the case of stainless steel (CL20ES), an increase in chromium content was observed in the surface layer of about 0.3 μm, but this increase was not observed in the 1.4 μm layer (Table 3). This increase in chromium content in the thin surface layer corresponds to a registered decrease in iron and nickel. In the case of maraging steel (CL50WS) in a thin 0.3 μm surface layer, a twofold increase in Co was observed, as were a practically tenfold decrease in Mo and Ti and a twentyfold decrease in Ni (Table 4). However, no increase in Co was observed in the 1.4 μm layer; the observed Co content did not change due to annealing. However, in the 1.4 μm layer, there was the same decrease in Ni, Mo, and Ti content as in the 0.3 μm layer. The observed changes in iron content correspond to changes in Co, Ni, Mo, and Ti contents. EDS inspection showed that diffusion of alloying elements occurs on the surface of the parts during annealing.

3.3. Mössbauer Spectroscopy

3.3.1. Mössbauer Spectroscopy of Initial Powders

The transmission Mössbauer spectra of the initial powders are shown in Figure 3, on the left. A single peak of the Mössbauer spectrum of CL20ES metal powder is characteristic of the γ-phase (FCC structure). For CL50WS powder, the predominance of the α-phase (BCC structure) is observed and there is the presence of the FCC structure. The single peak is characteristic for the pure γ-Fe (FCC structure) Mössbauer spectrum, but substitutional and interstitial atoms (dominantly Cr and Ni) cause a broadening of the spectrum; therefore, the Mössbauer spectrum is fitted with a doublet with small quadrupole splitting [25]. The hyperfine field of the α-phase corresponds to the number of alloying atoms in the nearest environment of iron atoms in the alloy, and therefore, the α-phase is adapted to the distribution of the magnetic fields [26].
It can be concluded that the Mössbauer spectrum of stainless steel powder CL20ES has a doublet (austenitic phase), and the spectrum of maraging steel powder CL50WS has a doublet and a sextet (ferritic phase) with a magnetic field distribution (Figure 3, right). Hyperfine parameters, the result of fitting using the MossWinn program, are presented in Table 5. The phase composition of both initial metal powders was confirmed by X-ray diffraction (XRD); the corresponding diffraction patterns are shown in Section 3.4.1.

3.3.2. Mössbauer Investigation of Surface Samples Manufactured from CL20ES Powder

For all samples (A–D) produced by selective laser melting, Mössbauer backscattering spectra were accumulated (CEMS and CXMS). The Mössbauer spectra for CXMS and CEMS are shown in Figure 4 and Figure 5, respectively. For CXMS, the depth of the layer with a thickness of 10 μm was studied, and for CEMS, the thickness of the studied layer was 0.3 μm. According to Figure 4, the FCC iron signal (austenitic phase) is clearly visible by CXMS examination of the samples. When studying samples using the CEMS method (Figure 5) on a thinner layer, we can observe, in addition to the austenitic phase, the iron oxide (sample B) and ferrite (sample D) phases. Hyperfine parameters, the result of fitting using the MossWinn program, are presented in Table 6. It is obvious that during the annealing of the non-sandblasted sample (sample B), intensive surface oxidation occurs, predominantly at the 0.3 μm depth. α-Fe2O3 was identified according to the fitting results (Table 6). Since α-Fe2O3 was not identified in the sandblasted and annealed sample (sample D), it probably predominantly oxidizes the surface of the initial particles welded to the surface (Figure 1).
Unexpected for us was the observation of the formation of a ferritic phase during the annealing of a sandblasted sample (Figure 5, sample D). The ferritic phase was observed only in the CEMS spectrum. The formation of this phase is not related to the SLM process itself, because the ferritic phase was not identified in the sandblasted and nonannealed sample (sample C). When the CEMS spectrum of sample D was fitted, a doublet was added, thus achieving better fit parameters. This subspectrum can be assigned to iron oxide according to the isomer shift value (IS = 0.29 ± 0.04 mm/s) [27]. The appearance of the BCC structure of iron (Figure 5) can be explained by the phenomenon of diffusion of iron and chromium atoms, due to an increase in temperature. At this temperature, chromium and iron atoms switch lattice sites with each other, resulting in a new ferritic phase [28]. To verify the occurrence of the BCC phase, a new sample was made from CL20ES stainless steel powder by the SLM method. The sample (sample DD) was sandblasted and annealed in air for 16 h at a temperature of 550 °C. The formation of the ferritic phase was confirmed by both CXMS and CEMS (Figure 6 and Table 6). XRD also confirmed the presence of this phase (Section 3.4.2).

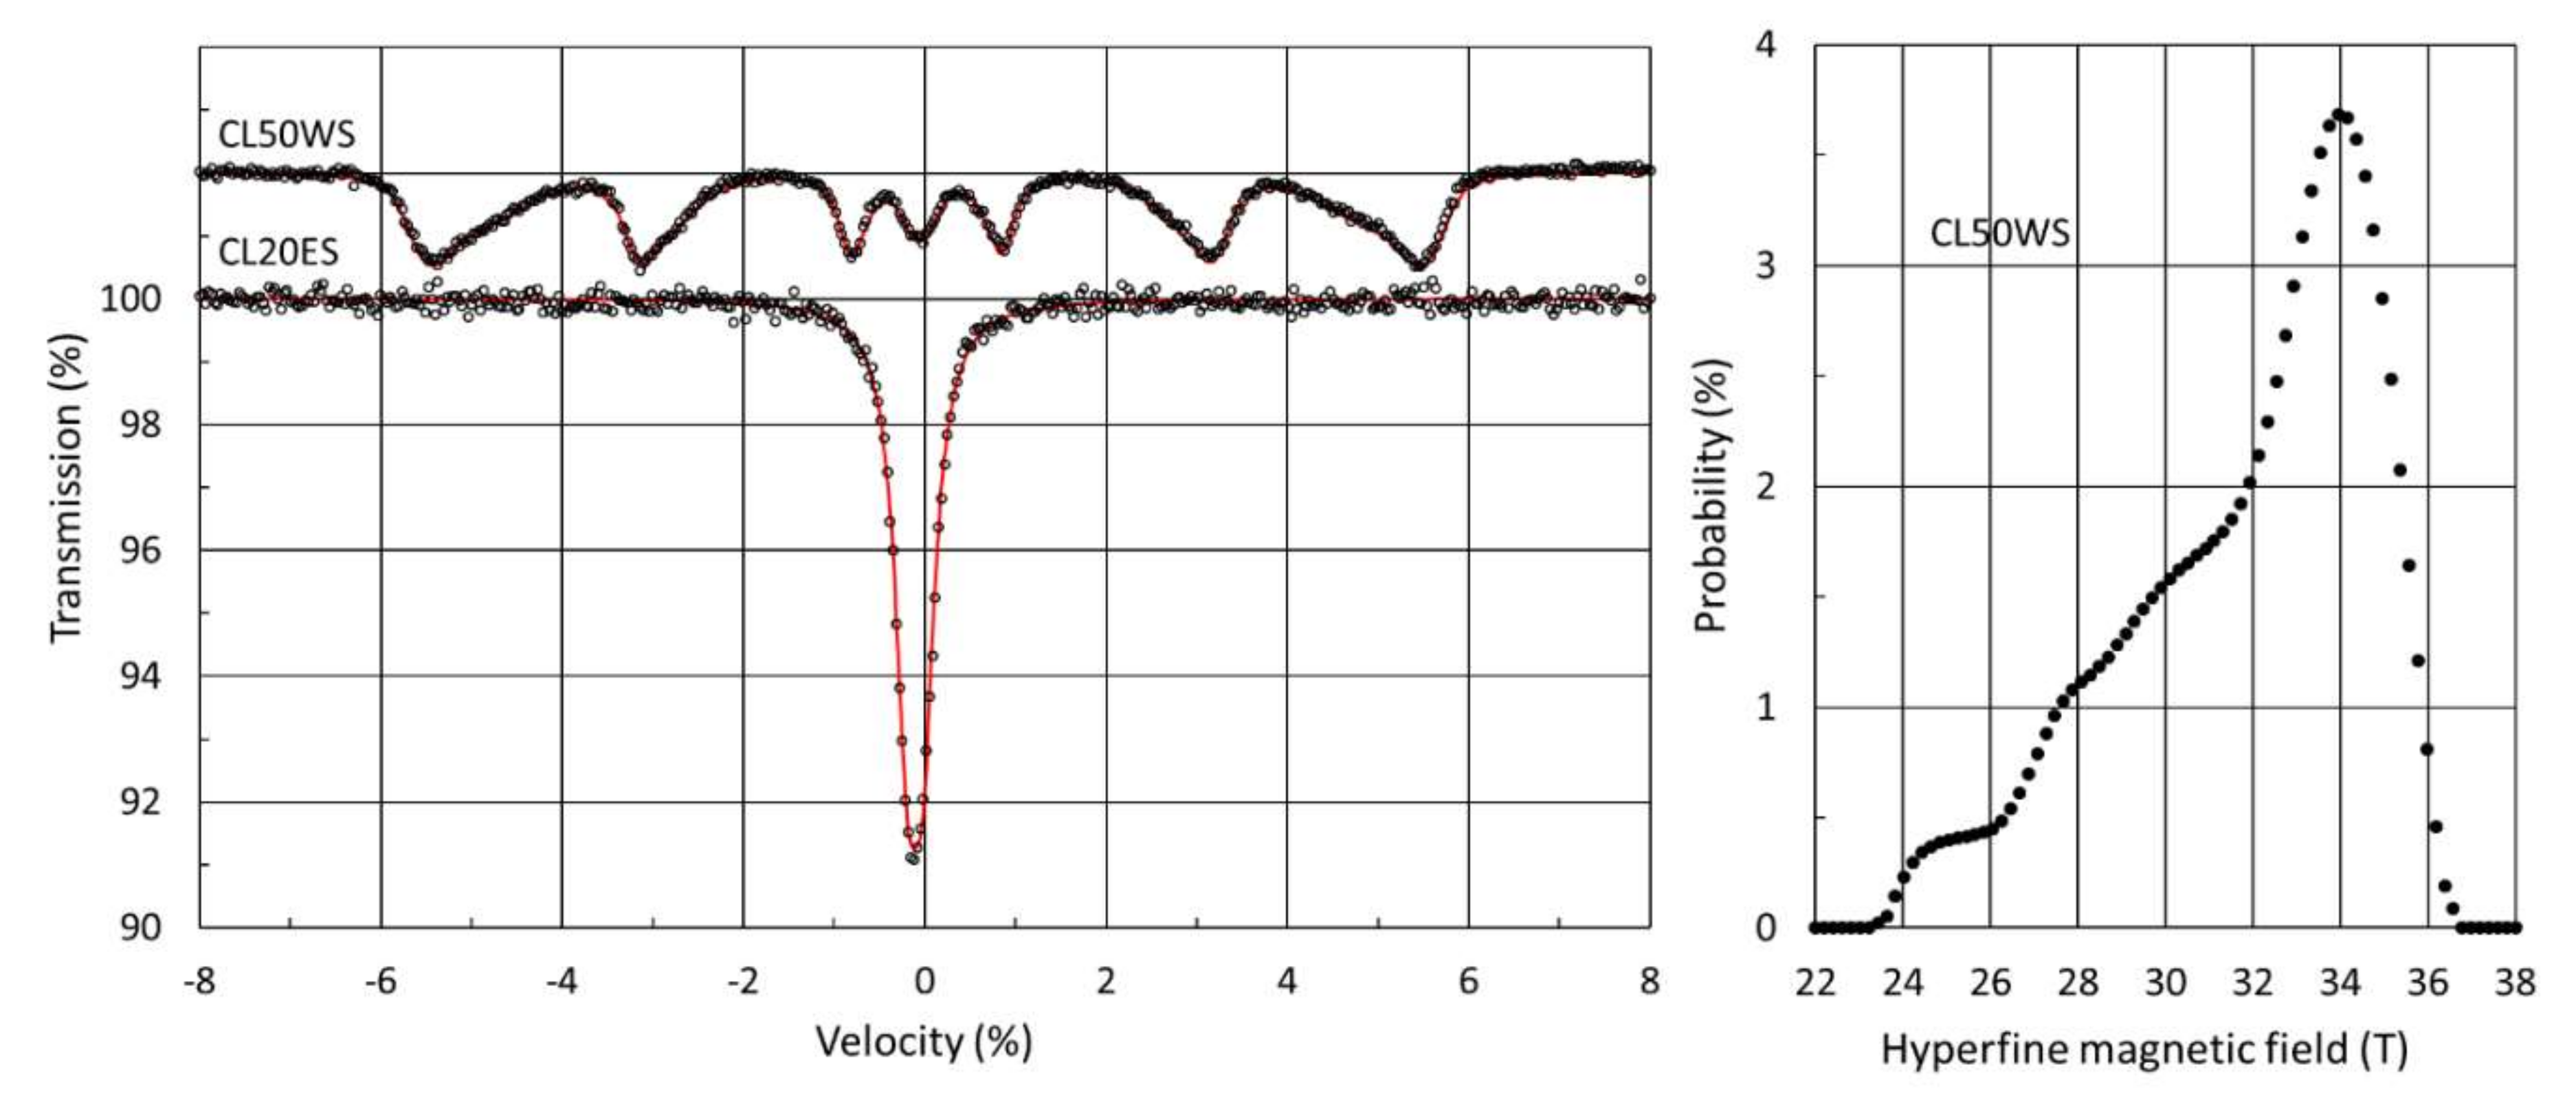
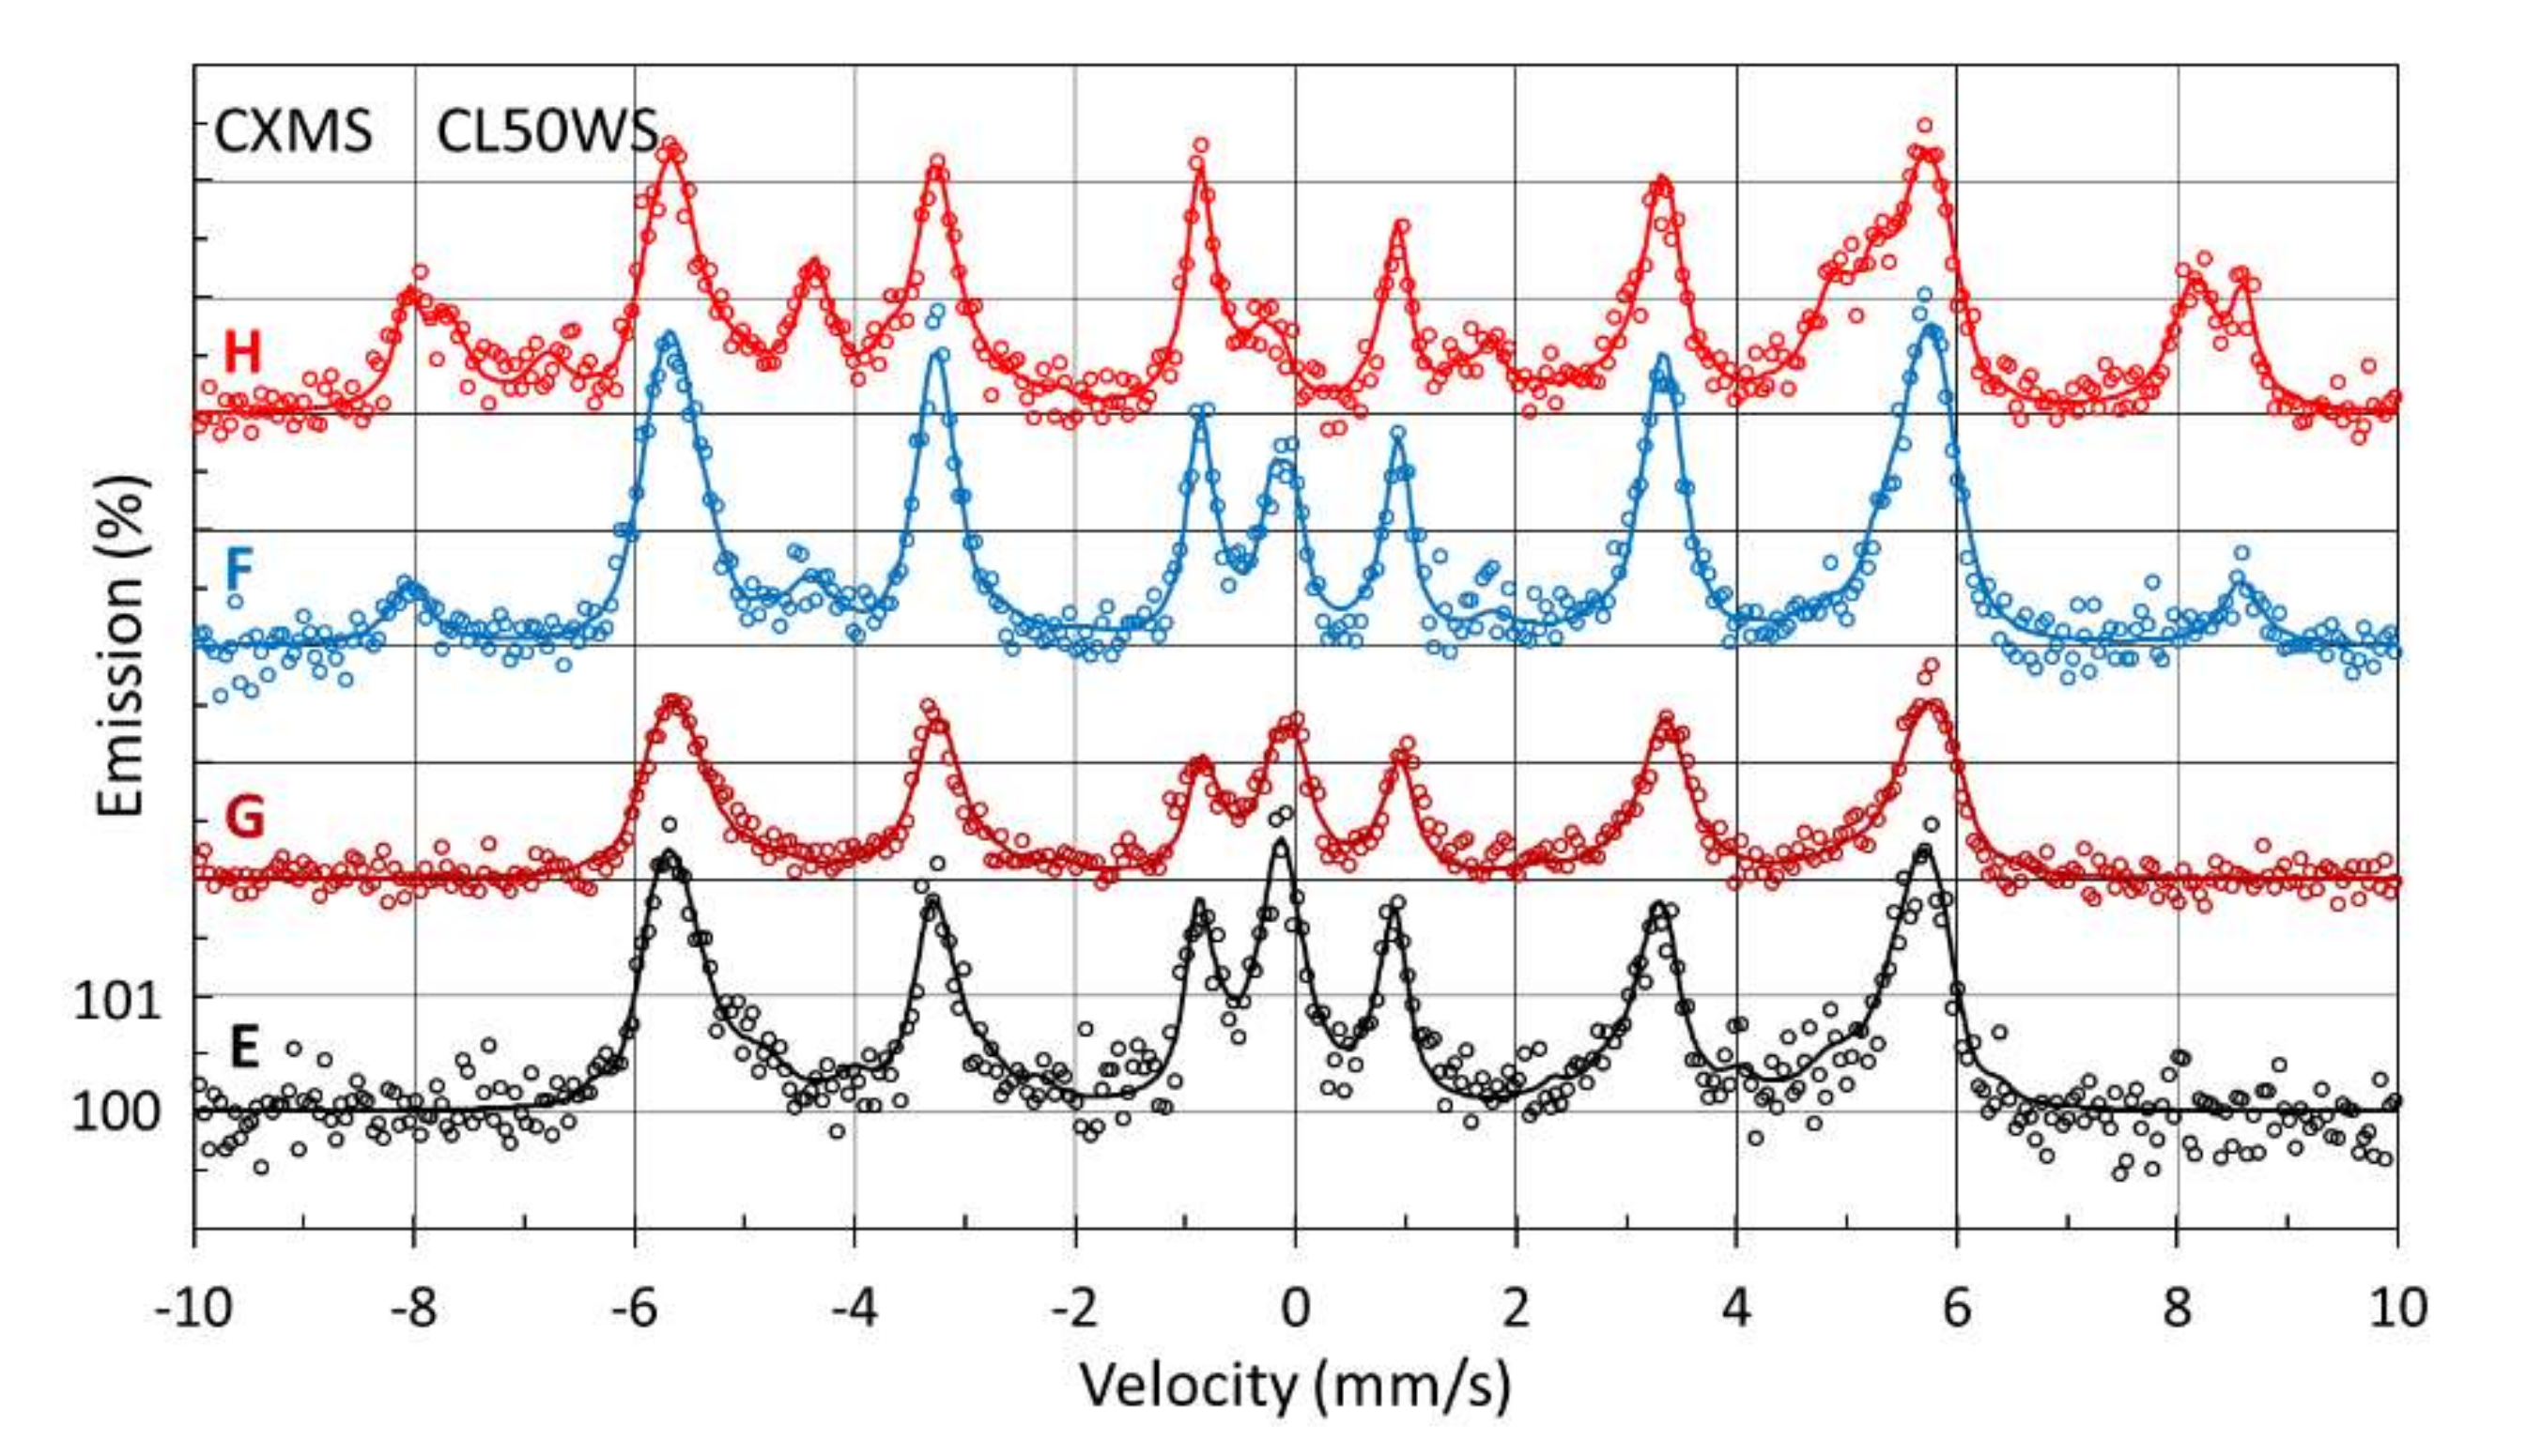
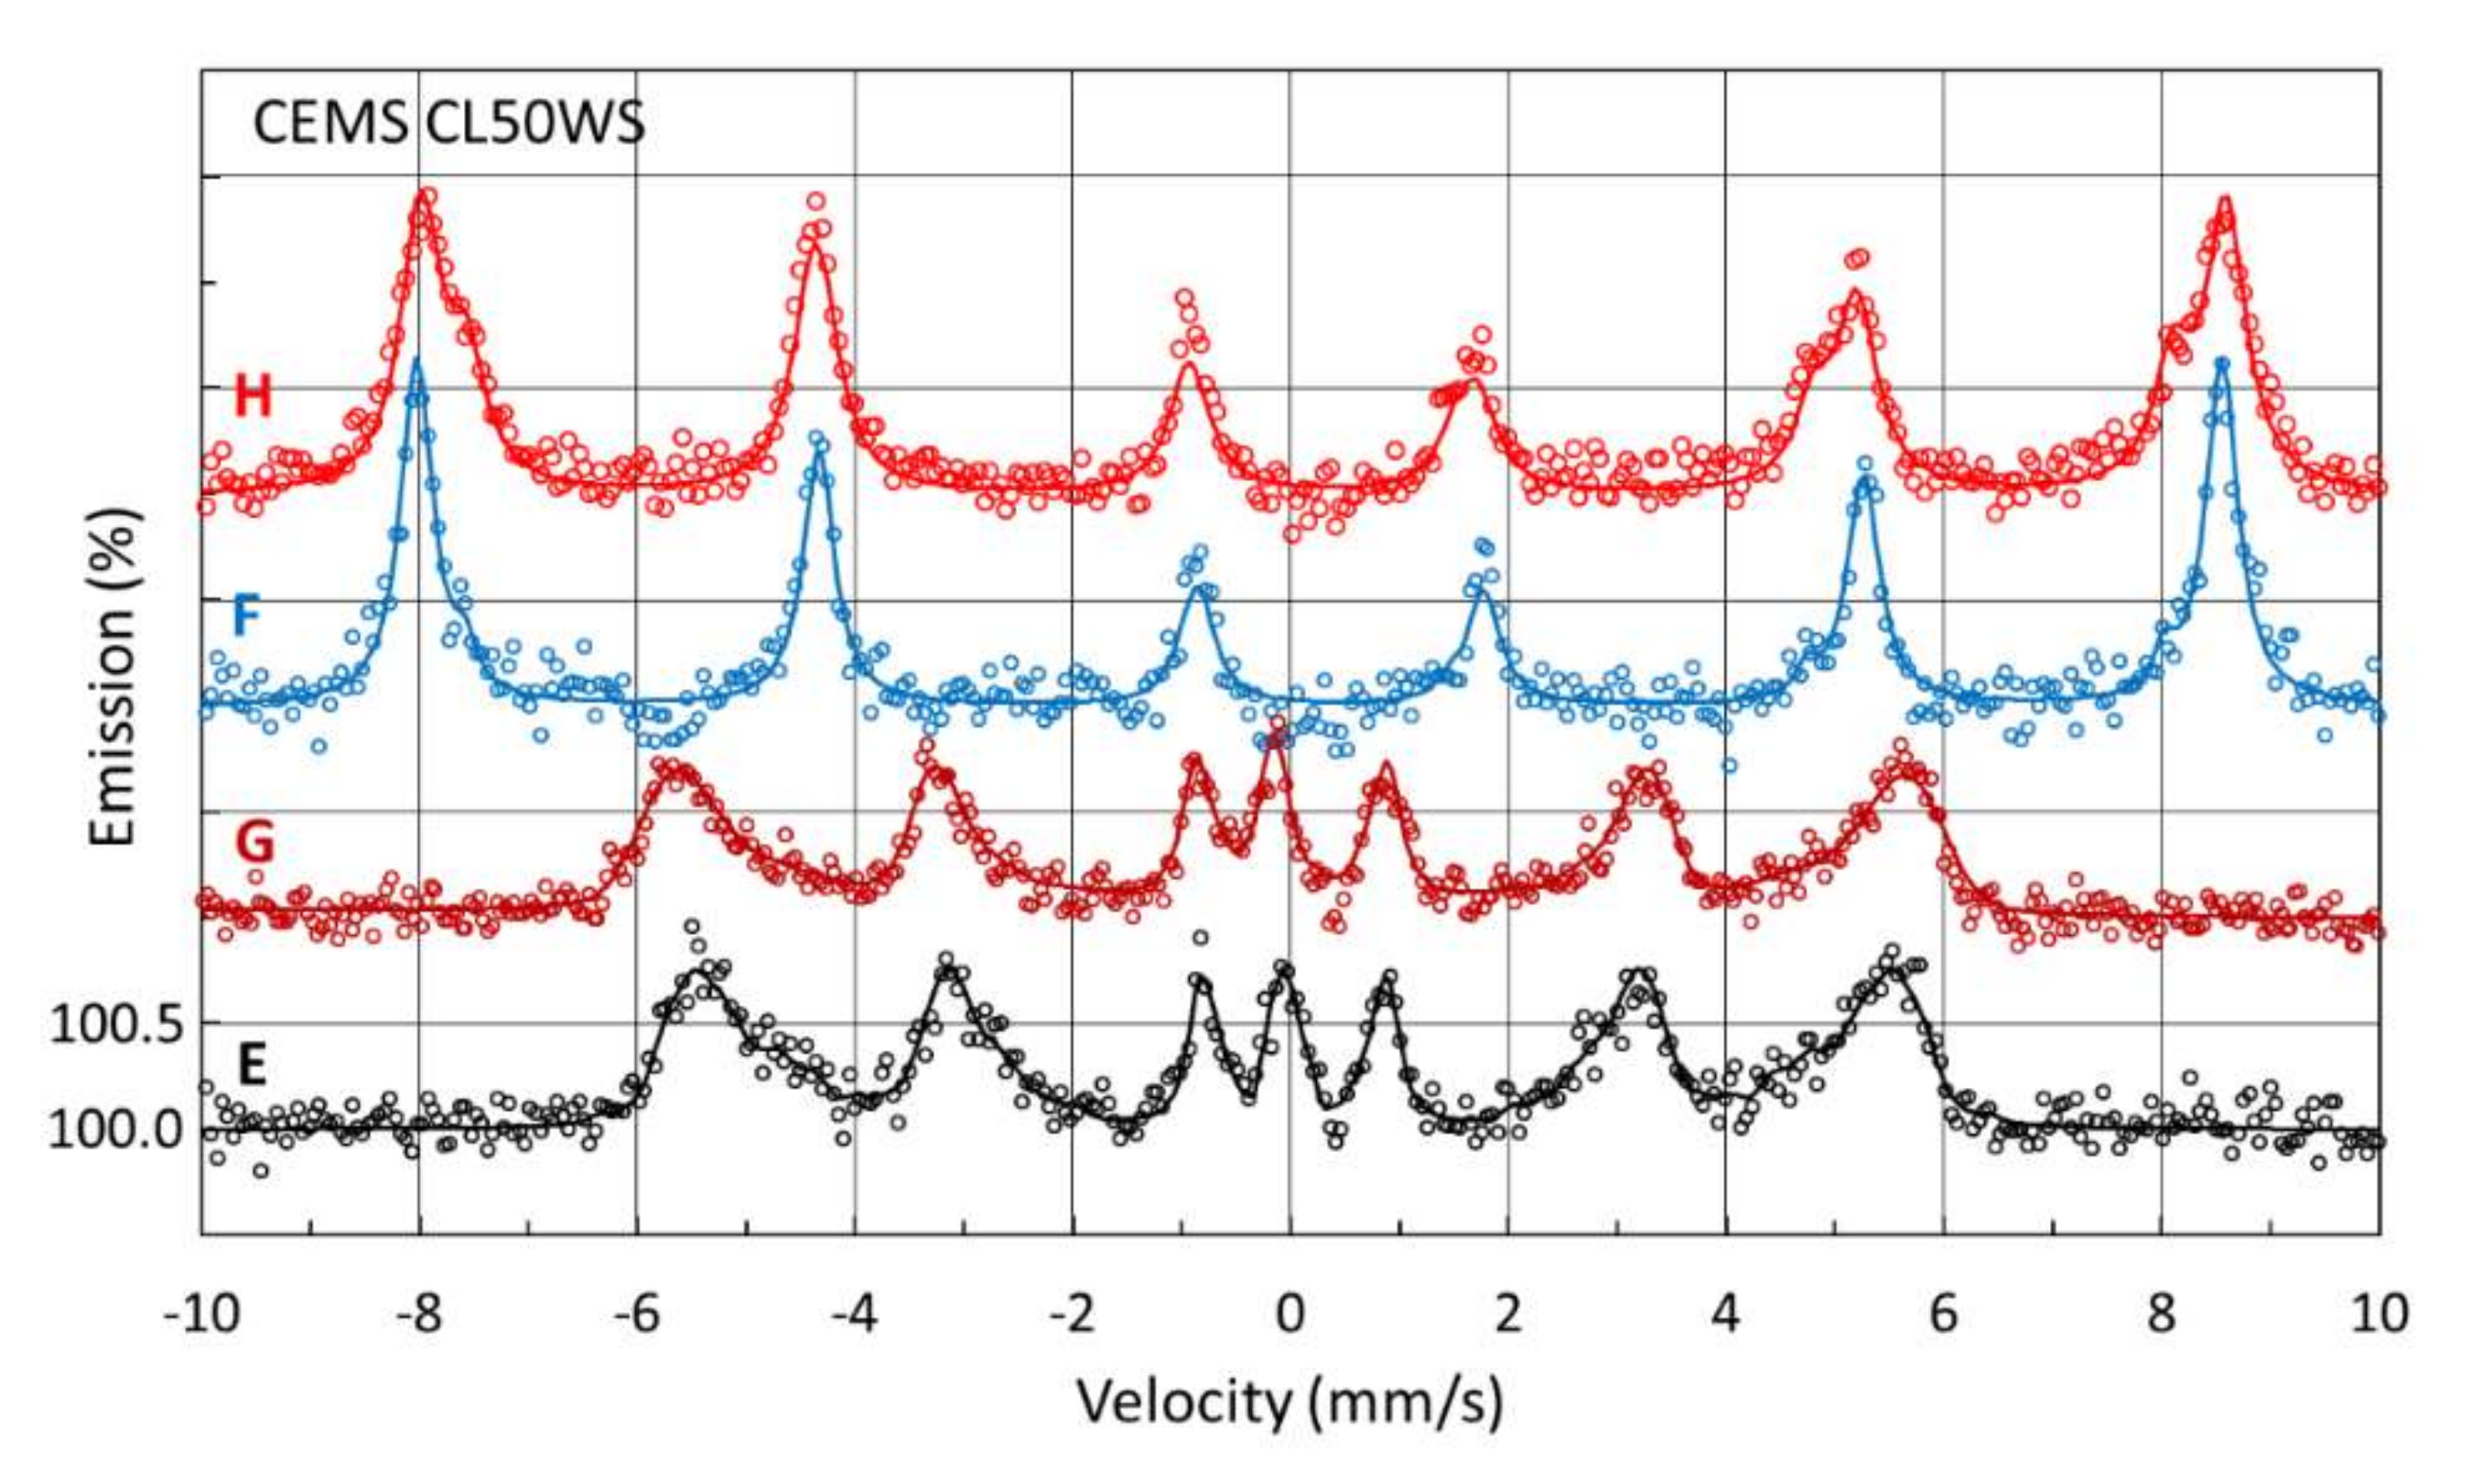
3.3.3. Mössbauer Investigation of Surface Samples Manufactured from CL50WS Powder

The CXMS and CEMS spectra of samples manufactured from CL50WS maraging steel powder, without post-process annealing (samples E and G in Figure 7 and Figure 8, Table 7), are similar to the transmission Mössbauer spectrum of the initial powder (Figure 3, Table 5), and are formed by superposition of both subspectra of austenitic and ferritic phases of maraging steel.
We see that annealing causes oxidation of the sample surface (samples F and H in Figure 7 and Figure 8, Table 7). At the same time, CEMS shows that the oxidation in the 0.3 μm surface layer is complete (Figure 8 samples F and H, Table 7). The CEMS spectra of samples F and H were fitted as a superposition of two subspectra, α-Fe2O3 and γ-Fe2O3 (Table 7). The α-Fe2O3 was identified in the CXMS spectrum of sample F simultaneously with the austenitic and ferritic phases of the maraging steel. In the CXMS spectrum of sample H, the α-Fe2O3 and Fe3O4 were identified. Furthermore, a change in the ratio of the austenitic-to-ferritic phase to 1:20 is observed in sample H. This ratio is close to 1:10 in the initial powder and in samples E and G. This fact may be related to the transformation of the austenitic phase to the ferritic phase, or to the different oxidation rates of the austenitic and ferritic phases.

3.4. X-ray Diffraction

3.4.1. X-ray Diffraction of Initial Powders

The XRD patterns of both initial powders are presented in Figure 9. Stainless steel (CL20ES) occurs only in an FCC structure corresponding to the austenitic phase (γ-Fe). The diffraction pattern of the maraging steel powder (CL50WS) shows the dominance of the BCC structure corresponding to the ferritic phase (α-Fe). The FCC structure is a minority. Quantitative analysis of the XRD pattern showed that the content of the FCC phase is 7 wt %, and that of the BCC phase is 93 wt %. The precision of the determination is 2%. The identified phase composition of both powders corresponds to the phase composition determined by Mössbauer spectroscopy (Table 5).

3.4.2. X-ray Diffraction of Samples Manufactured from CL20ES Powder

The XRD patterns of the samples (A—without sandblasting, C—with sandblasting) made of CL20ES stainless steel powder, without annealing, are presented in Figure 10. The patterns show that only the FCC structure corresponding to the austenitic phase was identified in both samples.
The XRD pattern of the sample without sandblasting and with annealing (sample B) shows that the FCC structure prevails in the sample (Figure 11). In the area of small diffraction angles, the presence of iron oxide (α-Fe2O3, Fe3O4) is probably visible. The presence of α-Fe2O3 was identified in the 0.3 μm depth layer of the surface by CEMS (Figure 5, Table 6). The XRD patterns of sample D, which was sandblasted after SLM manufacture, show the presence of a BCC structure that corresponds to the ferritic phase (Figure 12). This result corresponds to the identification of the ferritic phase by CEMS (Figure 5, Table 6). Iron oxide was also identified in sample D (Figure 12) as in sample B (Figure 11). The formation of the ferritic phase was also confirmed in a sample annealed at 550 °C for 16 h (Figure 13), which corresponds to the CEMS and CXMS results (Figure 6, Table 6). Table 8 summarizes the quantitative data of the XRD analysis.

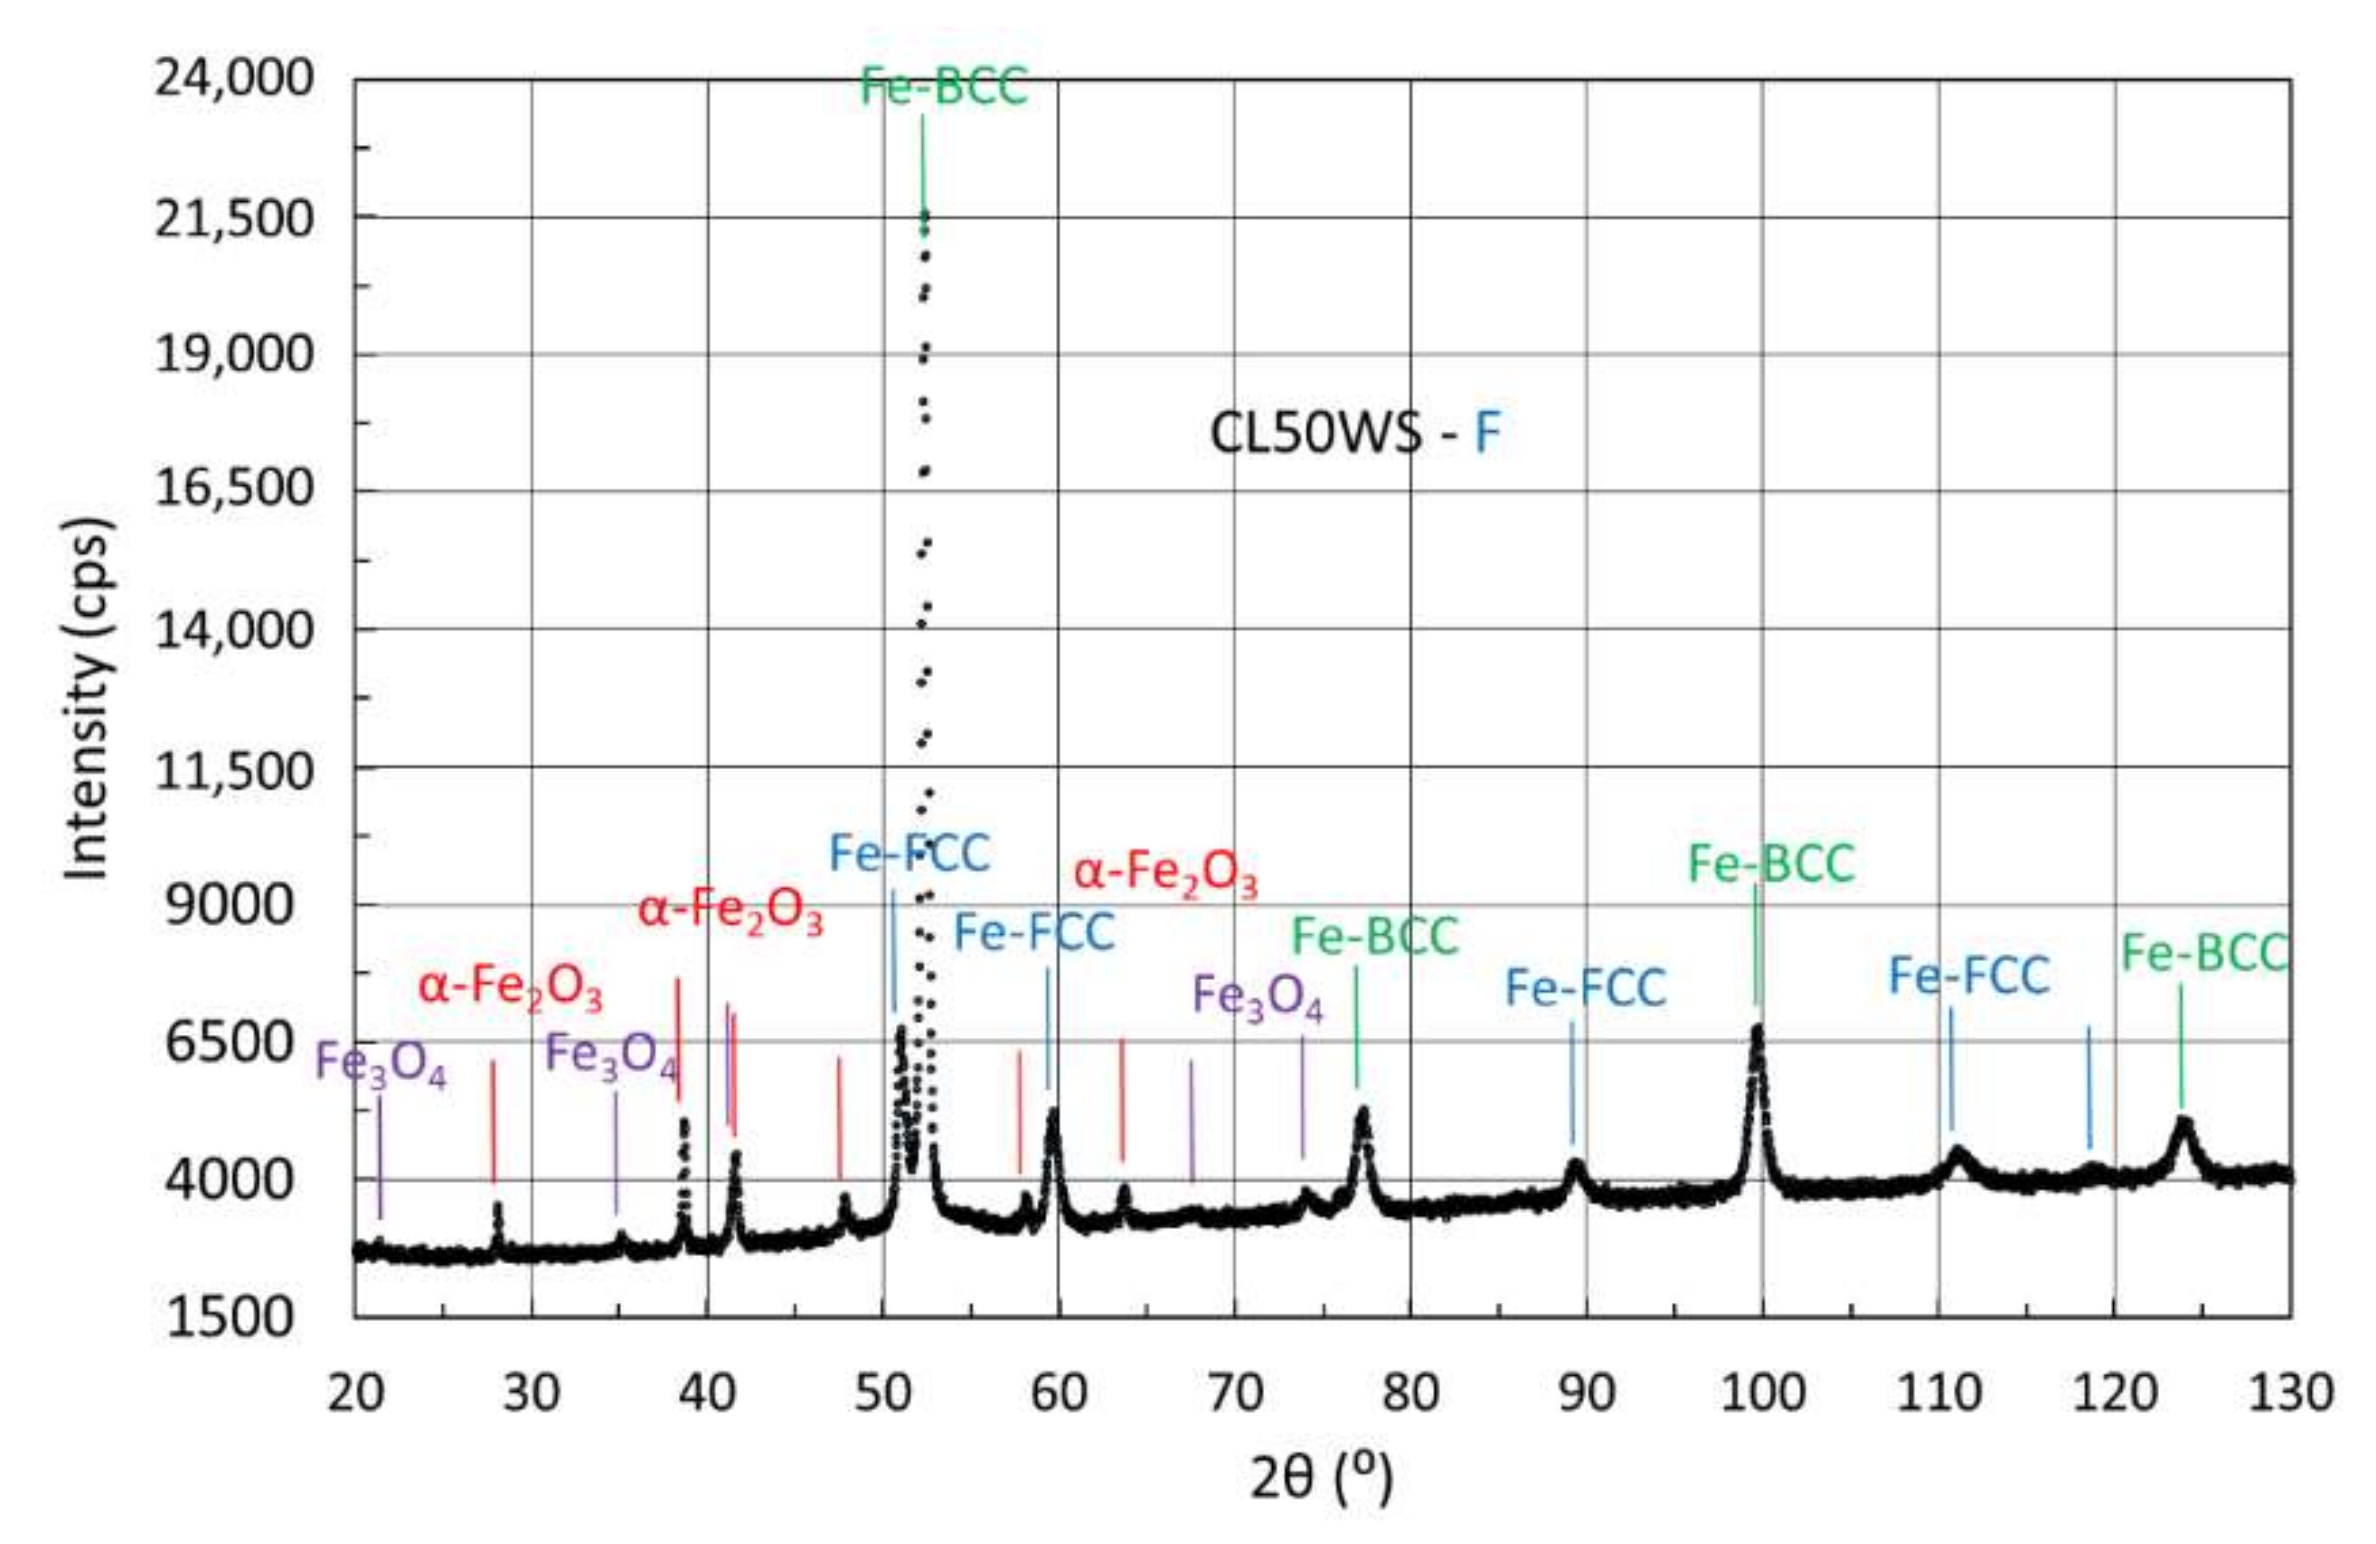
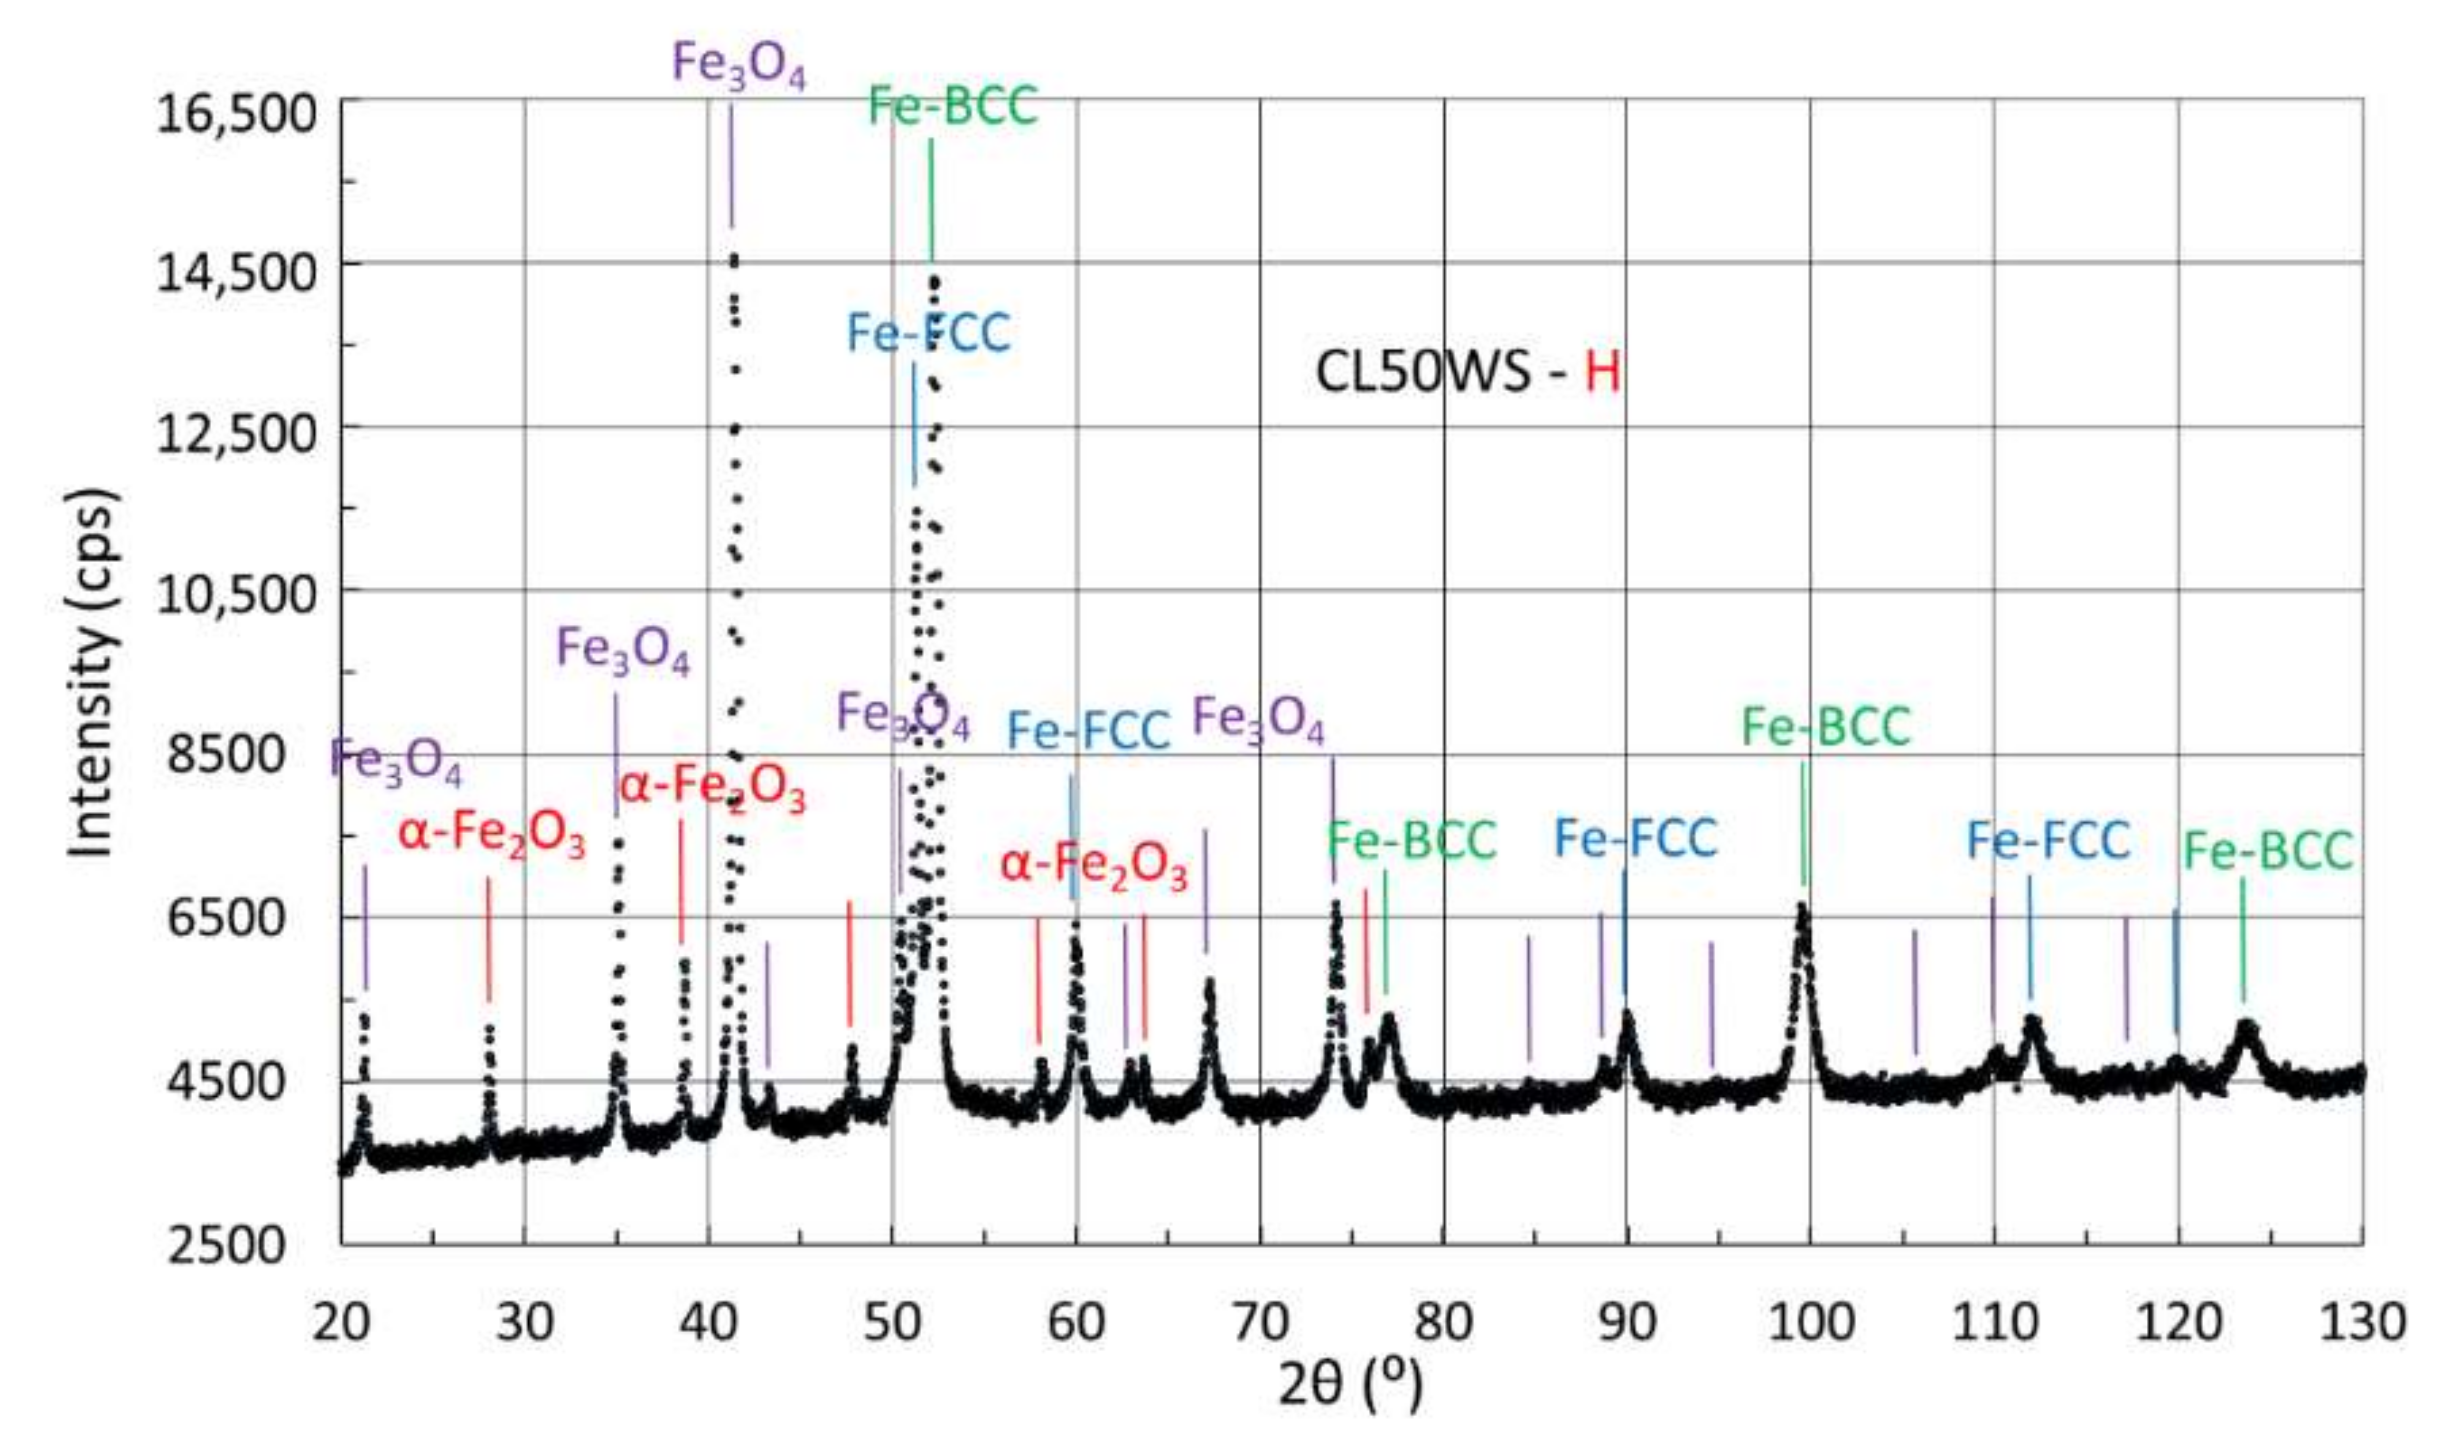
3.4.3. X-ray Diffraction of Samples Manufactured from CL50WS Powder

The XRD patterns of the samples (E–H) manufactured from CL50WS maraging steel powder show an alternation of the FCC and BCC structures with a predominance of the BCC structure, as shown in Figure 14, Figure 15 and Figure 16. Annealing (samples F and H) causes oxidation of the sample surface; iron oxides (α-Fe2O3 and Fe3O4) were identified in the XRD patterns (Figure 15 and Figure 16). The results obtained by X-ray diffraction correspond to the results of Mössbauer spectroscopy. The quantitative content of the identified phases is shown in Table 8.

4. Conclusions

SEM has shown that spherical particles of the initial powder are welded on the surface of the sample prepared by selective laser melting. Sandblasting completely removes these residues from the sample surface. The annealing of samples from both types of steels (CL20ES and CL50WS) in air leads to partial oxidation of their surface. A comparison of the results of CEMS and CXMS measurements shows the depth dependence of surface oxidation on samples made of CL50WS steel. CEMS identified α-Fe2O3 and γ-Fe2O3 (complete oxidation of the layer 0.3 μm), but CXMS also identified austenitic (FCC) and ferritic (BCC) phases, and Fe3O4 at a depth of 10 μm depth. In the case of stainless steel (CL20ES), an oxidation (α-Fe2O3) was identified by CEMS only in the sample that was not sandblasted prior to annealing. Apparently, only residues of the starting powder material oxidize. A comparison of the CEMS and CXMS spectra shows the transformation of the austenitic phase to the ferritic phase in the case of annealing of a sandblasted CL20ES sample. However, it occurs only in the 0.3 μm surface layer. The ratio of austenitic-to-ferritic phases in stainless steel is known to depend on the concentration of equivalent elements of chromium and nickel [29]. The Schaeffler diagram [30] determines the type of stainless steel. The concentrations of equivalent chromium and nickel elements in the 0.3 μm surface layer of CL20ES stainless steel after annealing (sample D) were approximately 23% and 10%, respectively (Table 3). The ferritic-to-austenitic phase ratio determined by CEMS was 32:56 (Table 6), which corresponds to a ferritic phase content of about 36%. This result is in accordance with the Schaeffler diagram for stainless steels (Figure 17). Austenitic stainless steel is transformed in a 0.3 μm surface layer into duplex stainless steel by annealing at 550 °C. This transformation occurs in a thin surface layer, which is allowed to observe CEMS, but is either not visible or poorly observable by other methods. Oxidation processes and phase transformations observed by Mössbauer spectroscopy were partially confirmed by XRD. However, CXMS and XRD, unlike CEMS, provide information from depths 10–100 times greater than CEMS. Conversion electron Mössbauer spectroscopy is a unique method used to determine the phase composition of thin surface layers, which may be important for the additional nanotechological surface treatment of steel parts.

Author Contributions

Conceptualization, M.M. and T.I. (Tatiana Ivanova); data curation, M.M., T.I. (Tomáš Ingr) and T.I. (Tatiana Ivanova); formal analysis, M.M., T.I. (Tatiana Ivanova) and D.S.; sample preparation, H.D. and A.S.; methodology, M.M., D.S., T.I. (Tomáš Ingr) and T.I. (Tatiana Ivanova); project administration, M.M.; resources, M.M.; validation, D.S., M.M., T.I. (Tomáš Ingr) and T.I. (Tatiana Ivanova); writing—original draft, T.I. (Tatiana Ivanova) and M.M.; writing—review and editing, T.I. (Tomáš Ingr), D.S., A.S. and H.D. All authors have read and agreed to the published version of the manuscript.

Funding

This research was funded by an internal IGA grant of Palacký University (IGA_PrF_2021_003) and the Czech Ministry of Education, Youth and Sports, grant number CZ.02.1.01/0.0/0.0/17_049/0008408.

Institutional Review Board Statement

Not applicable.

Informed Consent Statement

Not applicable.

Data Availability Statement

Publicly available datasets were analyzed in this study. This data can be found here: https://uloz.to/tam/aef5ee52-6ae6-4c02-9166-4e648f2c816c.

Conflicts of Interest

The authors declare no conflict of interest. The funders had no role in the design of the study; in the collection, analyses, or interpretation of data; in the writing of the manuscript, or in the decision to publish the results.

References

  1. Alkahari, M.R.; Furumoto, T.; Ueda, T.; Hosokava, A.; Tanaka, R.; Aziz, M.S.A. Thermal conductivity of metal powder and con-solidated material fabricated via selective laser melting. Key Eng. Mater. 2012, 523–524, 244–249. [Google Scholar] [CrossRef] [Green Version]
  2. Kruth, J.P.; Froyen, L.; Van Vaerenbergh, J.; Mercelis, P.; Rombouts, M.; Lauwers, B. Selective laser melting of iron-based powder. J. Mater. Process. Technol. 2004, 149, 616–622. [Google Scholar] [CrossRef]
  3. Yadroitsev, I.; Smurov, I. Surface Morphology in selective laser melting of metal powders. Phys. Procedia 2011, 12, 264–270. [Google Scholar] [CrossRef] [Green Version]
  4. Murr, L.E.; Gaytan, S.M.; Ramirez, D.A.; Martinez, E.; Hernandez, J.; Amato, K.N.; Shindo, P.W.; Medina, F.R.; Wicker, R.B. Metal fabrication by additive manufacturing using laser and electron beam melting technologies. J. Mater. Sci. Technol. 2012, 28, 1–14. [Google Scholar] [CrossRef]
  5. Gunasekaran, J.; Sevvel, P.; Solomon, I.J. Metallic materials fabrication by selective laser melting: A review. Mater. Today Proc. 2021, 37, 252–256. [Google Scholar] [CrossRef]
  6. Laskin, A.; Faidel, D.; Laskin, V. Optics to control thermal effects in selective laser melting. In Laser 3D Manufacturing V; SPIE: San Francisco, CA, USA, 2018; Volume 10523. [Google Scholar] [CrossRef]
  7. Thombansen, U.; Gatej, A.; Pereira, M. Process observation in fiber laser-based selective laser melting. Opt. Eng. 2015, 54, 011008. [Google Scholar] [CrossRef] [Green Version]
  8. West, C.; Wang, X. Modeling of selective laser sintering/selective laser melting. Proceeding SPIE 2017, 10095, 6. [Google Scholar] [CrossRef]
  9. Principi, G. The Mössbauer Effect: A Romantic Scientific Page. Metals 2020, 10, 992. [Google Scholar] [CrossRef]
  10. Mashlan, M.; Linderhof, F.; Davidova, M.; Kubickova, H.; Zemtsova, E. Changes of phase composition of maraging steel 1.2709 during selective laser melting. Hyperfine Interact. 2019, 241, 11. [Google Scholar] [CrossRef]
  11. Tyczynski, P.; Siemiatkowski, Z.; Bak, P.; Warzocha, K.; Rucki, M.; Szumiata, T. Performance of Maraging Steel Sleeves Produced by SLM with Subsequent Age Hardening. Materials 2020, 13, 3408. [Google Scholar] [CrossRef]
  12. Gainov, R.R.; Faidel, D.; Behr, W.; Natour, G.; Pauly, F.; Willms, H.; Vagizov, F.G. Investigation of LPBF A800H steel parts using Computed Tomography and Mössbauer spectroscopy. Addit. Manuf. 2020, 32, 101035. [Google Scholar] [CrossRef]
  13. Linderhof, F.; Mashlan, M.; Doláková, H.; Ingr, T.; Ivanova, T. Surface Micromorphology and Structure of Stainless and Maraging Steel Obtained via Selective Laser Melting: A Mössbauer Spectroscopy Study. Metals 2021, 11, 1028. [Google Scholar] [CrossRef]
  14. Garbucicchio, M.; Palombarini, G. Surface structures produced in 1C-1.5Cr and 0.38C-Ni-Cr-Mo steels by high-power CO2 laser processing. J. Mater. Sci. 1986, 21, 75–82. [Google Scholar] [CrossRef]
  15. Afanasieva, L.E.; Ratkevich, G.V.; Ivanova, A.I.; Novoselova, M.V.; Zorenko, D.A. On the Surface Micromorphology and Structure of Stainless Steel Obtained via Selective Laser Melting. J. Surf. Investig. X-Ray Synchrotron Neutron Tech. 2018, 12, 1082–1087. [Google Scholar] [CrossRef]
  16. Kale, A.B.; Kim, B.K.; Kim, D.I.; Castle, E.G.; Reece, M.; Choi, S.H. An investigation of the corrosion behavior of 316L stainless steel fabricated by SLM and SPS techniques. Mater. Charact. 2020, 163, 110204. [Google Scholar] [CrossRef]
  17. Pechousek, J.; Mashlan, M. Mössbauer spectrometer as a virtual instrument in the PXI/Compact PCI modular systém. Czech. J. Phys. 2005, 55, 853–863. [Google Scholar] [CrossRef]
  18. Kholmetskii, A.L.; Misevich, O.V.; Mashlan, M.; Chudakov, V.A.; Anashkevich, A.F.; Gurachevskii, V.L. Air scintillation detector for conversion electrons Mössbauer spectroscopy (CEMS). Nucl. Instrum. Methods Phys. Res. Sect. B Beam Interact. Mater. At. 1997, 129, 110–116. [Google Scholar] [CrossRef]
  19. Klencsár, Z.; Kuzmann, E.; Vértes, A. User-friendly software for Mössbauer spectrum analysis. J. Radioanal. Nucl. Chem. Arctic. 1996, 210, 105–118. [Google Scholar] [CrossRef]
  20. Klencsár, Z.; Kuzmann, E.; Vértes, A. User-Friendly Program for Multifold Evaluation of Mössbauer Spectra. Hyperfine Interact. 1998, 112, 269–274. [Google Scholar] [CrossRef]
  21. Peckner, D.; Bernstein, I.M. Handbook of Stainless Steels; McGraw Hill: New York, NY, USA, 1977. [Google Scholar]
  22. Lacombe, P.; Baroux, B.; Beranger, G. Stainless Steels; Les Edition de Physique: Les Ulis, France, 1993. [Google Scholar]
  23. Lippold, J.C.; Kotecki, D.J. Welding Metallurgy and Weldability of Stainless Steels; John Wiley & Sons: Hoboken, NJ, USA, 2005. [Google Scholar]
  24. Castaing, R. Application des Sondes Electronique a Une Methode D’Analyse Ponctuelle Chimique et Cristallographique. Ph.D. Thesis, University of Paris, Paris, France, 1952. [Google Scholar]
  25. Cook, D.C. Strain induced martensite formation in stainless steel Metall. Mater. Trans. A 1987, 18, 201–210. [Google Scholar] [CrossRef]
  26. Shabashov, V.A.; Gavrilov, N.V.; Kozlov, K.A.; Makarov, A.V.; Titova, S.G.; Voronin, V.I. Structure of the Surface Layers of Metastable Austenitic Stainless Steel Nitriden in Electron Beam Plasma. Phys. Met. Metallogr. 2018, 119, 755–763. [Google Scholar]
  27. Machala, L.; Tuček, J.; Zbořil, R. Polymorphous Transformations of Nanometric Iron(III) Oxide: A Review. Chem. Mater. 2011, 23, 3255–3272. [Google Scholar] [CrossRef]
  28. Boniardi, M.; Casaroli, A. Stainless Steels; Gruppo Lucefin: Esine, Italy, 2014. [Google Scholar]
  29. Kraus, G. Steels Processing, Structure, and Performance, 2nd ed.; ASM International, Materials Park: Russell Township, OH, USA, 2015; 705p. [Google Scholar]
  30. Schaeffler, A. Constitution Diagram for Stainless Steel Weld Metal. Metal Prog. 1949, 56, 680. [Google Scholar]
Figure 1. SEM images of CL20ES specimens under different conditions.
Metals 12 00551 g001
Figure 2. SEM images of CL50WS specimens under different conditions.
Metals 12 00551 g002
Figure 3. Transmission Mössbauer spectra of CL20ES and CL50WS powders (left); hyperfine magnetic field distribution of α-phase in CL50WS powders (right).
Metals 12 00551 g003
Figure 4. Conversion X-ray Mössbauer spectra of samples made of stainless steel powder CL20ES.
Metals 12 00551 g004
Figure 5. Conversion electron Mössbauer spectra of samples made of stainless steel powder CL20ES.
Metals 12 00551 g005
Figure 6. CXMS (left) and CEMS (right) spectra of sample sandblasted and annealed for 16 h (sample DD).
Metals 12 00551 g006
Figure 7. Conversion X-ray Mössbauer spectra of samples made of maraging steel powder CL50WS.
Metals 12 00551 g007
Figure 8. Conversion electron Mössbauer spectra of samples made of maraging steel powder CL50WS.
Metals 12 00551 g008
Figure 9. X-ray diffraction patterns of CL20ES (left) and CL50WS (right) initial metal powders.
Metals 12 00551 g009
Figure 10. X-ray diffraction patterns of samples A and C made of stainless steel powder CL20ES: A—without sandblasting and without annealing; C—with sandblasting and without annealing.
Metals 12 00551 g010
Figure 11. X-ray diffraction pattern of sample B made of stainless steel powder CL20ES: without sandblasting and with annealing.
Metals 12 00551 g011
Figure 12. X-ray diffraction pattern of sample D made of stainless steel powder CL20ES: with sandblasting and with annealing.
Metals 12 00551 g012
Figure 13. X-ray diffraction pattern of the sandblasted sample CL20ES after 16 h of annealing in air at a temperature of 550 °C.
Metals 12 00551 g013
Figure 14. X-ray diffraction patterns of samples E and G made of maraging steel powder CL50WS: E—without sandblasting and without annealing; G—with sandblasting and without annealing.
Metals 12 00551 g014
Figure 15. X-ray diffraction pattern of sample F made of maraging steel powder CL50WS: without sandblasting and with annealing.
Metals 12 00551 g015
Figure 16. X-ray diffraction pattern of sample H made of maraging steel powder CL50WS: with sandblasting and with annealing.
Metals 12 00551 g016
Figure 17. Schaeffler diagram of stainless steels (adapted from [28]), sample C, and sample D.
Metals 12 00551 g017
Table 1. Chemical composition of metal powders (material data Concept Laser GmbH).
Steel PowderElement Concentration (wt %)
FeCSiMnPSCrMoNiTiCo
CL20ESBal≤ 0.030–1.00–2.0≤ 0.045≤ 0.0316.5–18.52.0–2.510.0–13.0--
CL50WSBal≤ 0.03≤ 0.1≤ 0.15≤ 0.01≤ 0.01≤ 0.254.5–5.217.0–9.00.8–1.28.5–10.0
Table 2. Identification of samples.
MaterialWithout Sandblasting and Without AnnealingWithout Sandblasting and With AnnealingWith Sandblasting and Without AnnealingWith Sandblasting and With Annealing
CL20ESSample ASample BSample CSample D
CL50WSSample ESample FSample GSample H
Table 3. Elemental composition of CL20ES samples.
SampleAccelerating Voltage 11 kVAccelerating Voltage 20 kV
Fe (%)Cr (%)Ni (%)Other (%)Fe (%)Cr (%)Ni (%)Other (%)
C66 ± 218 ± 112 ± 14 ± 166 ± 218 ± 112 ± 14 ± 1
D63 ± 223 ± 110 ± 14 ± 166 ± 217 ± 113 ± 14 ± 1
Table 4. Elemental composition of CL50WS samples.
SampleAccelerating Voltage 11 kVAccelerating Voltage 20 kV
Fe (%)Ni (%)Co (%)Mo (%)Ti (%)Fe (%)Ni (%)Co (%)Mo (%)Ti (%)
G65 ± 218 ± 19 ± 14 ± 14 ± 165 ± 217 ± 19 ± 15 ± 14 ± 1
H80 ± 21 ± 118 ± 10.5 ± 10.5 ± 190 ± 21 ± 18 ± 10.5 ± 10.5 ± 1
Table 5. Parameters of transmission Mössbauer spectra of CL20ES and CL50WS metal powders (IS—isomer shift, QS—quadrupole splitting, FWHM—full width at half maximum, B—hyperfine magnetic field, A—spectrum area).
PowderPhaseIS (mm/s)QS (mm/s)FWHM (mm/s)B (T)A (%)
CL20ESFCC−0.11 ± 0.010.18 ± 0.010.32 ± 0.01-100
CL50WSFCC−0.06 ± 0.010.16 ± 0.020.34 ± 0.02-8 ± 2
BCC0.02 ± 0.01-0.27 ± 0.0131.7 *92 ± 2
* distribution of hyperfine magnetic field.
Table 6. Parameters of CXMS and CEMS for samples made by CL20ES powder.
MethodSamplePhaseIS (mm/s)QS (mm/s)W (mm/s)B (T)A (%)
CXMSAFCC−0.13 ± 0.010.17 ± 0.010.28 ± 0.01-100
BFCC−0.13 ± 0.010.18 ± 0.010.29 ± 0.01-100
CFCC−0.14 ± 0.010.17 ± 0.010.30 ± 0.01-100
DFCC−0.13 ± 0.010.17 ± 0.010.31 ± 0.01-100
DDFCC−0.11 ± 0.010.16 ± 0.01 0.28 ± 0.01-95 ± 2
BCC−0.06 ± 0.04-0.37 ± 0.1034.3 ± 0.55 ± 2
CEMSAFCC−0.12 ± 0.010.15 ± 0.010.25 ± 0.01-100
BFCC−0.09 ± 0.010.09 ± 0.020.27 ± 0.02-39 ± 2
α-Fe2O30.37 ± 0.01−0.18 ± 0.020.47 ± 0.0251.2 ± 0.561 ± 2
CFCC−0.11 ± 0.010.17 ± 0.010.27 ± 0.01-100
DFCC−0.08 ± 0.010.13 ± 0.010.27 ± 0.01-56 ± 2
BCC0.00 ± 0.02-0.56 ± 0.0633.3 ± 0.532 ± 2
doublet0.29 ±0.040.97 ± 0.050.39 ± 0.06-12 ± 2
DDFCC−0.10 ± 0.010.06 ± 0.080.35 ± 0.02-39 ± 2
BCC−0.03 ± 0.03-0.77 ± 0.0833.8 ± 0.550 ± 2
doublet0.36 ± 0.030.95 ± 0.040.29 ± 0.04-11 ± 2
Table 7. Parameters of CXMS and CEMS for samples made by CL50WS powder.
MethodSamplePhaseIS (mm/s)QS (mm/s)W (mm/s)B (T)A (%)
CXMSEFCC−0.07 ± 0.010.12 ± 0.010.27 ± 0.02-8 ± 2
BCC0.05 ± 0.01-0.23 ± 0.0231.5 *92 ± 2
FFCC−0.12 ± 0.010.18 ± 0.020.27 ± 0.04-8 ± 2
BCC0.03 ± 0.01-0.25 ± 0.0134.4 *80 ± 2
α-Fe2O30.35 ± 0.01−0.17 ± 0.040.43 ± 0.0651.6 ± 0.512 ± 2
GFCC−0.11 ± 0.010.19 ± 0.030.36 ± 0.04-12 ± 2
BCC0.02 ± 0.01-0.29 ± 0.0231.9 *88 ± 2
HFCC−0.13 ± 0.030.16 ± 0.040.29 ± 0.03-3 ± 2
BCC0.03 ± 0.01-0.22 ± 0.0233.9 *61 ± 2
α-Fe2O30.36 ± 0.01−0.18 ± 0.020.28 ± 0.0451.7 ± 0.512 ± 2
T-Fe3O40.25 ± 0.02-0.44 ± 0.0749.4 ± 0.515 ± 2
O-Fe3O40.64 ± 0.03-0.48 ± 0.1046.2 ± 0.59 ± 2
CEMSEFCC−0.07 ± 0.020.11 ± 0.080.24 ± 0.08-7 ± 2
BCC0.03 ± 0.01-0.22 ± 0.0231.9 *93 ± 2
Fα-Fe2O30.36 ± 0.01−0.20 ± 0.010.36 ± 0.0151.6 ± 0.593 ± 2
γ-Fe2O30.22 ± 0.02-0.24 ± 0.0748.5 ± 0.57 ± 2
GFCC−0.14 ± 0.020.11 ± 0.040.29 ± 0.03-8 ± 2
BCC0.01 ± 0.01-0.23 ± 0.0231.4 *92 ± 2
Hα-Fe2O30.35 ± 0.01−0.10 ± 0.010.45 ± 0.0251.5 ± 0.573 ± 2
γ-Fe2O30.27 ± 0.01-0.40 ± 0.0348.7 ± 0.527 ± 2
* distribution of hyperfine magnetic field.
Table 8. Results of quantitative XRD analysis (uncertainty 2%).
PowderSampleFCC (%)BCC (%)Oxides (%)
CL20ESA100--
B97-3
C100--
D9334
DD74719
CL50WSE595-
F246115
G2278-
H204535
Publisher’s Note: MDPI stays neutral with regard to jurisdictional claims in published maps and institutional affiliations.

