Article

Multiphysics Numerical Simulation of the Transient Forming Mechanism of Magnetic Pulse Welding

1
School of Material Science and Engineering, Taiyuan University of Science and Technology, 66 Waliu Road, Taiyuan 030024, China
2
Shanxi Electronic Science and Technology Institute (Preparatory), Linfen 041000, China
*
Author to whom correspondence should be addressed.
Metals 2022, 12(7), 1149; https://doi.org/10.3390/met12071149
Submission received: 6 June 2022 / Revised: 30 June 2022 / Accepted: 3 July 2022 / Published: 6 July 2022

Abstract

:
Magnetic pulse welding (MPW) is widely used in the connection of dissimilar metals. The welding process involves the coupling of the electromagnetic field and structural field, which is a high-energy transient forming process. Based on the current experimental methods, it is difficult to capture the relevant data in the process of magnetic pulse welding, and the transient forming mechanism of magnetic pulse welding needs to be further studied. Taking the magnetic pulse welding of an Al-Mg sheet as an example, based on the Ansoft Maxwell and ANSYS finite element simulation platform, the loose coupling method was used to analyze an electromagnetic field generated by the discharging capacitor bank and structural field of the Al-Mg sheet under the action of electromagnetic force. The discharge period of the magnetic pulse welding capacitor bank was 62 μs. The current direction in the aluminum sheet changed once half a cycle, and the direction of the electromagnetic force was always consistent with the Z-axis. Under the skin effect, the magnetic induction intensity on the lower surface of the aluminum sheet was the largest. At 16 μs, the induced current, electromagnetic force and magnetic induction intensity in the aluminum sheet reached the peak values, which were 7.89 A/m2, 4.58 N/m3 and 12.6 T, respectively. The maximum electromagnetic force and velocity in the structural field were 2400 KN and 300 m/s. The structure field simulation reproduces the transient forming process of magnetic pulse welding, and clarifies the formation mechanism of the “intermediate zone rebound uncomposite zone-welding bonding zone-unbound zone”. Based on the numerical simulation technology, the research on the transient forming mechanism of magnetic pulse welding under multiphysics simulations can promote the development and application of magnetic pulse welding technology and better guide engineering practices.

1. Introduction

Welding is a manufacturing process that uses technology for joining metals or other thermoplastic materials through heating, high temperature or high pressure. Welding plays a major role in the manufacturing industry, and is widely used in aerospace, electronic communication, the automotive industry and other fields [1]. There is a wide demand for dissimilar metal connection between aluminum alloys and magnesium alloys. Traditional fusion welding can easily form intermetallic compounds (IMCs), but it is difficult to form a reliable connection [2]. Magnetic pulse welding is a form of solid-state welding with high production efficiency, no pollution and high degree of automation. The low-heat input process can effectively avoid defects such as cracks and pores, and inhibit the formation of IMCs [3,4]. The velocity of magnetic pulse welding is usually more than several hundred meters, which makes it difficult to capture the relevant data in the process by traditional experimental methods. In this paper, the magnetic pulse welding process is simulated in order that the process of transient forming of MPW can be directly displayed by computer simulation and the relevant data can be obtained, such as induced magnetic field, induced current and electromagnetic force, etc.
Casalino et al. [5] used the finite element method to analyze the influence of thermal energy distribution, sheet deformation and different discharge parameters on the quality of MPW. Shim et al. [6] established an MPW model through FEM, and studied the distribution of electromagnetic force by taking current and frequency as loading conditions. Shim and Kang [7] established a 3D FEM simulation model to analyze the electromagnetic force distribution of the square coil. The results show that the generated electromagnetic force is the greatest at the center adjacent to the coil, but it decreased as it moved toward the edge. Xu et al. [8] successfully predicted the acceleration process and final impact velocity of the outer pipe during pipe fitting welding through finite element simulation. Shobhna Mishra et al. [9] used Ansoft Maxwell software to conduct a 2D electromagnetic field simulation for wide pipe welding with different types of coils. The simulation results showed that when the cross-sectional area, coil spacing, coil turns and discharge current were the same, the magnetic field generated by the discharge of the coil with a rectangular section was 1.3 times that of the coil with a circular area. Serizawa et al. [10] used MSC Dytran to conduct numerical simulation on the deformation process of Al-Fe sheet MPW, and theoretically proposed the conditions required for sheet MPW: collision velocity and collision angle.
Previous studies show that numerical simulation has a significant reference value for the process parameter setting, coil shape design and workpiece deformation behavior prediction. MPW involves many subjects such as electromagnetism, elasticity, fluid mechanics and material science. Currently, there is little research on the multiphysical field simulation of the MPW transient forming process, including the principles of MPW, the capacitor discharge, the change in the induced magnetic field around the coil and the electromagnetic force inside the material. The deep understanding of the MPW forming mechanism could promote the development of MPW technology, enlarging the application scope of the technology. It is of great significance. In this paper, by using magnetic pulse welding, the 1060 Al alloy and AZ31B Mg alloy were connected successfully.
In the future, the application of lightweight materials will continue to be the developing trend. Solid-phase welding methods such as explosive welding and MPW can perfectly realize the high-quality connection of dissimilar aluminum (Al) and magnesium (Mg) metals [3,11,12,13,14,15]. Taking MPW of an aluminum (Al) and magnesium (Mg) sheet as an example in this study, the transient forming mechanism of MPW was simulated based on multiphysics simulation.

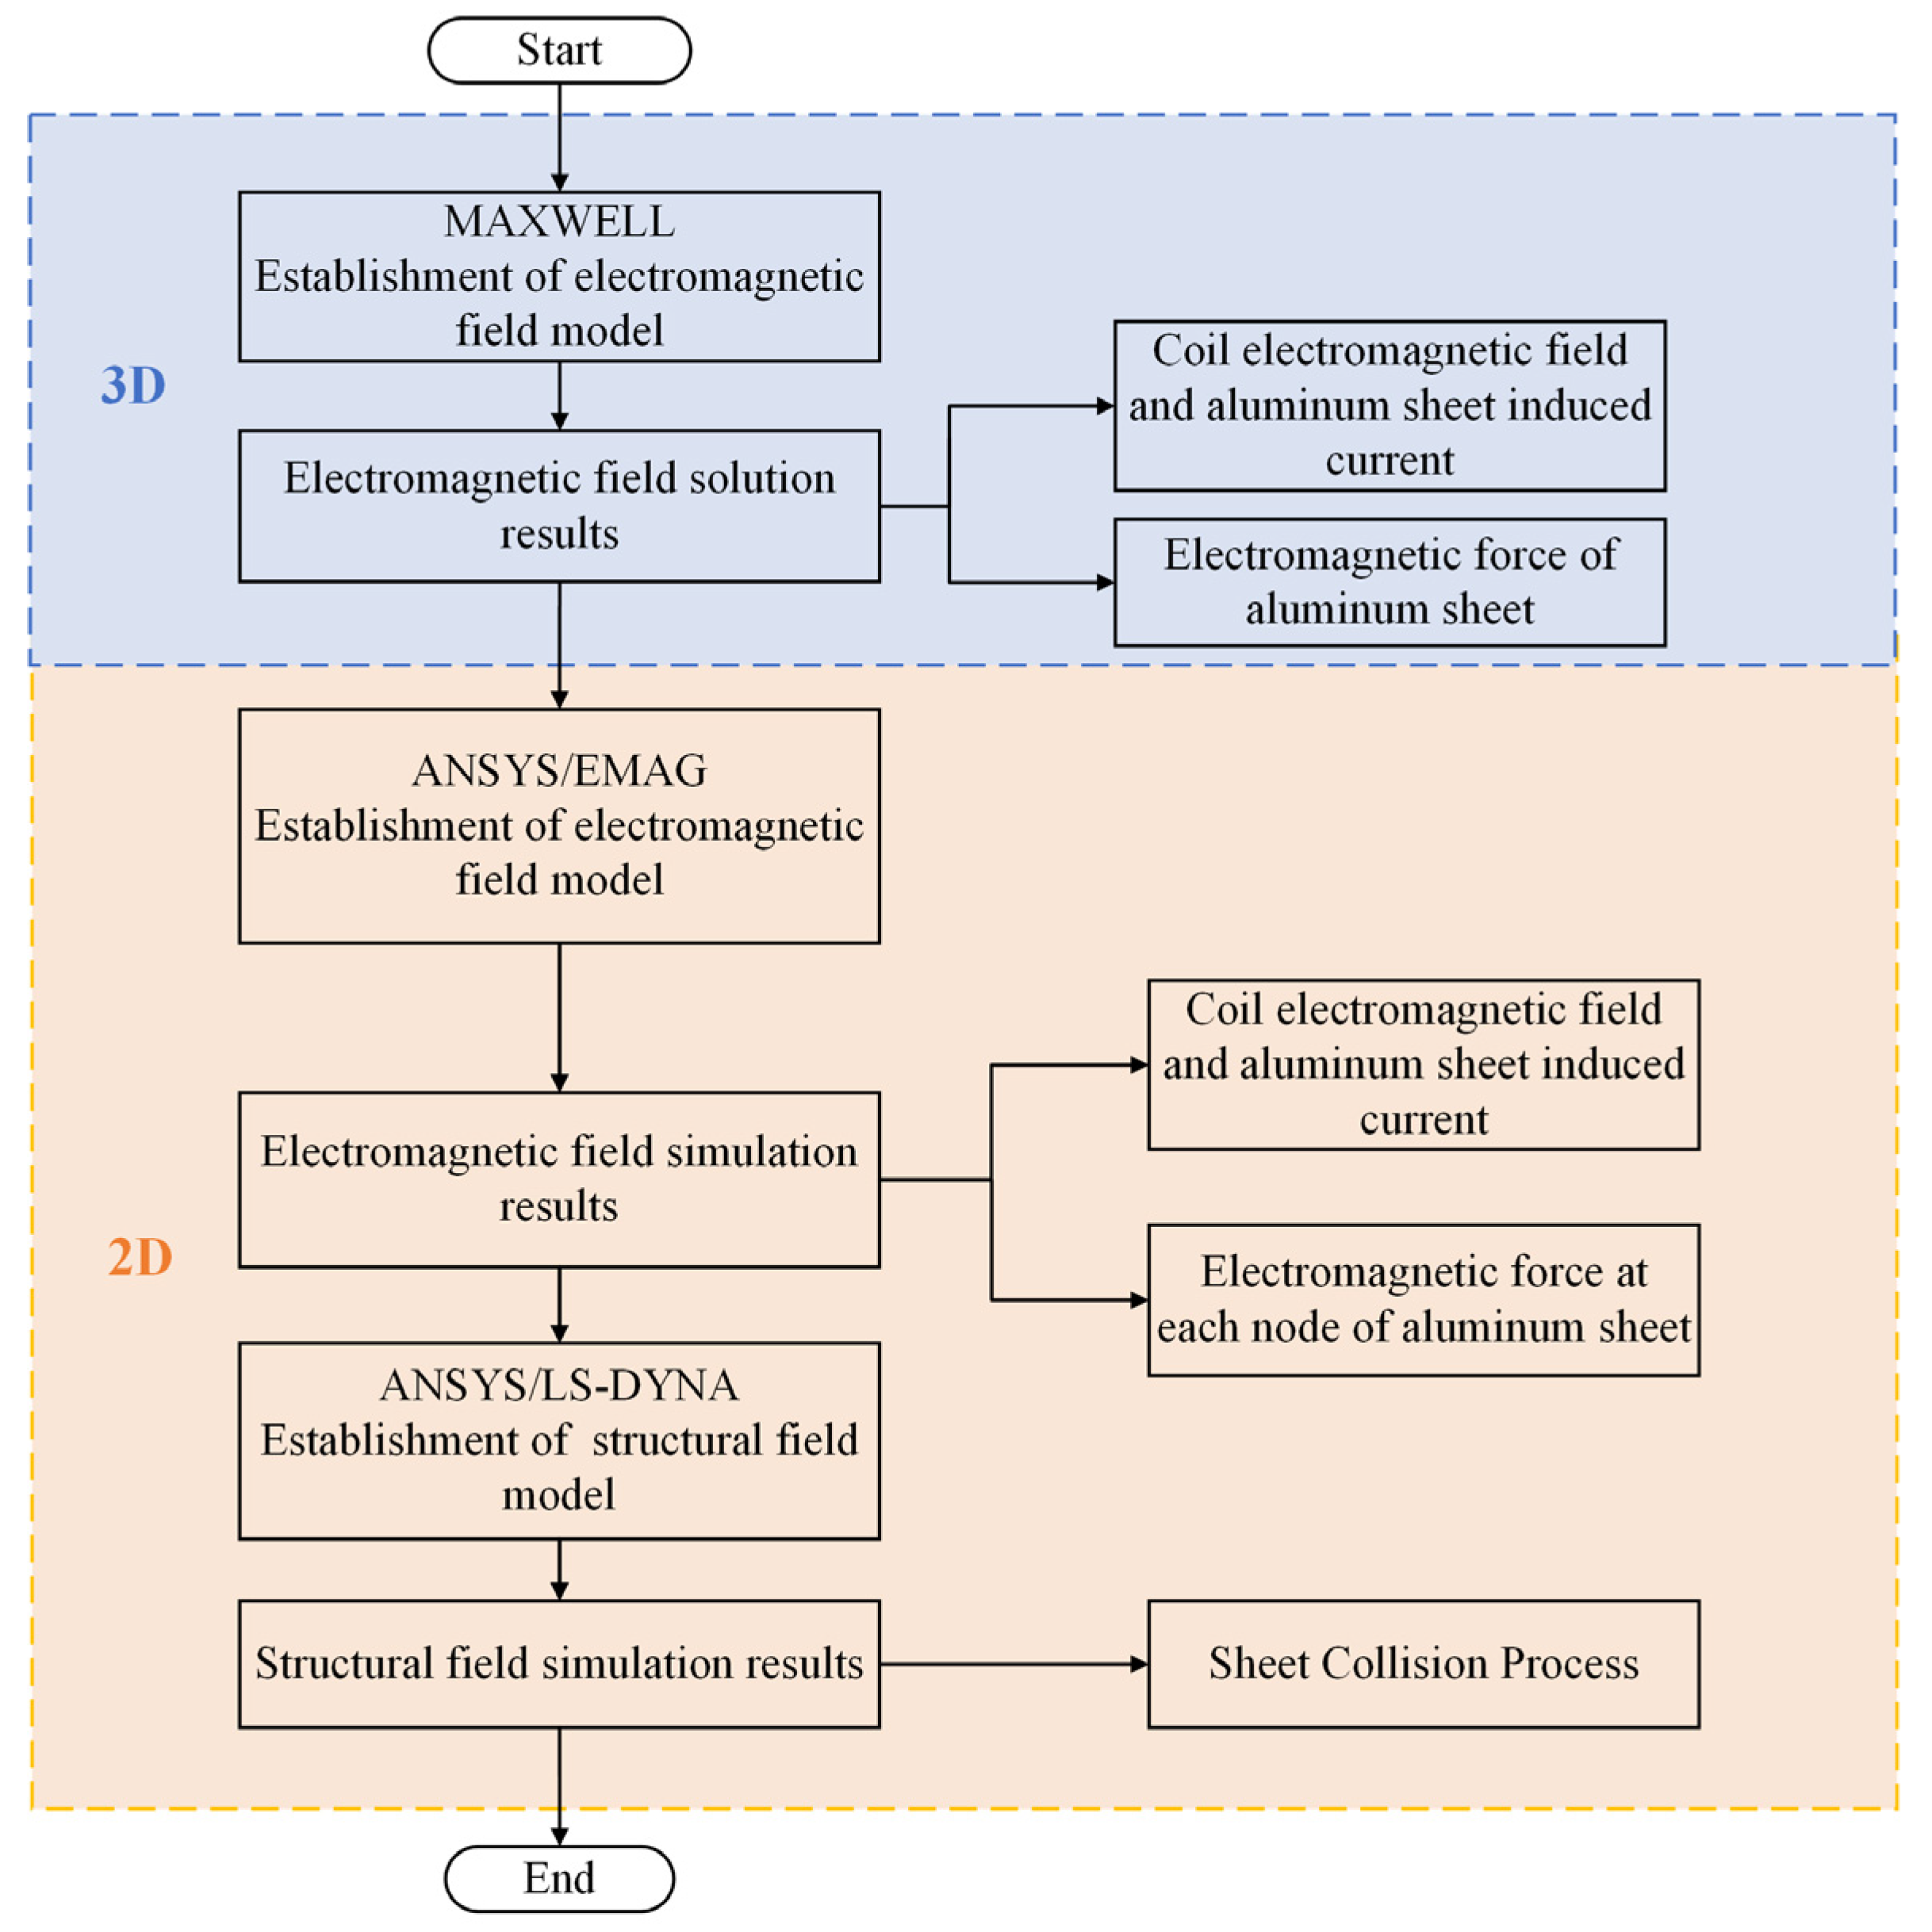
2. Simulation Scheme

The coupling of the three physical fields of electromagnetic field, structure field and thermal field is involved in the process of MPW. Since the Joule heat generated by discharge is very small, the increase in temperature caused by Joule heat can be ignored [16]. Taking the MPW of an Al-Mg sheet as an example, this paper studies the electromagnetic field distribution of the capacitor bank discharge and the structural field of the Al sheet under the action of electromagnetic force. Taking the 1060 Al alloy sheet as the flyer sheet and the AZ31B Mg alloy sheet as the base sheet, two insulating gaskets with a certain thickness were placed between the Al sheet and Mg sheet, and a rigid pressing block was placed above the Mg sheet.
According to the welding parameters and the current waveform obtained by the oscilloscope, the external circuit was created. Then, the external circuit was loaded into the coil model, and the magnetic induction generated around the coil and the electromagnetic force received by the Al sheet was calculated. The Ansoft Maxwell transient electromagnetic field analysis module was used to conduct numerical simulation of the 3D electromagnetic field in the welding process; the distribution law of the electromagnetic field generated by the coil and the electromagnetic force received by the Al sheet in the discharge process were analyzed and studied. Then, based on the results of the 3D electromagnetic field analysis, the various values of the electromagnetic force received by each node on the Al sheet over time were extracted from the ANSYS/EMAG (18.2) electromagnetic field module platform, and the ANSYS/LS-DYNA (18.2) module established the same finite element model as the electromagnetic field analysis. The electromagnetic force extracted in the above step was applied to each node as a load. The deformation process of the Al sheet was analyzed, and the transient forming mechanism of MPW was analyzed based on the electromagnetic field and structure field. The process of numerical simulation analysis is shown in Figure 1. Because the MPW process is the interaction of two different physical fields, and to obtain better convergence in the calculation process, the loose coupling method was used to conduct the analysis after modeling.

3. Ansoft Maxwell 3D Numerical Simulation of Electromagnetic Field

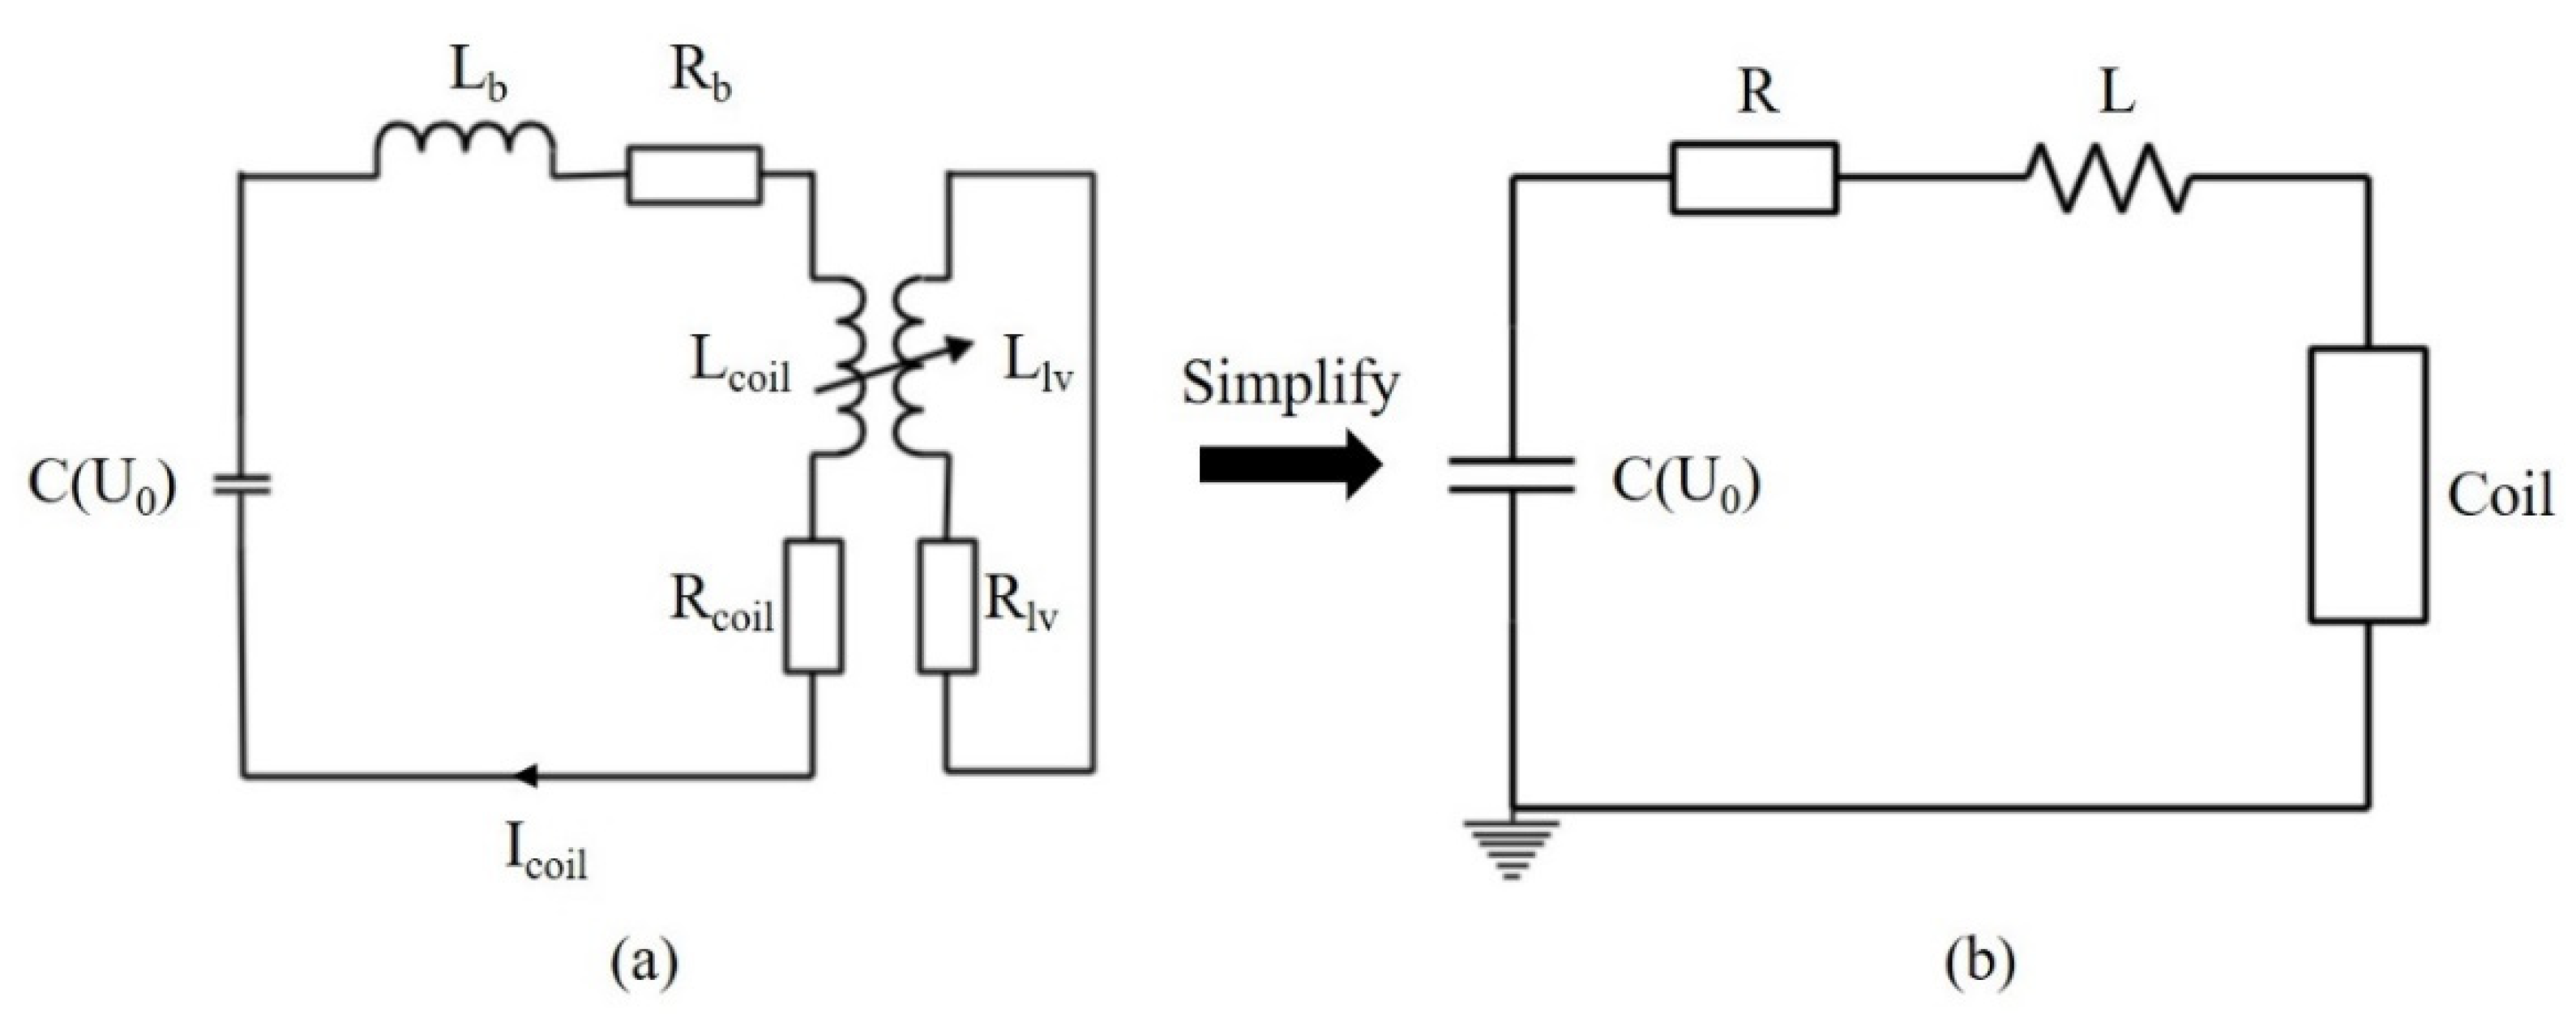
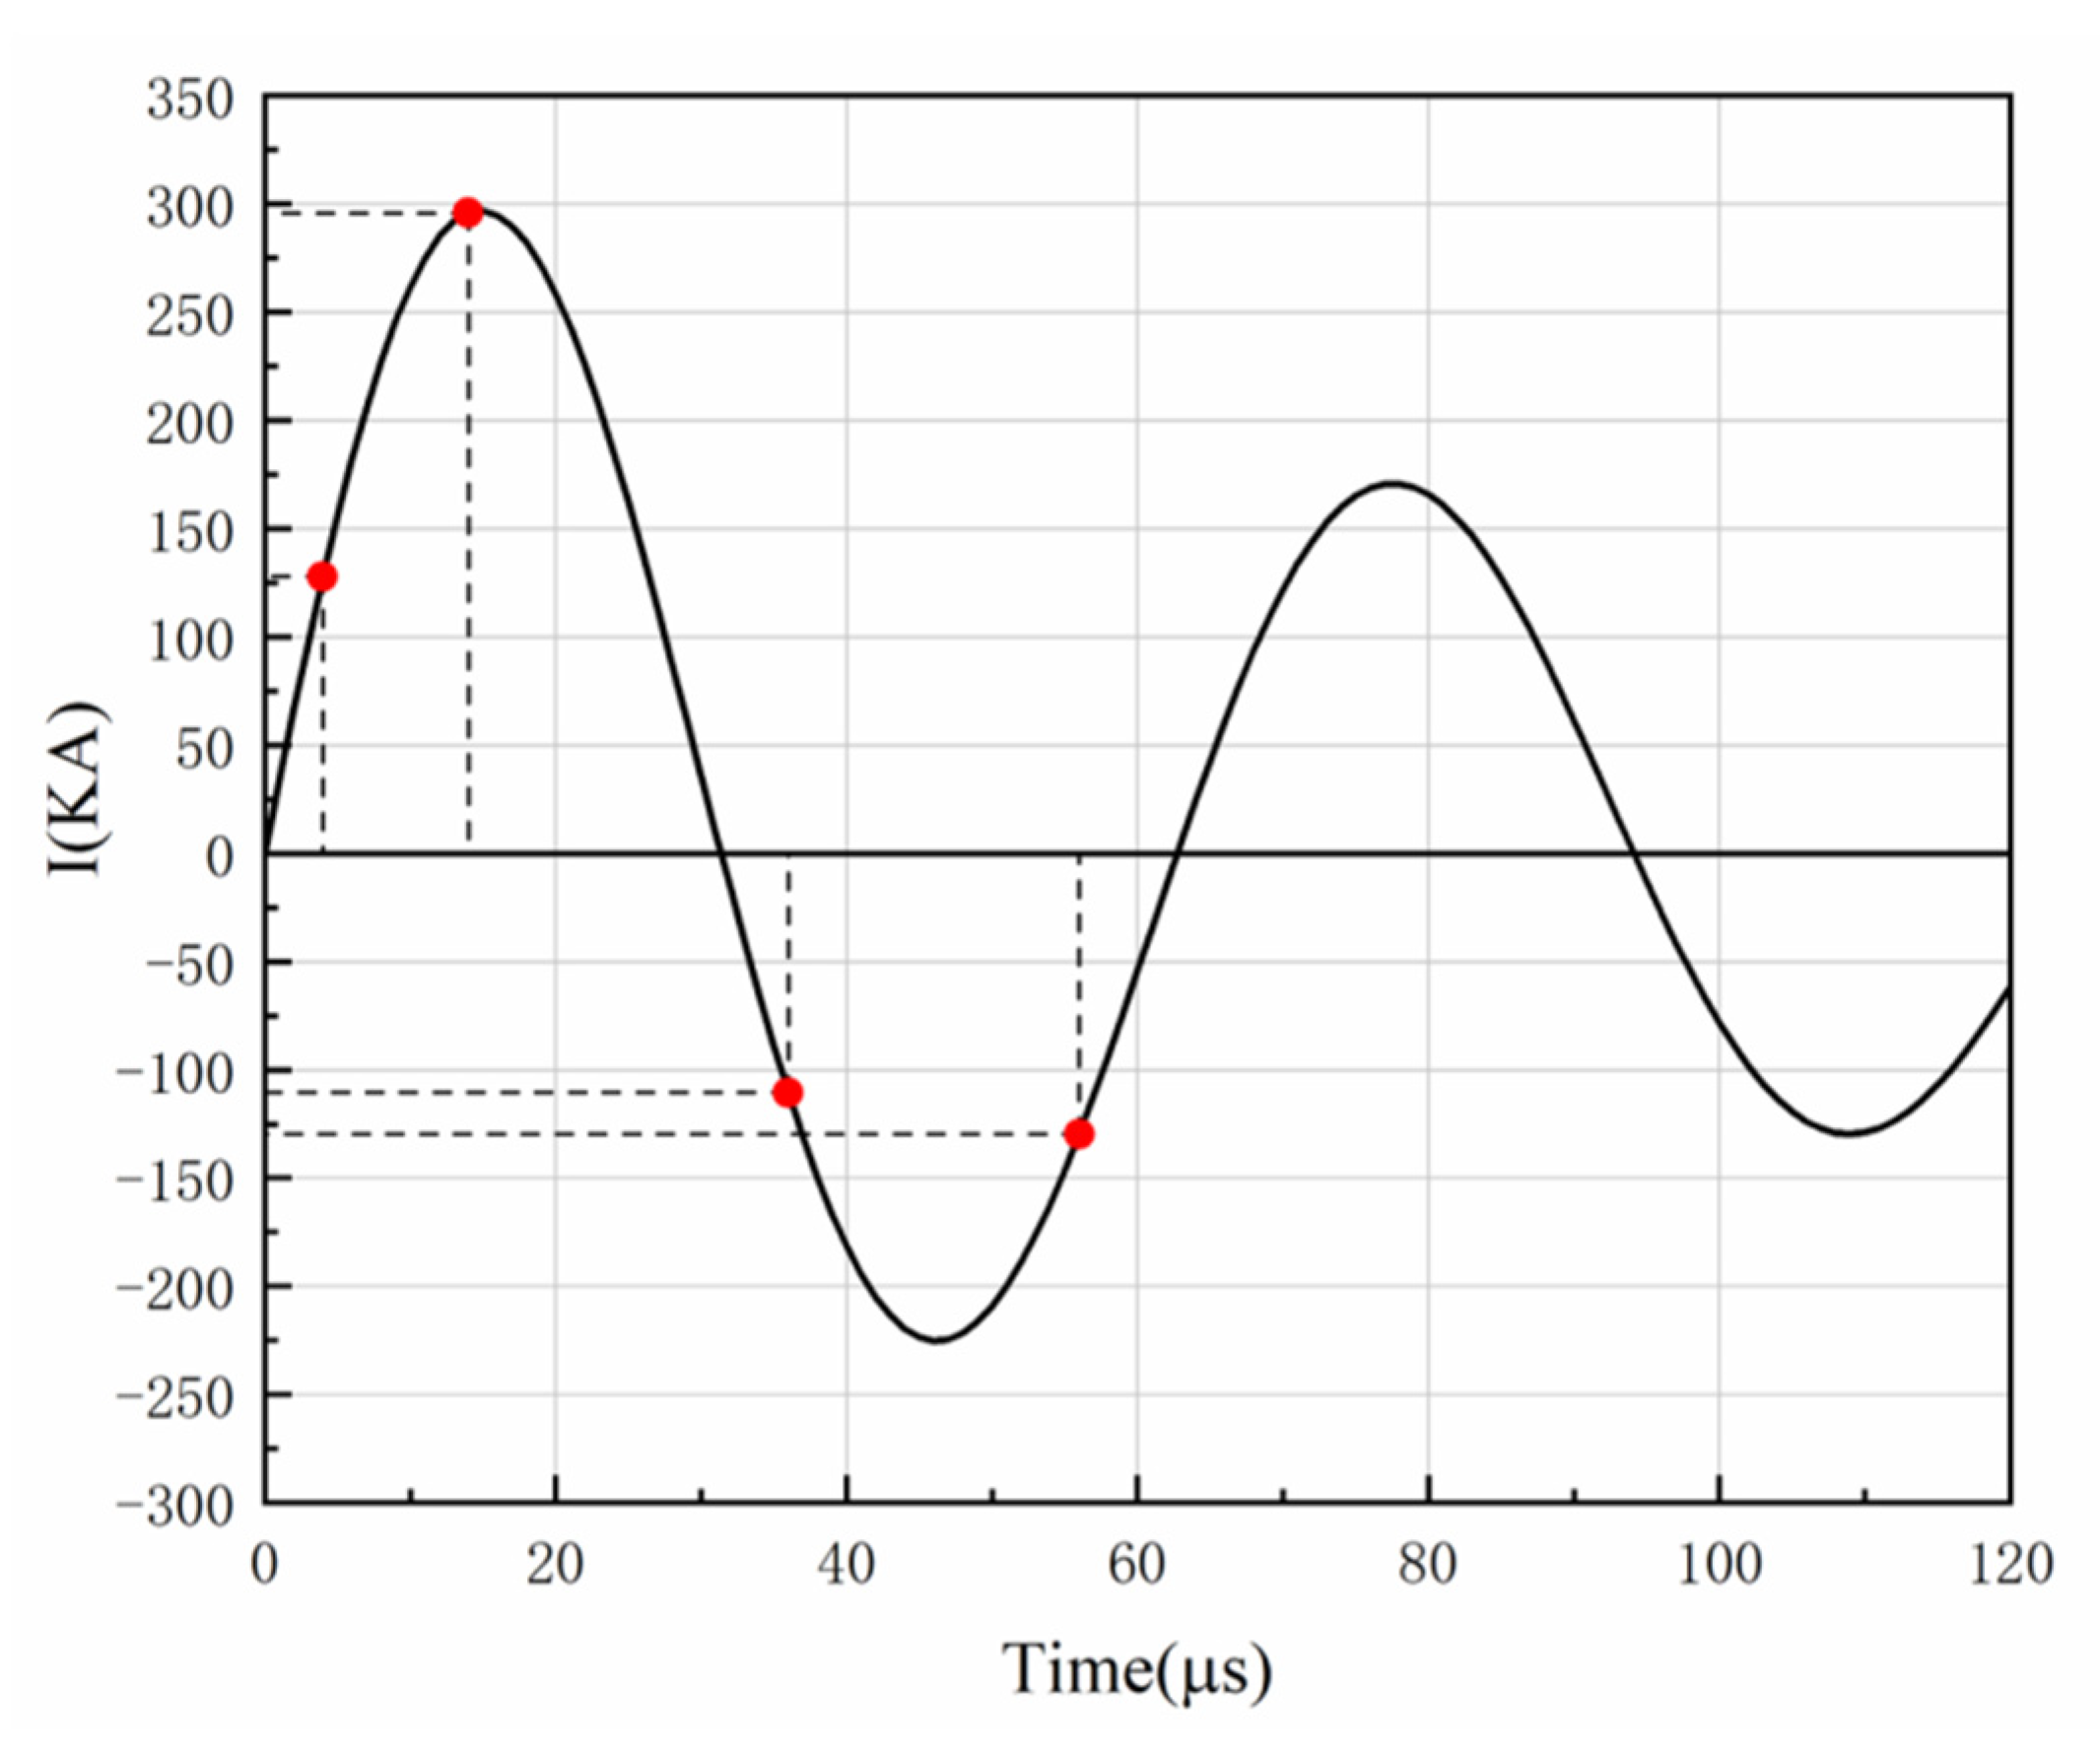
3.1. Establishment of External Circuit and Solution of Electrical Parameters

Magnetic pulse welding (MPW) is a new solid-state welding technology. The principal configuration is shown in Figure 2. After the circuit is switched on, the capacitor discharges and the circuit produces an attenuated sinusoidal current signal. The industrial power of 380 V is boosted to several thousand volts and then transformed into a direct current through high voltage rectification to charge the capacitor bank. When the voltage rises to the set threshold, the discharge generates a high-frequency sinusoidal attenuation current in the coil loop, a changing magnetic field around the coil and an induced current inside the aluminum (Al) sheet. Under the action of the magnetic field, the aluminum (Al) sheet is subjected to a huge electromagnetic force, which accelerates in microseconds and collides with the magnesium (Mg) sheet at the speed of hundreds of meters per second to realize the connection of the workpiece.
Figure 3a shows the circuit configuration of the magnetic pulse welding equipment. The capacitor bank in the equipment is assumed to be a voltage source with a capacitance of C and a charging voltage of U0. The inductance (Lcoil) and resistance of the coil (Rcoil) in the equipment and the inductance (Lb) and resistance of other parts (Rb) of the circuit together constitute the impedance part of the circuit. Assume that the inductance of the aluminum sheet is Llv, and the resistance is Rlv. Then, the electromagnetic induction between coil and aluminum sheet can be described by mutual inductance between Lcoil and Llv. The whole discharge circuit can be simplified to the RLC circuit in Figure 3b, where L and R represent the equivalent inductance and equivalent resistance in the RLC circuit.
The current waveform of the CWT300 Roche coil produced by PEM was collected by an oscilloscope. Figure 4 shows the current waveform with a discharge voltage of 14 KV. It can be seen from the figure that the discharge current has the characteristics of periodic oscillation, and its change process is underdamped, presenting periodic vibration with decreasing amplitude. The current in the coil reaches the peak value at 16 μs, where 0~31 μs is the first half period and 0~62 μs is the total period.
The main parameters of the circuit calculated by the Davinen theorem are shown in Table 1.

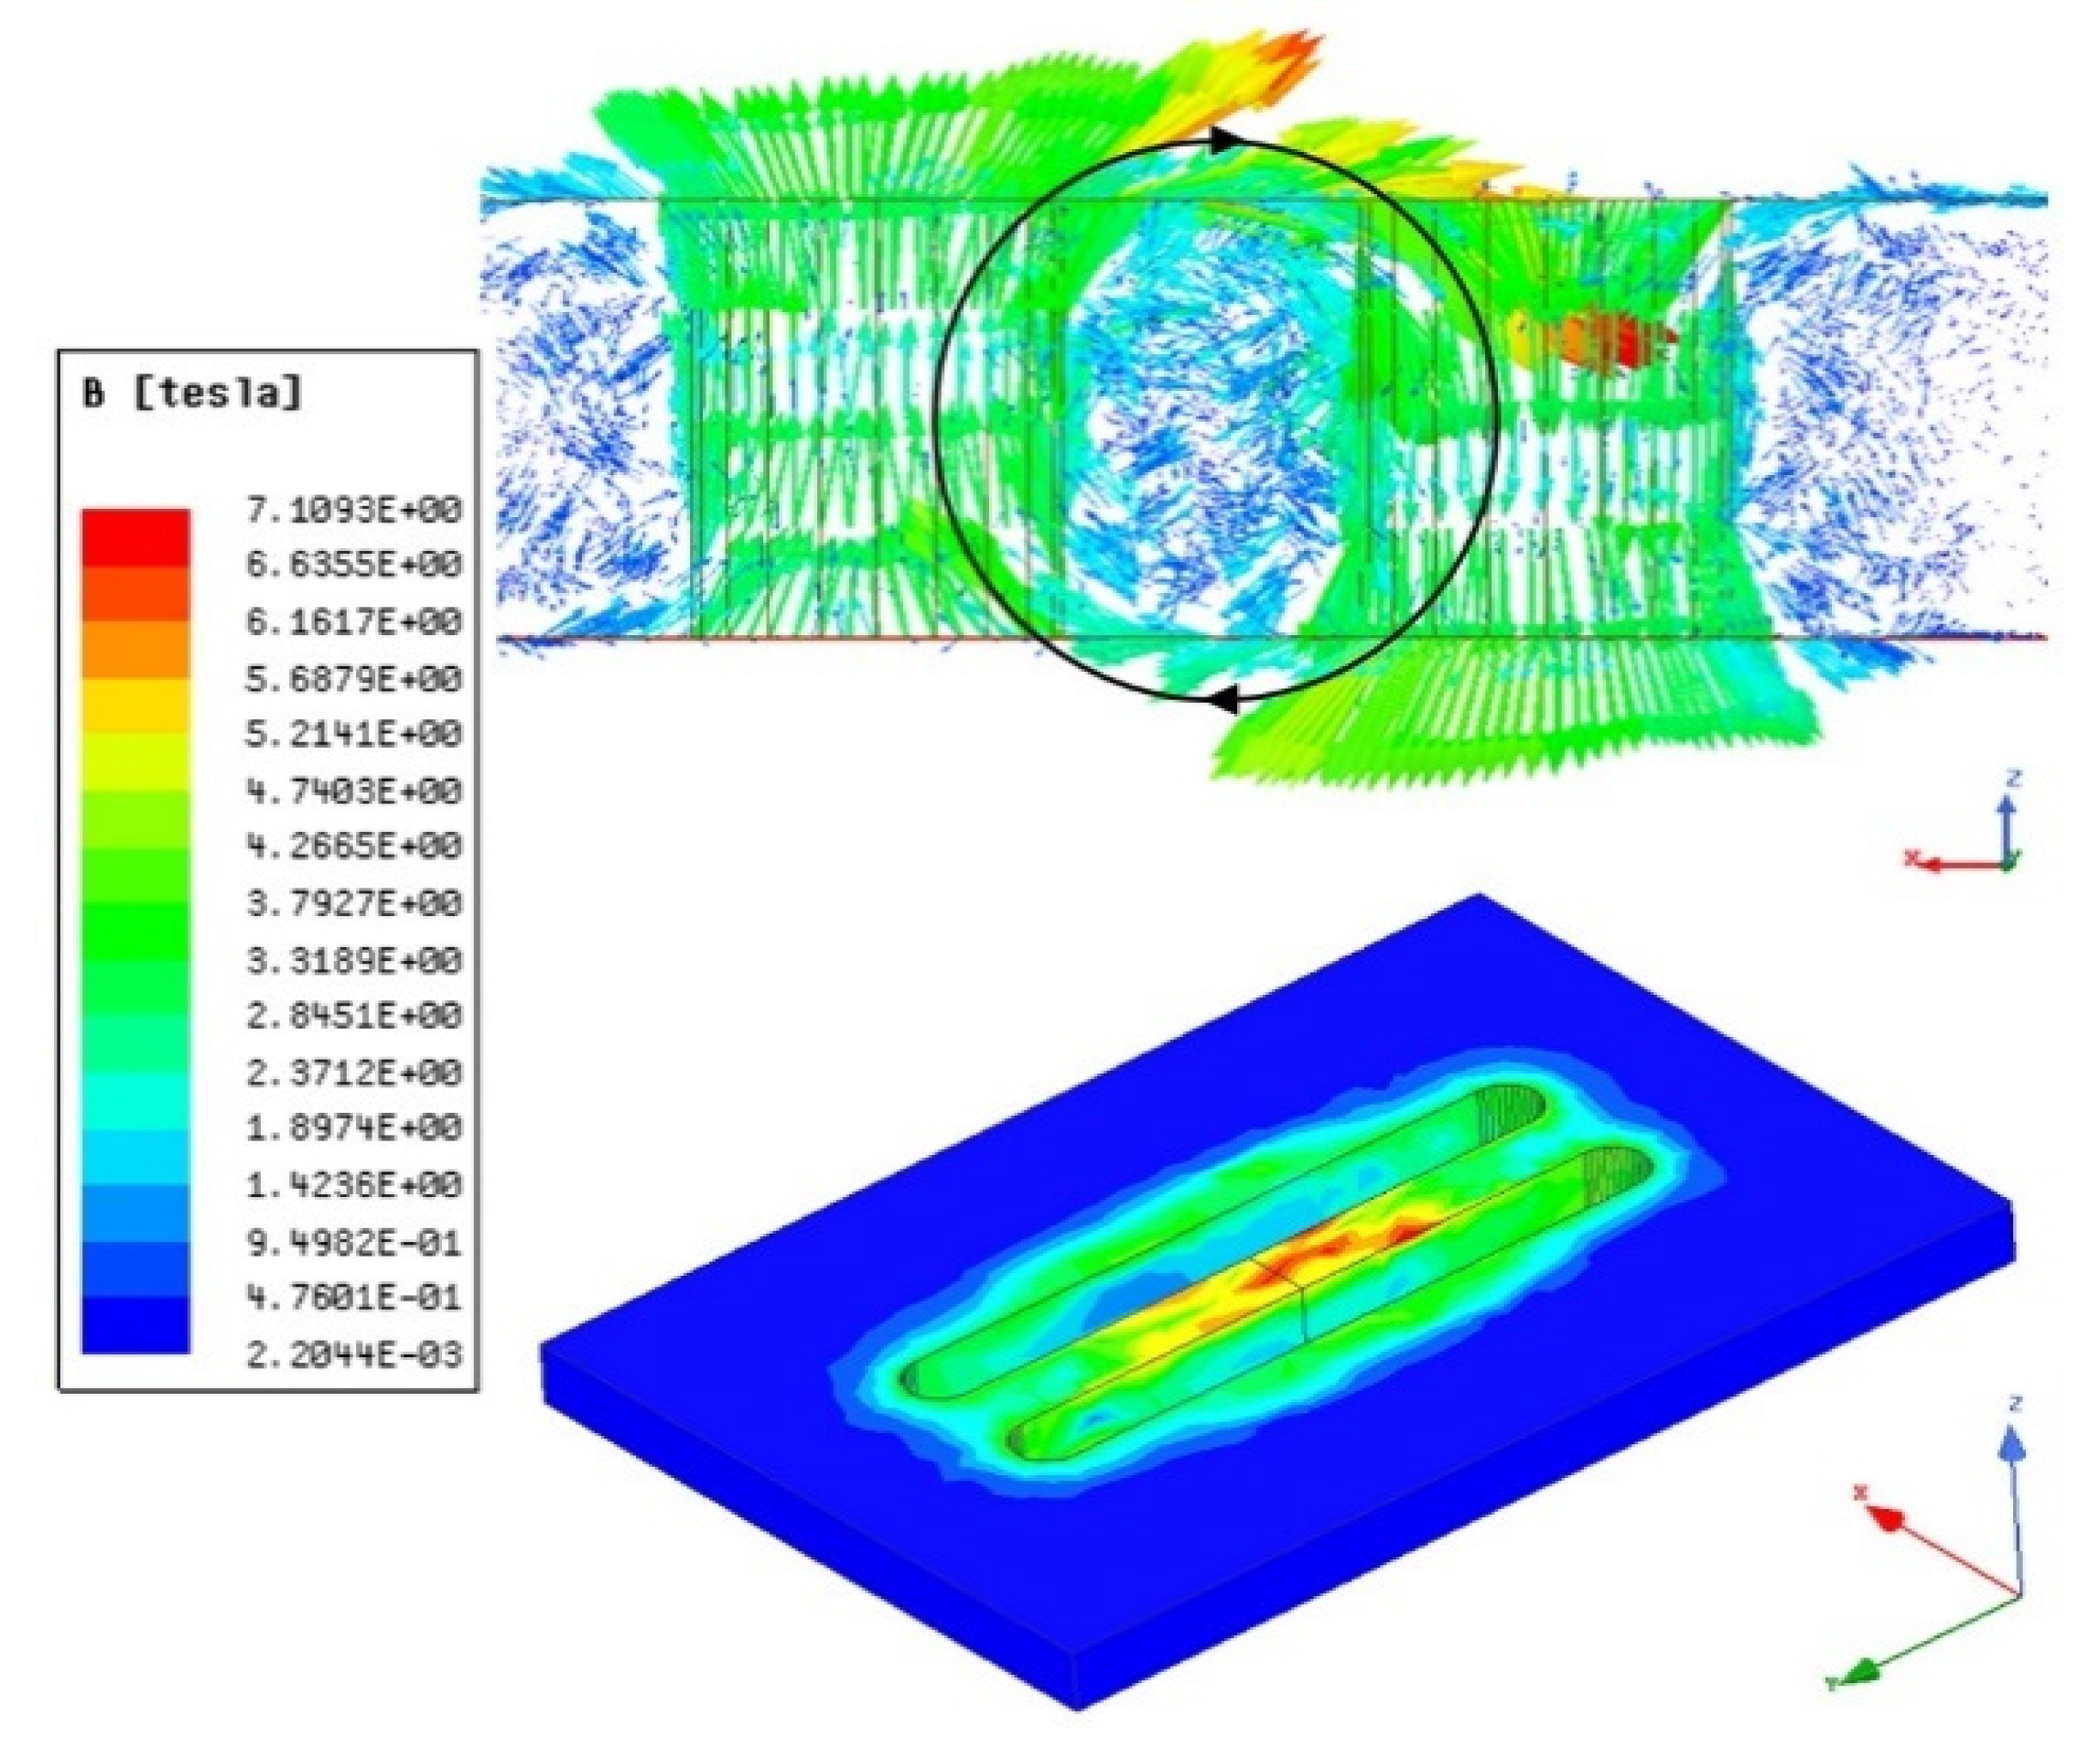
3.2. Three-Dimensional Electromagnetic Field Modeling and Analysis

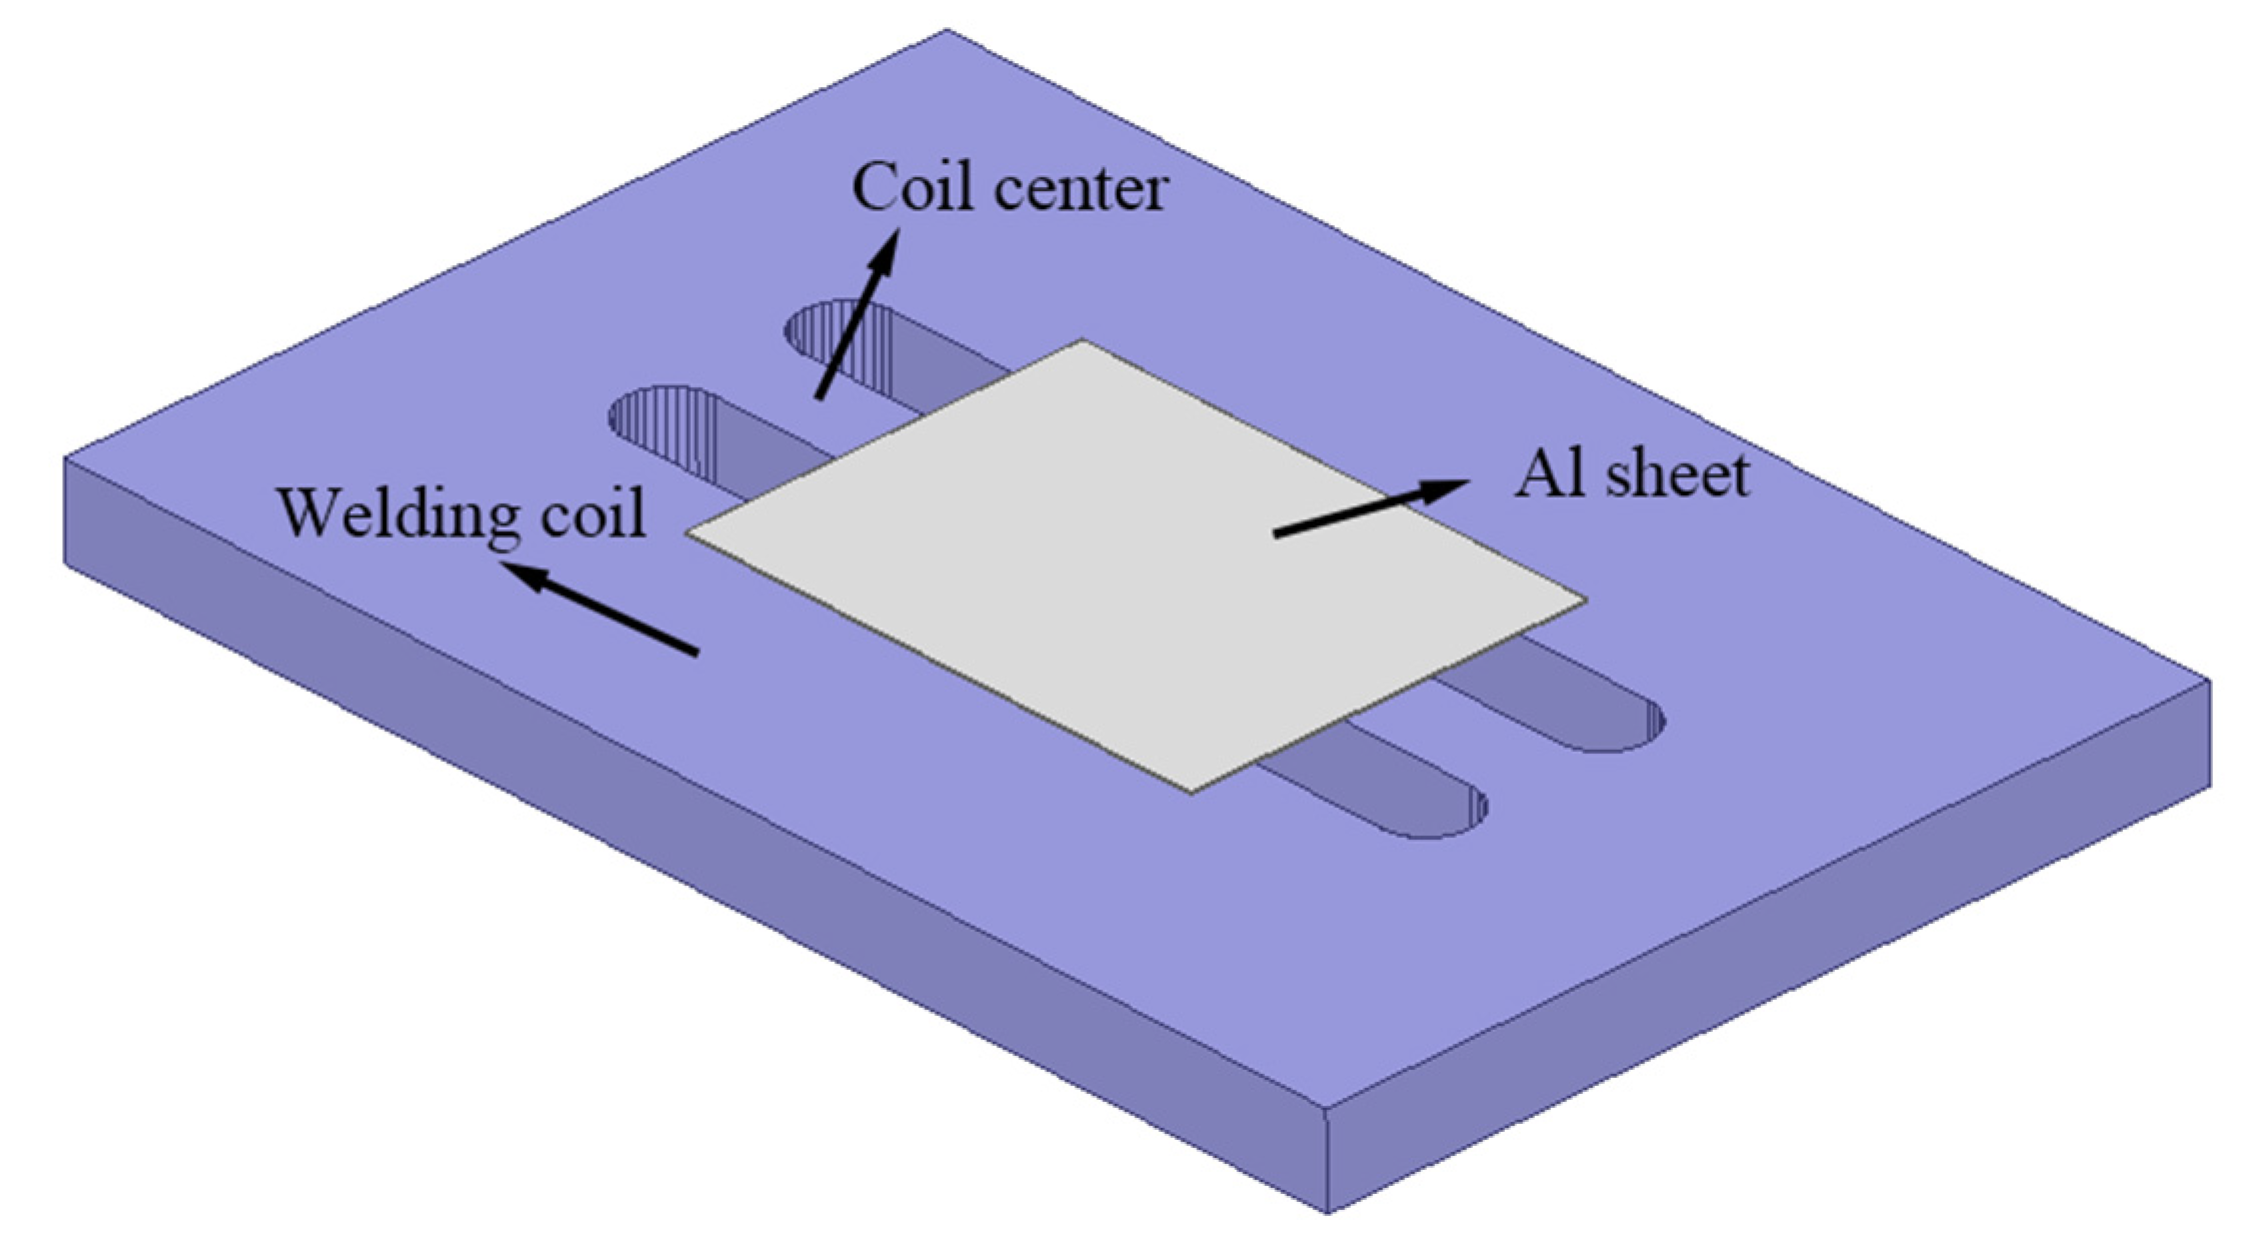
3.2.1. Electromagnetic Field Simulation Modeling

In the case of the alternating magnetic field, the skin effect makes the Al sheet produce a shielding effect on the Mg sheet, and the induced current generated in the Mg sheet can be ignored. Therefore, only the coil and Al sheet models are established in the 3D electromagnetic field simulation model. The 3D electromagnetic field numerical model established in Ansoft Maxwell (16.0) is shown in Figure 5. According to the actual MPW process [14], the calculation time of simulation was set as 60 μs and the step size was set as 1 μs. The geometric dimensions of the model are referenced in reference [11]. The sheet clearance was 1.4 mm, the lap length was 45 mm and the sheet length was 10 mm. The physical parameters of the material used the default software parameters. The current waveform in Figure 4 was loaded into the coil, and the relevant electrical parameters are shown in Table 1.

3.2.2. Analysis of Electromagnetic Field and Induced Current in Al Sheet

When the discharge voltage is 14 KV and the discharge time is 16 μs, the magnetic field distribution around the coil is shown in Figure 6 (the positive direction of the Y-axis is outward, vertical to the paper). At the time of 16 μs, the magnetic field intensity reaches the maximum, which is 7.1 T. As can be seen from Figure 6, the magnetic field generated after the coil is energized is mainly distributed around the center of the coil, and due to the shielding effect of the Al sheet, the magnetic field is concentrated primarily in the area between the center of the coil and the Al sheet. The magnetic field direction is negative along the X-axis. It can be clearly seen in the Figure 6 that the magnetic field is mainly distributed in the middle. According to this phenomenon, only the middle coil is retained in the two-dimensional magnetic field simulation. This reduces the number of simulation calculations.
Figure 7 shows the vector diagram of the induced current inside the Al sheet at a typical moment in the first discharge cycle when the discharge voltage is 14 KV. It can be seen from the Figure 7, that the induction current density is the largest in the middle area of the Al sheet, that is, the position around the center of the coil. In the first half of the discharge cycle, the induction current is always forward along the Y-axis, and the induction current turns at both ends of the Al sheet, forming a closed loop. The induced current is always in the positive direction of the Y-axis in the first half of the discharge cycle, and the induced current turns at both ends of the Al sheet, forming a closed loop. By combining the current waveform in Figure 4 and the analysis in Figure 7, it can be seen that the magnitude and direction of the induced current density in the Al sheet change with the change in the discharge current in the coil. When the discharge time is around 16 μs, the induced current density reaches a peak value. When the discharge time is around 31 μs, the direction of the discharge current passing through the coil changes, which causes the direction of the induced current in the Al sheet to change. The direction of the induced current in the Al sheet changes from the positive direction of the Y-axis to the negative direction of the Y-axis in the first half cycle. The direction of the induced current in the Al sheet changes once in half a cycle.
Figure 8 shows the distribution of the electromagnetic force in the Al sheet during the first cycle of the discharge voltage of 14 KV. The electromagnetic force in the Al sheet is just above the center of the coil, always along the positive direction of the Z-axis. In the first half of the discharge cycle, the direction of the induced current inside the Al sheet is consistent with the direction of the Y-axis, and the direction of the magnetic field is opposite to the direction of the X-axis. According to the left-hand rule, the electromagnetic force on the Al sheet is positive along the Z-axis. In the last half of the discharge cycle, the direction of the current through the coil changes, the direction of the magnetic field changes, the direction of the induced current in the Al sheet also changes and the direction of the electromagnetic force of the Al sheet does not change. When the discharge time is 16 μs, the inside of the Al sheet’s electromagnetic force reaches its maximum. From the figure, it is found that there is an electromagnetic force along the Y-axis direction along the edge area of the Al sheet. This is because the induced current in this area is along the X-axis direction, and the magnetic field direction is consistent with the Z-axis direction. According to the left-hand rule, the induced current in this area generates an electromagnetic force along the Y-axis.

4. ANSYS/EMAG 2D Numerical Simulation of Electromagnetic Field

4.1. Model Building

According to the 3D electromagnetic field simulation results, the magnitude and distribution of the electromagnetic force on the cross-section of the Al sheet in the MPW process tend to be consistent; thus, the welding system can be simplified into a 2D model. The 2D model can reduce the number of grids and improve computational efficiency. In addition, the 3D electromagnetic field simulation shows that only the center of the coil plays a role in the welding process, therefore the current loops on both sides are ignored in the modeling. The geometry of the model is the same as that of the 3D model. The pulse current density of Figure 4 is applied to the coil as an excitation load. After the coil passes through the pulsed current, the pulsed magnetic field centered on the coil is generated and is continuously attenuated towards infinity. Therefore, the existence of a boundary is needed to make the model converge during calculation. The infinite air field model is simplified to the near air element region and the far air element region. The 2D electromagnetic field simulation model is shown in Figure 9.
The welding coil, Al sheet, Mg sheet and the far air element region model adopted the mapping grid, whereas the near air element region model adopted the free grid. The infinite surface (INF) was applied to the outer surface of the model as the boundary condition. The loading time of current excitation was set as 60 μs, and the time step was set as 1 μs. Material unit types and parameters are shown in Table 2.

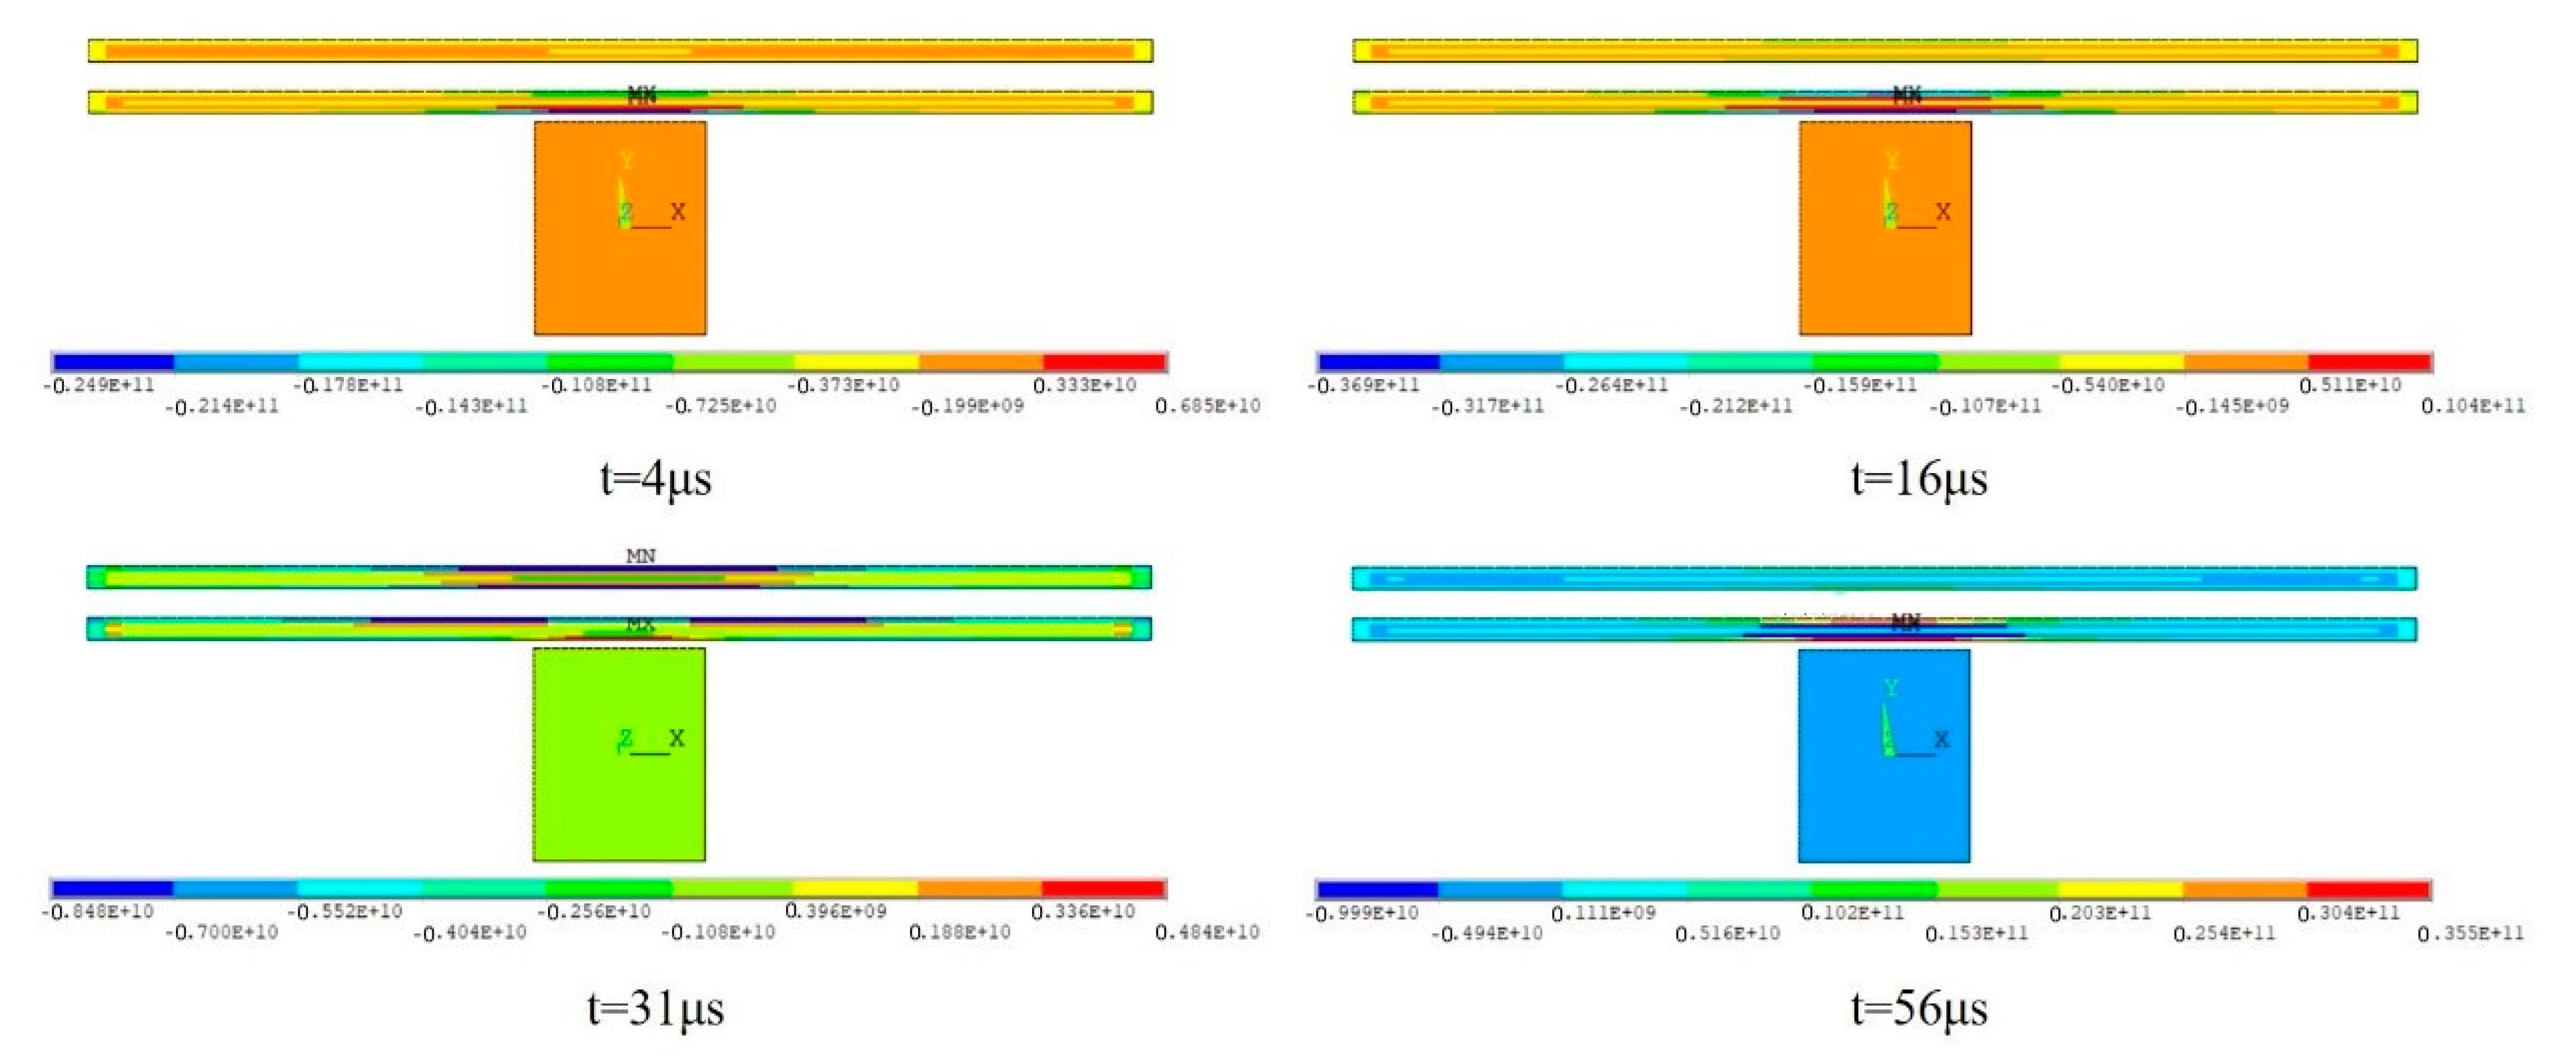
4.2. Regional Magnetic Field Analysis of Al Sheet and Mg Sheet

The distribution and change of magnetic induction intensity at typical moments in the first discharge cycle are shown in Figure 10. It can be seen from the figure that the magnetic field is mainly distributed in the Al sheet area around the center of the coil. The magnetic induction intensity gradually decreases as it moves towards the edge, and due to the skin effect and shielding effect of the Al sheet, the magnetic field is mainly concentrated on the lower surface of the Al sheet. The magnetic induction intensity of the Mg sheet is much smaller than that of the Al sheet. Combined with the current output waveform of the coil in Figure 4, the magnetic induction intensity increases gradually from 0 μs to 16 μs and reaches the peak value at 16 μs, which is about 12.6 T. In the second half of the discharge cycle, the direction of the current passing through the coil changes, and the direction of the magnetic induction intensity also changes according to the right-hand rule. At 31 μs, the induced current direction changes, and the magnetic field direction also changes. According to the magnetic induction intensity cloud map, 31 μs is the moment when the magnetic field direction changes.
In order to quantitatively study the distribution law of the magnetic induction intensity in the thickness direction, the typical nodes of the grid shown in Figure 11 were selected for analysis on the Al sheet and the Mg sheet.
Figure 12 shows the magnetic induction intensity distribution of typical nodes in the thickness direction of the simulation model. The variation law of magnetic induction intensity is similar to that of the coil discharge current, which is in the form of oscillation attenuation. The 32# node nearest to the coil has the maximum magnetic induction intensity. With the increase in the distance from the coil, the magnetic induction intensity in the thickness direction decreases gradually. The 398# node and 463# node are typical nodes on the Mg sheet, and their electromagnetic fields are small, which proves the skin effect of the magnetic field and the shielding effect of the Al sheet.

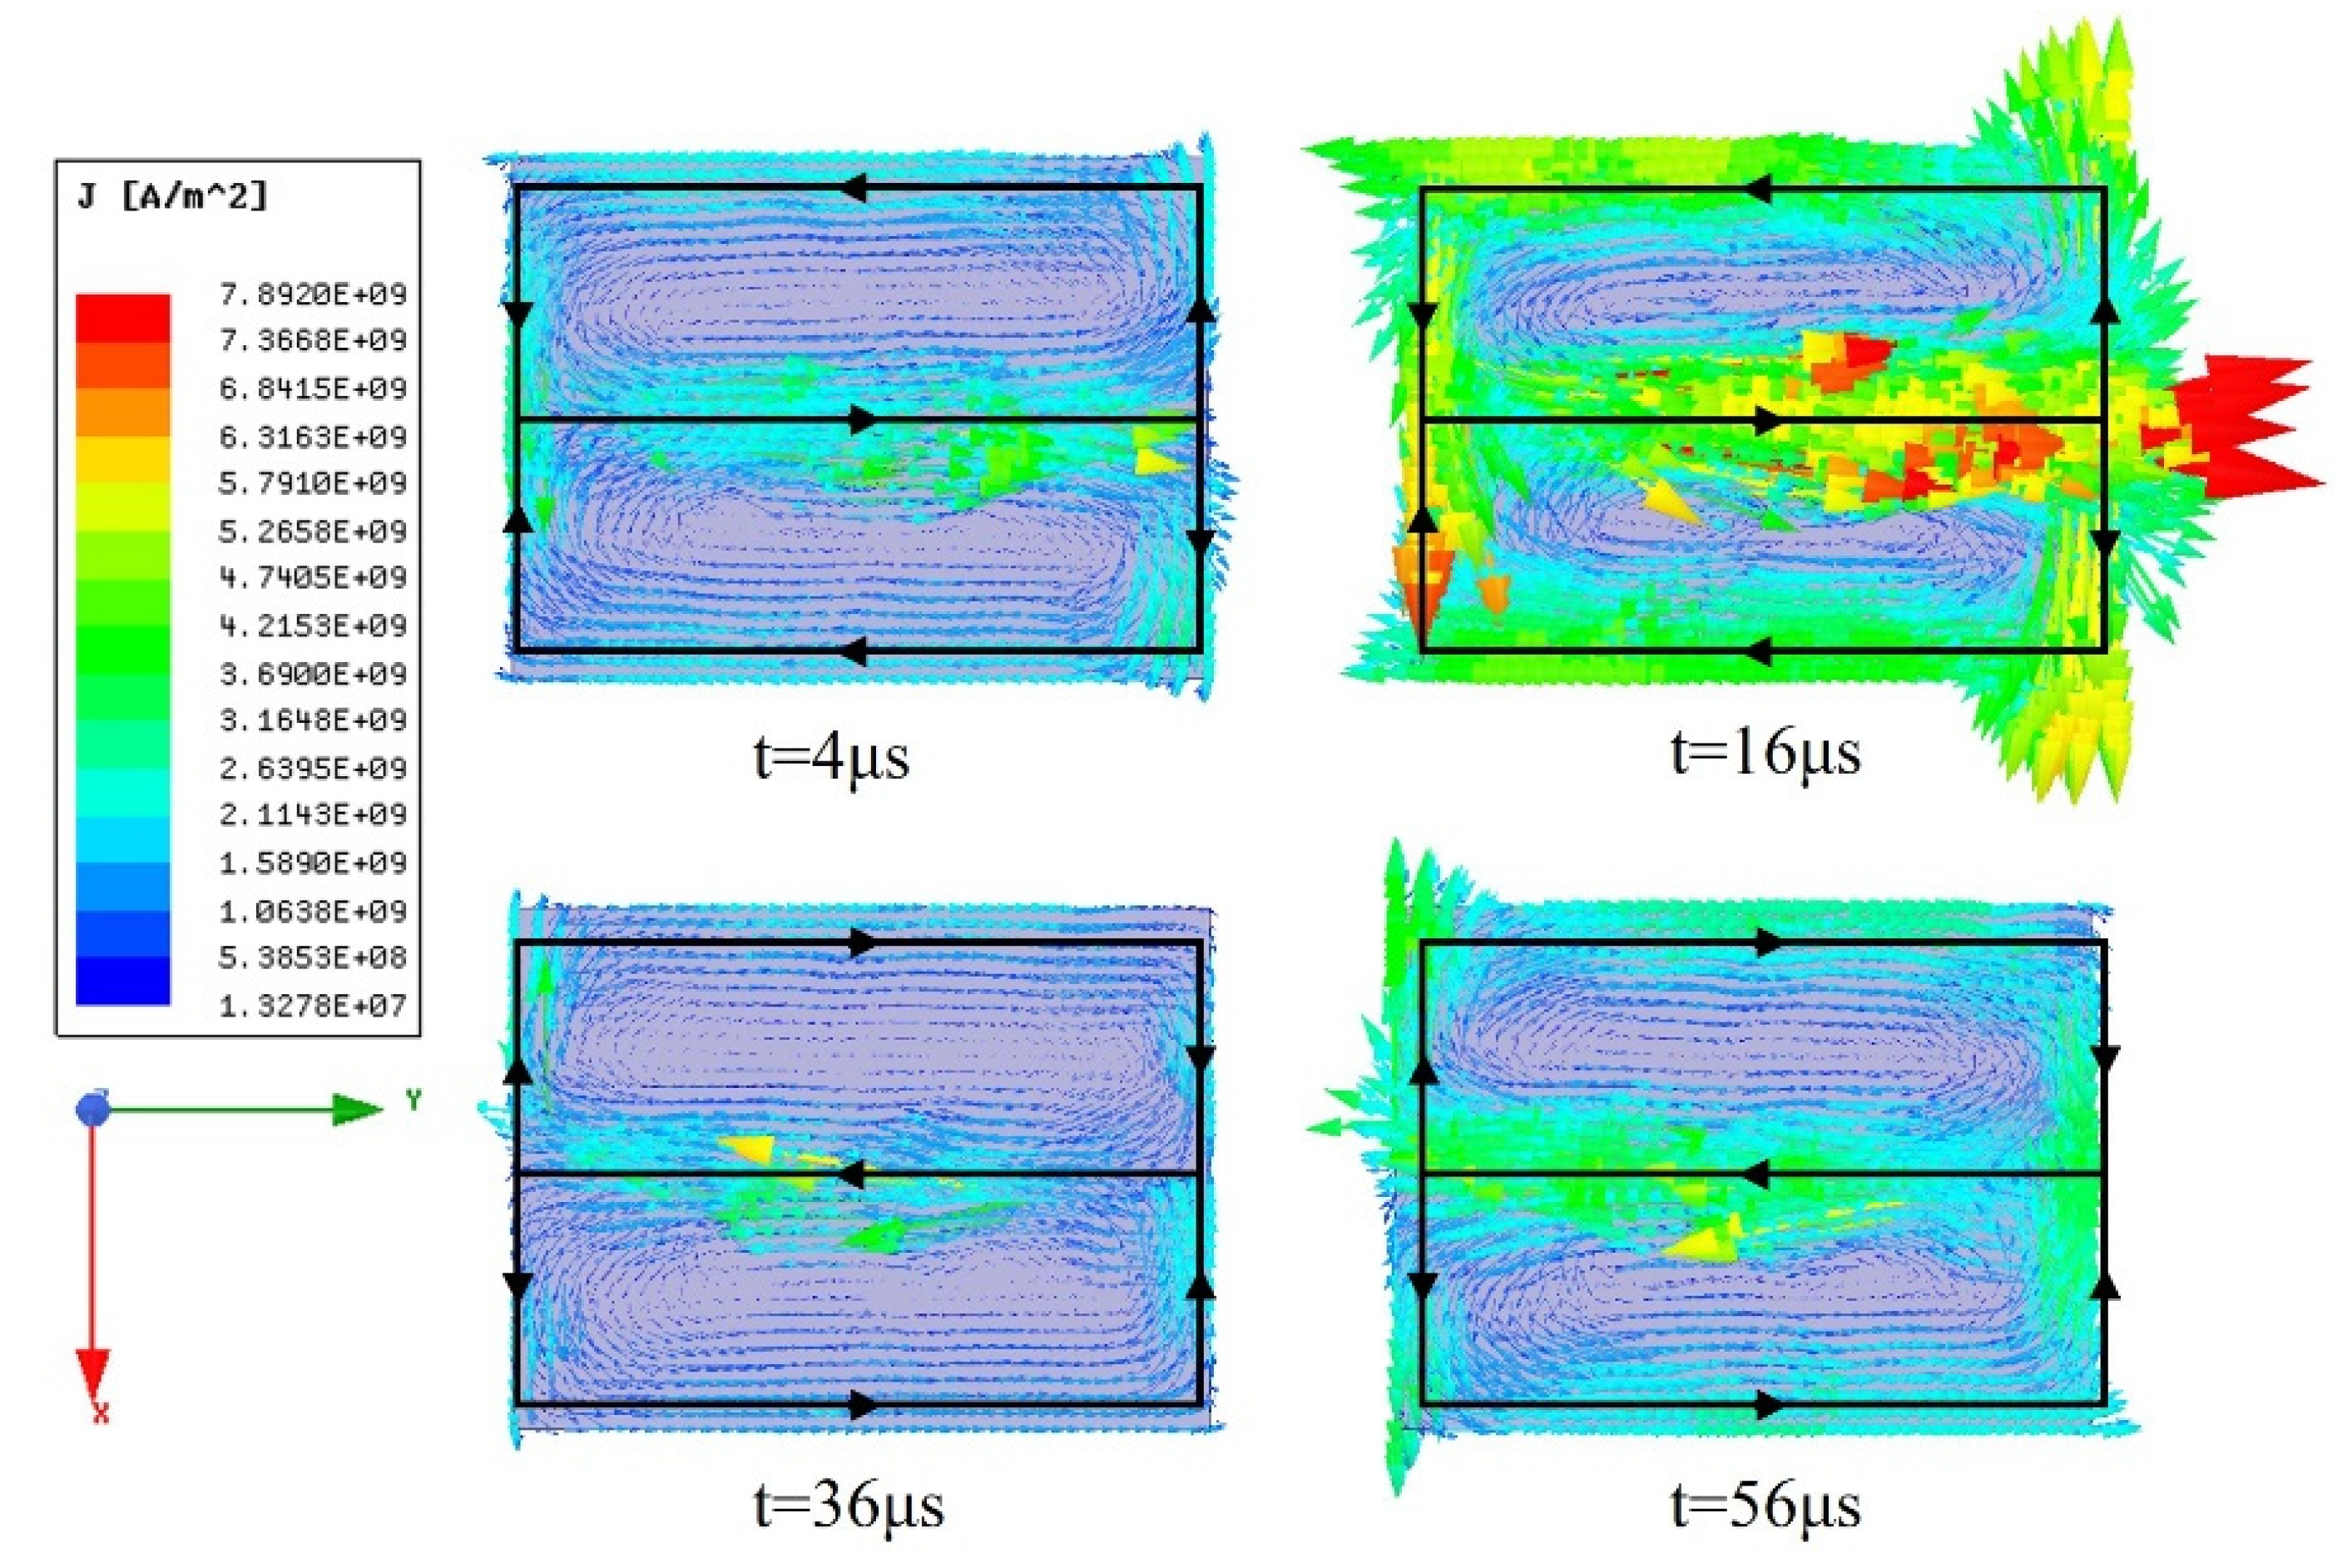
4.3. Analysis of Induced Current of the Al Sheet

Figure 13 shows the distribution of the current passing through the coil and the induced current of the sheet in the first discharge cycle when the discharge voltage is 14 KV. It can be seen from the figure that the induced current is mainly concentrated in the Al sheet directly above the coil, which has the same distribution as the magnetic induction intensity that is caused by the skin effect. In addition, it can also be seen from the cloud image that the induced current density of the Al sheet surface adjacent to the coil is much higher than that of other positions. The rapid change of the magnetic field makes the induced electromotive force in the Al sheet larger, and the resistivity of the Al sheet is very small, resulting in a large current density. On the other hand, the skin effect inside the coil is ignored when ANSYS/EMAG calculates the loading excitation current density. By default, the current density inside the coil is evenly distributed, which has a certain deviation from the actual situation.

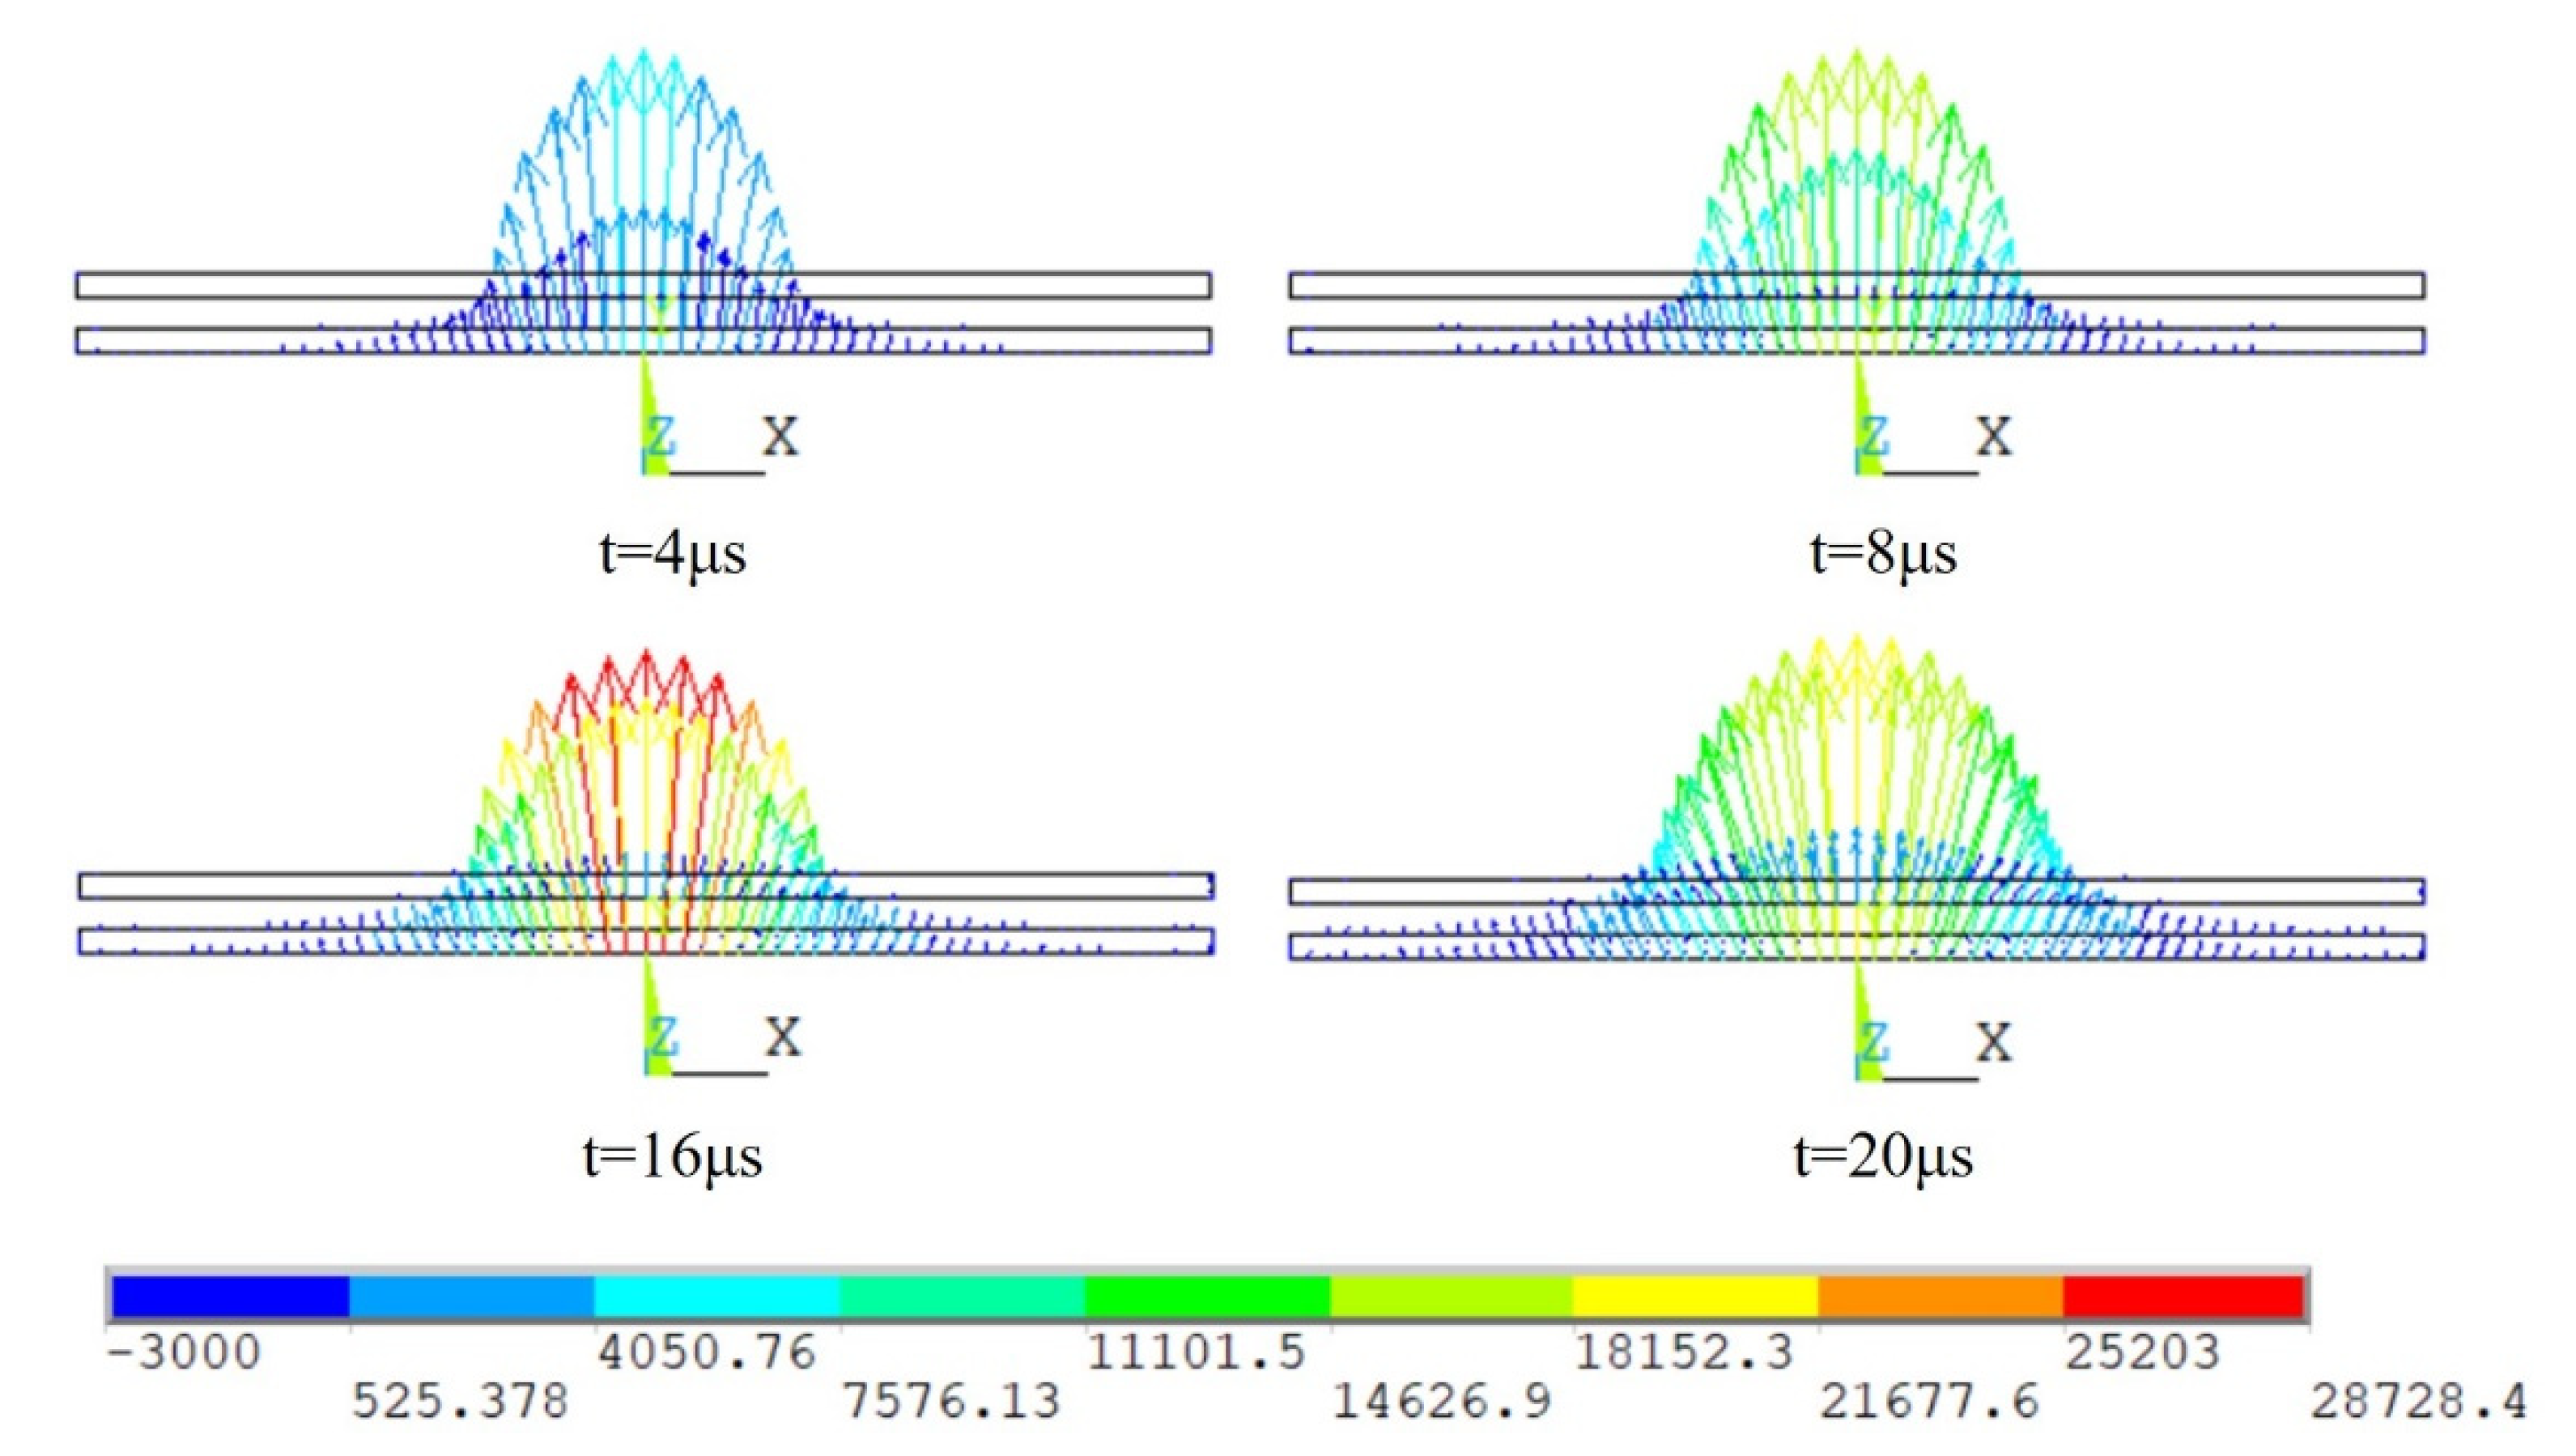
4.4. Analysis of Electromagnetic Force on Al Sheet

In the process of Al-Mg MPW, the Al sheet is affected by the electromagnetic force of the induced magnetic field around the coil. The magnitude of the electromagnetic force directly affects the speed and angle of the collision between the Al sheet and the Mg sheet. Figure 14 shows the distribution of the electromagnetic force on the Al sheet in the first half of the discharge cycle when the discharging voltage is 14 KV and the spacing between the sheets is 1.4 mm. The electromagnetic force on the Al sheet increases first and then decreases, which is related to the changing trend of the current loaded by the coil. It can be seen from the distribution of electromagnetic force that the electromagnetic force of the Al sheet is normally distributed in the center of the Al sheet, and the electromagnetic force decreases from the center of the Al sheet to both sides. Therefore, it can be known that the central area of the Al sheet has the largest force. When the electromagnetic force is greater than the deformation resistance of the Al sheet, deformation begins to occur, and the Al sheet collides with the Mg sheet, causing welding. However, due to the symmetrical distribution of the electromagnetic force on the Al sheet, the collision angle of the first collision point in the collision process is 0, and if the rebound occurs, this leads to the failure of welding in the central area of the sheet [11,12,14].

5. ANSYS/LS-DYNA 2D Structural Field Numerical Simulation

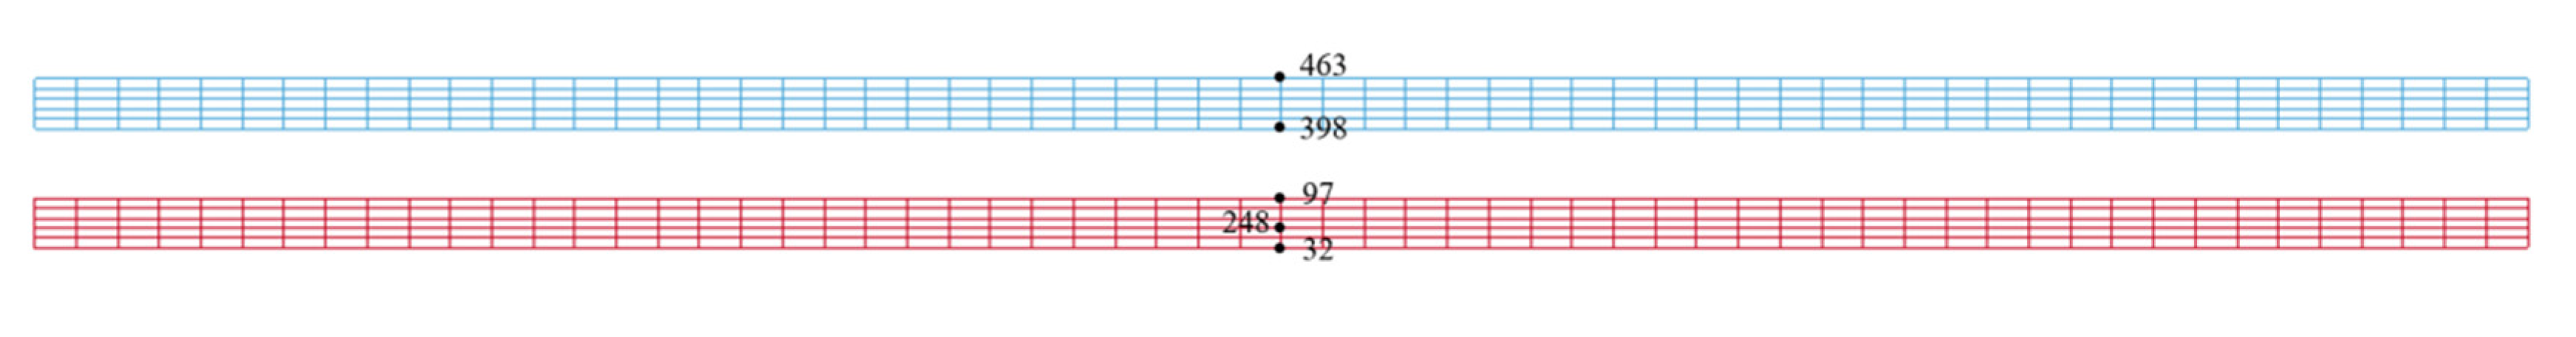
5.1. Model Establishment

ANSYS/LS-DYNA software was used to solve the high-speed collision process of the flyer sheet and base sheet. The electromagnetic force of each node of the Al sheet obtained in the 2D electromagnetic field simulation needs to be loaded as the boundary condition of the structural field model. Therefore, the model size and mesh type in the structural field analysis were exactly the same as that of the electromagnetic field, to ensure that the node number of the sheet in the structural field model was exactly the same as that of the electromagnetic field. The types and parameters of material elements in the structural field simulation are shown in Table 3.
The Johnson–Cook constitutive model was used to describe the dynamic mechanical behavior of an Al sheet under electromagnetic force. Relevant constitutive parameters are shown in Table 4.
In the process of MPW, the Mg sheet is affected by the high-speed impact of the Al sheet, but due to the restriction of the pressing block above the Mg sheet, it does not produce large deformation; thus, the Mg sheet adopts the elastoplastic model. The symmetric penalty function algorithm was used for the contact algorithm of Al-Mg collision, and the ASS2D automatic contact model was used for analyzing contact type.

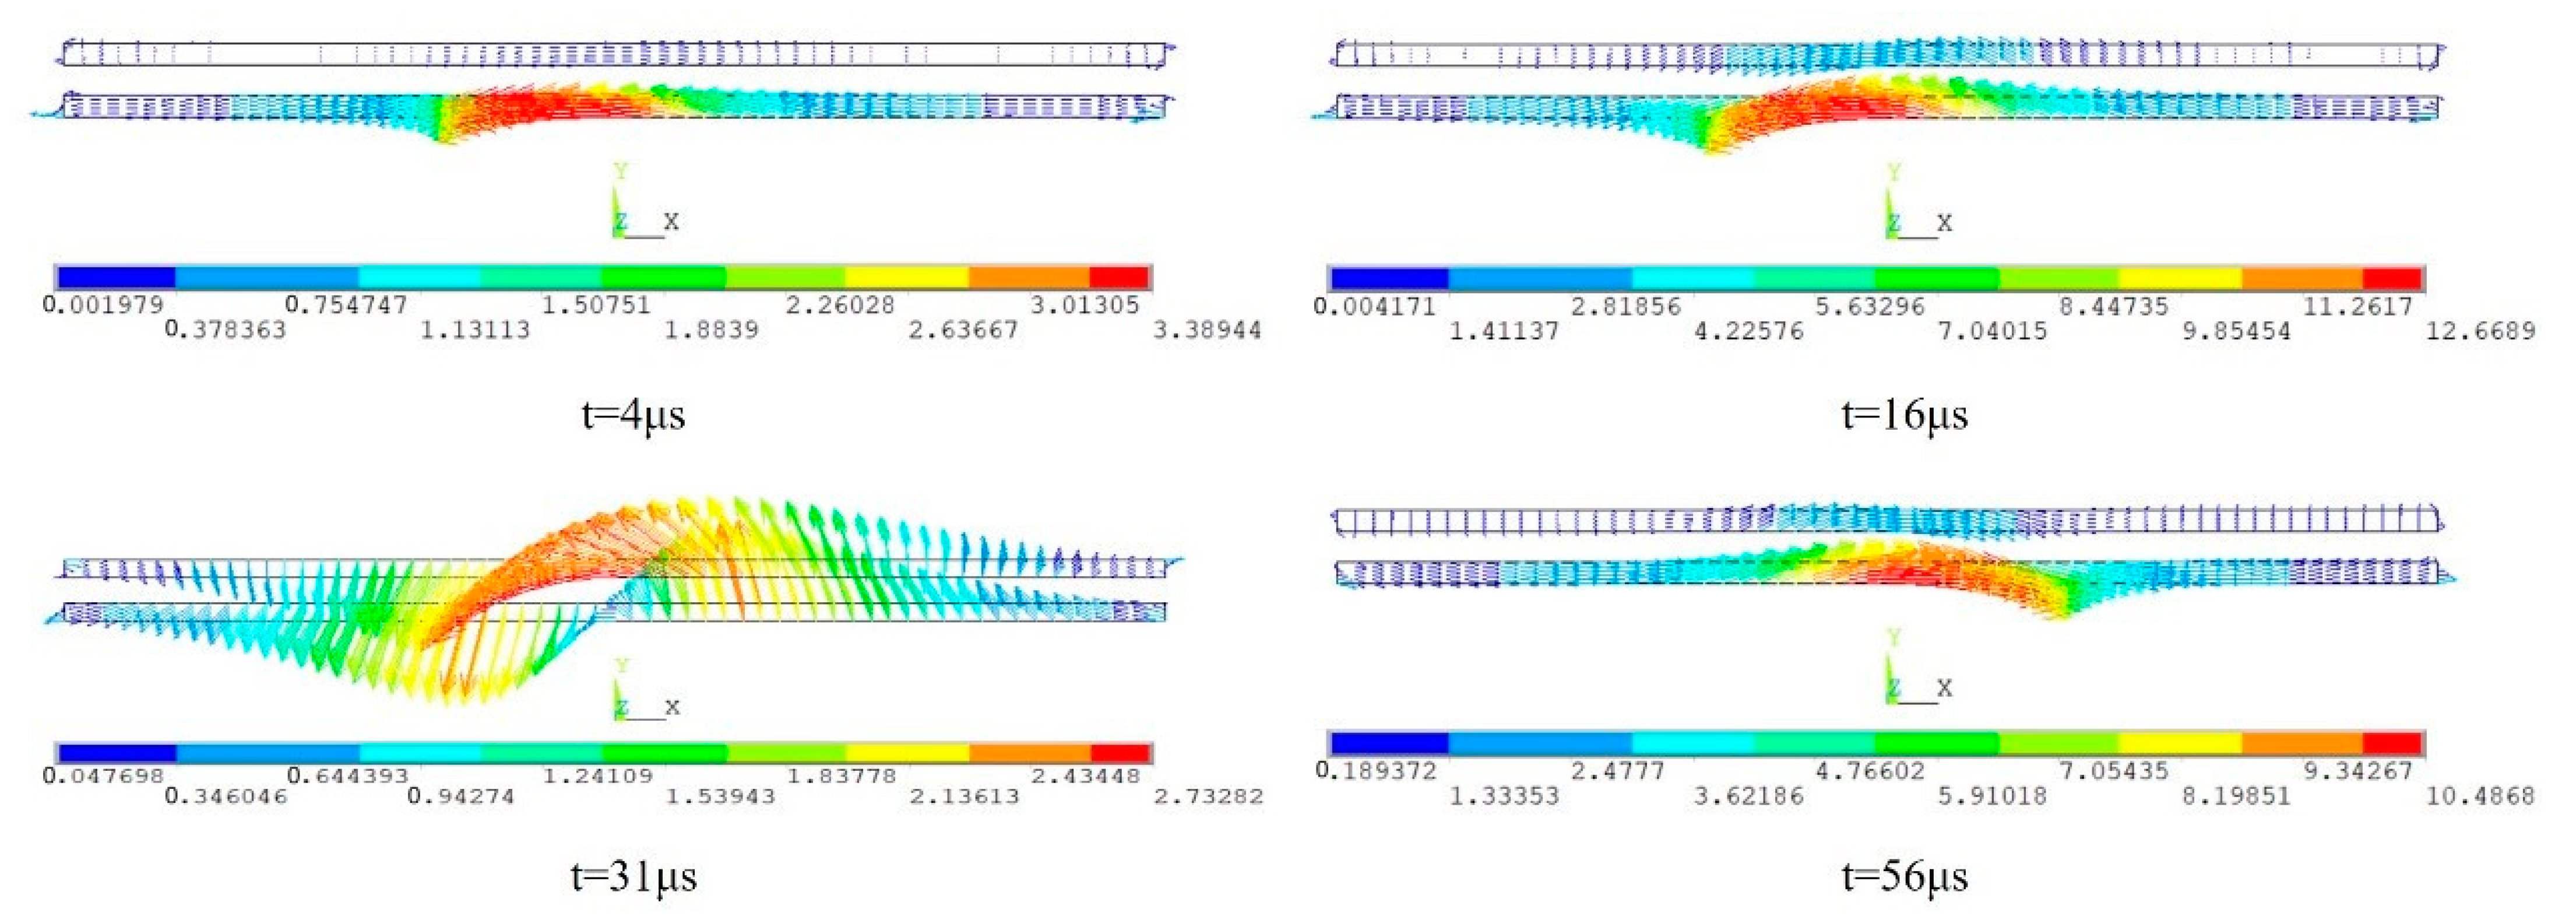
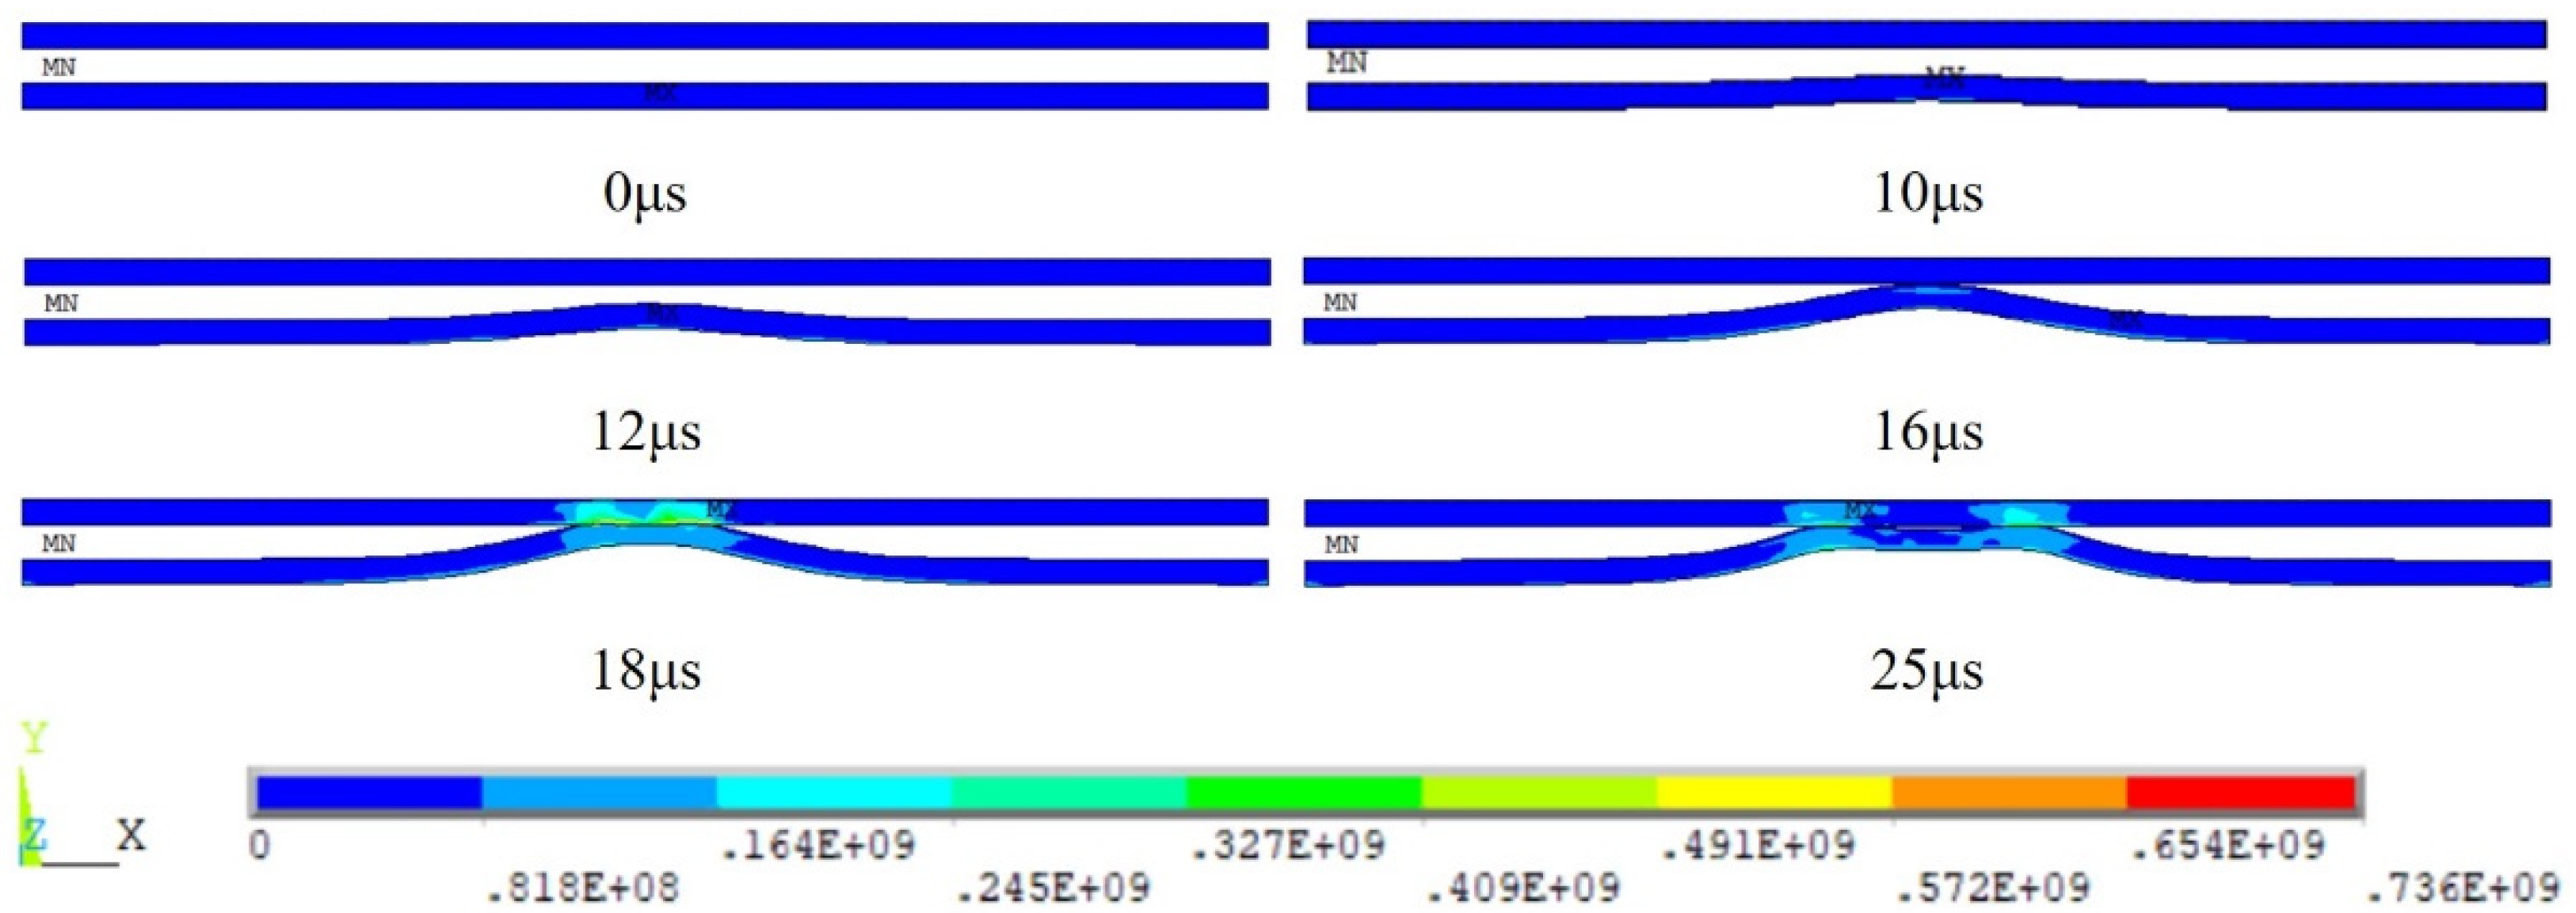
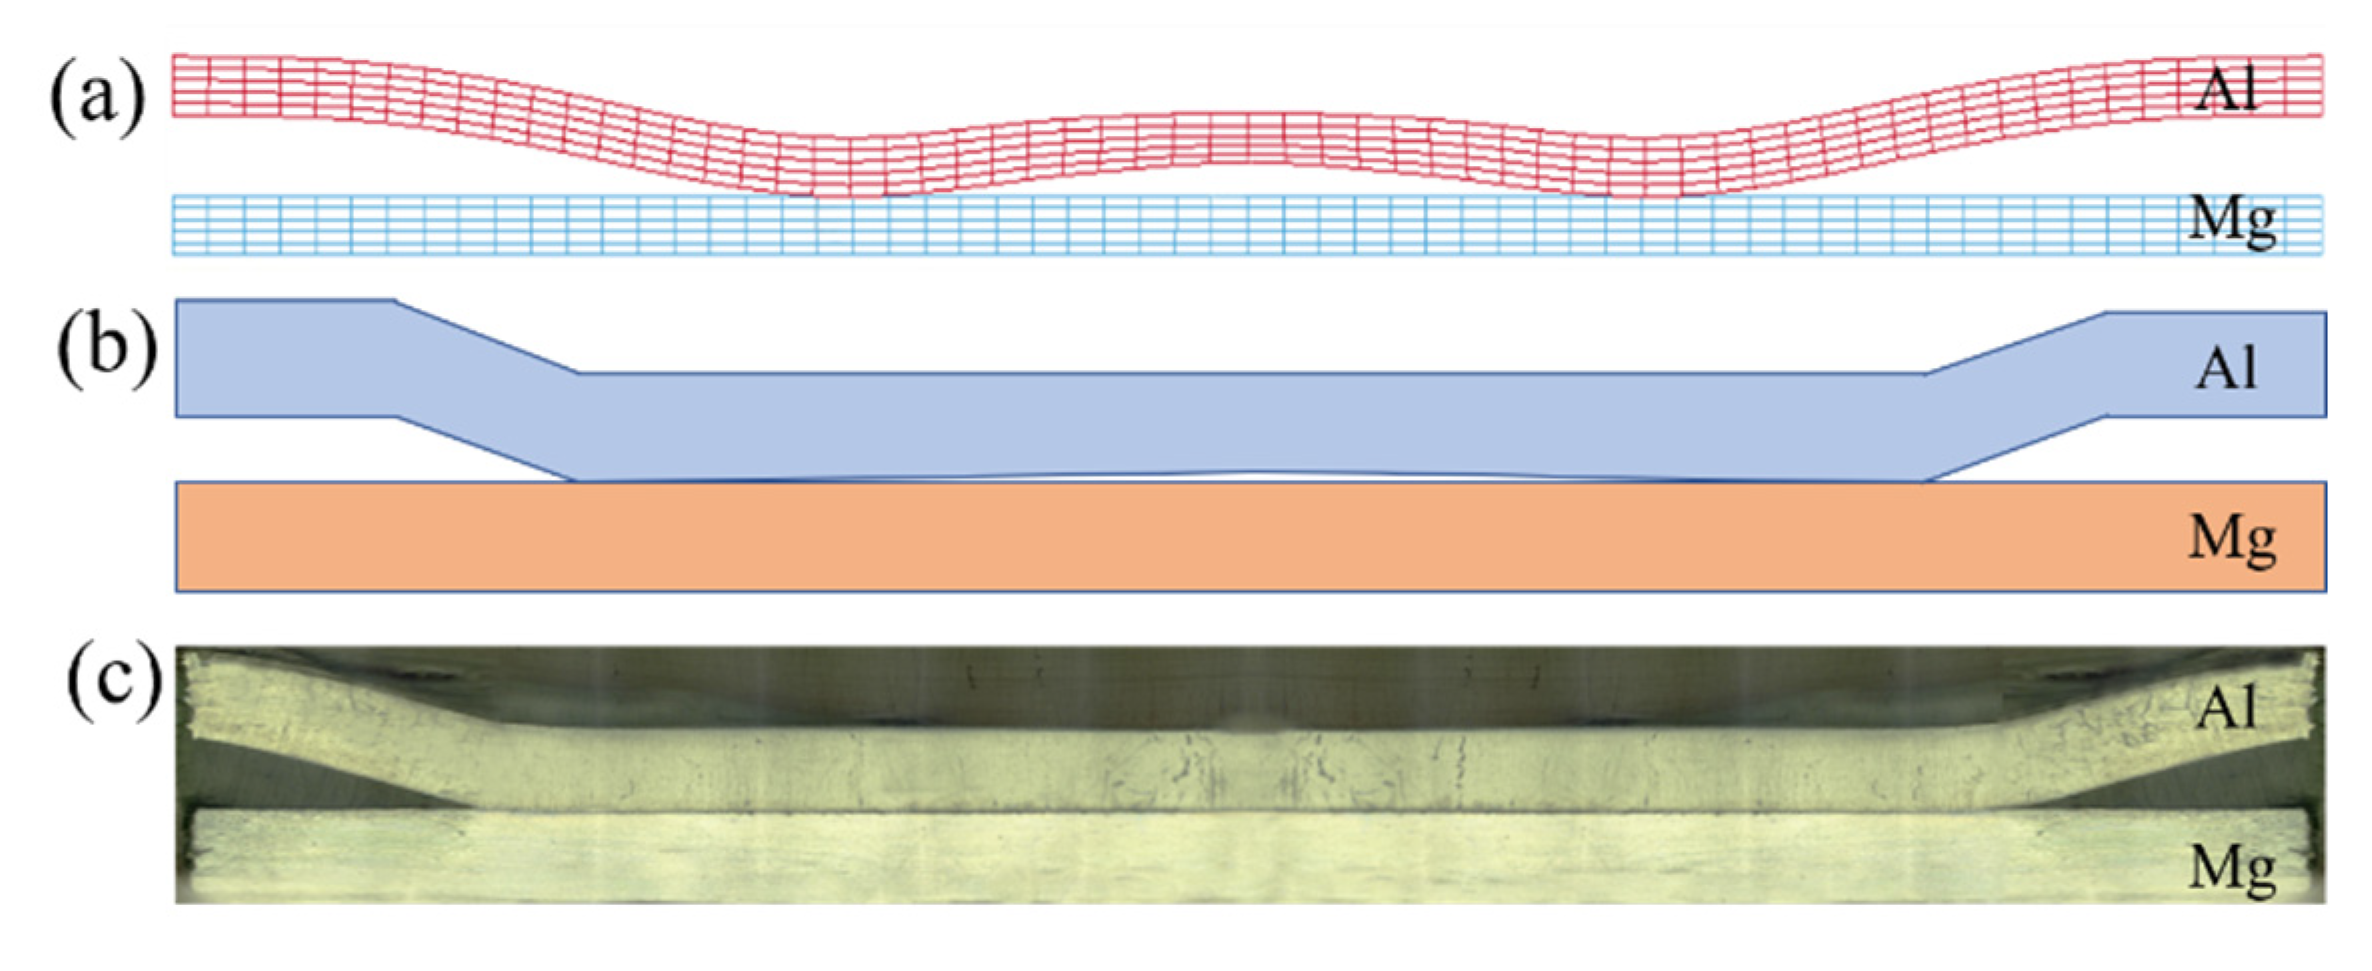
5.2. Structural Field Analysis

Figure 15 shows the von Mises stress distribution of the Al sheet impacted with the Mg sheet under the action of the electromagnetic force, which reproduces the transient forming process of Al and Mg MPW. The transient simulation results of the structural field are consistent with the deformation process of flyer sheets in MPW recorded by Watanabe M et al. [17] and Zhou Yan et al. [14] through a high-speed camera. At the initial stage of capacitor bank discharge, although the Al sheet is affected by electromagnetic force, the electromagnetic force is less than the deformation resistance of the Al sheet, which is not enough to cause deformation of the Al sheet. With an increase in time, the electromagnetic force increases gradually, and at about 10 μs the middle position of the Al sheet begins to deform and the deformation area of the Al sheet becomes more and more obvious, as seen in the middle of the “camel shape”. At the time of 16 μs, the center of the Al sheet collides with the Mg sheet, resulting in contact stress. According to the cloud image at the time of 25 μs, the stress in the middle is 0, indicating that the welding gap is formed by spring back. This is caused by the collision angle of the first contact position being 0, which is similar to the principle described by Li Yan et al. [18] that says that the boundary effect occurs at the position of the initiation point in the explosive welding and cannot be recombined. When the nodes in the central area collide with the Mg sheet, the nodes on both sides close to the center impact the Mg sheet to realize welding.
Figure 16a is a schematic diagram of typical nodes in Al-Mg MPW at a certain moment. The 97# node is the center point of the model, the 86# node is the welding zone and the 77# node is the undeformed zone of the Al sheet. The electromagnetic force variation curve of a typical node in the center of the Al sheet is shown in Figure 16b. After the system is energized, the electromagnetic force increases first and then decreases. At the initial electrification stage, the electromagnetic force is too small to deform the Al sheet. At the time of 16 μs, the maximum instantaneous electromagnetic force of the 97# node is 24 KN, the maximum electromagnetic force of the 86# node is 11 KN, the maximum electromagnetic force of the 77# node is small, and the farther the node is from the middle position, the smaller the electromagnetic force is. Figure 16c shows the curve of the Y-direction velocity of typical nodes on the upper surface of the Al sheet changing with time. From 0 μs to 16 μs, the velocity of the 97# node gradually increases to about 300 m/s, then suddenly changes to 0 and produces reverse velocity, which is the result of the contact collision and rebound between the Al sheet and Mg sheet. The 97# node in the center of the surface of the Al sheet first collides with the Mg sheet, and then the nodes on both sides gradually collide with the Mg sheet. The collision angle gradually increases, making the impact velocity produce components in the X-axis direction, providing favorable conditions for the generation of jet flow and the formation of a good welded joint [13,15]. After the collision between the 86# node and the Mg sheet, the speed instantly becomes 0 m/s without the reverse speed, indicating that the Al and Mg realize the recombination and become one. The velocity of node 77# is always 0, indicating that the electromagnetic force at node 77# is small and does not move.
To validate the numerical model, the magnetic pulse welding experiment was conducted. Experimental parameters of magnetic pulse welding were chosen based on the above numerical simulation. The impact velocity of the nodes in the central area of the Al sheet was the largest, and the speed of the nodes on both sides was gradually reduced, which is consistent with the electromagnetic force that affected the Al sheet; finally, the typical cross-section morphology of the welded joint of the “intermediate zone rebound uncomposite zone-welding bonding zone-unbound zone” is formed, which is the same as the cross-section of the Al-Mg sheet magnetic pulse welded joint obtained in the test [12,19]. Therefore, the simulation results explain the formation mechanism of the magnetic pulse sheet joint well. Figure 17 shows the comparison diagram of the Al-Mg magnetic pulse welding joint interface. Figure 17c shows the actual welding diagram; considering the influence of environment and other factors, it is roughly the same as the simulation result.
In the comparison of the experiment and numerical simulation, both of the results about the interface morphology are coherent, which further validates the accuracy of the magnetic pulse welding numerical model.

6. Conclusions

Taking Al-Mg MPW as an example, this paper studied the transient forming mechanism of MPW by analyzing the electromagnetic field of the capacitor bank discharge and the structure field of the flyer sheet under the action of electromagnetic force by using finite element simulation, and obtained the following conclusions:
(1) The discharge current of the MPW capacitor bank has the characteristics as periodic oscillation, and its variation process is an underdamped type, presenting periodic vibration with decreasing amplitude. Through the 3D electromagnetic field simulation analysis, the induced current and magnetic field are the largest in the Al sheet area around the center of the coil. The induction current direction in the Al sheet changes with the current direction of the coil, and changes once in half a cycle. The direction of the electromagnetic force on the Al sheet is positive along the Z-axis and remains unchanged.
(2) The variation law of the magnetic induction intensity of the flyer sheet is similar to that of the coil discharge current, which is in the form of oscillation attenuation. Under the action of the skin effect, the magnetic induction intensity on the lower surface of the Al sheet is the largest. At the time of 16 μs, the magnetic induction intensity reaches a peak value of about 12.6 T.
(3) Structural field simulation reproduces the transient forming process of MPW. The maximum magnetic force of the middle node of the flyer sheet can reach 24 KN, and the middle node area first collides with the base sheet. If the collision angle at the middle node is 0, then the rebound occurs, the reverse velocity is generated and the rebound noncomposite zone is formed. After the collision of the middle node area, the collision occurs gradually on both sides, resulting in the welding joint area. Other areas are not able to collide because they are less affected by the electromagnetic force.

Author Contributions

Z.W. conceived and designed the research project; Y.L. performed the electronic numerical simulation; W.Y. performed the structural numerical simulation; D.Y. wrote the paper and designed the article structure; C.L. analyzed the data and contributed to the revision of the paper. All authors have read and agreed to the published version of the manuscript.

Funding

This research was funded by Shanxi Youth Science Foundation Project grant number [201901d211291], National Key Research and Development Program of China grant number [2018YFA0707305], Shanxi Key Research and Development Program grant number [202101120401008] and Key research and development projects in Shanxi Province grant number [202102050201001].

Institutional Review Board Statement

Not applicable.

Informed Consent Statement

Not applicable.

Data Availability Statement

Not applicable.

Conflicts of Interest

The authors declare no conflict of interest.

References

  1. Khorasani, M.; Ghasemi, A.M.H.; Rolfe, B.F.; Gibson, I. Additive manufacturing a powerful tool for the aerospace industry. Rapid Prototyp. J. 2021, 28, 87–100. [Google Scholar] [CrossRef]
  2. Ben-Artzy, A.; Munitz, A.; Kohn, G.; Bronfin, B.; Shtechman, A. Joining of light hybrid constructions made of magnesium and aluminum alloys. Magnes. Technol. 2002, 302. [Google Scholar]
  3. Chen, S.; Jiang, X. Microstructure evolution during magnetic pulse welding of dissimilar aluminium and magnesium alloys. J. Manuf. Processes 2015, 19, 14–21. [Google Scholar] [CrossRef]
  4. Stern, A.; Shribman, V.; Ben-Artzy, A.; Aizenshtein, M. Interface Phenomena and Bonding Mechanism in Magnetic Pulse Welding. J. of Materi Eng and Perform 2014, 23, 3449–3458. [Google Scholar] [CrossRef]
  5. Casalino, G.; Ludovico, A.D. Finite element simulation of high speed pulse welding of high specific strength metal alloys. J. Mater. Processing Technol. 2008, 197, 301–305. [Google Scholar] [CrossRef]
  6. Shim, J.Y.; Kang, B.Y.; Kim, I.S.; Kang, M.J.; Kim, I.J. A Study on Distributions of Electromagnetic Force of the Dissimilar Metal Joining in MPW Using a FEM. Adv. Mater. Res. 2009, 83, 214–221. [Google Scholar] [CrossRef]
  7. Shim, J.Y.; Kang, B.Y. Distribution of Electromagnetic Force of Square Working Coil for High-Speed Magnetic Pulse Welding Using FEM. Mater. Sci. Appl. 2013, 04, 856–862. [Google Scholar] [CrossRef] [Green Version]
  8. Xu, Z.; Cui, J.; Yu, H.; Li, C. Research on the impact velocity of magnetic impulse welding of pipe fitting. Mater. Des. 2013, 49, 736–745. [Google Scholar] [CrossRef]
  9. Mishra, S.; Sharma, S.K.; Kumar, S.; Sagar, K.; Shyam, A. 40 kJ magnetic pulse welding system for expansion welding of aluminium 6061 tube. J. Mater. Processing Technol. 2017, 240, 168–175. [Google Scholar] [CrossRef]
  10. Serizawa, H.; Shibahara, I.; Rashed, S.; Murakawa, H. Numerical Study of Joining Process in Magnetic Pressure Seam Welding. Trans. JWRI 2009, 38, 63–68. [Google Scholar]
  11. Li, C.X.; Du, J.; Zhou, Y.; Shen, T.; Yao, C.G. Development of Electromagnetic Pulse Welding Equipment for Plates and Experimental Research on Magnesium/Aluminum Alloy Welding. Trans. China Electrotech. Soc. 2021, 36, 2018–2027. [Google Scholar]
  12. Zhu, C.C.; Sun, L.Q.; Gao, W.L.; Li, G.Y.; Cui, J.J. The effect of temperature on microstructure and mechanical properties of Al/Mg lap joints manufactured by magnetic pulse welding-ScienceDirect. J. Mater. Res. Technol. 2019, 8, 3270–3280. [Google Scholar] [CrossRef]
  13. Chen, S.J.; Yu, Y.; Xia, Y.; Liu, K.L.; Lu, Z.Y. Heat Production Mechanism at Al-Mg Magnetic Pulse Welding Interface. Rare Met. Mater. Eng. 2013, 42, 5. [Google Scholar]
  14. Zhou, Y.; Li, C.X.; Du, J.; Wang, X.M.; Yao, C.G. Investigation on the Effect of Discharge Voltage on Metal Jet and Bonded Interface in Mg-Al Magnetic Pulse Welding. Trans. China Electrotech. Soc. 2022, 37, 11. [Google Scholar]
  15. Chen, S.J.; Xia, Y.; Yu, Y.; Lu, Z.Y. Morphology Study of Al-Mg Alloy Magnetic Pulse Welding Interface. Rare Met. Mater. Eng. 2012, 41, 352–355. [Google Scholar]
  16. Sapanathan, T.; Chernikov, D.; Yang, K. Thermal Effect during Electromagnetic Pulse Welding Process. Mater. Sci. Forum 2017, 879, 1662–1667. [Google Scholar] [CrossRef]
  17. Watanabe, M.; Kumai, S. High-Speed Deformation and Collision Behavior of Pure Aluminum Plates in Magnetic Pulse Welding. Mater. Trans. 2009, 59, 2035–2042. [Google Scholar] [CrossRef] [Green Version]
  18. Li, Y.; Wu, Z. Microstructural Characteristics and Mechanical Properties of 2205/AZ31B Laminates Fabricated by Explosive Welding. Met.-Open Access Metall. J. 2017, 7, 125. [Google Scholar] [CrossRef]
  19. Zhu, C.C.; Meng, Y.F.; Liu, Q.X.X.; Li, G.Y.; Cui, J.J. Study on Process and Mechanical Properties of Al/Mg Dissimilar Metal Sheet Joints by Magnetic Pulse Welding. J. Netshape Form. Eng. 2021, 13, 7. [Google Scholar]
Figure 1. The principles of the MPW process.
Metals 12 01149 g001
Figure 2. The principal configuration of MPW process.
Metals 12 01149 g002
Figure 3. MPW circuit diagram. (a) circuit configuration of the magnetic pulse welding equipment; (b) simplify RLC circuit.
Metals 12 01149 g003
Figure 4. Output current waveform with discharge voltage of 14 KV.
Metals 12 01149 g004
Figure 5. Three-dimensional electromagnetic field simulation model of MPW.
Metals 12 01149 g005
Figure 6. Spatial magnetic field distribution near the 12 μs discharging coil.
Metals 12 01149 g006
Figure 7. Induced current distribution in Al sheet.
Metals 12 01149 g007
Figure 8. Distribution of electromagnetic force of Al sheet.
Metals 12 01149 g008
Figure 9. Two-dimensional electromagnetic field model and grid.
Metals 12 01149 g009
Figure 10. Distribution of magnetic induction intensity at typical moments.
Metals 12 01149 g010
Figure 11. Typical nodes in the thickness direction of the model.
Metals 12 01149 g011
Figure 12. Magnetic induction intensity of typical nodes in the thickness direction of the model.
Metals 12 01149 g012
Figure 13. Induced current distribution at typical time.
Metals 12 01149 g013
Figure 14. Distribution of electromagnetic force at typical time.
Metals 12 01149 g014
Figure 15. The von Mises stress distribution at typical time during collision.
Metals 12 01149 g015
Figure 16. The electromagnetic force and velocity curves of the nodes. (a) The position of the node; (b) electromagnetic force; (c) typical node velocity variation.
Metals 12 01149 g016
Figure 17. Comparison diagram of Al-Mg magnetic pulse welding joint interface. (a) Simulation diagram; (b) ideal schematic; (c) actual welding drawing.
Metals 12 01149 g017
Table 1. Related electrical parameters.
ParameterLi/nHCi/μFRi/mΩβT/μs
Value354.492406.227690.9263
Table 2. Material parameters of 2D electromagnetic field model.
NameMaterialResistivity/(Ω·m)Relative PermeabilityUnit Type
CoilCopper alloy1.75 × 10−81PLAN 13
Al sheetAl 10602.83 × 10−81PLAN 13
Mg sheetAZ31B4.45 × 10−81PLAN 13
The near air
element region
---+∞1PLAN 13
The far air
element region
---+∞1INFIN 110
Table 3. Material parameters of structural field model.
NameMaterialDensity/(kg·m3)Elastic Modulus (GPa)Poisson RatioUnit Type
Al sheet10602.71 × 103690.33PLANE 162
Mg sheetAZ31B1.78 × 103450.35PLANE 162
Table 4. Parameters of Johnson–Cook model for Al sheet.
MaterialA (MPa)B (MPa)Cnm
1060 Al35.568.70.0150.140.018
Publisher’s Note: MDPI stays neutral with regard to jurisdictional claims in published maps and institutional affiliations.

