Article

Effect of Bending Process on Microstructure, Mechanical Properties and Crack Formation of 5% Ni Steel

1
Key Laboratory of Material Physics, Ministry of Education, School of Physics and Microelectronics, Zhengzhou University, Zhengzhou 450052, China
2
School of Electrical Engineering, Zhengzhou University, Zhengzhou 450001, China
3
School of Materials Science and Engineering, Northeastern University, Shenyang 110819, China
4
State Key Laboratory of Rolling and Automotion, Northeastern University, Shenyang 110819, China
*
Authors to whom correspondence should be addressed.
Metals 2022, 12(7), 1188; https://doi.org/10.3390/met12071188
Submission received: 3 June 2022 / Revised: 8 July 2022 / Accepted: 8 July 2022 / Published: 12 July 2022
(This article belongs to the Special Issue Advanced Technology in Microalloyed Steels)

Abstract

:
The 5% Ni steel is often used to make steel storage tanks to store liquefied natural gas (LNG). Herein, the microstructure and mechanical properties of 5% Ni steel samples during bending were studied through combining scanning electron microscopy, energy dispersive spectroscopy, optical microscopy, X-ray diffraction, and electron backscattered diffractometer methods with tensile tests. The outer and inner arcs underwent tensile and compressive stress, respectively, resulting in a severely deformed microstructure with a high density of dislocation, improving both the tensile and yield strengths. The ductility of the 5% Ni steel samples decreased significantly after bending due to the work hardening and dislocation accumulation. During bending, the shear bands occurred at the surface or subsurface, which were caused by strain localization. Amounts of “harder” grains with high TF and more orange and red KAM areas with high local strain at the outer and inner arcs produced a greater stress concentration than that of the mid-thickness, which can induce crack initiation and propagation due to the large deformation during bending.

1. Introduction

Liquefied natural gas (LNG) has the advantages of reasonable calorific value, lightweight, and practicality [1]. LNG storage materials need to have better resistance to crack propagation to guarantee the safety of the tanks [2]. Ni-containing cryogenic steel is used for the storage of LNG because of its excellent toughness with moderate strength and ductility, even at cryogenic temperatures [3,4]. The addition of Ni to steel usually causes solid-solution softening at low temperature, which is considered to improve the cryogenic toughness of steel [5]. However, Ni is cost-intensive [6], so Ni-reduced cryogenic steel containing 5% Ni has been recently developed [7].
Cold bending is often used to manufacture LNG tanks, which causes changes in the microstructure and the resultant mechanical properties due to the multi-axial stress and strain state. The bending deformation capacity of steel is related to the roughness of the steel surface layer and the microstructures of the surface and subsurface layers. According to Aola et al. [8], the bendability can be significantly improved by modifying the subsurface microstructure, and a relatively soft surface layer with good work hardening capacity can prevent the strain localization, resulting in better bendability. The surface roughness decreases the cold bendability when compared with an ideal smooth surface due to the severe strain localization induced by a rough surface [9].
During the bending process, the strain decreases away from the surfaces toward the mid-thickness. In some cases, strain localization occurs after bending, resulting in the failure of materials, which is closely related to the formation of shear bands, and thereby the development of microcracks [10,11,12]. A lack of studies exist concerning the bending properties of 5% Ni steel. Thus, this study investigated the changes in the microstructure and mechanical properties along the thickness direction of the bending sample. In particular, the formation of surface microcracks during cold bending and its related mechanism are discussed.

2. Materials and Methods

The chemical composition of the 5% Ni steel is presented in Table 1. The as-received 20-mm thick steel plate was subjected to quenching at 880 °C and tempering at 650 °C. The plate underwent bend deformation at a bending angle of 90° with a bending radius of 40 mm, and the bend axis was along the transverse direction (TD). The Vickers hardness values of the plate along the normal direction (ND) were evaluated using a digital hardness tester (XHD–2000TMSC, Vickers, Shanghai, China) with a 0.5 kg load for a 15 s dwelling time. The cylindrical tensile samples were taken at the location of the bending axis and unbent zones (Figure 1a). The GB/T 228.1 standard (China National Standard, China) was followed to prepare tensile samples with a 25 mm gauge length and 5 mm diameter. The tensile tests were carried out using a universal tensile testing machine (CMT5105, SANS, Shenzhen, China) at a tensile speed of 10 mm·min−1. The fracture morphologies of the samples after the tensile tests were observed using scanning electron microscopy (SEM, JSM 6700F, Leol, Tokyo, Japan).
To analyze the microstructures and inclusions on the RD–ND plane at the bending axis, the samples were etched in solutions of 4% nitric acid and saturated picric acid, respectively. Microstructural examination was observed using optical microscopy (OM, BX51M, OLYMPUS, Tokyo, Japan) and SEM. Statistical analysis of the aspect ratio of oxide inclusions was performed by the Image-Pro Plus software (Media Cybernetics, Rockville, MD, USA). To analyze the dislocation density in the ND direction at the bending axis, in situ X-ray diffractometry (XRD, PANalytical, Almelo, The Netherlands) was used with Cu-Kα (λ = 1.5418 Å). After mechanical polishing and electropolishing, the samples were scanned in the angle range of 20–101° at a speed of 1° min−1. To analyze the crystallographic and microstructural features of the cracks on the RD–ND planes of the samples, electron backscatter diffraction (EBSD) was performed. The EBSD observation plane is shown in Figure 1b. Samples for EBSD were prepared by mechanical polishing and electropolishing at room temperature. The EBSD investigation was conducted by a field-emission SEM (FESEM, ZEISS, Oberkochen, Germany) at an accelerating voltage of 20 kV. The total scan area was 150 μm × 200 μm at a step of 0.2 μm. The HKL Channel 5 software (Oxford, UK) was used for data post-processing.

3. Results and Discussion

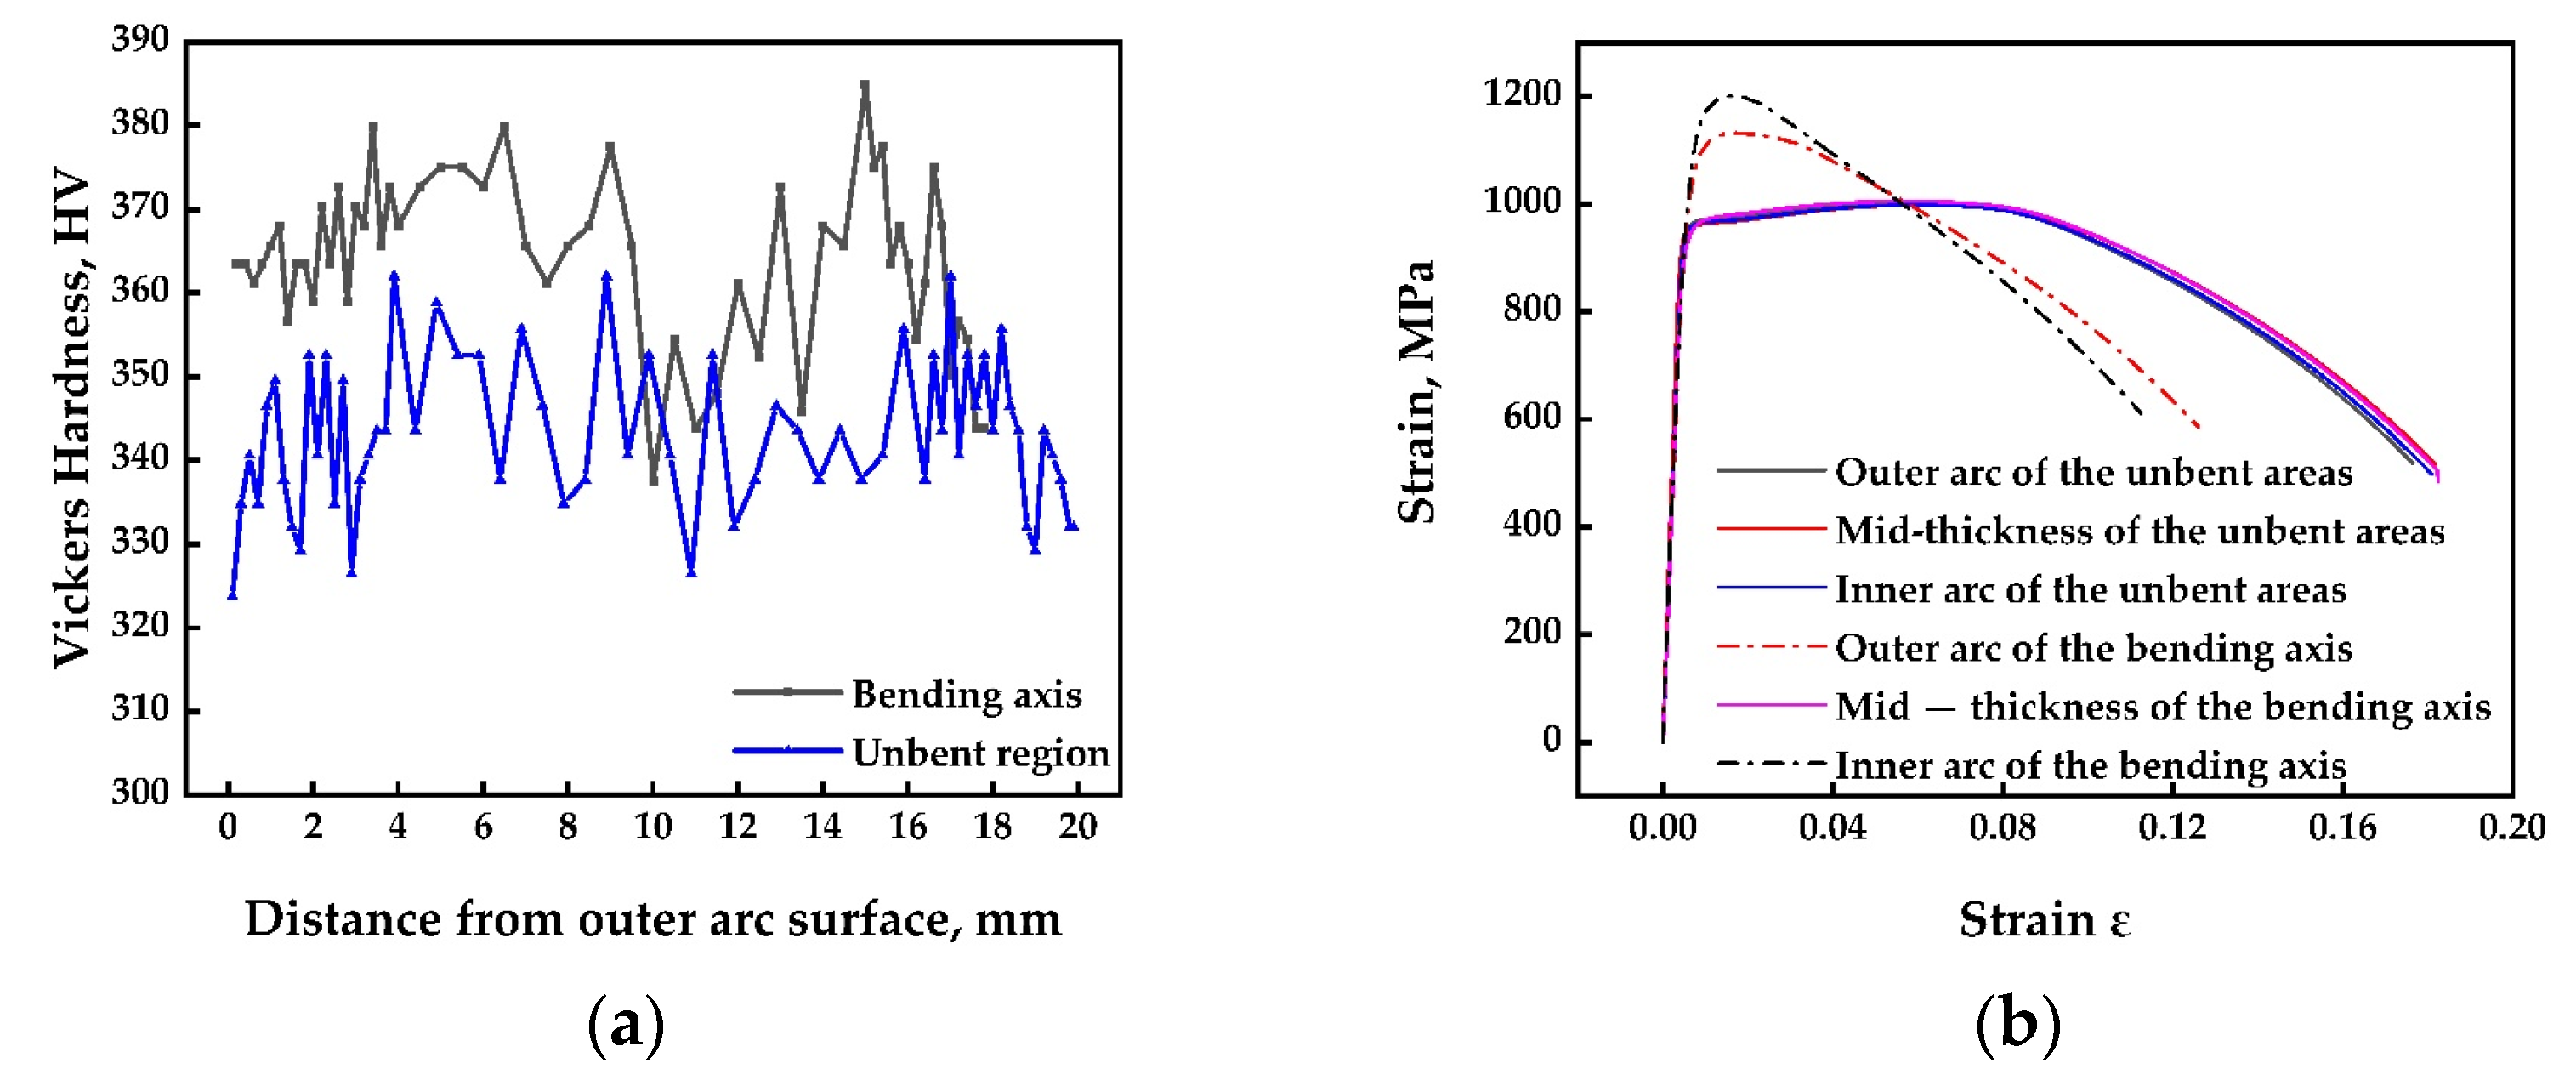
3.1. Mechanical Properties

The distribution of hardness values along the ND of the bending axis and unbent zones is presented in Figure 2a. The hardness value was found to increase as the bending axis was approached. Figure 2b shows the engineering stress–strain curves of the bending-axis zone and unbent-zone samples in the TD. Obviously, the samples from the unbent and mid-thickness (neutral axis) zones at the bending axis had relatively high tensile ductility, whereas the tensile ductility decreased for those samples from the inner and outer arcs at the bending axes. Table 2 presents the ultimate tensile strength (UTS), yield strength (YS), elongation, and area reduction values of the tensile samples. Evidently, as the deformation amount increased from the unbent zone to the bending zone at the bending axis, both values of the UTS and YS increased, whereas both values of the elongation and area reduction decreased. Compared with the unbent samples, the UTS and YS at the inner arc of the bending zone increased 203 MPa and 194 MPa, respectively, whereas the total elongation and area reduction decreased by 4.16% and 8.96%, respectively. The deformation was nonuniform along the ND at the bending axis. The deformation amount decreased gradually from the surface to the mid-thickness. The difference in UTS and YS between the inner arc and mid-thickness at the bending zone was approximately 196 MPa and 195 MPa high, respectively. Conversely, the difference in the total elongation and area reduction between the surface and mid-thickness were about 3.6% and 9.83% low, respectively. Thus, it can be concluded that the mechanical properties were closely associated with the degree of the bending deformation (i.e., the strength increased but the ductility decreased with bending deformation, which is known as the strength–ductility trade-off [13]).

3.2. Microstructural Analysis

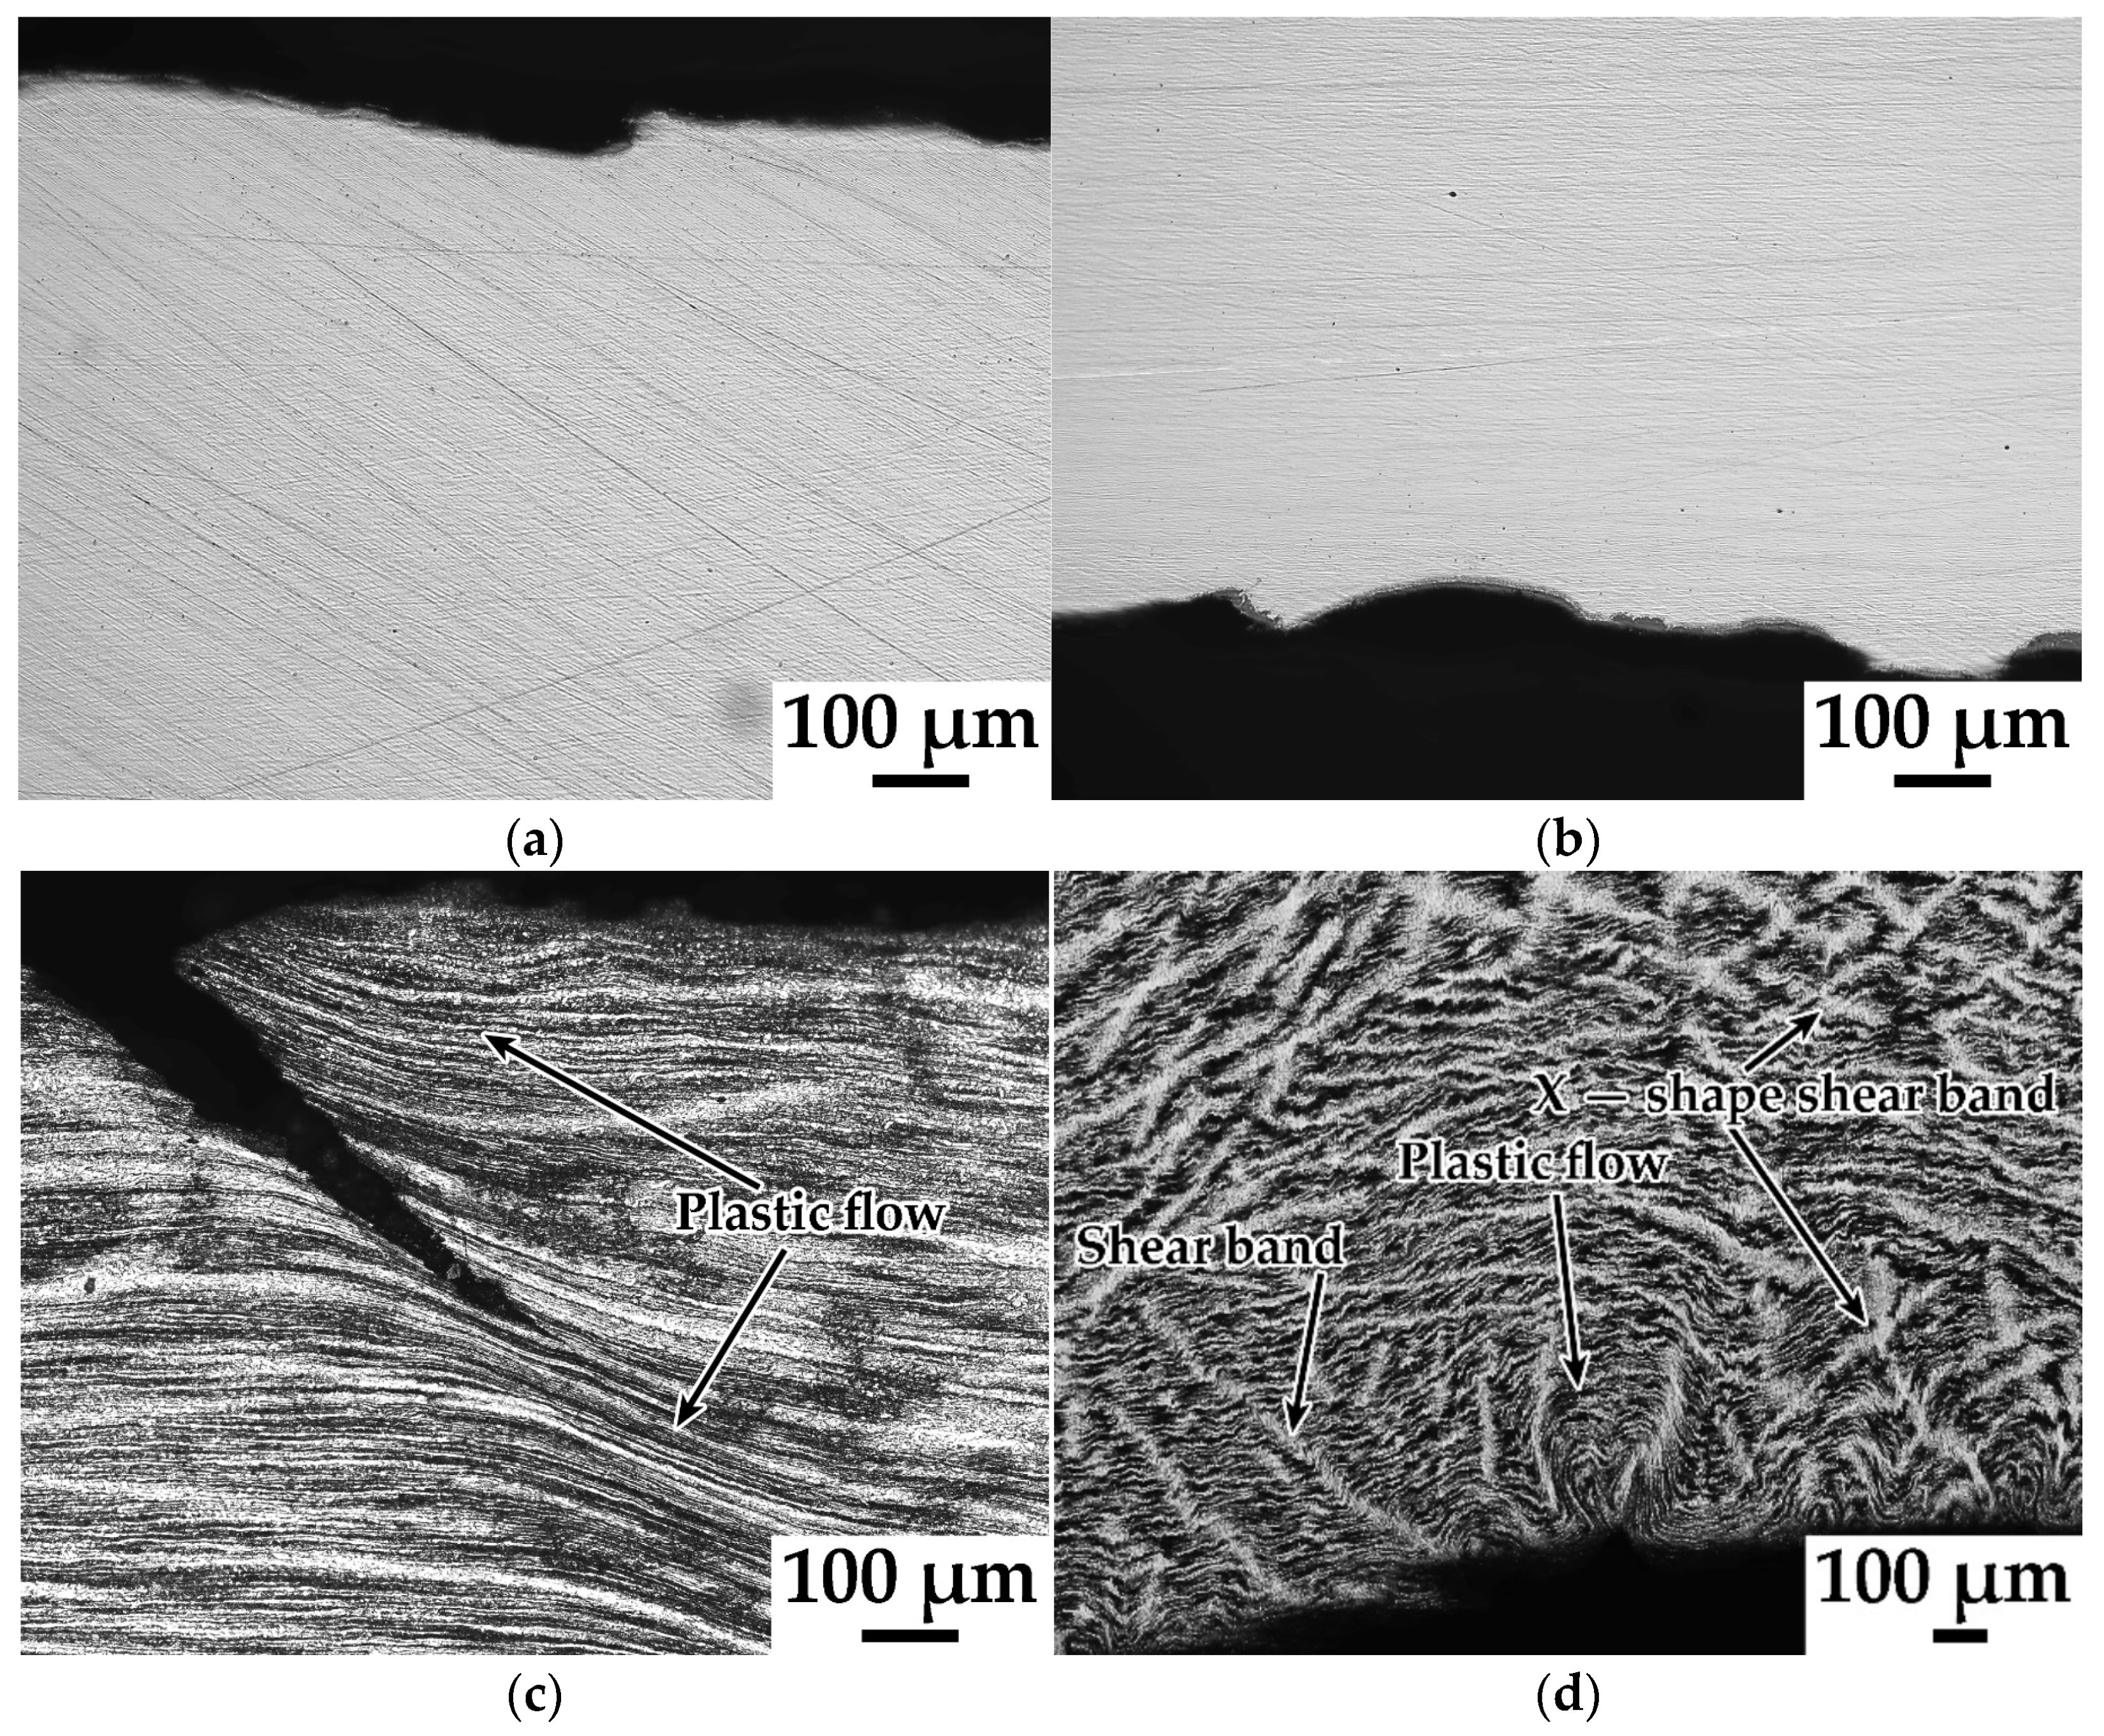
3.2.1. Surface Roughness and Cracks

The outer and inner arc surfaces at the RD–ND plane before bending are shown in Figure 3a,b. The minor surface roughening was observed from the outer- and inner-arc surfaces. The surfaces were characterized by wavy structures and V-shaped notches. Figure 3c,d shows the typical plastic flow characteristics with shear bands and cracks after bending. The plastic flow features around the cracks were probably caused by inhomogeneous deformation. The shape of the plastic flow varied with the stress direction. As the outer- and inner-arc surfaces were subjected to tensile and compressive stress, the plastic flow around the crack appeared as wavy and annular shapes, respectively. A shear band was found to be a special deformed microstructure caused by strain localization due to the bending deformation, which is mostly indicated by the bright-white thin-strip zone. The distribution of the narrow shear bands at the inner arc was divided into two types (Figure 3d). The first type was observed to form at the surface and extend to the matrix, which caused the formation of notches or cracks at the smooth surface. The second type was formed in the matrix, which was featured by an irregular distribution of the X-shape. Note that the X-shaped shear bands were caused by the interaction of the local stress at an angle with the rolling direction [14]. As shown in Figure 3c,d, the cracks were initiated at the tips of the V-shaped notches on the plate surface and extended to the matrix during bending, which was attributed to the local strain concentration. The processes leading to the formation and growth of cracks at the bending axis can be suggested as follows: (1) the surface cracks were initiated by the strain concentrations around the notches’ tips during bending; and (2) the shear bands formed near the tips of the cracks under the strain localization, further causing the crack propagation. Similar deformation and damage mechanisms were reported in some dual and complex phase steels by Suppan [15]. In the present study, the 20 mm thick specimen was bent at a bending angle of 90° with a bending radius of 40 mm, easily giving rise to the surface crack. The standard does not specify the bending angle, but for the 5% Ni steel, a bending angle less than 60° is recommended for practicable use.

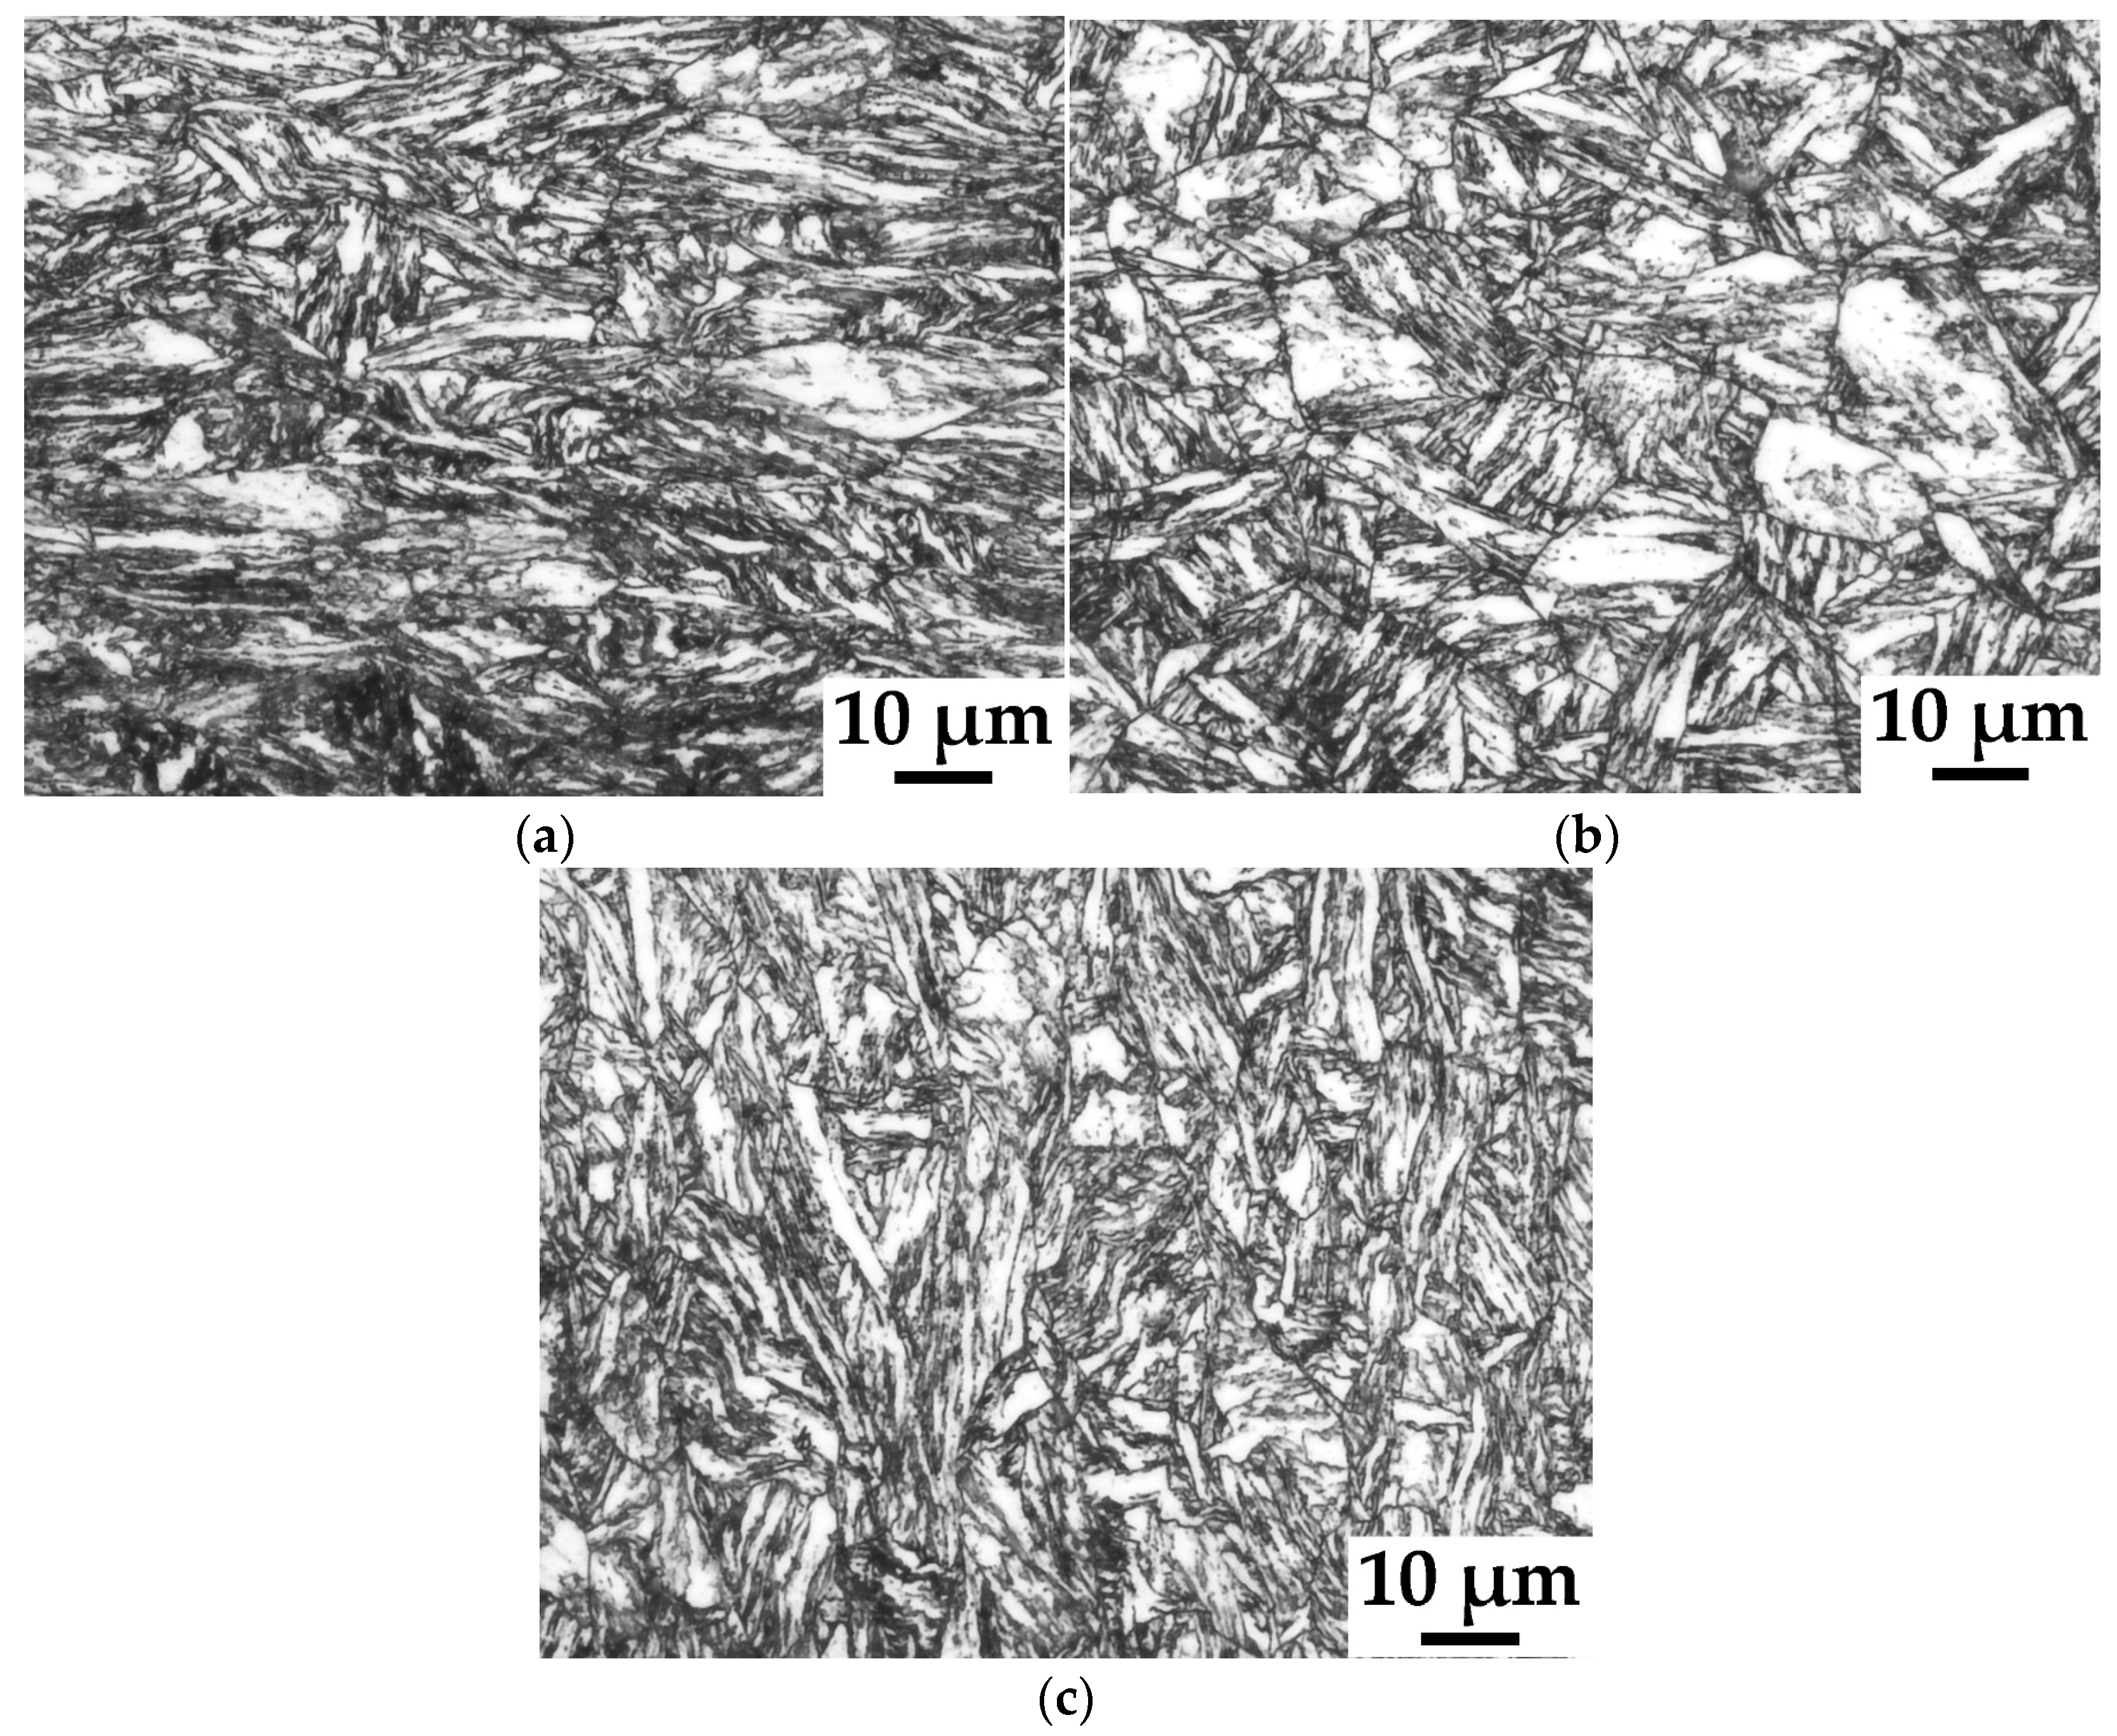
3.2.2. Microstructure

The distribution of grains in the ND is shown in Figure 4a–c. The gains in the outer arc were elongated along the tensile direction, and the average width and length of the grains were approximately 19.68 μm and 8.72 μm, respectively (Figure 4a). No severely deformed grains were observed in the mid-thickness, which is located in the transition region of the tensile and compression stress; the average width and length of the grains in the mid-thickness were about 10.79 μm and 9.25 μm, respectively (Figure 4b). Figure 4c shows that the grains at the inner arc were squeezed under compression stress and elongated along the direction perpendicular to the stress. The average width and length of the grains were 9.27 μm and 15.81 μm, respectively. From the outer arc to the inner arc, the values of the width and length decreased and increased gradually, respectively.

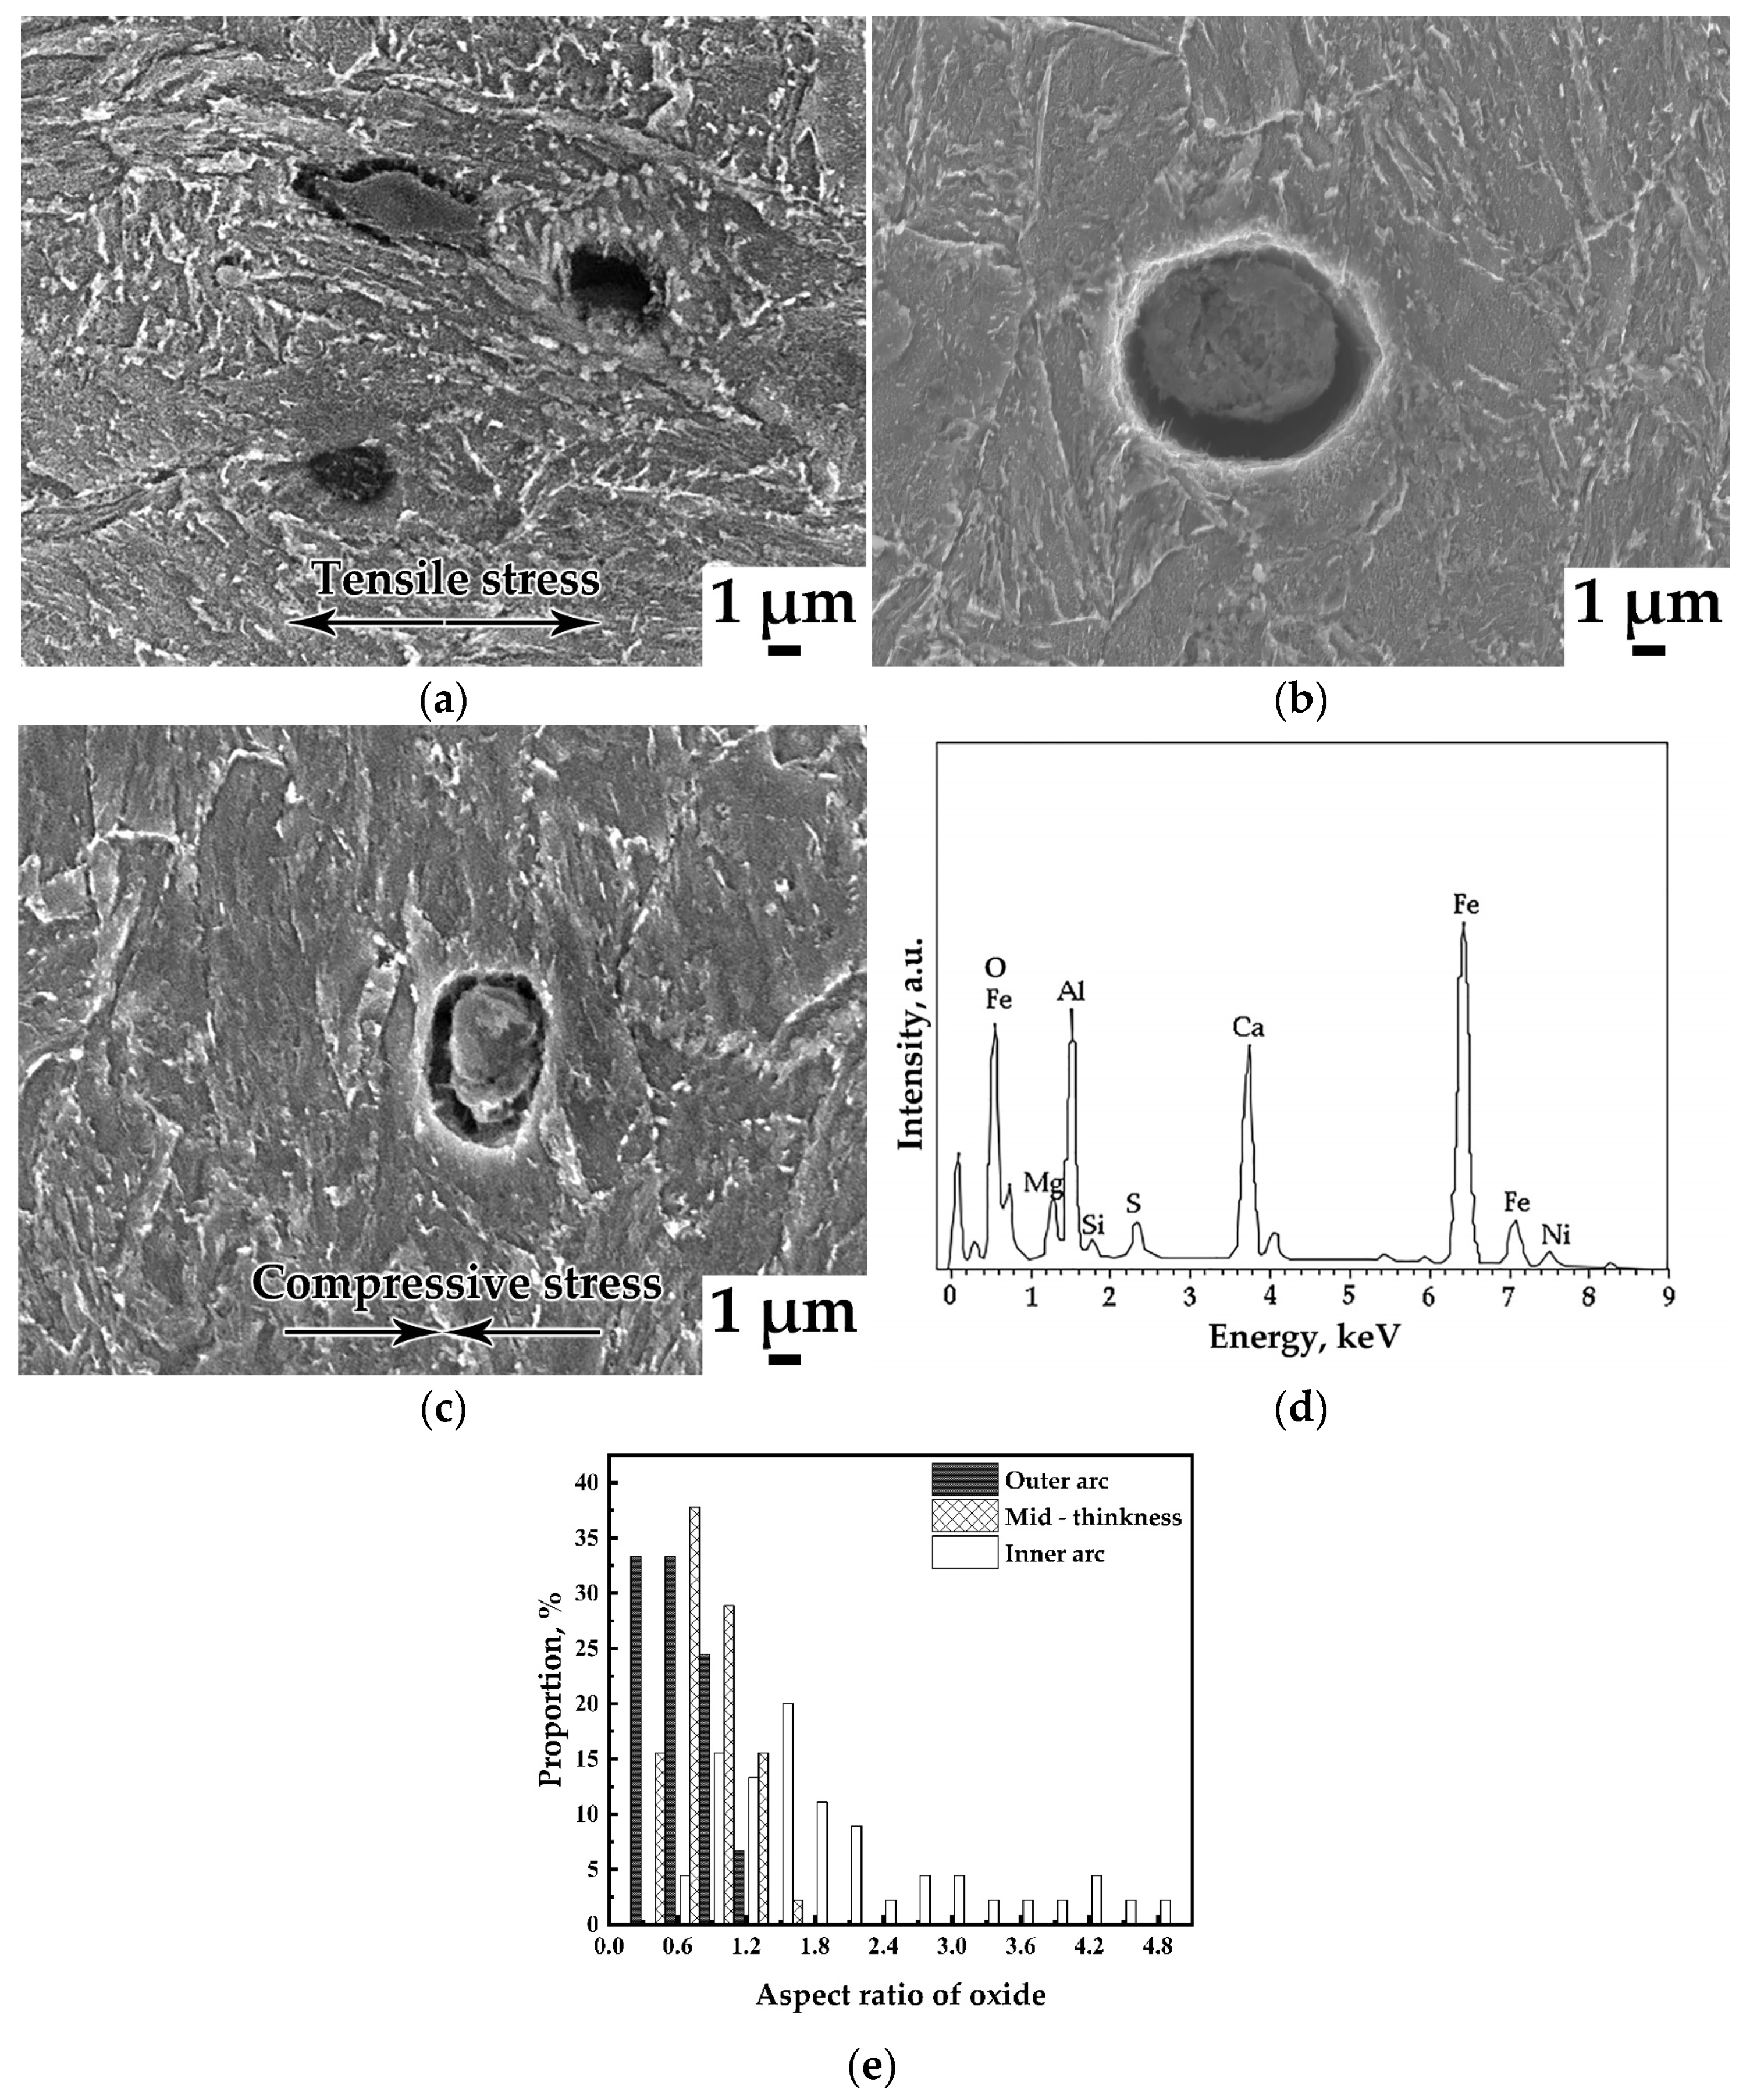
3.3. Oxide Inclusion Analysis

The microstructure and inclusions in the ND at the bending axis were observed using SEM (Figure 5). The EDS analysis results in Figure 5d show that the inclusions in Figure 5a–c were MgO–Al2O3–CaO–SiO2 oxide inclusions. The oxide inclusions that formed during the steel-making process were inevitable, and our preliminary studies found that these types of inclusions have deformability to some extent [16]. After conventional quenching and tempering, the microstructure consisted of a large fraction of carbide precipitated mainly close to the martensitic packets, block and sub-block boundaries, and prior grain boundaries. During bending, the outer and inner arcs with severe deformation were subjected to tensile and compressive stress, respectively. In Figure 5a, the oxide inclusion was elongated in the tensile stress direction parallel to the outer arc surface. The microstructure of the outer arc was also elongated parallel to the tensile direction. In Figure 5b, the mid-thickness region was considered as a relatively undeformed region; therefore, the oxide inclusion of the mid-thickness appeared to be circular with an average size of about 6 μm. In Figure 5c, the oxide inclusion was elongated in the direction perpendicular to the compressive stress, which is perpendicular to the inner arc surface. According to the statistical results, as shown in Figure 5e, the average aspect ratio of the oxide inclusions was evaluated in various regions (e.g., the values were determined as 0.499 and 2.094 for the outer and inner arc, respectively). This difference was ascribed to either tensile or compressive deformation in the outer and inner arc during the bending process when compared to the mid-thickness (0.888). Additionally, the microstructure of the inner arc was observed to be elongated along the vertical direction of the compressive stress.

3.4. Dislocation Density Analysis
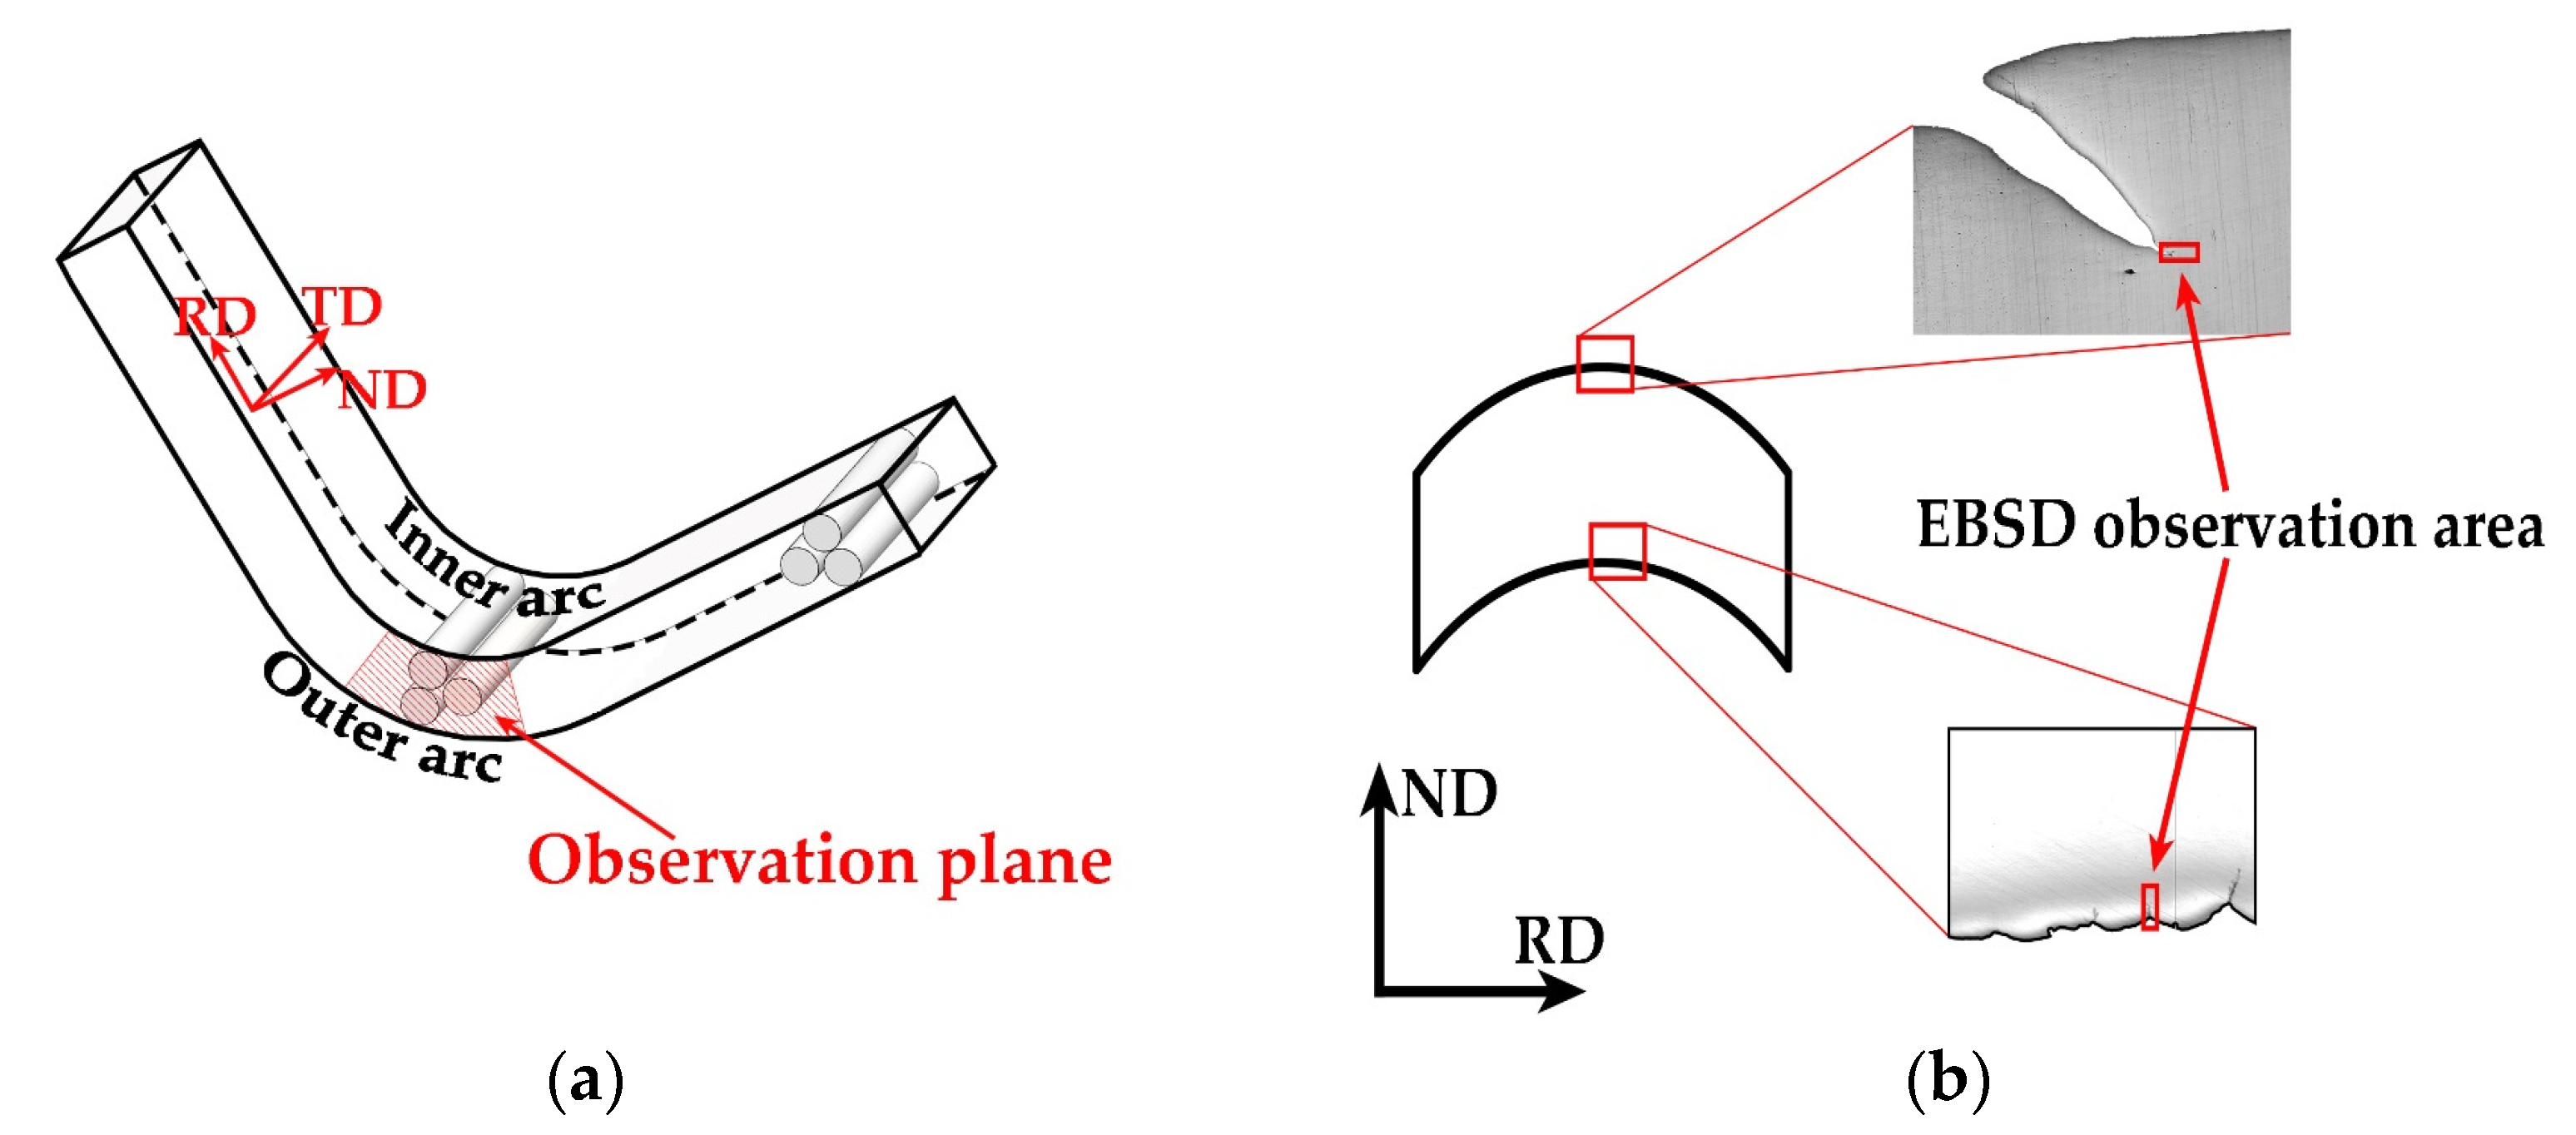
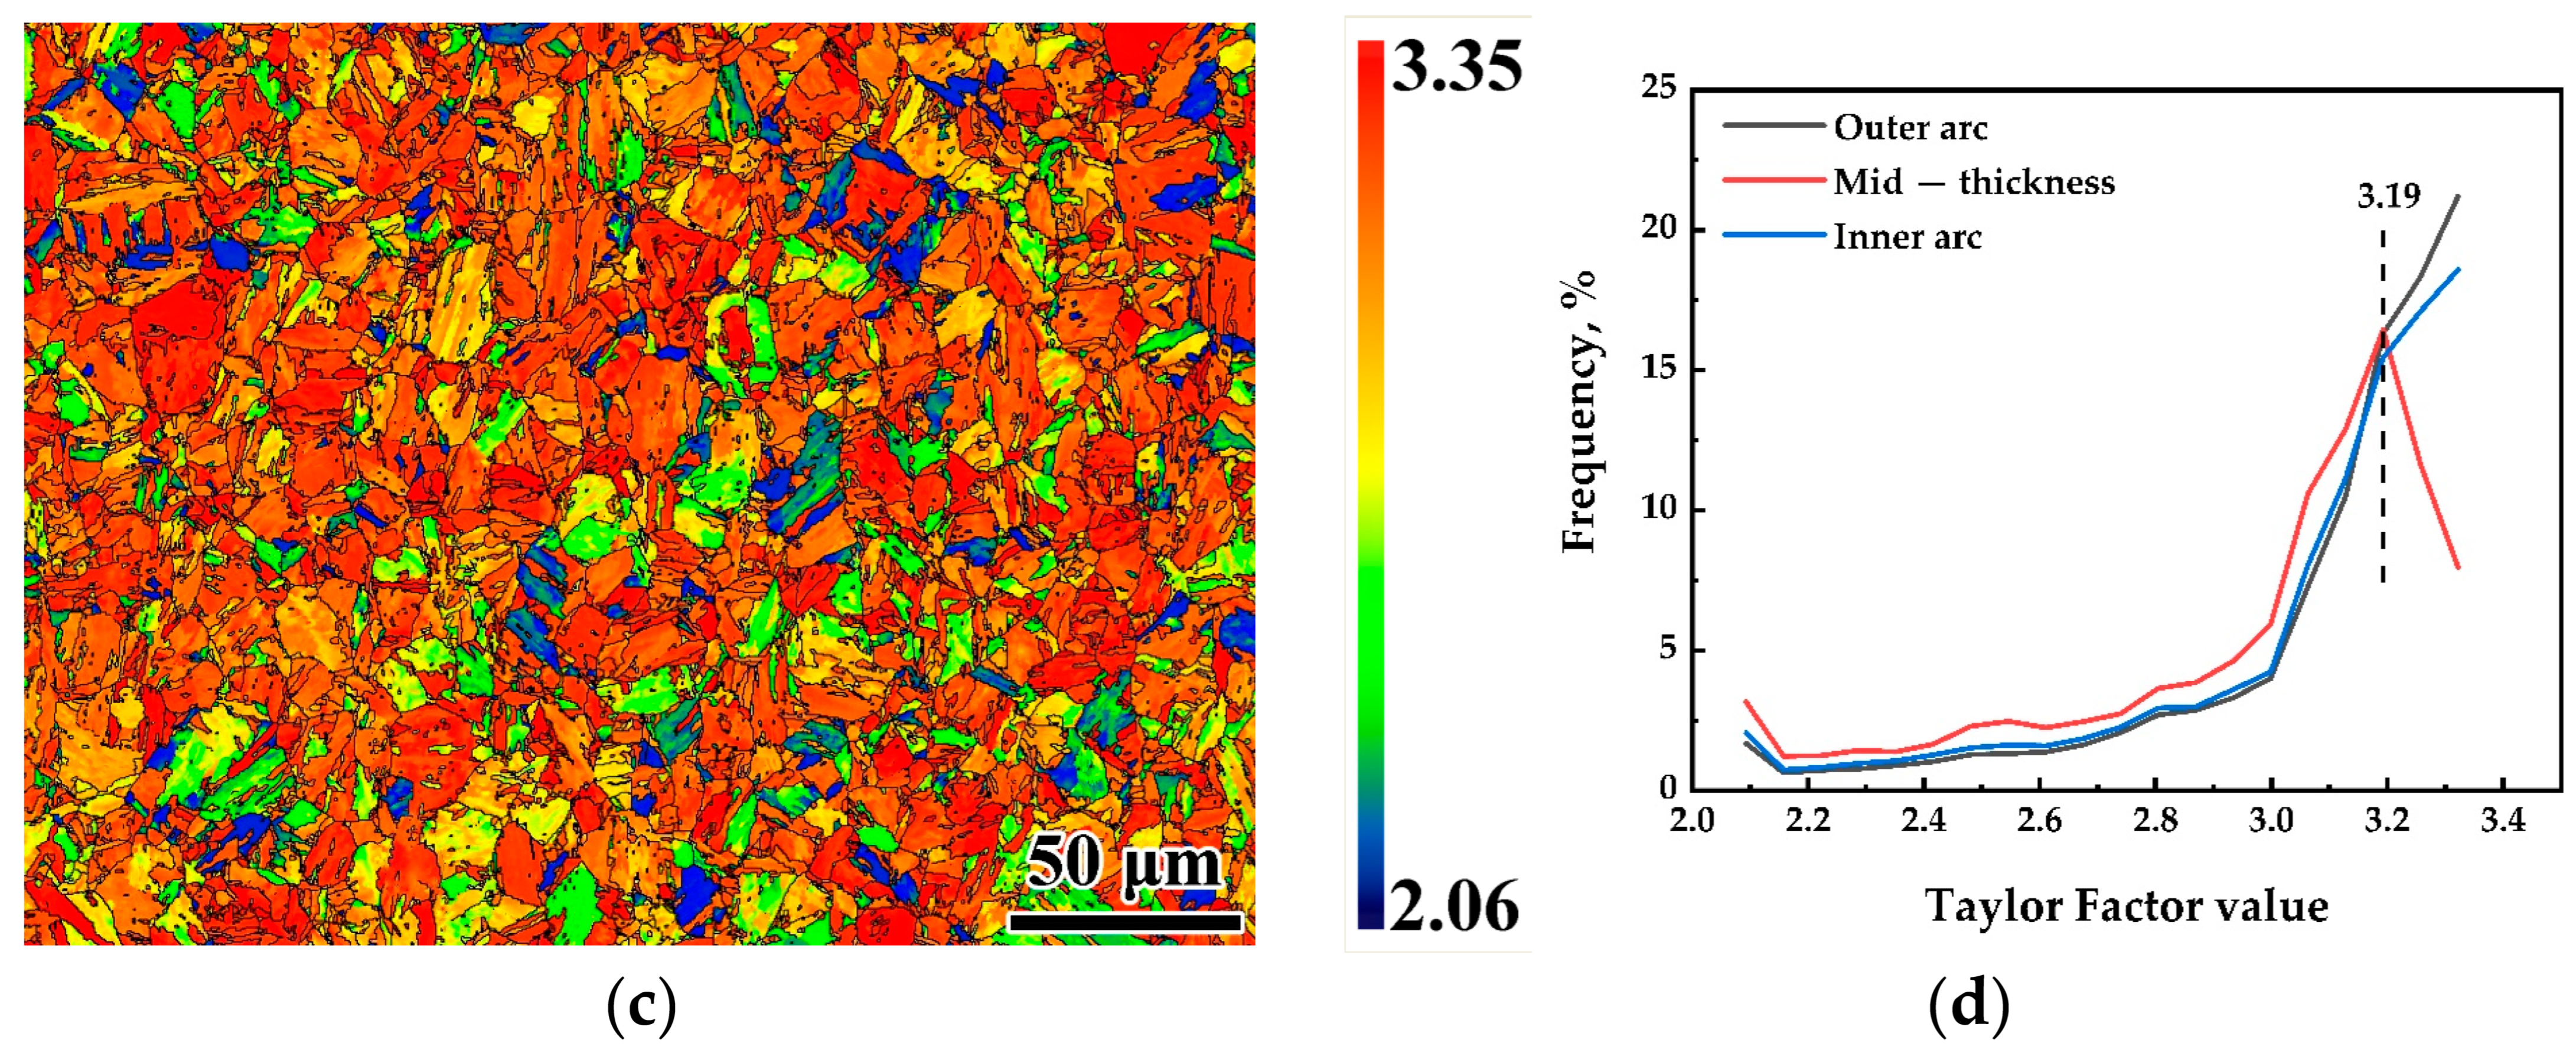
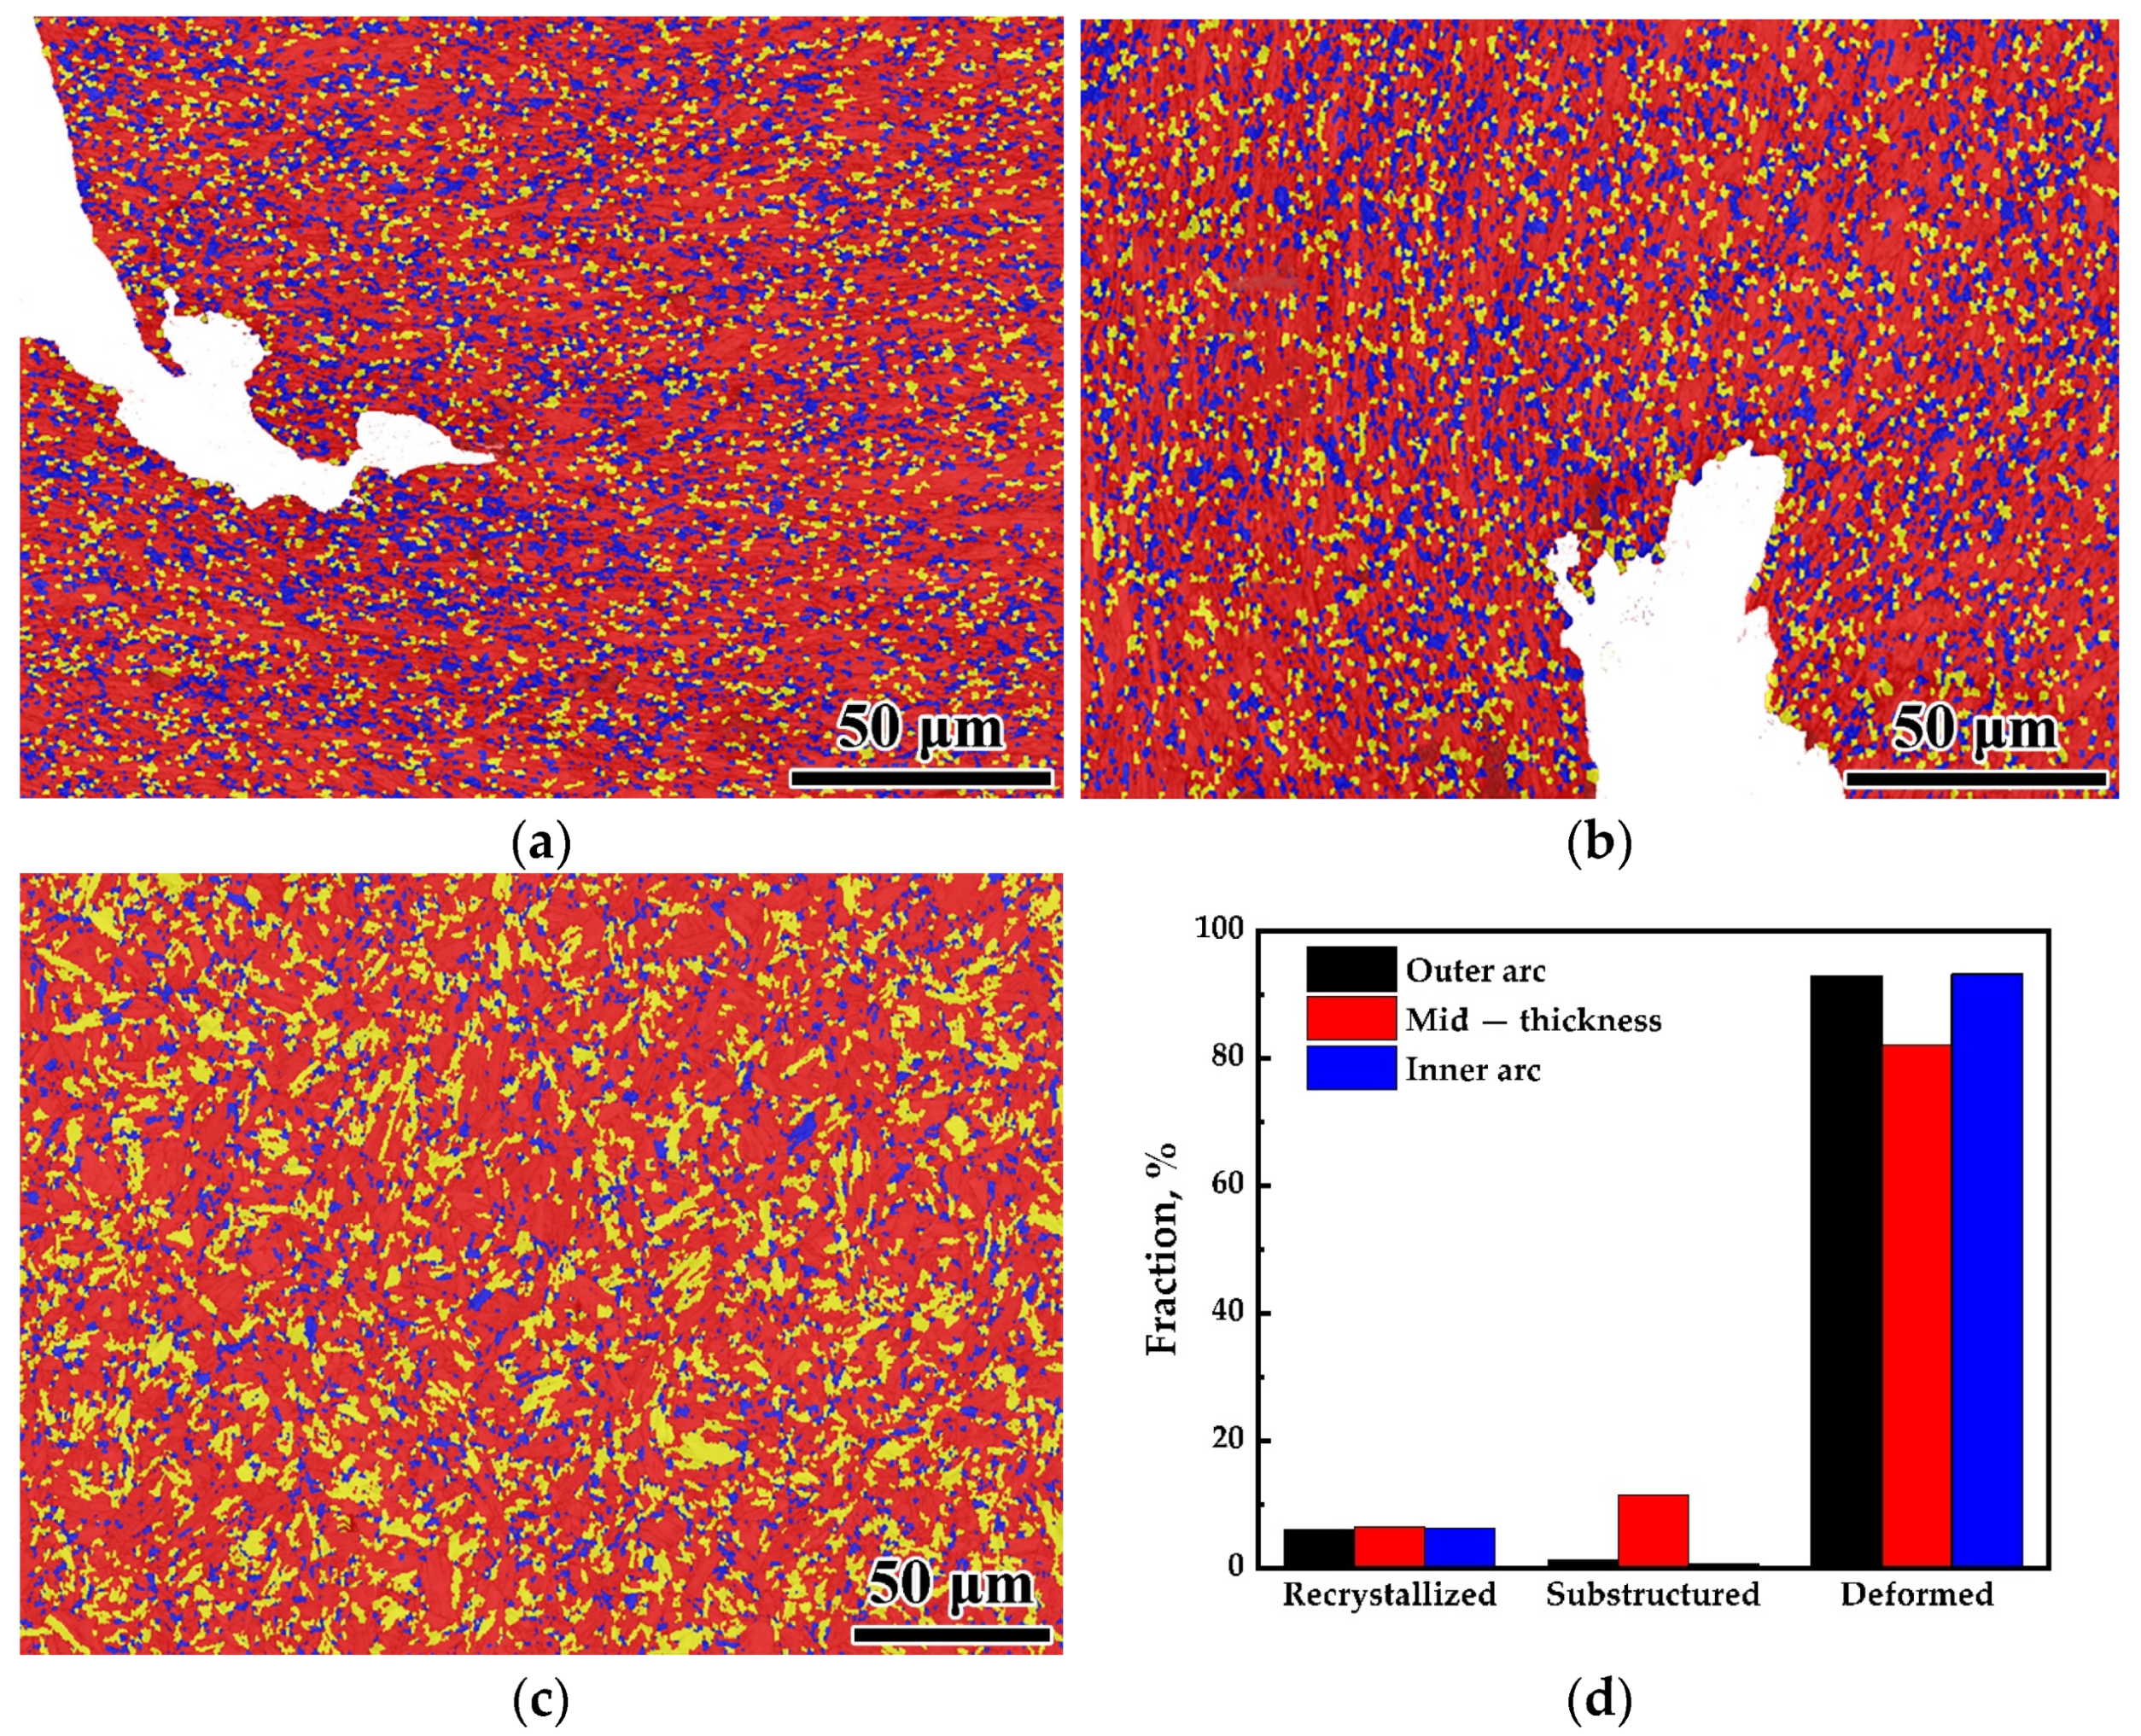
The XRD analysis was performed for the dislocation density measurements including the dislocations both in the grain interior and at the grain boundary [17]. The size of the inner and outer arc samples for the XRD was 5 × 5 mm2 from the surfaces of the RD–ND plane, corresponding to the high hardness zone in the hardness curves in Figure 2a. Figure 6a shows the four diffraction peaks: (110) α, (200) α, (221) α, and (220) α. These peaks of the inner and outer arcs were significantly broader than those of the mid-thickness zone. The dislocation density was determined using the modified Williamson–Hall (MWH) method, which was reported by Ungár et al. [18,19]. The MWH equation is shown in Equation (1) as follows:
Δ K = 0.9 d + 1 2 π M 2 b 2 ρ K 2 C ¯
where ΔK is the full width at half maximum of the diffraction peak, K = 2 sinθ/λ; θ is the diffraction angle; λ = 0.15405 nm; b is the Burgers vector (0.248 nm); and d is the average grain size (herein, the d-value is ~8 μm). Furthermore, M is a constant (herein, the M-value is 3) and C ¯ is the average contrast factor.
As shown in Figure 6b, according to the line slope value, the dislocation densities of the inner-arc, mid-thickness, and outer-arc regions were calculated as 1.43 × 10¹⁵ m−2, 0.43 × 10¹⁵ m−2, 1.90 × 10¹⁵ m−2, respectively. Evidently, the dislocation densities of the outer and inner arcs exceeded that of the mid-thickness. During the bending process, notable strains of about 50% at the plate surfaces enabled a regular multiplication of dislocations in the interiors of the deformed grains [20]. After bending, one reason for the inverse strength–ductility trade-off was attributed to the high dislocation density [21].

3.5. EBSD Analysis

The Taylor factor (TF) presents the value of the grain orientation hardness. The TF maps at the bending axis are shown in Figure 7. When TF is less than 3, the grains are called “soft” grains, which are most likely for slip to occur and increase the deformation ability of the steel. When TF is more than 3, the grains are called “hard” grains, which are associated with a higher yield strength. The TF increased, indicating that the value of the grain orientation hardness increased. The average TF value at outer-arc and inner-arc surfaces, and mid-thickness was 3.08, 3.06, and 2.97, respectively, and the amount of high TF value (>3.19) at the outer-arc and inner-arc surfaces was higher than that of the mid-thickness. The “hard” grains with a high TF value at the outer-arc and inner-arc provide a higher grain orientation hardening, resulting in high strength and hardness. However, the amount of “hard” grains also tend to induce cracks [22,23].
Figure 8 shows the distribution map of the deformed grains, recrystallized grains, and substructures represented with red, blue and yellow colors, respectively. Obviously, there were more deformed grains at the outer- and inner-arc surfaces than that at the mid-thickness.
The kernel average misorientation (KAM) maps at the bending axis are shown in Figure 9. The KAM distribution reflects the local strain gradient by the orientation gradient and hence the underlying distributions of the lattice defects. The KAM values (degree) were calculated up to 5°. The color ranged from blue to red, indicating that the value of the local strain distribution changed from small to large. According to Morsdorf et al. [24], upon deformation, strain localization was prone to occur close to the lath martensitic packets, block, and sub-block boundaries. In contrast, no strain localization was observed close to the prior austenite grain boundaries. It is obvious from Figure 9a,b that samples at the outer- and inner-arcs surfaces had a relatively low KAM zone (blue) with a small local strain. However, the microstructure of the inner- and outer-arcs had more orange and red areas with a high local strain than the mid-thickness. These high local strain regions with a high dislocation density produce a great stress concentration, which can easily induce crack initiation and propagation.
The grain boundary misorientation maps of the samples are shown in Figure 10. The misorientations >15° were defined as high angle grain boundaries (HAGBs), and the misorientations between 2° and 15° were defined as low angle grain boundaries (LAGBs). In Figure 10, the red lines and black lines represent the LAGBs and HAGBs, respectively. As shown in Figure 10d, the grain boundary distribution at the mid-thickness displayed a bimodal structure. It can be seen that a 25% HAGB (>50°) at mid-thickness was found, which can efficiently prevent the crack propagating compared to the outer- and inner-arc surface samples with 15.1% and 14.9%, respectively [25]. During bending, dislocations begin to move, pile up, and entangle, resulting in the formation of LAGBs in the outer and inner arcs [26,27]. The higher amount of LAGBs in the outer and inner arcs (45% and 44%, respectively) contributed to the higher strength and hardness than those of the mid-thickness (38%) [28].

3.6. Fracture Surface

Figure 11 shows the fracture surfaces of the samples after the tensile tests. The whole fracture morphologies at low magnification showed obvious differences. The mid-thickness fracture surfaces at the bending axis and unbent zones had visible shear lip zones compared to the inner and outer arcs at the bending axis. The inner and outer arcs at the bending axis exhibited poor ductility. Figure 11a shows the fiber zone of the sample in the unbent region. Deep dimples and secondary cracks were observed, indicating that the surface was fractured in a ductile fracture mode. The fracture surfaces of the outer arc, mid-thickness, and inner arc samples at the bending axis are shown in Figure 11b–d, respectively. In Figure 11b,d, the number and depth of dimples in the inner and outer arcs were significantly reduced, and especially obvious cleavage facets were observed. In Figure 11c, the fracture surface of the mid-thickness was still characterized by ductile fracture without cleavage facets, which is similar to the fracture characteristics of the unbent zone. As the amount of deformation increases, the fracture morphology changed from a typical ductile fracture to a mixture of cleavage and ductile fracture, implying the decreased ductility.

4. Conclusions

The following conclusions can be obtained as follows:
  • After bending, these samples from the outer and inner arcs were subjected to severe deformation at the bending axis, improving both the tensile and yield strengths. However, the ductility decreased due to work hardening and dislocation accumulation.
  • The strain along the ND was inhomogeneous at the bending axis, and the bending surface experienced more strain than the mid-thickness. Therefore, the mechanism of crack formation and growth can be summarized as: (1) the surface cracks were initiated by the strain concentrations around the notches’ tips during bending; and (2) the shear bands formed near the tips of the cracks under the strain localization, further causing the crack propagation.
  • The quantity of “harder” grains with a high TF value and more orange and red KAM areas with a high local strain in the inner- and outer-arc microstructure produces a great stress concentration, which could induce crack initiation and propagation.

Author Contributions

Conceptualization, X.Z. and M.C.; Methodology, X.Z. and F.N.; Software and experimental validation, F.N. and D.L.; Formal analysis and investigation, X.Z., J.H. and F.N.; Resources, X.Z.; Data curation, X.Z. and F.N.; Writing—original draft preparation, F.N. and J.H.; Writing—review and editing, X.Z. and M.C.; Supervision, X.Z. and M.C.; Project administration, X.Z.; Funding acquisition, X.Z. and M.C. All authors have read and agreed to the published version of the manuscript.

Funding

This research was funded by the Henan Provincial Science and Technology Cooperation Project China (Grant No. 182106000016); the Key R&D and Promotion Special Project of Henan Province (No. 212102210444); and the Natural Science Foundation of China (No. 51975111).

Institutional Review Board Statement

Not applicable.

Informed Consent Statement

Not applicable.

Data Availability Statement

Data are contained within the article.

Acknowledgments

The authors gratefully acknowledge the financial support provided by Nanjing Iron & Steel Co., Ltd.

Conflicts of Interest

The authors declare no conflict of interest.

References

  1. Hany, S.; Duponchel, B.; Poupin, C.; Kais, A.A.; Dewael, D.; Vogt, J.B.; Bouquerel, J.; Kacem, H.; Mouftiez, A.; Hariri, S.; et al. Microstructural and mechanical properties of 9%Ni steels used for the construction of LNG storage tanks. Adv. Mater. Res. 2014, 936, 1953–1957. [Google Scholar] [CrossRef]
  2. Kumar, S.; Kwon, H.T.; Choi, K.H.; Lim, W.; Cho, J.H.; Tak, K.; Moon, I. LNG: An eco-friendly cryogenic fuel for sustainable development. Appl. Energy 2011, 88, 4264–4273. [Google Scholar] [CrossRef]
  3. Shin, H.-S.; Lee, H.-M.; Kim, M.-S. Impact tensile behaviors of 9% nickel steel at low temperature. Int. J. Impact Eng. 2000, 24, 571–581. [Google Scholar] [CrossRef]
  4. Zhang, W.X.; Chen, Y.Z.; Cong, Y.B.; Liu, Y.H.; Liu, F. On the austenite stability of cryogenic Ni steels: Microstructural effects: A review. J. Mater. Sci. 2021, 56, 12539–12558. [Google Scholar] [CrossRef]
  5. Tanaka, M.; Matsuo, K.; Yoshimura, N.; Shigesato, G.; Hoshino, M.; Ushioda, K.; Higashida, K. Effects of Ni and Mn on brittle-to-ductile transition in ultralow-carbon steels. Mater. Sci. Eng. A 2017, 682, 370–375. [Google Scholar] [CrossRef]
  6. Nagashima, M.; Tsuchiya, M.; Asada, M. Reducing the economic risk of LNG tank construction under conditions of fluctuating resource prices. J. Constr. Eng. Manag. 2011, 137, 382–391. [Google Scholar] [CrossRef]
  7. Strife, J.R.; Passoja, D.E. The effect of heat treatment on microstructure and cryogenic fracture properties in 5Ni and 9Ni steel. Metall. Trans. A 1980, 11, 1341–1350. [Google Scholar] [CrossRef]
  8. Arola, A.-M.; Kaijalainen, A.; Kesti, V.; Troive, L.; Larkiola, J.; Portera, D. The effect of mechanical behavior on bendability of ultrahigh–strength steel. Mater. Today Commun. 2021, 26, 101943. [Google Scholar] [CrossRef]
  9. Wechsuwanmanee, P.; Lian, J.; Shen, F.; Münstermann, S. Influence of surface roughness on cold formability in bending processes: A multiscale modelling approach with the hybrid damage mechanics model. Int. J. Mater. Form. 2021, 14, 235–248. [Google Scholar] [CrossRef]
  10. Rèche, D.; Sturel, T.; Bouaziz, O.; Col, A.; Gourgues-Lorenzon, A.F. Damage development in low alloy TRIP-aided steels during air-bending. Mater. Sci. Eng. A 2011, 528, 5241–5250. [Google Scholar] [CrossRef]
  11. Soyarslan, C.; Malekipour Gharbi, M.; Tekkaya, A.E. A combined experimental-numerical investigation of ductile fracture in bending of a class of ferritic-martensitic steel. Int. J. Solids Struct. 2012, 49, 1608–1626. [Google Scholar] [CrossRef] [Green Version]
  12. Kaupper, M.; Merklein, M. Bendability of advanced high strength steels—A new evaluation procedure. CIRP Ann. Manuf. Technol. 2013, 62, 247–250. [Google Scholar] [CrossRef]
  13. Fan, J.; Zhu, L.; Lu, J.; Fu, T.; Chen, A. Theory of designing the gradient microstructured metals for overcoming strength-ductility trade-off. Scr. Mater. 2020, 184, 41–45. [Google Scholar] [CrossRef]
  14. Kuroda, M.; Tvergaard, V. Effects of texture on shear band formation in plane strain tension/compression and bending. Int. J. Plast. 2007, 23, 244–272. [Google Scholar] [CrossRef]
  15. Suppan, C.; Hebesberger, T.; Pichler, A.; Rehrl, J.; Kolednik, O. On the microstructure control of the bendability of advanced high strength steels. Mater. Sci. Eng. A 2018, 735, 89–98. [Google Scholar] [CrossRef]
  16. Liu, J.; Liu, D.; Zuo, X.; Liu, L.; Yan, Q. Influence of TiN Inclusions and Segregation on the Delayed Cracking in NM450 Wear-Resistant Steel. Metals 2022, 12, 21. [Google Scholar] [CrossRef]
  17. Li, H.; Gao, S.; Tomota, Y.; Ii, S.; Tsuji, N.; Ohmura, T. Mechanical response of dislocation interaction with grain boundary in ultrafine-grained interstitial-free steel. Acta Mater. 2021, 206, 116621. [Google Scholar] [CrossRef]
  18. Ungár, T.; Borbély, A. The effect of dislocation contrast on X–ray line broadening: A new approach to line profile analysis. Appl. Phys. Lett. 1996, 69, 3173. [Google Scholar] [CrossRef]
  19. Jiang, H.; He, Y.; Lin, L.; Liu, R.; Zhang, Y.; Zheng, W.; Li, L. Microstructures and properties of auto-tempering ultra-high strength automotive steels under different thermo-processing. Metals 2021, 11, 1121. [Google Scholar] [CrossRef]
  20. He, J.; Niu, F.; Zuo, X.; Liu, D.; Cai, M. Changes in microstructure and mechanical properties during the bending process of NM450 wear–resistant steel. Mater. Res. Express. 2022, 9, 046524. [Google Scholar] [CrossRef]
  21. He, B.B.; Hu, B.; Yen, H.W.; Cheng, G.J.; Wang, Z.K.; Luo, H.W.; Huang, M.X. High dislocation density–induced large ductility in deformed and partitioned steels. Science 2017, 357, 1029–1032. [Google Scholar] [CrossRef] [Green Version]
  22. Li, S.; Guo, C.; Hao, L.; Kang, Y.; An, Y. In-situ EBSD study of deformation behaviour of 600 MPa grade dual phase steel during uniaxial tensile tests. Mater. Sci. Eng. A 2019, 759, 624–632. [Google Scholar] [CrossRef]
  23. Wang, N.; Chen, Y.; Wu, G.; Zhang, Z.; Wu, Z.; Luo, J. Investigation on micromechanism involved in ferrite hardening after prestraining of dual-phase steel. Mater. Sci. Eng. A 2021, 800, 140387. [Google Scholar] [CrossRef]
  24. Morsdorf, L.; Jeannin, O.; Barbier, D.; Mitsuhara, M.; Raabe, D.; Tasan, C.C. Multiple mechanisms of lath martensite plasticity. Acta Mater. 2016, 121, 202–214. [Google Scholar] [CrossRef]
  25. Zhou, T.; Yu, H.; Wang, S. Effect of microstructural types on toughness and microstructural optimization of ultra-heavy steel plate: EBSD analysis and microscopic fracture mechanism. Mater. Sci. Eng. A 2016, 658, 150–158. [Google Scholar] [CrossRef]
  26. Muránsky, O.; Balogh, L.; Tran, M.; Hamelin, C.J.; Park, J.S.; Daymond, M.R. On the measurement of dislocations and dislocationsubstructures using EBSD and HRSD techniques. Acta Mater. 2019, 175, 297–313. [Google Scholar] [CrossRef]
  27. Akama, D.; Tsuchiyama, T.; Takaki, S. Change in Dislocation Characteristics with Cold Working in Ultralow-carbon Martensitic Steel. ISIJ Int. 2016, 56, 1675–1680. [Google Scholar] [CrossRef] [Green Version]
  28. Omale, J.I.; Ohaeri, E.G.; Tiamiyu, A.A.; Eskandari, M.; Mostafijur, K.M.; Szpunar, J.A. Microstructure, texture evolution and mechanical properties of X70 pipeline steel after different thermomechanical treatments. Mater. Sci. Eng. A 2017, 703, 477–485. [Google Scholar] [CrossRef]
Figure 1. The sketch maps of the specimens: (a) OM observation plane and locations of tensile samples, and (b) EBSD observation zone.
Metals 12 01188 g001
Figure 2. The hardness and tensile curves of the 5% Ni steel samples: (a) hardness curves in the thickness direction at different positions from the bending axis, and (b) engineering stress–strain curves in the thickness direction of the samples at the bending and unbent zones.
Metals 12 01188 g002
Figure 3. The OM images of the 5% Ni steel sample surfaces: (a) outer arc and (b) inner arc surfaces before bending, and (c) outer arc and (d) inner arc surfaces after bending.
Metals 12 01188 g003
Figure 4. The OM images of the 5% Ni steel at the bending axis: (a) near the outer arc surface, (b) transition region near the mid-thickness, and (c) near the inner arc.
Metals 12 01188 g004
Figure 5. The SEM images at the bending axis near the (a) outer arc, (b) mid-thickness, and (c) inner arc. (d) Energy dispersive spectra of the oxide inclusions, and (e) aspect radio distribution of oxide inclusions.
Metals 12 01188 g005
Figure 6. The XRD patterns of the 5% Ni steel samples. (a) X-ray diffraction profiles of samples at the bending axis. (b) Linear relationship between ΔK and K2 C ¯ based on the modified Williamson–Hall method.
Metals 12 01188 g006
Figure 7. The Taylor factor (TF) maps at the bending axis of the 5% Ni steel: (a) outer arc surface, (b) inner arc surface, (c) mid-thickness, and (d) TF distributions.
Metals 12 01188 g007aMetals 12 01188 g007b
Figure 8. The distribution map of the deformed grains, recrystallized grains, and substructures of the 5% Ni steel sample: (a) outer arc surface, (b) inner arc surface, (c) mid-thickness, and (d) volume fractions of recrystallized, substructured, and deformed regions.
Metals 12 01188 g008
Figure 9. The kernel average misorientation (KAM) maps at the bending axis of the 5% Ni steel: (a) outer arc surface, (b) inner arc surface, (c) mid-thickness, and (d) distribution of KAM.
Metals 12 01188 g009
Figure 10. The grain boundary misorientation maps at the bending axis of the 5% Ni steel: (a) outer arc surface, (b) inner arc surface, (c) mid-thickness, and (d) distribution of grain boundary misorientation.
Metals 12 01188 g010
Figure 11. The fracture surface after the tensile test at the bending axis and unbent zones: fiber zones of the (a) unbent areas, (b) outer arc, (c) mid-thickness, and (d) inner arc.
Metals 12 01188 g011
Table 1. The chemical composition of the 5% Ni steel (wt %).
CMnSiSPNiMoCr
0.071.100.250.0010.0105.10.430.42
Table 2. The tensile test results of the 5% Ni steel samples.
PositionSpecimensUTS (MPa)YS (MPa)Elongation (%)Area Reduction (%)
Bending axisOuter arc1132108612.5665.26
Mid–thickness100595616.0073.66
Inner arc1201115112.4063.83
Unbent zoneOuter arc100496216.4872.65
Mid–thickness99895316.8076.81
Inner arc99895716.5672.79
Publisher’s Note: MDPI stays neutral with regard to jurisdictional claims in published maps and institutional affiliations.

