Article

Recovery and Utilization of Lead in Lead–Containing Waste Residue from Electrolytic Manganese Production

1
School of Environment and Municipal Engineering, Lanzhou Jiaotong University, Lanzhou 730070, China
2
Engineering Center of Water Resources Comprehensive Utilization, Ministry of Education, Lanzhou 730070, China
*
Author to whom correspondence should be addressed.
Metals 2023, 13(10), 1643; https://doi.org/10.3390/met13101643
Submission received: 14 August 2023 / Revised: 20 September 2023 / Accepted: 22 September 2023 / Published: 25 September 2023

Abstract

:
As a metallurgical and chemical raw material, electrolytic manganese is an important strategic resource. However, with the rapid development of the electrolytic manganese industry, the correct disposal of anode slime has become a serious problem. The purpose of this experiment was to reduce the occupation of land resources by the lead–containing waste residue of electrolytic manganese, reduce the pollution caused by the lead–containing waste residue to the environment and provide a reference for the research on the treatment technology and resource utilization of lead–containing waste residue in China. In this experiment, a special process was studied for the composition characteristics of lead–containing waste residues produced by electrolytic manganese. The acid leaching–enrichment–membrane electrolysis process was used to recover the lead in the lead–containing waste residues of electrolytic manganese and to recover the acid, so as to maximize the utilization of resources. In this experiment, the pretreated lead–containing waste residue was leached, enriched and concentrated, and then the enriched Pb2+ solution was used as cathode solution and dilute nitric acid as anode solution to recover lead by membrane electrolysis. The membrane electrolysis experiment uses lead plate as cathode, selects the best anion exchange membrane and anodic electrolysis material, and then takes lead recovery, acid recovery, current efficiency, voltage and power consumption as investigation indexes to explore and analyze the influence of many factors such as Pb2+ concentration and current density on the experiment, so as to determine the best membrane electrolysis process parameters. The optimum process parameters of lead recovery by membrane electrolysis were determined as follows: Pb2+ concentration was 40 g/L, current density was 30 mA/cm2, reaction temperature was 60 °C, cathodic pH value was 4.0, anodic HNO3 concentration was 0.5 mol/L, and cathodic ammonium nitrate concentration was 50 g/L. Under the optimal conditions, the current efficiency was 85.6%, the acid recovery was 73.03%, the lead recovery was 99.2%, the voltage was 3.8 V, and the power consumption was 1148.4 kW·h·t−1. Through the three steps of acid leaching–enrichment–membrane electrolysis, 78.53% of the Pb2+ in the original lead–containing waste residue can be recovered in the form of metal lead element, and the HNO3 recovered in the anode chamber can also be used again in the acid leaching process, which can not only solve the problem of environmental pollution caused by lead–containing waste residue but also achieve the recovery and utilization of resources, with good social and economic benefits.

1. Introduction

Lead–tin alloy is used as an anode plate in the electrolytic manganese industry. Therefore, in the process of electrolysis, manganese and part of lead in the anode plate are oxidized and entered into the anode mud. Due to the low activity of hydrated manganese oxide and the presence of impurities such as soluble salt (like (NH4)2SO4), most of the anode slime is stored as solid waste [1], steelmaking additive or sold cheaply. A large amount of lead slag will be produced in the process of producing primary and secondary lead. To realize the reduction, resource utilization and harmless utilization of lead slag is an urgent problem to be solved to ensure the sustainable development of lead smelting industry.
Due to the difficulty of reaction control, high requirements for equipment, and the production of acid and waste residue in the reaction process, the traditional pyrometallurgy, hydrometallurgy and bioleaching technologies are not suitable for large–scale industrial production. The recovery of metal ions by electrodeposition technology is a topic closely related to environmental applications. Camarillo et al. combined polymer–enhanced ultrafiltration (PEUF) with electrodeposition as an effective process for efficient recovery of copper [2]. With the combination of electrodeposition technology and membrane technology, higher recovery rate, acceptable energy consumption and high metal purity can be obtained from solid and liquid wastes. The action mechanism of ion exchange membrane is mainly the interaction between charge transfer and membrane materials. They can be based on the addition of an ionic functional group to the membrane structure or the introduction of vacancies in the crystal structure of solid materials. By using this method, nickel can be recovered with high current efficiency (95.6%) [3], and copper can be recovered from wastewater with high purity (96.38%) and low energy consumption (0.6 kWh·kg−1 Cu) [4]. Yong et al. [5] studied the effects of Fe2+ concentration, H2SO4 concentration, liquid–solid mass ratio, reaction temperature and current density on the leaching efficiency of Mn. The leaching mechanism shows that Fe2+, Fe2+ and Fe3+ become electron transport media during the electric field leaching of Fe2+–Fe3+ closed–loop system, and the redox leaching of MnO2 and Fe2+ in EMAS is realized. This study provided a new method for the utilization of EMAS resources. Zhang et al. proposed to extract and separate manganese and lead from EMAS by SO2 roasting–acid leaching. Thermodynamic analysis showed that a coexistence area of MnSO4 and PbSO4 was present in both the roasting and leaching processes. During the roasting process, manganese and lead oxides were sulfated to MnSO4 and PbSO4 by SO2. Then, MnSO4 and PbSO4 could be separated in the following acid–leaching process owing to their different solubilities in acid solution. The leaching efficiencies of 92.5 wt.% for Mn and only 3.21 wt.% for Pb were obtained under optimal conditions. This study provided an alternative approach to utilize the EMAS [6].
In this experiment, according to the composition characteristics of lead–containing waste residue from electrolytic manganese production, the waste residue was in a free state after acid leaching and enrichment, and then the Pb2+ in the solution was purified by membrane electrolysis process. The optimum parameters of the process were explored in the experiment, and the acid was recovered while the lead was recovered from the lead–containing waste residue of electrolytic manganese, so as to maximize the utilization of resources.

2. Materials and Methods

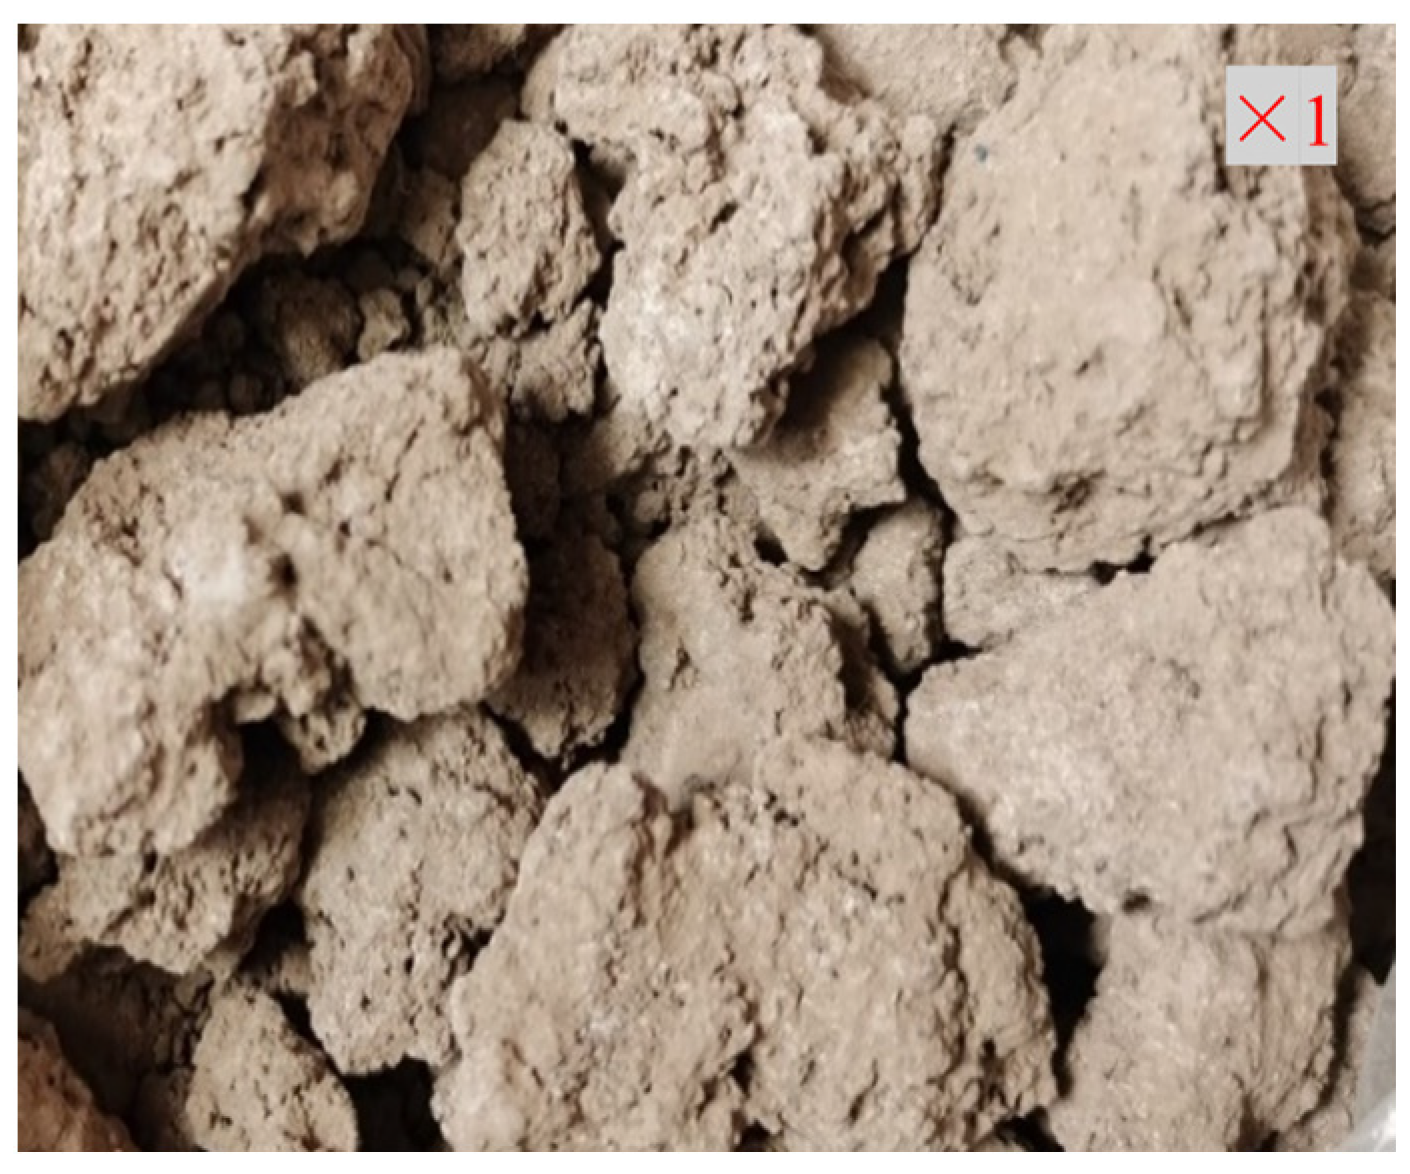
2.1. Devices and Materials

The electrolytic cell used for the recovery of metal lead with single–membrane double–chamber was made in laboratory, and the material was polymethyl methacrylate with corrosion resistance and high–temperature resistance. As shown in Figure 1, the electrolytic cell was mainly divided into three parts, which are cathode chamber, anion exchange membrane and anode chamber from left to right.
In this experiment, all the chemical reagents used were analytically pure, and the raw materials came from the anodic slime produced by an electrolytic manganese plant in Ningxia Province, China, after leaching with hydrogen peroxide (lead residue) (Figure 2). The lead–containing waste residue was analyzed by XRD, and the results are shown in Figure 3, and its main composition was PbSO4. Table 1 shows the analysis of the leaching solution under the optimum conditions: when the leaching solution was HNO3, the solid–liquid ratio was 4 g, the concentration of HNO3 was 2 mol/L, the leaching time was 70 min, and the leaching temperature was 80 °C, the leaching effect was the best, and the leaching rate of lead in the lead–containing waste residue was 85.7%. The concentration of lead Pb2+ was 2456.76 mg/L.

2.2. Experimental Process

In this process, the anion exchange membrane was placed in the middle of the electrolytic cell, and the enriched Pb2+ solution was adjusted to the corresponding concentration by dilution or distillation. An amount of 200 mL Pb2+ solution was added to the cathode chamber and 200 mL 0.5 mol/L HNO3 solution was added to the anode chamber. The electrolytic cell was placed in a constant temperature water bath pot and its power was supplied by DC–stabilized power supply. The changes of current and voltage were recorded during the experiment, and the lead recovered from the anode and cathode was detected and analyzed at the end. The effects of ion exchange membrane, anode material, Pb2+ concentration, current density, reaction temperature, pH of cathode solution, HNO3 concentration of anode solution and ammonium nitrate concentration of anode solution on the membrane electrolysis process were investigated. The current efficiency, lead recovery rate, acid recovery rate, voltage and power consumption were used as evaluation indexes to determine the optimal control parameters of the membrane electrolysis lead recovery process, and the reaction mechanism was analyzed. Then, the morphology, quality and crystal form of lead under the optimum electrolysis conditions were analyzed by means of SEM, XRD and other characterization methods.

2.3. Experimental Principle

The principle of the experiment is shown in Figure 4. Under the action of electric field, the reduction reaction occurred in the cathode, and the Pb2+ in the cathode solution was reduced to metal lead on the cathode plate. At the same time, the hydrogen evolution reaction occurred in the cathode, which affected the formation of metal lead. During the reaction, the NO3 in the cathodic solution passed through the anion exchange membrane into the anodic solution. At the same time, the oxygen evolution reaction took place in the anode to form NO3, and the NO3 migrated into the anodic solution formed HNO3 with the H+ generated by electrolytic water. With the progress of electrolytic reaction, the concentration of HNO3 in the anode chamber increased gradually, and the enrichment and recovery of nitric acid was realized. In the process of electrolysis, the main reactions in the cathode and anode chamber were as follows:
cathode room:
2 H + + 2 e H 2   φ = 0   V
P b 2 + + 2 e P b   φ = 0.126   V
2 H 2 O + 4 e H 2 + 2 O H   φ = 0.414   V
anode chamber:
2 H 2 O O 2 + 4 H + + 4 e   φ = 1.229   V
Figure 4. Experimental schematic diagram of single–membrane double–chamber electrolysis in the same cell.
Metals 13 01643 g004

2.4. Survey Indicators

(1)
Current efficiency. The percentage of the ratio of the actual amount of metal precipitated on the cathode to the theoretical amount of metal precipitated during electrolysis. The theoretical precipitation is calculated according to Faraday’s law, and so, the current efficiency is actually a measure of the deviation of the electrolysis process from Faraday law.
η = F m n M I t × 100 %
In the formula, η is the current efficiency, %; F is the Faraday constant, (96,485.33 C/mol); m is the product quality increment of electrodeposition, g; n is the number of transferred electrons, n = 2; M is the molar mass, (Pb 207.2 g/mol); I is the current intensity, A; t is the electrolysis time, s.
(2)
Acid recovery rate. In the process of membrane electrolysis, NO3 acts as a conductive ion between the anode solution and the cathode solution under the action of electric field force, and so, the recovery rate of HNO3 is calculated by Faraday law to measure the acid enrichment and recovery ability of this process.
p = ( C 2 C 1 ) n F M I t
In the formula, p is acid recovery, %; C2 is the concentration of nitric acid after the end of the reaction, g/L; C1 is the initial concentration of nitric acid, g/L; M is the molar mass (HNO3 is 63 g/mol).
(3)
Lead recovery rate. In this experiment, the ratio of Pb2+ concentration in cathode solution to Pb2+ concentration in initial cathode solution was used as lead recovery rate.
ζ = C 0 C t C 0 × 100 %
In the formula, ζ is the recovery rate of lead, %; C0 is the initial concentration of Pb2+; Ct is the concentration of Pb2+ after the end of the reaction, g/L.
(4)
Electricity consumption. In the electrolysis test, the lower the energy consumption, the better the economy.
E = n U F × 1000 3600 η M
In the formula, E is electricity consumption, kW·h·t−1; U is cell voltage, V; η is current efficiency, %; M is molar mass.

3. Results and Discussion

Before the experiment, the lead–containing waste residue produced in electrolytic manganese was firstly leach from solid state, and then enriched and concentrated by ion exchange method, so that the concentration of Pb2+ reached the concentration range suitable for membrane electrolysis.

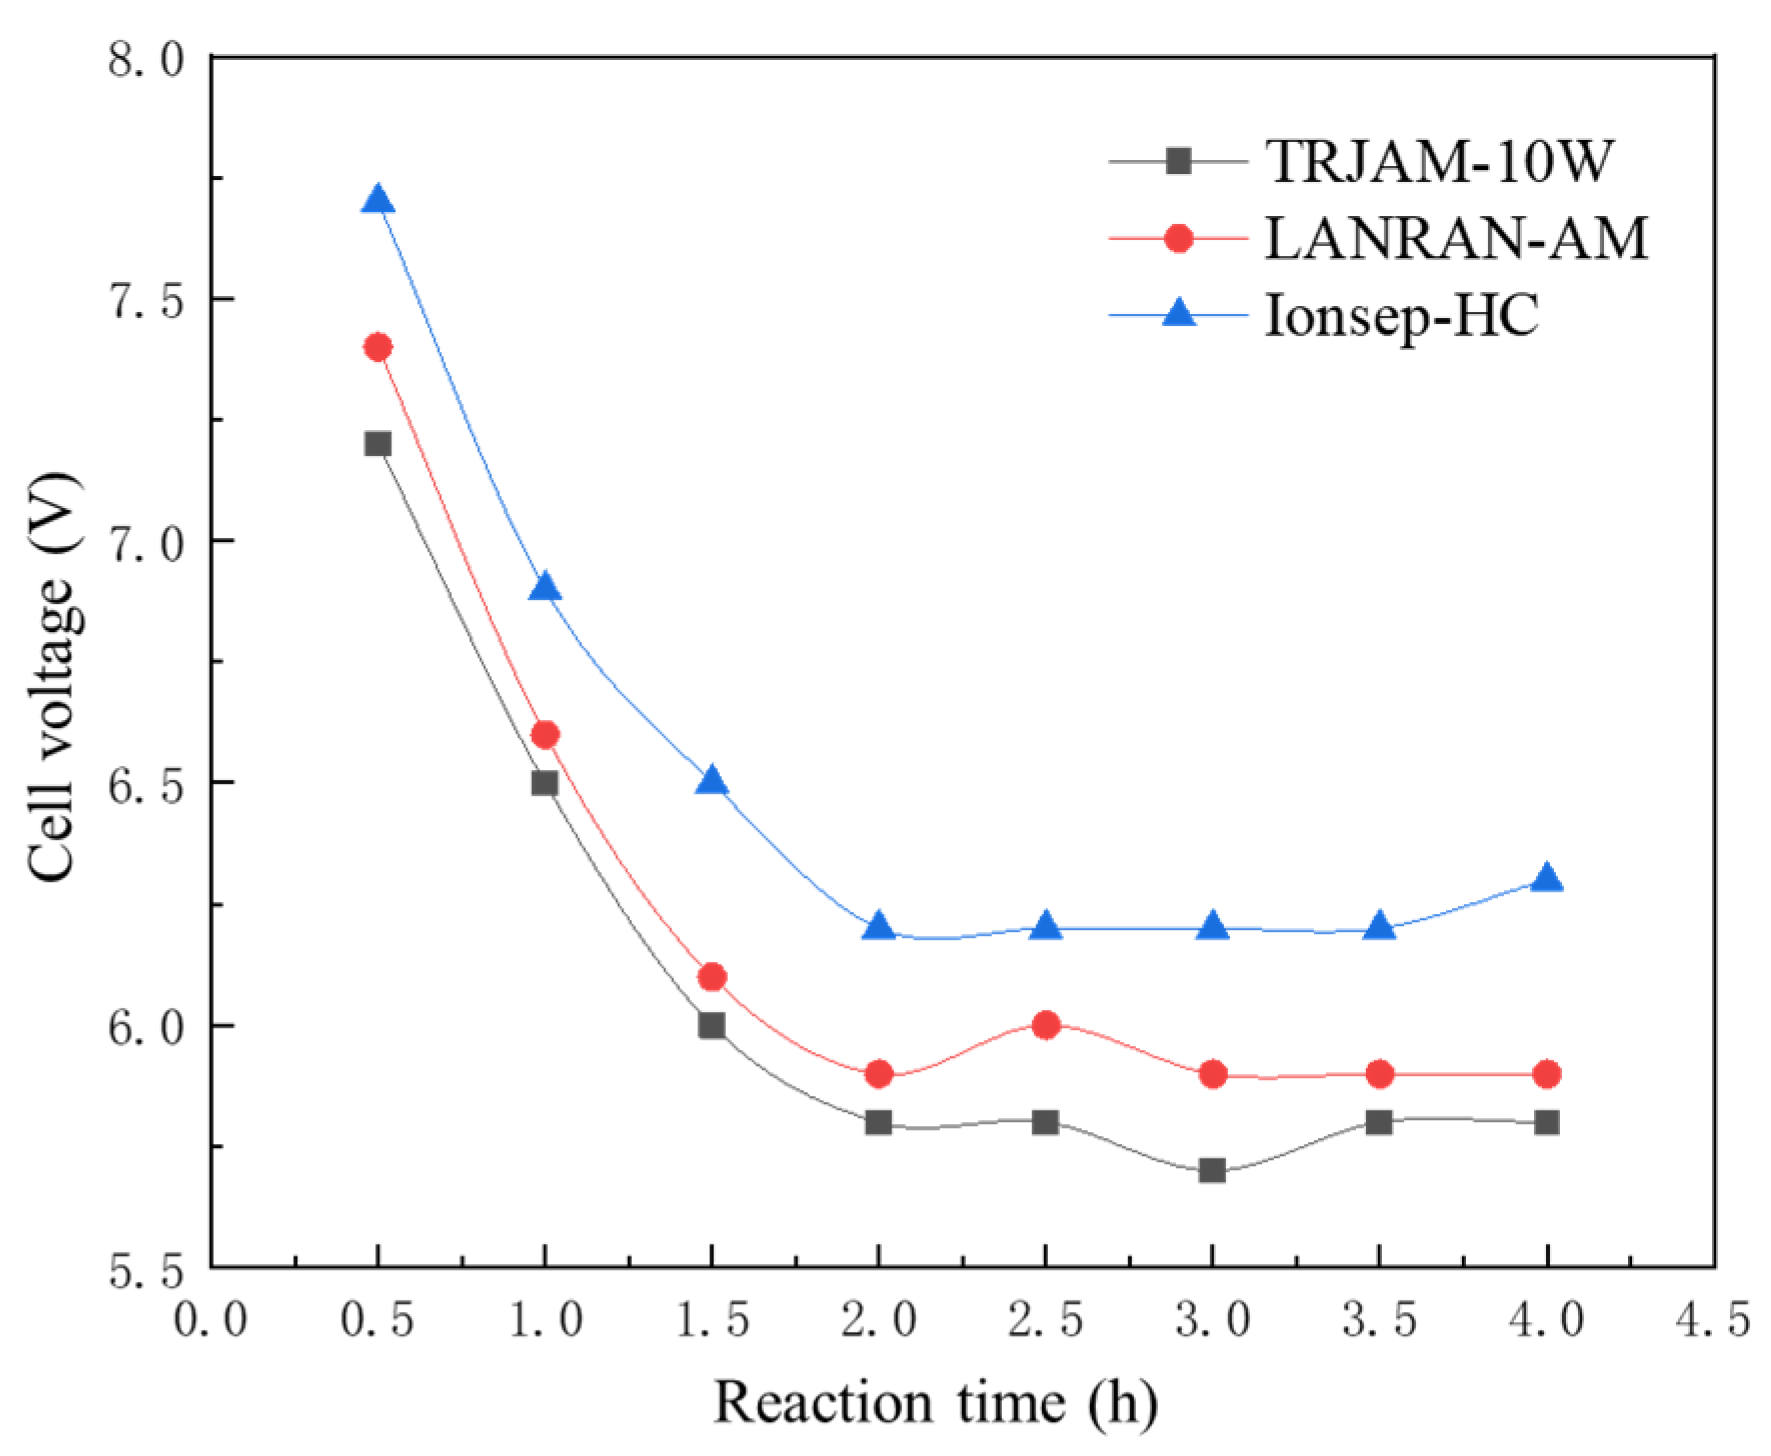
3.1. Selection of Ion Exchange Membrane

Ion exchange membrane is an important part of the device, the selection of appropriate ion exchange membrane has a certain significance to improve the electrolysis effect, increase the current efficiency and reduce energy consumption. Many parameters such as mechanical strength, selective permeability, corrosion resistance and membrane resistance should be comprehensively considered in the selection, so the best membrane materials are selected from three kinds of anion exchange membranes: homogeneous membrane, semi–homogeneous membrane and heterogeneous membrane for this experiment.
In this experiment, the anode material was a titanium–coated ruthenium–iridium plate and the cathode was a pure lead plate. During the electrolytic process, the concentration of Pb2+ in the cathodic solution was controlled to be 40 g/L, the initial pH value was 4, the current density was 40 mA/cm2, the electrode membrane distance was 5 cm, the concentration of HNO3 in the anodic solution was 0.5 mol/L, the concentration of ammonium nitrate in the cathodic solution was 110 g/L, and the electrolytic temperature was 40 °C. Under this condition, three commercially available ion exchange membranes of different types (TRJAM–10W (homogeneous), LANRAN–AM (semi–homogeneous) and Ionsep–HC (heterophase) were selected (their properties are shown in Table 2). A constant temperature water bath was used to control the electrolysis temperature for 2 h, and relevant indicators were investigated. The effects of three different types of ion exchange membranes on the lead recovery process were investigated, and the best membrane materials were selected for subsequent experiments.
Figure 5 is the experimental results of current efficiency, recovery and power consumption under different ion exchange membrane conditions, from which it can be clearly seen that no matter which index, the performance of homogeneous anion exchange membrane TRJAM–10W was the best. According to the analysis of the reason, because TRJAM–10W had a larger selective permeability coefficient (>95%), more NO3 ions in the cathode chamber will migrate through the ion exchange membrane to the anode chamber, and according to the solution neutrality principle, more H+ will be formed in the anode chamber and form HNO3 with NO3−. So, there is a higher acid recovery rate at this time. At the same time, in order to maintain the charge balance, the reduction in NO3 ions in the cathode solution will inevitably lead to the corresponding reduction in Pb2+, and then Pb2+ will be reduced in the cathode to form metal lead.
It can be seen from Figure 5 that although the types of the three anion exchange membranes were different, the cell voltage decreased with the increase in electrolysis time, and the cell voltage decelerated rapidly in the first two hours, and then tended to smooth gradually. The reason for thwas that the concentration of anodic acid was low at the initial stage of electrolysis, and with the progress of the reaction, the concentration of HNO3 increased gradually, the resistance of the solution decreased with the increase in free electrons in the solution, and the cell voltage decreased accordingly. After 2 h, the migration of ions was gradually completed, and the concentration of anodic acid reached the saturated state, and so, the cell voltage was gradually stable. It can be seen from the figure that the cell voltage of heterogeneous anion exchange membrane Ionsep–HC in the process of electrolys was always large, which was caused by its own high membrane resistance.

3.2. Selection of Anode Materials

As an important component of membrane electrolysis, anode material has an important influence on the electrolysis process. Different anode materials have different corrosion resistance, electrical conductivity and oxygen evolution performance, which directly affect the current efficiency, recovery rate and power consumption and other indicators. At present, the commonly used titanium–based electrode is often used in the electrolysis process because of its high strength, corrosion resistance, excellent electrical conductivity and oxygen evolution performance. Therefore, in this experiment, pure titanium plate, titanium–coated ruthenium iridium and titanium–coated iridium–tantalum (7 cm × 7 cm × 9 cm) were selected for the experiment, and the best material was selected for the follow–up experiment.
In the process of electrolytic recovery of lead in this experiment, the pure lead plate was used as the cathode. Because of its high hydrogen evolution overpotential, the side reaction of hydrogen evolution can be reduced and other impurities will not be introduced. In the process of electrolysis, the Pb2+ concentration of cathode solution was 40 g/L, the initial pH value was 4, current density was 40 mA/cm2, electrode membrane spacing was 5 cm, HNO3 concentration of anode solution was 0.5 mol/L, ammonium nitrate concentration of cathode solution was 110 g/L, electrolysis temperature was 40°C, electrolysis temperature was controlled by constant temperature water bath pot, electrolysis for 2 h, current efficiency, lead recovery rate, acid recovery rate, voltage and power consumption were investigated respectively. To explore the effects of three different anode plates on the process of recovering lead by membrane electrolysis, we selected the best anode material for follow–up experiments.
It is obvious from Table 3 that the slot voltage of titanium plates was much higher than that of titanium–coated ruthenium iridium and titanium–coated iridium–tantalum plates. Compared with other parameters, there was a big gap between titanium plate and the other two plates in each dimension. Compared with titanium–coated iridium–tantalum electrode, titanium–coated ruthenium iridium electrode has lower oxygen evolution potential, lower cell voltage [7], higher acid recovery and lower power consumption in the experiment. and the cost of titanium–coated iridium–tantalum electrode is higher. Therefore, from a comprehensive point of view, titanium–coated ruthenium iridium electrode was selected as the anode of membrane electrolysis to recover lead.

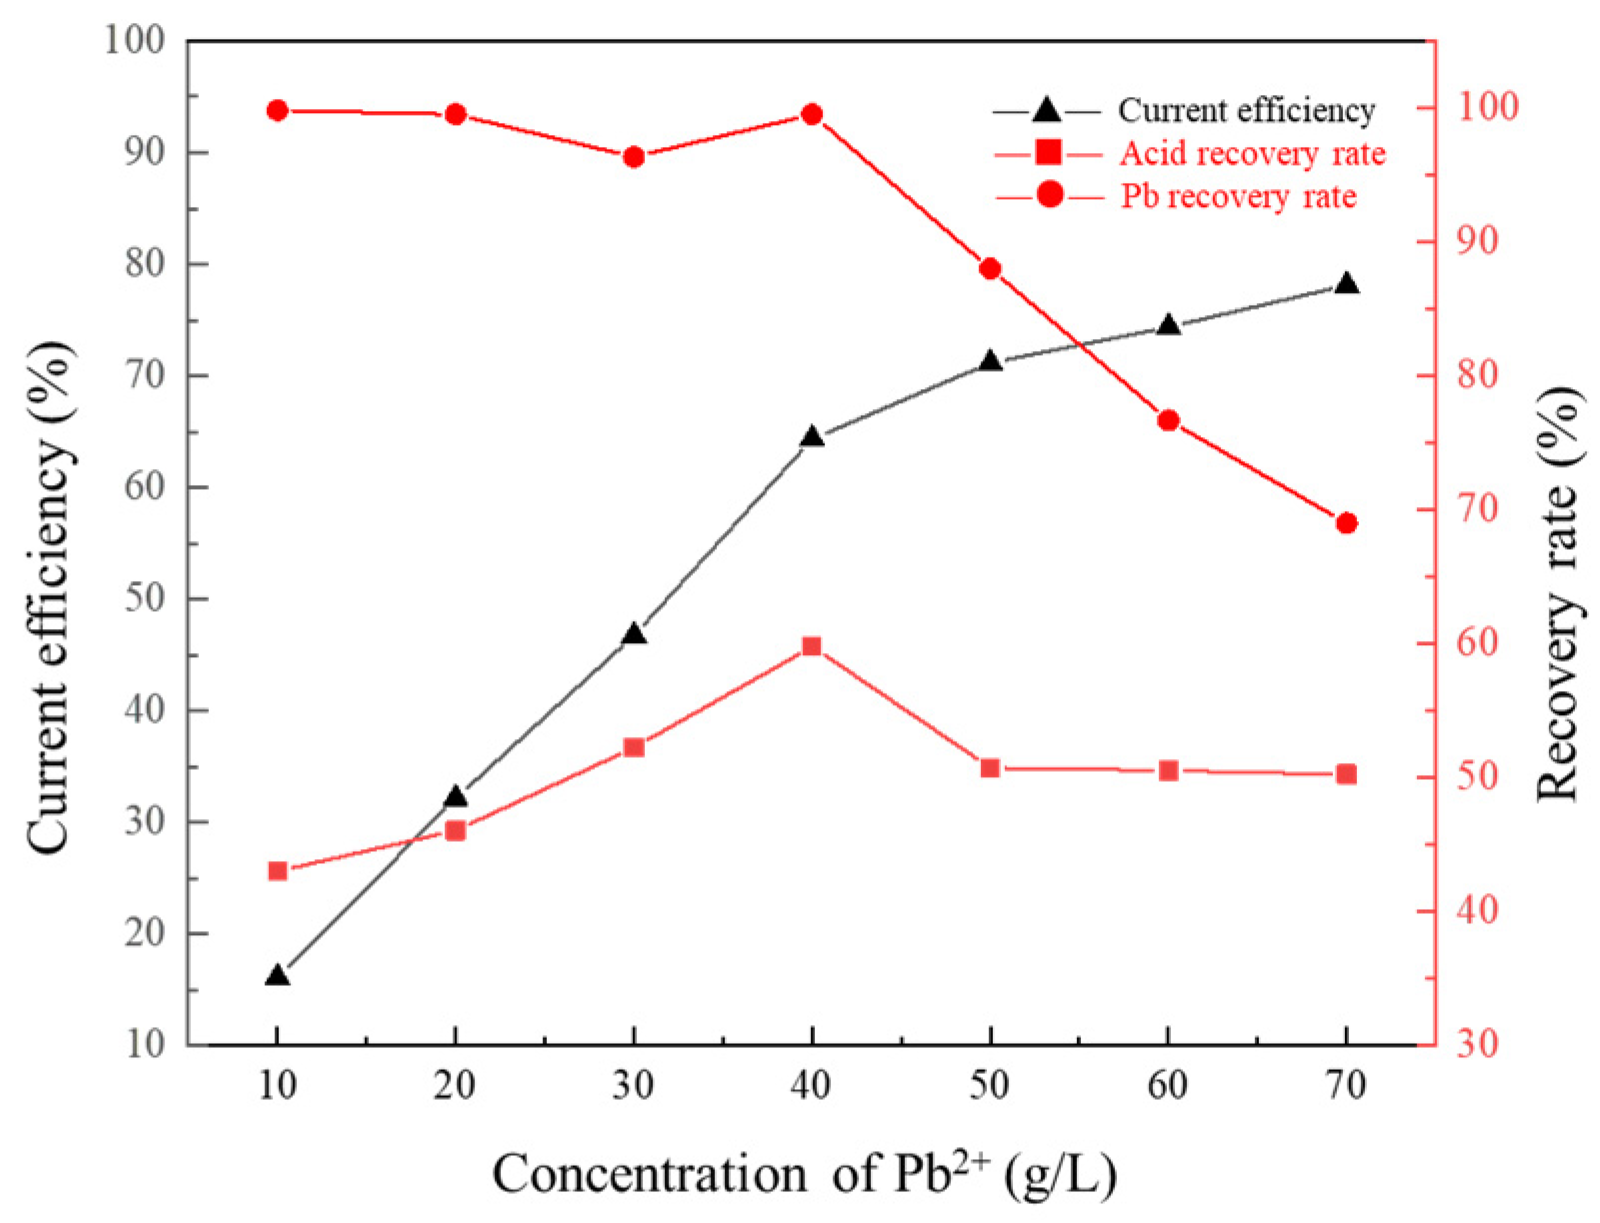
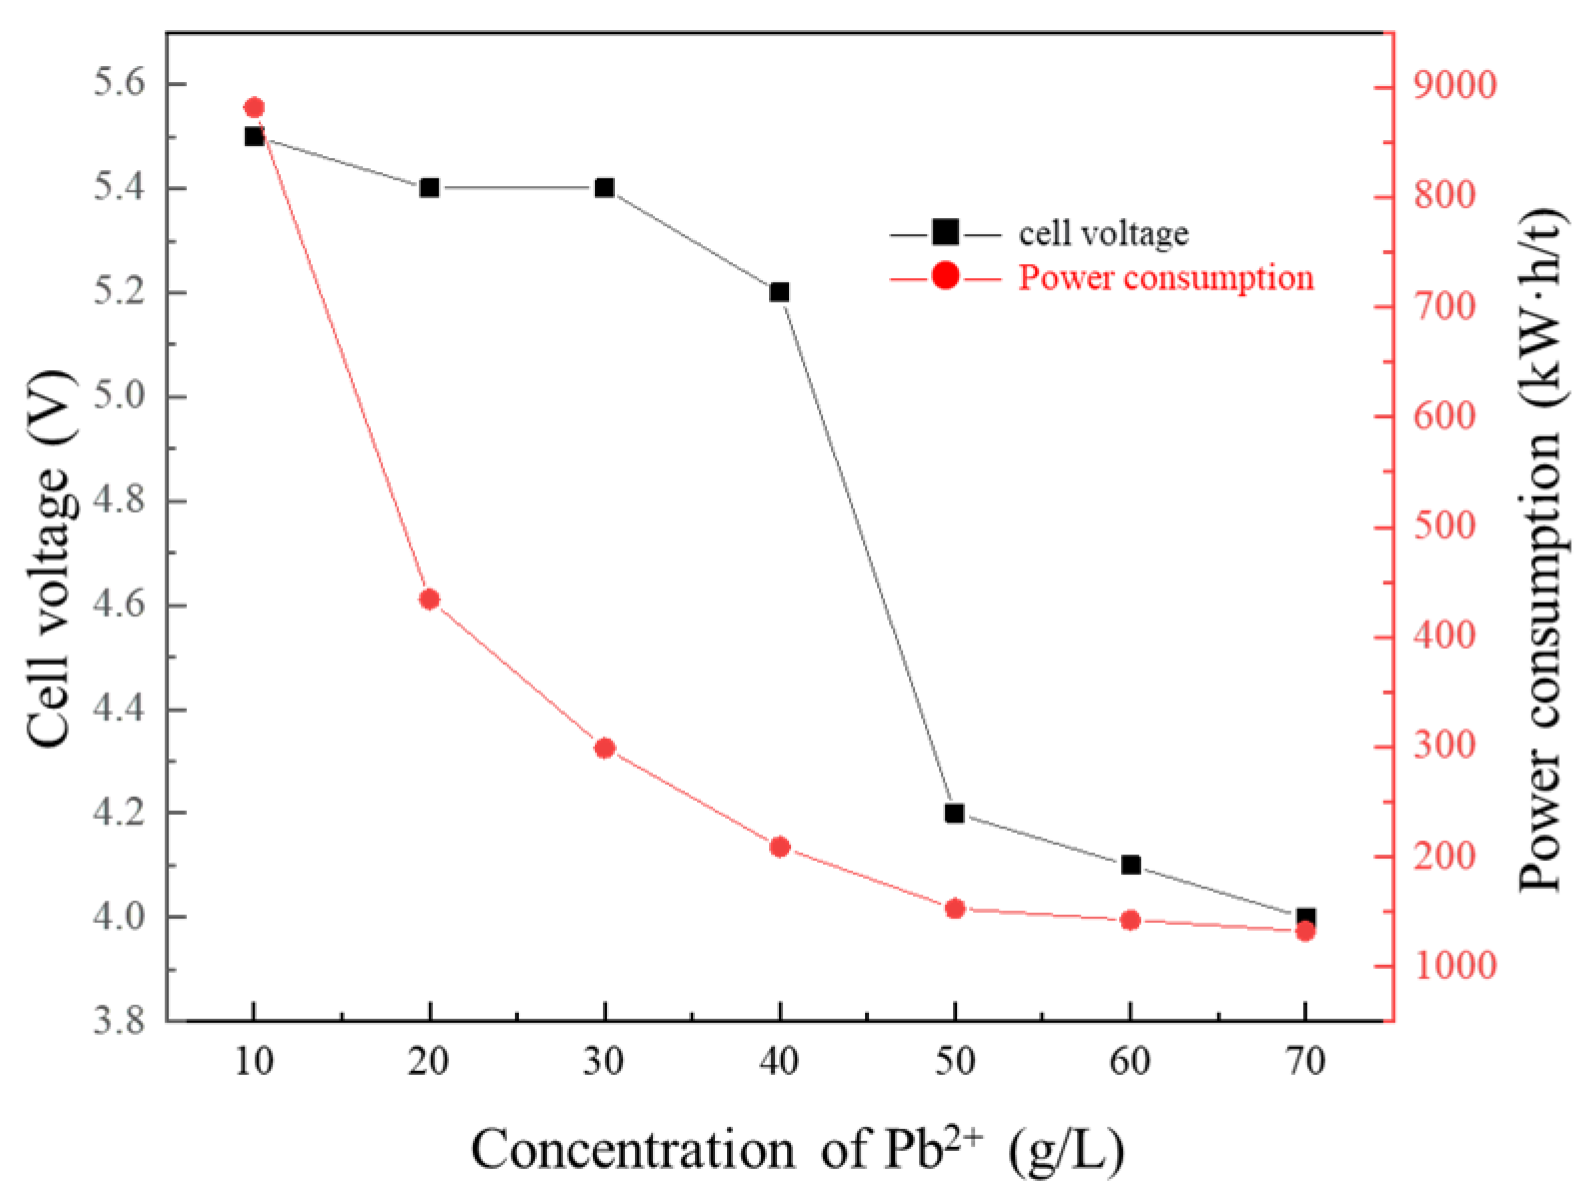
3.3. Effect of Pb2+ Concentration of Cathode Solution on Membrane Electrolysis

Sufficient Pb2+ concentration in the solution is a necessary condition to ensure the normal occurrence of electrodeposition reaction in the process of membrane electrolysis. The concentration of Pb2+ in the suitable concentration range can not only improve the current efficiency and accelerate the deposition of lead in the cathode, but also reduce energy consumption and improve the quality and purity of recovered lead.
In this experiment, the anode material was titanium–coated ruthenium iridium plate and the cathode plate was pure lead. In the process of electrolysis, the initial pH value was 4.0, the current density was 40 mA/cm2, the distance between the electrode membranes was 5 cm, the concentration of HNO3 in the anode solution was 0.5 mol/L, the concentration of ammonium nitrate in the cathode solution was 110 g/L, the electrolysis temperature was 40 °C, and the electrolysis time was 2 h. The effects of Pb2+ concentration of 10 g/L, 20 g/L, 30 g/L, 40 g/L, 50 g/L, 60 g/L and 70 g/L on the current efficiency, lead recovery, acid recovery, voltage and power consumption in the process of lead recovery by membrane electrolysis were investigated, and the best Pb2+ concentration was selected for follow–up experiments.
Lead in the solution will be gradually exhausted in the process of electrolysis. Therefore, through the previous experiments, it was found that the current efficiency decreased sharply when the lead concentration was below 10 g/L. Considering the production practice and economic benefits, the lowest acceptable concentration of lead recovered by electrolysis is 10 g/L. It can be seen from Figure 6 that the current efficiency increased with the increase in Pb2+ concentration, and the current efficiency increased slowly when the 40 g/L concentration was exceeded, while the lead recovery rate can be maintained at a high level when the Pb2+ concentration is small, and it also decreased rapidly when the 40 g/L concentration was exceeded, and the excess Pb2+ in the solution cannot be electrolyzed out. Similarly, the acid recovery was the highest when the Pb2+ concentration was 40 g/L, and the current efficiency, lead recovery and acid recovery were 64.4%, 94.2% and 59.8%, respectively.
At the same time, as shown in Figure 7, the power consumption was also maintained at a low level at this time. This is because when the concentration of Pb2+ was low, the concentration of ions in the electrolyte was smaller and the conductive ions were less, and so, the higher the resistance of the solution leads to the higher the voltage; when the Pb2+ in the solution increased, the free ions in the solution gradually increased, the voltage will gradually decrease and the power consumption will gradually decrease. The high concentration of Pb2+ will lead to the increase in solution viscosity and hinder the transport process of conductive ions [8].
As shown in Figure 8, the surface of lead recovered by electrolys was black PbO2 when the concentration of Pb2+ was 10 g/L, and the electrolytic product was lead with silver metallic luster when the concentration of 40 g/L was too high, but when the concentration of Pb2+ was too high, the lead element cannot be well attached to the cathode, which leads to it being scattered in the cathode solution. To sum up, too high or too low Pb2+ in the cathode solution is not conducive to the electrolysis process and the effective recovery of electrolytic products, and so, it was determined that the Pb2+ concentration of the cathode solution in the single–membrane double–chamber electrolysis process for lead recovery is 40 g/L.

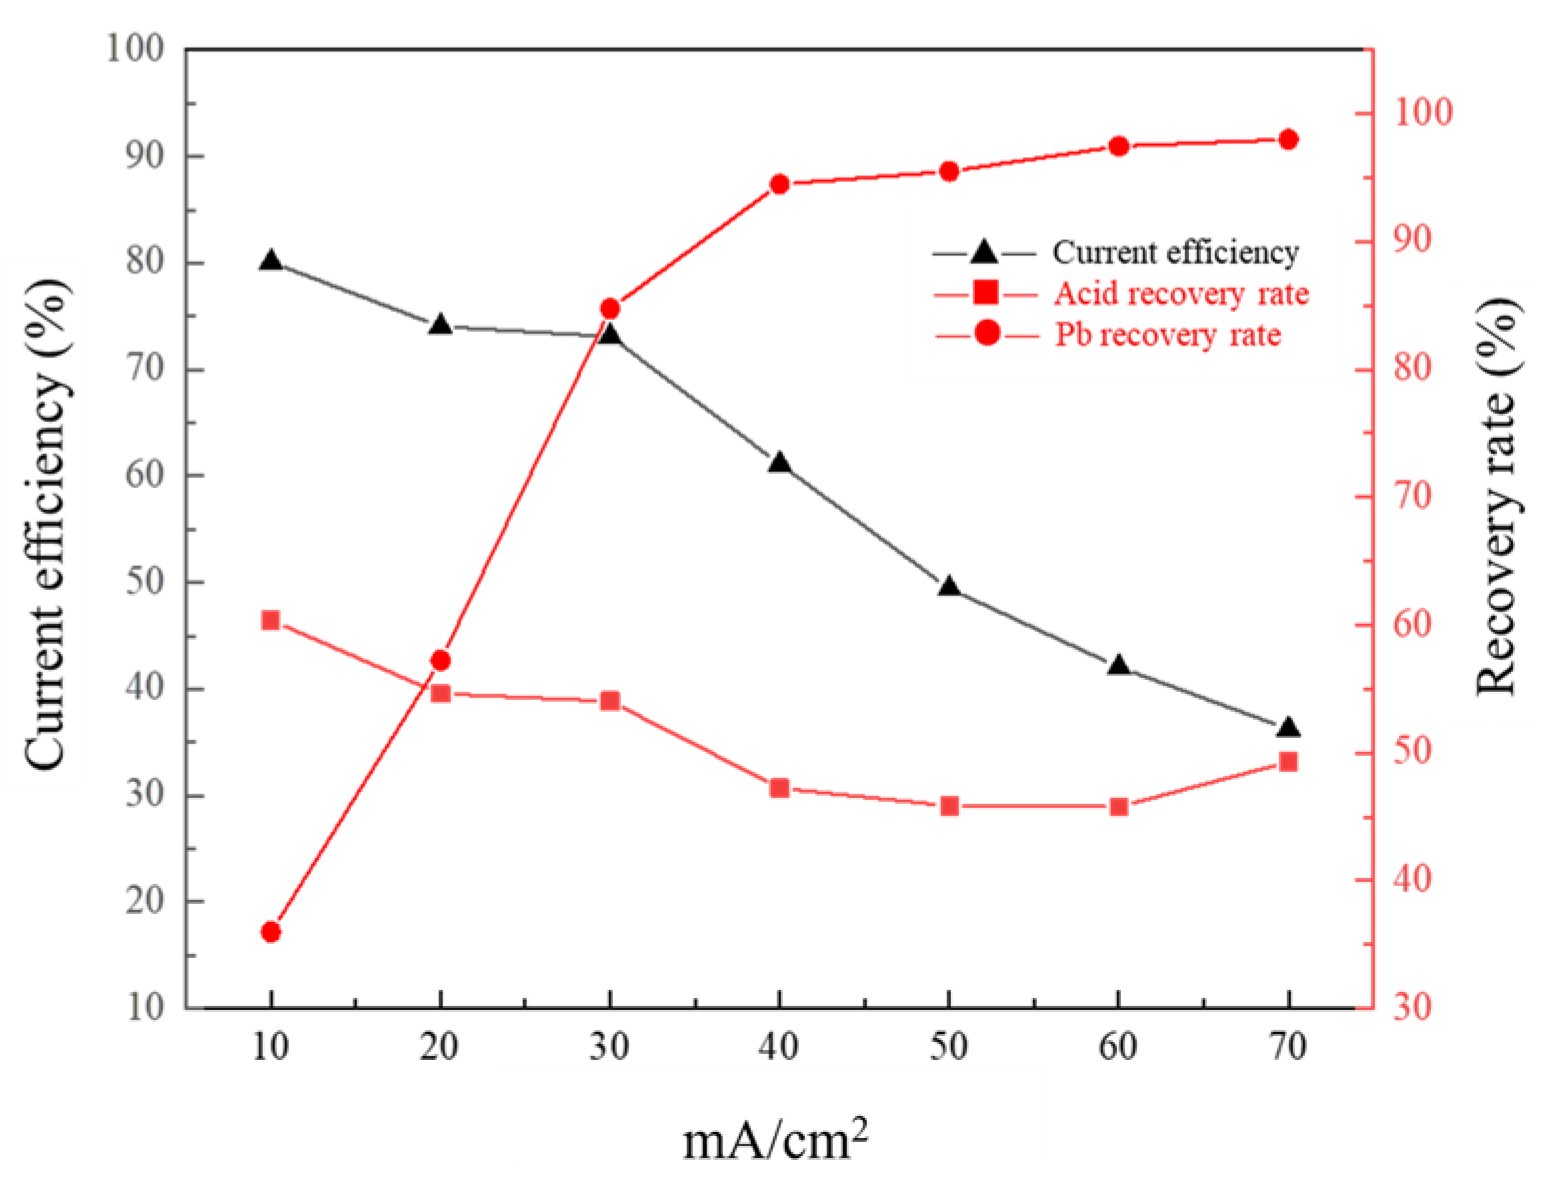
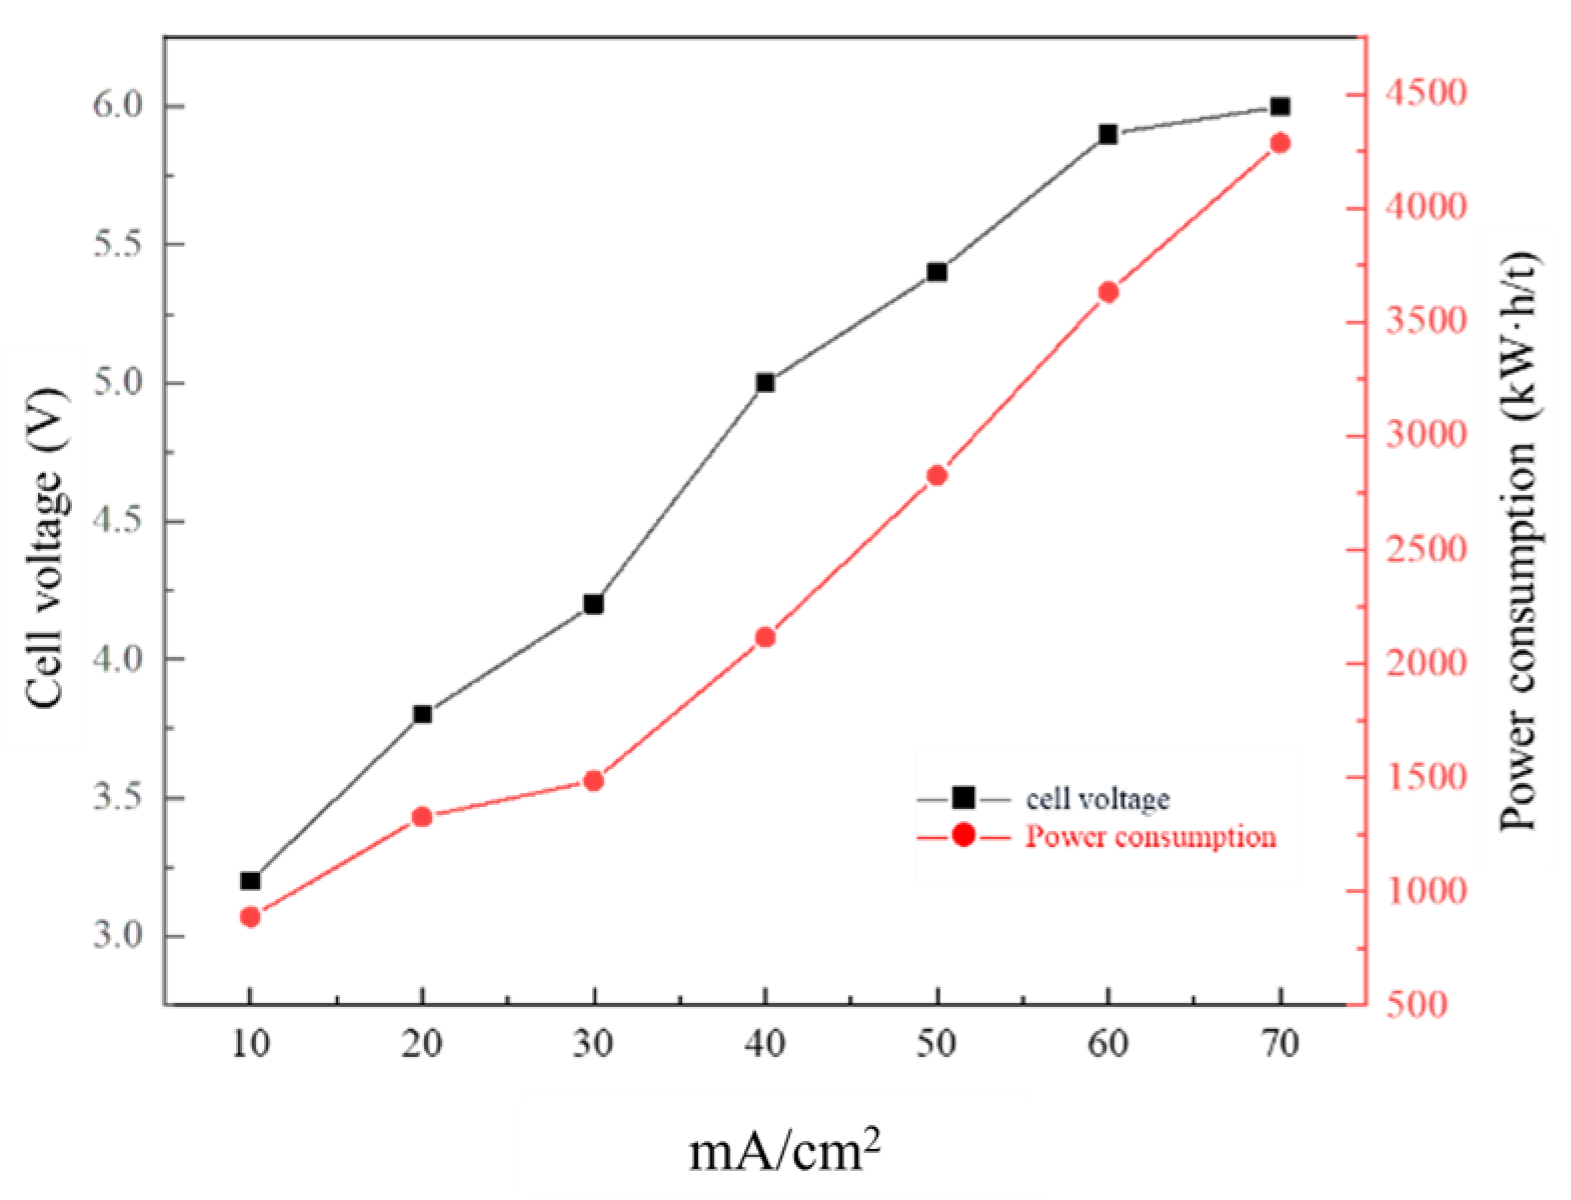
3.4. Effect of Current Density on Membrane Electrolysis

The current density has an important influence on the electrolysis process. The appropriate current density will not only improve the current efficiency, but also increase the reaction rate to optimize the deposition state. For the membrane electrolysis technology, due to the existence of the ion exchange membrane, the reaction efficiency will be reduced and the current efficiency will be reduced if the current density is too low. When the current density is too high, the pressure drop between the solution and the ion membrane will be too large. It will reduce the performance of the ion exchange membrane, and even cause damage to the membrane.
In this experiment, the same electrolysis conditions were used to investigate the effects of different current densities of 10 mA/cm2, 20 mA/cm2, 30 mA/cm2, 40 mA/cm2, 50 mA/cm2, 60 mA/cm2 and 70 mA/cm2 on the experiment. Through the evaluation of current efficiency, lead recovery, acid recovery, voltage and power consumption, the best current density was selected for follow–up experiments.
The experimental results are shown in Figure 9 and Figure 10. The current efficiency and acid recovery decreased with the increase in current density. However, the recovery rate of lead was the opposite trend, and was found to be stable after the current density was 30 mA/cm2, when the current efficiency, acid recovery and lead recovery were 71.3%, 54% and 84.8%, respectively. At the same time, it can be seen that the voltage and power consumption increased with the increase in current density, in which the power consumption increased slowly when the current density was small, and almost linearly increased when it exceeded 30 mA/cm2. At 30 mA/cm2, the voltage and energy consumption were 4.2 V and 1486.5 kW·h·t−1, respectively.
The reason for this is that with the increase in current density, the chance of hydrogen evolution reaction of electrolytic products increases under the impact of high current density, which will affect the reduction in Pb2+ in the cathode [9]. Moreover, when the current density is high enough, the Pb2+ in the cathode solution is close to being electrolyzed out completely, and so, the recovery rate of lead is gradually flat. In addition, with the increase in current density, the energy consumption of voltage and electric energy increases sharply, because the higher the overpotential of oxygen evolution reaction and cathodic reduction reaction at high current density, the higher the overall voltage of the electrolytic cell. In turn, it leads to an increase in energy consumption in the electrolysis process [10,11].
From the point of view of energy saving, it is advantageous to use lower current density, which can lead to lower energy consumption and higher quality electrolytic products [12]. However, at low current density, it takes a long time for electrolysis to recover lead completely. On the contrary, the use of high current density is not satisfactory, because severe gas precipitation will affect the service life of the anode. Finally, considering the energy consumption and the actual operation, it was determined that the current density in the single– membrane double–chamber electrolytic lead recovery process is 30 mA/cm2.

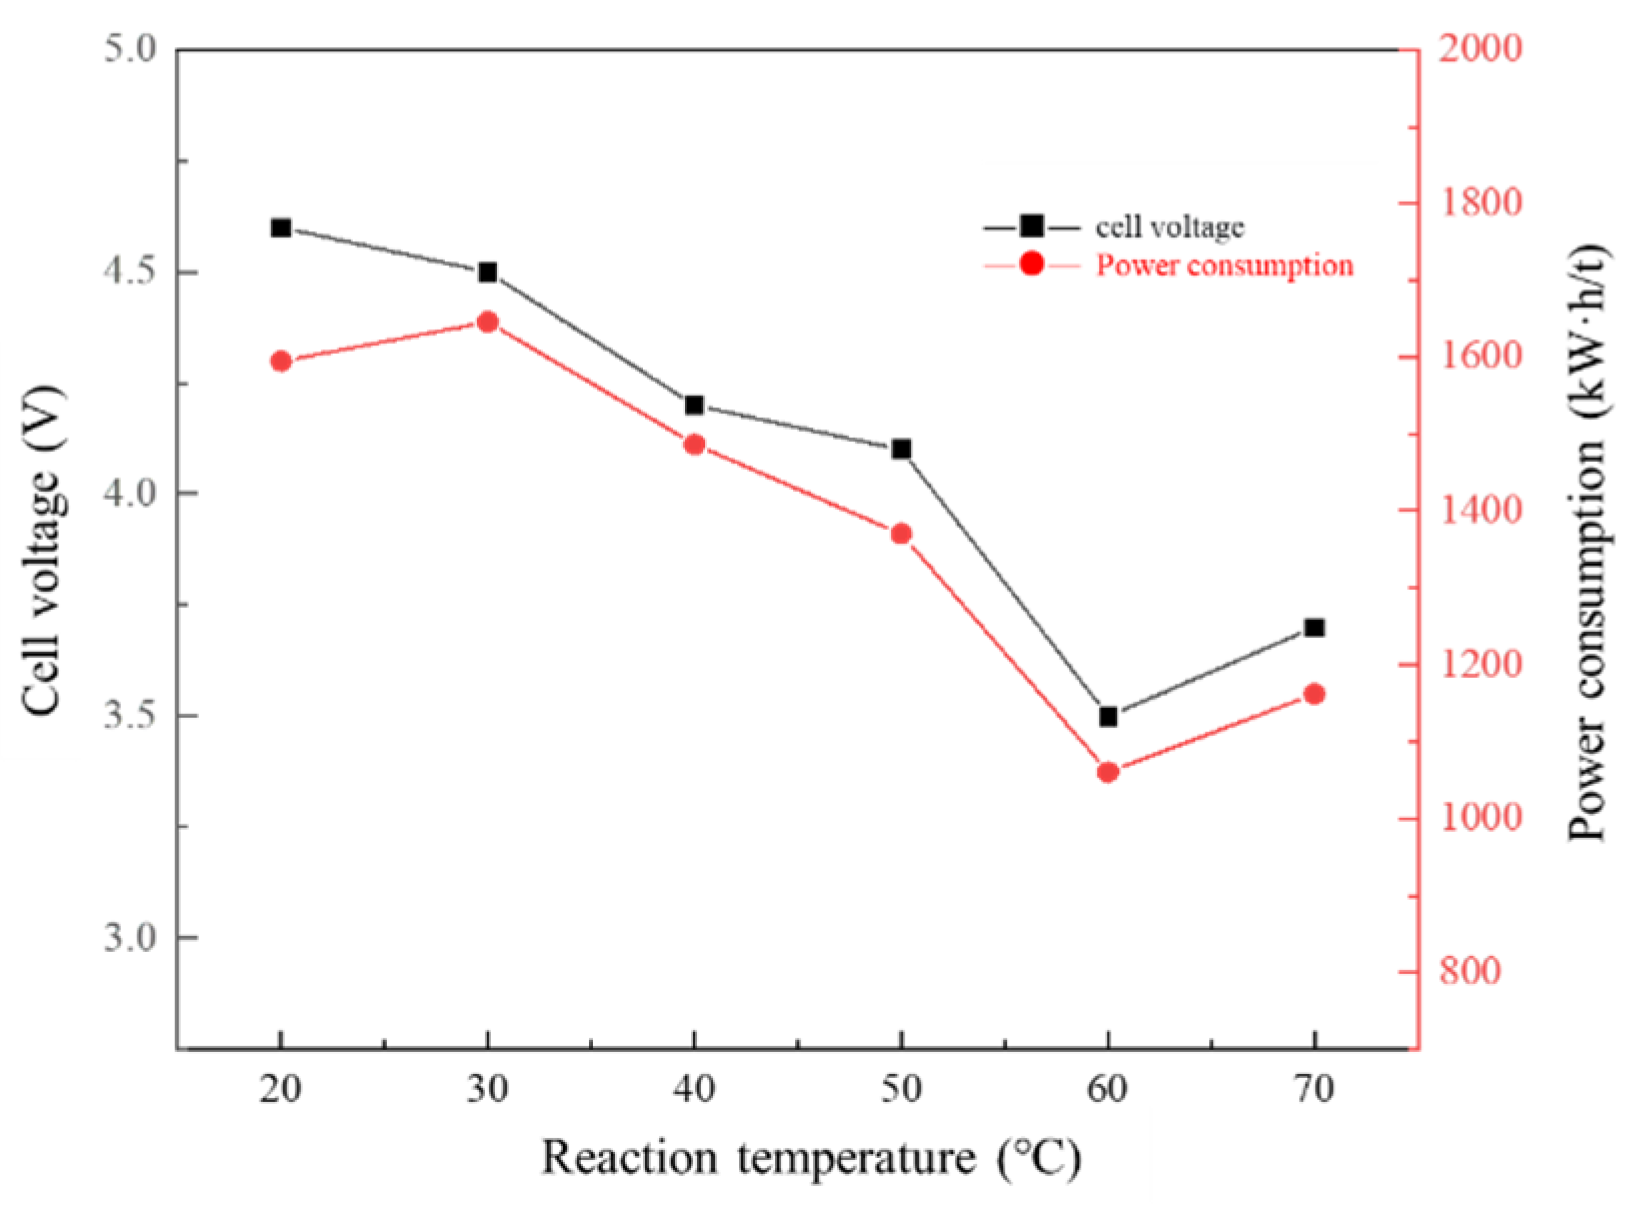
3.5. Effect of Reaction Temperature on Membrane Electrolysis

The effect of temperature on the process of membrane electrolysis is mainly shown in two aspects [13]: on the one hand, high temperature can effectively reduce the rate and degree of electrochemical polarization reaction, which is beneficial to the electrodeposition reaction; on the other hand, due to the increase in temperature, the diffusion coefficient of the reaction ion at the interface and the diffusion layer increases, the thickness of the diffusion layer decreases, and the migration speed of the ion to the electrode surface is accelerated.
In this experiment, the same experimental parameters were used, the concentration of HNO3 in anode solution was 0.5 mol/L, the concentration of ammonium nitrate in cathode solution was 110 g/L, and the electrolysis temperature was 20 °C, 30 °C, 40 °C, 50 °C, 60 °C, 70 °C, respectively. The current efficiency and other indexes were investigated, and the best electrolysis temperature was selected.
As shown in Figure 11 and Figure 12, the current efficiency, acid recovery and lead recovery all increased with the increase in temperature in the range of 20–60 °C, reaching the highest at 60 °C, 85.4%, 70.6% and 99.0%, respectively. At the same time, the energy consumption of voltage and electric energy decreased at first and then increased, and reached the lowest point when the electrolysis temperature reached 60 °C, which was 3.5 V and 1060.4 kW·h·t−1, respectively.
Analyzing the reasons, firstly, appropriately increasing the temperature of the electrolyte can accelerate ion diffusion, increase the conductivity of the solution, and reduce the overpotential of the cathodic reduction reaction [14]. That is to say, increasing the temperature is beneficial to reduce the energy consumption in the process of lead reduction. However, the higher the temperature, the lower the hydrogen evolution overpotential, and the greater the possibility of the cathodic hydrogen evolution reaction, resulting in a decrease in current efficiency and lead recovery [15]. At the same time, increasing the temperature helps to increase the diffusion coefficient of ions at the interface and diffusion layer, reduce the thickness of the diffusion layer, and accelerate the migration of ions to the electrode surface [16]. In addition, raising the temperature will enlarge the pores of the ion exchange membrane, enhance the conductivity of the ion exchange membrane, reduce the membrane resistance and cell voltage, and reduce energy consumption. When the temperature exceeds 60 °C, the cathode current efficiency drops sharply. This is because the selective permeation function of the ion exchange membrane is disordered and the ions cannot be effectively blocked when the temperature is too high. The H+ in the anolyte migrates through the anion exchange membrane and enters the cathode chamber under the action of the electric field force. The increase in H+ concentration in the cathode chamber will cause serious hydrogen evolution reaction, reduce current efficiency and increase energy consumption [17].

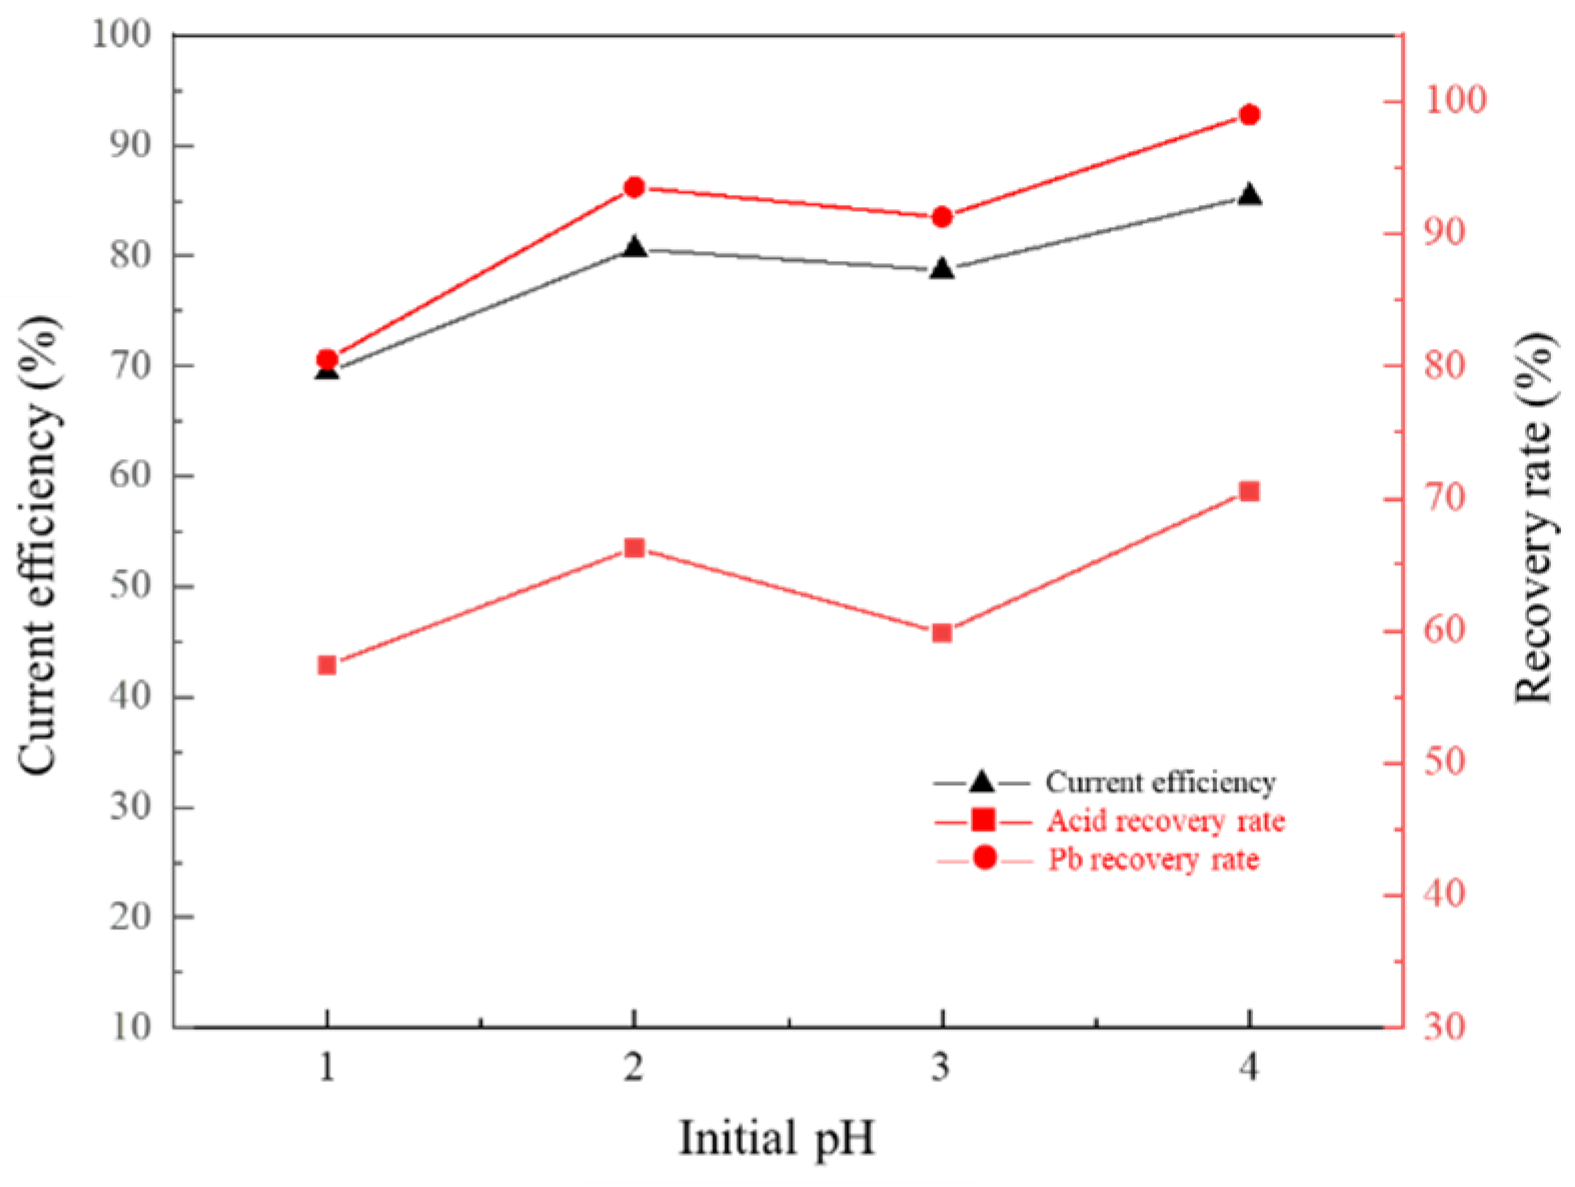
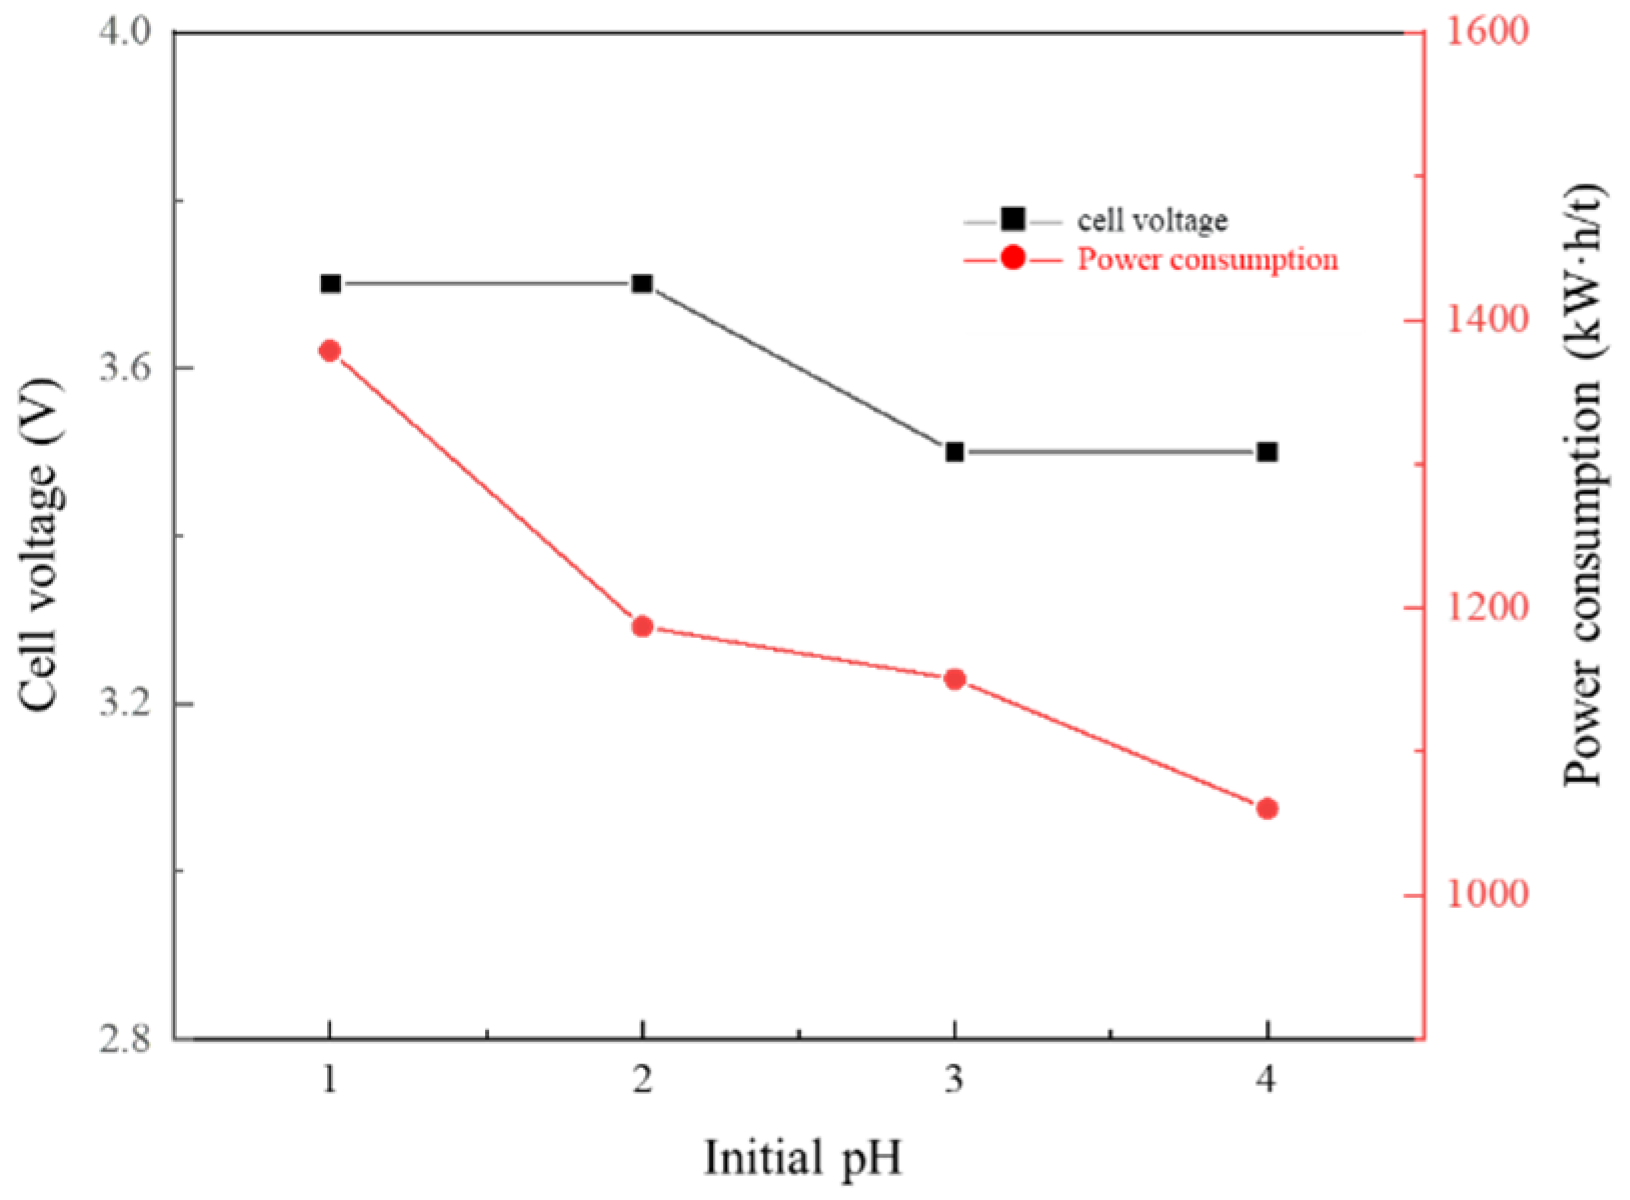
3.6. Effect of Cathode Solution pH on Membrane Electrolysis

In the membrane electrolysis lead recovery process, the control of the pH of the catholyte is critical. If the pH value is too low, the side reaction of hydrogen evolution at the cathode will be intensified, which will affect the recovery efficiency and quality of lead; and when the pH value is too high, Pb2+ in the catholyte will react with OH to form Pb(OH)2 precipitation, which will reduce the recovery quality of lead and recovery rate.
In this experiment, the influence of the initial pH value of the catholyte on the process was investigated, and we then selected the optimal initial pH value of the catholyte.
As shown in Figure 13 and Figure 14, in the pH range of 1–4, the current efficiency, acid recovery rate and lead recovery rate all increased with the increase in pH value, and reached the highest when the pH value reached 4, which were 85.4%, 70.1% and 99.0%, respectively. At the same time, the voltage and power consumption decreased continuously with the increase in pH, and, finally, were 3.5 V and 1060.4 kW·h·t−1, respectively. When the pH value of the catholyte is low, there are more H+ in the catholyte, and H+ forms a competitive relationship with Pb2+, thus affecting the precipitation of lead.
As shown in Figure 15, when the initial pH of the catholyte was 1, the purity of lead recovered by electrolys was not high, and there was black PbO2 on the surface. As the pH rose, the hydrogen evolution reaction was suppressed, and more Pb2+ will be reduced to lead at the cathode, so that more NO3 will migrate into the anolyte through the anion exchange membrane to form HNO3, thereby increasing the acid recovery rate, and it will reduce energy consumption. When the pH value exceeds 4, Pb2+ will form white precipitate Pb(OH)2 with OH, which will cause Pb2+ not to be reduced to lead and reduce the recovery rate of lead. In summary, the initial pH value of the catholyte in the single–membrane double–chamber electrolytic recovery process for lead was determined to be 4.

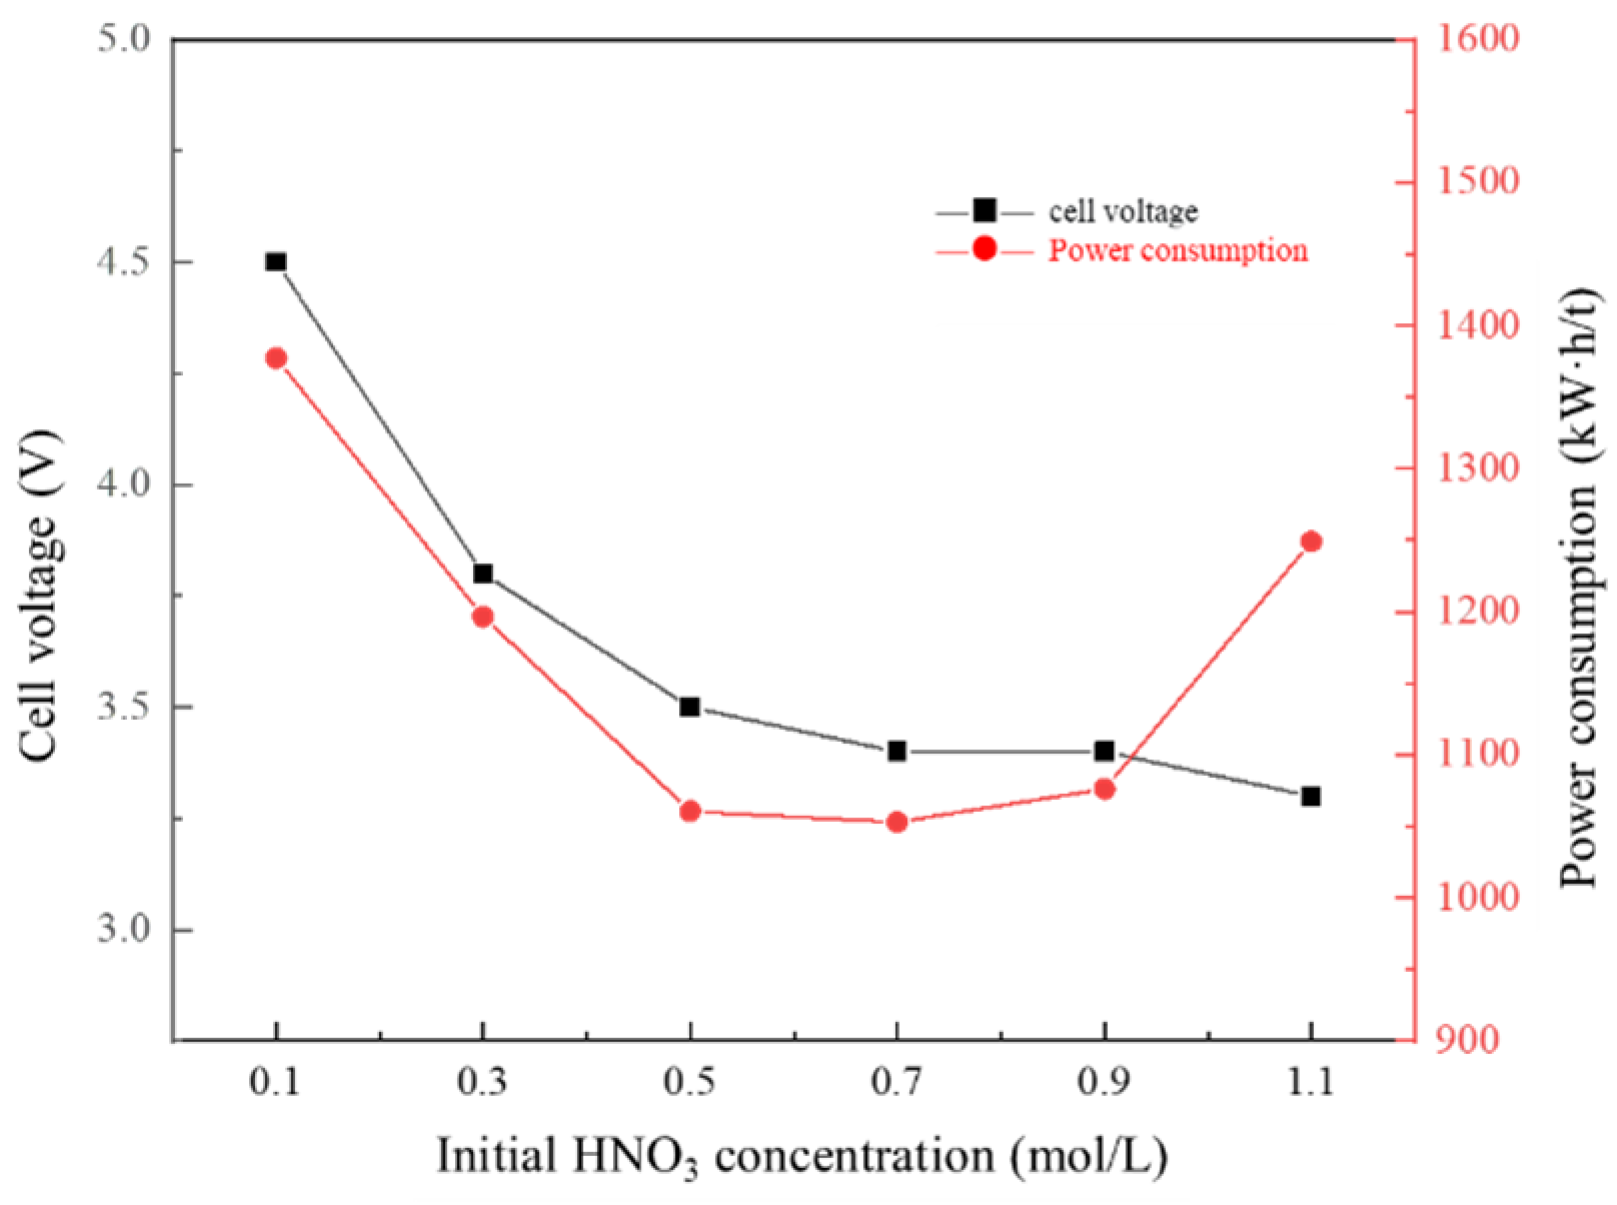
3.7. Effect of HNO3 Concentration of Anode Solution on Membrane Electrolysis

In the process of membrane electrolysis lead recovery, the concentration of initial HNO3 in the anolyte affects the conductivity in the solution, and also has a great influence on the recovery of HNO3 in the anolyte. In this experiment, the initial pH of the catholyte was controlled at 4 and the electrolysis temperature was 60 °C to explore the influence of the concentration of HNO3 in the anolyte on the process of lead recovery by membrane electrolysis, so as to select the optimal concentration of HNO3 in the anolyte.
It can be seen from Figure 16 and Figure 17 that the current efficiency and lead recovery rate wererelatively stable at the beginning, and began to decline when the concentration of HNO3 exceeded 0.5 mol/L. However, the acid recovery rate decreased with the increase in the concentration of HNO3 in the anolyte, and the voltage decreased continuously with the increase in the concentration of HNO3.
With the increase in HNO3 concentration in anode solution, there weremore free conductive ions in the solution, the resistance of the solution became smaller, and the cell voltage decreased, resulting in lower energy consumption. However, when the concentration of HNO3 was too high, the concentration difference of H+ in the solution on both sides of the anion exchange membrane became larger. Under the double action of the electric field force and the diffusion behavior caused by the concentration difference between the two sides, part of H+ will leak through the anion exchange membrane into the cathode chamber. When the concentration of H+ in the catholyte increases, Pb2+ in the catholyte competes with the increasing H+, resulting in the decrease in lead recovery and the increase in energy consumption. At the same time, due to the leakage of H+, the recovery rate of HNO3 in the anodic solution decreased significantly. As can be seen from Figure 18, when the concentration of HNO3 in the anodic solution was as high as 1.1 mol/L, due to the large amount of H+ leakage, the cathodic hydrogen evolution reaction was severe, and the recovered sponge lead was randomly scattered in the catholyte. At the same time, it will cause certain loss to the ion exchange membrane, reduce its performance and shorten the service life.
Considering comprehensively, 0.5 mol/L was selected as the concentration of HNO3 in the anolyte in the process of single–membrane double–chamber electrolytic recovery of lead.

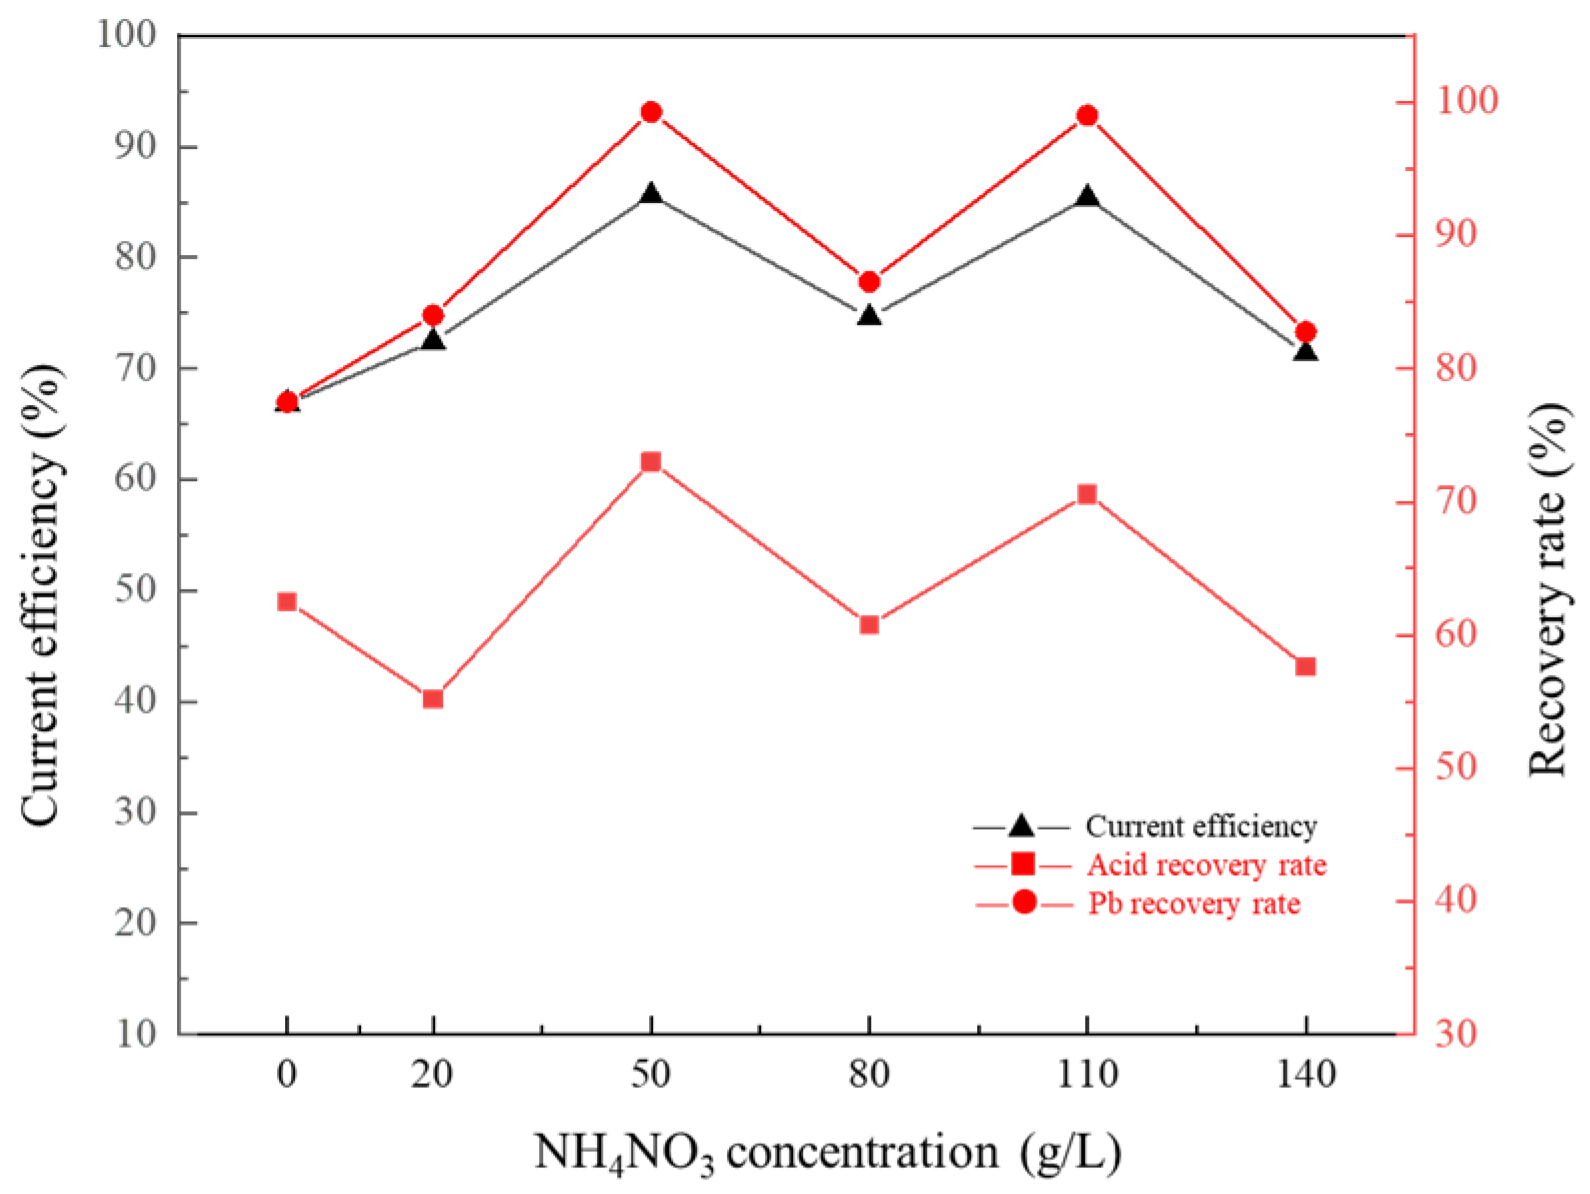
3.8. Effect of Concentration of NH4NO3 in Cathode Solution on Membrane Electrolysis

Since the conductivity of the Pb(NO3)2 electrolyte system is small, this will lead to an increase in voltage and power consumption, adding a certain concentration of NH4NO3 to it can reduce the resistance, increase the conductivity and reduce the voltage and power consumption. In this experiment, the catholyte Pb2+ concentration was controlled at 40 g/L, the current density was 30 mA/cm2, the electrolysis temperature was 60 °C, the electrode membrane spacing was 5 cm and the anolyte HNO3 concentration was 0.5 mol/L to explore the influence of ammonium nitrate concentration on the process.
It can be seen from Figure 19 and Figure 20 that when the concentration of NH4NO3 increased from 0 g/L to 50 g/L, the increase in current efficiency, acid recovery rate and lead recovery rate was more obvious. When the concentration of NH4NO3 exceeded 50 g/L, the current efficiency and recovery rate no longer increased. At the same time, the voltage and power consumption were significantly lower than those without NH4NO3.
When NH4NO3 is not added, the conductive ions of the electrolyte system are less, the resistance is large, and the conductivity is poor, and so, the current efficiency, recovery rate and voltage are all at a low level. However, when the concentration of NH4NO3 is increased appropriately, various parameters in the electrolysis process are optimized due to the introduction of more conductive ions. Moreover, the concentration of NO3 in the catholyte increases, more NO3 will pass through the anion exchange membrane and enter the anode chamber, thereby increasing the acid recovery rate. However, when the concentration of NH4NO3 is too high, the viscosity in the solution will be too high, which will block the membrane pores and reduce the mobility of free conductive ions. On the whole, the optimal concentration of NH4NO3 in the process was determined to be 50 g/L.

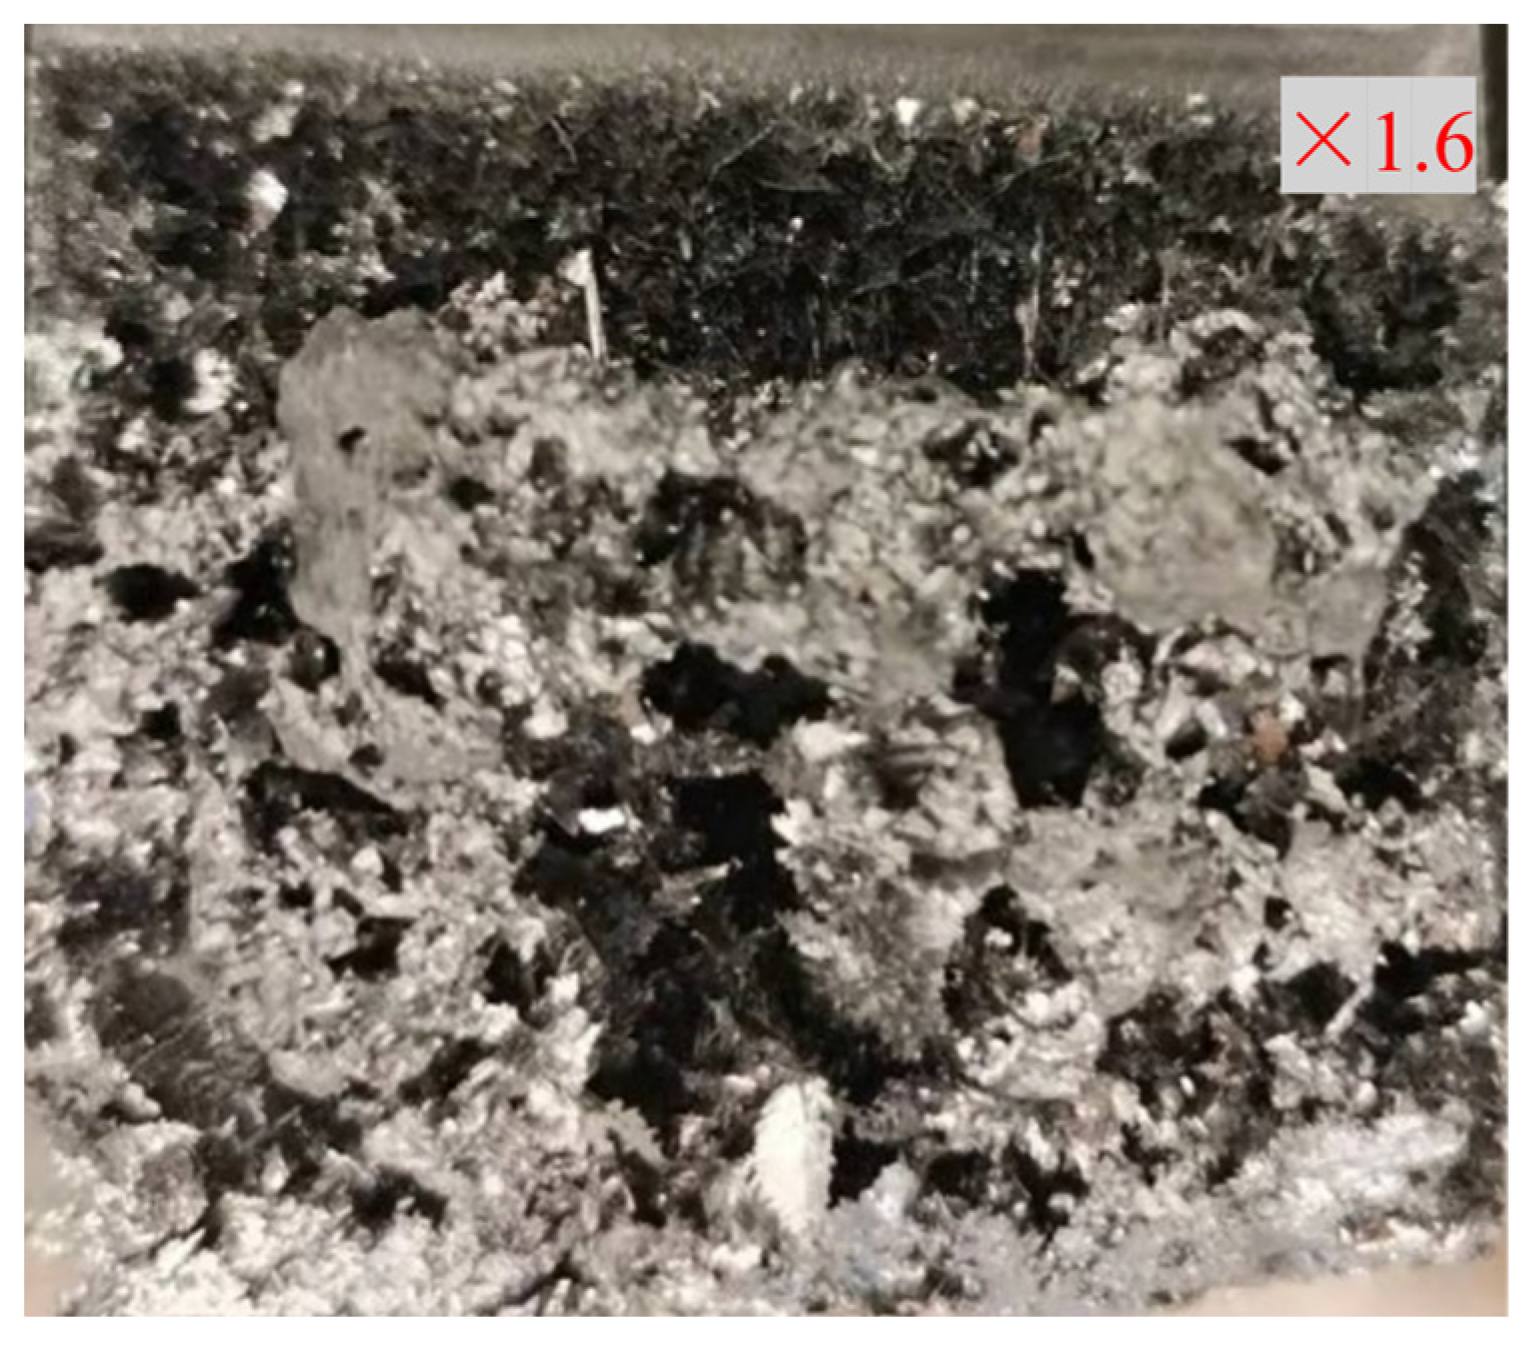
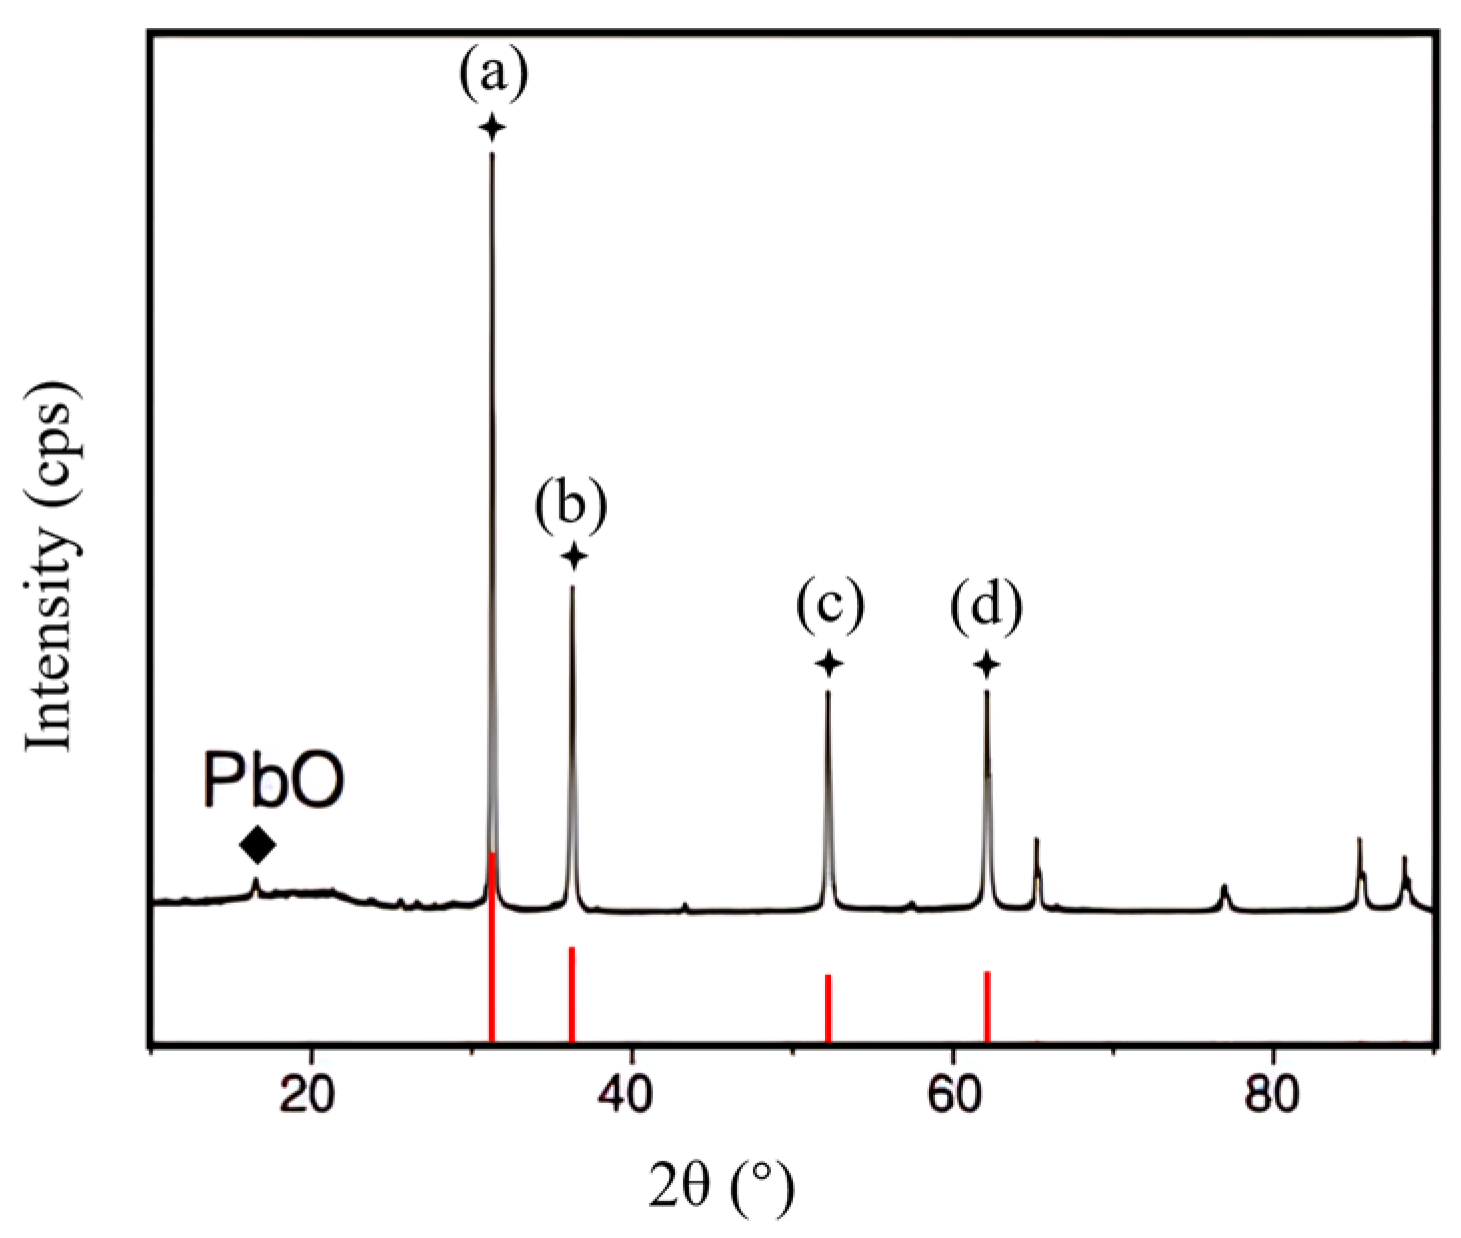
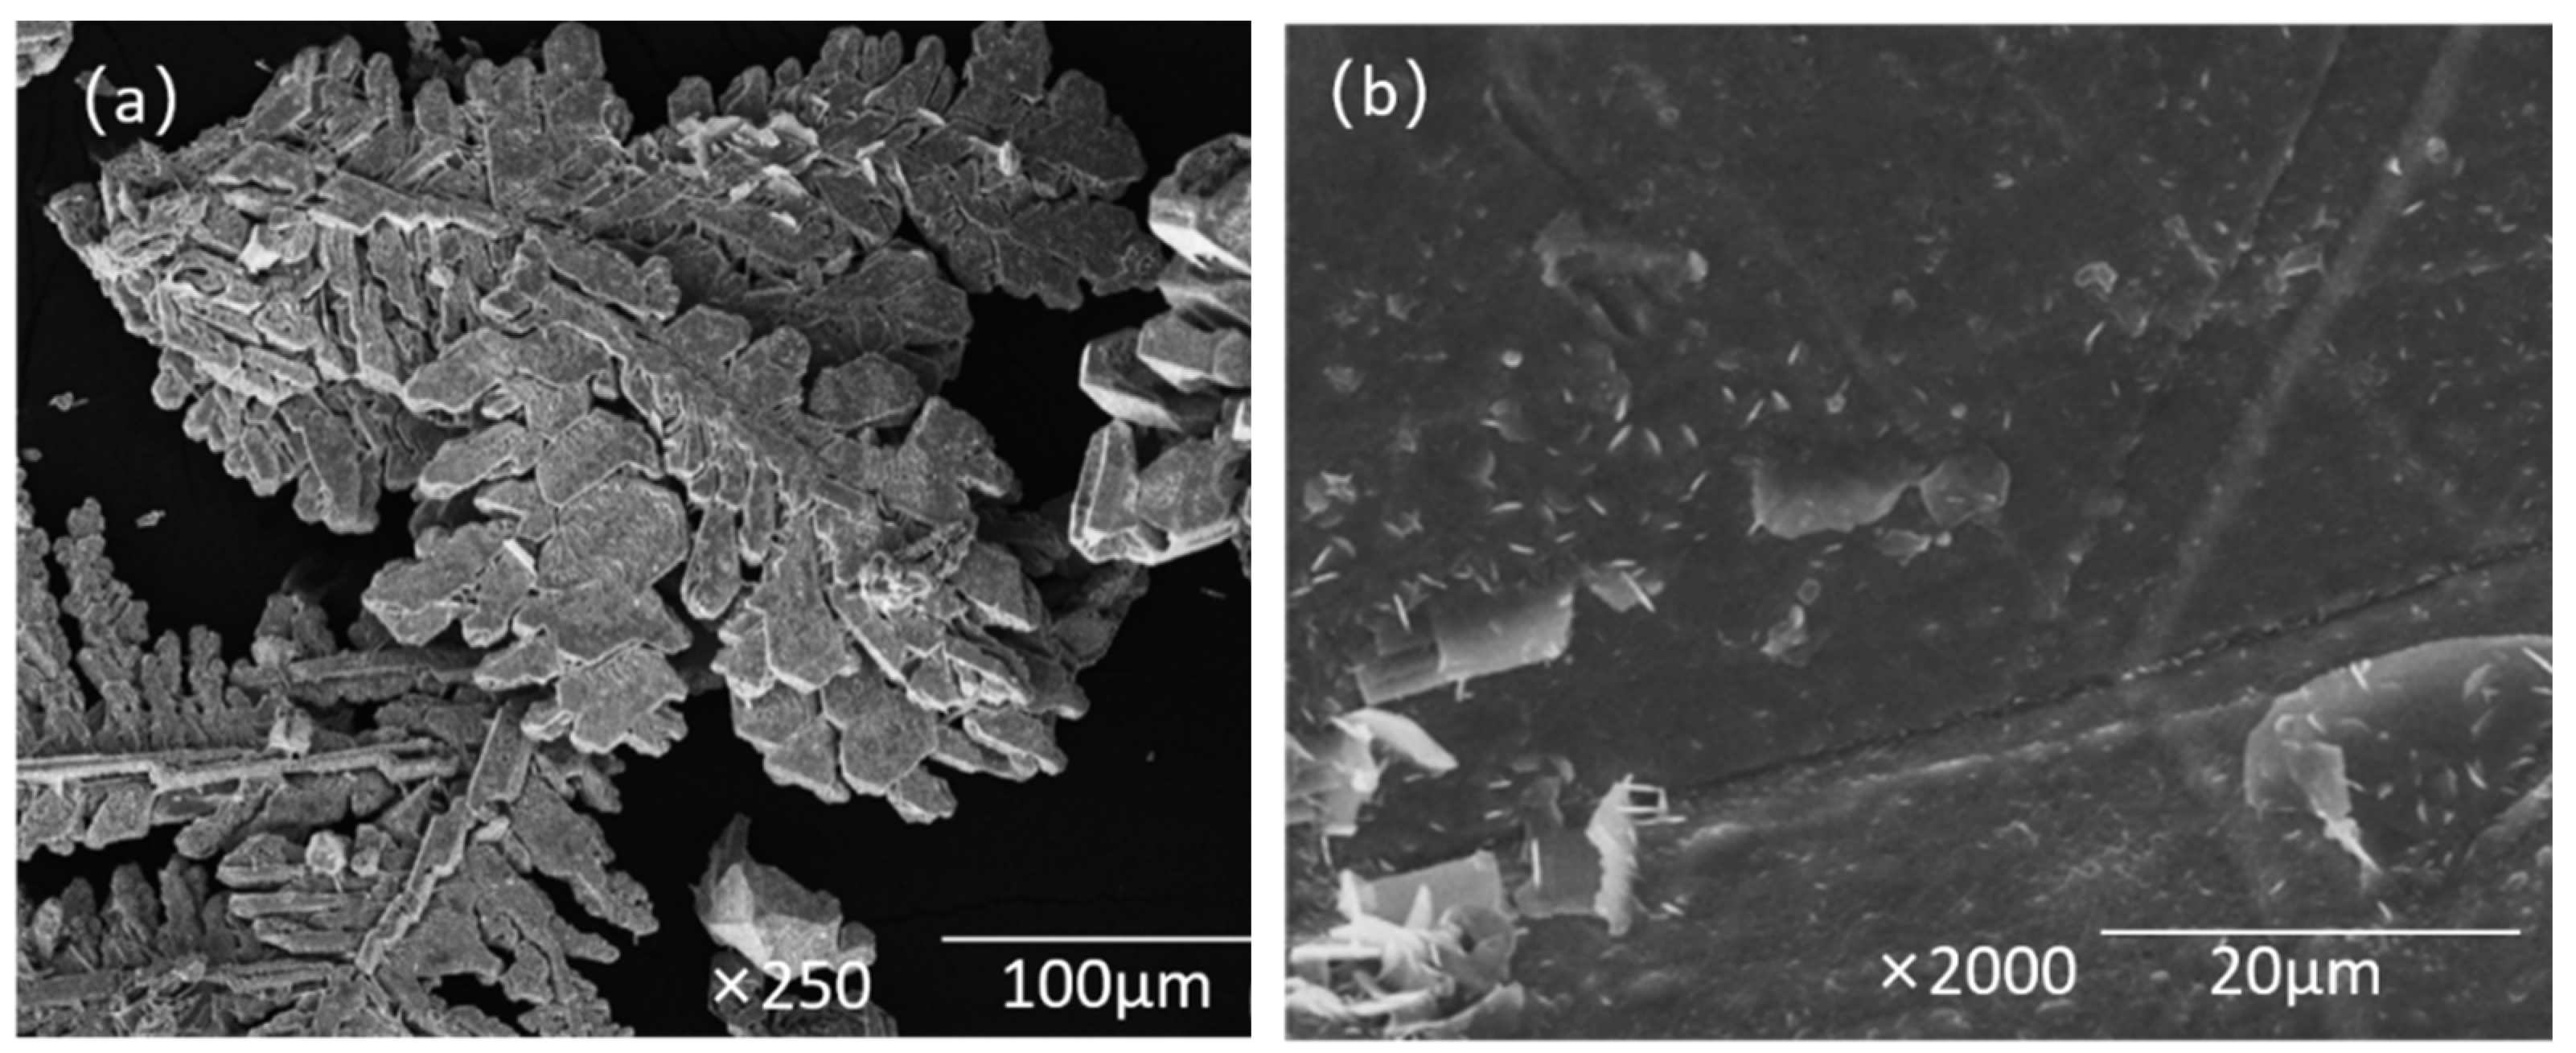
3.9. Characterization and Analysis

Through the above experiments, the optimal electrolysis conditions were determined. Several experiments were carried out under these conditions and the spongy lead recovered from the cathode was analyzed. The macroscopic photo of the sponge lead recovered on the cathode plate is shown in Figure 21. It can be seen that the lead attached to the cathode plate was relatively fluffy. Locally, the lead recovered by electrolysis was leaf–shaped, formed by irregular accumulation of layers, and the overall Silvery white metallic luster.
The XRD spectrum of the obtained sample is shown in Figure 22. Figure 23 is the microscopic morphology of metallic lead observed by scanning electron microscope (SEM), magnified 250 times and 1000 times, respectively. It can be seen from Figure 23a that this was consistent with the shape seen under the macroscopic morphology; from Figure 23b, the surface of metallic lead was smooth and flat, showing a dense crystal structure, and the surface only contained a small amount of dendritic lead grains.
It can be seen that the characteristic diffraction peaks of (111), (200), (220), and (311) crystal lines of the electrolytic product all conformed to the characteristic diffraction peaks of metal lead JCPDF#65–2873 card. Thus, the electrolysis product was pure lead. However, a small diffraction peak of PbO2 was also observed at 16.44°, which was caused by oxidation of a small amount of metallic lead after electrolysis in air.

4. Summary

In the process of lead recovery by single–membrane double–chamber membrane electrolysis, the experimental parameters were controlled by single factor method, and the anode material was selected as the titanium–coated ruthenium–iridium plate, the cathode as the pure lead plate, and TRJAM–10W as the anion exchange membrane. Considering the current efficiency, lead recovery rate, acid recovery rate, voltage and electric energy consumption, the optimal process parameters for membrane electrolysis lead recovery were determined as follows: The concentration of Pb2+ was 40 g/L, the current density was 30 mA/cm2, the reaction temperature was 60 °C, the pH value of the cathodic solution was 4.0, the concentration of HNO3 in the anodic solution was 0.5 mol/L, and the concentration of ammonium nitrate in the cathodic solution was 50 g/L. Under the optimal conditions, the current efficiency was 85.6%, the acid recovery was 73.03%, the lead recovery was 99.2%, the voltage was 3.8 V, and the power consumption was 1148.4 kW·h·t−1.
Through the SEM and XRD analysis of the lead recovered from the cathode under the optimum conditions, it was concluded that the lead recovered by electrolysis was foliar with silvery white metal luster and a smooth surface. The electrolytic product was pure lead, but a small amount of metal lead was oxidized.
After the three steps of acid leaching–enrichment–membrane electrolysis in electrolytic manganese lead–containing waste residue, it was calculated that 78.53% of Pb2+ in lead–containing waste residue was recovered in the form of lead element. At the same time, the HNO3 recovered in the anode chamber can also be used again in the acid leaching process. While solving the problem of environmental pollution caused by lead–containing waste residues, the recycling of resources was realized, which has good social and economic benefits. However, there is still ammonia nitrogen in the electrolyte that has not been removed, and so, it is necessary to further study how to treat it synchronously. In addition, the recovery of insoluble manganese from electrolytic manganese slag is also worth exploring [18], so as to realize harmless treatment and resource utilization in the real sense.

Author Contributions

X.S. contributed to the methodology of the study and helped perform the analysis with constructive discussions; J.F. contributed to the writing—original draft and Writing—review and editing; performed the experiment; J.Z. used software to analyze the data and contributed significantly to analysis and manuscript preparation. All authors have read and agreed to the published version of the manuscript.

Funding

This research received no external funding.

Data Availability Statement

Data was not available for this study due to privacy restrictions.

Conflicts of Interest

The authors declare no conflict of interest.

References

  1. Wei, H.; Yang, Y.; Luo, D.; Wu, X.; Lu, Q.; Huang, H. A Research on Comprehensive Recycling of Electrolytic Manganese Anode Slim. China Manganese Ind. 2017, 35, 55–58. (In Chinese) [Google Scholar]
  2. Camarillo, R.; Llanos, J.; García-Fernández, L.; Pérez, Á.; Canizares, P. Treatment of copper (II)-loaded aqueous nitrate solutions by polymer enhanced ultrafiltration and electrodeposition. Sep. Purif. Technol. 2010, 70, 320–328. [Google Scholar] [CrossRef]
  3. Li, T.; Xiao, K.; Yang, B.; Peng, G.; Liu, F.; Tao, L.; Chen, S.; Wei, H.; Yu, G.; Deng, S. Recovery of Ni (II) from real electroplating wastewater using fixed-bed resin adsorption and subsequent electrodeposition. Front. Environ. Sci. Eng. 2019, 13, 91. [Google Scholar] [CrossRef]
  4. Romero-Cano, L.A.; García-Rosero, H.; Baldenegro-Pérez, L.A.; Marín, F.C.; González-Gutiérrez, L.V. Coupled Adsorption and Electrochemical Process for Copper Recovery from Wastewater Using Grapefruit Peel. J. Environ. Eng. 2020, 146, 04020100. [Google Scholar] [CrossRef]
  5. Yang, Y.; Shu, J.; Zhang, L.; Su, P.; Meng, W.; Wan, Q.; Liu, Z.; Liu, R.; Chen, F.; Ming, X. Enhanced Leaching of Mn from Electrolytic Manganese Anode Slime via an Electric Field. Energy Fuels 2021, 35, 20224–20230. [Google Scholar] [CrossRef]
  6. Zhang, Y.; Wang, J.; Liu, B.; Huang, J.; Ye, J.; Li, Y.; Su, Z.; Wang, J. Extraction and Separation of Mn and Pb from Electrolytic Manganese Anodic Slime (EMAS) via SO2 Roasting Followed by Acid Leaching Process. JOM 2020, 72, 925–932. [Google Scholar] [CrossRef]
  7. Jiang, B. Study on Treatment and Recovery Technology of High Concentration Manganese Sulfate Waste Liquid with Double Membranes and Three Chambers; Lanzhou Jiaotong University: Lanzhou, China, 2019. (In Chinese) [Google Scholar]
  8. LI, T.; Wang, S.; Zhou, J. Experimental Study of Ion-exchange Membrane Electrolysis Nickel Sulfate Electrowinning of Nickel Metal System. Mater. Rep. 2016, 30, 432–435+439. (In Chinese) [Google Scholar]
  9. Guo, P. Relationship between hydrogen evolution reaction and overpotential and application of hydrogen over potential. Coal Chem. Ind. 2009, 32, 12–15. (In Chinese) [Google Scholar]
  10. Jia, Z.; Ma, H.; Wu, X.; Liao, S.; Wang, B. Fundamentals of electrochemistry (V)—Electrochemical kinetic and charge-transfer process for electrochemical reaction. Energy Storage Sci. Technol. 2013, 2, 402–409. (In Chinese) [Google Scholar]
  11. Jin, B.; Dreisinger, D.B. A green electrorefining process for production of pure lead from methanesulfonic acid medium. Sep. Purif. Technol. 2016, 170, 199–207. [Google Scholar] [CrossRef]
  12. Dai, F.; Huang, H.; Chen, B.; Zhang, P.; He, Y.; Guo, Z. Recovery of high purity lead from spent lead paste via direct electrolysis and process evaluation. Sep. Purif. Technol. 2019, 224, 237–246. [Google Scholar] [CrossRef]
  13. Xu, J. Preparation of Nanocrystalline Nickel by Electrodeposition and its Electrochemical Properties; Kunming University of Science and Technology: Kunming, China, 2007. (In Chinese) [Google Scholar]
  14. Tsurtsumia, G.; Shengelia, D.; Koiava, N.; Lezhava, T.; Gogoli, D.; Beriashvili, L.; Kakhniashvili, I. Novel hydro-electrometallurgical technology for simultaneous production of manganese metal, electrolytic manganese dioxide, and manganese sulfate monohydrate. Hydrometallurgy 2019, 186, 260–268. [Google Scholar] [CrossRef]
  15. Zhang, X.; Sun, Y.; Pan, J. A Clean and Highly Efficient Leaching–Electrodeposition Lead Recovery Route in HClO4 Solution. Int. J. Electrochem. Sci. 2017, 12, 6966–6979. [Google Scholar] [CrossRef]
  16. Zhang, H. Research on Production Recovery Process and Pilot Test from the Amberplex Metal Electrodeposition Technology; Lanzhou Jiaotong University: Lanzhou, China, 2015. (In Chinese) [Google Scholar]
  17. Wei, Q.; Ren, X.; Du, J.; Wei, S.; Hu, S. Study of the electrodeposition conditions of metallic manganese in an electrolytic membrane reactor. Miner. Eng. 2010, 23, 578–586. [Google Scholar] [CrossRef]
  18. Xiang, H.; Yang, Z.; Liu, S.; Li, X.; Yang, C.; Ke, Y.; Lin, Z. Natural Pyrite-assisted Mechanochemical Recovery of Insoluble Manganese from Electrolytic Manganese Residue: Kinetics and Mechanisms. ACS EST Eng. 2023. [Google Scholar] [CrossRef]
Figure 1. Diagram of experimental equipment for single–membrane double–chamber electrolytic cell. 1, DC power supply; 2, cathode plate; 3, anion exchange membrane; 4, anode plate; 5, cathode chamber; 6, anode chamber; 7, single–membrane double–chamber electrolytic cell.
Metals 13 01643 g001
Figure 2. Original drawing of lead–containing waste residue of Electrolytic Manganese.
Metals 13 01643 g002
Figure 3. XRD Spectrum of lead–containing waste residue from Electrolytic Manganese.
Metals 13 01643 g003
Figure 5. Changes of tank voltage with time during electrolysis of different anion exchange membranes.
Metals 13 01643 g005
Figure 6. Effect of Pb2+ concentration on current efficiency and recovery.
Metals 13 01643 g006
Figure 7. Effect of Pb2+ concentration on Voltage and Power consumption.
Metals 13 01643 g007
Figure 8. Macroscopic surface morphology of lead when Pb2+ concentration is 10 g/L, 40 g/L, 70 g/L.
Metals 13 01643 g008
Figure 9. Effect of current density on current efficiency, acid recovery rate and lead recovery rate.
Metals 13 01643 g009
Figure 10. Effect of current density on voltage and power consumption.
Metals 13 01643 g010
Figure 11. Effect of reaction temperature on current efficiency and recovery.
Metals 13 01643 g011
Figure 12. Effect of reaction temperature on Voltage and Power consumption.
Metals 13 01643 g012
Figure 13. Effect of initial pH on current efficiency and recovery.
Metals 13 01643 g013
Figure 14. Effect of initial pH of catholyte on voltage and power consumption.
Metals 13 01643 g014
Figure 15. Macroscopic surface morphology of lead at initial pH 1.
Metals 13 01643 g015
Figure 16. Effect of initial HNO3 concentration on current efficiency and recovery.
Metals 13 01643 g016
Figure 17. Effect of initial HNO3 concentration on voltage and power consumption.
Metals 13 01643 g017
Figure 18. The macroscopic surface morphology of lead when the initial HNO3 concentration of the anolyte is 1.1 mol/L.
Metals 13 01643 g018
Figure 19. Effect of NH4NO3 concentration on Current Efficiency and Recovery.
Metals 13 01643 g019
Figure 20. Effect of NH4NO3 concentration on Voltage and Power Consumption.
Metals 13 01643 g020
Figure 21. Macroscopic surface morphology lead recovered from cathode.
Metals 13 01643 g021
Figure 22. XRD spectrum of sponge lead sponge recovered from cathode.
Metals 13 01643 g022
Figure 23. SEM topography of sponge lead recovered from cathode (a) 250 times (b) 2000 times.
Metals 13 01643 g023
Table 1. Composition analysis of leaching solution under optimum conditions.
SubstanConcentration
Pb2+2456.76 mg/L
pH0.5
Ca2+12.3 mg/L
Mn2+5.63 mg/L
Al3+1.12 mg/L
Table 2. Performance index of anion exchange membrane for experiment.
MembraneTypeIon Exchange Capacity (mmol/g)Selective Transmittance (%)Membrane Resistance (Ω·cm2)Bursting Strength (Mpa)Thickness (mm)
HomogeneousTRJAM–10W2.0>9530.350.20~0.30
Semi–homogeneousLANRAN–AM2.1>925~60.600.38~0.42
HeterogeneousIonsep–HC2.2>90120.600.40~0.44
Table 3. Experimental results of membrane electrolysis.
Anode MaterialInitial Cell Voltage (V)Current Efficiency (%)Acid Recovery Rate (%)Power Consumption (kW·h·t−1)
Titanium plate15.5534.232.23844.9
Titanium–coated ruthenium iridium5.8363.350.62040.5
titanium–coated iridium–tantalum6.0059.945.52234.9
Disclaimer/Publisher’s Note: The statements, opinions and data contained in all publications are solely those of the individual author(s) and contributor(s) and not of MDPI and/or the editor(s). MDPI and/or the editor(s) disclaim responsibility for any injury to people or property resulting from any ideas, methods, instructions or products referred to in the content.

