Article

A New Approach for Increasing the Chelating Capacity of the Tartrate Ion in the Extraction of Copper from Ores

by
Félix J. Sueros Velarde
1,*,
Jhon A. Quispe Ortiz
1,
Angie A. Hidalgo Apaza
1 and
Angela F. Danil de Namor
2
1
Departamento de Ingeniería Química, Universidad Nacional de San Agustín (UNSA), Arequipa 04000, Peru
2
Laboratory of Thermochemistry, School of Chemistry & Chemical Engineering, University of Surrey, Guildford, Surrey GU2 7XH, UK
*
Author to whom correspondence should be addressed.
Metals 2023, 13(10), 1672; https://doi.org/10.3390/met13101672
Submission received: 14 August 2023 / Revised: 12 September 2023 / Accepted: 19 September 2023 / Published: 29 September 2023
(This article belongs to the Section Extractive Metallurgy)

Abstract

:
The role of the tartrate ion in the extraction of copper from oxidized ore in aqueous alkaline medium is first reported. This was demonstrated by a sequential evaluation of the following: (i) The formation of an ionic complex resulting from the interaction of copper salts (CuSO4, Cu(NO3)2) with an alkaline aqueous solution of tartrate ions. (ii) The treatment of metallic copper with hydrogen peroxide. (iii) Spectrophotometric and potentiometric studies of malaquite. These studies demonstrated that the Cu(II)–tartrate interaction is only possible due to the chelating activity of tartrate ion leading to the formation of the [Cu(OH)2C4H4O6]2− anion complex and the lixiviation of the oxidized mineral is controlled by the chelating agent. The advantage of this approach relative to previous ones is discussed. Final conclusions are given.

1. Introduction

Mining is an activity which contributes significantly to the economic growth of countries [1], particularly in those that are in the process of development. Chile and Peru produce 45% of the total copper traded worldwide, being the main global producers of copper internationally.
As far as Peru is concerned, extractive mining related to copper production has evolved due to the introduction of scientific and technological innovations in processes developed in the field of extractive metallurgy [2]. However, this country has had to face a series of challenges related to the optimum use of water, energy, basic sanitation services, and land deterioration, in addition to those related to the contamination of the ecosystem generated by the use of technological extraction processes [3,4].
From the geological point of view, copper is found in the Earth’s crust, forming part of mineralogical species such as sulfides, in the forms of chalcopyrite (CuFeS2), bornite (Cu5FeS4), chalcocite (Cu2S), and covellite (CuS), as well as oxides, such as cuprite (cuprous oxide, Cu2O), tenorite (cupric oxide, CuO), malachite (basic copper carbonate, CuCO3·Cu(OH)2), and azurite (Cu3(CO3)2(OH)2 [1].
Two different types of processes, pyrometallurgical and hydrometallurgical, are currently used for the extraction of copper from minerals. The former applies to sulfides in which the mineral is processed in a sequence of stages, involving a series of operations such as crushing, flotation, smelting-refining, and electrorefining [5]. Recently, flotation, which is considered to be the main process for copper ore, has received considerable attention as reflected in the papers published by Zhao and coworkers [6] and by Shen and coworkers [7]. The disadvantages of this process are the high energy consumption, the loss of metals, and the negative impact on the environment (the release of dust in suspension, toxic gases, and highly contaminated aqueous effluents) [8]. The latter process, applied to oxides extractive metallurgy, also requires a number of operations in order to extract and recover the valuable metal present in the mineral, including a leaching agent (conventionally sulfuric acid), the use of ion exchangers as extracting materials, in addition to the consumption of energy required for the reduction of copper ions to highly purified metallic copper.
Therefore, the objectives of this paper are as follows:
(i)
To report the results obtained by introducing a new leaching methodology which consists of replacing the use of an aqueous solution of sulfuric acid by an alkaline solution rich in tartrate ions as a chelating agent for the release of copper from the oxidized mineral, to identify the presence of the complex, and to assess its stability through spectrophotometry. The selection of tartrate as a complexing agent is based on its lack of toxicity given that it is a natural component which is currently used as an ingredient in the food industry. It is commercially available at a relatively low cost and it forms complexes with transition metal cations such as Cu(II) [9] as well as lanthanide cations [10]. In fact, the interaction of tartrate with Cu(II) has been extensively discussed in the literature [11]. In addition, it is water soluble.
(ii)
To verify the presence of the coordination compound when metallic copper is treated with a tartrate alkaline solution in the presence of hydrogen peroxide.
(iii)
To assess the impact of an alkaline aqueous solution of tartrate on the dissolution of malachite (basic cupric carbonate), as well as in the oxidized ore leaching process.

2. Materials and Methods

2.1. Materials

The materials used in the present investigation were oxidized copper ore, metallic copper, and analytical grade chemical reagents.
The oxidized copper ore used in the experimental tests belongs to the mining deposit located in the district of Polobaya, 60 km from the city of Arequipa—southern region of Peru; it is housed in sedimentary rocks, in a high-grade mantle, with an average copper content of more than 10%. The ore sample was previously prepared by reducing its size to a particle size of <45 µm (Tyler −325 mesh), before being used in the experimental tests.
The metallic copper used in the investigation was in the form of a thin sheet of 0.01 mm thickness, with a purity of 99.8%, commercialized by Thermo Scientific Chemicals, Santiago, Chile.
The chemical reagents used were sodium and potassium tartrate C4H4KNaO6.4H2O (SOLUTEST—Lab Chem, Zelienople, PA, USA), sodium hydroxide, NaOH (Riedel-de Haën, Hannover, Germany, 98% purity, ), potassium chloride, KCl (J.T. Baker, Phillipsburg, NJ, USA, 100.3% purity), ethylenediaminetetraacetic acid disodium salt dihydrate, C10H14O8Na2N2.2H2O, Daryaganj, New Delhi, India, (CDH, 99.5% purity), H2O2 medicinal 3% w/w, copper sulfate, CuSO4.5H2O, Xalostoc, Estado de Mexico, Mexico, (J.T. Beaker, >98% purity), copper nitrate, Cu(NO3)2, Phillipsburg, NJ, USA, (J.T. Beaker, >98% purity), basic cupric carbonate (malachite), CuCO3.Cu(OH)2, Phillipsburg, NJ, USA, (J.T. Baker), metallic copper in sheets, and oxidized copper ore (head grade of 10.02%).
For the reduction in mineral size and classification, a jaw crusher, ball mill, disc sprayer, vibrating shaver, and electric sieve (Retsch—AS200Tap, Haan North—Westphalia, Germany), equipped with a set of standard sieves ASTM E1, were used.
A scanning spectrophotometer, SPECTRO VIS PLUS—VERNIER, Beaverton, OR, USA was used (equipped with Vernier Spectral Analysis software, available online: https://www.vernier.com/product/spectral-analysis/, accessed on 12 August 2023) while, for selecting the working wavelength, a fixed wave spectrophotometer, Spectronic 20D+ brand (Thermo Fisher Scientific Inc., Madison, WI, USA), was used. The spectra were taken using quartz cells of 1.0 cm optical path length and measured between 400 and 900 nm, for both cases. Potentiometric measurements were carried out with a digital pH meter, JENCO, model 1671, Shanghai, China, with a combined Ag/AgCl glass electrode (OAKTON—pH 700, Mumbai, India).
For the homogenization of reaction mixtures and monitoring leaching tests, a Cole Parmer digital mixer, Thermo Scientific ICE, Vernon Hills, IL, USA, a magnetic stirrer brand IKA—COMBIMAG-RCH, Burladingen, Germany, and a GENIE—WINN, Tolbert, The Netherlands, vortex were used.
For the chemical characterization of the oxidized copper mineral and the solid residue resulting from the leaching process, a Thermo Scientific Model Scios 2, Breda, The Netherlands, scanning electron microscope was used; likewise, for the analysis of the leaching solutions, an atomic absorption spectrophotometer (Thermo Scientific ICE 3300, Bremen, Germany) was used.

2.2. Methodology

The methodology used in this research comprises three stages: the first one is associated with the chemical characterization of copper oxidized ore, the second with the interaction tests between the alkaline solution of tartrate ions and copper in its different forms (solution, metal, ore), and the third one deals with the determination of the copper content in the leaching solutions and in the solid residue resulting from the leaching process.

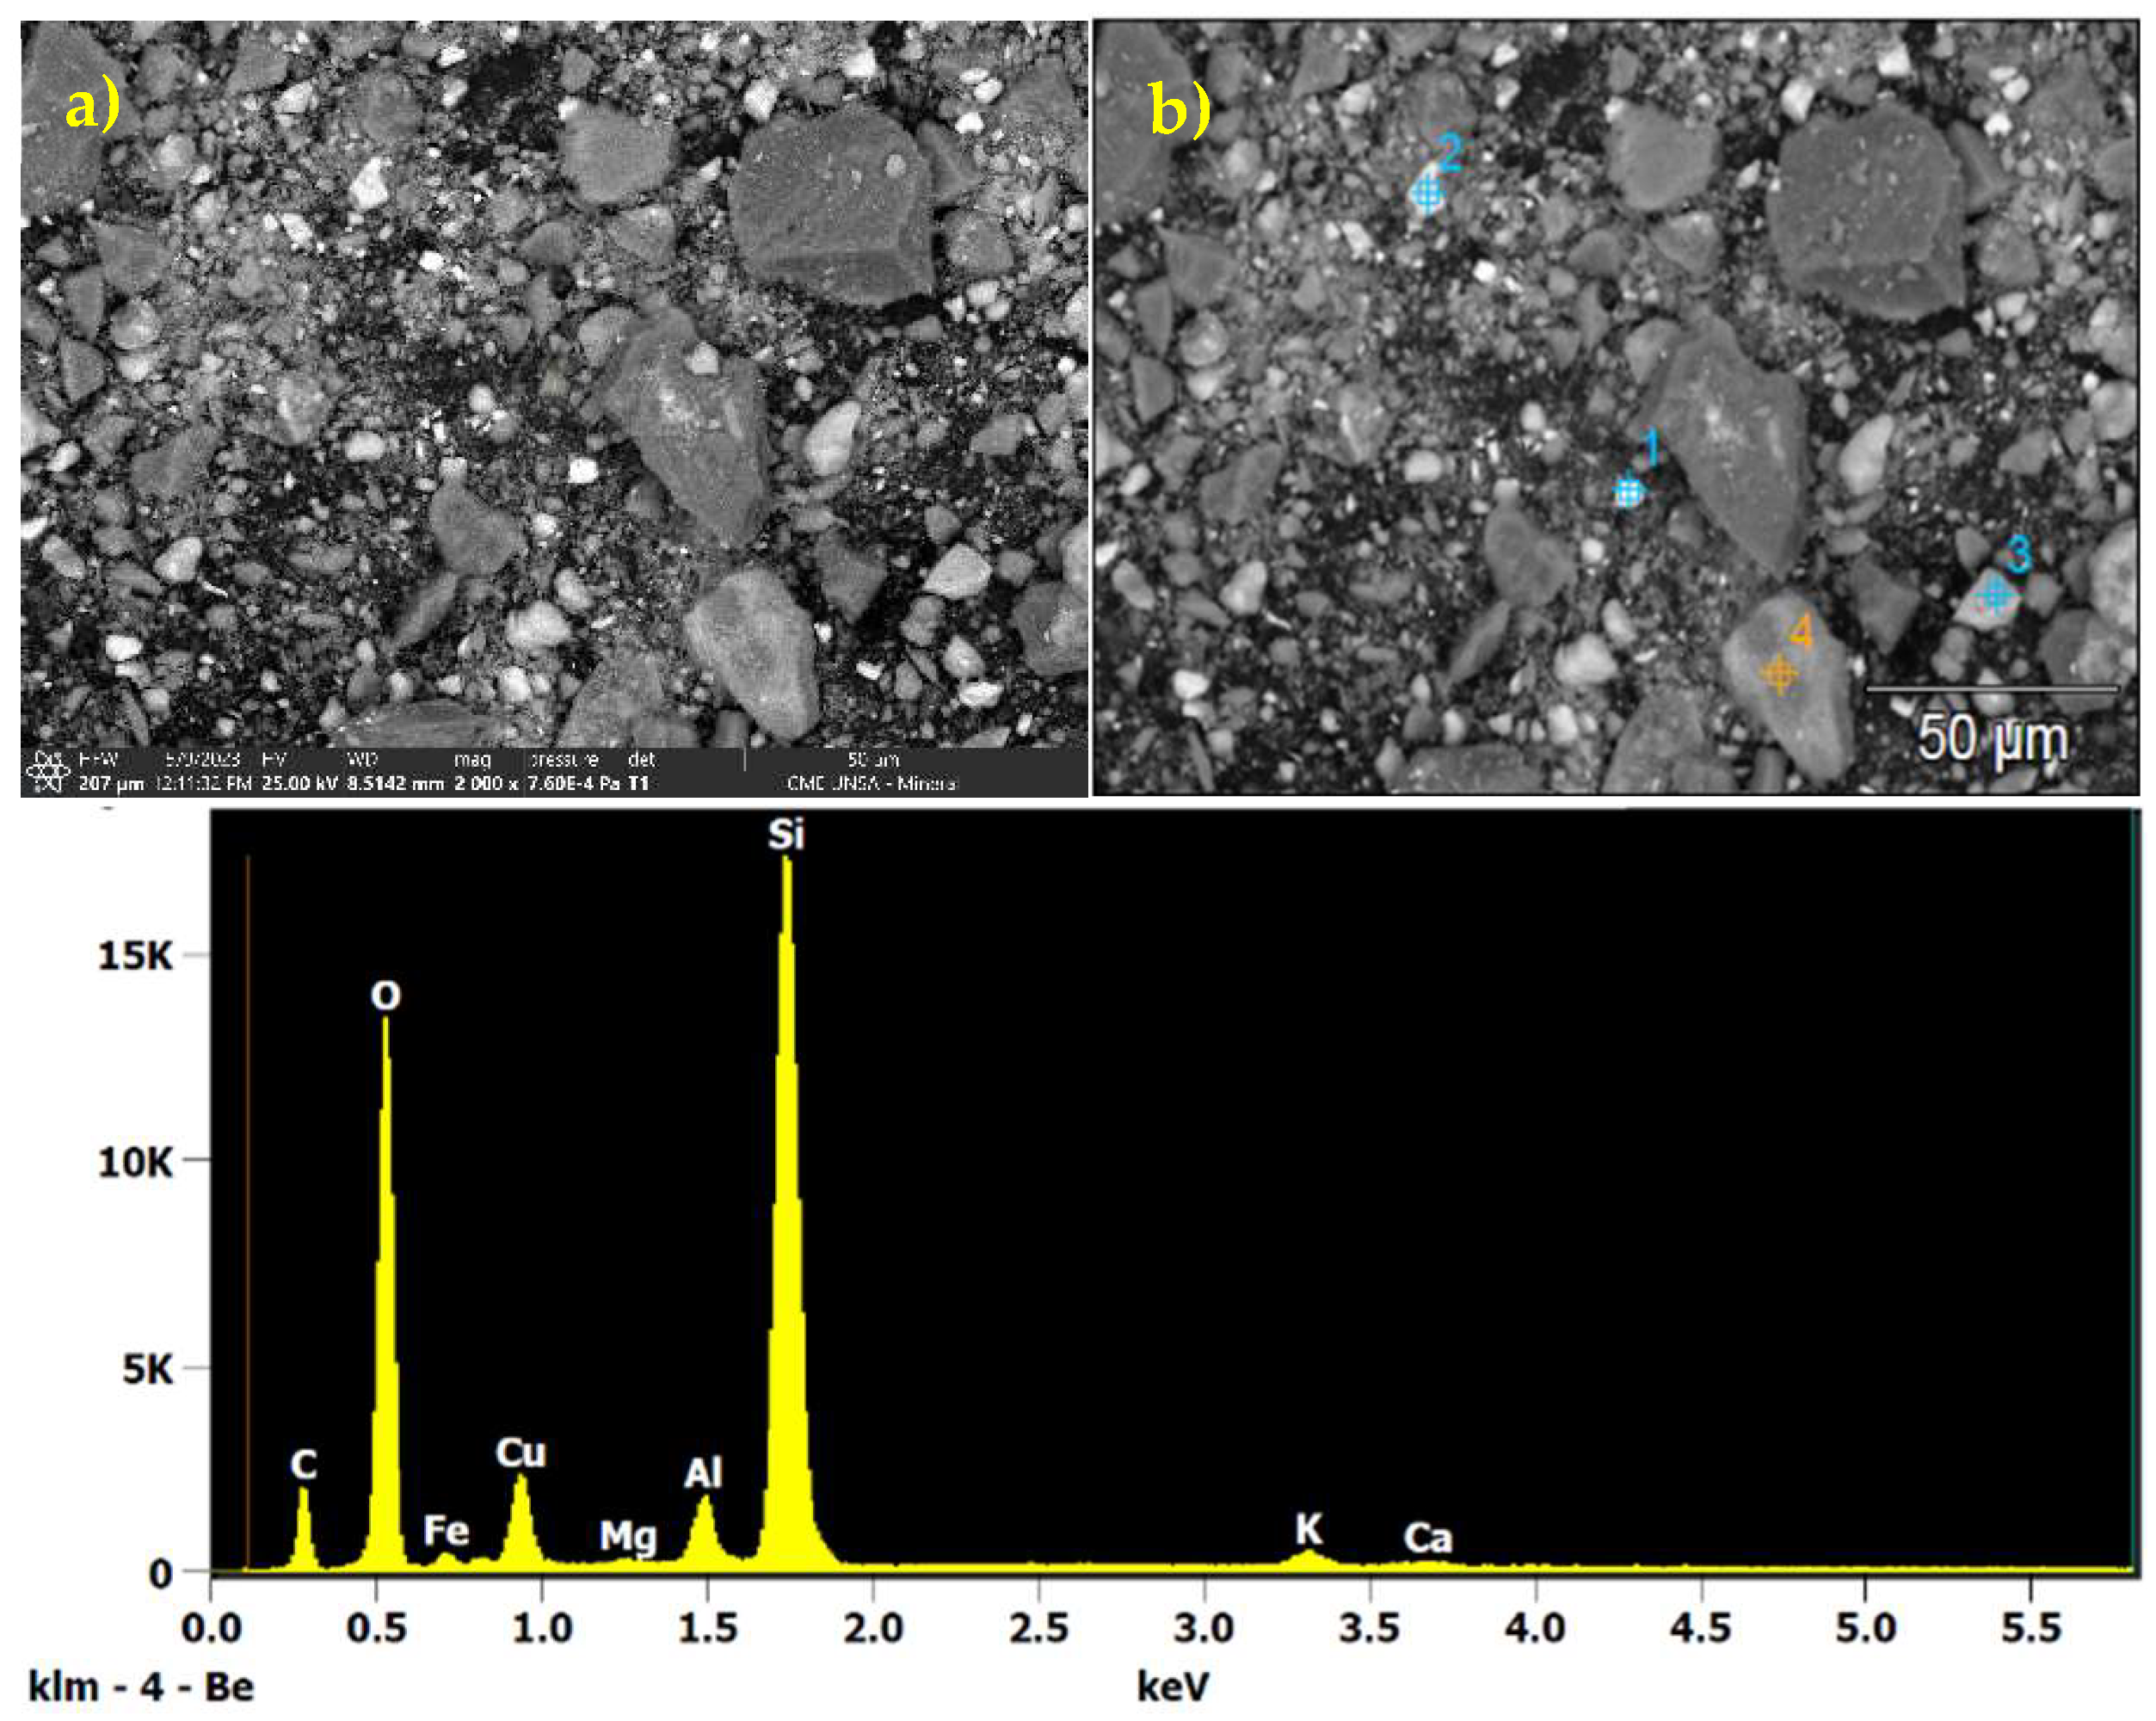
2.2.1. Chemical Characterization of the Processed Mineral

The determination of the atomic and topological composition of the collected mineral and the solid residue resulting from the leaching process was carried out using the analytical techniques of scanning electron microscopy and energy dispersive X-ray spectroscopy (SEM-EDX).
Experimental tests on interactions between the alkaline solution of tartrate ions with copper in its different forms (solution, metal, mineral) were studied by means of spectrophotometric and potentiometric analysis, to demonstrate that the oxidized copper mineral is leached by the complexing action of tartrate ions over copper ions; while the copper content present in the leachate solution resulting from the leaching process was analyzed using atomic absorption spectroscopy.

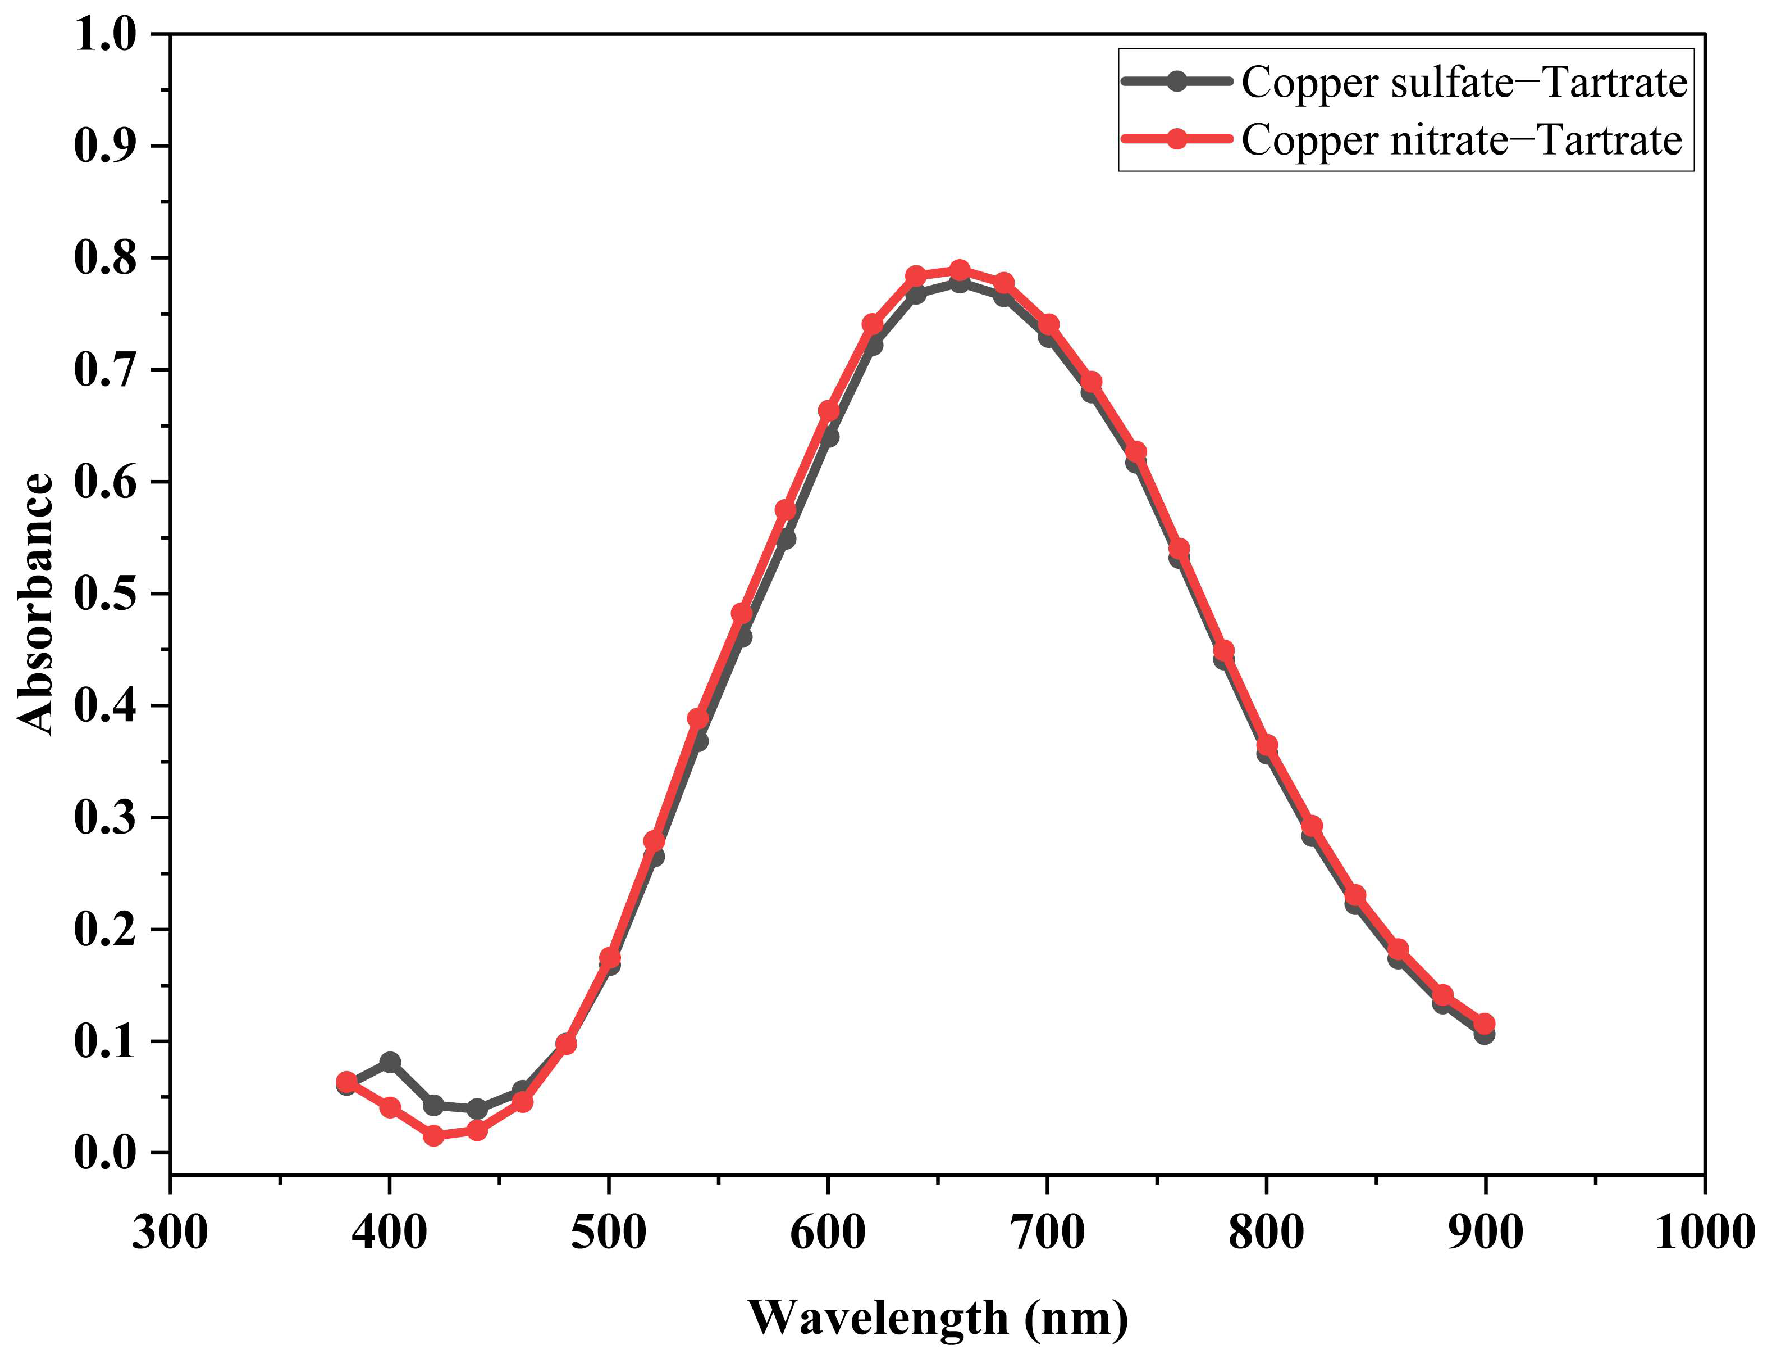
2.2.2. Identification of Complex Formation through Spectrophotometric Examination

To identify the compound formed between copper ions and tartrate ions in an alkaline medium, CuSO4.5H2O (15 cm3, 0.05 mol dm−3 standardized with EDTA solution 0.01 mol dm−3), sodium, and potassium tartrate solution (15 cm3, 0.1 mol dm−3) in NaOH (3.5 mol dm−3) were mixed by using a vortex (GENIE-WINN). The resulting solution was analyzed spectrophotometrically in the visible region. The spectra were measured using as reference a KCl solution (0.1 mol dm−3). The same process was repeated with a Cu(NO3)2 solution.

2.2.3. Stoichiometry of the Coordination Compound

The composition of the coordination compound was determined using the Job’s method and the continuous variations method, applying the UV-visible spectrophotometric technique recommended by Da Silva Júnior [12,13]. For this, solutions of sodium and potassium tartrate (0.05 mol dm−3) prepared in NaOH (3.5 mol dm−3) and Cu(NO3)2 (0.05 mol dm−3) were used. The procedure followed consisted of preparing 10 solutions of 20 cm3 each, mixing 2, 4, 6,…, 18 cm3 of tartrate, with 18, 16, 14,…, 2 cm3 of copper ions, respectively. These mixtures of solution were homogenized in a vortex for a period of 1.0 min, left for 2 h, and then centrifuged at 2500 rpm for 15 min. Solids produced by an excess of alkali, were separated from the supernatant solution by decantation.

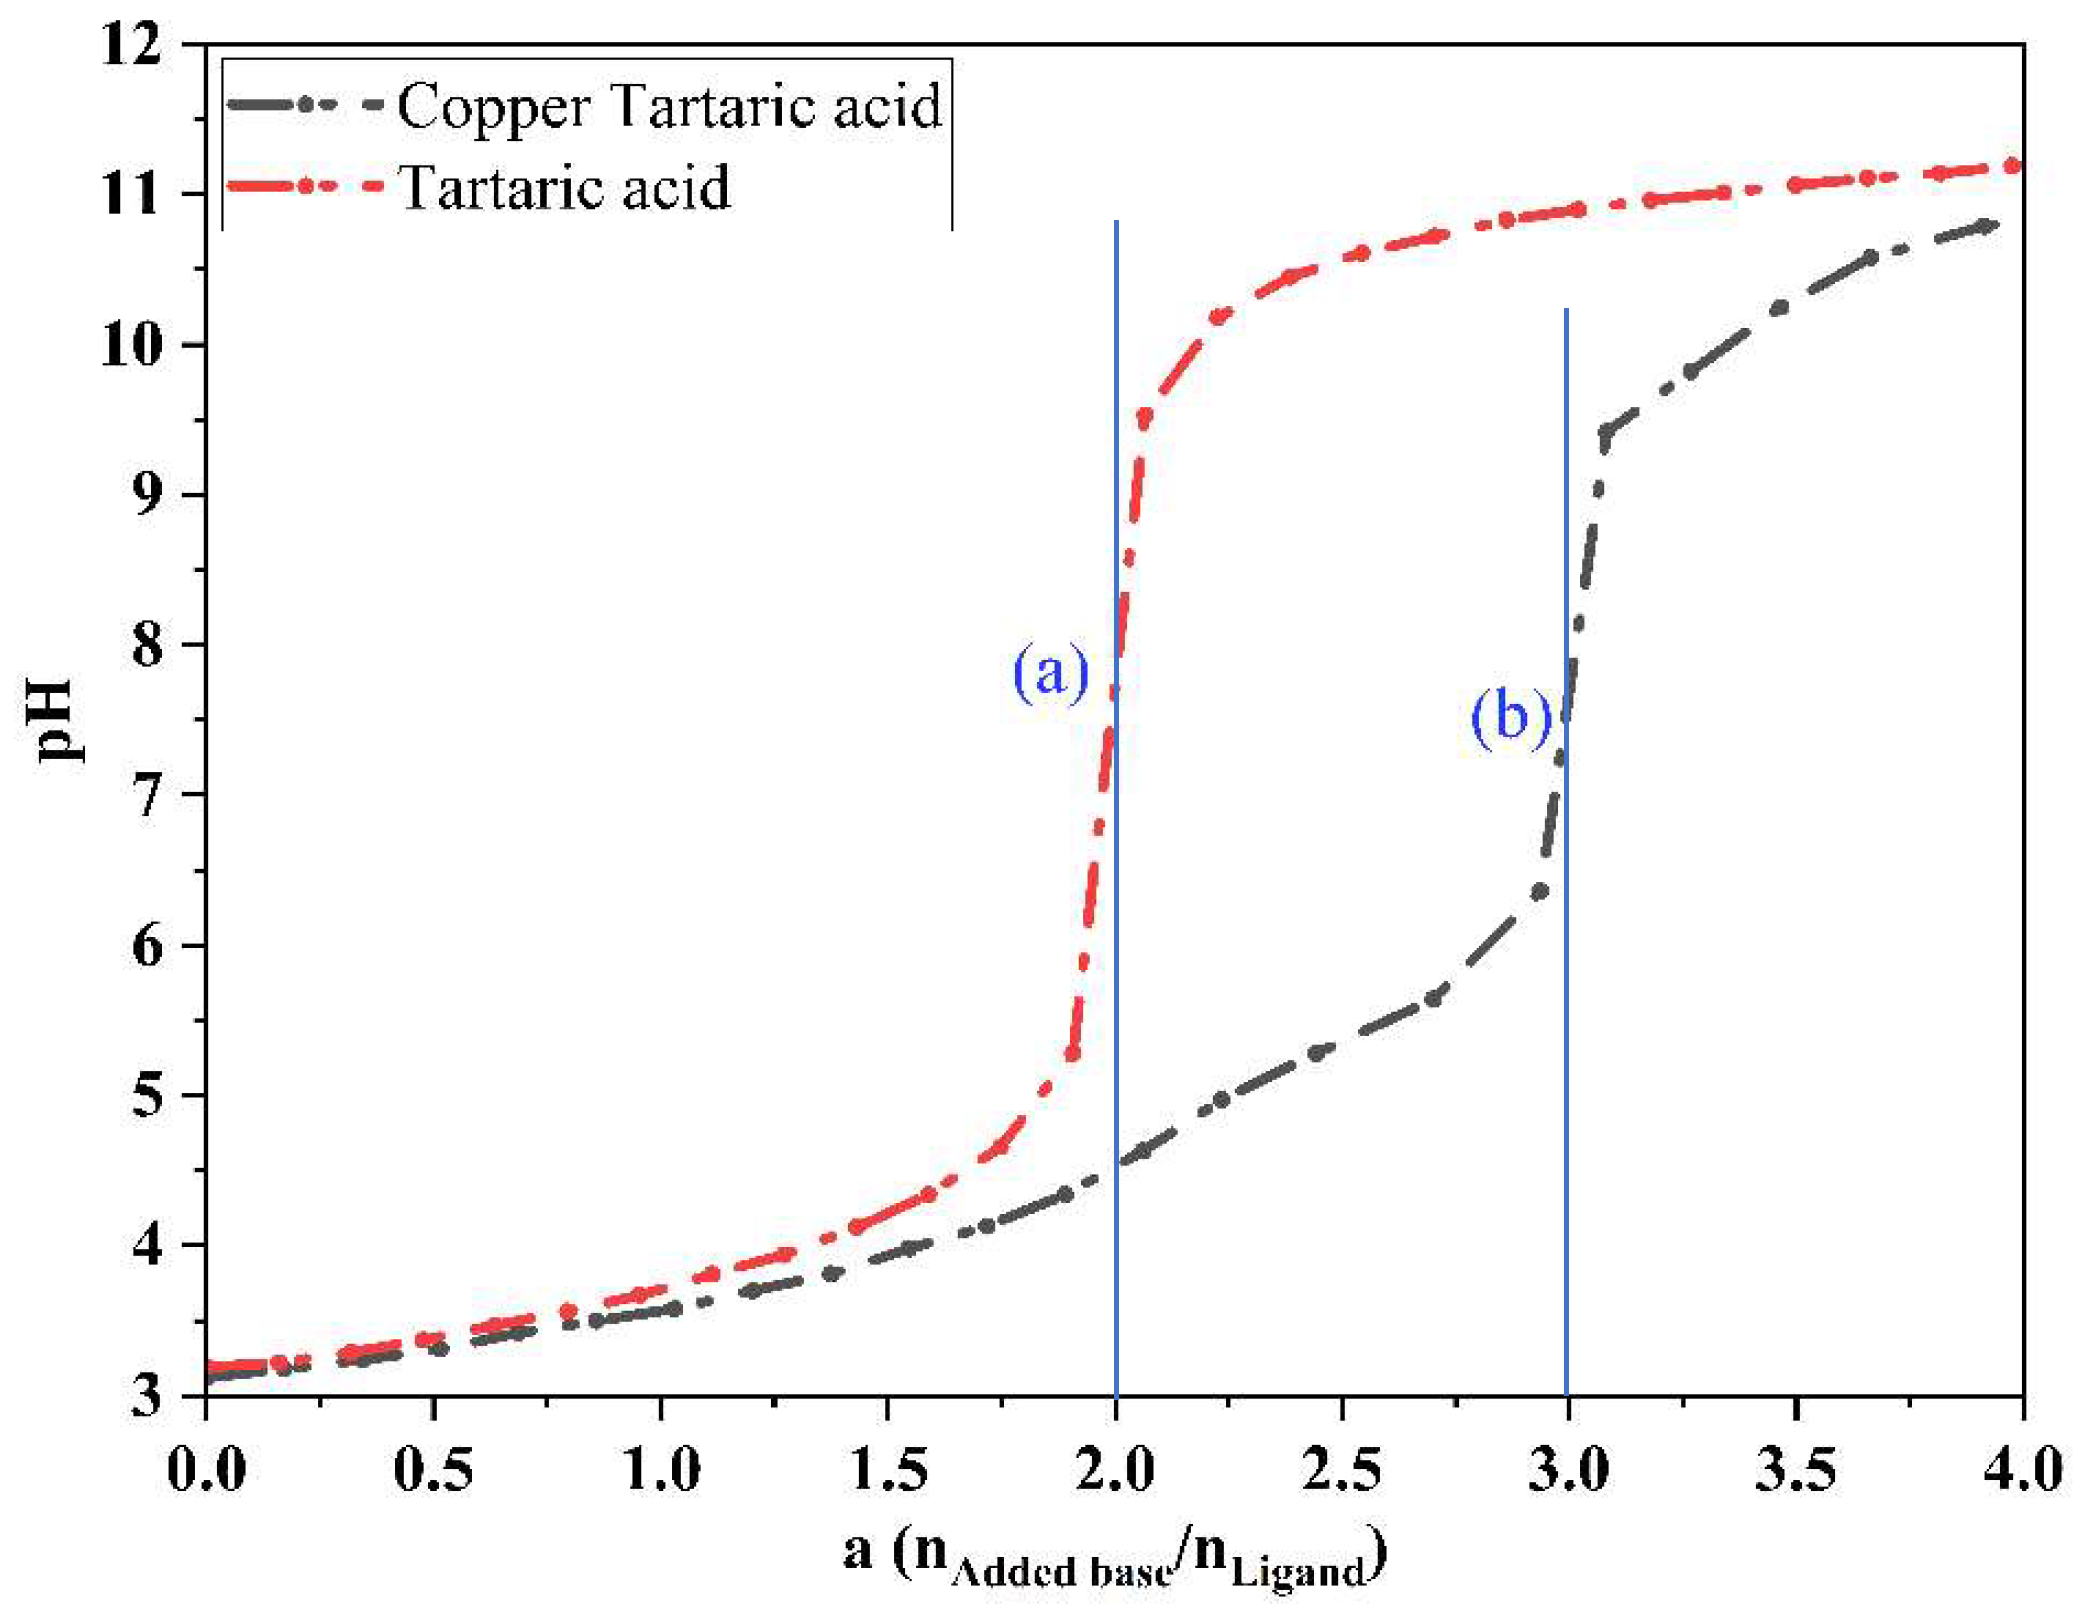
2.2.4. Potentiometric Measurements of Free Tartaric Acid in the Absence and Presence of Copper Ions at 298.15 K

Potentiometric titrations were performed at 298.15 K in a vessel with a water jacket, equipped with magnetic bar and over a magnetic stirrer. The pH Meter was previously standardized according to its operation manual and the electrode calibrated with a standard buffer solution (pH 4.01, 7.01 and 10.01—HI54710-11). The procedure used is that recommended by James and Prichard [14]. In the absence of copper, a solution of tartaric acid (100 cm3, 8.0 × 10⁻⁴ mol dm−3) in a potassium chloride solution (0.1 mol dm−3) was titrated with NaOH (9.2 × 10⁻² mol dm−3). The NaOH solution was added, under stirring, from a microburette (HANNA), pH readings were recorded after 3 min following each addition. Then, the same procedure was replicated in the presence of copper nitrate (2 cm3, 2.5 × 10⁻² mol dm−3).

2.2.5. Verification of Oxidation and Complexation of Metallic Copper in the Presence of Tartrate and Hydrogen Peroxide in an Alkaline Medium

For the verification of the compound formed from the oxidation of metallic copper by the action of hydrogen peroxide in the presence of tartrate in an alkaline medium, a copper metal sheet (1 cm wide by 5 cm long and 0.01 cm thick) was immersed in a solution containing H2O2, (5 cm3, 0.88 mol dm−3) and a solution of sodium and potassium tartrate (25 cm3, 0.16 mol dm−3) in NaOH (3.5 mol dm−3). The reaction mixture was stirred for 30 min at room temperature, after which the remaining sheet metal was removed and the resulting blue solution was filtered by gravity. The copper content present in the filtered solution was quantified by complexometric titration, using an EDTA solution (0.01 mol dm−3), an indicator solution of Fast Sulphon Black 3%, and a buffer solution (NH4OH/NH4Cl) of pH 10. Another aliquot of the same solution was subjected to spectrophotometric examination in the range of 400 to 900 nm.

2.2.6. Dissolution of Basic Cupric Carbonate (Malachite) by an Alkaline Aqueous Solution of Tartrate

Malachite (0.11 g) was stirred with a solution containing sodium and potassium tartrate (50 cm3, 0.07 mol dm−3) in sodium hydroxide (3.5 mol dm−3) for 10 min. An aliquot of the resulting solution was analyzed spectrophotometrically in the 400 to 900 nm wavelength range. Another aliquot of the same solution was used to quantify the copper content volumetrically, using an EDTA solution (0.01 mol dm−3), a Fast Sulphon Black solution at 3% as an indicator, and a buffer solution pH 10.

2.2.7. Evaluation of the Removal Capacity of Tartrate for Copper

The efficacy of the tartrate ion in the leaching process was evaluated, varying its concentration in the aqueous medium at a rate of change of 20 g/L from 80 to 140 g/L, keeping the alkalinity of the medium constant, at a concentration of 3.5 mol dm−3 of NaOH.
A test of the typical leaching process was carried out in a 250 cm3 beaker (reactor), fitted with a vertical shaker with a paddle impeller 3.0 cm long and 1.15 cm high and with an inclination of 45°. The reactor was loaded with the oxidized mineral (10 g, particle size 45 μm-Tyler mesh 325, leachate solution 100 cm3), containing tartrate (0.425 mol dm−3, 80 g/L) in NaOH (3.5 mol dm−3). The reaction mixture was stirred at 600 rpm for a period of 18 h, then centrifuged at 2500 rpm for 15 min, decanted, and filtered at reduced pressure. Three aliquots of 10 mL of filtered solution were submitted to the complexometric examination using an EDTA solution (0.01 mol dm−3), Fast Sulphon Black F indicator at 3%, and buffer pH 10 solution for the quantification of copper ions. Another three aliquots were reserved for analysis by atomic absorption spectroscopy, as well as samples of solid remaining from the leaching tests to be subjected to SEM/EDX analysis.

3. Results and Discussion

3.1. Chemical Characterization of the Processed Mineral

The results of the SEM/EDX analysis carried out on the oxidized copper ore, before and after being used in the leaching process, are shown in Table 1 and Table 2 and also in Figure 1 and Figure 2. They indicate that copper is present in the mineral before being lixiviated in a percentage of 10.72%, accompanied by iron in a percentage of 6.31%, while, in the solid leaching residue, the copper content was 1.79% and the iron content was 1.97%.
These results confirm that copper has been released from the ore during the leaching process.

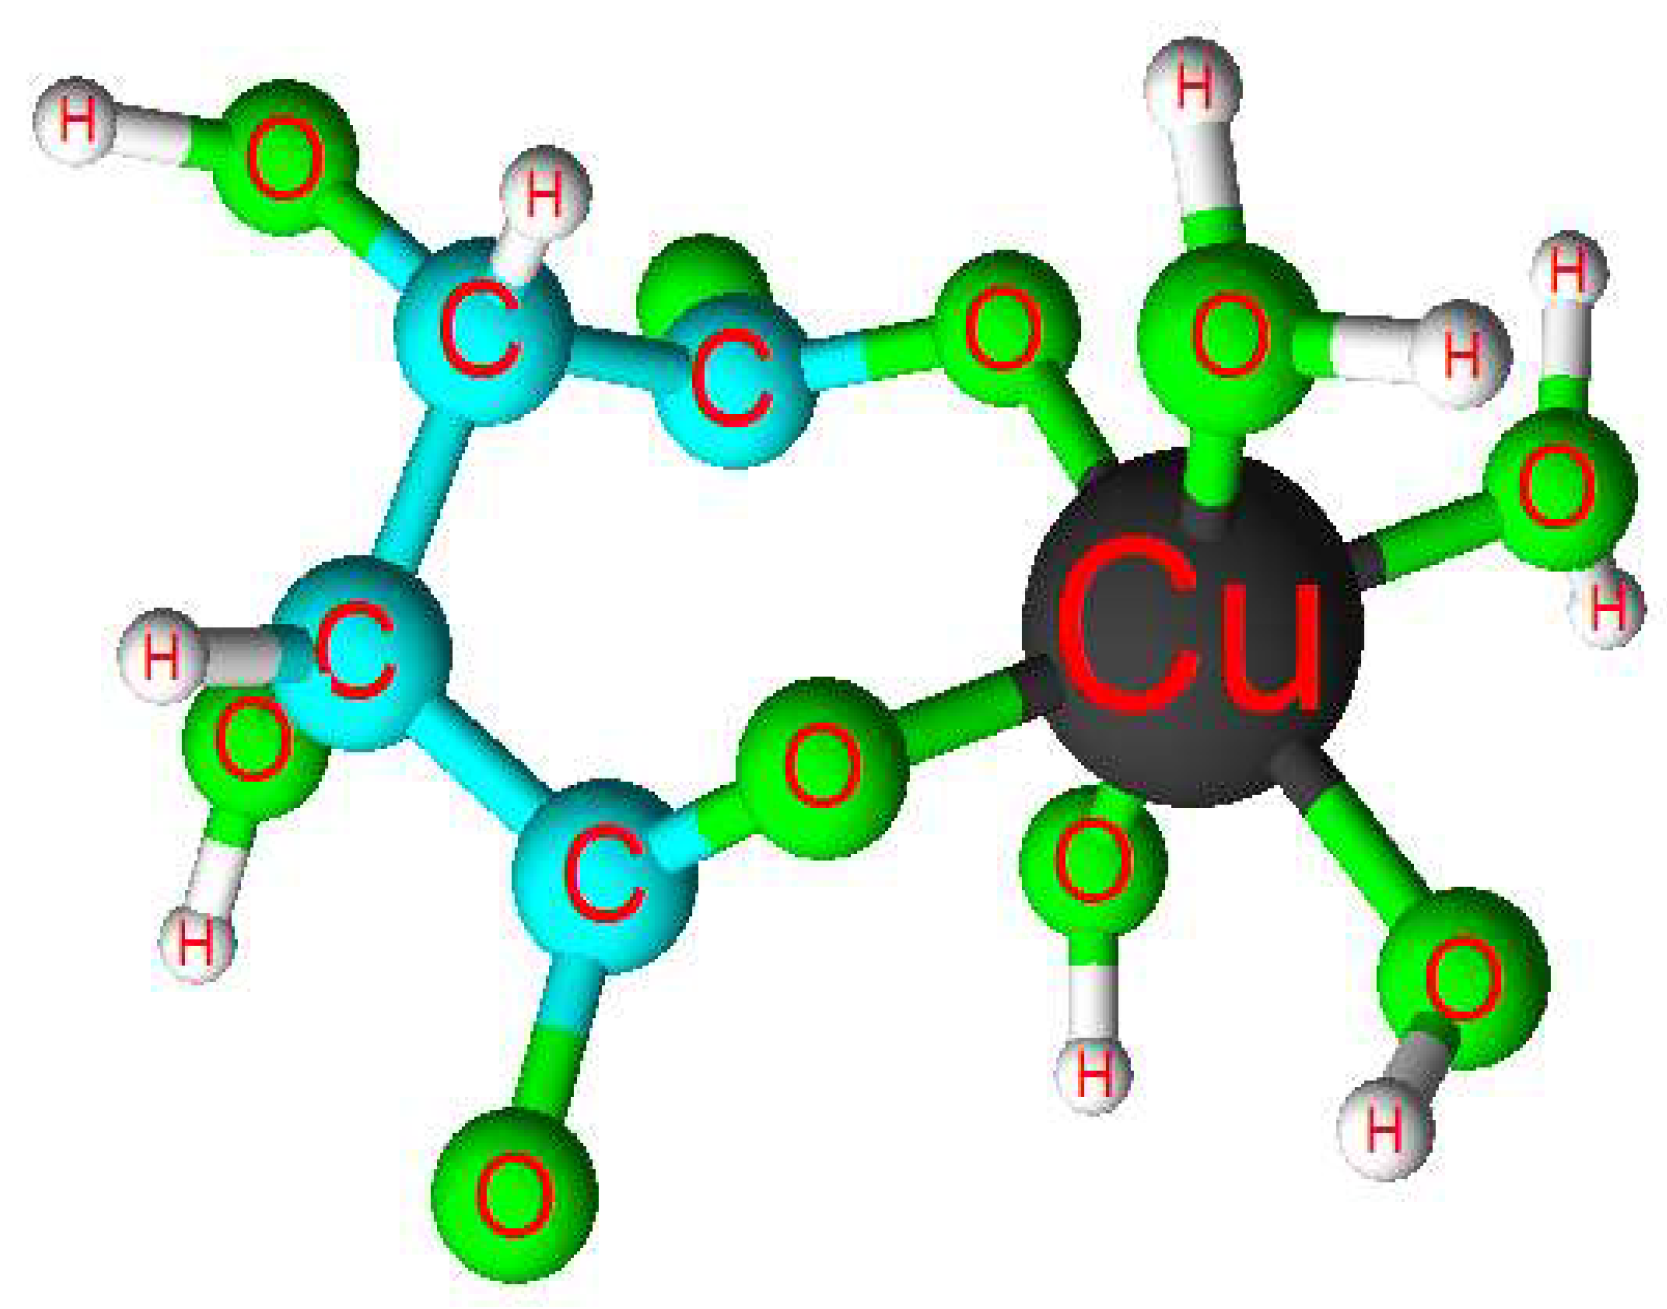
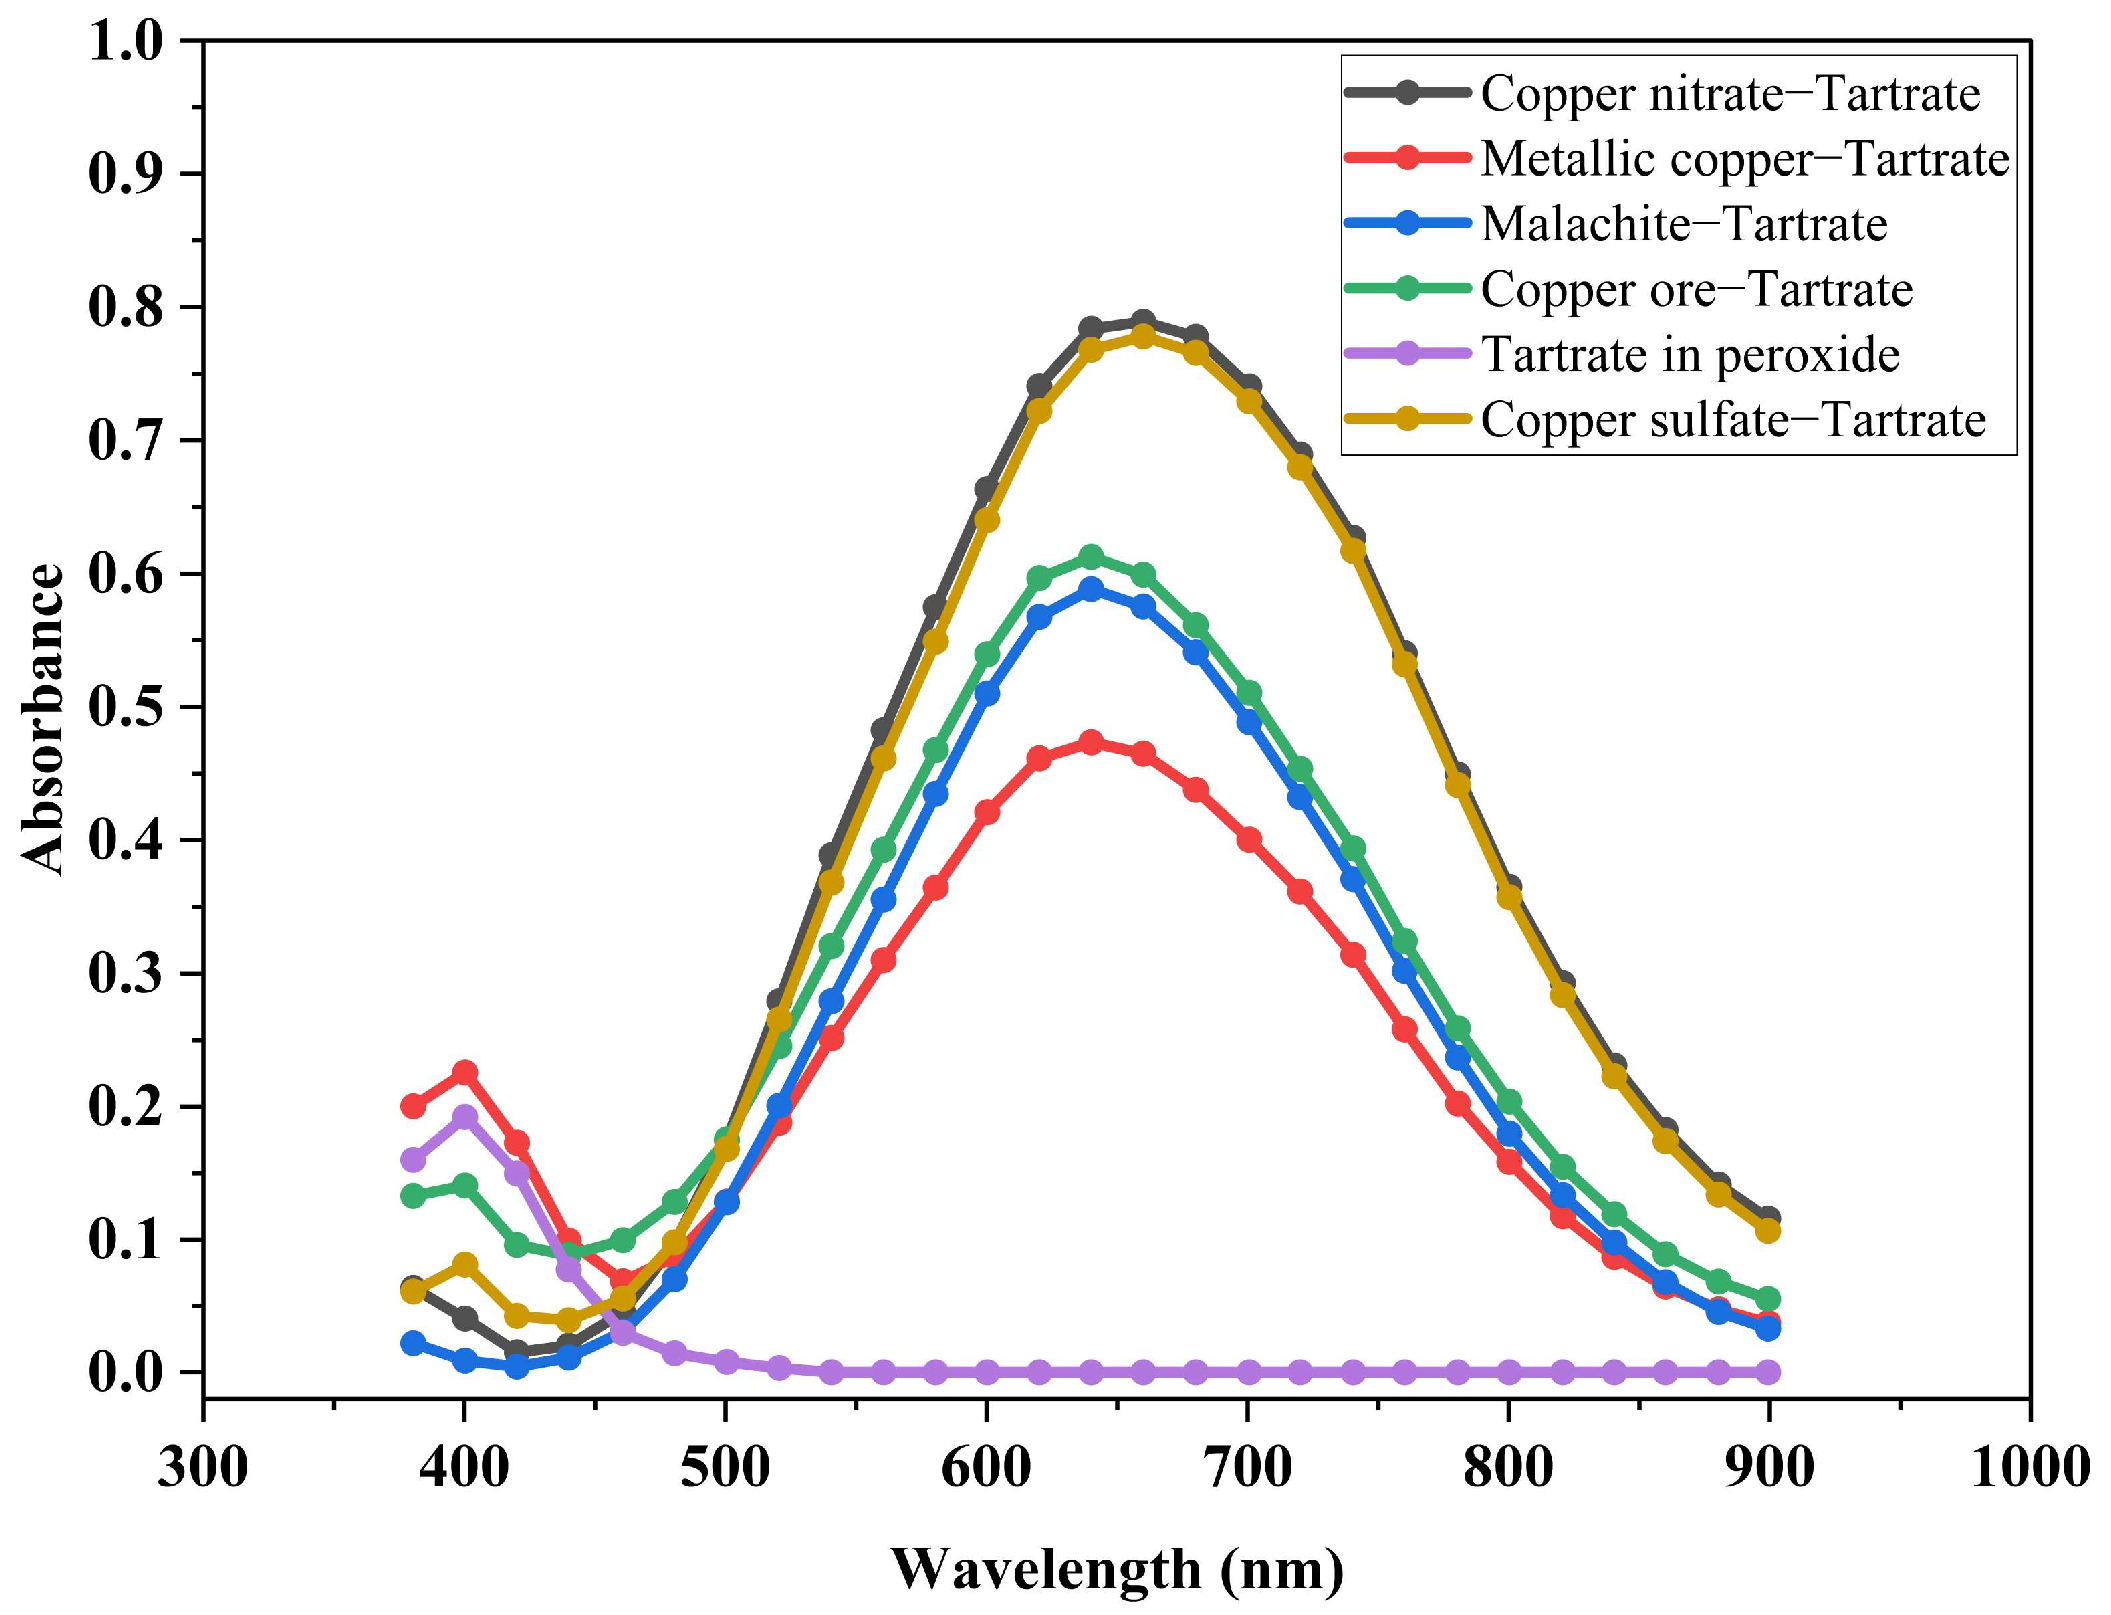
3.2. Identification of the Compound Formed

The absorption curves reported in Figure 3 correspond to wideband absorption spectra that originate from electronic transitions d-d and vibrational energies typical of copper complexes with ligands that use donor oxygen atoms in the formation of coordination bonds with the metal ion. This is in accord with the results reported by Baker [15] for the formation of copper (II) complexes with polydentate ligands such as oxalate, EDTA, and ethylenediamine.
The same spectral behavior is observed in the absorption spectra obtained from copper sulfate and copper nitrate aqueous solutions, which are identical and of similar wide band wave; both are formed in the range of 400 to 900 nm. These are of intense blue color and have a maximum absorbance at 660 nm, although the copper (II) ions come from different salts which means that the counter-ion has no effect which is expected given that the salt is fully dissociated in water. Therefore, it is established that the compound formed turns out to be a coordination compound that originates from the chelating action of the tartrate ion on the copper (II) ion. Similar behavior occurs when copper reacts with glycine in an alkaline medium [16].
The results of processing the spectrophotometric information collected from the tests performed for the determination of the stoichiometry of the copper–tartrate complex using Job’s methods of Continuous Variations [17], (Figure 4a,b), corresponds to the formation of a 1:1 (metal ion:ligand) complex in an alkaline aqueous solution, a result that is consistent with that reported by Schoenberg [18].
As indicated in Equation (1), one unit of the tartrate ligand interacts with one unit of the metal ion to displace two units of water with the formation of one unit of the complexed ligand.
[Cu(H2O)6]2+(aq) + [C4H4O6]2−(aq) → [Cu(H2O)4(C4H4O6)](aq) + 2H2O(l)
This equation is in agreement with the process reported by Thomsen [19], which is detailed later in Figure 5.
Additionally, an analysis of the experimental data obtained to determine the formula of the complex formed between copper (II) ions and tartrate ions using the potentiometric method, indicates that the copper tartrate complex corresponds to the formula [Cu(H2O)2(OH)2(C4H4O6)]2−(aq), which originates as a result of the following reaction:
[Cu(H2O)4(C4H4O6)](aq) + 2OH(aq) → [Cu(H2O)2(OH)2(C4H4O6)]2−(aq) + 2H2O(l)
The potentiometric titration curve for tartaric acid with the base in aqueous medium clearly shows the end point associated with the ionization of tartaric acid (a = 2, Figure 5a), to generate the tartrate anion. Figure 5b shows the potentiometric titration curve in the presence of Cu(II) where the deprotonation of two water molecules of the copper (II)–tartrate complex (a = 3.0) takes place with the formation: [Cu(H2O)2(OH)2(C4H4O6)]2−(aq), anion.
Within this context, it is concluded that the absorption spectra shown in Figure 3 correspond to the copper tartrate anionic complex, with an absorptivity coefficient (ε) of 31.36 cm−1 dm3 mol−1 at a wavelength of 660 nm. These spectra are similar to those reported by Hörner and Klüfers [20].
Finally, it can be established that the compound formed from the interaction between copper (II) and tartrate ions has as an ionic formula: [Cu(H2O)2(OH)2(C4H4O6)]2−(aq), as shown in Figure 6, in which the central atom is coordinated with the oxygen atoms of two water molecules, two hydroxyl oxygens, and two carboxylic oxygens, corroborating what was reported by Logunov [21].
Considering the value of the stability constant of the copper–tartrate anionic complex in water at 298 K (log Kf = 19.14), reported by Dean [22], a highly stable complex is formed in the alkaline medium.

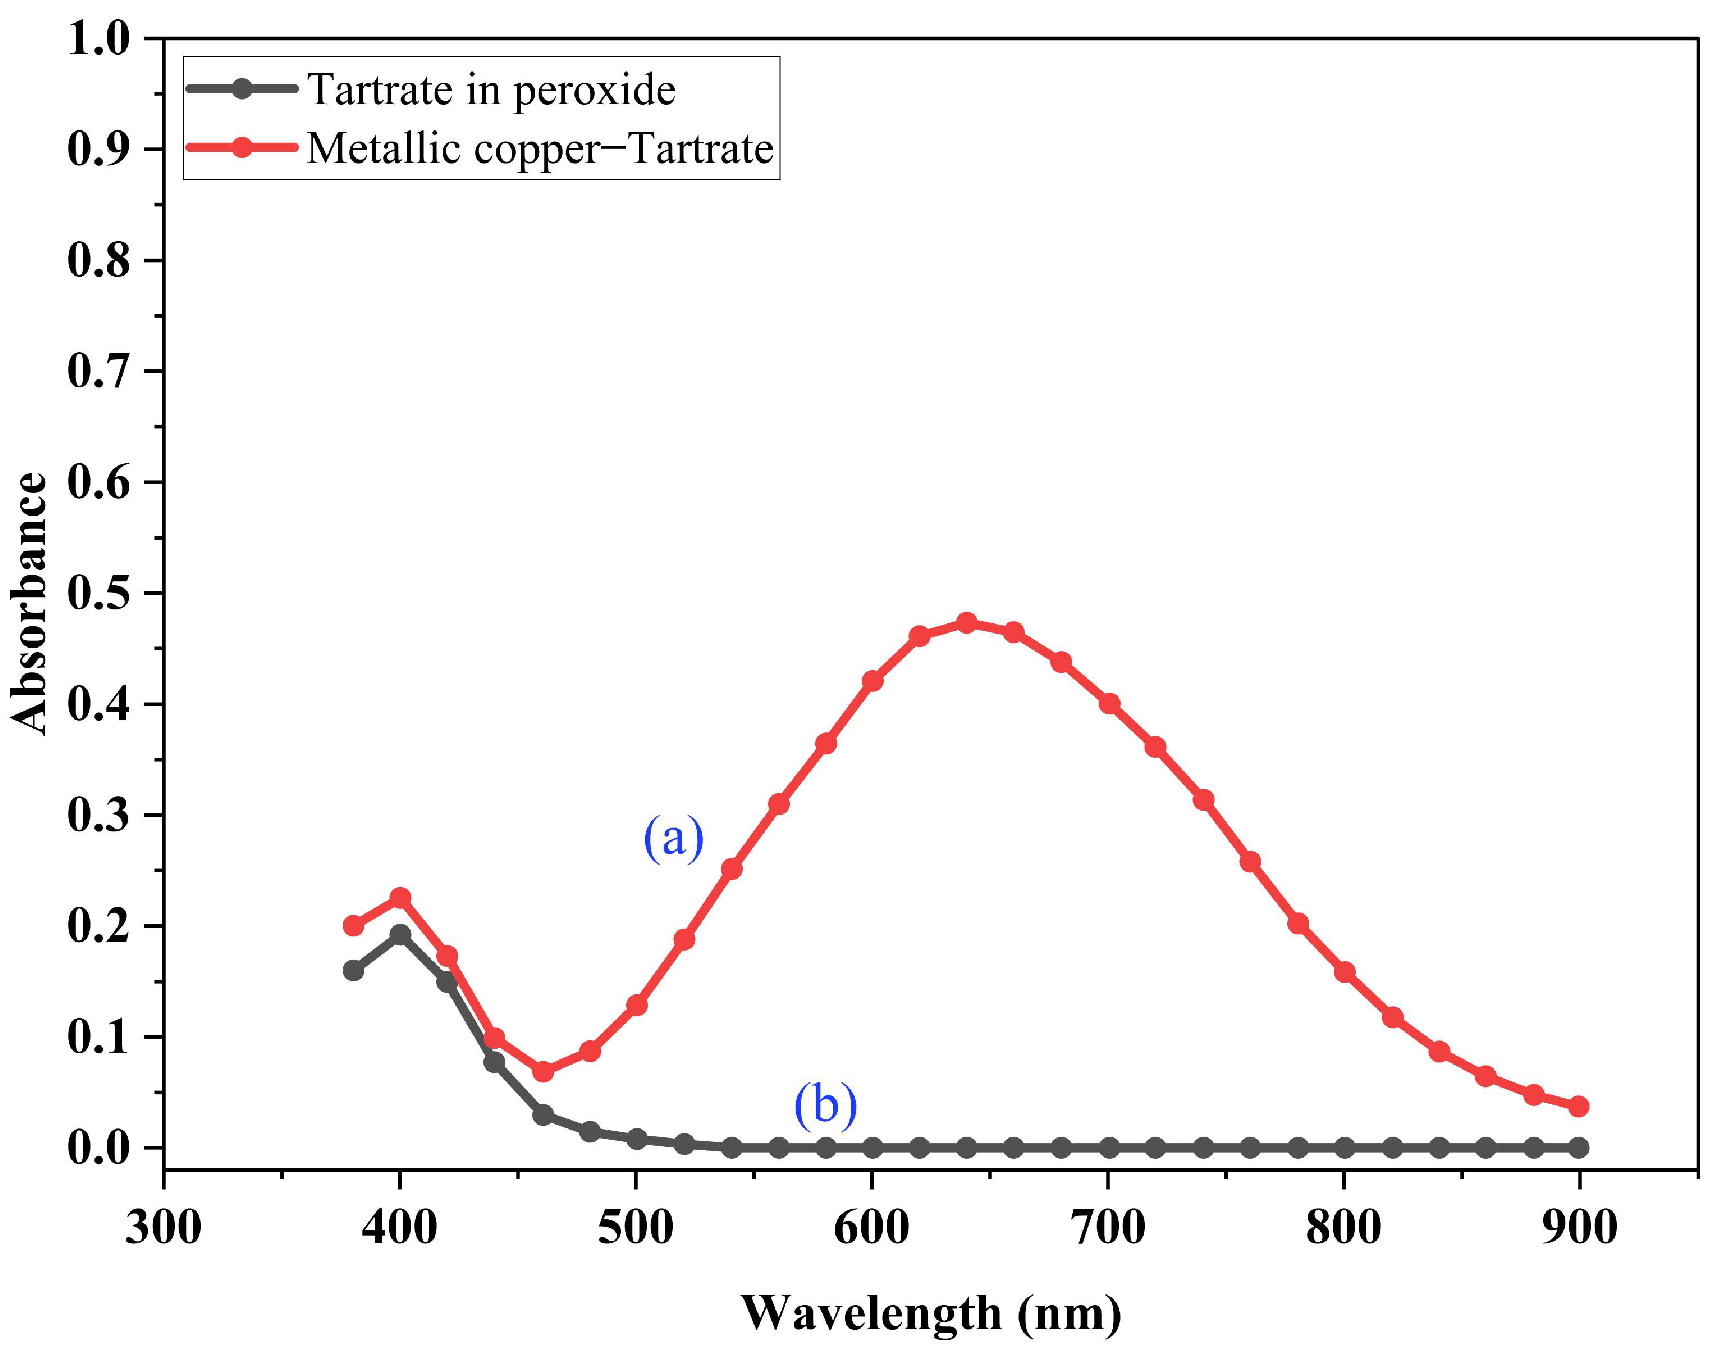
3.3. Dissolution of Metallic Copper in the Presence of an Alkaline Aqueous Solution of Tartrate Ions and Hydrogen Peroxide

The absorption spectra of the solution, resulting from the dissolution of metallic copper by the action of tartrate ions in alkaline medium in the presence of hydrogen peroxide, showed two bands of maximum absorbance: a small one at 400 nm, that corresponds to the partial decomposition of the tartrate ion by hydrogen peroxide, as indicated by Wright and Silverstein [23]; and the other, dominant and broad, at 640 nm, similar to that recorded by the spectrum of the solution of the copper–tartrate complex, as reported in Figure 7. This spectral behavior confirms that the oxidation of metallic copper is accompanied by the subsequent formation of the copper–tartrate complex, thus demonstrating the chelating capacity of the tartrate ion to dissolve metallic copper, a fact that is consistent with the results reported by Tianbao in the interaction of copper with an alkaline glycine solution [24].

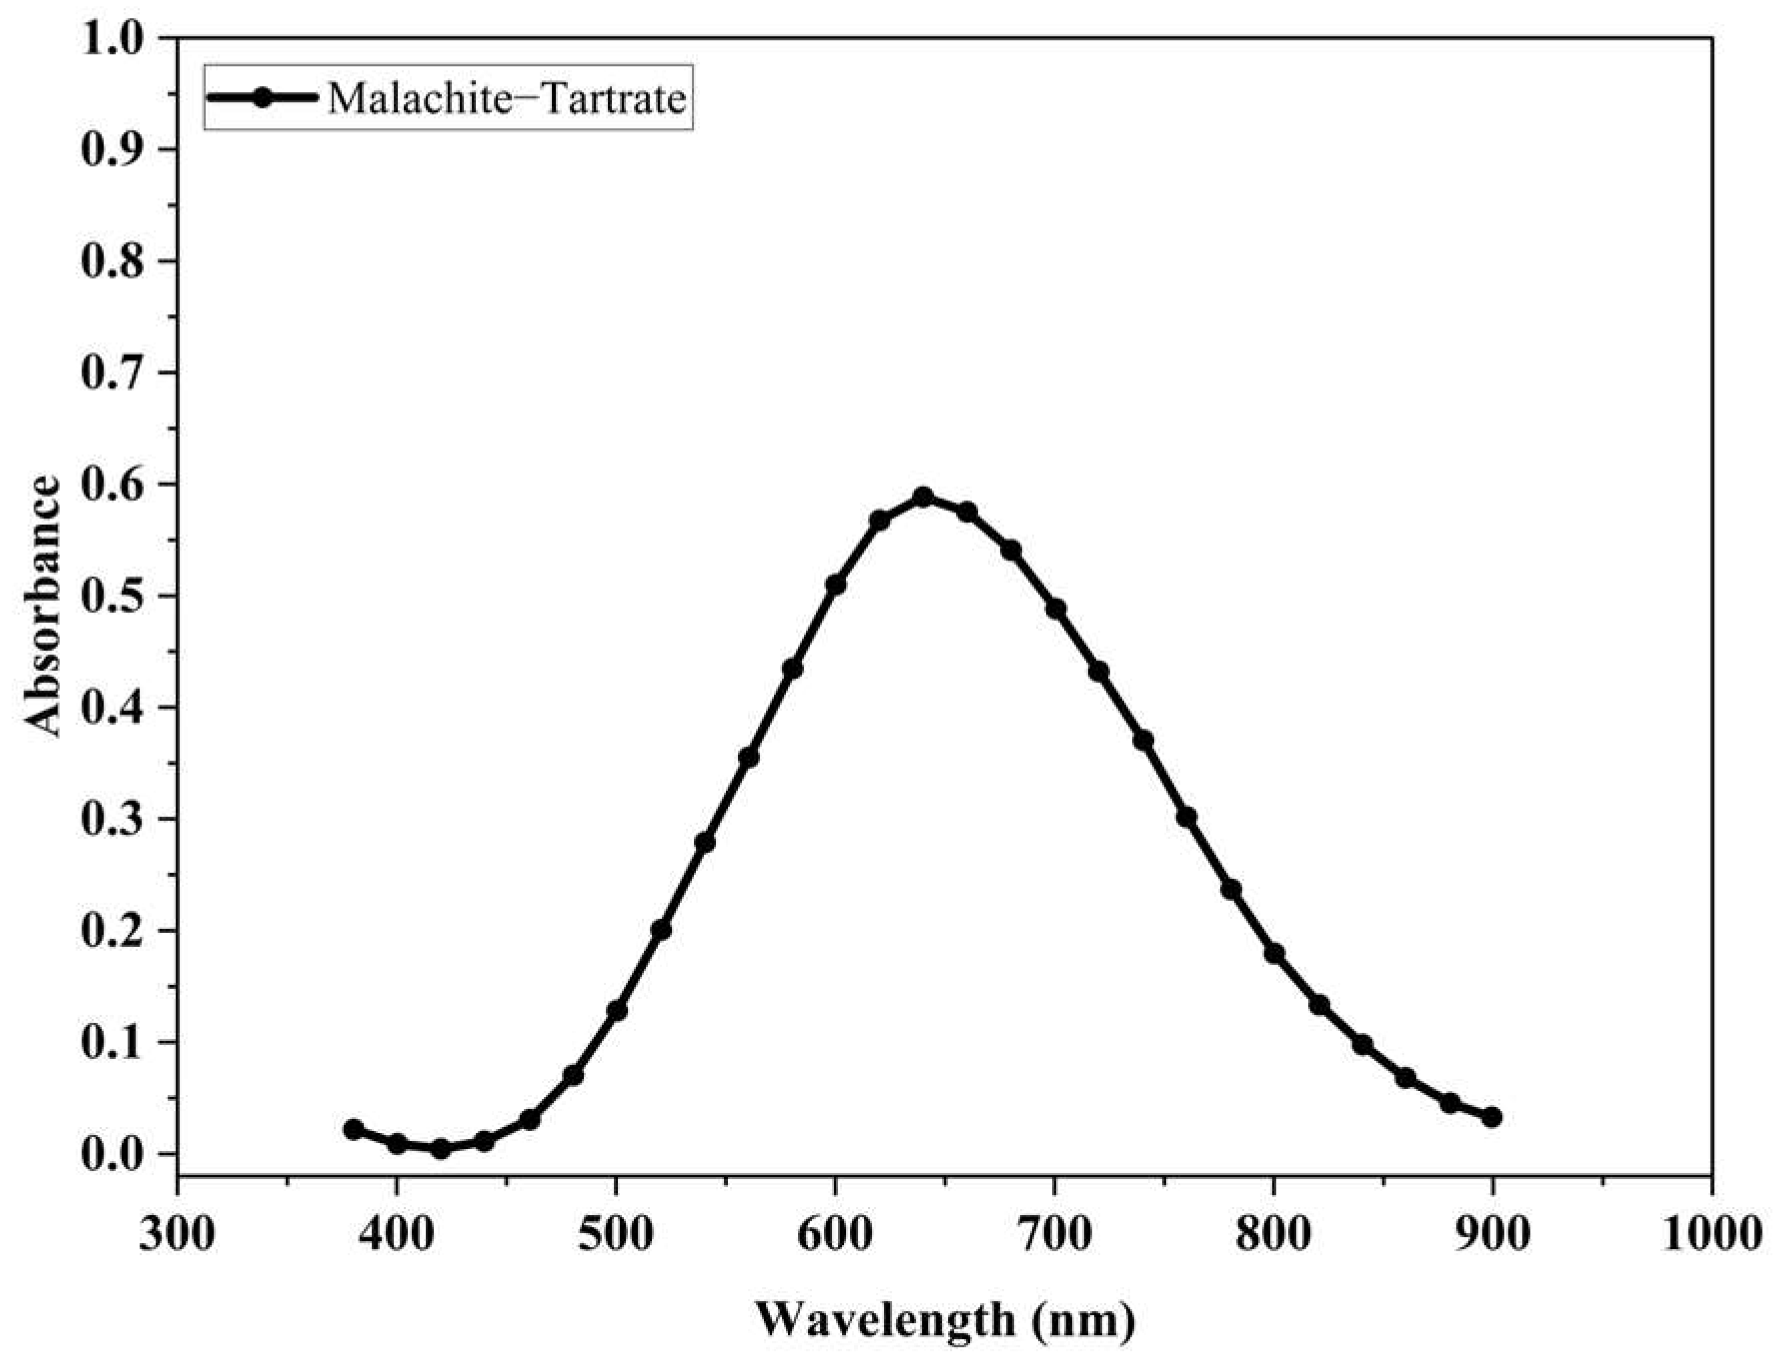
3.4. Evaluation of the Dissolution of Basic Cupric Carbonate (Malachite) by the Action of an Aqueous Solution, Consisting of Tartrate Ions in an Alkaline Medium

The results of the study of the dissolution of basic cupric carbonate (malachite) in an alkaline aqueous medium and in the presence of tartrate ions provide evidence that an increase in the concentration of copper ions in the resulting solution is due to the chelating activity of the tartrate ions around the transition metal. This behavior is observed in the graphical representation of the dissolution process, shown in Figure 8, which is a plot of the fraction of copper dissolved vs. time, showing that 91% of copper present in 10 g of malachite was dissolved in 500 cm3 of aqueous solution containing 40 g/L of tartrate (0.21 mol dm−3) and 20 g/L (0.5 mol dm−3) of sodium hydroxide in a period of 40 min at room temperature. Furthermore, Figure 8 shows that the kinetics of the dissolution process are relatively fast.
According to these results, it is proposed that the global reaction for the dissolution of basic cupric carbonate (malachite) by the action of tartrate ions in aqueous alkaline medium is represented by the following equation:
CuCO 3 · Cu ( OH ) 2 ( s ) + 2 C 4 H 4 O 6 2 ( aq ) + H 2 O ( l )   O H 2 [ C u ( O H ) 2 · ( C 4 H 4 O 6 ) ] 2 ( a q ) + C O 2 ( g )
In Equation (3), the notations s, aq., l, and g are the notations used to indicate solid, aqueous, liquid, and gas, respectively. The product of malachite in the presence of an alkaline solution of tartrate ions in an aqueous medium is the formation of a Cu(II)–tartrate complex of an intense blue color. This was analyzed by spectral scanning in the visible region, yielding a wide band with a maximum peak at the wavelength of 640 nm, as shown in Figure 9. Such an absorption spectrum turned out to be identical to those obtained from solutions containing CuSO4 and KNaC4H4O6 in an alkaline medium (Figure 3). Malachite experiences a similar case when it reacts with an alkaline ammoniacal solution of ammonium carbonate [25]. Although the conventional alkaline leaching process using cyanide and ammonia can yield recovery percentages close to 90%, its use is limited; even though the ammoniacal leaching medium is intended to selectively extract copper, its use implies technical and environmental risks [16,26,27].
In the previous figure (Figure 8), the tartrate ions under the experimental conditions indicated are capable of dissolving malachite in a period of 20 min at room temperature. Such behavior is favored by the increase in the concentration of tartrate ions.
The leaching rate (RCu) for malachite dissolution was calculated from the following equation:
R C u = M L M F 100
where ML is the mass of copper ions present in the leached solution and MF is the mass of copper in the oxidized mineral.

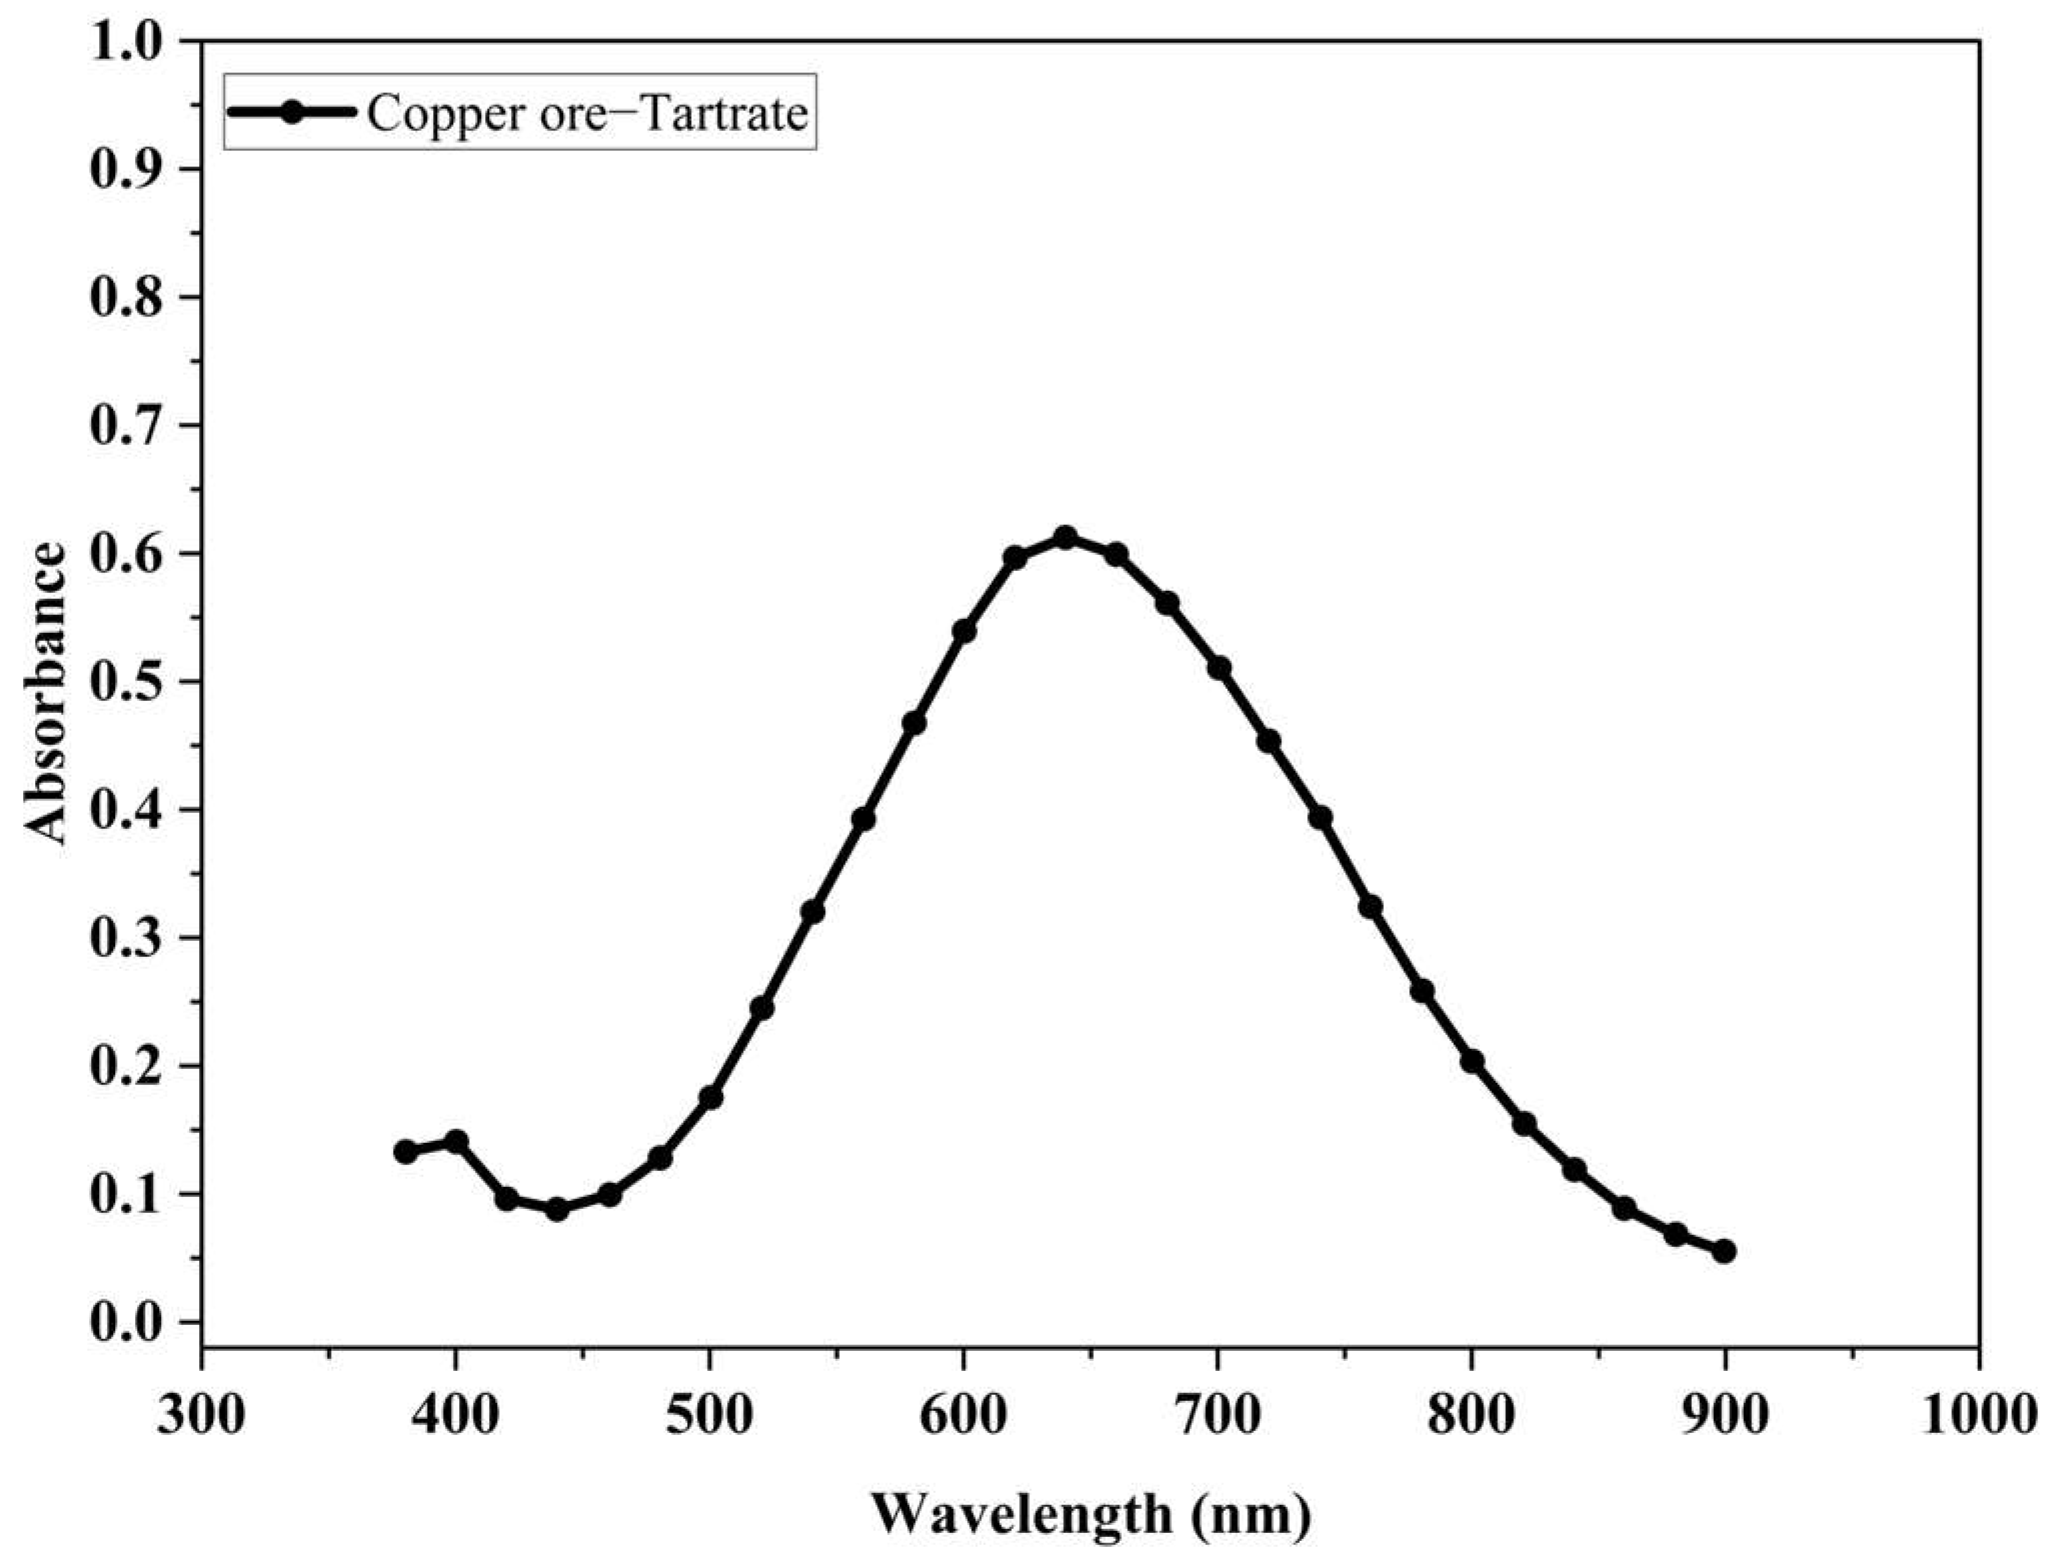
3.5. Ability of the Tartrate Ion to Remove Copper Ions in the Oxidized Ore Leaching Process

The results of the oxidized ore leaching tests clearly indicate that copper recovery is strongly dependent on the concentration of tartrate ions in the alkaline medium, as shown in Figure 10, which is a plot of the fraction of copper dissolved vs. the concentration of tartrate on the molar scale. Thus, for a tartrate concentration of 140 g/L (0.74 mol dm−3) in a sodium hydroxide solution (3.5 mol dm−3), 62% of copper was removed in a period of 18 h, as can be seen in Figure 10.
The fraction of dissolved copper (RCu) for each of the leaching tests was calculated using the following equation:
% R C u = % C u M i n e r a l % C u R e s i d u o % C u M i n e r a l 100
where %CuMineral = is the percentage of copper in the oxidized mineral and %CuResiduo = is the percentage of copper in the residual solid.
The dissolution rate, as seen in Figure 10, is dependent on the increase in the concentration of tartrate ions, with the dissolution rate showing a moderate increase. The best experimental condition for copper extraction is when the concentration of tartrate ions is 0.74 mol dm−3 and the concentration of NaOH 3.5 mol dm−3. Likewise, the percentage range of copper extraction turns out to be sufficient so that the resulting solution can guarantee the continuity of the subsequent stages of the hydro-metallurgical process. Furthermore, it is a product that is commercially available in the food industry, and due to its non-toxic nature, opposite to that of cyanide and ammonium, it constitutes an attractive reagent, not only from an environmental perspective, to minimize the impact of hydrometallurgical activity.
This is made feasible by the formation of the copper(II)—tartrate complex as demonstrated through the absorption spectra of the solutions resulting from the leaching, which are similar to those already evaluated, as shown in Figure 11 and Figure 12.
The results of the experimental tests developed in this research demonstrated, sequentially, that the alkaline solution of tartrate ions is capable of forming coordination complexes with copper ions, forming stable solutions of copper ions taking advantage of the chelating capacity of tartrate, a behavior (see Figure 12) which allows it to dissolve metallic copper, attack malachite, and leach oxidized copper ore efficiently.

4. Conclusions

From the above discussion, the following conclusions are drawn:
(i)
A new leaching methodology, which consists in replacing the use of an aqueous solution of sulfuric acid with an alkaline solution enriched by the presence of tartrate ions as chelating agent for the release of copper from the oxidized mineral, has been successfully developed. This statement is supported by the observed enhancement of the capacity of the tartrate ion to dissolve copper from ores in the presence of hydrogen peroxide.
(ii)
Basic cupric carbonate (malachite) is soluble in an alkaline solution, due to the complexing ability of tartrate ions.
(iii)
Copper is released from the oxidized mineral in the leachate solution forming the [Cu(OH)2(C4H4O6]2− complex.
(iv)
The concentration of copper ions in the solution resulting from the leaching process is strongly dependent on the concentration of tartrate ions in the leachate solution. This behavior confirms the chelating capacity of the tartrate ions in the release of copper ions from the oxidized mineral.
(v)
In addition, the results of this investigation provide the basis of a new environmentally friendly hydrometallurgical process of oxidized copper minerals, in which the use of sulfuric acid solutions is eliminated.

Author Contributions

Methodology, F.J.S.V. and J.A.Q.O.; Validation, A.F.D.d.N.; Formal analysis, A.F.D.d.N.; Investigation, F.J.S.V. and J.A.Q.O.; Data curation, J.A.Q.O.; Writing—original draft, F.J.S.V.; Writing—review & editing, A.F.D.d.N.; Visualization, A.A.H.A.; Supervision, F.J.S.V. All authors have read and agreed to the published version of the manuscript.

Funding

The authors gratefully acknowledge the financial assistance provided by the Universidad Nacional de San Agustín de Arequipa—Perú to carry out this research [grant numbers: IBAIB-04-2019-UNSA].

Data Availability Statement

Not applicable.

Conflicts of Interest

The authors declare no conflict of interest.

References

  1. Hocking, M.B. Ore Enrichment and Smelting of Copper. In Handbook of Chemical Technology and Pollution Control; Academic Press: Cambridge, MA, USA, 2005; pp. 391–420. [Google Scholar] [CrossRef]
  2. Joaquín Jara, J.; Pérez, P.; Villalobos, P. Good deposits are not enough: Mining labor productivity analysis in the copper industry in Chile and Peru 1992–2009. Resour. Policy 2010, 35, 247–256. [Google Scholar] [CrossRef]
  3. Leon Mendoza, J.C. Determinantes Económicos y Sociopolíticos de Los Conflictos Socioambientales en el Peru. Rev. De Investig. Altoandinas J. High Andean Res. 2019, 21, 122–138. [Google Scholar] [CrossRef]
  4. Terrones-Saeta, J.M.; Suárez-Macías, J.; Río, F.J.L.D.; Corpas-Iglesias, F.A. Study of Copper Leaching from Mining Waste in Acidic Media, at Ambient Temperature and Atmospheric Pressure. Minerals 2020, 10, 873. [Google Scholar] [CrossRef]
  5. Stevanović, Z.; Antonijević, M.; Jonović, R.; Avramović, L.; Marković, R.; Bugarin, M.; Trujić, V. Leach-SX-EW Copper revalorization from overburden of abandoned copper mine Cerovo, Eastern Serbia. J. Min. Metall. 2009, 45, 45–57. [Google Scholar] [CrossRef]
  6. Zhao, W.; Yang, B.; Yi, Y.; Fang, Q. Synergistic activation of smithsonite with copper-ammonium species for enhancing surface activity and xanthate adsorption. Int. J. Min. Sci. Technol. 2023, 33, 519–527. [Google Scholar] [CrossRef]
  7. Shen, Z.; Wen, S.; Wang, H.; Meng, S.; Feng, Q. Effect of dissolved components of malachite and calcite on surface properties and flotation behavior. Int. J. Miner. Miner. Metall. Mater. 2023, 30, 1297–1309. [Google Scholar] [CrossRef]
  8. Balasubramaniam, B.; Singh, N.; Verma, S.; Gupta, R.K. Recycling of Lithium from Li-ion Batteries. In Encyclopedia of Renewable and Sustainable Materials; Elsevier: Amsterdam, The Netherlands, 2020; pp. 546–554. [Google Scholar] [CrossRef]
  9. Lin, F.H.-J.; Horváth, C. Measurements of stability constants for complexes of divalent cations with tartaric acid by ion chromatography. J. Chromatogr. A 1992, 589, 185–195. [Google Scholar] [CrossRef]
  10. Zabiszak, M.; Nowak, M.; Hnatejko, Z.; Grajewski, J.; Ogawa, K.; Kaczmarek, M.T.; Jastrzab, R. Thermodynamic and Spectroscopic Studies of the complexes formed in tartaric acid and lanthanide (III) ions binary systems. Molecules 2020, 25, 1121. [Google Scholar] [CrossRef]
  11. Han, M.J.; He, J.I.; Sun, W.; Li, S.; Yu, H.; Yue, T.; Wei, X.; Zhang, C.-Y. Coordination configurations of cupric tartrate in electronic industry wastewater. Trans. Nonferrous Met. Soc. China 2022, 32, 3753–3766. [Google Scholar] [CrossRef]
  12. Da Silva Júnior, W.F.; de Oliveira Pinheiro, J.G.; Moreira, C.D.; de Souza, F.J.; de Lima, D.A. Alternative Technologies to Improve Solubility and Stability of Poorly Water-Soluble Drugs. In Multifunctional Systems for Combined Delivery, Biosensing and Diagnostics; Elsevier: Amsterdam, The Netherlands, 2017; pp. 281–305. [Google Scholar] [CrossRef]
  13. Renny, J.S.; Tomasevich, L.L.; Tallmadge, E.H.; Collum, D.B. Method of continuous variations: Applications of Job plots to the study of molecular associations in organometallic chemistry. J. Angew. Chem. Int. Ed. 2013, 52, 11998–12013. [Google Scholar] [CrossRef]
  14. James, A.M.; Prichard, F.E. Practical Physical Chemistry, 3rd ed.; Longman: London, UK, 1974. [Google Scholar]
  15. Baker, A.T. The Ligand Field Spectra of Copper(II) Complexes. J. Chem. Educ. 1998, 75, 98. [Google Scholar] [CrossRef]
  16. Tanda, B.C.; Eksteen, J.J.; Oraby, E.A. An investigation into the leaching behaviour of copper oxide minerals in aqueous alkaline glycine solutions. Hydrometallurgy 2017, 167, 153–162. [Google Scholar] [CrossRef]
  17. Wasim, A.A.; Khan, M.N.; Wahab, M.F.; Rehman, S.F.U. Construction of Job’s plot in case of high spectral overlap between the reactants and the complex: Application of multiwavelength linear regression analysis using the Cu-EDTA system. Chem. Bulg. J. Sci. Educ. 2019, 28, 475–484. [Google Scholar]
  18. Schoenberg, L.N. The structure of the complexed copper species in electroless copper plating solutions. J. Electrochem. Soc. Electrochem. Sci. 1971, 118, 1571–1576. [Google Scholar] [CrossRef]
  19. Thomsen, M.W. Determination of the solubility product of copper(II) tartrate. J. Chem. Educ. 1992, 69, 328. [Google Scholar] [CrossRef]
  20. Hörner, T.G.; Klüfers, P. The Species of Fehling’s Solution. Eur. J. Inorg. Chem. 2016, 2016, 1798–1807. [Google Scholar] [CrossRef]
  21. Logunov, L.S.; Panov, M.S.; Myund, L.A.; Tumkin, I.I.; Khairullina, E.M.; Ryazantsev, M.N.; Balova, I.A.; Kochemirovsky, V.A. Influence of the ligand nature on the in situ laser-induced synthesis of the electrocatalytically active copper microstructures. Arab. J. Chem. 2018, 11, 624–634. [Google Scholar] [CrossRef]
  22. Dean, J.A. Lange’s Handbook of Chemistry, 15th ed.; McGraw-Hill, Inc.: New York, NY, USA; St. Louis, MO, USA; San Francisco, CA, USA, 1999. [Google Scholar]
  23. Wright, S.W.; Silverstein, T.P. Improvements upon the “Colorful Cobalt Catalysis” Demonstration and Evidence for the Presence of an Autocatalytic Mechanism. J. Chem. Educ. 2010, 87, 1064–1069. [Google Scholar] [CrossRef]
  24. Tianbao, D.; Vijayakumar, A.; Desai, V. Effect of hydrogen peroxide on oxidation of copper in CMP slurries containing glycine and Cu ions. Electrochim. Acta 2004, 49, 4505–4512. [Google Scholar]
  25. Bingöl, D.; Canbazoğlu, M.; Aydoğan, S. Dissolution kinetics of malachite in ammonia/ammonium carbonate leaching. Hydrometallurgy 2005, 76, 55–62. [Google Scholar] [CrossRef]
  26. D’Aloya, A.; Nikoloski, A. The passivation of iron in ammoniacal solutions containing copper (II) ions. Hydrometallurgy 2012, 111–112, 58–64. [Google Scholar] [CrossRef]
  27. Liu, Z.X.; Yin, Z.L.; Hu, H.P.; Chen, Q.Y. Dissolution kinetics of malachite in ammonia/ammonium sulphate solution. J. Cent. South Univ. 2012, 19, 903–910. [Google Scholar] [CrossRef]
Figure 1. The surface SEM micrographs (a) global and (b) punctual and the EDX spectrum for the oxidized copper ore.
Metals 13 01672 g001
Figure 2. Micrographs (a) global and (b) punctual SEM/EDX of the leaching residue at the conditions of CNaOH = 3.5 mol dm−3 (pH > 13); CTartrate = 0.744 mol dm−3; Room temperature; S/L ratio (1:10); and 600 RPM stirring rate.
Metals 13 01672 g002
Figure 3. Visible spectrum of the formation of the copper (II)—tartrate complex from copper salt.
Metals 13 01672 g003
Figure 4. Stoichiometric relationship of copper complex (II)—tartrate: (a) Applying Job’s method. (b) Applying the Continuous Variations method. The reported results are the product of tests performed in triplicate.
Metals 13 01672 g004
Figure 5. Potentiometric titration curves of (a) tartaric acid (b) 1:1.6 Cu(II)—tartaric acid system, CM = 0.025 mol dm−3, CL = 8.02 × 10⁻⁴ mol dm−3, CNaOH = 4.99 × 10⁻⁵, T = 298.15 °K.
Metals 13 01672 g005
Figure 6. System structure [Cu(H2O)2(OH)2(C4H4O6)]2−(aq), in ACD/ChemSketch software, Ontario, Canada (available online: https://www.acdlabs.com/resources/free-chemistry-software-apps/chemsketch-freeware/, accessed on 12 August 2023).
Metals 13 01672 g006
Figure 7. Visible spectrum of (a) Cu(II)—tartrate coordination compound in the presence of hydrogen peroxide. (b) Tartrate ion solution in presence of hydrogen peroxide.
Metals 13 01672 g007
Figure 8. Chelating activity of tartrate ions in the dissolution of basic cupric carbonate (malachite). (a) CL = 0.11 mol dm−3, (b) CL = 0.16 mol dm−3, (c) CL = 0.21 mol dm−3, CNaOH = 0.5 mol dm−3, T = 298.15 K, weight of Malachite = 10 g, V = 500 cm3. The reported results are the product of tests performed in triplicate.
Metals 13 01672 g008
Figure 9. Visible spectrum of the formation of the Cu(II)–tartrate coordination compound from basic cupric carbonate (malachite). CL = 0.07 mol dm−3 in presence of NaOH 3.5 mol dm−3.
Metals 13 01672 g009
Figure 10. Copper fraction extracted from an oxidized ore (particle size 45 μm) using an alkaline solution of NaOH 3.5 mol dm−3, pH = 12 in presence of tartrate ions at concentrations of 0.43, 0.53, 0.64, and 0.74 mol dm−3. The reported results are the product of tests performed in triplicate.
Metals 13 01672 g010
Figure 11. Visible spectrum of the formation of the Cu (II) complex—tartrate present in the leaching solution.
Metals 13 01672 g011
Figure 12. Visible spectrum of the formation of Cu (II)—tartrate complexes from different copper (II) sources.
Metals 13 01672 g012
Table 1. Chemical composition of oxidized copper ore (SEM-EDX).
Element%
C6.16
O49.79
Mg0.20
Al2.07
Si23.81
K0.78
Ca0.17
Fe6.31
Cu10.72
Table 2. Chemical composition of the solid leaching residue (SEM-EDX).
Element%
C18.16
O63.95
Na1.03
Al0.73
Si11.73
K0.64
Fe1.97
Cu1.79
Disclaimer/Publisher’s Note: The statements, opinions and data contained in all publications are solely those of the individual author(s) and contributor(s) and not of MDPI and/or the editor(s). MDPI and/or the editor(s) disclaim responsibility for any injury to people or property resulting from any ideas, methods, instructions or products referred to in the content.

