Article

An Improved Correlation for the Estimation of the Yield Strength from Small Punch Testing

by
Eberhard Altstadt
Helmholtz-Zentrum Dresden-Rossendorf, Bautzner Landstrasse 400, 01328 Dresden, Germany
Metals 2023, 13(10), 1716; https://doi.org/10.3390/met13101716
Submission received: 16 September 2023 / Revised: 30 September 2023 / Accepted: 7 October 2023 / Published: 9 October 2023
(This article belongs to the Section Computation and Simulation on Metals)

Abstract

:
This study aims at improving the empirical correlation for estimating the yield strength from small punch tests. The currently used procedure in the European standard EN 10371 to determine the elastic–plastic transition force—based on bi-linear fitting—involves a dependency not only on the onset of plastic flow but also on the work hardening of the material. Consequently, the yield strength correlation factor is not universal but depends on the material properties and on the geometry of the small punch set-up, leading to a significant uncertainty in the yield strength estimation. In this study, an alternative definition of the elastic–plastic transition force is proposed, which depends significantly less on the work hardening of the material and on the small punch geometry. The approach is based on extensive elastic–plastic finite element simulations with generic material properties, including a systematic variation of the yield strength, ultimate tensile strength, and uniform elongation. The new definition of the transition force is based on the deviation of the force-deflection curve from the analytical elastic slope derived by Reissner’s plate theory. A significant reduction of the uncertainty of the yield strength estimation is demonstrated.

1. Introduction

The small punch (SP) test was established as a small-specimen test technology supporting the development and screening of structural materials (see, e.g., [1,2,3]). It provides estimations of mechanical properties with small amounts of material and has received much attention as a high-throughput characterization method. For example, this is of major interest for irradiated and activated materials [4,5]. The primary output of the quasi-static SP test is the punch force as a function of the punch displacement—force-displacement curve F ( v ) —or as function of specimen deflection—force-deflection curve F ( u ) . A comprehensive discussion on the stages and properties of the force-deflection curve is provided in [3]. In case of SP creep tests, the punch force is kept constant, and the displacement and/or deflection is measured as function of time. Recently, a European standard was published [6]. Thus far, the SP test has been successfully used to estimate (i) the ductile-to-brittle transition temperature where SP tests at different temperatures are used to derive the SP energy as function of test temperature [1,2,7]; (ii) tensile properties, in particular the yield strength (YS) and ultimate tensile strength (UTS) [8,9,10,11,12]; (iii) fracture and damage parameters [3,13,14]; and (iv) creep properties [15,16,17,18,19,20,21,22]. In the European standard [6], the associated methods are described in informative, non-mandatory annexes. The current study is related to (ii), in particular to the estimation of the yield strength from the quasi-static force-deflection curve F ( u ) . Recent developments are focused on the involvement of machine learning [23,24].
The following correlation was proposed for the YS [25]:
R p 02 = β Y S F e / h 2
with h being the initial specimen thickness, F e the elastic–plastic transition force, and βYS an empirical factor. The transition force is determined by a bi-linear fit [6,26] (see Figure 1). Kameda and Mao [25] found β Y S = 0.36 for specimen thicknesses of 0.25 mm and 0.5 mm irrespective of the geometrical parameters of the SPT set-up. In contrast, the European standard suggests a value of β Y S = 0.51 . The application and detailed analysis of these empirical correlations shows that the correlation factor for the yield stress depends on the geometrical parameters of the SP test (punch diameter, die diameter, size of die edge radius or chamfer, and specimen thickness) and on the material properties.
In [27], it was demonstrated that the maximum plastic strain in the sample is already around 0.1 when the transition force F e is reached. Therefore, F e is not only a function of the flow stress but is also significantly affected by the work hardening of the material (i.e., the slope of the stress–strain curve). Hähner et al. [28] addressed this problem by means of a self-consistent data reduction scheme for the determination of σ y , which was based on the curvature K of the force–displacement curve rather than a single F e force level. The curvature was estimated from the offset forces at displacement offsets of 10, 50, and 90 µm. Based on systematic FE simulations with a Holomon hardening law ( σ = C ε n ), they related the hardening exponent n to the curvature K of the force-displacement curve (C is a material constant). This relationship facilitated the establishment of the correlation factor β Y S as a function of n , which led to a significant reduction of the uncertainty for the yield strength estimation. In this approach, the correlation factor β Y S is material-dependent through its dependence on the hardening exponent n .
Another method was proposed by Calaf Chica et al. [9]. Based on FE simulations and experimental SP results, they derived an exponential expression for the yield stress as function of the slope at the first inflection point of the force-displacement curve. It was shown that the uncertainty for the yield strength estimation could be reduced as compared to the methods based on Equation (1). Nevertheless, the very accurate determination of the slope at the first inflection point is crucial because of the exponential nature of the correlation. In view of measurement accuracy and the compliance of the test set-up, this required accuracy could be problematic in practice.
Yet another method was proposed by Zhong et al. [29]. It is based on extracting true stress–strain curves from SP test data using iterative finite element simulations. The extracted true stress–strain curves were used in FE simulation of tensile tests to obtain the tensile parameters. In this way, a database was created to predict tensile parameters from SP force-deflection curves by means of data mining.
The above-mentioned findings in [9,27,28,29] demonstrate that the current procedure for the yield strength estimation as established in the standard [6] exhibits a large uncertainty. The motivation of the current work is to identify a possibility for an improvement of the reliability of the YS estimation while keeping the procedure as simple as possible for the practical application. Therefore, the study still relies on the simple correlation Equation (1) but proposes an alternative definition of the elastic–plastic transition force, which is significantly less dependent on the work hardening of the material. The approach is based on the deviation of the force-deflection curve F ( u ) from the analytical elastic slope derived by Reissner’s plate theory. Moreover, it can show that the new definition of the transition force leads to significantly reduced dependence of the correlation factor β Y S on the geometry of the SP set-up.

2. Modeling of the Small Punch Test

2.1. Finite Element Modeling

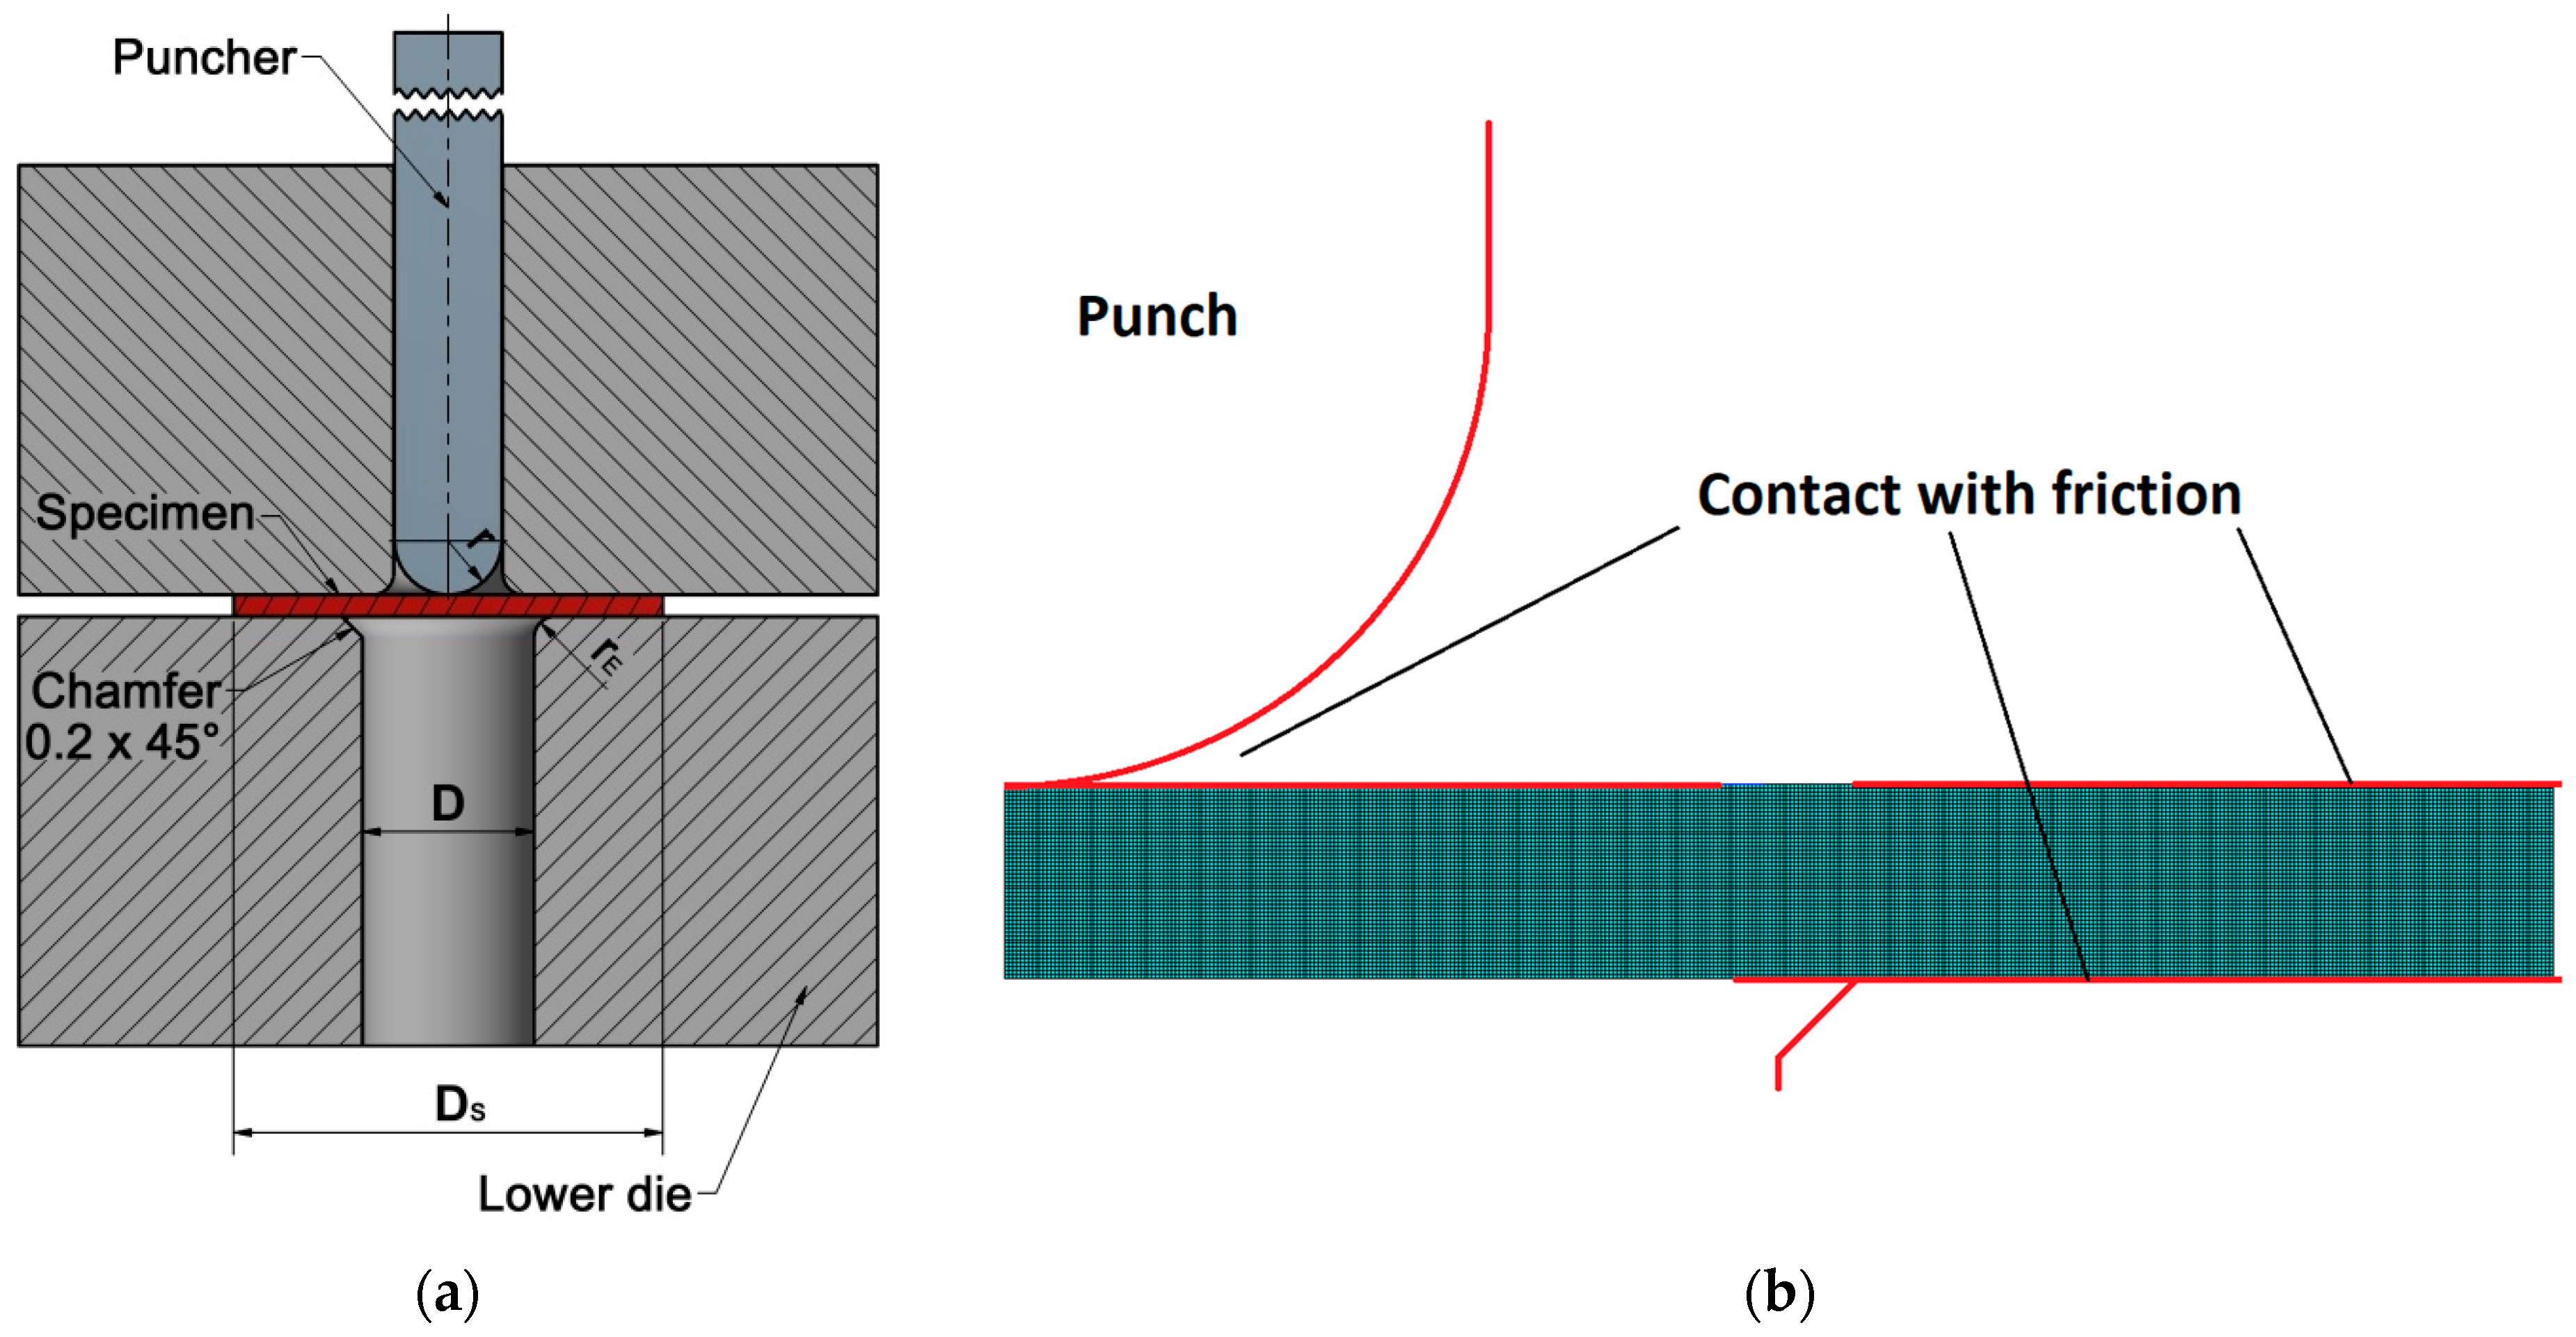
The basic geometry of a SP set-up is shown in Figure 2. The geometrical parameters are listed in Table 1. For h = 0.5   m m , this parameter set represents the default geometry according to the EN standard [6].
The finite element simulations were performed with an axisymmetric model including contact and friction. The commercial code ANSYS® 2021.R1 was used. Axisymmetric elements with eight nodes, elastic–plastic material, and large deformation and finite strain capability were used for the SP specimen. The element size was 10 µm. The lower die, the punch, and the downholder were modeled by means of rigid lines interacting with the contact elements attached to the specimen surface. In [11], it was shown that the assumption of rigid punch and die has no significant effect on F ( u ) as compared to an elastic model of punch and die. The friction coefficient for the contact areas between disc and punch was µ = 0.2 . The SP disc was fully clamped; i.e., relative motion between the SP disc and lower die was prevented.
The plastic deformation was based on the following constitutive equation:
σ y ε p l = σ y 0 + r 1 α ε p l + 1 exp n ε p l
where σ is the true equivalent stress and ε p l the true plastic equivalent strain. σ y 0 , r 1 , α , and n are material parameters. The parameter α represents the ratio of linear and exponential hardening. In this study, α = 1 was chosen. The corresponding uniaxial engineering (nominal) stress–strain curve σ ¯ ( ε ¯ ) is obtained by the following:
ε ¯ t o = exp ε p l + ε e l 1 = exp ε p l + σ E 1 σ ¯ = σ / ( 1 + ε ¯ )
with E being the elasticity modulus. The overbar indicates engineering (nominal) values. An in-house fitting algorithm was used to determine σ y 0 , r 1 , and n from given values of R p 02 , R m , and A g t . The specimen plate was loaded by a stepwise increasing displacement of the punch, v , up to a final value of 1 mm. For the purpose of this investigation, larger displacements were not needed. Consequently, the constitutive equations do not include ductile damage, as this develops only at higher displacements [5]. In the postprocessing, two types of SP curves were generated: the force-displacement curve F ( v ) (reaction force at the pilot node of the punch versus punch displacement) and the force-deflection curve F ( u ) (reaction force at the pilot node of the punch versus the central bottom deflection of the plate). The difference between v and u equals the thickness reduction of the disc at the center.

2.2. Analytical Equations for the Linear Elastic Phase of the SP Test

The analytical description of plate bending is useful for the for determination of the initial slope of the load-deflection curve of a SP test. Figure 3 shows the relevant parameters of a fully clamped circular plate: a —plate radius ( D / 2 + r E ); p 0 —contact pressure between punch and SP specimen; b —radius of the contact area. The contact pressure is simplified, assumed to be independent of the radial position. This assumption is justified by the fact that the contact area is very small ( b 0.1   m m for F < 100   N ; cf. Equation (4) below).
The contact radius b is obtained by Hertzian contact theory [30]:
b = 3 F r 4 E 1 / 3             1 E = 1 ν 2 E + 1 ν p 2 E p = 1 E + 1 E p
with E ,   ν ,   E P ,   a n d   ν P being the elasticity modulus and Poisson ratio of the SP specimen and of the puncher, respectively. The indentation depth of the puncher into the SP specimen (without plate bending deflection) is given below:
y i n d = b 2 r = 3 F 4 E 2 / 3 r 1 / 3
According to Reissner’s plate theory, the linear-elastic solution for the central deflection of a fully clamped circular plate is given by the following [31,32,33]:
u = F a 2 64 π N 4 b a 2 3 4 ln b a + 16 5 1 ν h a 2 1 2 ln b a F = p 0 π b 2               N = E h 3 12 1 ν 2
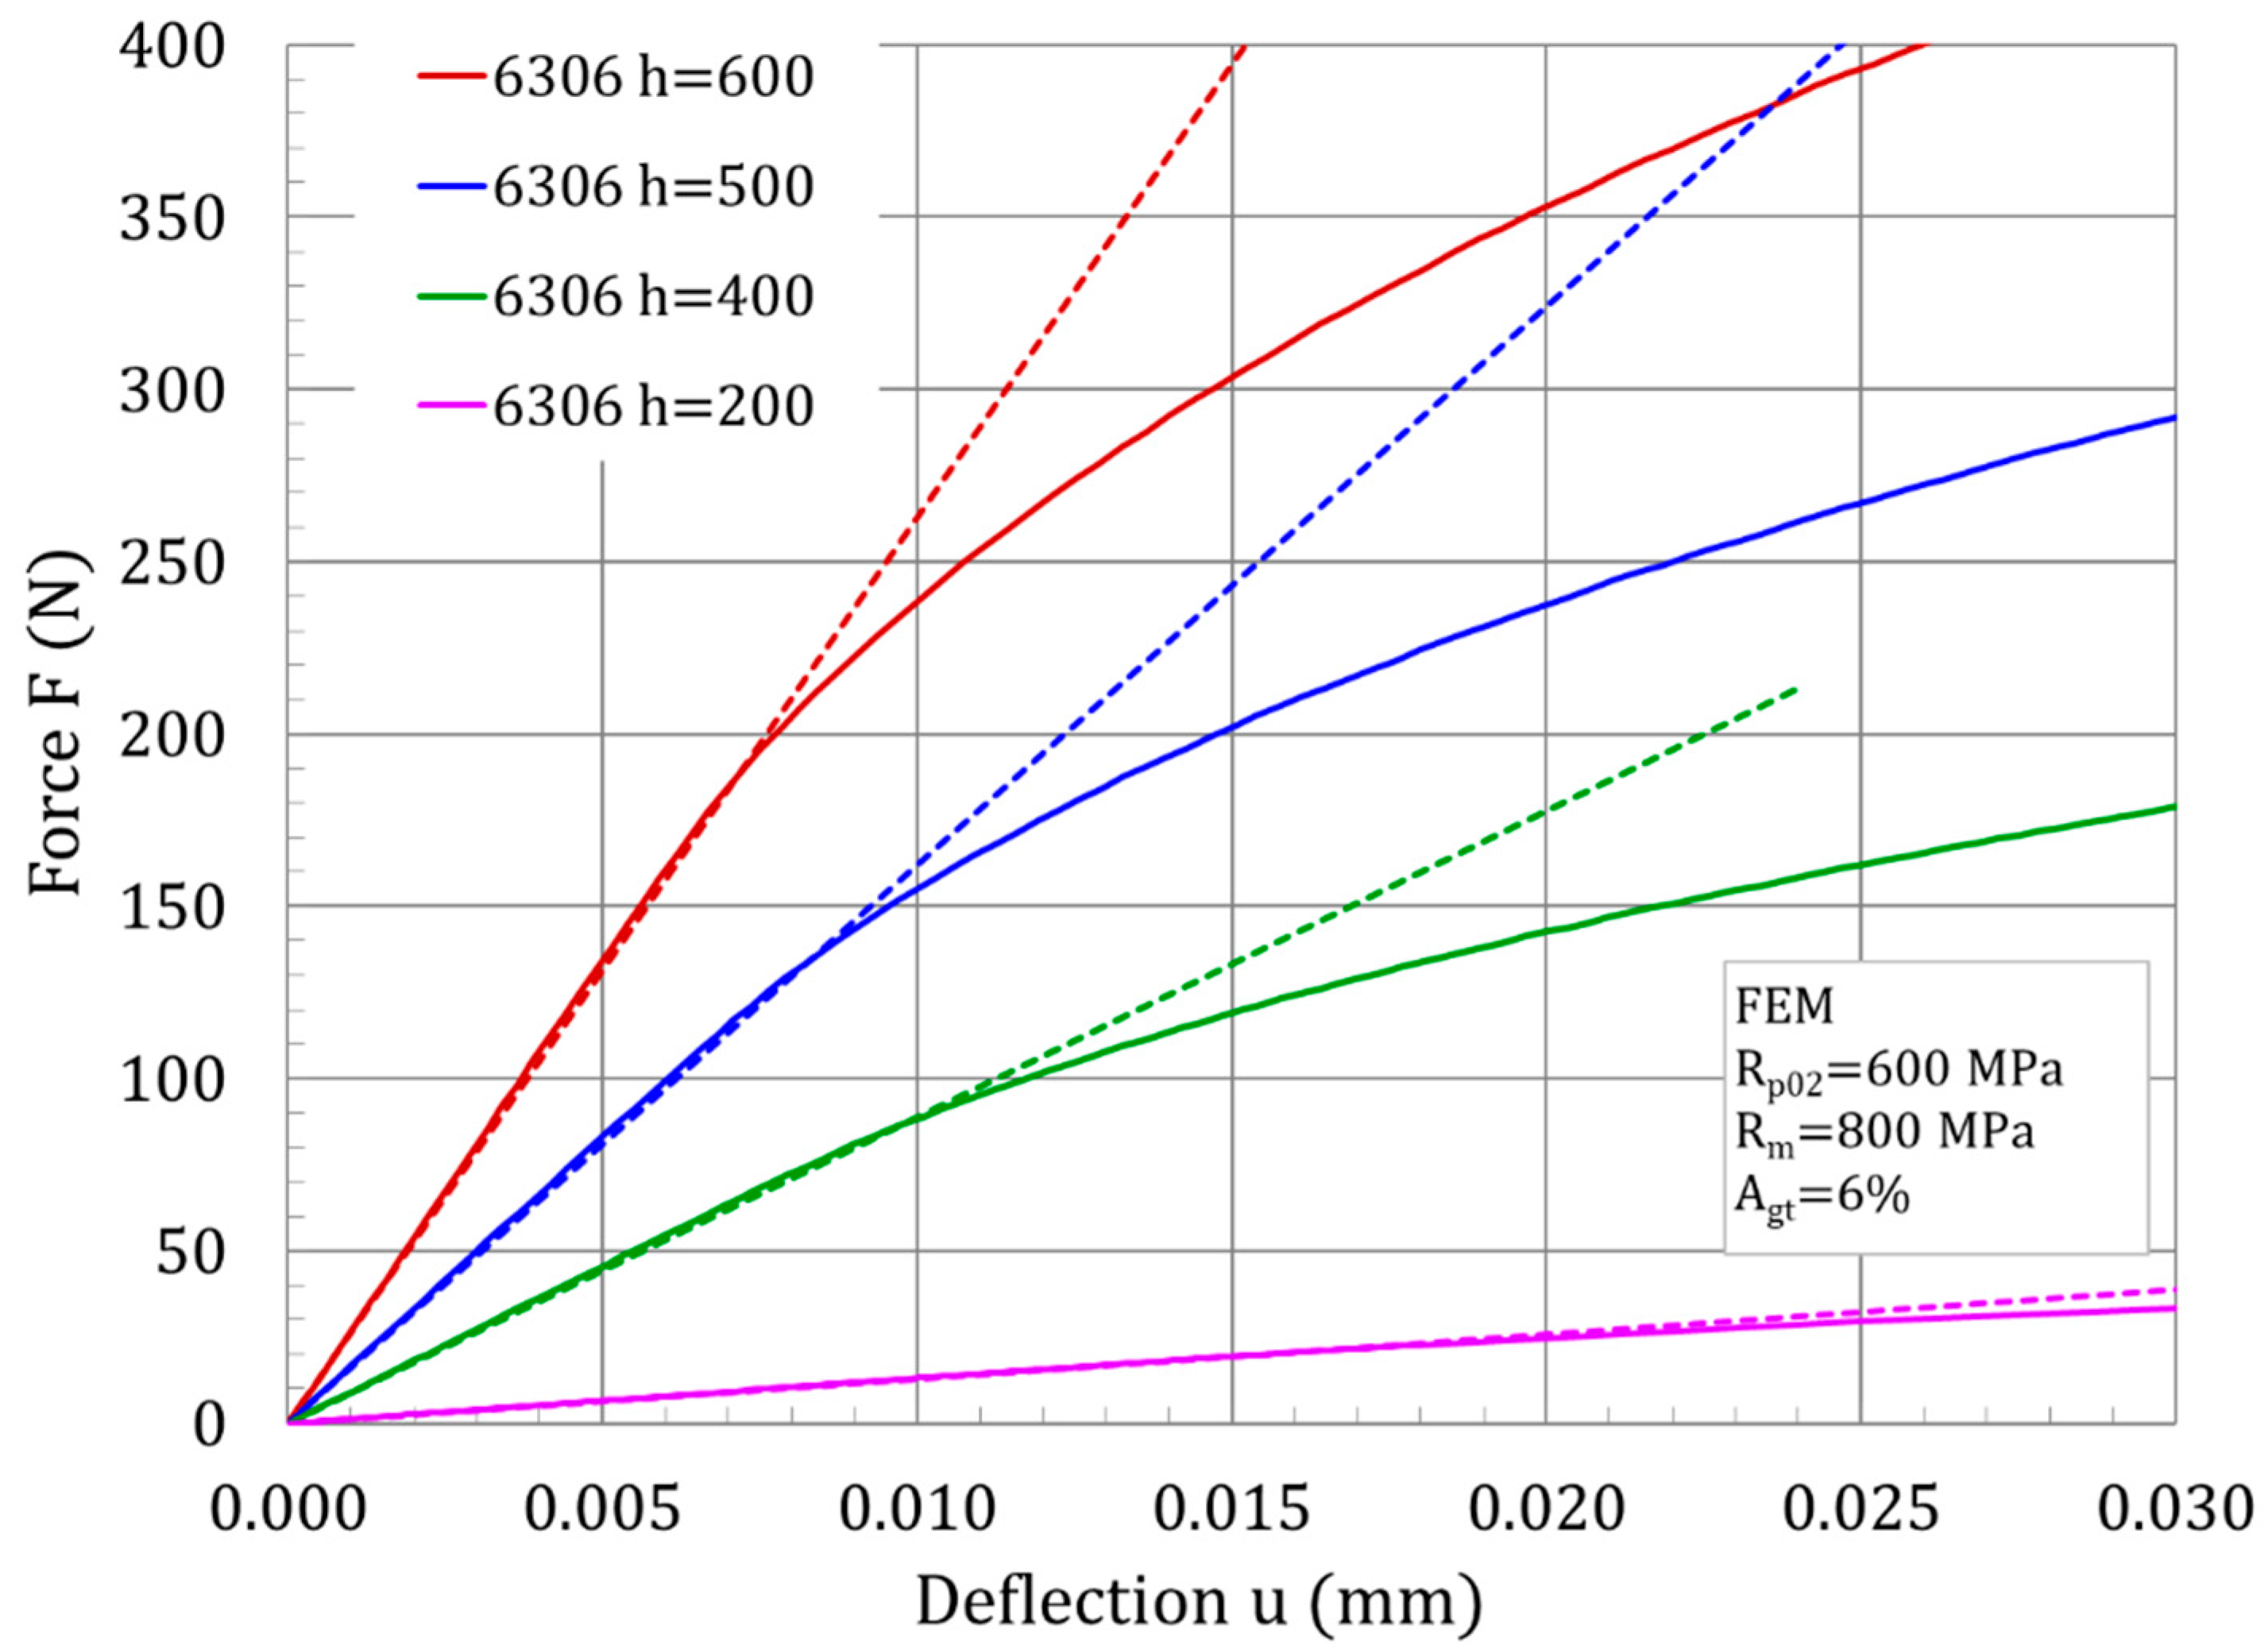
where h is the plate thickness and p 0 the contact pressure. The rightmost term accounts for the shear deformation of the plate. Despite of the consideration of the shear rotation of the cross section, Equation (6) relies on the assumption of thin plates, i.e., h < < a . Comparing FE calculations with Equation (6), it was found that the elastic slope is underestimated for higher thicknesses of the plate (see Figure 4).
It was concluded that the h / a dependence of shear term in Equation (6) has to be modified. A systematic variation of the shear term and comparison with elastic FE solutions for different plate thicknesses was performed. A very good approximation is obtained by the following equation (see also Figure 5):
u 0 = F a 2 64 π N 4 b a 2 3 4 ln b a + 1.0565 1 ν h a 4 / 3 1 2 ln b a
The modified elastic slope is defined as given below:
S e l = F u = 64 π N a 2 f b / a f b a = 4 b a 2 3 4 ln b a + 1.0565 1 ν h a 4 / 3 1 2 ln b a
The reference force for the elastic slope was chosen based on the plate stiffness as follows:
F a 2 N = u 0 , r e f = 0.01 a F r e f = 0.01 N a     F r e f h 3 / a
The combination of Equations (4) and (9) gives the following:
b F r e f = b r e f = E h 3 r 1600 E a 1 /   3
For the standard geometry with the parameters F r e f = 10.4   N , a = 2.2   m m , E = 200   G P a , E P = 565   G P a , ν = ν P = 0.3 , r = 1.25   m m , and h = 0.5   m m , one obtains the initial slope of the F ( u ) curve as S e l = 16.1   k N / m m . It has to be mentioned that the calculation of the contact radius and indentation depth by Equations (4) and (5) is a rigorous simplification. In contrast to this elastic approach, there is an immediate plastic deformation at the upper surface of the sample in the contact region, Section 3. Nevertheless, the deflection of the plate according to Equation (7) is rather insensitive to the contact radius b as long as b < < a holds. Therefore, the analytical calculation of the elastic slope works surprisingly well.

2.3. Systematic Variation of the Tensile Parameters and Specimen Thickness

A generic material behavior was used for the FE simulations. Three levels of YS (300, 600, and 900 MPa), and for each YS, three different yield ratios were applied to generate the stress–strain curves according to Equations (2) and (3). The uniform elongation was varied for the medium yield stress and yield ratio by A g t = 3 ,   6 ,   a n d   12 % and was kept constant at 6% otherwise. The range of these material properties is typical for various classes of steel. An iterative fitting algorithm was used to obtain the constitutive parameters σy0, r1, and n as used in Equation (2), Section 2.1, for a given set of R p 02 , R m , and A g t . The parameter variations are listed in Table 2. The nominal and true stress–strain curves for selected parameter combinations are shown in Figure 6.
In addition, FE simulations WERE executed with different thicknesses of the SP disc, in particular h = 200 ,   400 ,   500 ,   a n d   600   µ m . In order to discriminate the multitude of simulations, a simulation ID was defined as follows: xxxx-hy, where xxxx stands for the material code (see Table 2) and y for the thickness (2 for h = 200   µ m etc). For example, 6306-h4 refers to parameter set R p 02 = 600   M P a , R m = 800   M P a ,   A g t = 6 % ,   a n d   h = 400   µ m . In total, 20 simulations were carried out (see Section 3).

3. Results

Selected force-deflection curves for the chamfer geometry are shown in Figure 7. Both yield strength variation at constant yield ratio and variation of yield ratio at constant yield strength produce significant effects in the curves. While in the first case, an effect can be observed right at the onset of plastic deformation, the curves start to deviate somewhat later in the latter case. In the right figure, the range of transition forces F e   (obtained by the currently used bi-linear fit; see Figure 1) is indicated. From this it becomes clear that the plastic deformation in the sample is already well advanced when the deflection u A is reached.
These results straightforwardly suggest a modified definition of the elastic–plastic transition force. A disjunctive combination of the horizontal and the vertical distance of F ( u ) from the elastic slope is proposed:
u F > F S e l + a 1100 F ( u ) < S e l u a 2200
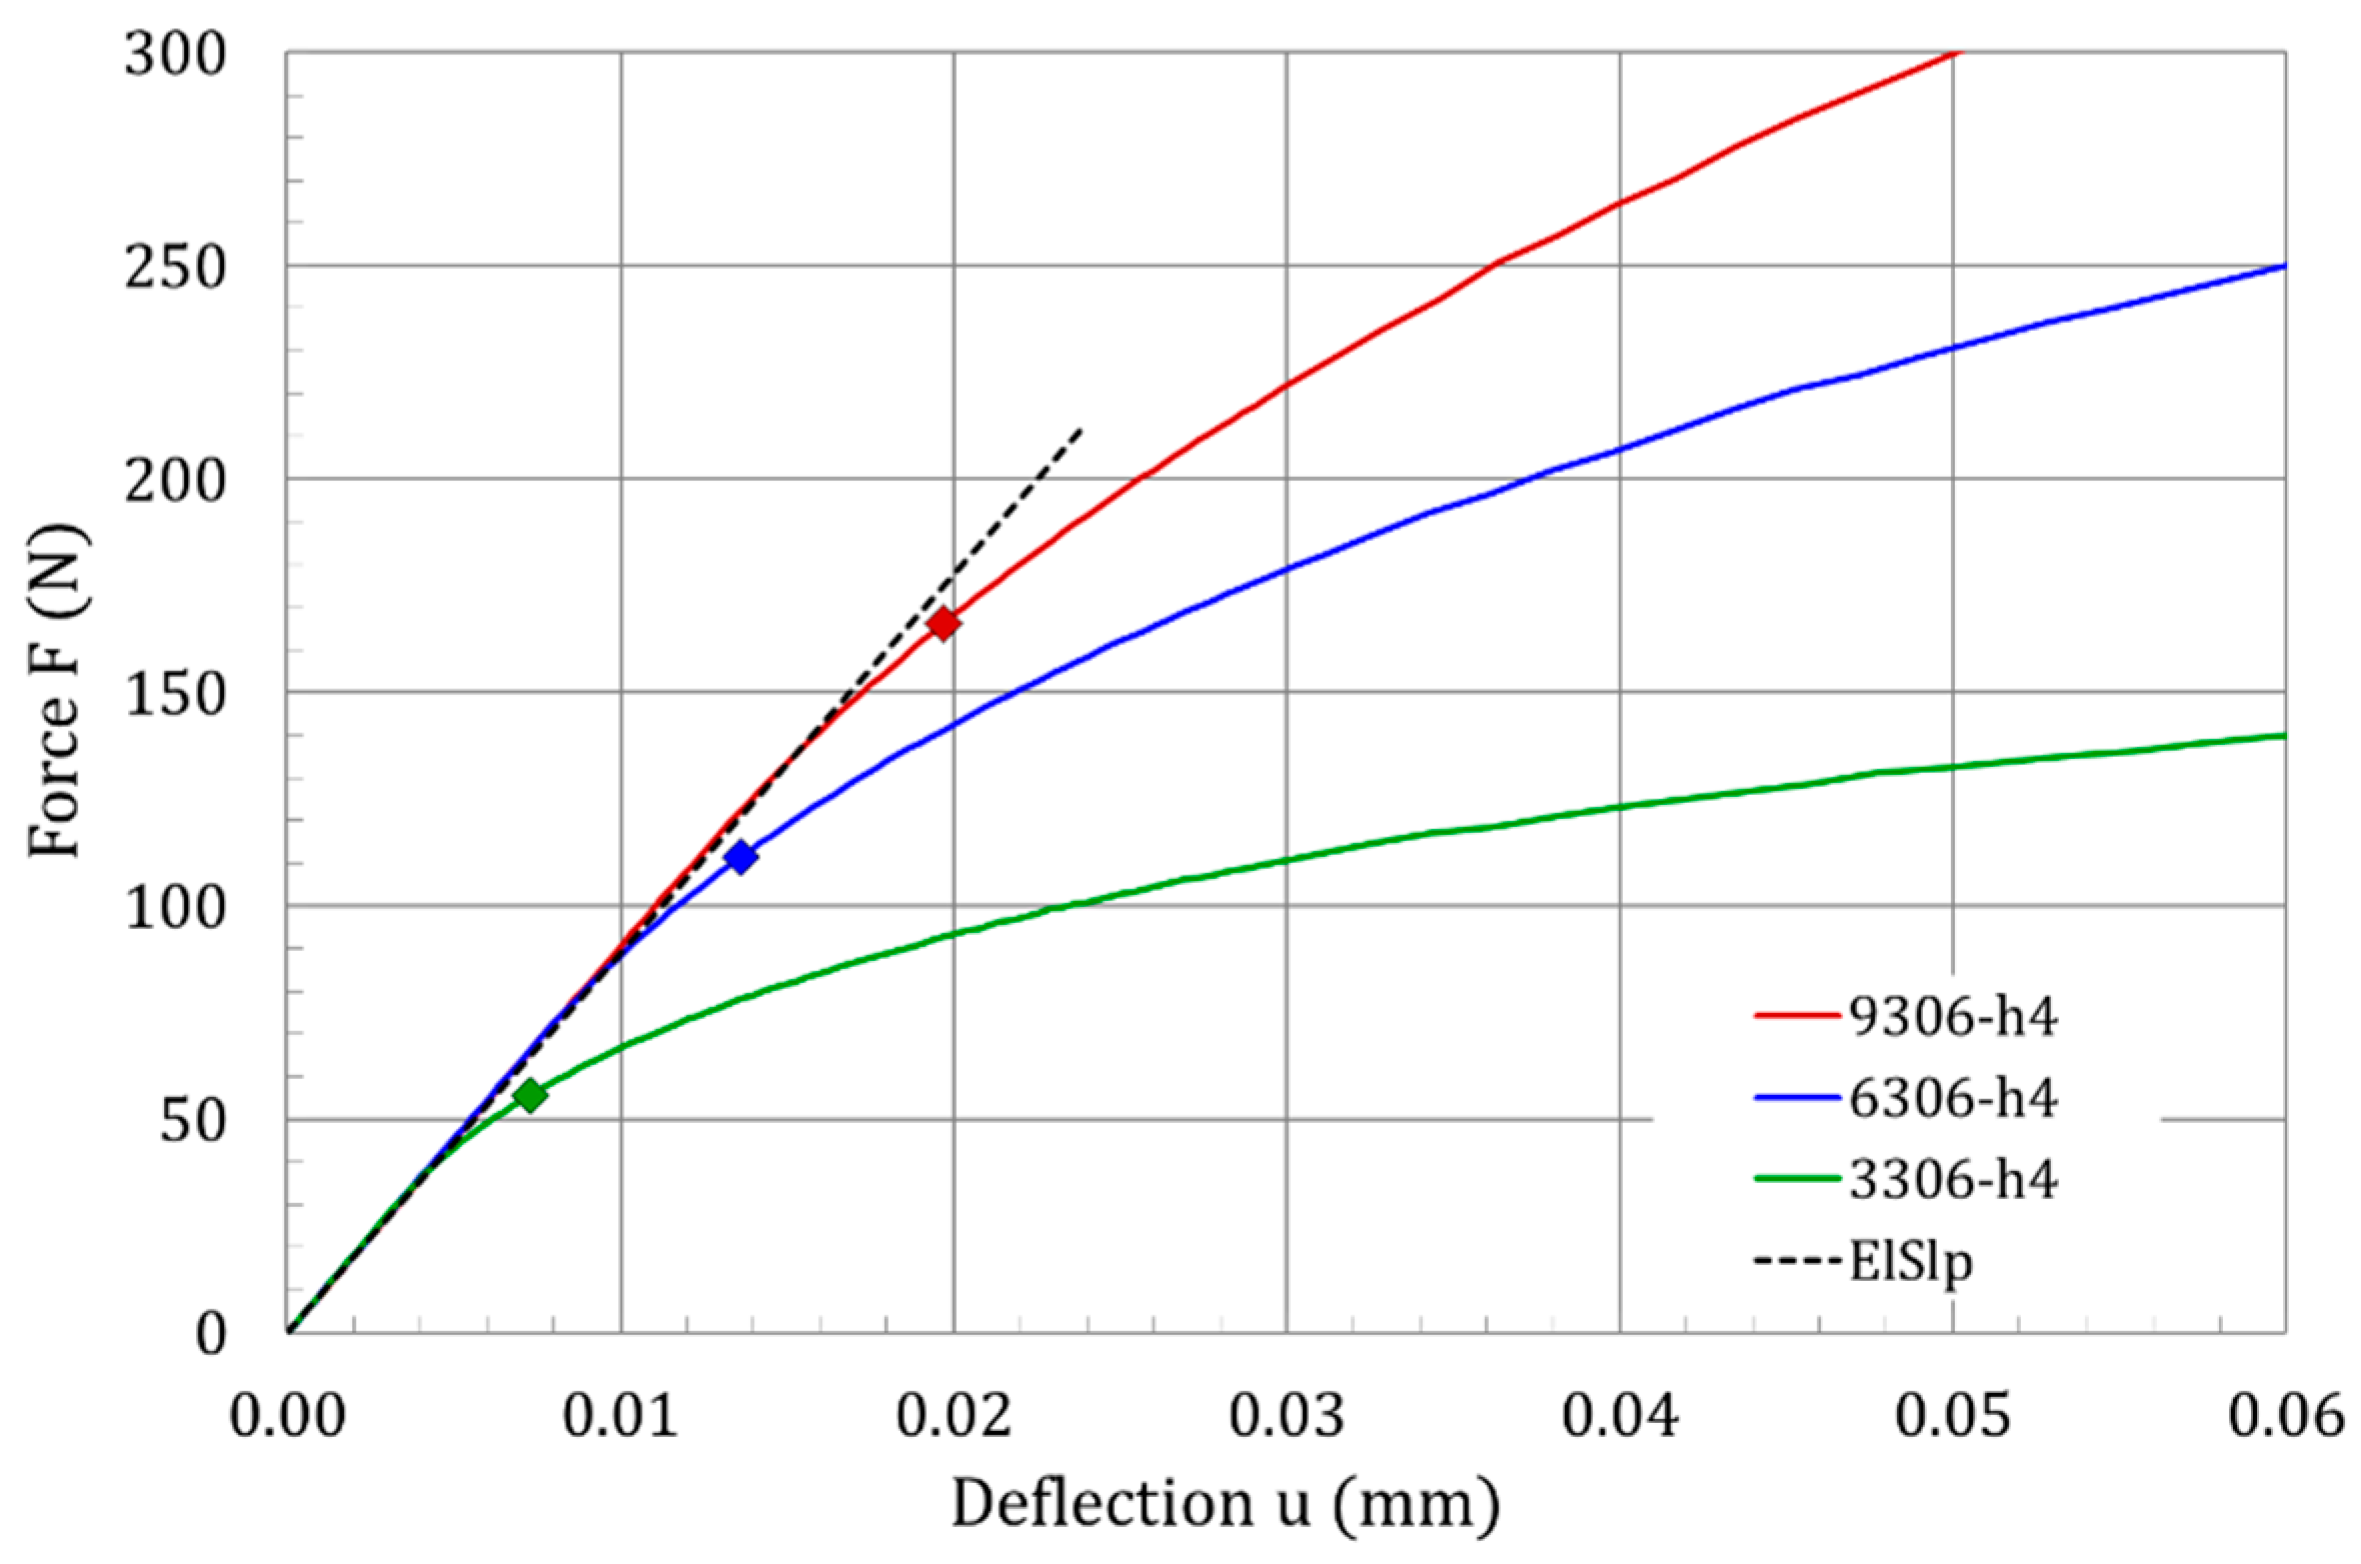
with S e l being the elastic slope as defined in Equation (8). The first fulfilment of Equation (11), whichever criterion is reached earlier, marks the modified transition force F y . An example of this procedure is shown in Figure 8.
It should be mentioned that the agreement of the analytical elastic slope and the very first stage of the FE solution only exists for the force-deflection curve F u and not for the force-displacement curve F v . This is due to the indentation process between punch and upper specimen surface, which takes place immediately after the contact (see Figure 9). Therefore, the proposed transition force F y can only be determined from F ( u ) measurements and not from F ( v ) .
A summary of all simulation results is listed in Table 3. Both methods for the evaluation are included ( F e based on bi-linear fitting [6] vs. F y based on Equations (4), (5) and (8)–(11)).
The resulting correlation factors for the yield strength are obtained from the following (see also Equation (1)):
β Y S ( F e , F y ) = R p 02 h 2 ( F e , F y )

4. Discussion

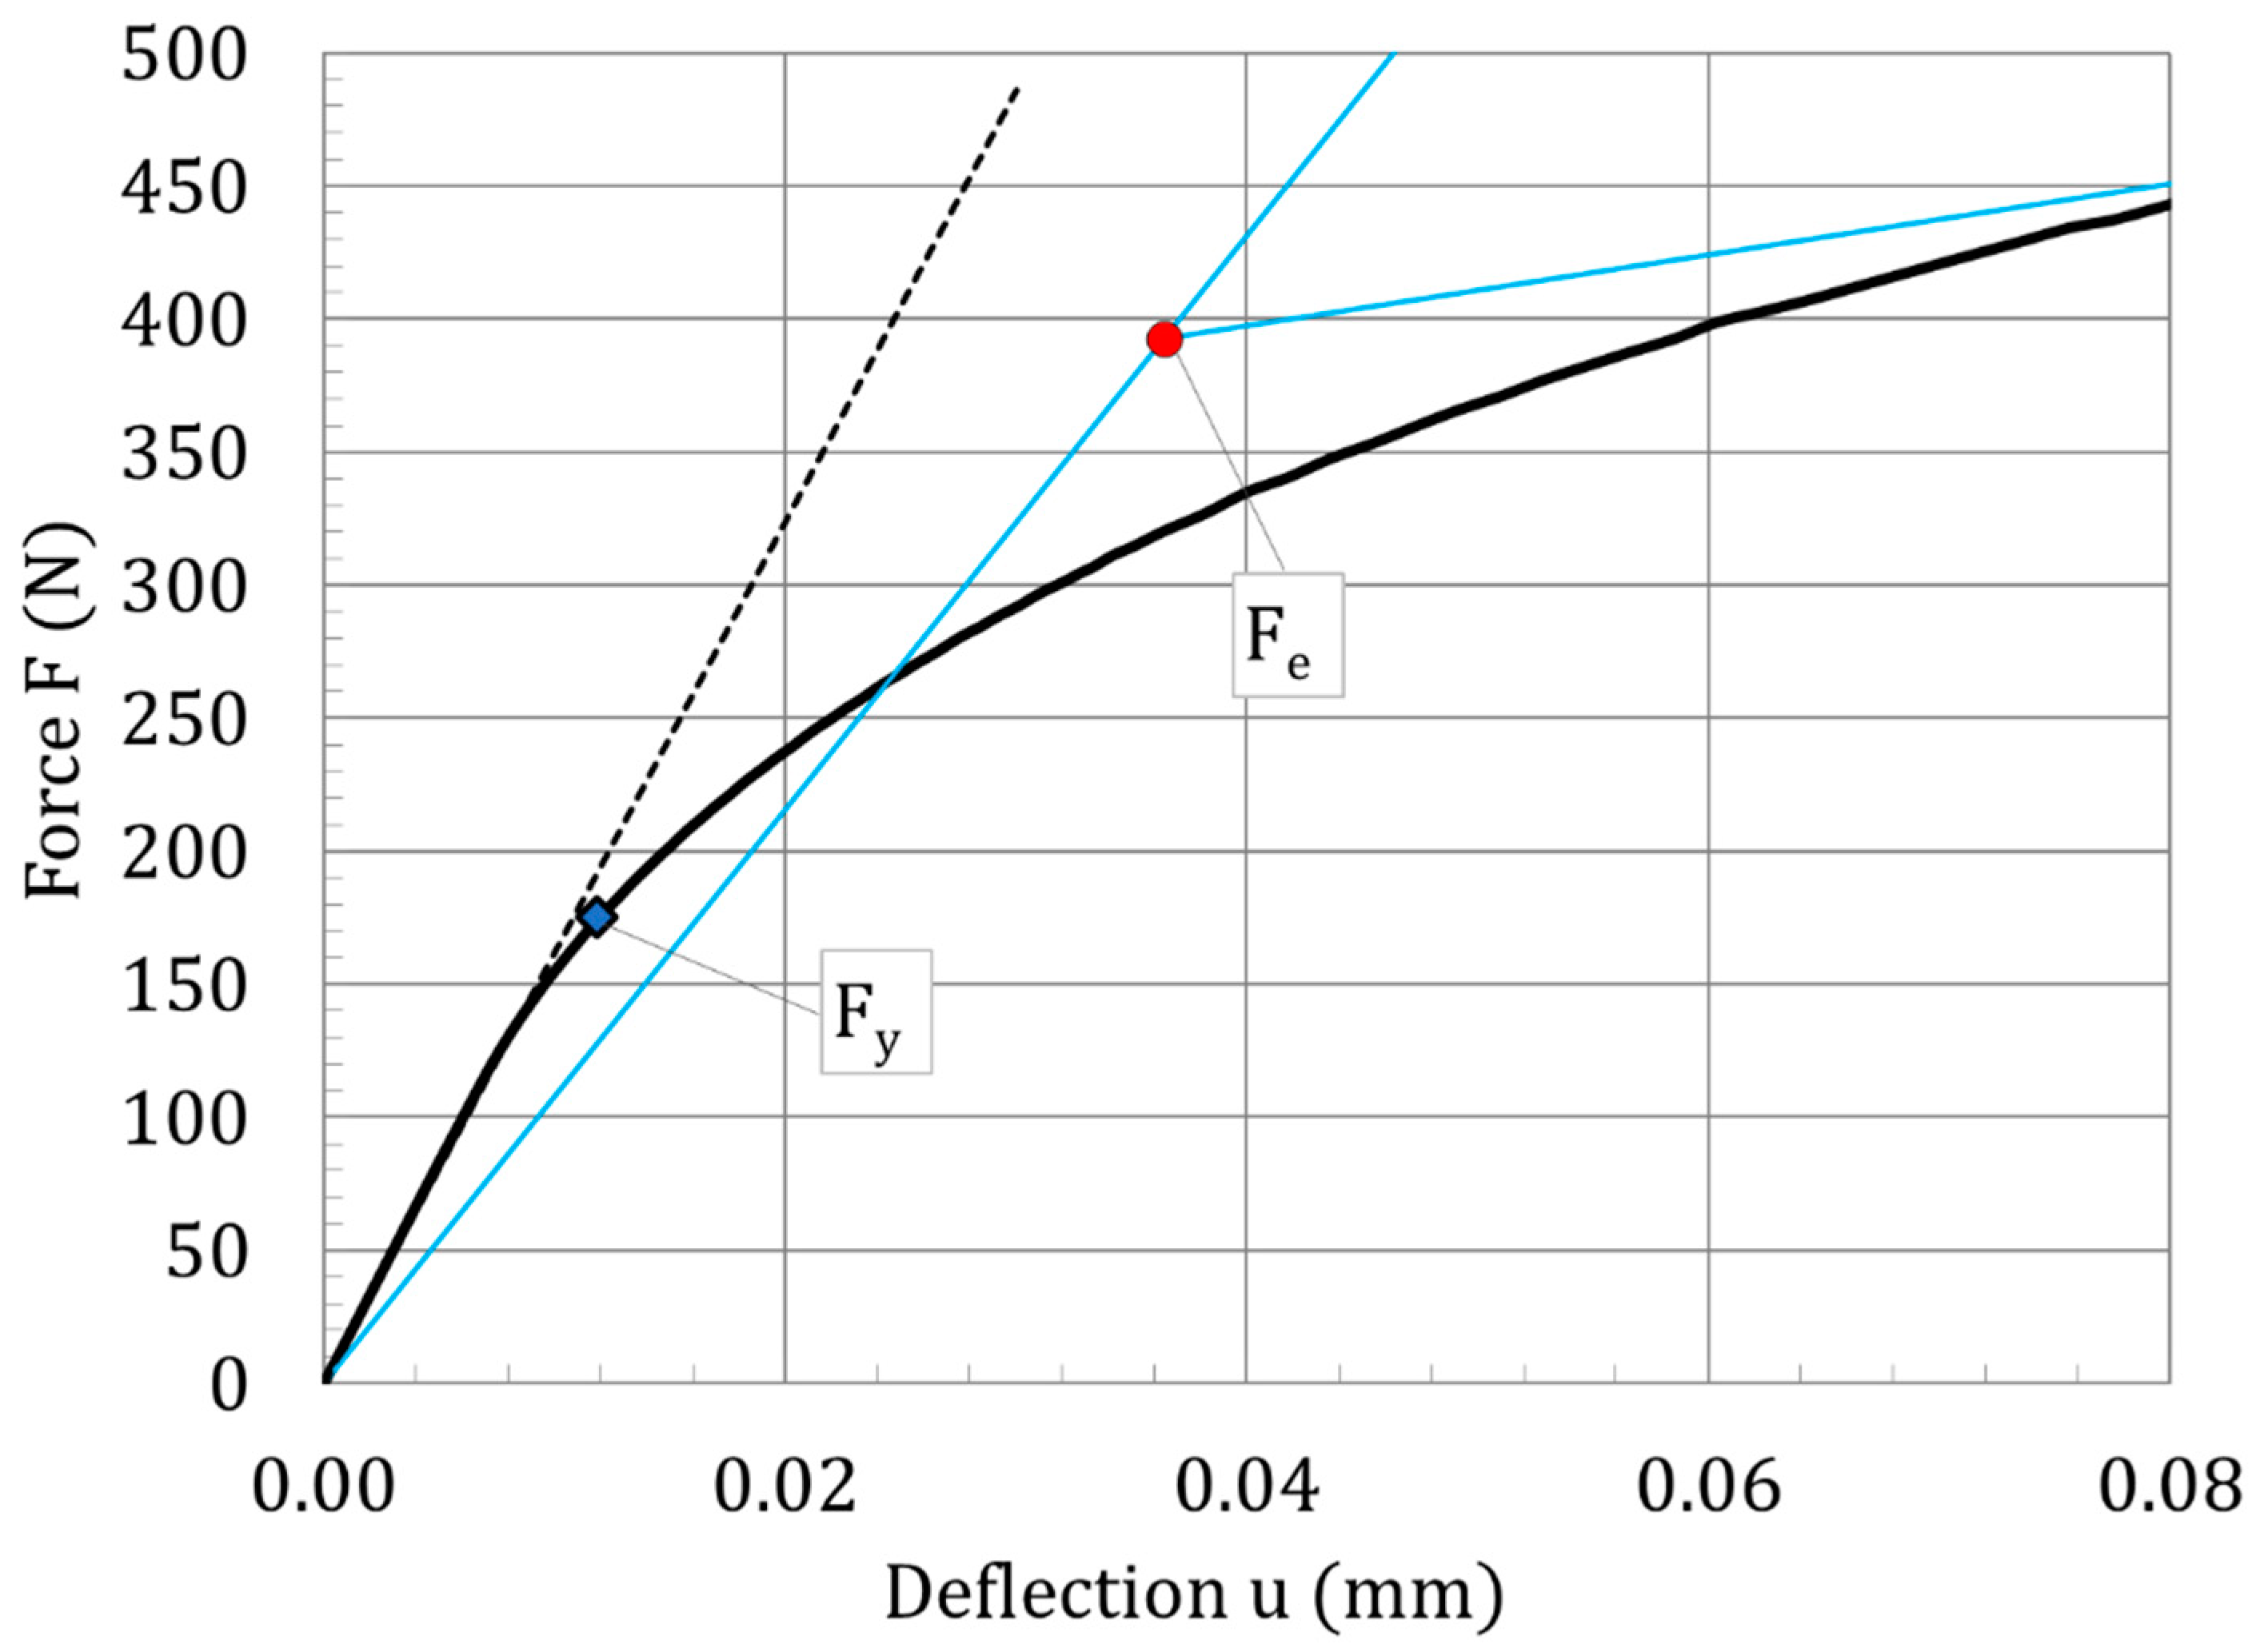
The modified transition force F y is essentially different from the one obtained from bilinear fitting, F e (see Section 1). As shown in Figure 10, F y is associated with a significantly earlier stage of the SP test as compared to F e . Therefore, it can be expected that F y is mainly governed by the onset of plastic flow. In contrast, F e is significantly affected by the work hardening of the material and thus less representative for the onset of plastic flow.
This reasoning is underpinned by the plastic strain fields associated with F y and F e , respectively. The equivalent plastic strain is shown in Figure 11.
In Table 4, the simulation results, as listed in Table 3, are analyzed from a statistical point of view. Various datasets are selected, and for each selection, the average correlation factors β ¯ Y S are listed along with their coefficients of variation c V (standard deviation divided by mean value).
From these data, it is obvious that the scatter of the correlation factor values obtained by the F e approach is significantly larger as compared to the new F y approach. Therefore, it can be expected that the estimation of the yield strength based on F y is more precise. Moreover, the F e -based correlation factor exhibits a significant dependence on the sample thickness. This effect is much less pronounced in the F y -based correlation factor. This is understandable, as the estimation of the elastic slope S e l (Section 2.2) explicitly considers the sample geometry, in particular the sample thickness in relation to the plate diameter ( h / a ) and the punch radius r . In conclusion, β Y S F e is to a much larger extent dependent on the geometry and the flow properties of the material. On the other hand, the β Y S F y correlation factor can be used for different geometrical set-ups, e.g., the so-called TEM geometry ( r = 0.5   m m , D = 1.75   m m , h = 250   µ m ), which is also mentioned in [6]. For this geometry and material code 6306, one obtains the following transition forces and correlation factors (Table 5):
The correlation coefficient β Y S F y agrees well with the one obtained for the standard geometry.

5. Conclusions

The effect of flow properties and SP geometry on the lower range of the force-deflection curve F ( u ) was analyzed by a systematic finite element study. Reissner’s plate theory was employed to develop an analytical set of equations for the elastic slope of the force-deflection curve. A correction of the shear term was proposed. The results can be summarized as follows:
  • The analytical elastic slope agrees very well with the finite element simulation;
  • A modified elastic–plastic transition force F y was proposed for the empirical yield strength correlation, which provides a significantly reduced uncertainty as compared to the elastic–plastic transition force F e defined in the European standard;
  • With the new definition of F y (Equation (11)), the yield strength correlation is widely independent of the SP geometry and the flow properties of the material.
The presented work provides an improvement for the estimation of the yield strength from force-deflection curves of small punch tests through a significant reduction of uncertainties and a better independence of the small punch geometry. At the same time, the procedure is kept as simple as possible for practical application. The new definition of the elastic–plastic transition force can be considered in future revisions of the related standard EN-10371 [6].

Funding

This research received no external funding.

Data Availability Statement

The data were published on the data repository RODARE of Helmholtz-Zentrum Dresden–Rossendorf, DOI: 10.14278/rodare.2501.

Acknowledgments

The work contributes to the Joint Programme on Nuclear Materials (JPNM) within the European Energy Research Alliance (EERA). The work is also an in-kind contribution to the H2020-Euratom project FRACTESUS (grant agreement no. 900014).

Conflicts of Interest

The author declares no conflict of interest.

Abbreviations

a Effective lower die radius
A g t Total uniform strain (nominal strain at σ ¯ = R m )
b Radius of the contact area between punch and specimen
b r e f Contact radius associated with the reference force
c V Coefficient of variation (standard deviation divided by average)
D Diameter of lower die receiving hole
E Elasticity modulus
F Punch force
F e Elastic–plastic transition force
F r e f Reference force for the analytical calculation of the elastic slope
F y Modified elastic–plastic transition force
FEFinite element
h Specimens thickness
n Hardening exponent of the true stress–plastic strain curve
N Plate stiffness
r Puncher radius
r 1 Parameter of the true stress–plastic strain curve
R p 02 Yield strength
R m Ultimate tensile strength
S e l Elastic slope of the small punch plate (analytical calculation)
SPSmall punch
UTSUltimate tensile strength
u Central deflection at the specimen bottom (opposite to punch tip)
v Punch tip displacement
y i n d Indentation depth of the punch as calculated by Hertzian contact theory
YSYield strength
β Y S Empirical factor for the estimation of yield stress
ε True strain
ε ¯ Nominal strain
ν Poisson’s ratio
σ True stress
σ ¯ Nominal stress
σ y 0 Elasticity limit, true initial flow stress

References

  1. Kameda, J. A kinetic model for ductile-brittle fracture mode transition behavior. Acta Metall. 1986, 34, 2391–2398. [Google Scholar] [CrossRef]
  2. Misawa, T.; Adachi, T.; Saito, M.; Hamaguchi, Y. Small punch tests for evaluating ductile-brittle transition behavior of irradiated ferritic steels. J. Nucl. Mater. 1987, 150, 194–202. [Google Scholar] [CrossRef]
  3. Abendroth, M.; Kuna, M. Identification of ductile damage and fracture parameters from the small punch test using neural networks. Eng. Fract. Mech. 2006, 73, 710–725. [Google Scholar] [CrossRef]
  4. Melkior, T.; Terentyev, D.; Chang, C.; Bakaev, A.; Holmström, S.; Lebediev, S.; Paputsia, A. Mechanical properties of structural metallic alloys for nuclear applications deduced by small punch test. J. Nucl. Mater. 2023, 583, 154521. [Google Scholar] [CrossRef]
  5. Shen, Y.; Lv, S.; Zhou, Q.; Shi, L.; Sun, L.; Li, Z. Microstructure Characterization and Small Punch Test Analysis in Nickel-Based Alloy 617 by High Energy Neon Implantation. Metals 2022, 12, 438. [Google Scholar] [CrossRef]
  6. EN Standard EN-10371; Small Punch Test Method for Metallic Materials. European Committee for Standardization: Brussels, Belgium, 2021.
  7. Altstadt, E.; Bergner, F.; Houska, M. Use of the small punch test for the estimation of ductile-to-brittle transition temperature shift of irradiated steels. Nucl. Mater. Energy 2021, 26, 100918. [Google Scholar] [CrossRef]
  8. Calaf Chica, J.; Bravo Díez, P.; Preciado Calzada, M. A New Prediction Method for the Ultimate Tensile Strength of Steel Alloys with Small Punch Test. Materials 2018, 11, 1491. [Google Scholar] [CrossRef]
  9. Calaf Chica, J.; Bravo Díez, P.M.; Preciado Calzada, M. Development of an improved prediction method for the yield strength of steel alloys in the Small Punch Test. Mater. Des. 2018, 148, 153–166. [Google Scholar] [CrossRef]
  10. Holmström, S.; Simonovski, I.; Baraldi, D.; Bruchhausen, M.; Altstadt, E.; Delville, R. Developments in the estimation of tensile strength by small punch testing. Theor. Appl. Fract. Mech. 2019, 101, 25–34. [Google Scholar] [CrossRef]
  11. Altstadt, E.; Houska, M.; Simonovski, I.; Bruchhausen, M.; Holmström, S.; Lacalle, R. On the estimation of ultimate tensile stress from small punch testing. Int. J. Mech. Sci. 2018, 136, 85–93. [Google Scholar] [CrossRef]
  12. Campitelli, E.N.; Spätig, P.; Bonadé, R.; Hoffelner, W.; Victoria, M. Assessment of the constitutive properties from small ball punch test: Experiment and modeling. J. Nucl. Mater. 2004, 335, 366–378. [Google Scholar] [CrossRef]
  13. Lacalle, R.; Andrés, D.; Álvarez, J.A.; Gutiérrez-Solana, F. Transition Region of Nuclear Vessel Steels: Master Curve Approach Using Small Punch Notched Specimens. Key Eng. Mater. 2017, 734, 77–86. [Google Scholar] [CrossRef]
  14. Andres, D.; Lacalle, R.; Cicero, S.; Alvarez, J.A. Application of the small punch test in combination with the master curve approach for the characterisation of the ductile to brittle transition region. J. Nucl. Mater. 2019, 518, 409–418. [Google Scholar] [CrossRef]
  15. Holmström, S.; Li, Y.; Dymacek, P.; Vacchieri, E.; Jeffs, S.P.; Lancaster, R.J.; Omacht, D.; Kubon, Z.; Anelli, E.; Rantala, J.; et al. Creep strength and minimum strain rate estimation from Small Punch Creep tests. Mater. Sci. Eng. A 2018, 731, 161–172. [Google Scholar] [CrossRef]
  16. Vivas, J.; Capdevila, C.; Altstadt, E.; Houska, M.; Sabirov, I.; San-Martín, D. Microstructural Degradation and Creep Fracture Behavior of Conventionally and Thermomechanically Treated 9% Chromium Heat Resistant Steel. Met. Mater. Int. 2019, 25, 343–352. [Google Scholar] [CrossRef]
  17. Vivas, J.; Capdevila, C.; Altstadt, E.; Houska, M.; San-Martín, D. Importance of austenitization temperature and ausforming on creep strength in 9Cr ferritic/martensitic steel. Scr. Mater. 2018, 153, 14–18. [Google Scholar] [CrossRef]
  18. Dymáček, P.; Jarý, M.; Dobeš, F.; Kloc, L. Tensile and Creep Testing of Sanicro 25 Using Miniature Specimens. Materials 2018, 11, 142. [Google Scholar] [CrossRef] [PubMed]
  19. Peng, J.; Gao, M.; Zhang, H.; Geng, X.; Liu, X.; Pan, H. Small punch creep test reveals the differences of high-temperature creep behaviours for laser powder bed fusion and Rolled Inconel 718 alloys. Mater. Sci. Eng. A 2023, 886, 145698. [Google Scholar] [CrossRef]
  20. Huang, Y.; Kadowaki, M.; Nakano, T.; Kumada, K.; Watanabe, S.; Kawada, T.; Sato, K. Creep constitutive law prediction via short-term evaluation using a small size testing method. Energy Rep. 2023, 10, 1126–1134. [Google Scholar] [CrossRef]
  21. Hermanová, Š.; Kuboň, Z.; Čížek, P.; Kosňovská, J.; Rožnovská, G.; Dorazil, O.; Cieslarová, M. Study of Material Properties and Creep Behavior of a Large Block of AISI 316L Steel Produced by SLM Technology. Metals 2022, 12, 1283. [Google Scholar] [CrossRef]
  22. Tian, X.; Zhang, S.; Xu, H.; Li, T.; Yang, B.; Zhang, M. Assessment of Creep Properties Using Small Punch Test for a 9%Cr-Mo-Co-B Power Plant Steel. Metals 2021, 11, 1996. [Google Scholar] [CrossRef]
  23. Pan, H.; Peng, J.; Geng, X.; Gao, M.; Miao, X. Prediction of mechanical properties for typical pressure vessel steels by small punch test combined with machine learning. Int. J. Press. Vessels Pip. 2023, 206, 105060. [Google Scholar] [CrossRef]
  24. Zhong, J.; He, Z.; Guan, K.; Jiang, T. Investigation on regression model for the force of small punch test using machine learning. Int. J. Press. Vessels Pip. 2023, 206, 105031. [Google Scholar] [CrossRef]
  25. Kameda, J.; Mao, X. Small-punch and TEM-disc testing techniques and their application to characterization of radiation damage. J. Mater. Sci. 1992, 27, 983–989. [Google Scholar] [CrossRef]
  26. Bruchhausen, M.; Austin, T.; Holmström, S.; Altstadt, E.; Dymacek, P.; Jeffs, S.; Lancaster, R.; Lacalle, R.; Matocha, K.; Petzová, J. European Standard on Small Punch Testing of Metallic Materials; ASME: New York, NY, USA, 2017; p. V01AT01A065. [Google Scholar] [CrossRef]
  27. Altstadt, E.; Ge, H.E.; Kuksenko, V.; Serrano, M.; Houska, M.; Lasan, M.; Bruchhausen, M.; Lapetite, J.-M.; Dai, Y. Critical evaluation of the small punch test as a screening procedure for mechanical properties. J. Nucl. Mater. 2016, 472, 186–195. [Google Scholar] [CrossRef]
  28. Hähner, P.; Soyarslan, C.; Çakan, B.G.; Bargmann, S. Determining tensile yield stresses from Small Punch tests: A numerical-based scheme. Mater. Des. 2019, 182, 107974. [Google Scholar] [CrossRef]
  29. Zhong, J.; Song, M.; Guan, K.; Dymacek, P. Application of a database in the evaluation of strengths of Cr-Mo steels by means of small punch test. Int. J. Mech. Sci. 2020, 166, 105195. [Google Scholar] [CrossRef]
  30. Popov, V.L. Contact Mechanics and Friction: Physical Principles and Applications, English ed.; Springer: Heidelberg, Germany; New York, NY, USA, 2010. [Google Scholar]
  31. Mathiak, F.U. Ebene Flächentragwerke II—Grundlagen der Plattentheorie; Hochschule Neubrandenburg, Dept. Bauingenieur- und Vermessungswesen: Neubrandenburg, Germany, 2008. [Google Scholar]
  32. Reissner, E. On the Theory of Bending of Elastic Plates. J. Math. Phys. 1944, 23, 184–191. [Google Scholar] [CrossRef]
  33. Mindlin, R.D. Influence of Rotatory Inertia and Shear on Flexural Motions of Isotropic. Elastic Plates J. Appl. Mech. 1951, 18, 31–38. [Google Scholar] [CrossRef]
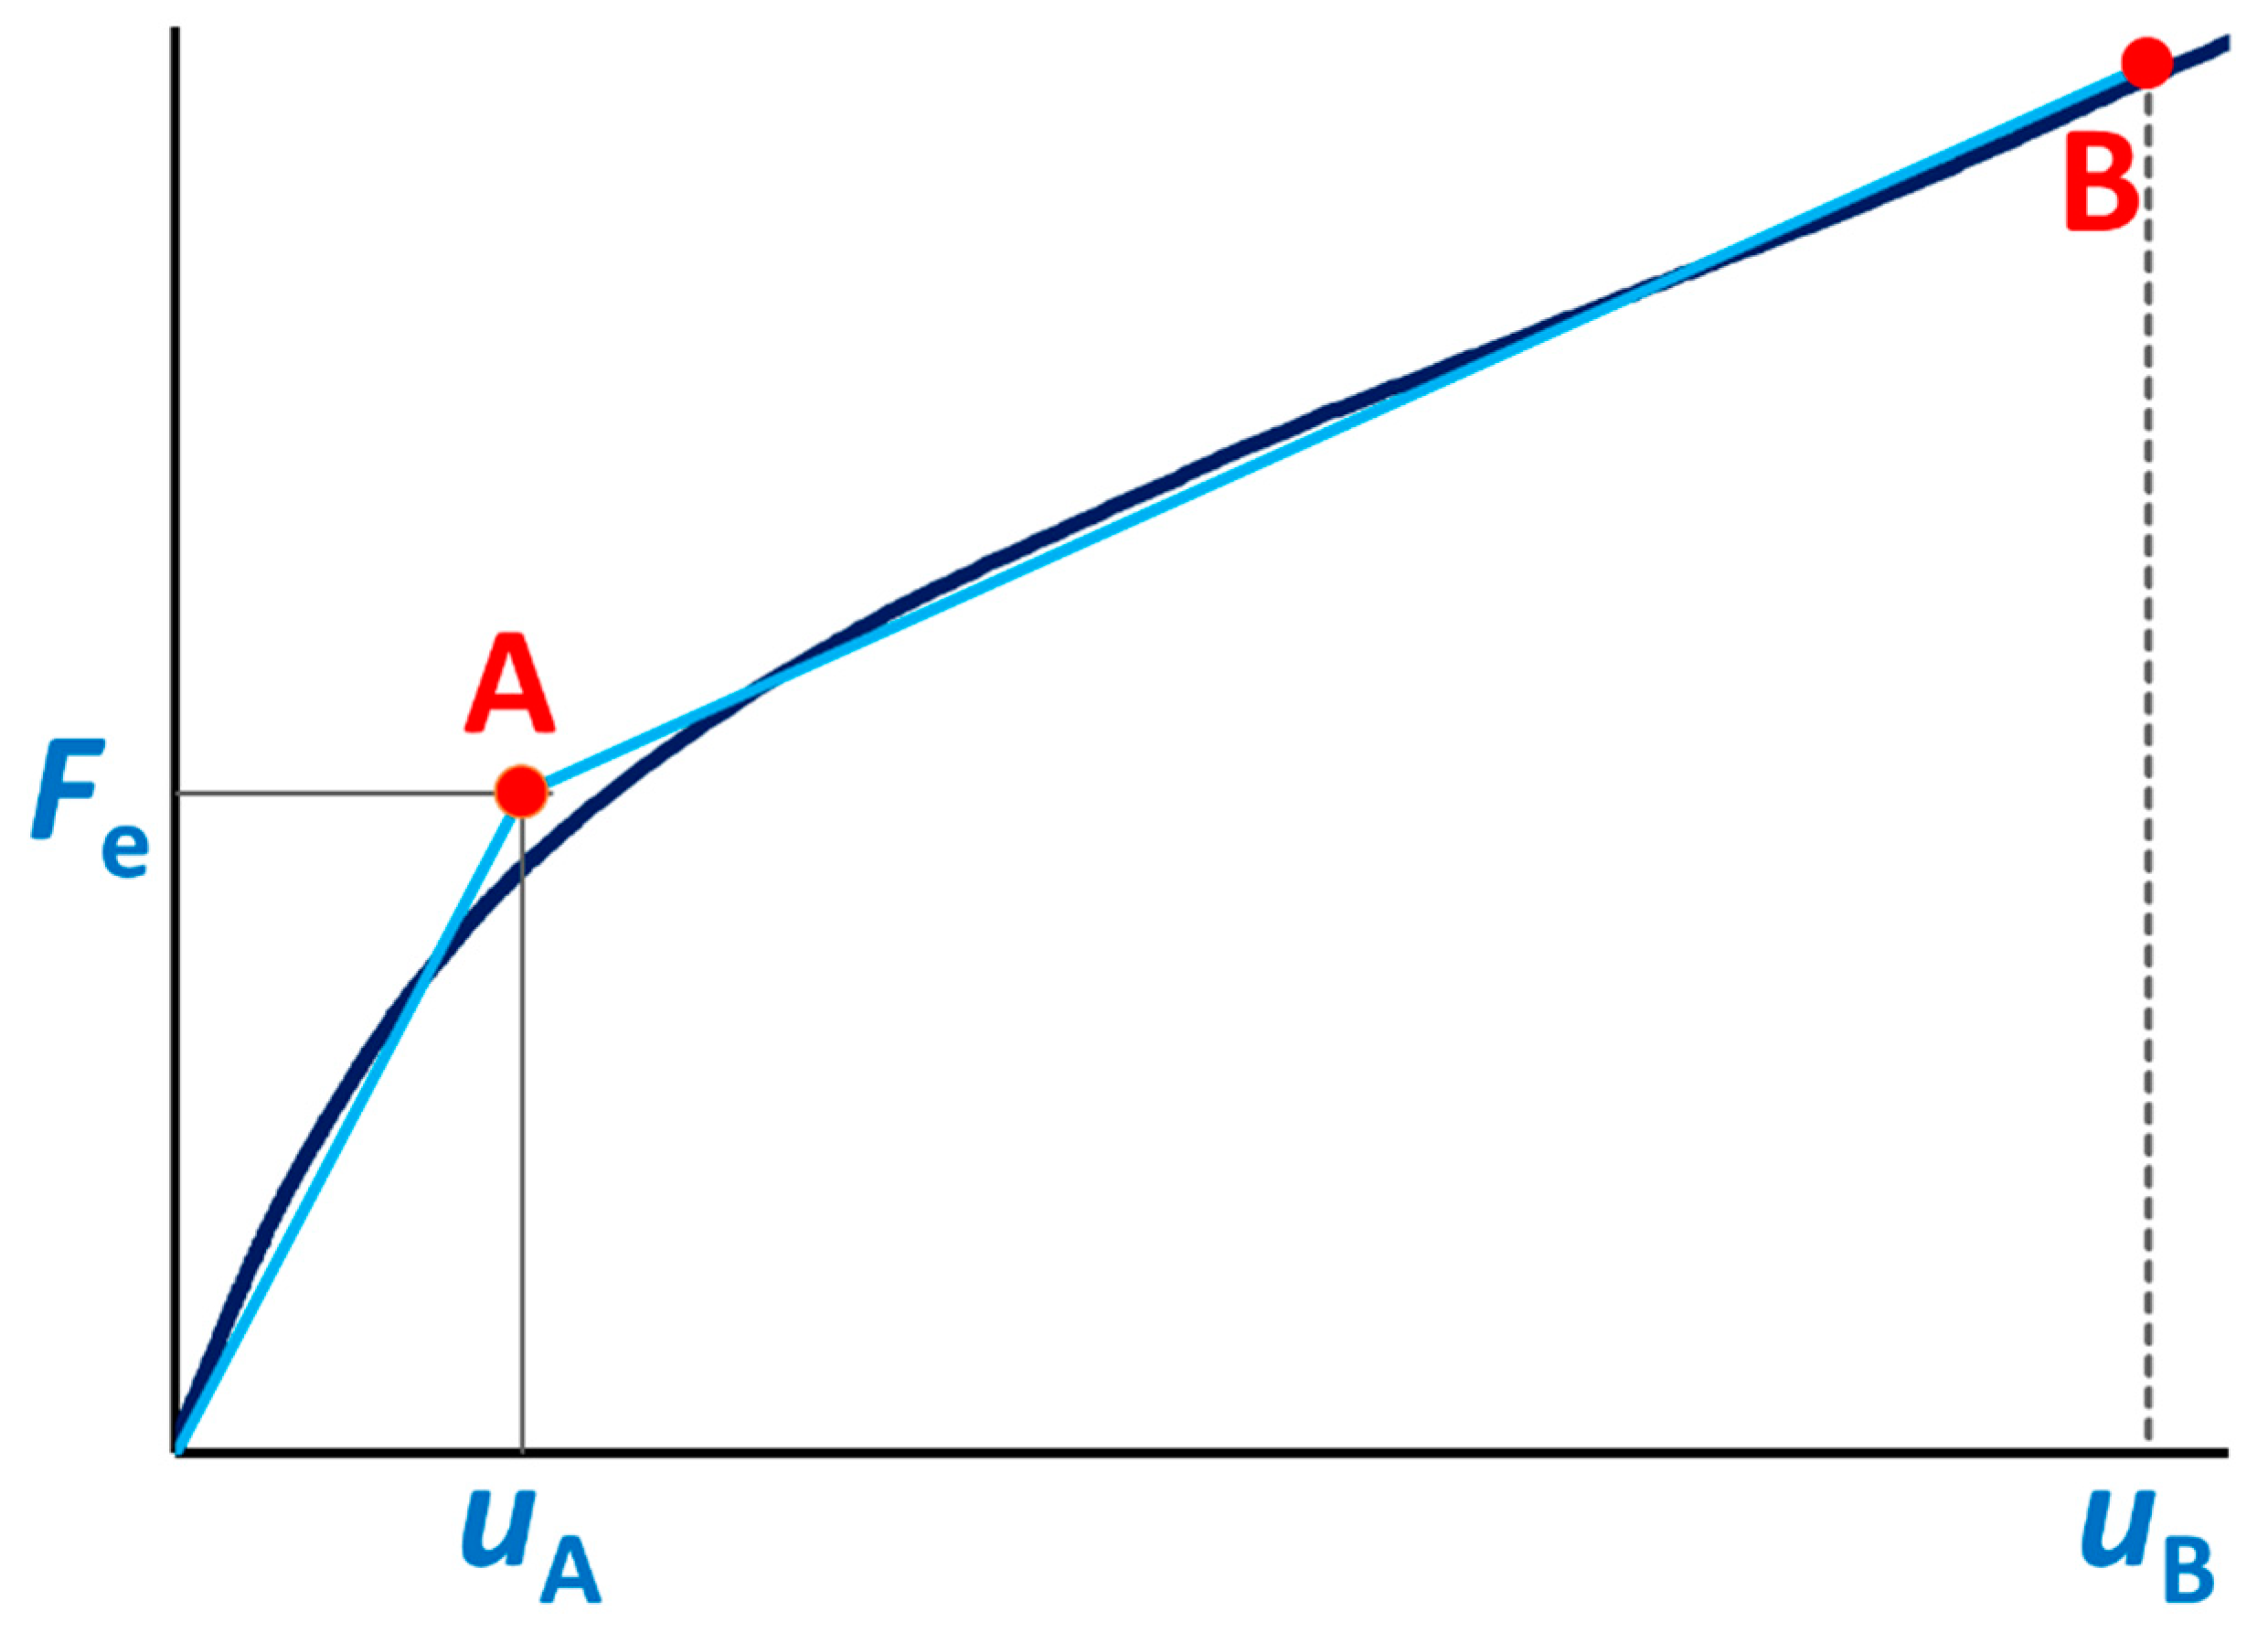
Figure 1. Bi-linear fit to obtain the transition force F e . The graph represents the early stage of the SP test ( u h ).
Metals 13 01716 g001
Figure 2. (a) Scheme of a SP test setup the edge of the receiving hole can either be a chamfer or a radius; (b) FE mesh (right).
Metals 13 01716 g002
Figure 3. Parameters of a circular plate model; figure not to scale.
Metals 13 01716 g003
Figure 4. Comparison of the F(u) slope according to Equation (6) (dashed lines) with FEM simulations for different sample thicknesses (200, 400, 500, and 600 µm).
Metals 13 01716 g004
Figure 5. Comparison of the F(u) slope (dashed lines) according to Equation (7) with FEM simulations for different sample thicknesses (200, 400, 500, and 600 µm).
Metals 13 01716 g005
Figure 6. Generic stress–strain curves for Rp02 = 600 MPa and varying Rm/Rp02, codes 6106 (green), 6306 (blue), AND 6506 (red); left: nominal stress vs. total nominal strain; right: true stress vs. true plastic strain.
Metals 13 01716 g006
Figure 7. Force-deflection curves for different flow parameters (material codes xx06 from Table 2, h = 500 µm); left (a): complete curves; right (b): zoom into the lower deflection range with indication of the elastic slope and the range where the transition forces Fe from the bi-linear fits are located.
Metals 13 01716 g007
Figure 8. Force-deflection curves for simulation IDs x306-h4 with transition forces F y marked by diamonds.
Metals 13 01716 g008
Figure 9. Force-displacement curves F ( v ) and elastic slope with parameters as in Figure 7 (left); plastic equivalent strain distribution at v = 0.0104   m m for simulation ID 6306-h5 (right).
Metals 13 01716 g009
Figure 10. Force-deflection curve with transition forces F y (according to Section 3 and F e from bi-linear fitting); simulation ID 6306-h5.
Metals 13 01716 g010
Figure 11. Equivalent plastic strain fields in the sample associated with Fy (left) and Fe (right); simulation ID 6306-h5, with same scale in both plots.
Metals 13 01716 g011
Table 1. Geometry parameters of the analyzed SPT set-ups.
Punch Diameter
d = 2r (mm)
Receiving Hole Diameter D (mm)Specimen
Thickness h (mm)
Edge Size
(mm)
Edge Type
2.54.00.2 … 0.60.2Chamfer
Table 2. Material parameters for the investigation of the yield strength correlation; see Equation (2).
Code S y 0   ( M P a ) r 1   ( M P a ) n R p 02   ( M P a ) R m   ( M P a ) R m / R p 02 A g t   ( % )
3106296.360.835.43003331.116
3306285.3135.159.23004001.336
3506275.2193.969.13004501.56
6106592.2121.227.56006671.116
6303504.2311.3185.96008001.333
6306569.0270.062.66008001.336
6312587.7298.622.16008001.3312
6506547.5388.873.46009001.56
9106887.9179.239.490010001.116
9306851.0404.966.290012001.336
9506816.3585.378.390013501.56
Table 3. Transition forces and obtained correlation factors. Green rows R p 02 = 300   M P a , blue rows R p 02 = 600   M P a , red rows R p 02 = 900   M P a .
Simulation ID F y   ( N ) F e   ( N ) β Y S   ( F y ) β Y S F e
3106-h581.9196.40.9160.382
3306-h213.324.80.9000.484
3306-h455.8124.70.8600.385
3306-h585.5202.50.8770.370
3306-h6120.1301.00.8990.359
3506-h588.5209.60.8480.358
6106-h5164.2370.60.9140.405
6303-h5178.8401.80.8390.373
6306-h225.942.30.9270.567
6306-h4111.4232.70.8620.413
6306-h5174.7392.80.8590.382
6306-h6244.5586.70.8840.368
6312-h5167.4381.10.8960.394
6506-h5179.5407.10.8360.368
9106-h5250.6539.60.8980.417
9306-h238.555.40.9350.650
9306-h4168.4335.80.8550.429
9306-h5264.0563.30.8520.399
9306-h6369.2850.20.8780.381
9506-h5269.9578.50.8340.389
Table 4. Average correlation factors and coefficients of variation (standard deviation divided by average).
Dataset β ¯ Y S F e β ¯ Y S F y c V F e c V F y
All data0.410.8817.4%3.7%
Sets h = 600   µ m 0.370.882.5%1.9%
Sets h = 500   µ m 0.390.874.4%3.8%
Sets h = 400   µ m 0.410.864.4%0.3%
Sets h = 200   µ m 0.570.9212.0%1.1%
Table 5. Transition forces and correlation factors for the TEM geometry.
Simulation ID F y   ( N ) F e   ( N ) β Y S   ( F y ) β Y S F e
6306-D175-h25042.795.50.880.39
Disclaimer/Publisher’s Note: The statements, opinions and data contained in all publications are solely those of the individual author(s) and contributor(s) and not of MDPI and/or the editor(s). MDPI and/or the editor(s) disclaim responsibility for any injury to people or property resulting from any ideas, methods, instructions or products referred to in the content.