

Fatigue and Fracture Evaluations in Ti-10V-2Fe-3Al (Ti 10-2-3)


Institute of Structural Materials, Faculty of Science and Engineering, Swansea University, Swansea SA1 8EN, UK
Metals 2023, 13(12), 1986; https://doi.org/10.3390/met13121986
Submission received: 27 October 2023
/
Revised: 17 November 2023
/
Accepted: 25 November 2023
/
Published: 7 December 2023
(This article belongs to the Section Metal Failure Analysis)
Abstract
:A mechanical assessment was conducted to characterise the near β titanium alloy Ti-10V-2Fe-3Al (Ti 10-2-3), which was heat-treated to provide two strength variants. Low cycle fatigue and crack propagation tests were performed under standard laboratory air plus a salt fog environment. The differences in static strength were also demonstrated under fatigue conditions utilising plain specimens. However, the alloy was essentially insensitive to the test environment when comparing LCF performance in air and salt fog. Salt fog also provided no effect on crack growth behaviour. A double edge notch specimen geometry was employed to measure free initiation and the growth of cracks from a stress-raising feature. The current data now supplement previous studies aimed at expanding the mechanical database for Ti 10-2-3 component design and in-service life predictions.
1. Introduction
The near-β titanium alloy Ti-10V-2Fe-3Al (Ti 10-2-3) was originally developed during the 1970s and subsequently employed for low weight/high strength airframe applications, with a specific focus on aircraft main landing gear and associated actuation. Over the intervening period the alloy was utilised on two notable platforms, the Boeing 777 and Airbus A380 [1,2]. The thermo-mechanical forging of the wrought alloy is typically followed by solution heat treatment below the β transus. Containing a relatively high volume of β-stabilising elements enables lower forging temperatures under reduced flow stress when compared to the near α and α/β classes of titanium alloys, which are typically aimed towards gas turbine applications.
Post-forging, the ultimate mechanical properties of Ti 10-2-3, particularly tensile strength and fracture toughness, are controlled by an ageing treatment. Towards the end of the 70s, a wide-ranging assessment of static and cyclic mechanical properties was conducted on behalf of Boeing, culminating in a seminal publication from Boyer [3] and acting as a basis for future engineering design and in-service lifing. More recently, Jha and Ravichandran [4] conducted a comprehensive suite of academic experiments evaluating damage tolerance behaviour in various heat-treated variants of the alloy under a range of waveform and mean stress conditions. An expanded range of service applications had been considered by this time, for example, fasteners and helicopter rotor heads [5]. Coming closer to date, previous Ti 10-2-3 applications are subjected to regular review [1] and future avenues for the employment of Ti 10-2-3 and alternative β alloys in general remain under consideration [2].
The vast majority of previous laboratory assessments published in the open literature appear to focus on room temperature properties under standard atmospheric air environments. The current paper will supplement those earlier data by reporting additional results from mechanical testing performed under fatigue and fracture mechanics scenarios. Although the overall test matrix was restricted by the volume of available material, it was possible to generate data on two extreme strength conditions: designated AMS4984 (High strength) and AMS4987 (Low strength) [6,7]. These ageing treatments typically generate UTS values approximating 1190 and 965 MPa, respectively [8]. Fundamental low cycle fatigue (LCF) strength and “long” fatigue crack growth (FCG) Stage II Paris behaviour will be reported from plain cylindrical and corner crack (CC) specimen geometries, respectively. Recognising that fatigue failures are most often located from complex geometric features, the influence of stress concentration was considered by employing a double edge notch (DEN) specimen design, instrumented with potential drop techniques in two distinct methods to measure both crack initiation and crack growth.
Notably, data from these various forms of evaluation were obtained in both atmospheric air and a controlled aqueous salt fog environment. The latter simulates the employment of the alloy in locations where ambient temperature saline corrosion could occur. Commercial aircraft regularly conduct services in humid, coastal marine locations, and military platforms may experience even more severe saline-bearing environments when operating from offshore carriers.
2. Materials and Methods
Rectilinear forged bar stock (approximately 25 mm square) was procured (Timet UK), and the solution was then heat-treated and aged in this laboratory using an electric radiant furnace. The cropped specimen blanks were approximately 110 mm in length and were processed into two distinct standard conditions: AMS4984 (High UTS) and AMS4987 (Low UTS) [8]. Mechanical specimens were subsequently machined from the aged blanks using CNC lathe and milling operations according to the three geometries illustrated in Figure 1.
Plain cylindrical specimens (Figure 1a) were used for LCF assessments, all under a load ratio of R = 0.1 and 1 Hz sinusoidal waveform. The experiments were performed according to test standard BS3518 [9]. With the exception of a single test, all specimens were run to complete rupture (designated Nf). Applied peak stress conditions were selected to generate individual failures between 103 and 106 cycles.
CC specimens (Figure 1b), with a square cross-section (width W = 10 mm), were employed to measure Stage II Paris fatigue crack growth under constant amplitude loading. Crack growth was measured using a well-established pulsed direct current potential drop (DCPD) technique [10]. A fine starter slit (details highlighted in Figure 1b) was ground with a diamond cutting wheel on one edge mid-way along the gauge section. This controlled the position of crack initiation and the plane of growth. Fine platinum wires were spot-welded on the corner edge of the gauge section immediately straddling the starter slit. A pulsed direct current of 30 A was applied every 200 cycles, with the resultant crack voltage taken at the peak of an individual load cycle. PD calibration and the associated stress solutions reported by Pickard [11] were utilised to describe the growth of the part-through quarter circular crack as da/dN vs. ΔK. A range of R ratios from 0.1 to 0.7 was assessed to obtain data under various mean stress levels under a 1 Hz sinusoidal waveform. Unless specified, all tests were conducted with a peak applied stress of 300 MPa. The crack was grown to a maximum projected length (a) of approximately a/W = 0.4.
The DEN specimen design (Figure 1c), offering an average of Kt = 1.9 along the notch root, was employed in two distinct modes. First, the measurement of quarter elliptical part-through crack growth from a starter slit that was machined in a single corner position. The 10 × 10 mm cross-section at the notch root duplicated that of the CC specimen, but with the superposition of a stress concentration along one edge of the developing crack due to the incorporation of the semi-circular, 3 mm radius notch. In general, the test procedures were identical to those employed for CC specimens; however, for DEN specimens, only the extreme mean stress conditions of R = 0.1 and R = 0.7 were employed. An in-house finite element analysis was used to calculate the crack characteristics (da/dN vs. ΔK) associated growth at the projected 45° position around the crack profile [12]. The crack profiles and pertinent dimensions relating to CC and DEN crack growth are illustrated in Figure 2.
Second, freely initiated fatigue performance was characterised (i.e., without the presence of a starter slit). All specimens were cycled to complete failure (Nf). For these fatigue-based experiments, a single mean stress condition of R = 0.1 was assessed at 1 Hz sine. A relatively small database was generated with the longest life test approximating 35,000 cycles. Pulsed DCPD monitoring was employed with a constant current of 30 A applied at 200 cycle intervals. Two pairs of fine titanium probe wires were welded diagonally across each notch, as shown in Figure 3. This allowed for the detection of early cracking and definition of a crack initiation life (Ni) corresponding to an incremental voltage of ΔV > 0.01 mV in either notch. The PD data relating to the five DEN specimens are plotted in Figure 4 (n.b., only those data from the first notch indicating cracking are plotted).
The entire mechanical database relates to room temperature testing performed at 22 °C. The majority of tests reported were conducted in laboratory air. However, selected tests were performed in a salt fog atmosphere (3.5% NaCl by weight), employing a bespoke spray cabinet that encapsulated the load train within the frame of the servo-hydraulic test machine. The calibrated fog fall-out rate within the chamber conformed to the corrosion test conditions defined by ASTM B117 [13].
3. Results
The fatigue data measured from plain cylindrical specimens are illustrated by the plot of peak applied stress versus cycles to failure, as seen in Figure 5. The individual test results are tabulated in Table 1. A clear difference in fatigue strength was defined between the High and Low UTS variants. Within the range of cyclic life assessed, there appears to be no difference in performance with respect to air and salt fog environments. The best fit trend lines calculated from the combined air and salt fog data for each strength variant are superimposed (n.b., ignoring any runout specimens).
The limited LCF data measured from the DEN specimens are plotted in Figure 6. The individual test results are tabulated in Table 2. It is emphasised that on this occasion, the Y axis represents the applied net-section stress as calculated across the 100 mm2 cross-section at the root of the notch (so ignoring the stress concentration factor). The X axis employs the cycles to the crack initiation criterion, as detected by PD (incremental ΔV > 0.01 mV). The combined data show no difference according to the strength variant, at least towards the low cycle end of the SN curve. Two best fit lines have simply been superimposed by the eye to suggest a possible transition in performance towards the high cycle fatigue (HCF) regime.
Stage II Paris crack growth data are plotted for the Low UTS variant only in Figure 7. The graph illustrates the minimal effect of mean stress amongst the four tests performed in air, as further emphasised by the similar m and C values calculated for the individual specimens and presented in Table 3. Note that these four air tests were performed under the identical peak stress level of 300 MPa. The data points measured from these four tests were combined into a single dataset to allow the calculation of a best fit line for the Low UTS variant in air (i.e., mean stress independent).
The data from two corner crack tests performed in salt fog are then compared to the Low UTS air best fit line in Figure 8. The R = 0.1 test, also conducted at a peak stress of 300 MPa, performed almost identically to the equivalent test in air (best illustrated when separately plotting the actual data points together). A marginally accelerated growth rate was measured under R = 0.7, noting that the peak stress on this specific test was deliberately raised to 600 MPa. Paris coefficients for the salt fog data are appended to Table 3.
Additional crack growth data are plotted in Figure 9, and were once again compared to the combined Low UTS best fit from the CC air data. A single High UTS CC specimen was available, plus two DEN specimens with one in each variant. These three tests were all conducted with a peak stress of 300 MPa.
4. Discussion
The data from this relatively limited matrix of experiments are intended to supplement earlier assessments of Ti 10-2-3. Some of those previous studies were purposely reported to promote the alloy in comparison with competing near-α and near-β alternatives and to support fatigue and damage tolerance lifing methodologies. Two notable aspects of the current work include the characterisation performed within a salt fog environment and the influence of a stress concentration feature on crack initiation and propagation.
In the case of plain specimens, static strength differences induced in the alloy through ageing treatment also transferred through to LCF performance. The current results from the LCF tests performed in air and salt fog, as seen in Figure 5, show the alloy to be insensitive to an aqueous saline environment. This is encouraging given the ongoing employment of this alloy for safety critical applications, such as aircraft main landing gear, actuation, and rotor head components, in particular where operations may involve marine environments.
Naturally, the fatigue data generated using plain specimens integrate periods of crack initiation and the growth of the crack to a critical size prior to ultimate failure. Given that the crack growth measurements show no significant effect of the environment, it may be assumed that the period of initiation is also independent of the environment.
The combination of high mean stress (R = 0.7) and salt fog appears to induce marginally fast crack growth in corner crack specimens, as shown in Figure 8. However, this was the only specimen subjected to the elevated peak stress of 600 MPa. Additional tests would be required to prove whether this was an effect of increased environmental influence (due to an increased crack opening and the easier transport of the aggressive species to the crack tip [14]) or possibly an artifact of increased crack tip plasticity [4].
Although only a limited number of tests were performed to evaluate freely initiated fatigue in DEN specimens, the alloy ageing condition appeared not to control LCF performance from a stress concentration feature. The use of PD monitoring to detect crack initiation, as illustrated in Figure 4, suggests that crack growth typically accounted for less than 5% of total life across the range of the applied stresses employed. This is typical of many aerospace grade alloys (in pristine, defect-free form). The positioning of the probe wires across each notch, at 6 mm axial separation (i.e., approximately 3 mm either side of the eventual plane of fracture), plus the fact that the crack is free to initiate at any lateral position along the root of the notches in the individual specimens, makes it difficult to accurately calibrate the PD initiation criterion to a crack size (whether defined by surface length or cracked area). However, similar tests on other titanium alloys in this laboratory have indicated that an increment of ΔV = 0.01 mV at a current of 30 A correlates to a cracked area of approximately 1 mm2.
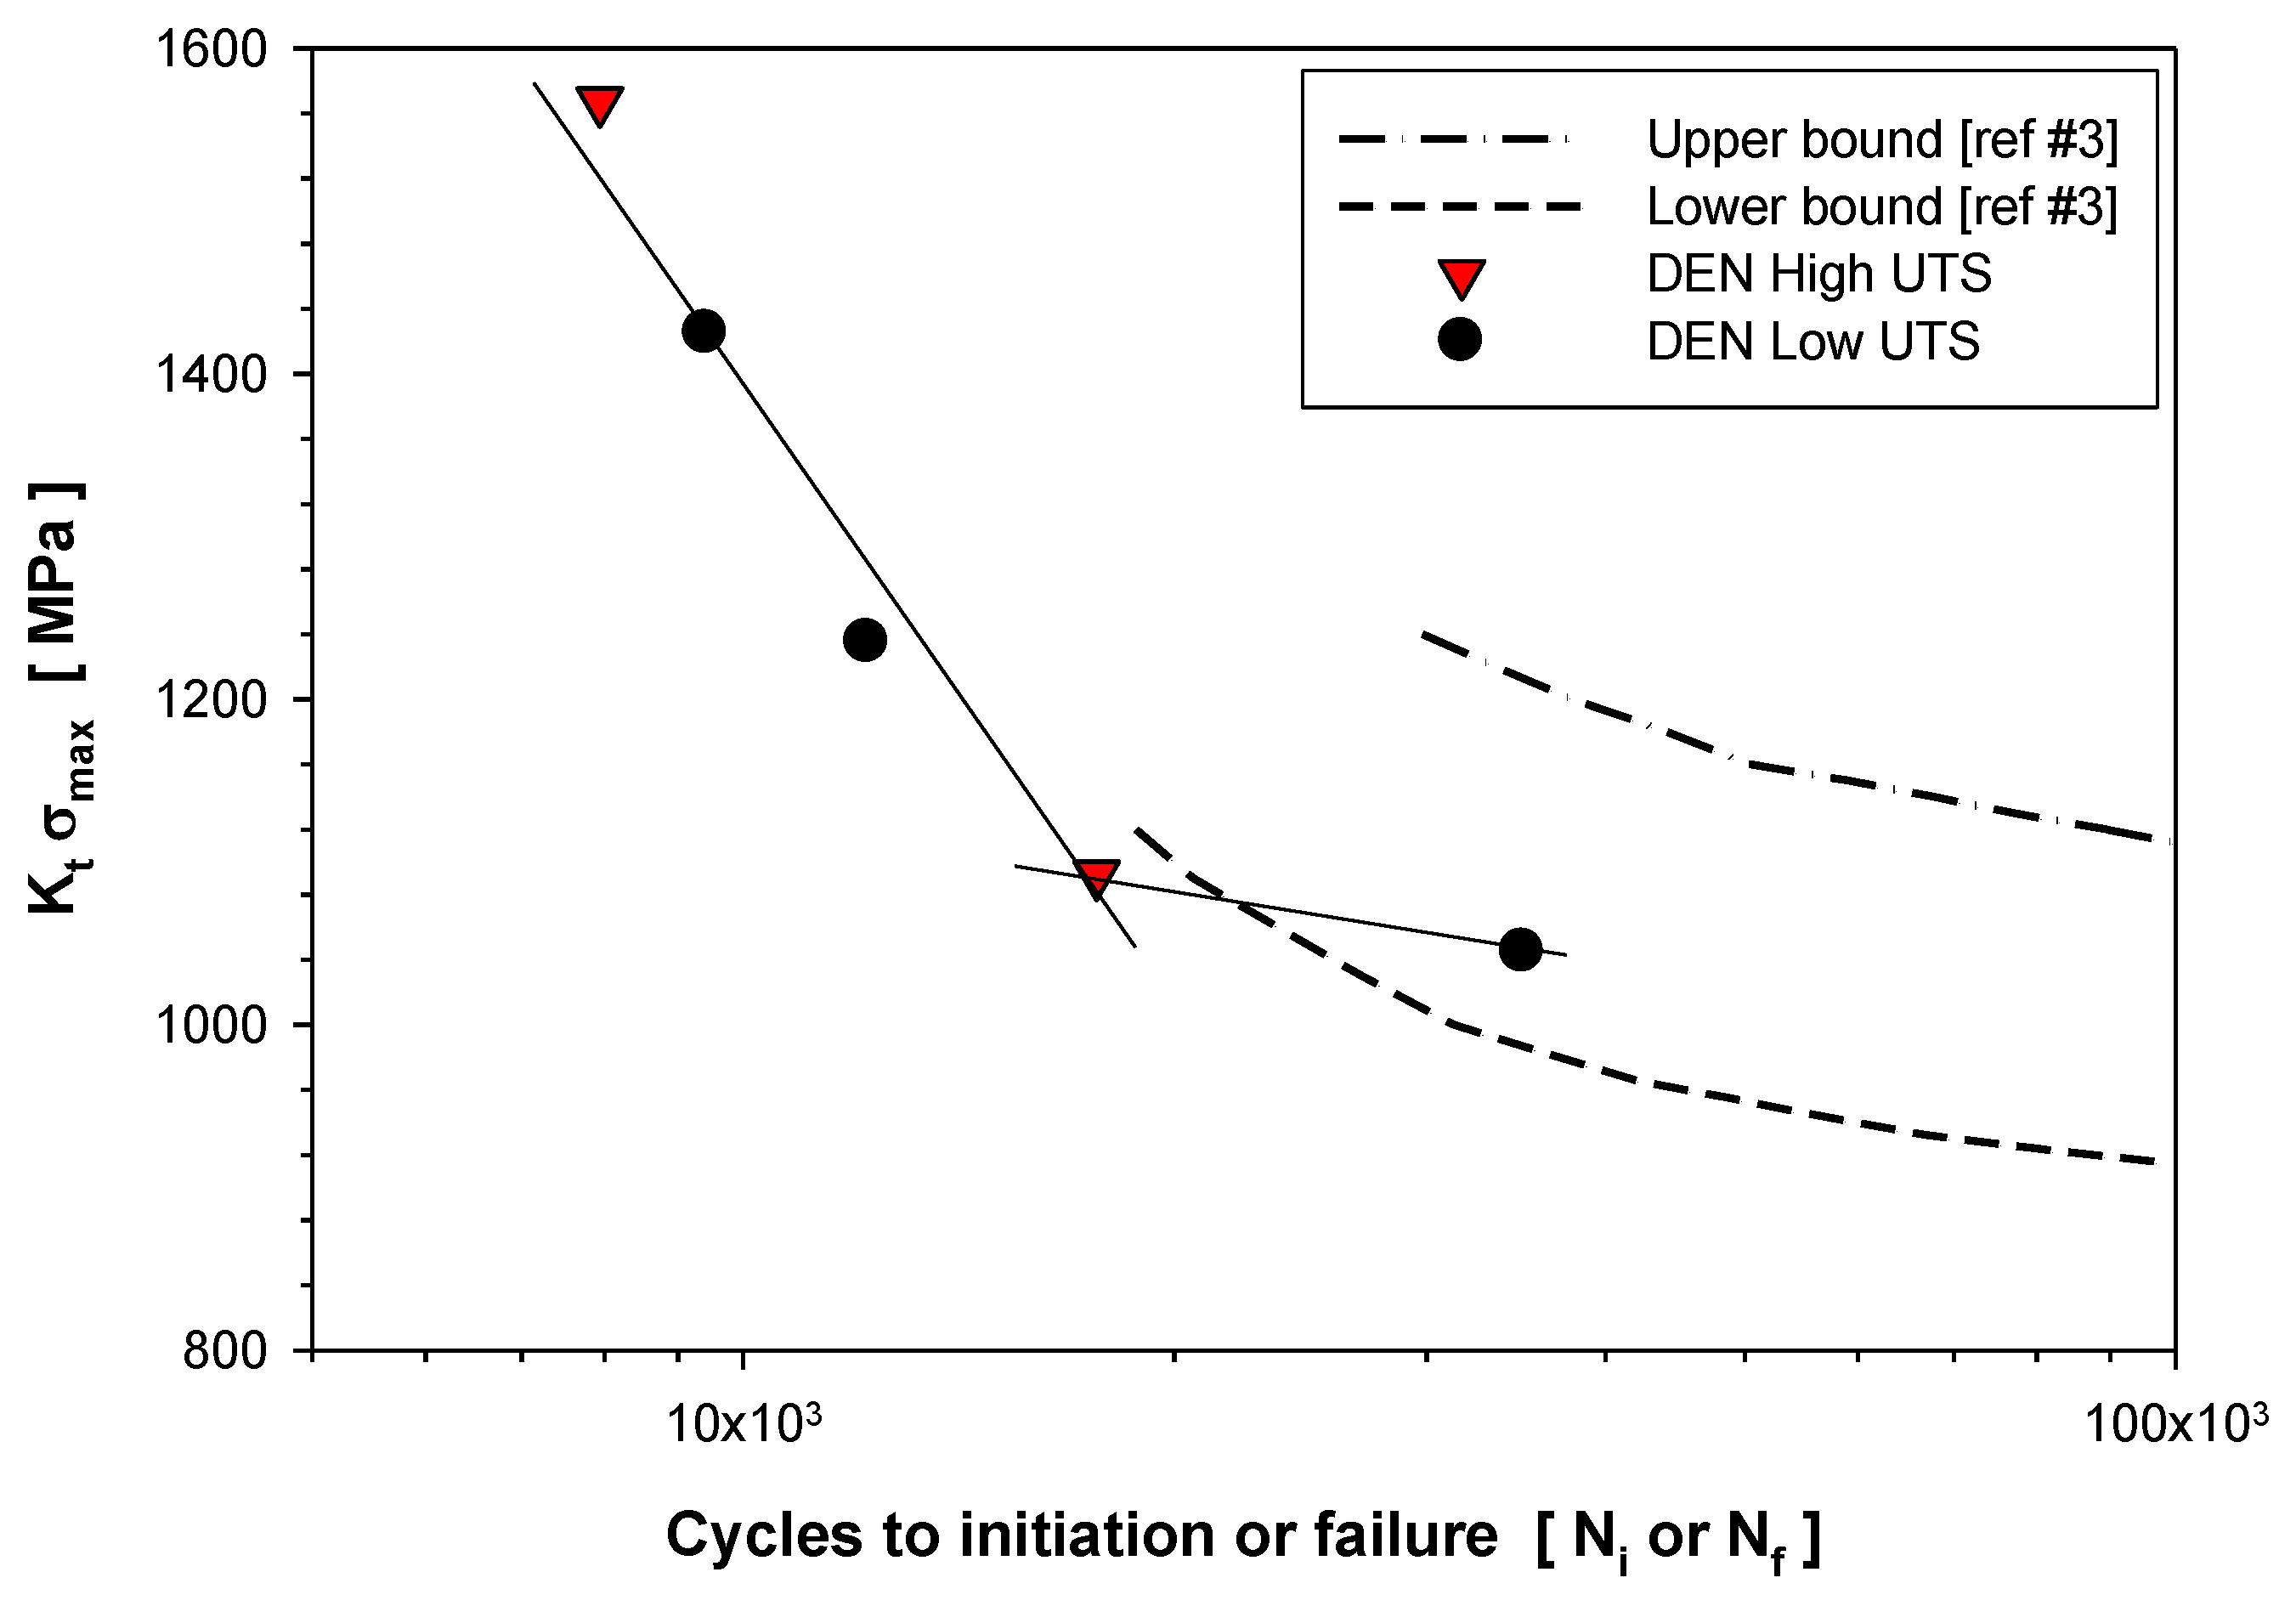
Boyer previously reported notch LCF/HCF fatigue data for Ti 10-2-3 material extracted from aerospace forgings [3]. These commercial forgings were subjected to a double ageing treatment, imparting a greater strength relative to the current material under investigation. The precise specimen geometry was not described, other than quoting the Kt value of 2.9. The notch results as presented in [3] were illustrated as an SN band rather than individual data points. The current DEN data have been compared to those previous results (by digitising the upper and lower extent of the scatter band), as shown in Figure 10, employing a peak elastic stress criterion (Kt × applied net-section stress). Consistent with the differences in static strength properties, the current DEN data fall close to the lower bound SN behaviour from reference #3. This helps extend the cycle range of the combined database further towards the LCF regime.
The growth rates of part-through quarter elliptical cracks growing under the influence of stress concentration, as provided by the edge notch in a DEN specimen, compare favourably to the behaviour of corner cracks, as observed in Figure 9. Although only one High UTS CC specimen was tested, when compared to the best fit trend representing the Low UTS material cracks, it appears that cracks may grow relatively slowly under low ΔK conditions in the stronger variant, as also demonstrated in Figure 9. This marginal benefit in damage tolerance diminished at higher cyclic stress range intensities (i.e., the data essentially merge at ΔK > 6 MNm−3/2).
5. Conclusions
The present results have extended previously published databases describing fatigue and crack propagation behaviour in the near-β titanium alloy Ti 10-2-3. LCF strength was sensitive to ageing treatments originally devised for the optimisation of static strength and fracture toughness. The alloy appeared to be resistant to an aqueous saline environment, with similar responses measured under fatigue and crack propagation experiments conducted in either air or salt fog atmospheres. The crack growth rates relating to part-through semi-elliptical cracks developing within a complex stress concentration field were similar to quarter circular cracks growing in a uni-axial stress field.
Funding
This research received no external funding.
Data Availability Statement
The original fatigue and crack propagation data as generated by the author are available on request.
Acknowledgments
This research was conducted by the author during 1990 and 1992 under the Interdisciplinary Research Centre in Materials for High Performance Applications, Swansea University, funded by the then Science and Engineering Research Council (UK).
Conflicts of Interest
The author declares no conflict of interest.
References
- Boyer, R.R.; Slattery, K.T.; Chellman, D.J.; Phelps, H.R. Recent Titanium Developments and Applications in the Aerospace Industry. In Ti-2007 Science and Technology; Ninomi, M., Akiyama, S., Ikeda, M., Hagiwara, M., Maruyama, K., Eds.; The Japan Institute of Metals: Sendai, Japan, 2007; pp. 1255–1262. [Google Scholar]
- Boyer, R.R. Design properties of a high strength titanium alloy, Ti-10V-2Fe-3Al. J. Met. March 1980, 32, 61–65. [Google Scholar] [CrossRef]
- Jha, S.K.; Ravichandran, K.S. Effect of mean stress (stress ratio) and aging on fatigue-crack growth in a metastable beta titanium alloy, Ti-10V-2Fe-3Al. Metall. Mater. Trans. A 2000, 31, 703–714. [Google Scholar] [CrossRef]
- Terlinde, G.; Fischer, G. Beta Titanium Alloys. In Titanium and Titanium Alloys: Fundamentals and Applications; Leyens, C., Peters, M., Eds.; Wiley-VCH Verlag GmbH & Co. KGaA: Weinheim, Germany, 2003; pp. 37–57. [Google Scholar]
- Cotton, J.D.; Briggs, R.D.; Boyer, R.R.; Tamirisakandala, S.; Russo, P.; Shchetnikov, N.; Fanning, J.C. State of the Art in Beta Titanium Alloys for Airframe Applications. JOM 2015, 67, 1281–1303. [Google Scholar] [CrossRef]
- Aerospace Material Specification AMS4984; Titanium Alloy Forgings 10V-2Fe-3Al Consumable Electrode Melted, Solution Heat Treated and Aged 173,000 psi (1195 MPa) Tensile Strength. SAE International: Warrendale, PA, USA, 1987.
- Aerospace Material Specification AMS4987; Titanium Alloy, Forgings 10V-2Fe-3AI Consumable Electrode Melted, Single-Step Solution Heat Treated and Overaged 140 ksi (965 MPa) Tensile Strength. SAE International: Warrendale, PA, USA, 1995.
- Timetal 10-2-3; Data Sheet. Timet: Birmingham, UK, 2000.
- BS3518-1:1993; Methods of Fatigue Testing. British Standards Institution: London, UK, 1993.
- Mom, A.J.A. Revised Working Document for the AGARD co-Operative Test Programme on Titanium Alloy Engine Material; Technical Report TR 86019L; National Aerospace Laboratory (NLR): Amsterdam, The Netherlands, 1986. [Google Scholar]
- Pickard, A.C. The application of 3-dimensional finite element methods to fracture mechanics and fatigue life prediction. In Engineering Materials Advisory Service; Chameleon Press: London, UK, 1986. [Google Scholar]
- Spence, S.H.; Evans, W.J.; Nicholas, P.J. The Growth of Microstructurally Small Cracks in a Near Alpha Titanium Alloy. In Fracture of Engineering Materials and Structures; Teoh, S.H., Lee, K.H., Eds.; Springer: Dordrecht, The Netherlands, 1991. [Google Scholar]
- ASTM B117; Standard Method of Salt Spray (Fog) Testing. ASTM: West Conshohocken, PA, USA, 2011.
- Vasudevan, A.K.; Ricker, R.E.; Miller, A.C.; Kujawski, D. Fatigue crack tip corrosion processes and oxide induced closure. Mater. Sci. Eng. A 2022, 861, 144383. [Google Scholar] [CrossRef]
Figure 1.
Mechanical test specimens: (a) plain cylindrical, (b) corner crack (CC), and (c) double edge notched (DEN). All dimensions in mm.
Figure 1.
Mechanical test specimens: (a) plain cylindrical, (b) corner crack (CC), and (c) double edge notched (DEN). All dimensions in mm.
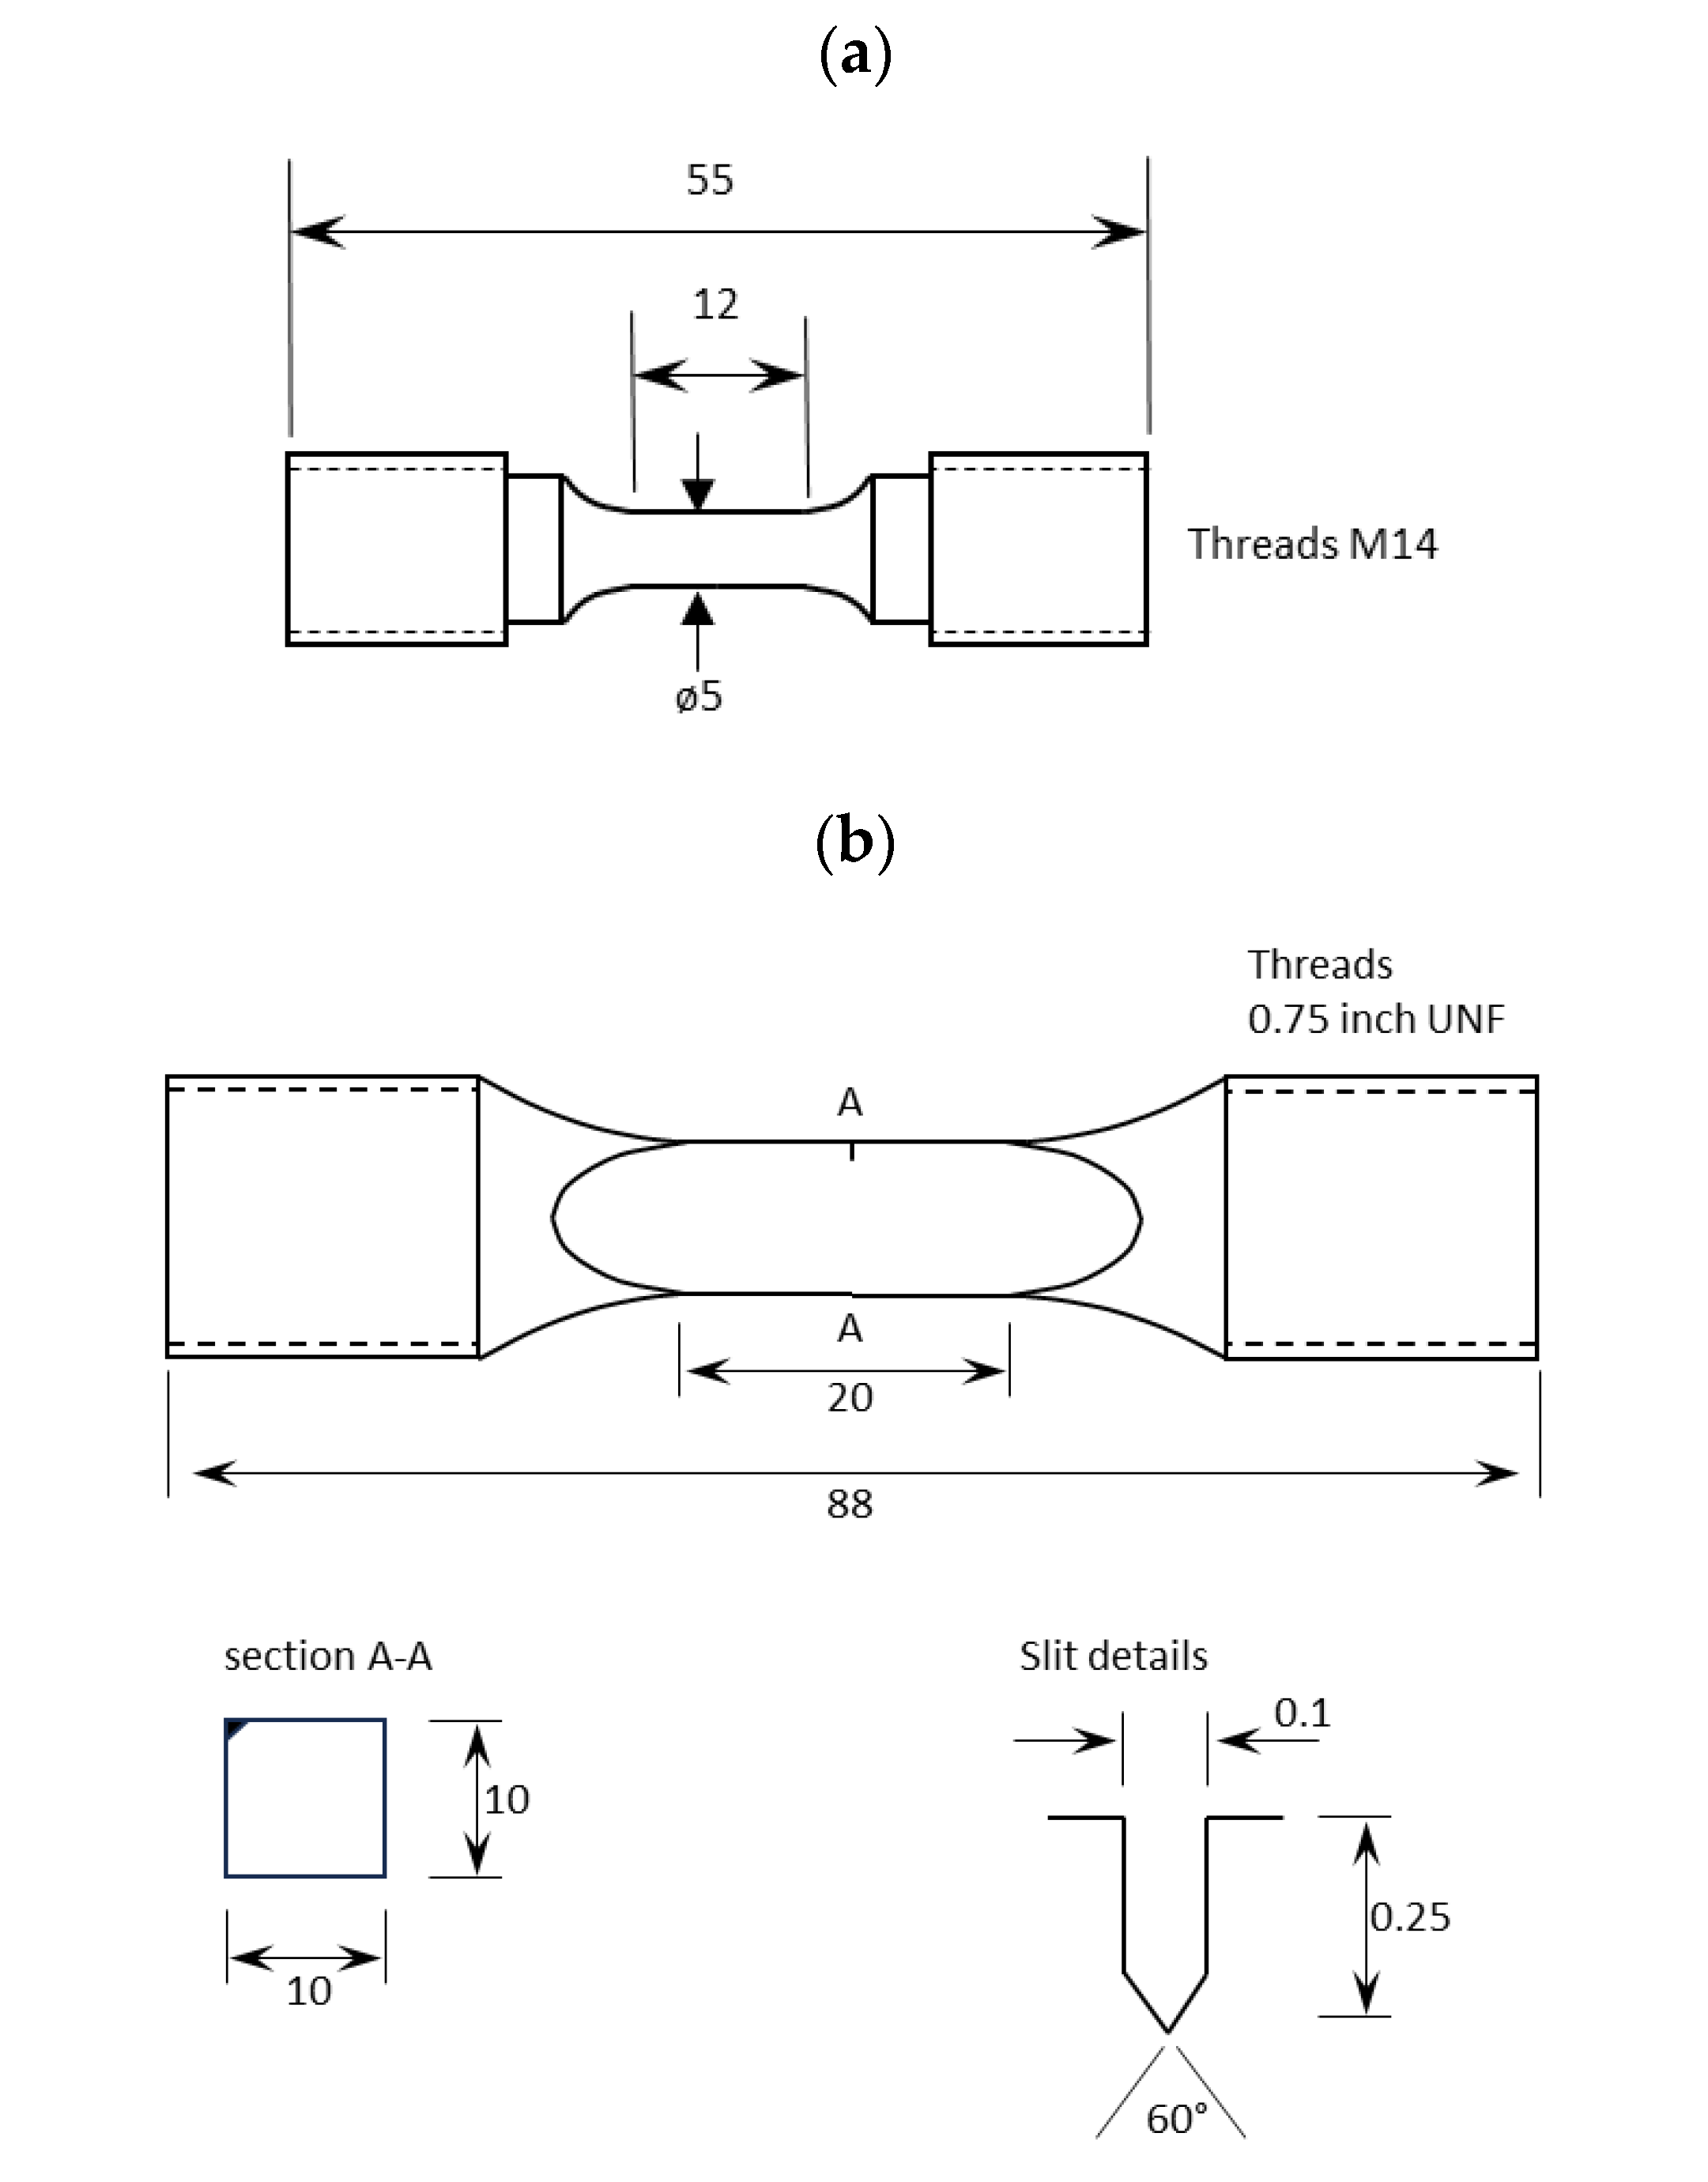
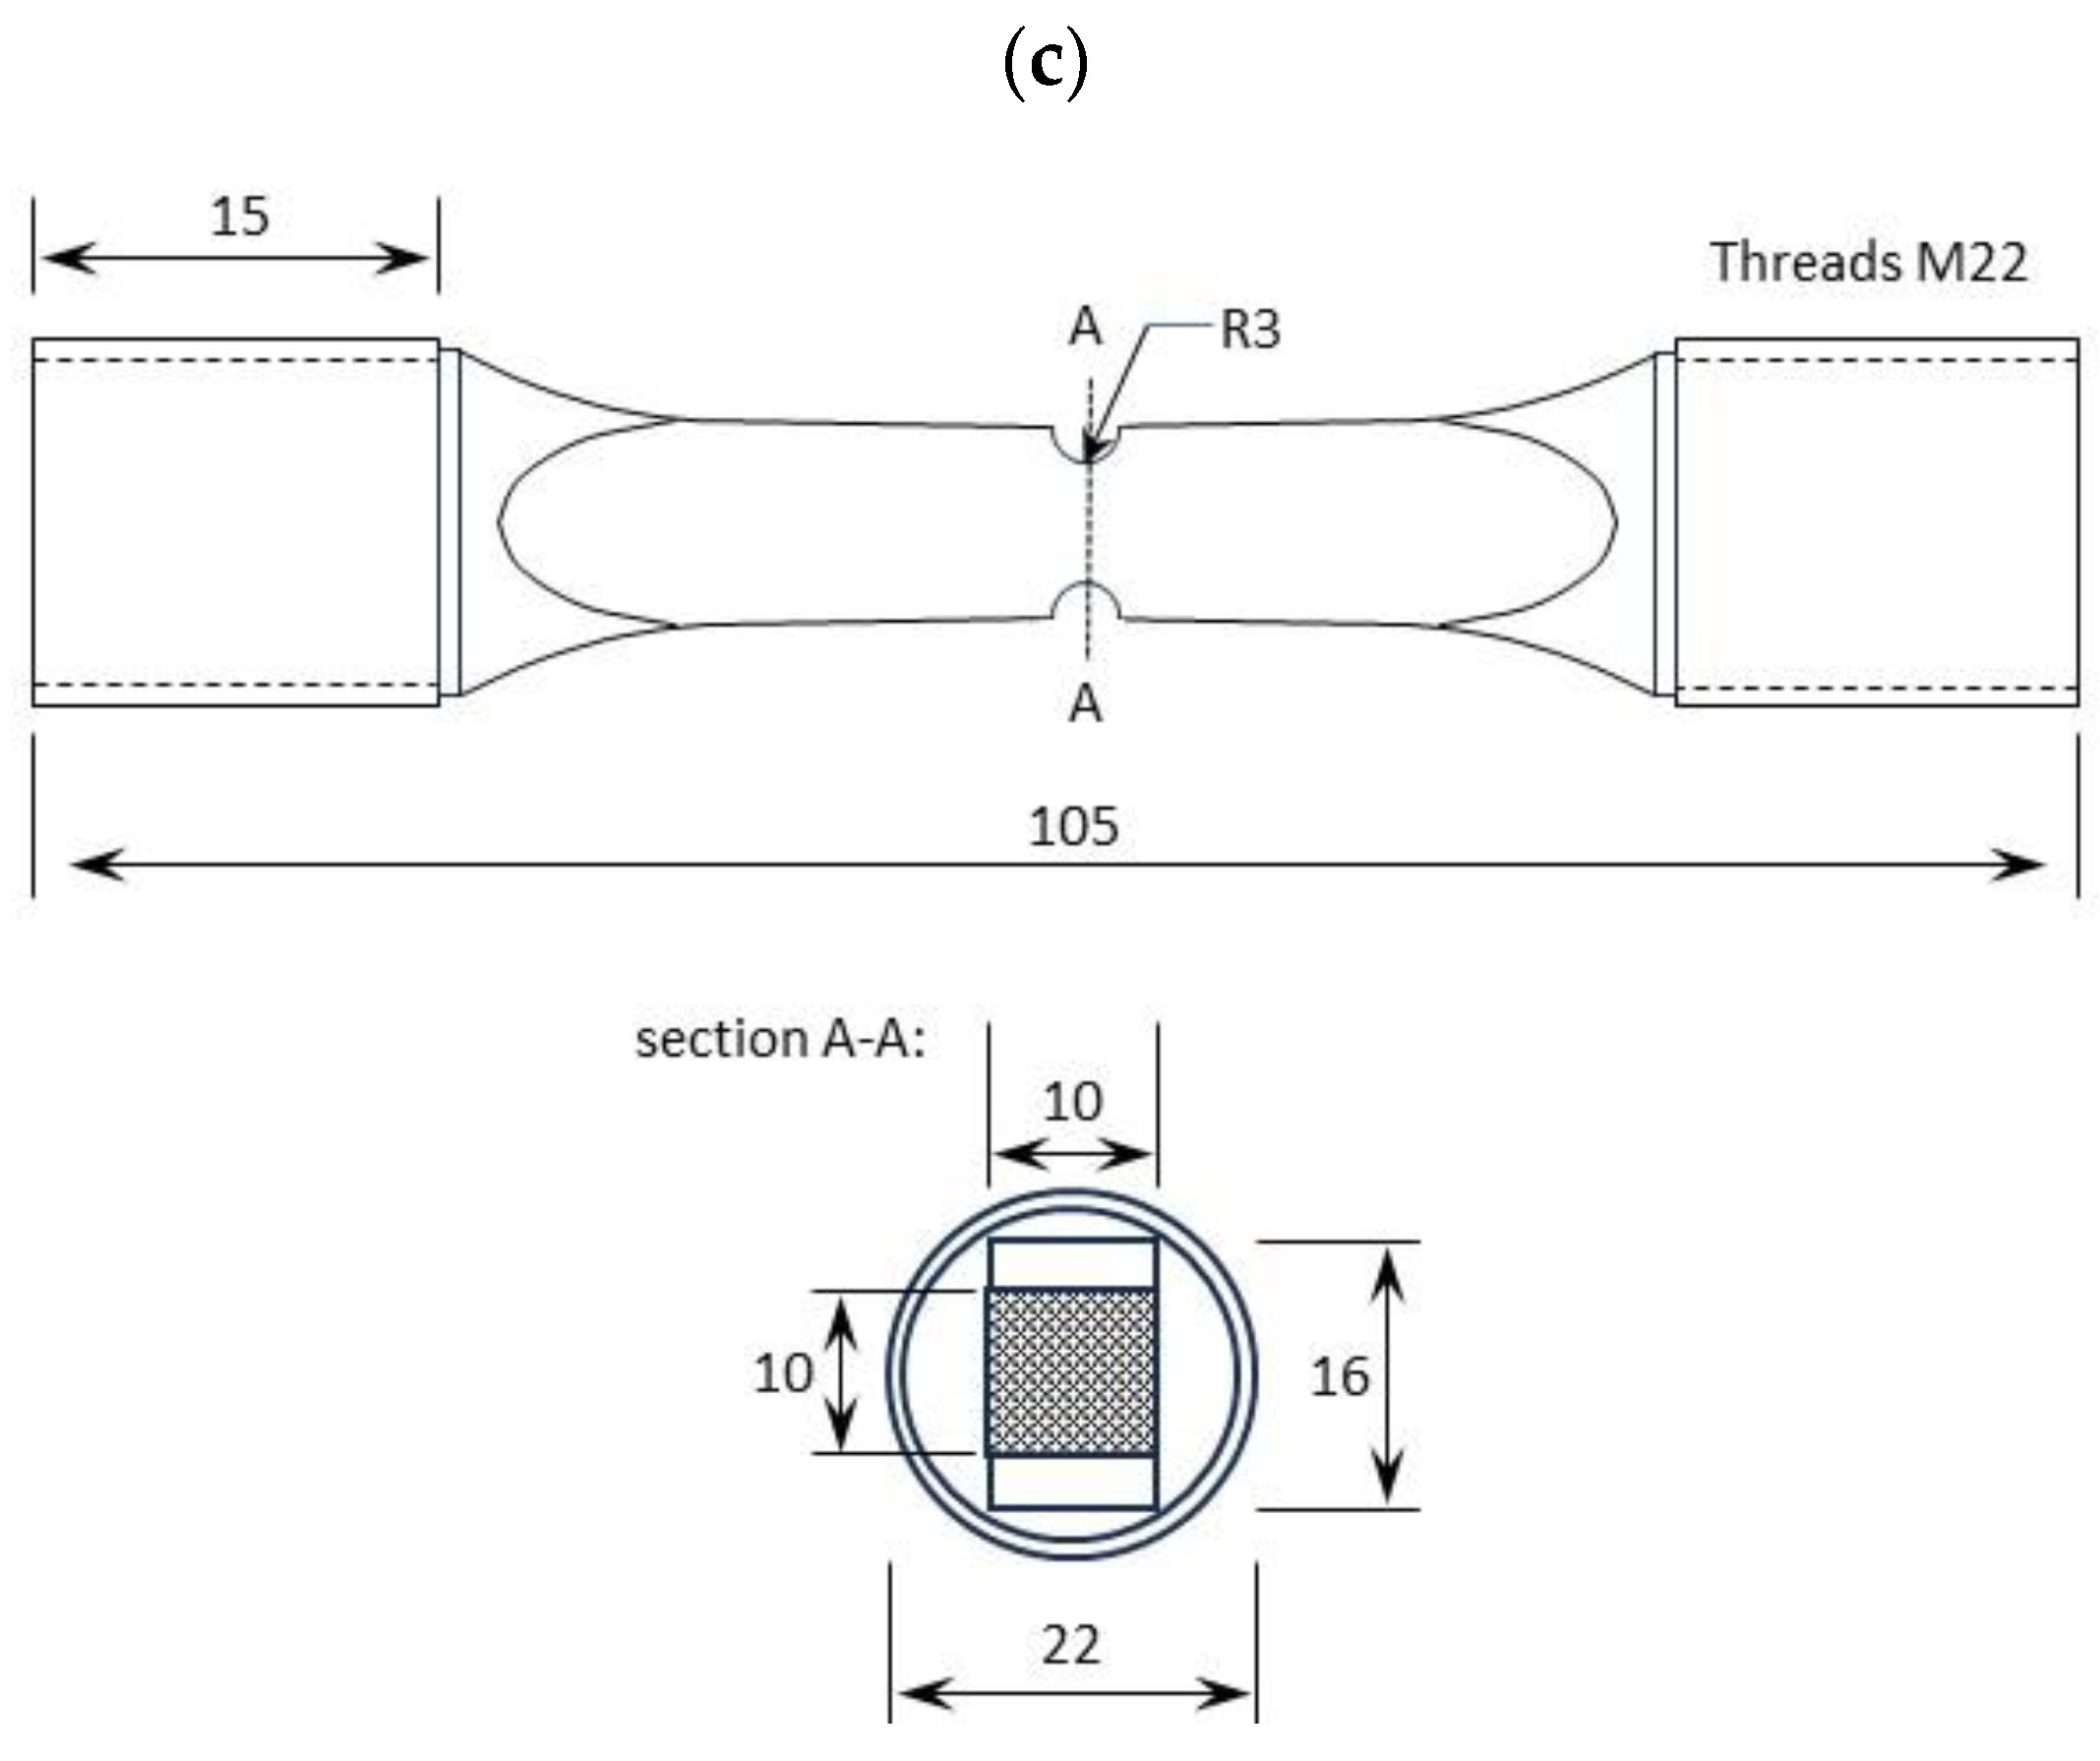
Figure 2.
Crack profiles generated in CC and DEN specimens (left and right, respectively), together with key dimensions. The starter slit is indicated at the bottom left corner position in each case.
Figure 2.
Crack profiles generated in CC and DEN specimens (left and right, respectively), together with key dimensions. The starter slit is indicated at the bottom left corner position in each case.
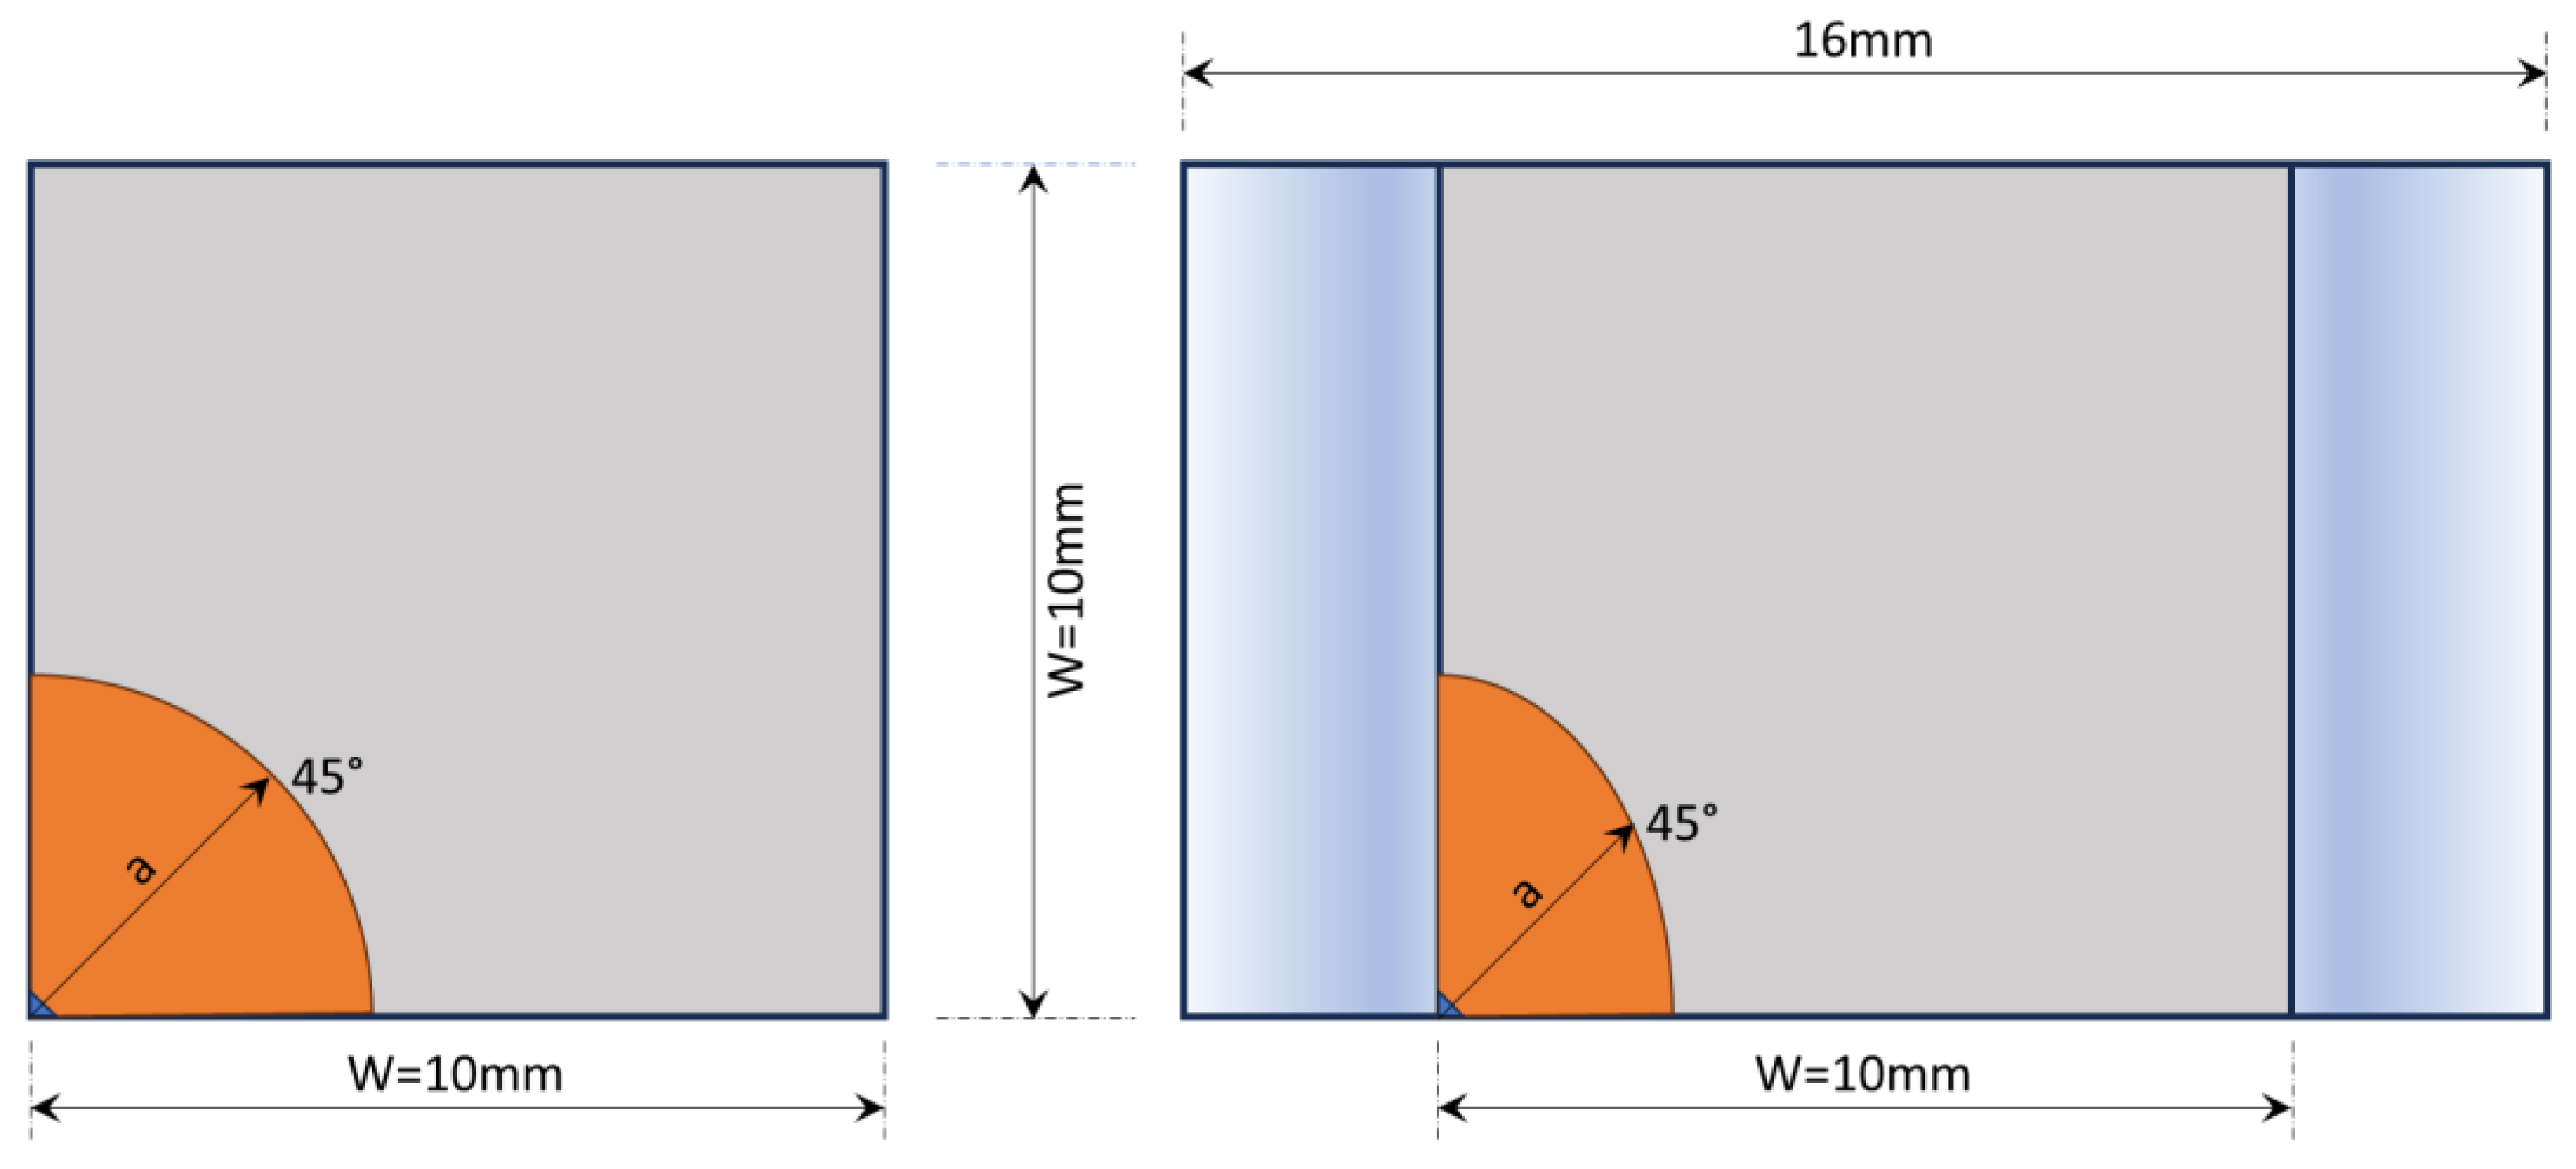
Figure 3.
Diametric welded probe positions for PD monitoring of freely initiated cracks in DEN specimens (also replicated on opposite notch).
Figure 3.
Diametric welded probe positions for PD monitoring of freely initiated cracks in DEN specimens (also replicated on opposite notch).
Figure 4.
Incremental potential difference as a function of cycles, measured from freely initiated fractures in five DEN specimens.
Figure 4.
Incremental potential difference as a function of cycles, measured from freely initiated fractures in five DEN specimens.
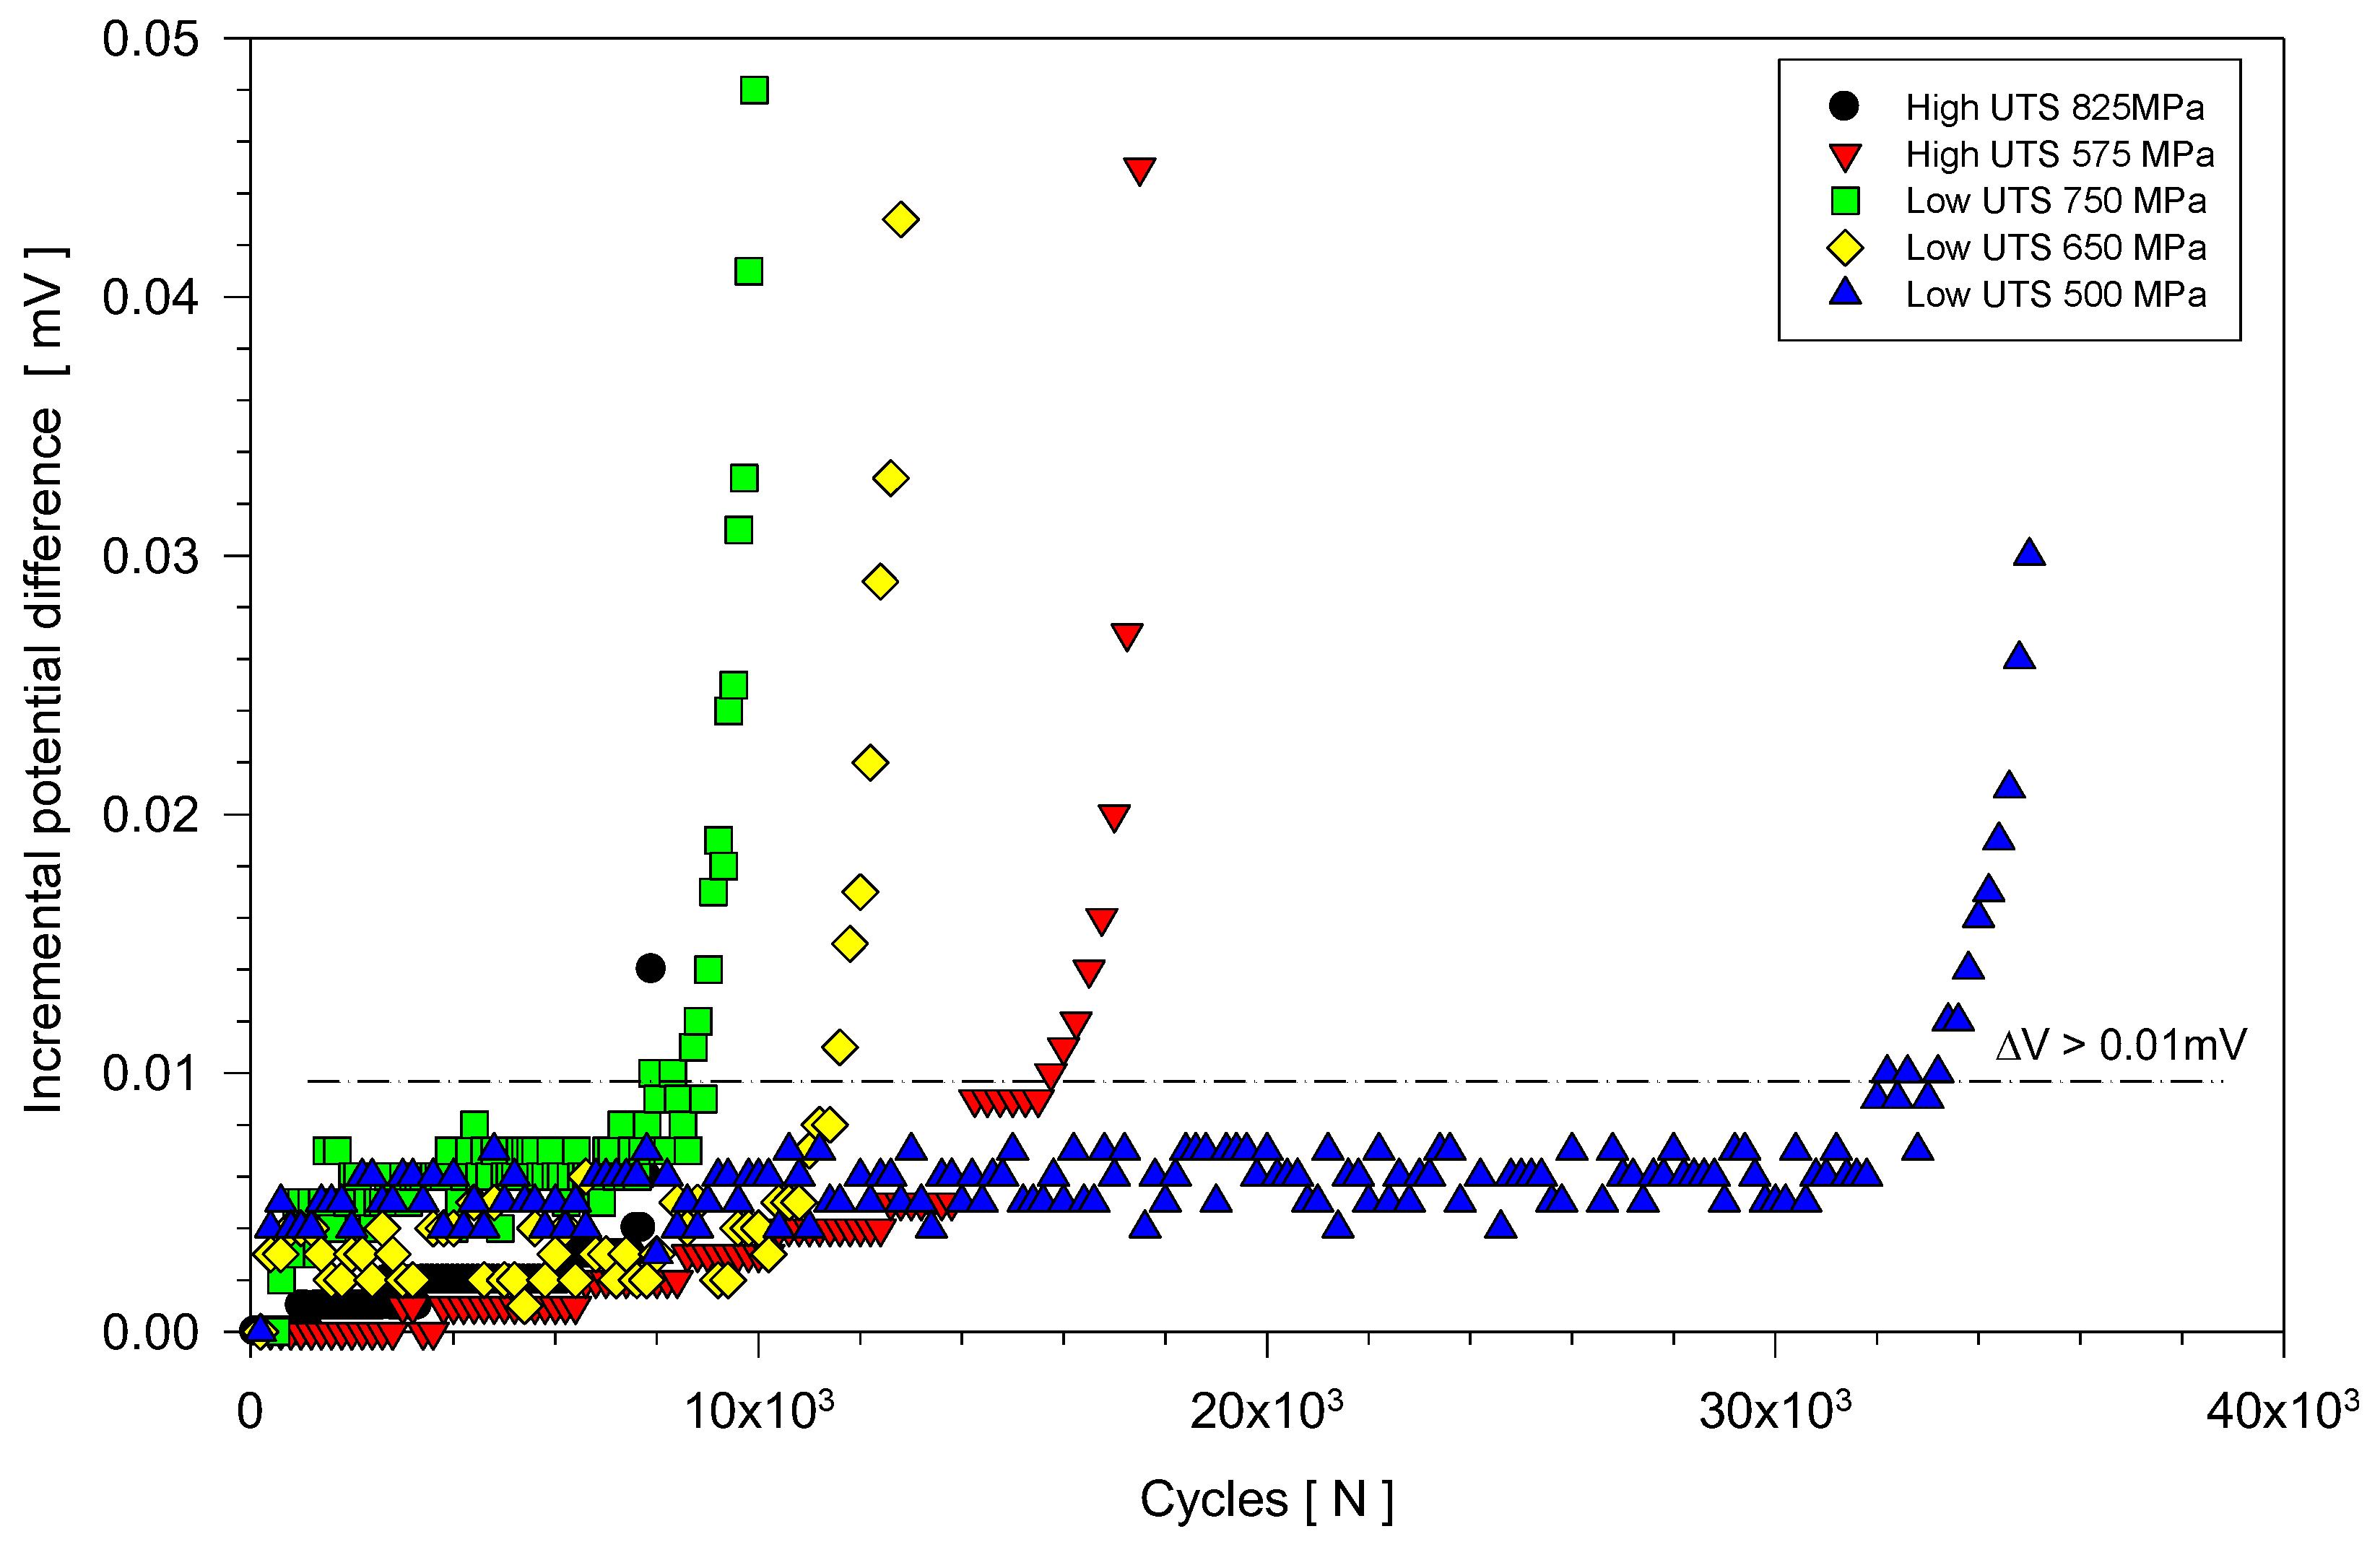
Figure 5.
Fatigue data measured from plain cylindrical specimens in air and salt fog environments (Low and High strength variants).
Figure 5.
Fatigue data measured from plain cylindrical specimens in air and salt fog environments (Low and High strength variants).
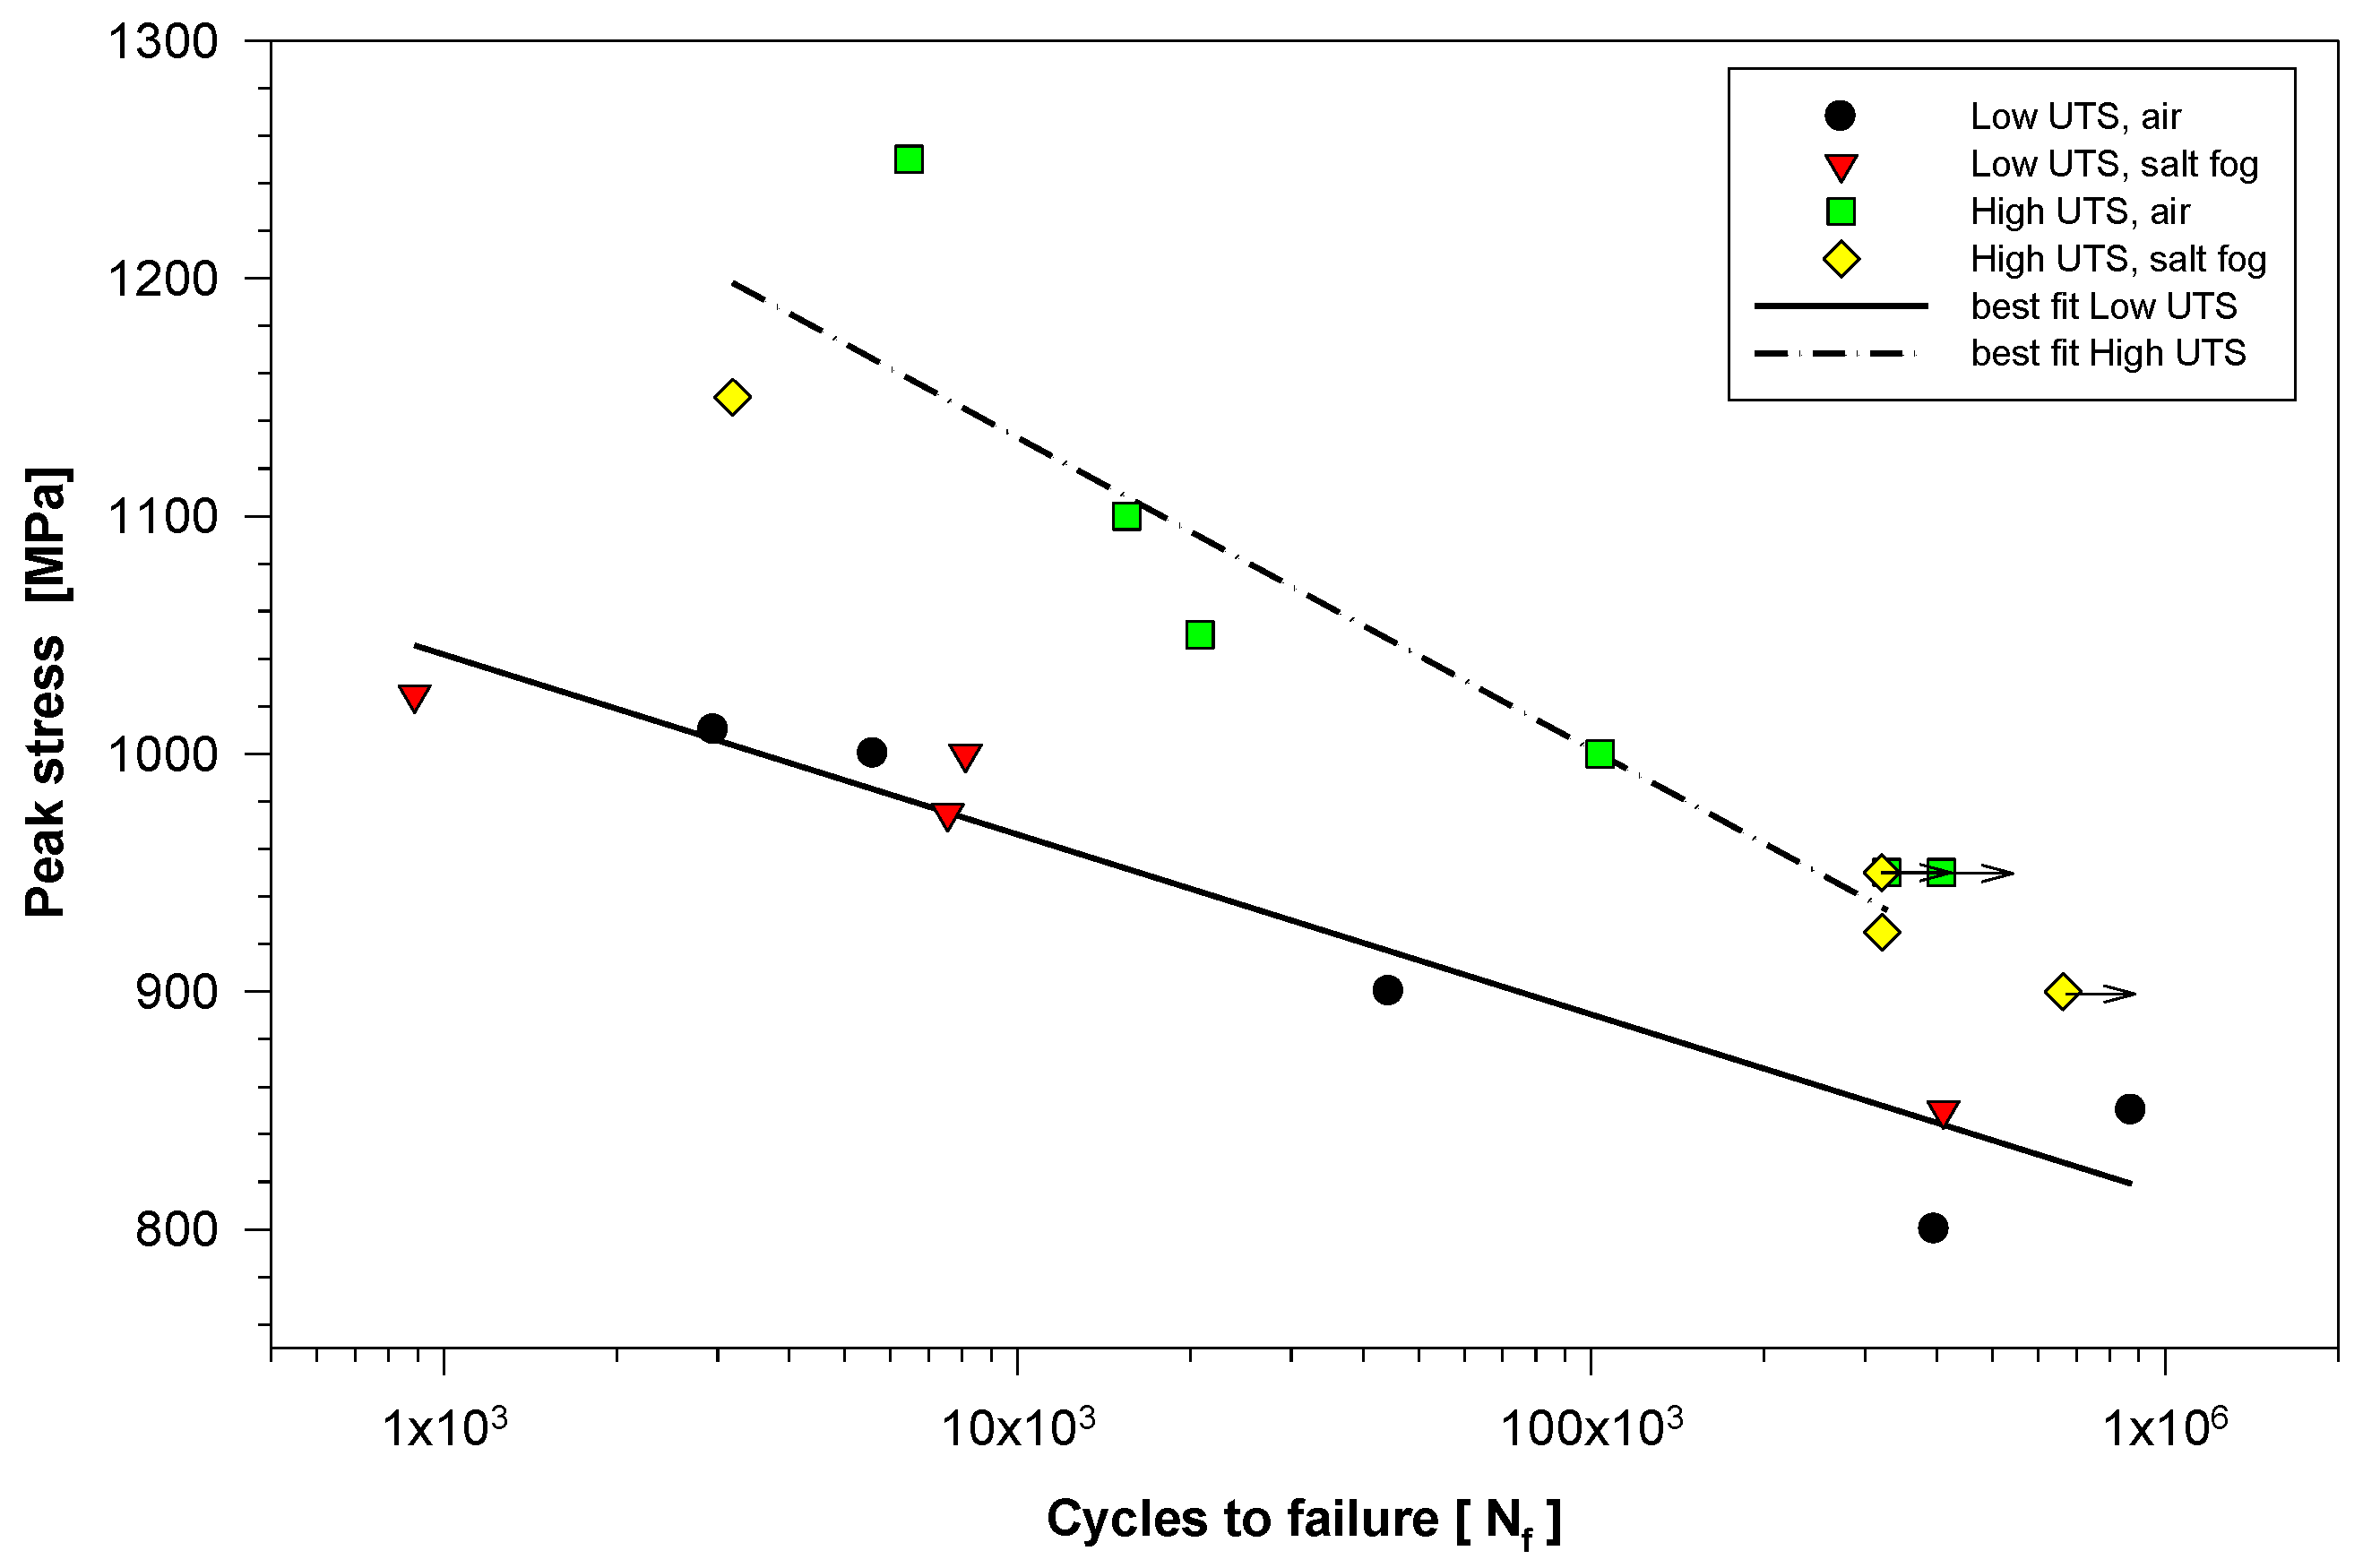
Figure 6.
Fatigue data measured from DEN specimens in air (Low and High strength variants).
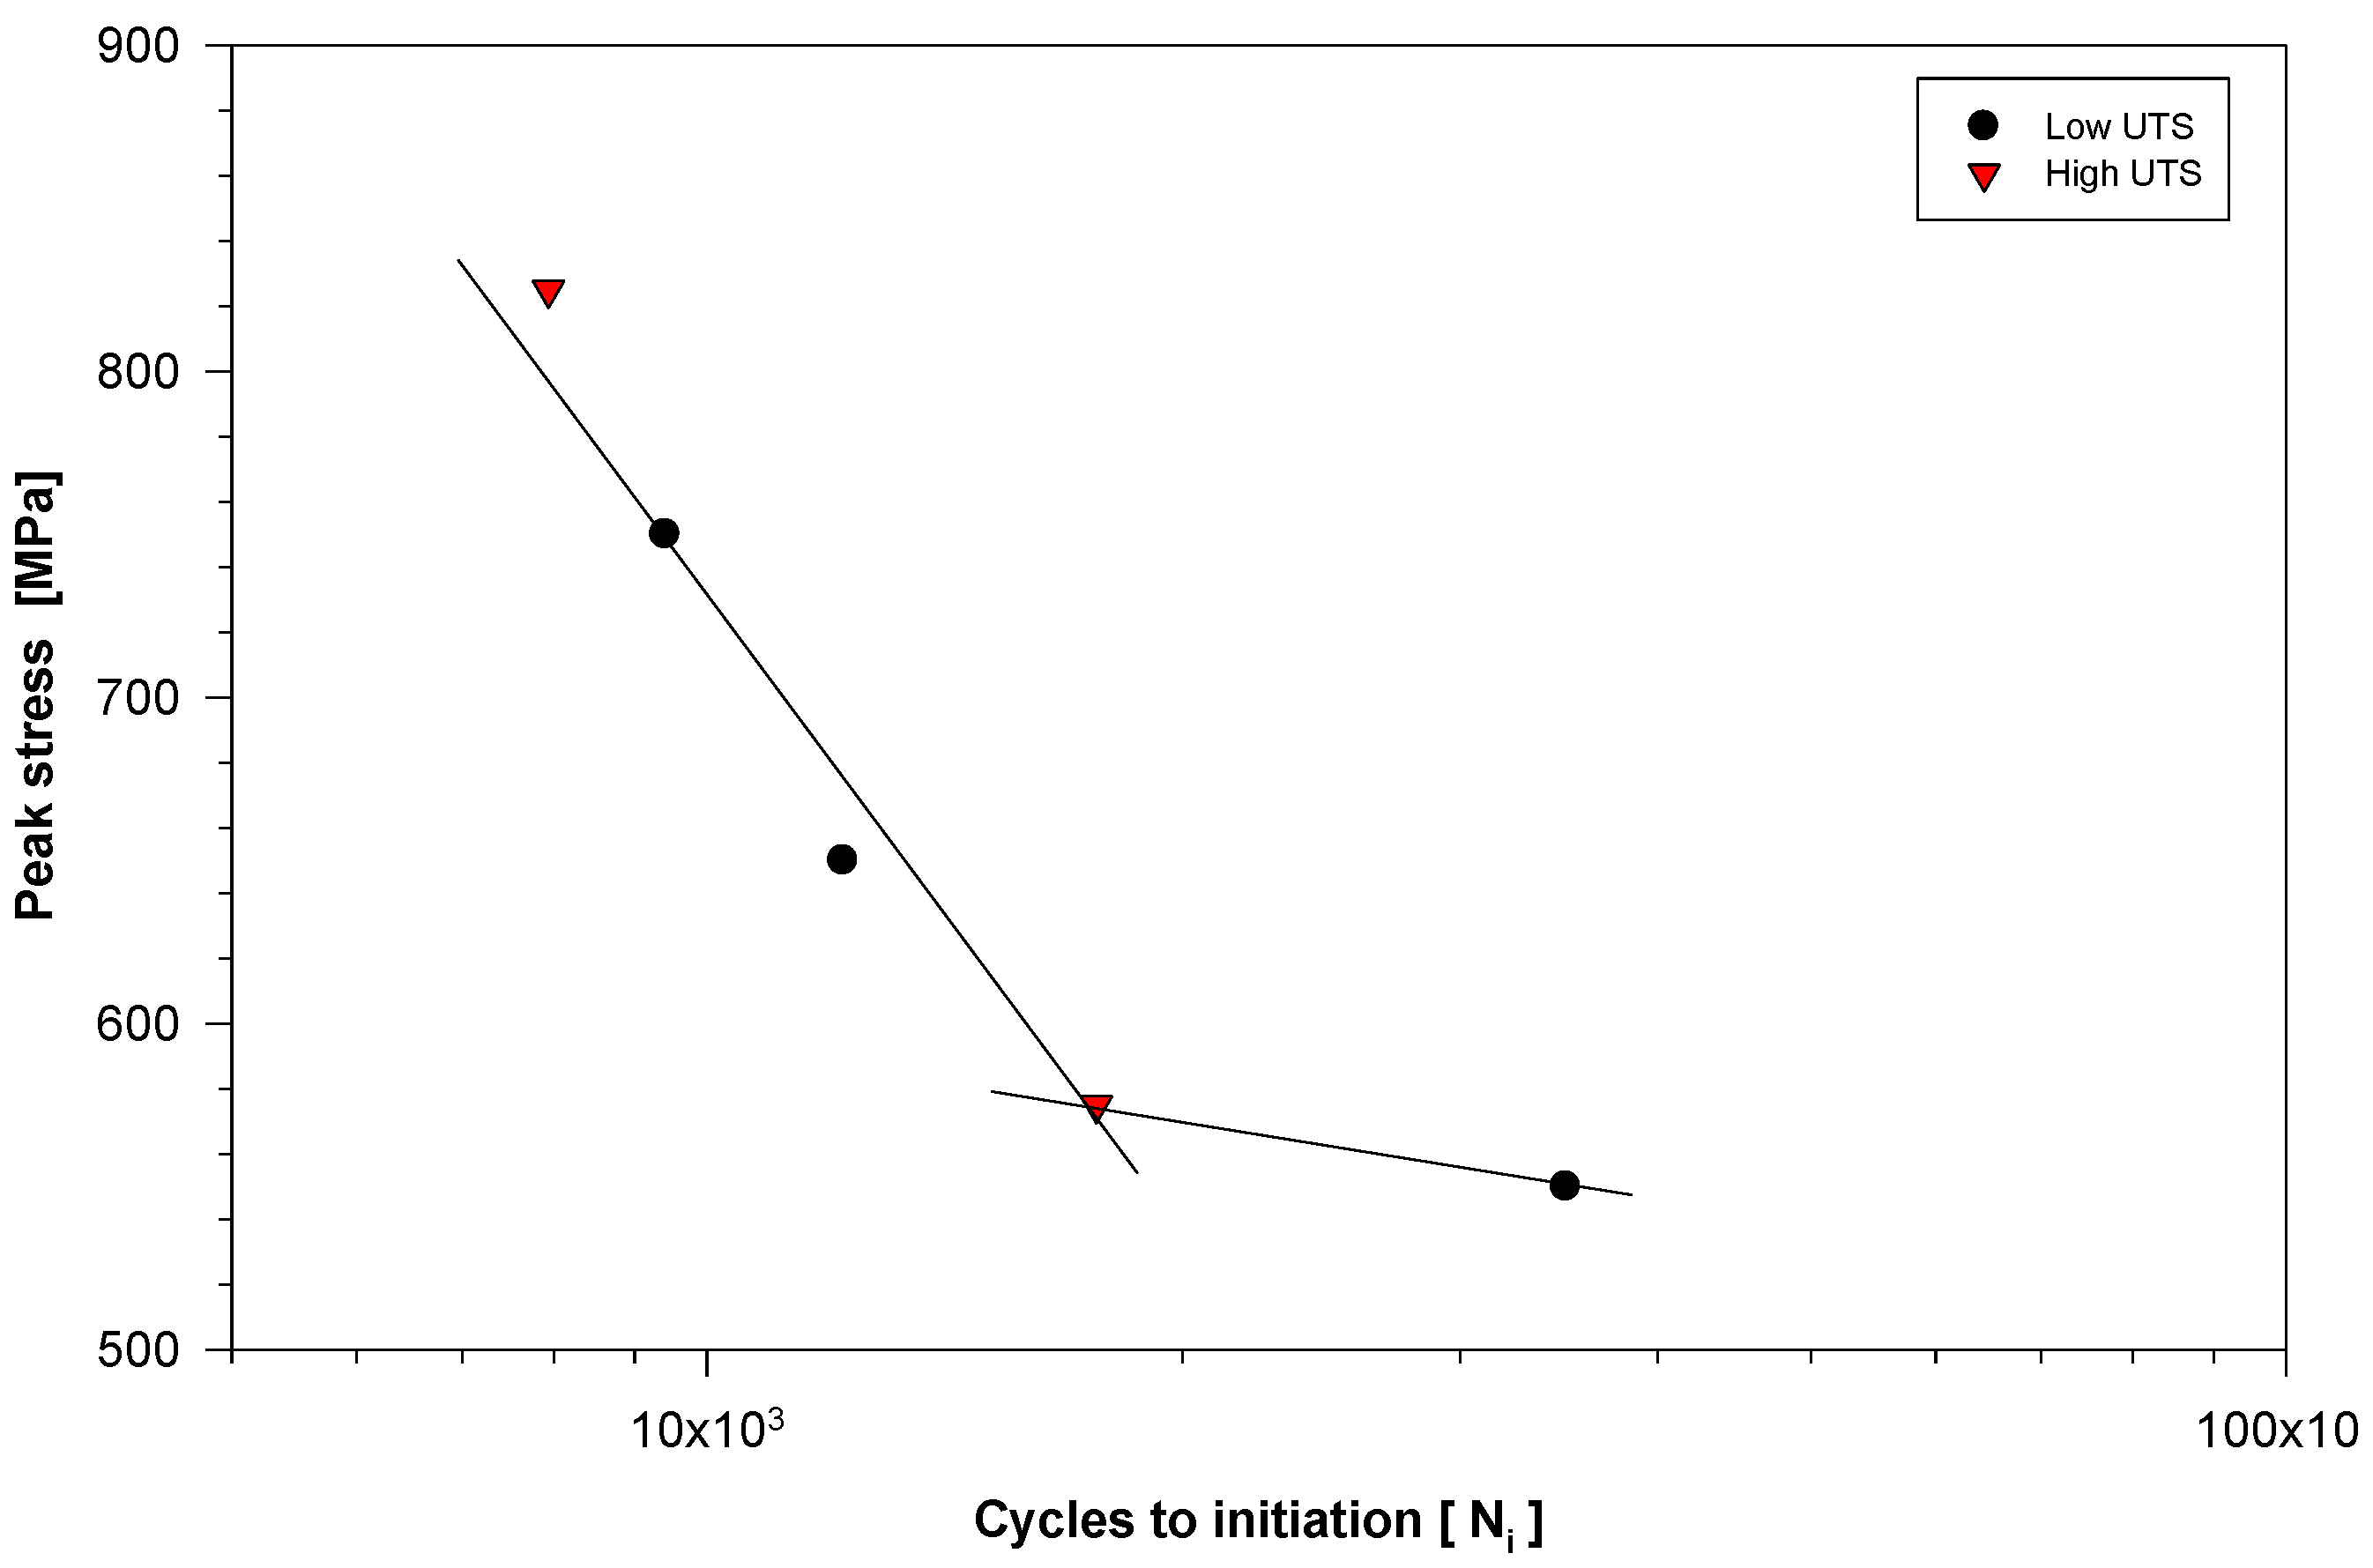
Figure 7.
Fatigue crack growth measured in Low UTS CC specimens tested under air at various mean stress conditions. All tests were performed with a peak stress of 300 MPa.
Figure 7.
Fatigue crack growth measured in Low UTS CC specimens tested under air at various mean stress conditions. All tests were performed with a peak stress of 300 MPa.
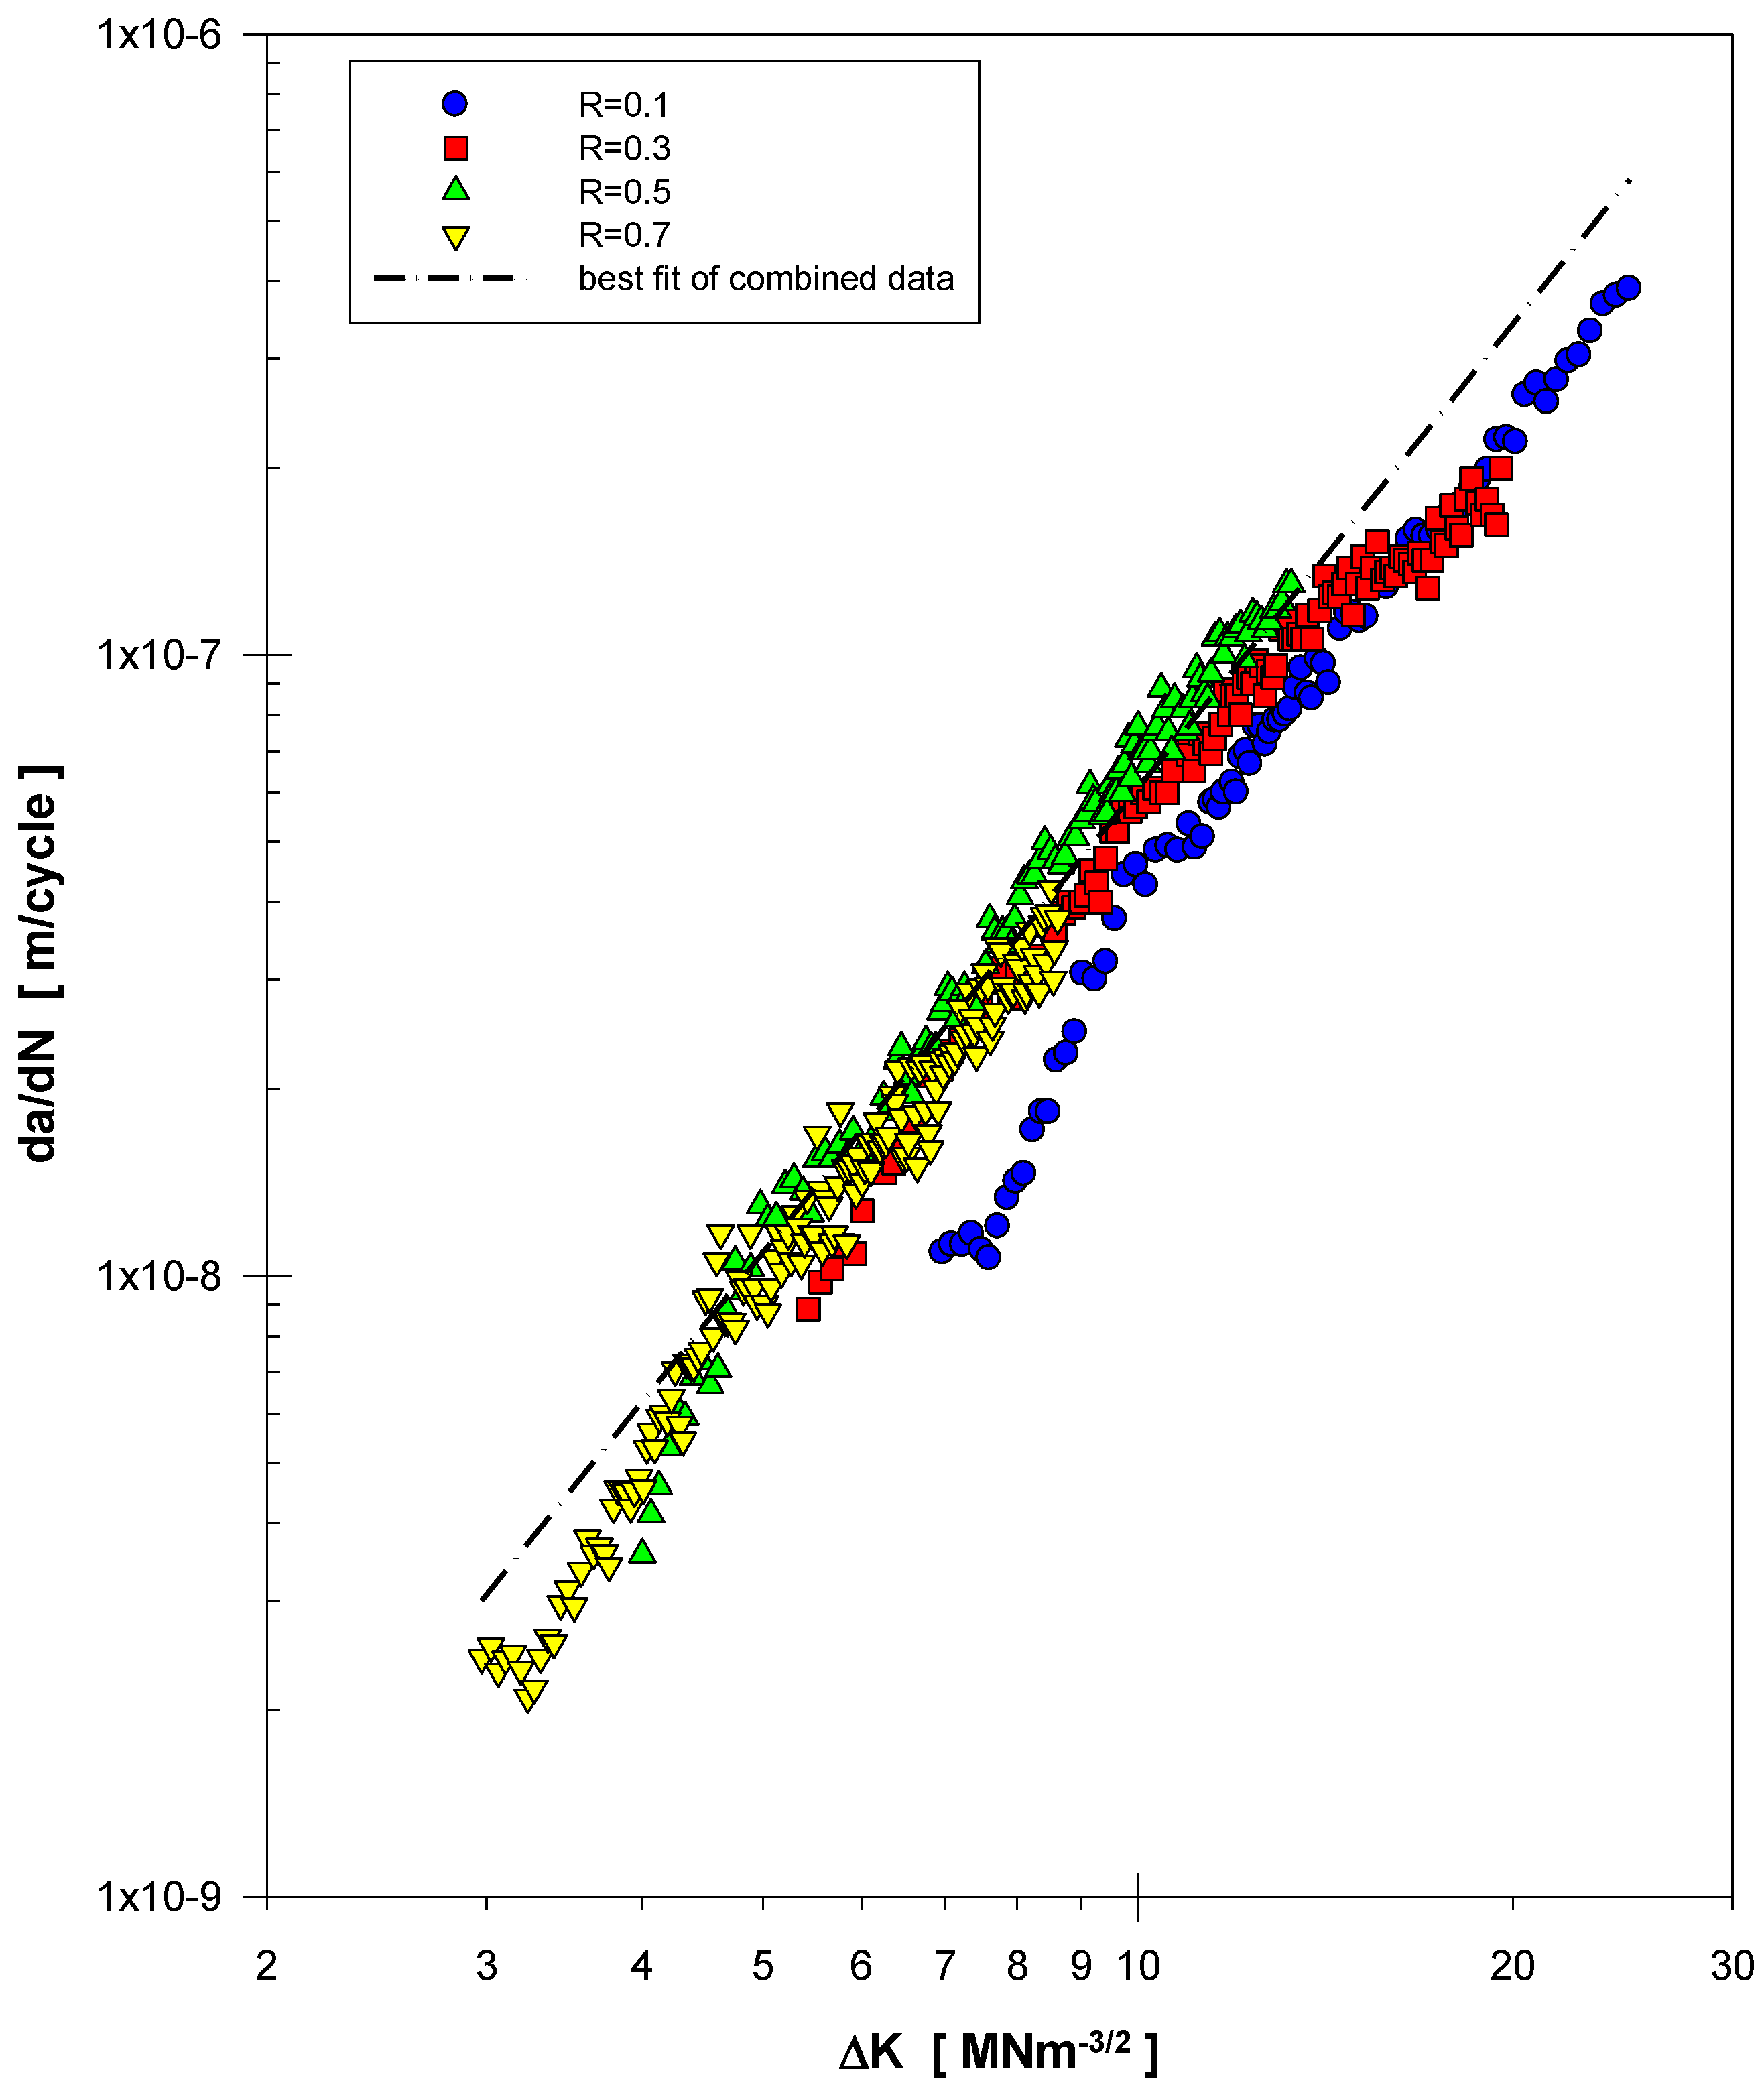
Figure 8.
Fatigue crack growth measured in Low UTS CC specimens tested under salt fog compared to the best fit trend from the combined air testing.
Figure 8.
Fatigue crack growth measured in Low UTS CC specimens tested under salt fog compared to the best fit trend from the combined air testing.
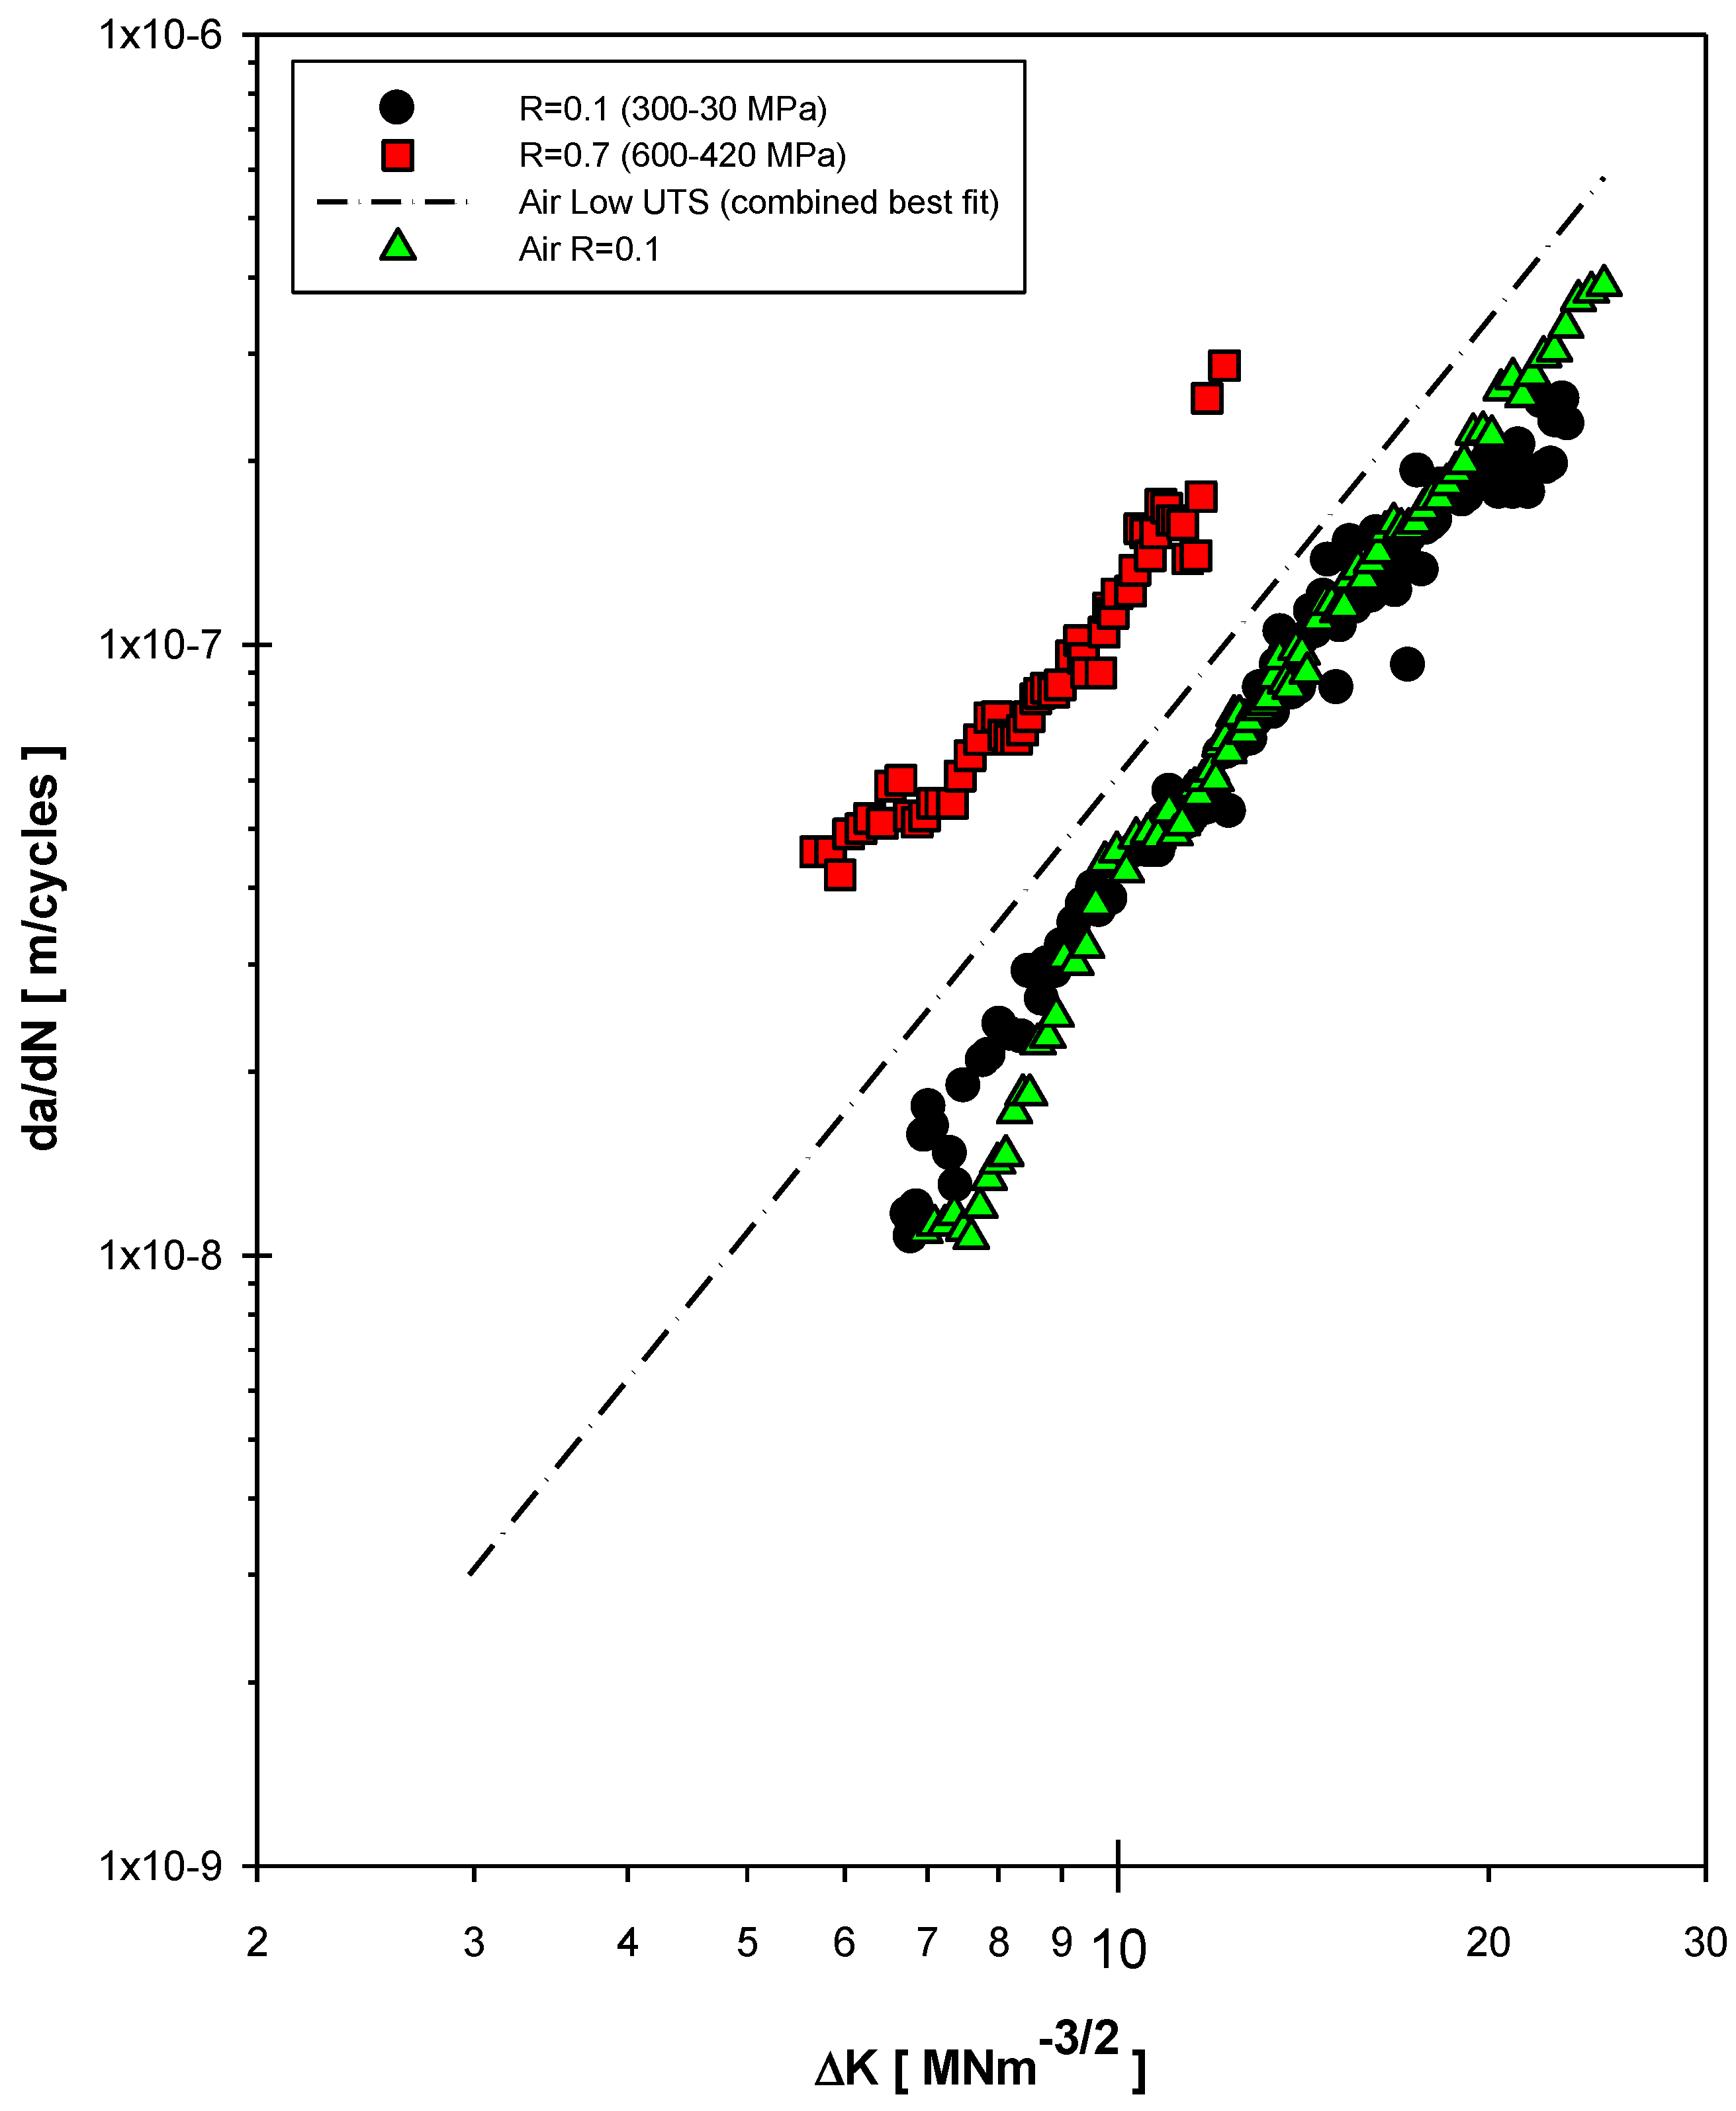
Figure 9.
Fatigue crack growth rates in DEN specimens (both variants) and a CC High UTS specimen. All tests were performed in air with a maximum stress of 300 MPa.
Figure 9.
Fatigue crack growth rates in DEN specimens (both variants) and a CC High UTS specimen. All tests were performed in air with a maximum stress of 300 MPa.
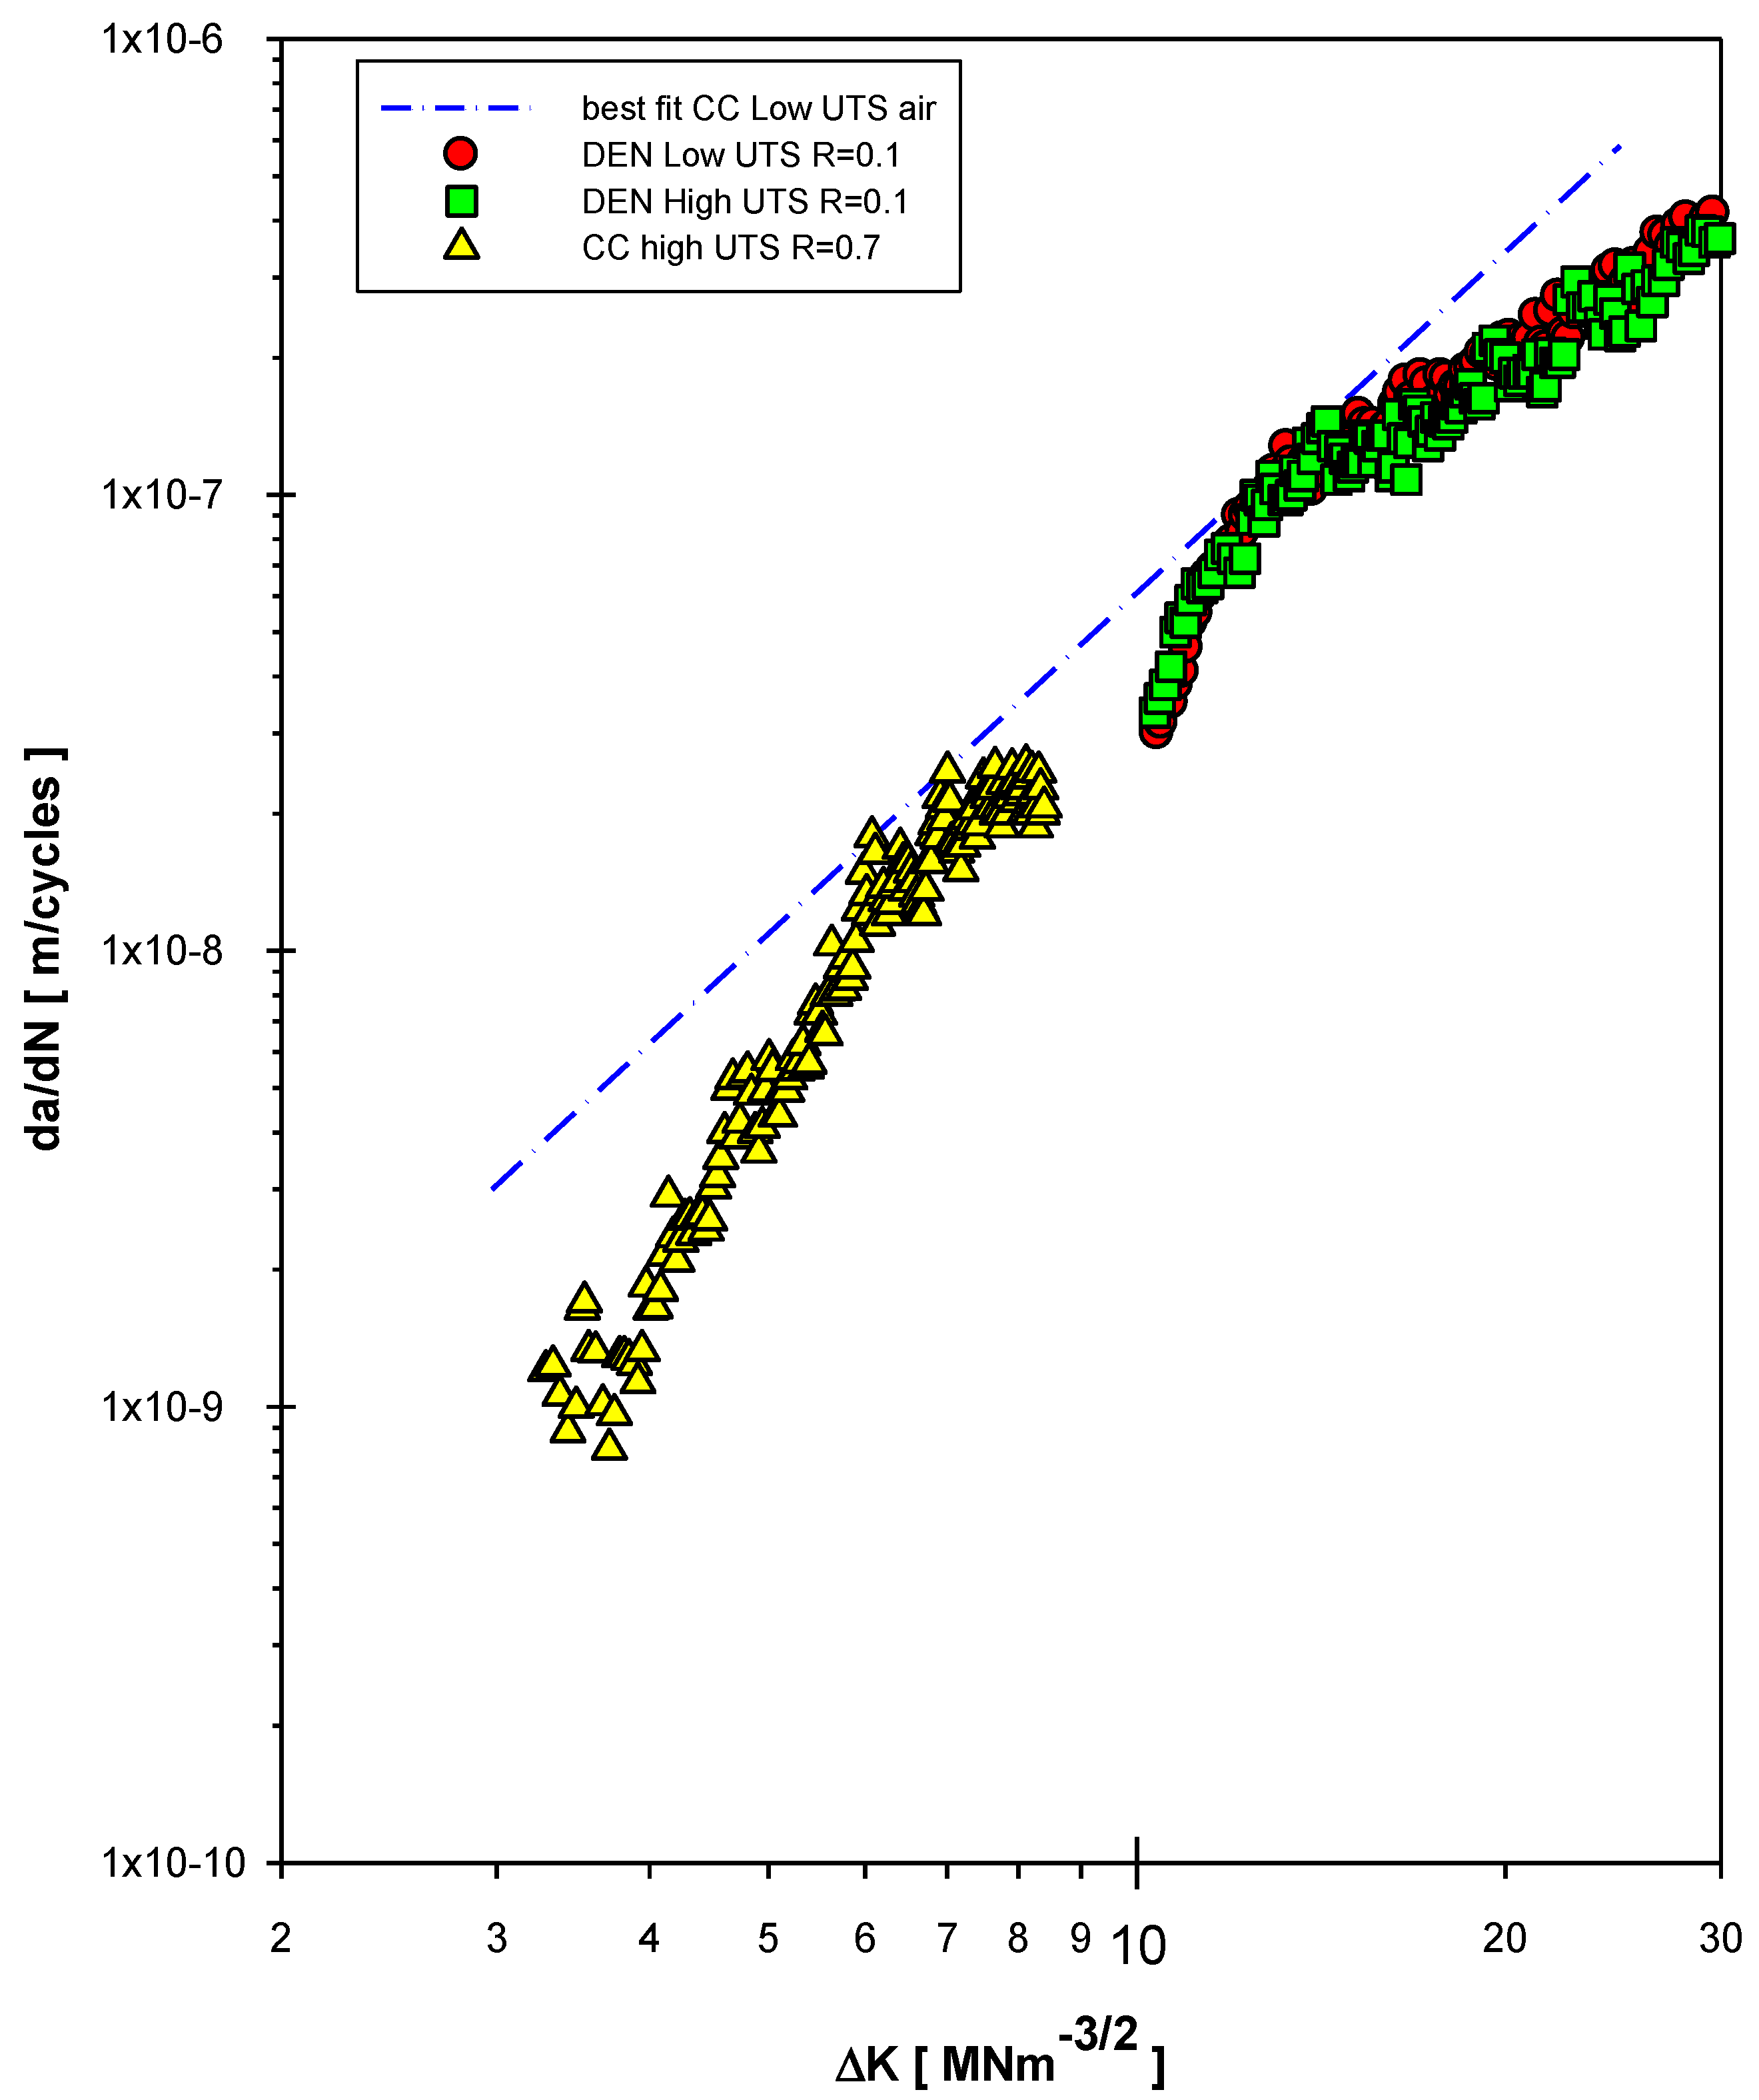
Figure 10.
Current DEN data (Kt = 1.9) compared to notch data from Reference #3 (Kt = 2.9) employing a peak elastic stress criterion (Kt × maximum applied stress).
Figure 10.
Current DEN data (Kt = 1.9) compared to notch data from Reference #3 (Kt = 2.9) employing a peak elastic stress criterion (Kt × maximum applied stress).

Table 1.
Fatigue results from the individual tests performed on plain cylindrical specimens.
| Peak Stress [MPa] | Cycles to Failure [Nf] | Peak Stress [MPa] | Cycles to Failure [Nf] |
|---|---|---|---|
| Air | |||
| Low UTS | High UTS | ||
| 800 | 396,378 | 950 | 327,678 |
| 850 | 873,220 | 950 | 407,025 * |
| 900 | 44,438 | 1000 | 103,539 |
| 1000 | 5607 | 1050 | 20,788 |
| 1010 | 2954 | 1100 | 15,494 |
| 1050 | 20 | 1250 | 6464 |
| Salt Fog | |||
| Low UTS | High UTS | ||
| 850 | 410,596 | 900 | 663,329 * |
| 975 | 7552 | 925 | 321,027 * |
| 1000 | 8109 | 950 | 320,847 |
| 1025 | 889 | 1150 | 3188 |
* Runout test.
Table 2.
Fatigue results from the individual tests performed on DEN specimens.
| Peak Stress [MPa] | Cycles to Initiation [Ni] | Peak Stress [MPa] | Cycles to Initiation [Ni] |
|---|---|---|---|
| Air | |||
| Low UTS | High UTS | ||
| 550 | 35,000 | 575 | 17,644 |
| 650 | 12,200 | 825 | 7936 |
| 750 | 9413 |
Table 3.
Paris m and C values calculated from CC tests on the Low UTS variant (valid across range of ΔK indicated).
Table 3.
Paris m and C values calculated from CC tests on the Low UTS variant (valid across range of ΔK indicated).
| R Ratio | C [m/cycle] | m | ΔKmin [MNm−3/2] | ΔKmax [MNm−3/2] |
|---|---|---|---|---|
| Air | ||||
| 0.1 | 4 × 10⁻¹¹ | 3.00 | 6.97 | 24.82 |
| 0.3 | 2 × 10⁻¹⁰ | 2.46 | 5.44 | 19.56 |
| 0.5 | 8 × 10⁻¹¹ | 3.02 | 4.00 | 13.28 |
| 0.7 | 2 × 10⁻¹⁰ | 2.54 | 2.97 | 8.62 |
| Combined air data | 2 × 10⁻¹⁰ | 2.48 | 2.97 | 24.82 |
| Salt Fog | ||||
| 0.1 | 2 × 10⁻¹⁰ | 2.36 | 6.76 | 23.20 |
| 0.7 | 1 × 10⁻⁹ | 2.04 | 5.68 | 12.20 |
Disclaimer/Publisher’s Note: The statements, opinions and data contained in all publications are solely those of the individual author(s) and contributor(s) and not of MDPI and/or the editor(s). MDPI and/or the editor(s) disclaim responsibility for any injury to people or property resulting from any ideas, methods, instructions or products referred to in the content. |
© 2023 by the author. Licensee MDPI, Basel, Switzerland. This article is an open access article distributed under the terms and conditions of the Creative Commons Attribution (CC BY) license (https://creativecommons.org/licenses/by/4.0/).
Share and Cite
MDPI and ACS Style
Bache, M. Fatigue and Fracture Evaluations in Ti-10V-2Fe-3Al (Ti 10-2-3). Metals 2023, 13, 1986. https://doi.org/10.3390/met13121986
AMA Style
Bache M. Fatigue and Fracture Evaluations in Ti-10V-2Fe-3Al (Ti 10-2-3). Metals. 2023; 13(12):1986. https://doi.org/10.3390/met13121986
Chicago/Turabian StyleBache, Martin. 2023. "Fatigue and Fracture Evaluations in Ti-10V-2Fe-3Al (Ti 10-2-3)" Metals 13, no. 12: 1986. https://doi.org/10.3390/met13121986
Note that from the first issue of 2016, this journal uses article numbers instead of page numbers. See further details here.