Article

Influence of Microstructure on the Mechanical and Corrosion Response of a Friction Stir-Extruded WE43 Magnesium Rod

by
Maryam Al-Buainain
1,2,
Vasanth C. Shunmugasamy
1,
Chaudhry A. Usman
1 and
Bilal Mansoor
1,2,3,*
1
Mechanical Engineering Program, Texas A&M University at Qatar, Education City, Doha 23874, Qatar
2
Department of Materials Science and Engineering, Texas A&M University, 575 Ross Street, College Station, TX 77843, USA
3
Department of Mechanical Engineering, Texas A&M University, 202 Spence Street, College Station, TX 77840, USA
*
Author to whom correspondence should be addressed.
Metals 2023, 13(2), 191; https://doi.org/10.3390/met13020191
Submission received: 9 November 2022 / Revised: 1 December 2022 / Accepted: 10 December 2022 / Published: 18 January 2023
(This article belongs to the Special Issue Severe Plastic Deformation Techniques of Metal Alloys)

Abstract

:
Friction stir extrusion (FSE) was used with WE43 Mg to create a rod with a hybrid microstructure. The rod’s electrochemical corrosion response was characterized in Hank’s balanced salt solution at 37 ± 1 °C. The rod showed refined grains near the edge, while coarse grains were observed at the rod center. A larger fraction of precipitates was observed near the edge possibly hindering grain growth. The refined grains and the presence of a larger fraction of precipitates in the edge regions resulted in higher hardness owing to a confluence of precipitate hardening and solid–solution strengthening. Texture analysis of the rod cross-section exhibited a basal texture, perpendicular to the extrusion direction and populating the rod’s outer surface. In compression, the rod showed a near-base material yield strength (225.6 MPa) and a good combination of compressive strength (357.5 MPa) and ductility (~17.7%). The rod’s electrochemical corrosion response was sensitive to variations in the grain size, texture, and precipitate distribution between the rod core and edge regions. Removal of the edge region resulted in the formation of a more stable and protective film with an increase in the immersion period. The results from the study establish the ability of the FSE process to tailor the rod microstructure thereby influencing the mechanical properties and corrosion rate of Mg alloy.

Graphical Abstract

1. Introduction

Magnesium (Mg) and its alloys are lightweight materials with high specific mechanical properties. These attributes make Mg materials comparable to many polymers in terms of weight while providing better strength [1]. Mg is also a biocompatible material that does not induce a toxicological tissue reaction since it exists naturally in the human body [2]. The applications of Mg can also be seen in the automobile industry and in structural applications, where it can be used in structural members and components [3,4]. Another important application where Mg alloys are preferred is in dissolvable frac plugs in the oil and gas industry [5,6]. Temporary tools such as plugs may require expensive machinery to be extracted after service; using some Mg alloys can eliminate such problems, as the alloys can fully dissolve due to the microgalvanic corrosion effect they exhibit [5,6].
Although Mg is an excellent material to be utilized in the oil and gas industry, biomedical, and transportation sectors, it exhibits problems such as low deformability at room temperature. This is due to the low symmetry of the HCP crystal structure, which requires heat input to activate additional slip systems and to accommodate large strains [7]. Therefore, the low deformability of Mg necessitates thermomechanical processing schemes with sufficient heat input to achieve the desired structures.
In this context, WE43, a precipitation-hardened rare earth alloy containing Mg alloy, is suitable for structural and biomedical applications [1,8,9,10,11]. The introduction of alloying elements helps to improve the deformability of Mg by reducing the differences in critically resolved shear stress between the slip modes and in promoting non-basal slip modes [12]. Specifically, rare earth (RE) elements have been found to alter the texture of Mg alloys which promote non-basal slip during the deformation and growth of non-basal-oriented grains [12,13]. WE43 Mg alloy consists of an α-Mg matrix and intermetallic phases, rich in yttrium (Y), zirconium (Zr), and neodymium (Nd) [14]. The addition of the intermetallic phases to the α-Mg matrix introduces localized corrosion owing to the galvanic coupling between cathodic intermetallic phases and the anodic α-Mg matrix [15,16,17]. It has also been reported that the distribution of the intermetallic phases has a crucial role in altering the corrosion behavior of Mg alloy [18,19]. This means that by controlling the distribution of the intermetallic phases, the corrosion response of a Mg alloy can be engineered.
Friction Stir Extrusion (FSE), which works on Friction Stir Processing (FSP) principles, is a solid-state process that uses severe plastic deformation (SPD) and frictional heat to deform and recrystallize the material into the desired shape in a single stage of processing [20]. During FSE, a stirring tool rotates and moves in a vertical motion, and gets plunged into a metallic workpiece resulting in a three-dimensional material flow resembling a spiral that is forced through a rigid internal channel within the tool to create a rod [21]. The high frictional force and SPD during FSE result in temperature increases along with extruded material subjected to higher strain rates. Such an increase in temperature and strain rate influences the extruded rod’s microstructural features, resulting in an engineered mechanical and corrosion behavior [22]. Process parameters such as the tool’s rotational speed, vertical displacement, extrusion force, and process temperature play a vital role in controlling the grain size, grain orientation, and precipitate distribution in the rod [7]. Grain refinement, texture, and change in the precipitate distribution are the main microstructural modifications that affect the rod’s mechanical and corrosion response [22]. Therefore, by modifying the process parameters, rod properties can be controlled.
In our pilot work on preparing Mg AZ31 alloy rods using the FSE process, an engineered microstructure with two distinct regions containing refined grains at the rod edge and coarse grains at the rod center was obtained [23]. FSE used with AZ31 Mg alloy chips to produce rods showed that grain size distribution differs moving from the edge to the rod center [24]. Severe plastic deformation of the grains was observed near the rod’s edge, while grain growth and recrystallization were detected in the central region [25]. In another study on FSE utilized to prepare an AZ31 Mg alloy tube, the difference in grain size and texture distribution across the tube wall thickness was observed [22]. The study showed that the prepared AZ31 tube corrosion was influenced by several factors such as residual stress, grain size, and texture variations between the inner and outer edges of the tube wall [22]. The corrosion behavior of FSPed WE43 showed that the corrosion rate improved after processing as a result of the refined grains and a more uniform precipitate distribution; however, microgalvanic corrosion was still dominant [16]. These studies validate the ability of FSE in engineering the microstructure and thereby influencing the overall corrosion behavior of the processed material.
The application of FSE process to precipitate containing light metal alloy remains an open question, as the material flow can impact the resulting rods or tube microstructure and nature of precipitates. In this context, WE43 Mg alloy introduces new challenges such as porosity, incomplete consolidation of the extruded rod, oxidation, and a high extrusion force. Overcoming such challenges, there is a significant benefit in utilizing fully consolidated friction stir-extruded rods as structural members, frac plugs, and biomedical devices. There is very limited literature reported on the microstructural, mechanical, and corrosion properties of precipitation-strengthened Mg alloy rods prepared using the FSE process. The present work addresses this concern; FSE was applied to a rare earth-containing Mg alloy, WE43, to prepare a rod with an engineered microstructure. Our goal was to investigate the relationship between the microstructure, mechanical, and corrosion behavior of the WE43 Mg alloy rod, especially the role that precipitates play in tailoring them.

2. Materials and Methods

The Mg alloy used in this work is a 20 mm thick plate of rolled WE43 Mg alloy with a nominal composition of 4.1 wt% Y, 2.4 wt% Nd, 0.62 wt% Zr, and 1.25 wt% Gd obtained from a commercial vendor (Suzhou Chuanmao Metal Material Co. Ltd., Suzhou, China). The workpiece for friction stir extrusion was obtained from this base material sheet in cylindrical form (40 mm in diameter) cut using waterjet machining. The schematic of the FSE process utilized in the present work is illustrated in Figure 1. FSE was carried out on a five-axis FSW machine (CFSWT, China FSW Center, Beijing, China) using a custom-designed FSE tool and mild steel die comprising a temperature-controllable heating coil. The FSE tool was custom-made from H13 tool steel containing a through cavity of 10 mm internal diameter for the material to extrude into. The base of the tool was comprised of four flutes to assist in deforming the workpiece and enable material flow into the extrusion cavity.
Prior to the FSE process, the die and FSE tool cavity were coated with a high-temperature solid lubricant to assist material flow and to ease the extruded rod removal post-experiment. The die and workpiece were heated to a steady-state temperature of 400 °C before FSE to facilitate material flow. FSE parameters utilized were a tool rotation of 1200 rpm, a constant transverse rate of 1 mm/min, and a dwell time of 60 s preceding the tool plunge. The parameters were chosen based on the results of prior experiments varying the process parameters. The microstructure of the extruded rod was studied from a cross-section taken from the rod middle. The specimens were metallurgically prepared and then etched with acetic-picral solution to reveal the microstructure [22]. The axes assigned for the base material (BM) rolled sheet and the extruded rod are represented in Figure 1. The rolled sheet reference frame is the rolling direction (RD), transverse direction (TD), and normal direction (ND). For the extruded rod, the assigned axes are the extrusion direction (ED) and normal directions 1 and 2 (ND 1-ND 2).
Furthermore, to investigate the microstructure, precipitate evolution, and observe grain size distribution, optical micrographs were obtained using an optical microscope (OM, Zeiss AxioVert40MAT fitted with ERC5 camera, Carl Zeiss Light Microscopy, Gottingen, Germany). The microstructure was also obtained using a scanning electron microscope (SEM, Thermo Fisher Apreo model, Thermo Fisher Scientific BV, Breda, The Netherlands) to explore more detailed microstructural features and intermetallic distribution. Grain size analysis was performed using ImageJ software based on microstructure images obtained from OM and SEM. Elemental maps and line analysis were generated using Energy-dispersive spectrometry (EDS, Thermo Fisher, Thermo Fisher Scientific BV, Breda, The Netherlands) equipped with SEM. X-ray diffraction (XRD) measurements of the BM and friction stir-extruded rod were taken using a RIGAKU Ultima IV (Rigaku Corporation, Tokyo, Japan) and a diffractometer with CuKα radiation, 40 kV, between 22° and 80°. The texture analysis of the BM and friction stir-extruded rod was assessed with an electron backscatter diffraction (EBSD) detector and a Hikari Super Camera connected to a Philips XL 30 SFEG microscope in the ND 1-ND 2 planes. The step size used was 1 µm for the coarse grains, 0.4 µm for the fine grains, and a confidence index filter of 0.1 was also used.
The structural integrity of the rod was evaluated by studying hardness (micro- and nanoscale) distribution and compressive properties. Vickers microhardness testing (Future Tech FM-310, Japan) was conducted using an applied force of 50 gf and a dwell time of 15 s. Nanoindentation measurements were executed on the BM and FSE rod using a Hysitron TI Premier (Hysitron Inc., Minneapolis, MN, USA) with a standard Berkovich diamond tip indenter. The applied load was 4000 µN and a loading time of 5 s, a holding time of 10 s, and an unloading time of 5 s were used. Compression testing was performed using an MTS Insight tester fitted with a 30 kN load cell at a strain rate of 10−3/s, on both the BM and FSE rod.
Electrochemical testing was performed on the BM and FSE rod (ND 1-ND 2 plane) samples with a cross-sectional diameter of 1 cm. The electrochemical setup is a classical three-electrode cell from Gamry (MultiPort Corrosion Cell Kit) connected to a Gamry Reference 3000 potentiostat. The sample was the working electrode while the reference electrode was a Ag/AgCl electrode, and the counter electrode was a graphite rod. Hank’s balanced salt solution (HBSS) was used at 37 ± 1 °C with a buffer solution to keep the pH level between (7.4–7.5) to simulate human body conditions. The electrochemical impedance spectroscopy (EIS) experiment was carried out for 28 h (1680 min), and the scans were acquired from 100 kHz to 0.01 Hz with a sinusoidal potential of 10 mV RMS. Open circuit potential (OCP) measurements were also collected while performing the EIS experiment. The potentiodynamic (PD) scan started after 30 min of open circuit potential (OCP) measurements on a freshly prepared sample to ensure that the OCP reached a steady-state condition. The measurements were taken by scanning the electrode from −2.8 to −0.9 V. vs. Eref, and the scan rate for PD was 0.7 mV/s.

3. Results

3.1. Microstructure

The microstructure of the as-received rolled WE43 is shown in Figure 2; the base metal has an average grain size of 17.1 ± 7.1 µm with intermetallics (Figure 2b). Some of the secondary phases are cuboid-shaped precipitates dispersed in the α-Mg matrix as shown in Figure 2c. EDS area mapping of the BM shows that the intermetallics are rich in Nd while the cuboid-shaped phases are rich in Y- and Zr-, as shown in Figure 2. The solubility of elements in Mg is directly related to their atomic number, i.e., the lower the atomic number, the lower the solubility of the alloying elements in Mg [25,26]. In the case of the alloying elements in WE43 Mg alloy, the atomic number of Gd, Nd, Zr, and Y were 64, 60, 40, and 39, respectively [25,26]. Gd creates a solid–solution with the α-Mg matrix and has a more uniform distribution, as observed in the EDS map in Figure 2, since the atomic number of Gd is relatively higher compared to the other alloying elements. Furthermore, the cuboid-shaped precipitates are mostly made of Zr and Y since both elements have similar atomic numbers, hence a similar solubility.
An exemplar extruded rod prepared using the FSE process is shown in Figure 3. Visual inspection of the extruded rod shows a sound structure free of defects, voids, or cracks. The optical macrostructure image of the rod’s cross-section (ND 1-ND 2 planes) is shown in Figure 3a. The FS extrusion process of the WE43 Mg alloy rod led to the emergence of three main regions in the rod’s cross-section, namely edge (E), transition (T), and core (C) regions. Magnified OM and SEM images of the different regions are shown in Figure 3b–f. From Figure 3b,c, it can be observed that a gradient in grain size occurs within the edge region. The average grain size near the edge–tool interface was 20.1 ± 9.3 µm, while near the edge–transition interface, an average grain size of 64.4 ± 32.5 µm was observed. A eutectic phase located intermittently along the grain boundaries and distributed more toward the transition region was also observed in the edge region. The transition region showed refined grains, with an average grain size of 22.1 ± 7.8 µm. As shown in Figure 3e,f, the transition zone has no visible eutectic phase; however, Nd- and Y-rich precipitates are observed in the grains and along the grain boundaries in the transition region of the friction stir-extruded rod [27,28,29,30]. The extruded rod core, Figure 3d, shows the largest grain size with an average grain size of 115.2 ± 43.2 µm, resulting from grain growth due to the heat generated during the FSE process, with fewer eutectics decorating the grain boundaries.
A more detailed microstructural analysis was carried out across the different regions of the rod. The below-summarized results are based on the analysis of different cross-sections along the rod length and similar observations were made. Figure 4 represents SEM, EDS—line analysis, and map scans obtained from the edge region. Generally, the edge has more refined grains and a higher concentration of cuboid-shaped precipitates, as shown in Figure 4a. The variation of the elements along the line shown in Figure 4a is presented in Figure 4b, and the results show Y- and Zr-rich precipitates in the Mg matrix. This is consistent with the findings of the BM, where the cuboid-shaped phase mostly contains Y and Zr, Figure 4. Moreover, Figure 4c shows a magnified EDS area map scan of the cuboid-shaped precipitates cluster where there is a high concentration of Y and Zr in the cluster region. These clusters have been observed in some discontinuous regions at the rod’s edge. Similar behavior of precipitate clustering was found in hot-deformed WE43 Mg alloy where strips of the clustered precipitate appeared along the extrusion direction [31]. In the case of the friction stir-extruded rod, the clustering of precipitates was found to be in a circular path along the edge. Additionally, precipitate clustering is a contributing factor in hindering α-Mg grain growth due to the pinning force exerted by the cuboid-shaped precipitates on the α-Mg grain boundaries [32]. Similar behavior of the pinning effect of precipitates was observed in the transition region, where grain growth was hindered by the high intensity of Nd- and Y-rich precipitates.
Figure 5 represents the friction stir-extruded rod core region (C) showing large grains. An SEM image of a core grain containing deformation bands is shown in Figure 5a. The EDS line analysis of the grain shows the presence of cuboidal precipitates in the grain interior, as seen in the line scan in Figure 5b, which indicates that the cuboid-shaped precipitates did not fully dissolve into the α-Mg matrix. This can be ascribed to elements with a low atomic number having a lower solubility in the α-Mg matrix [25]. The EDS area map scan of the eutectic phase in the core is represented in Figure 5c,d. The EDS analysis shows the presence of Nd-rich eutectic along with Zr- and Y-rich cuboidal precipitates in the rod core region.
To study the variation of elements across the rod regions, EDS Line compositional analysis of the core grains and across the rod moving from the core to the edge region is shown in Figure 6a,b. Figure 6a, it can be seen that the content of the RE metals is more toward the grain boundaries while the content of Mg increases in the grain center, indicating precipitation along the grain boundaries. Also, from Figure 6b, it can be observed that there is a composition gradient from the core toward the edge region, with decreasing Mg content and increasing RE elements. To further understand the element distribution within the different regions, EDS spot analysis was carried out on the α-Mg matrix and precipitates in the rod core and edge regions and the results are presented in Figure 7a and Figure 7b, respectively. It can be observed that the content of Y and Zr elements in the α-Mg matrix increased in the edge region, while the content of RE (Nd and Gd) elements increased in the core’s α-Mg matrix. The eutectic phase in the edge region had a higher Y and Zr content than the eutectic phase in the core region.
XRD spectra obtained from the BM and the rod cross-section are shown in Figure 8. The spectra show phases in the BM and rod are composed mainly of the α-Mg matrix and precipitates such as Mg24Y5, Mg41Nd5, and Mg12Nd. Peaks corresponding to precipitates containing lower concentrations of elements such as Zr were not detected in the XRD spectra. The strong intensity of the (0002) peak at 34.3° [33] can be noticed in the BM which indicates that the basal plane is parallel to the sample rolling direction. In the FSE sample, the intensity of the prismatic plane (10 1 ¯ 0 ) at 32.2° is the highest, while there is a relatively fair amount of intensity of the basal plane (0002) and the pyramidal plane (10 1 ¯ 1 ) at 36.2° [33]. The results show that FSE has played a significant role in altering the Mg alloy texture compared to the BM. These results were further explored through the texture measurements obtained from the rod and BM.
During the FSE process, the material gets severely plastically deformed as it gets subjected to a high amount of strain [34]. The strain and strain rate are directly connected to the microstructural features of the extruded rod, which in return controls the rod characteristics. The effect of strain rate on FSE has been studied before in recycled machining chips made from an AZ31 Mg alloy [35]. The study showed the appearance of three microstructurally different regions in the friction stir-extruded rod cross-section owing to severe plastic deformation resulting in grain refinement near the edge while grain growth occurred in the core, resulting from a decreasing strain rate toward the core [35]. Consequently, the strain and strain rate can be major contributors to microstructural evolution in different regions of the friction stir-extruded rod.
Based on the SEM, OM, and XRD analysis, the evolution of the FSE rod microstructure can be explained as follows. FSE results in refined grains in the edge region, owing to severe plastic deformation. Figure 3b,c show the existence of the eutectic phase and some large grains in the edge region which have grown from the refined grains. Since the process occurs at elevated temperatures, the rod experiences significant heat input from the frictional effort between the tool and workpiece resulting in recrystallization and recovery, followed by grain growth [32]. A higher fraction of precipitates are observed in the edge and transition regions, slowing down the grain growth compared to the core region, where fewer precipitates are observed (Figure 5). This resulted in the compositional gradient observed in the EDS line map moving across the core to the edge region (Figure 6b).

3.2. Texture Analysis

EBSD measurements were performed on the rod cross-section in the ND1-ND2 plane in the center and edge regions, along with the BM, and the results are presented in Figure 9. Since the base material is a rolled plate, there is a predominant basal texture with basal poles (0001) parallel with the rolling plane, as illustrated in Figure 9a,b [36,37]. The rod core is exposed to lower strain rates along with elevated temperatures produced from frictional forces [35], leading to recrystallization followed by grain growth, as seen in Figure 3d. The texture and IPF figures of the core, Figure 9c,d, show a predominant prismatic texture with the basal poles oriented perpendicular to the ED in a concentric fashion around the ED. The edge region also shows a predominant prismatic texture, as shown in Figure 9e,f, with the basal poles (0001) aligned perpendicular to the ED along the ND1 and inhabiting the rod’s external surface. Studies on the FSE of Mg alloys have shown the basal pole (0001) aligning perpendicular to the extrusion direction and aligning parallel to normal planes in regions that are subjected to severe plastic deformation near the tool–workpiece interface [21,22,38].

4. Discussion

4.1. Mechanical Properties

The prepared Mg alloy rods were characterized for nano- and microscale hardness distribution and compressive mechanical properties. The microhardness contour plot across the extruded rod in the cross-sectional (ND1-ND2) plane is shown in Figure 10. It can be noticed that the microhardness values increase toward the rod edge (max—122.5 HV) while they decrease moving toward the core (min—46.9 HV). The decrease in hardness as we move from edge to core is gradual through the different microstructural zones. The observed trend correlates with the Hall–Petch relationship between grain size and microhardness for Mg alloys [39,40]. The refined grains, along with the higher precipitate concentration observed in the rod edge (Figure 10) hinder the movement of dislocations, thereby enabling a higher hardness compared to the core region.
Due to the evolution of complex microstructural features during the FSE process with differences in grain size and precipitate distribution, nanoindentation measurements were performed on an α-Mg matrix and eutectic phase to observe the change in properties arising due to the FSE process. The results from nanoindentation are represented in Figure 11, with nanoindents on the α-Mg and eutectic phases shown in Figure 11a. The difference in the mechanical response for both the α-Mg matrix and eutectic phase in the core and edge regions is evident from the load–displacement curves shown in Figure 11b. The hardness results from nanoindentation show that the rod zones show a lower hardness compared to the BM, and this could be ascribed to the thermomechanical processing the Mg alloy has been subjected to. Relative to the α-Mg matrix, the eutectic phase has a higher hardness in the core region while it has a lower hardness in the edge region, as can be seen in Figure 11b,d. The observed hardness for the secondary phase obtained through nanoindentation is much lower than that which has been observed for WE43 alloy in existing literature [41,42]. This discrepancy can be explained by the applied load being utilized during the nanoindentation testing. In the present study, the applied load is much smaller compared to other works, so the nanomechanical properties of precipitates can be captured. The α-Mg shows a higher hardness in the edge region compared to the core. This can be explained based on the solid–solution strengthening of the α-Mg due to the solubility of Y/Zr-rich precipitates. The content of Y and Zr is higher in the α-Mg matrix of the edge region compared to the core, as seen in Figure 7, and it has been shown that Mg has been strengthened due to the solid–solution strengthening of Y [41]. In the binary Mg–Y alloy system, the increase in solute content of Y from 0 to 2% increased hardness by up to 70% [43]. In the present work, FSE is a solid-state processing technique that causes the temperature to reach up to 80–90% of the melting temperature of Mg alloy, leading to an increase in the solid–solution content in the α-Mg matrix.
Compression testing was carried out on the prepared friction stir-extruded rod to investigate the rod’s mechanical integrity and was compared with the BM. Compression was applied in the ND 1–ND 2 plane for the rod and the TD–ND plane for the BM to maintain the prismatic texture consistency for both samples. The compressive stress–strain curves for the rod and BM are shown in Figure 12a, and the yield strength, compressive strength, and percentage elongation measured from the stress–strain curves are presented in Figure 12b. It could be observed that the rod shows a similar yield strength to the BM and a compressive strength of 87% along with an 8.4% increase in ductility compared to the BM. A study on the FSE of Mg-RE alloys showed an increase in the yield strength and the compressive strength of friction stir-extruded rods by 42.5% and 63.6%, respectively [44]. However, the friction stir-extruded rod had a smaller diameter of 4 mm and a different microstructure where fine grains and precipitates were uniformly distributed across the rod cross-section [44]. In the present study, the rod presents a hybrid structure with refined grains in the edge region and enlarged grains in the core region. The edge region is approximately 1 mm thick across the rod cross-section, while the rod core with larger grains significantly influences the overall rod compressive response and increased the rod ductility.

4.2. Electrochemical Analysis

Electrochemical testing was performed on the BM and friction stir-extruded sample with the edge included (FSE), and friction stir-extruded sample without the edge region (core). The reason for studying the rod with and without the edge is due to the differences in their microstructural features. As can be observed in Figure 3, there is a major difference in grain size and precipitate distribution in these regions. In our previous study on preparing an Mg alloy (AZ31) ultra-thin wall tube using the FSE process, it was observed that subjecting the alloy to a corrosion medium resulted in a preferential dissolution of the outer regions due to a microgalvanic couple arising from the differences in grain size and texture between tube inner and outer edge [22].
WE43 Mg alloy forms two main corrosion films made of magnesium oxide, MgO, and magnesium hydroxide, Mg(OH)2 [45,46]. However, MgO film gets hydrated into Mg(OH)2, which was found to be porous, making it easier for the electrolyte to penetrate the film layer and attack the sample surface [47]. The edge region of the friction stir-extruded rod has a higher intensity of energetic crystalline defects due to a higher volume fraction of grain boundaries. These energetic crystalline defects act as an active site for producing corrosion products (MgO and Mg(OH)2) [48]. The core region has a coarser grain, which would result in a lower intensity of the energetic crystalline defects and indicates that a relatively thinner corrosion film is being produced. It has also been reported in the literature that Zr-rich precipitates are the main source of the galvanic effect in WE43 alloy [49,50]. The fraction of secondary phases in the edge region is relatively higher than in the core region, which induces galvanic coupling between the two regions.
The OCP analysis was run for 1680 min with immersion in HBSS solution, as shown in Figure 13a; each OCP data point corresponds to a measurement that was taken at the end of a time interval. The OCP behavior of FSE showed a notably positive potential compared to the core and the BM, while the BM showed the most negative OCP values for all the immersion time. By the end of the immersion, the difference in corrosion potential between the FSE core and the BM core was 207 mV and 37 mV, respectively. The more positive the value of OCP, which is the case in the FSE sample, the quicker the development of the porous Mg(OH)2 layer [48] is predicted. The core sample shows more negative OCP values but a more stable OCP trend than the FSE sample. Further, the BM sample had a lower potential than the core sample. The exposed BM specimen surface showed a basal texture, while the core specimen showed a prismatic texture (Figure 9). It has been previously reported that the theoretical dissolution of the prismatic plane is 18–20 times larger than the basal plane [51,52], which would help in promoting the formation of the corrosion layer and also explains a more positive potential of the core sample compared to the BM.
Figure 13b displays the PD curves of three samples after 30 min of immersion. The corrosion potential (Ecorr) had a similar trend to the OCP. The Ecorr values were −1.81 V, −1.73 V, and −1.6 V vs. Ag/AgCl for the BM, core, and FSE samples, respectively. Ecorr is a thermodynamic characterization of the material and not necessarily a representation of the corrosion kinetics [53,54]. The corrosion current density (Icorr) was calculated using the cathodic branch for Tafel extrapolation [55]. The cathodic branch was solely considered because the anodic branch experienced a sudden increase in the current density because of the negative difference effect (NDE) that Mg uniquely exhibits [55,56]. The BM, core, and FSE samples had an Icorr value of 40 µA/cm2, 74 µA/cm2, and 63 µA/cm2, respectively. A lower Icorr value corresponds to the better corrosion resistance of the specimen [17,54,55]. The core showed a higher Icorr while the BM showed the lowest Icorr value among the tested specimens. However, it was also reported that the Icorr values do not reflect the true corrosion rate [57], and the implementation of other techniques such as EIS, weight loss, and hydrogen evolution is required to accurately estimate the corrosion rate. Furthermore, since the PD measurements were taken after 30 min of immersion, the PD behavior is consistent with the EIS analysis, Figure 13c–f, where it can be seen that the corrosion behavior is not stable, especially at early immersion times. During anodic scans, the passivation behavior can be seen in all three samples, which can be attributed to the creation of a partially protective metastable layer [58,59]. The corrosion potential (Epit) shows the material’s proclivity for pitting corrosion; higher Epit values suggest a lower tendency for pitting corrosion. [53]. The Epit values were approximated to be (~−1.41 V vs. Ag/AgCl, FSE), (~−1.38 V vs. Ag/AgCl, core), and (~−1.42 V vs. Ag/AgCl, BM), which indicates that there is no noticeable difference in the pitting potential.
Representative Nyquist plots for all three samples at 110 min and 1680 min are shown in Figure 13c and Figure 13d, respectively. The Nyquist plots of all three samples show two capacitive arcs associated with the charge transfer resistance and the film resistance at high and intermediate frequencies, respectively [48,60]. At low frequencies, an inductive arc, which is linked to the adsorption or desorption of species [17,60], appears for the BM and core samples. For the FSE sample, the formation of an inductive arc is unstable throughout the immersion time. The arcs associated with the charge transfer resistance (Rct) and film resistance (Rf) are directly related to the corrosion resistance of the sample surface [48]. The Rct and Rf vs. immersion time are represented in Figure 13e and Figure 13f, respectively. The BM sample had a decreasing trend and eventually reached a similar value to the FSE sample for both Rct and Rf. The core sample showed a stable behavior of the Rct and Rf with the progression of immersion time. The FSE sample had the lowest Rct and Rf values and a fluctuating trend throughout immersion. The fitted equivalent circuit for the BM and core is shown in Figure 13g, whereas the fitted equivalent circuit for the FSE sample is shown in Figure 13h. The distinction between both circuit configurations comes from the inductive resistance (RL) as it has been excluded from the FSE sample circuit due to the sample not having rational values for the resistance.
The more positive OCP values of the FSE sample predict a more rapid development of the thicker porous Mg(OH)2 layer. However, the permeability of the Mg(OH)2 allows the electrolyte to attack the sample surface. This can be clearly observed in the Nyquist plots, where both Rct and Rf of the FSE sample are the lowest. The Nyquist plots of the core sample showed a more stable and better corrosion resistance compared to both the BM and FSE samples at high immersion times (1680 min). This can be due to the sample having relatively larger grains and fewer precipitates, leading to less energetic crystalline defects sites on the sample surface.

5. Conclusions

Defect-free fully consolidated WE43 Mg alloy rod with potential applications for biomedical and oil and gas sectors, was successfully prepared using a friction stir extrusion process. The microstructure, texture, mechanical properties, and corrosion response of the prepared rods have been studied. The following conclusions can be drawn based on the present study results:
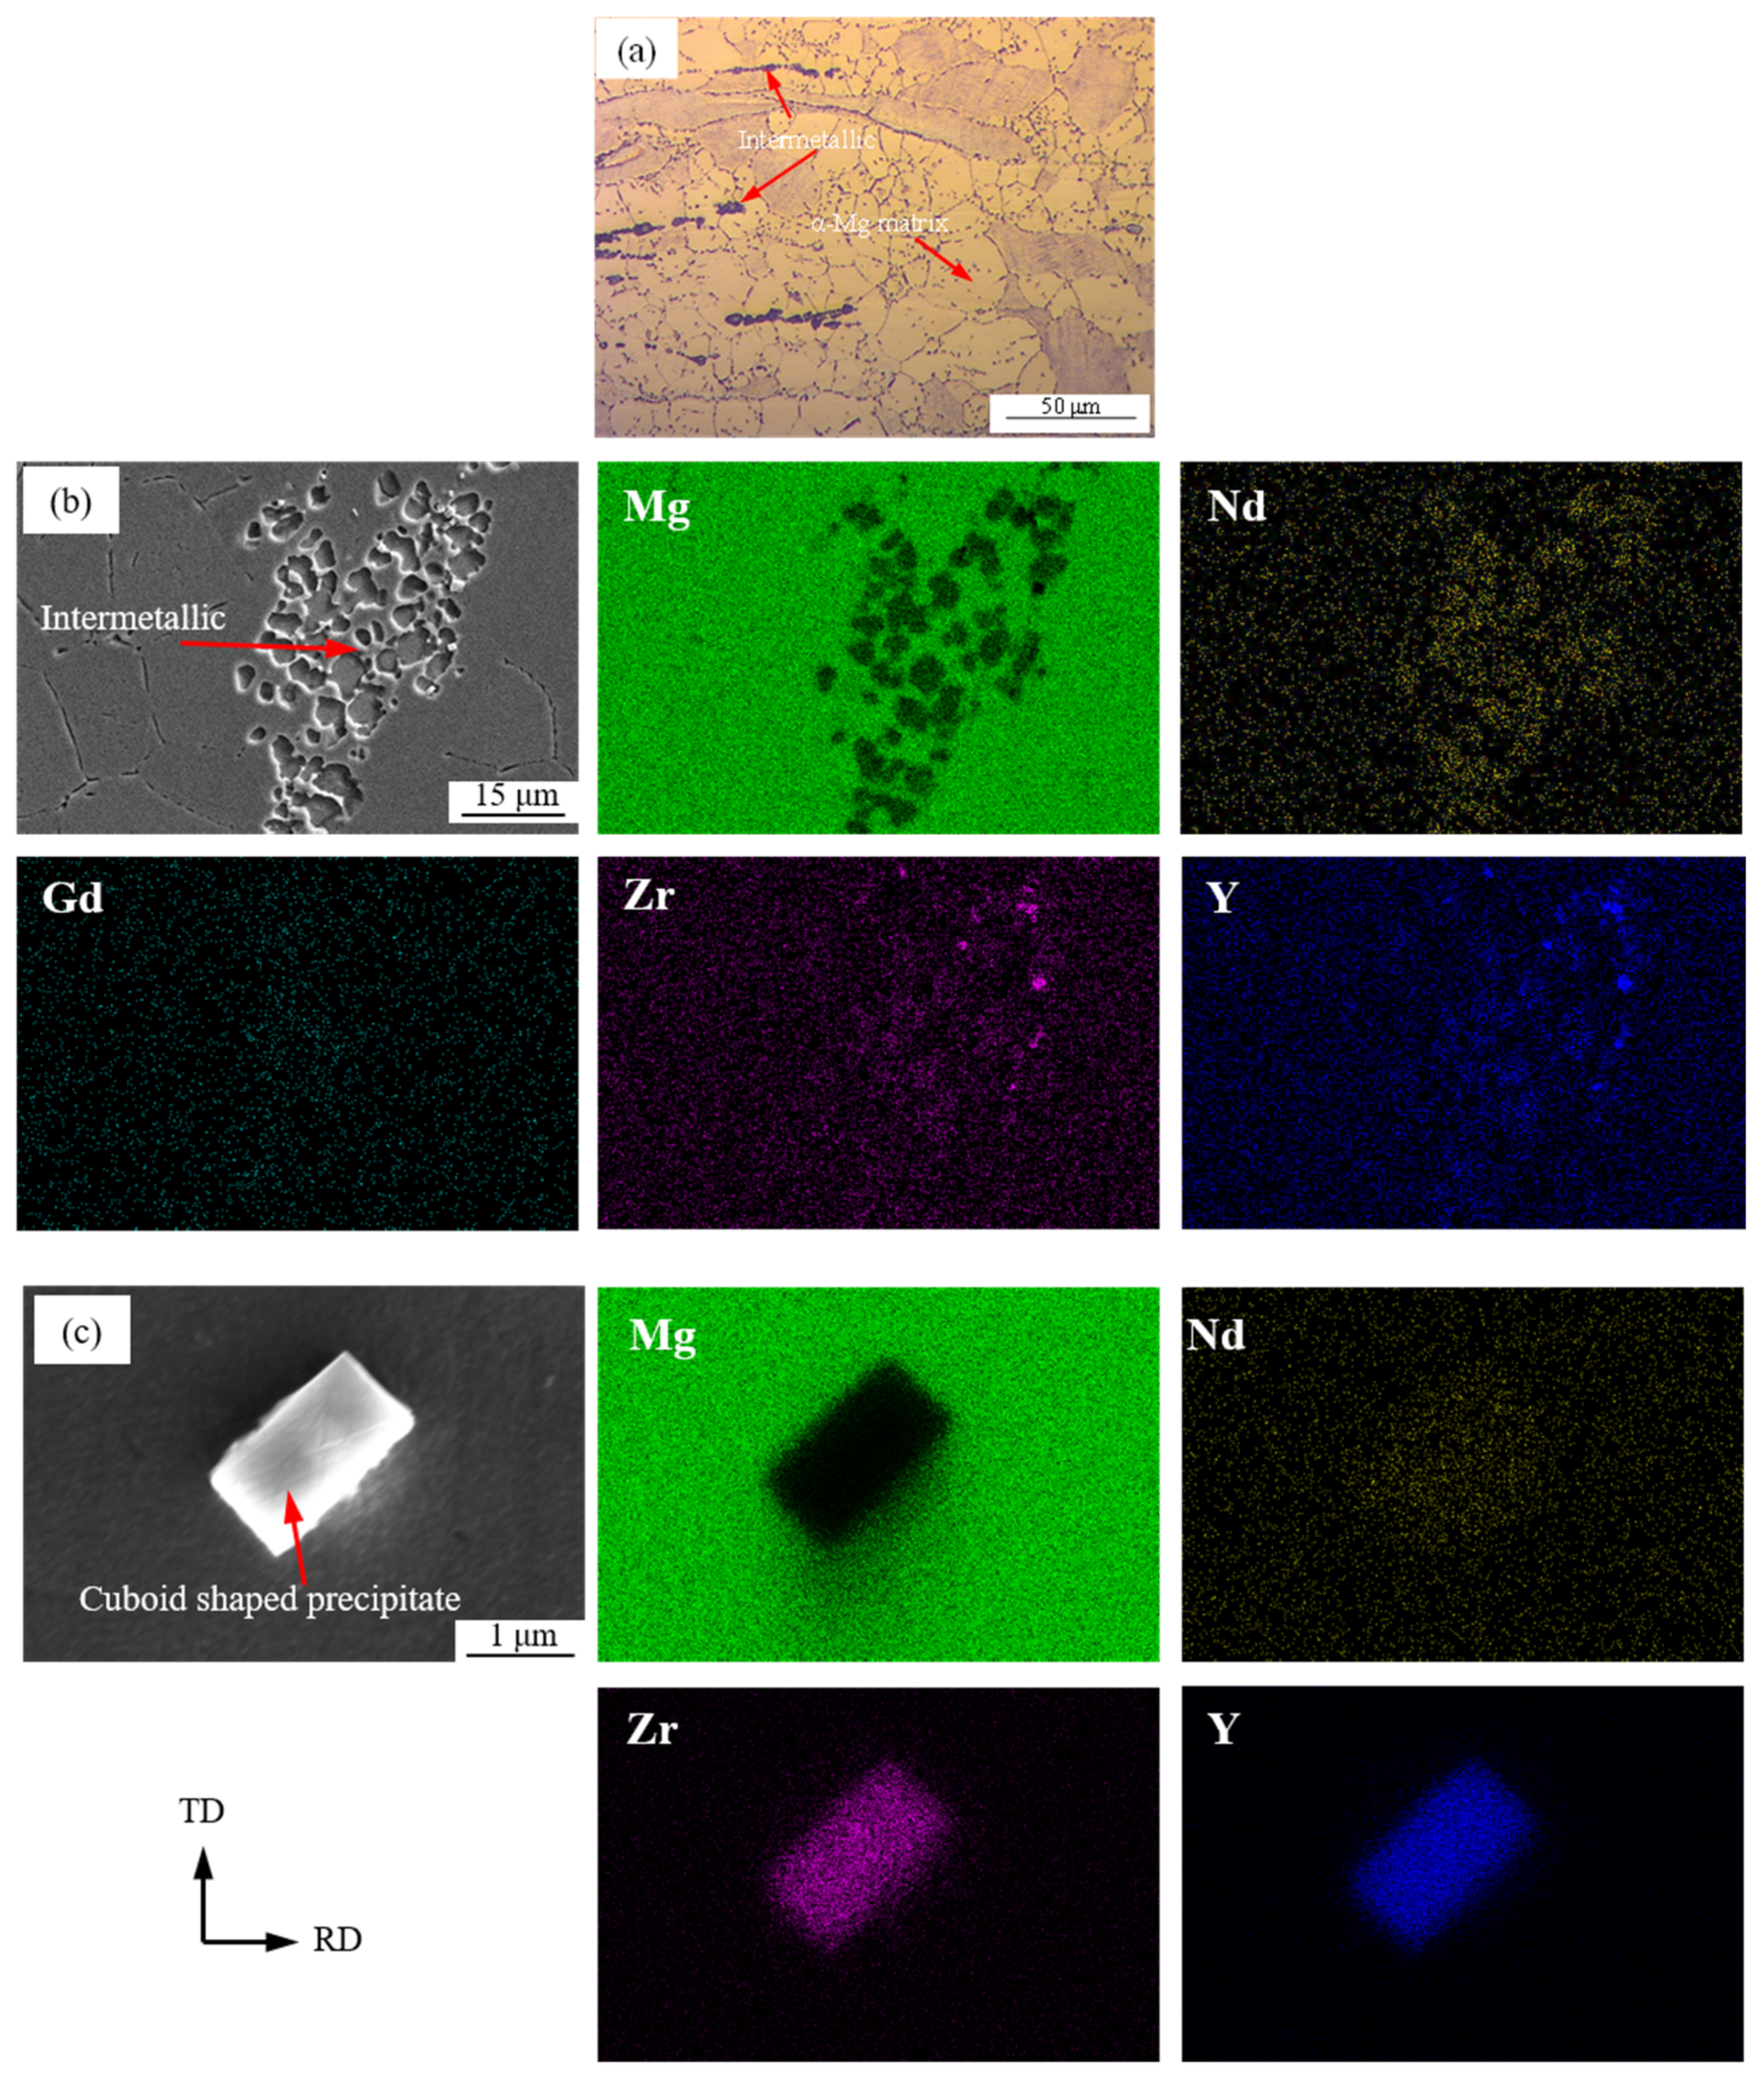
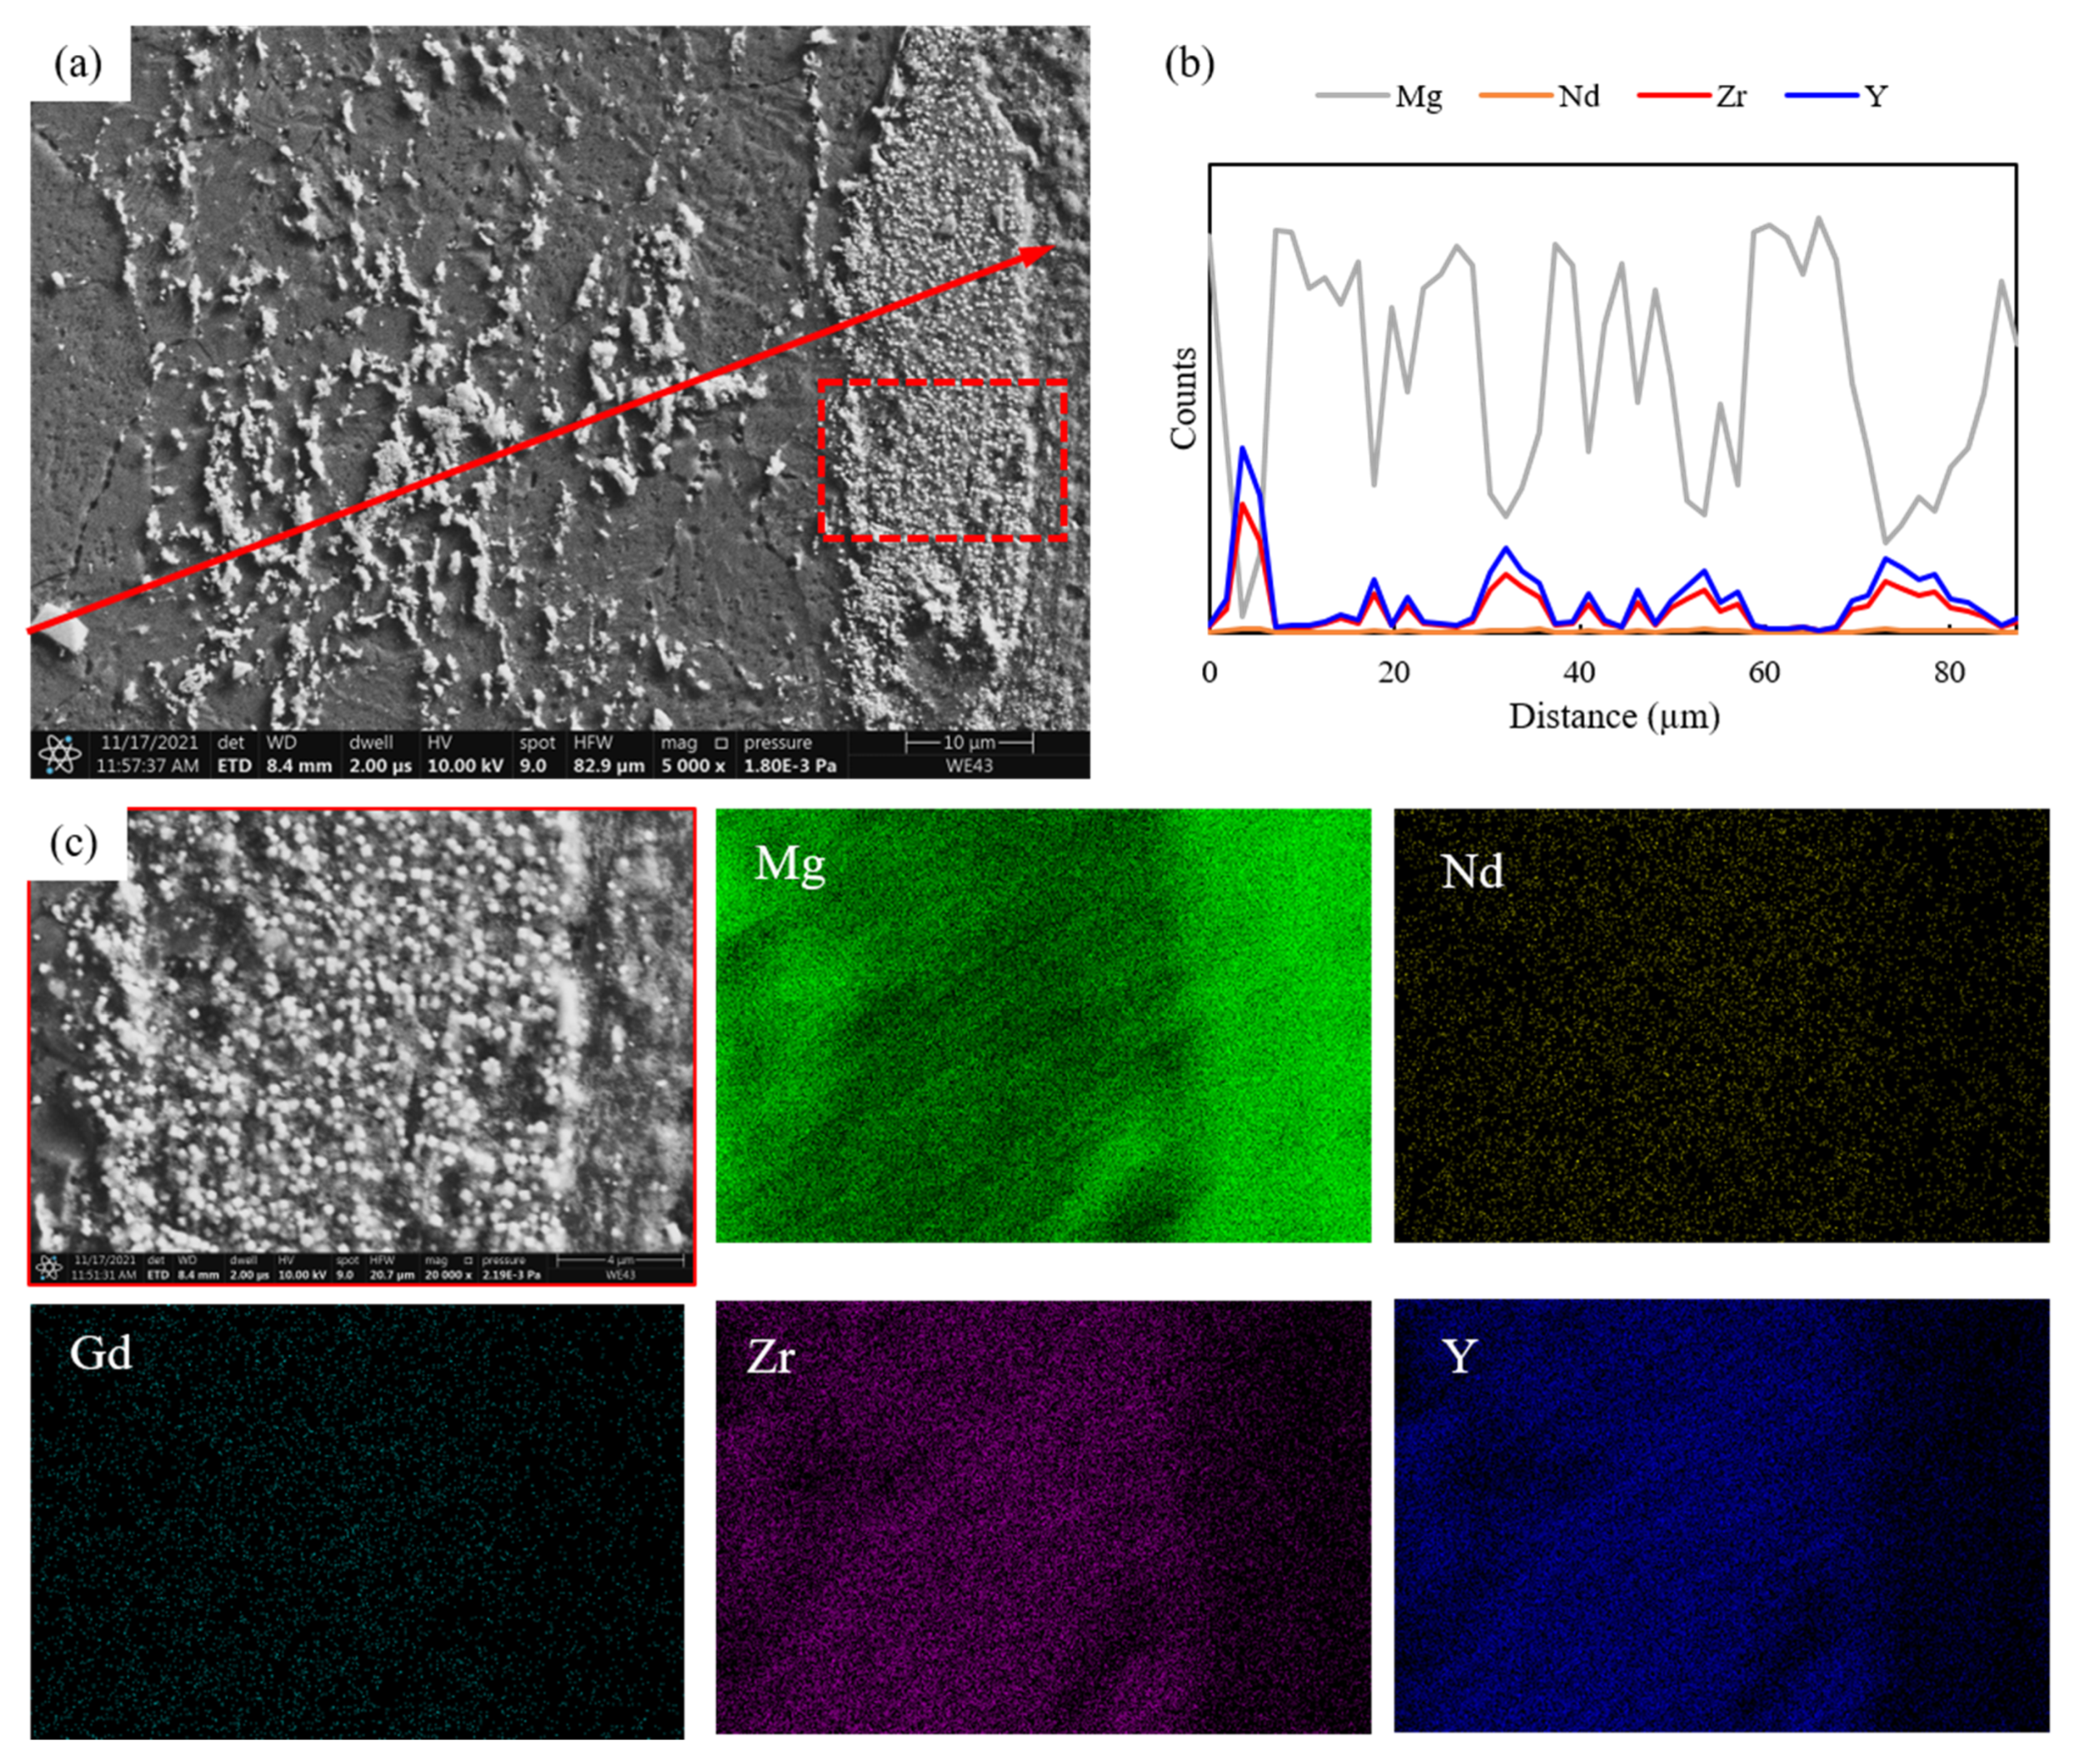
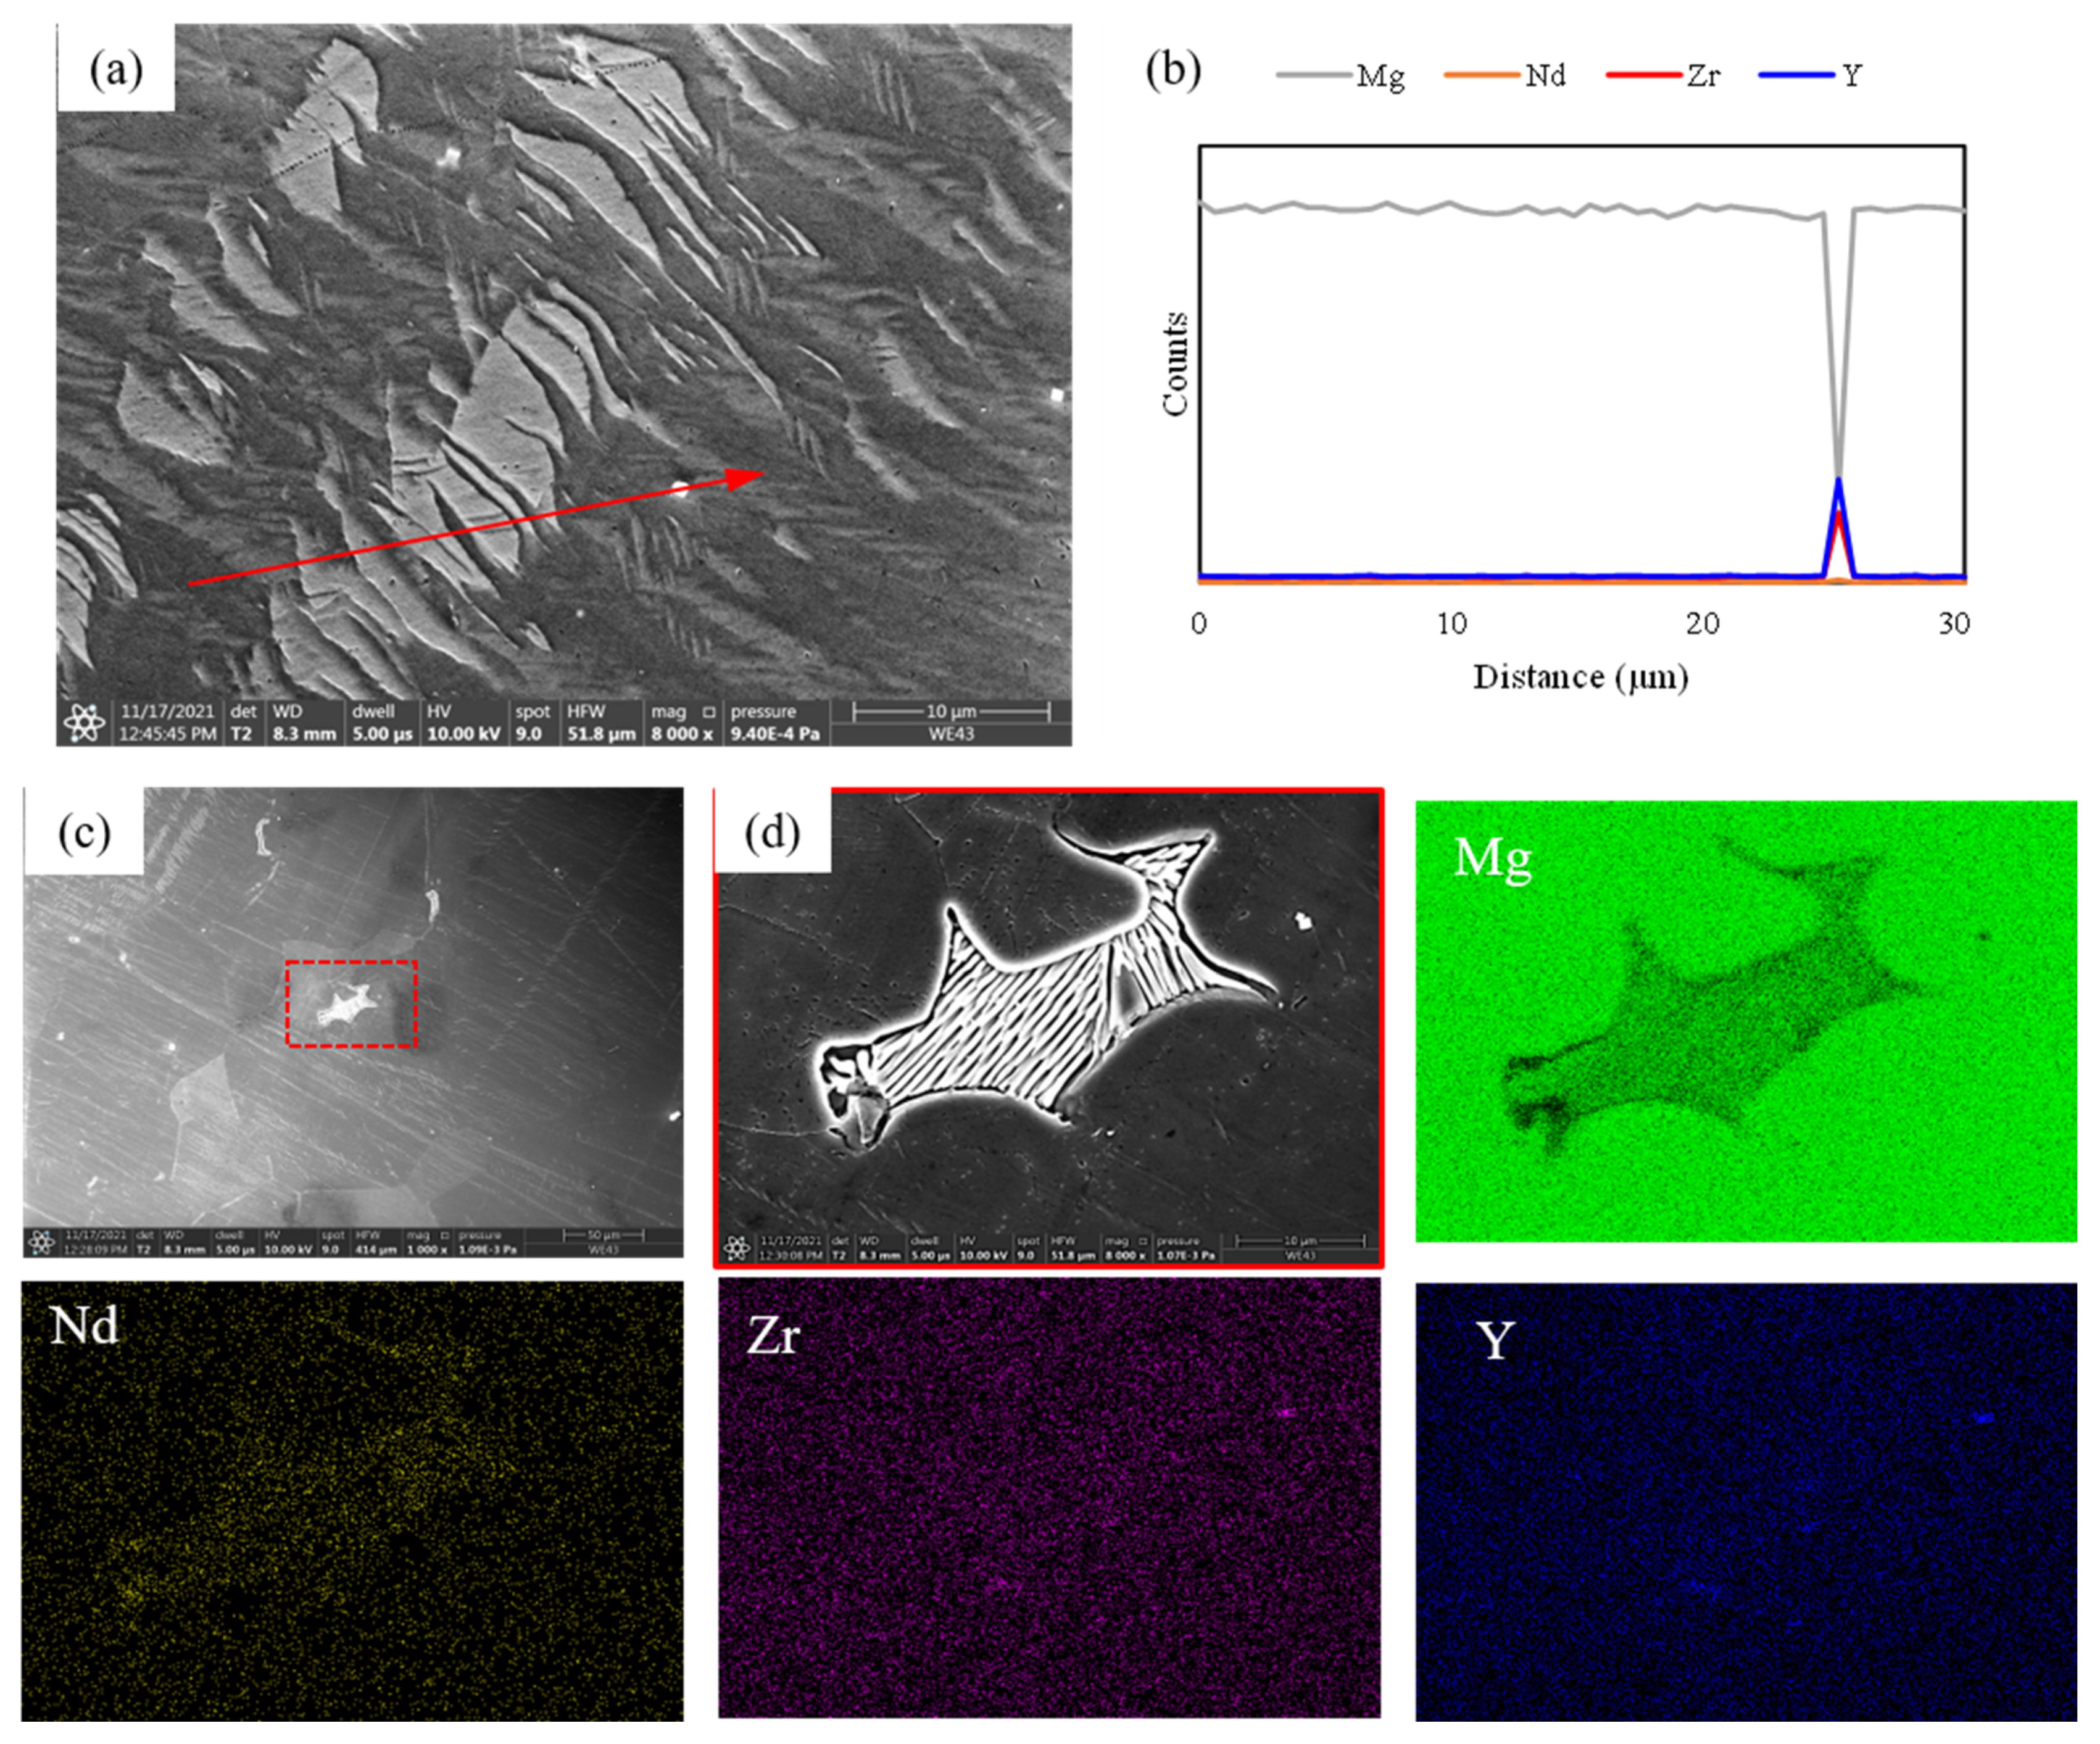
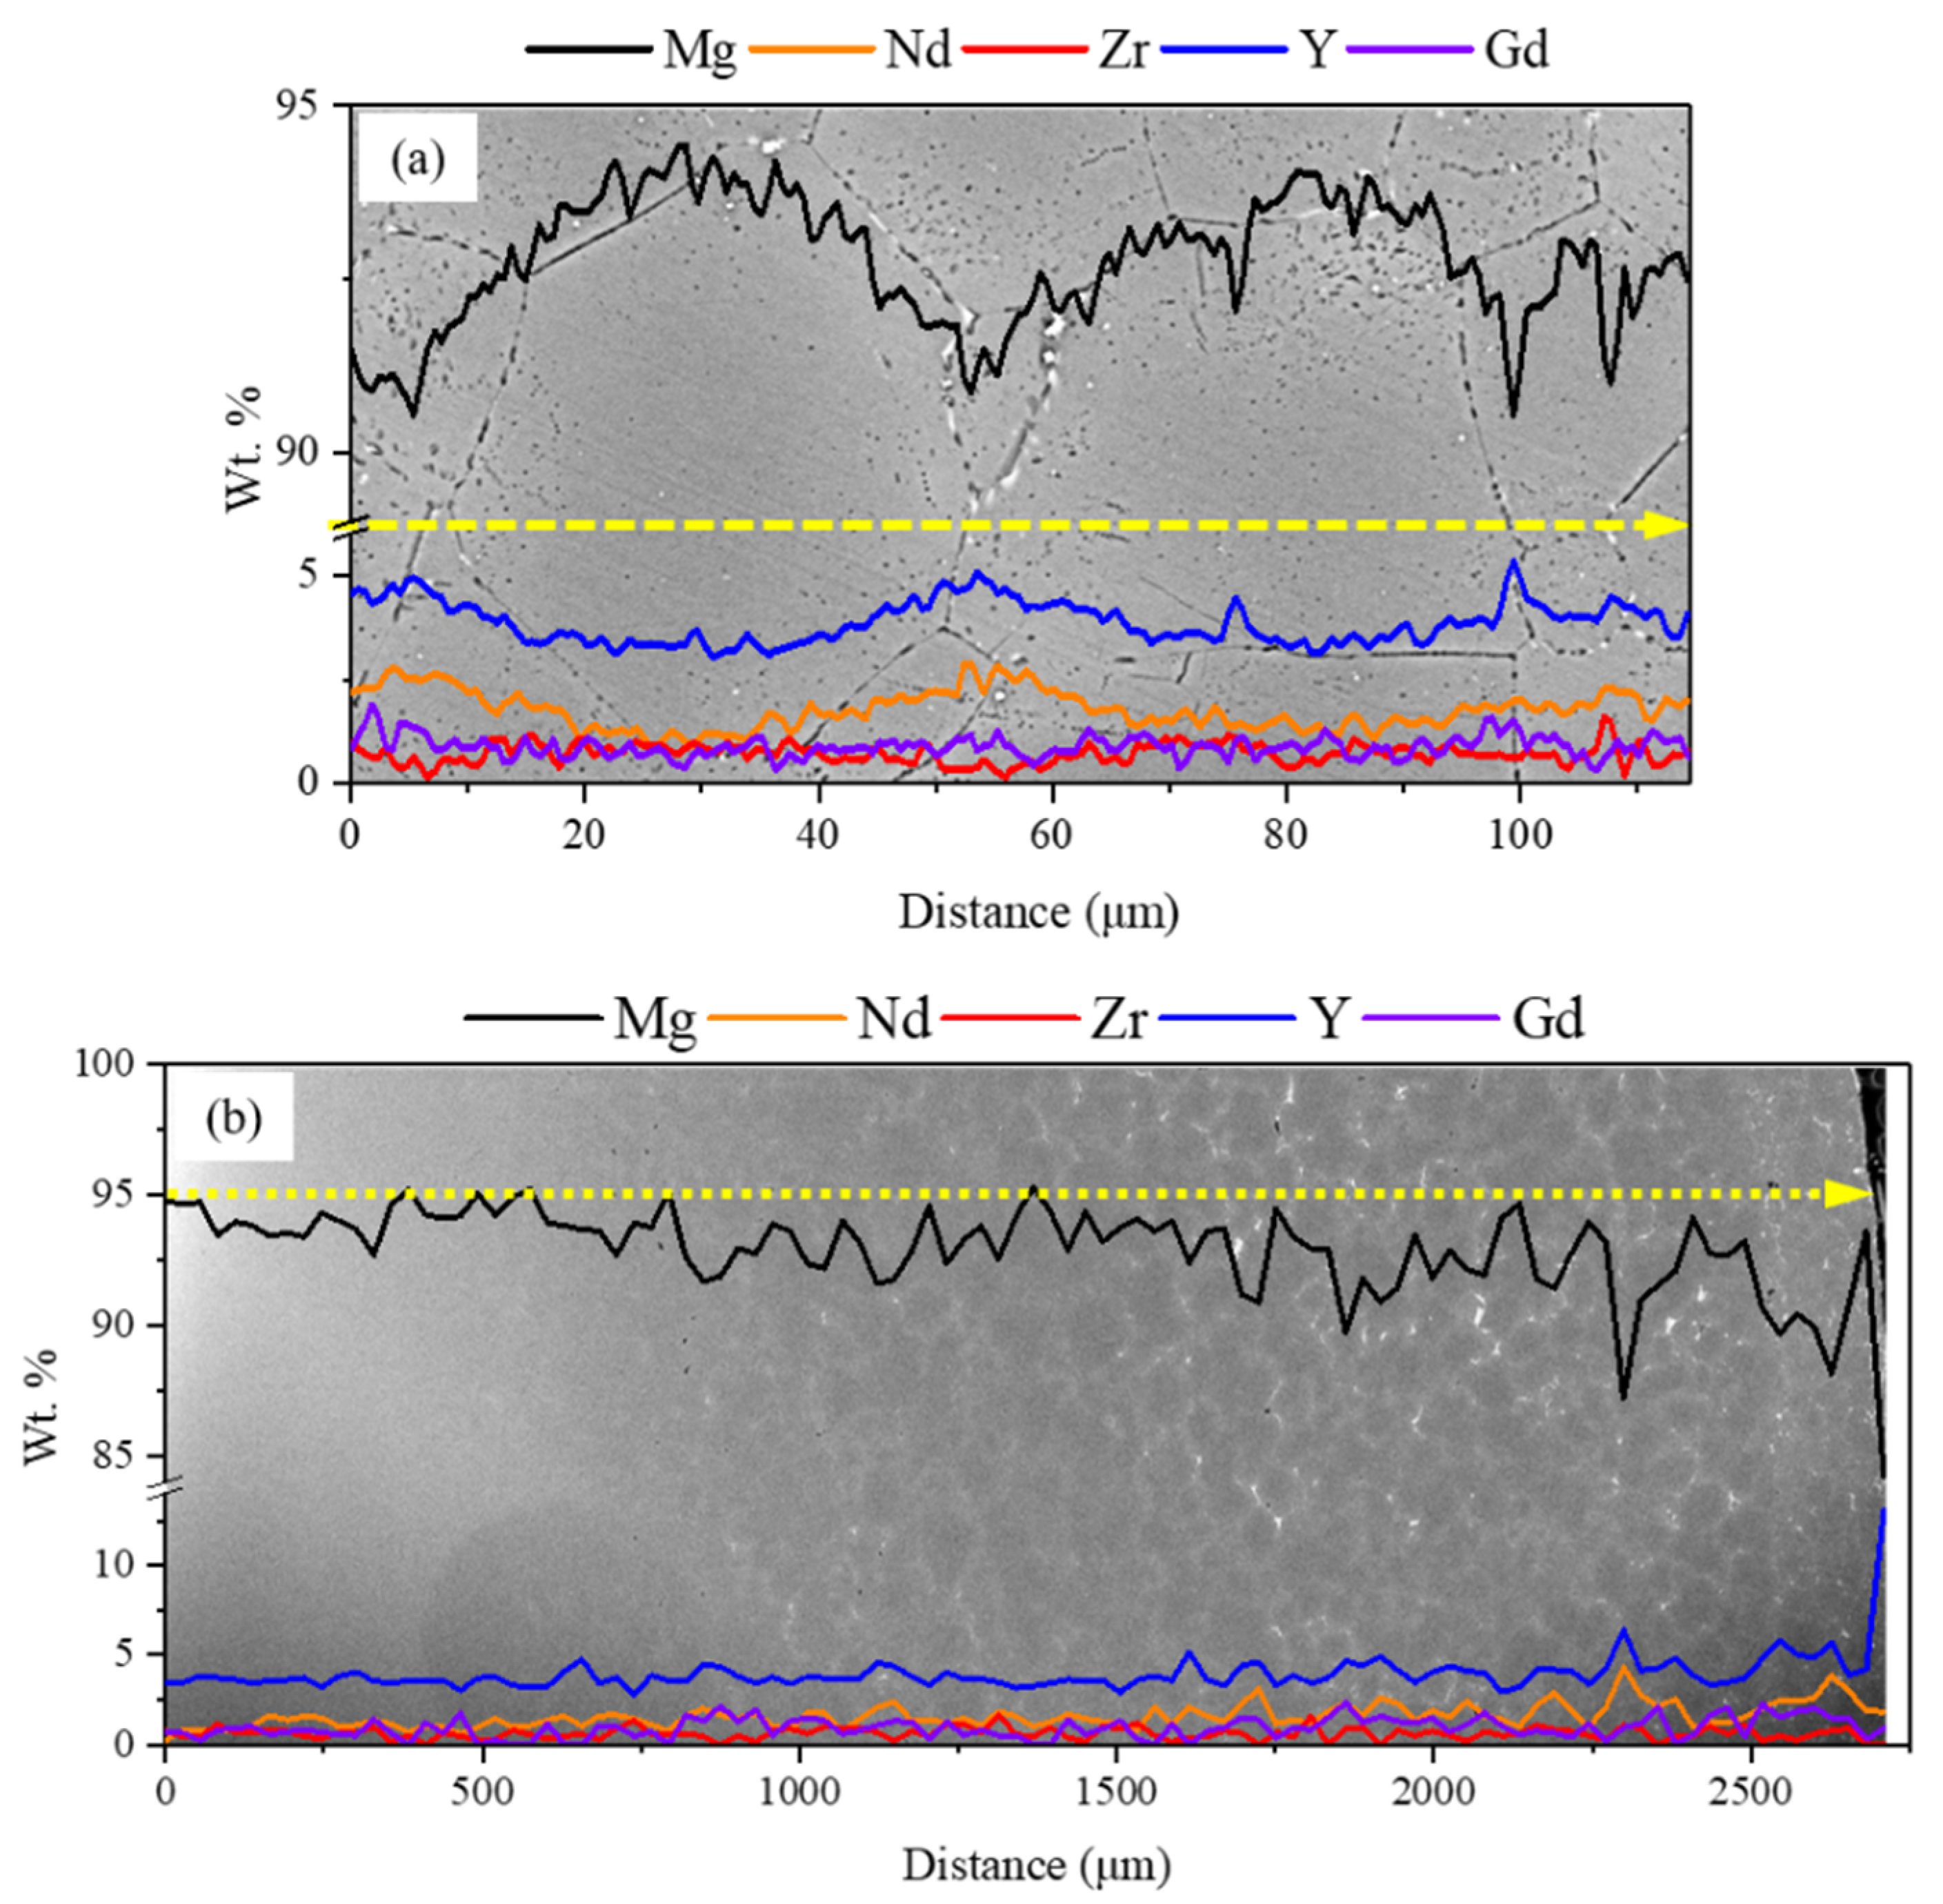
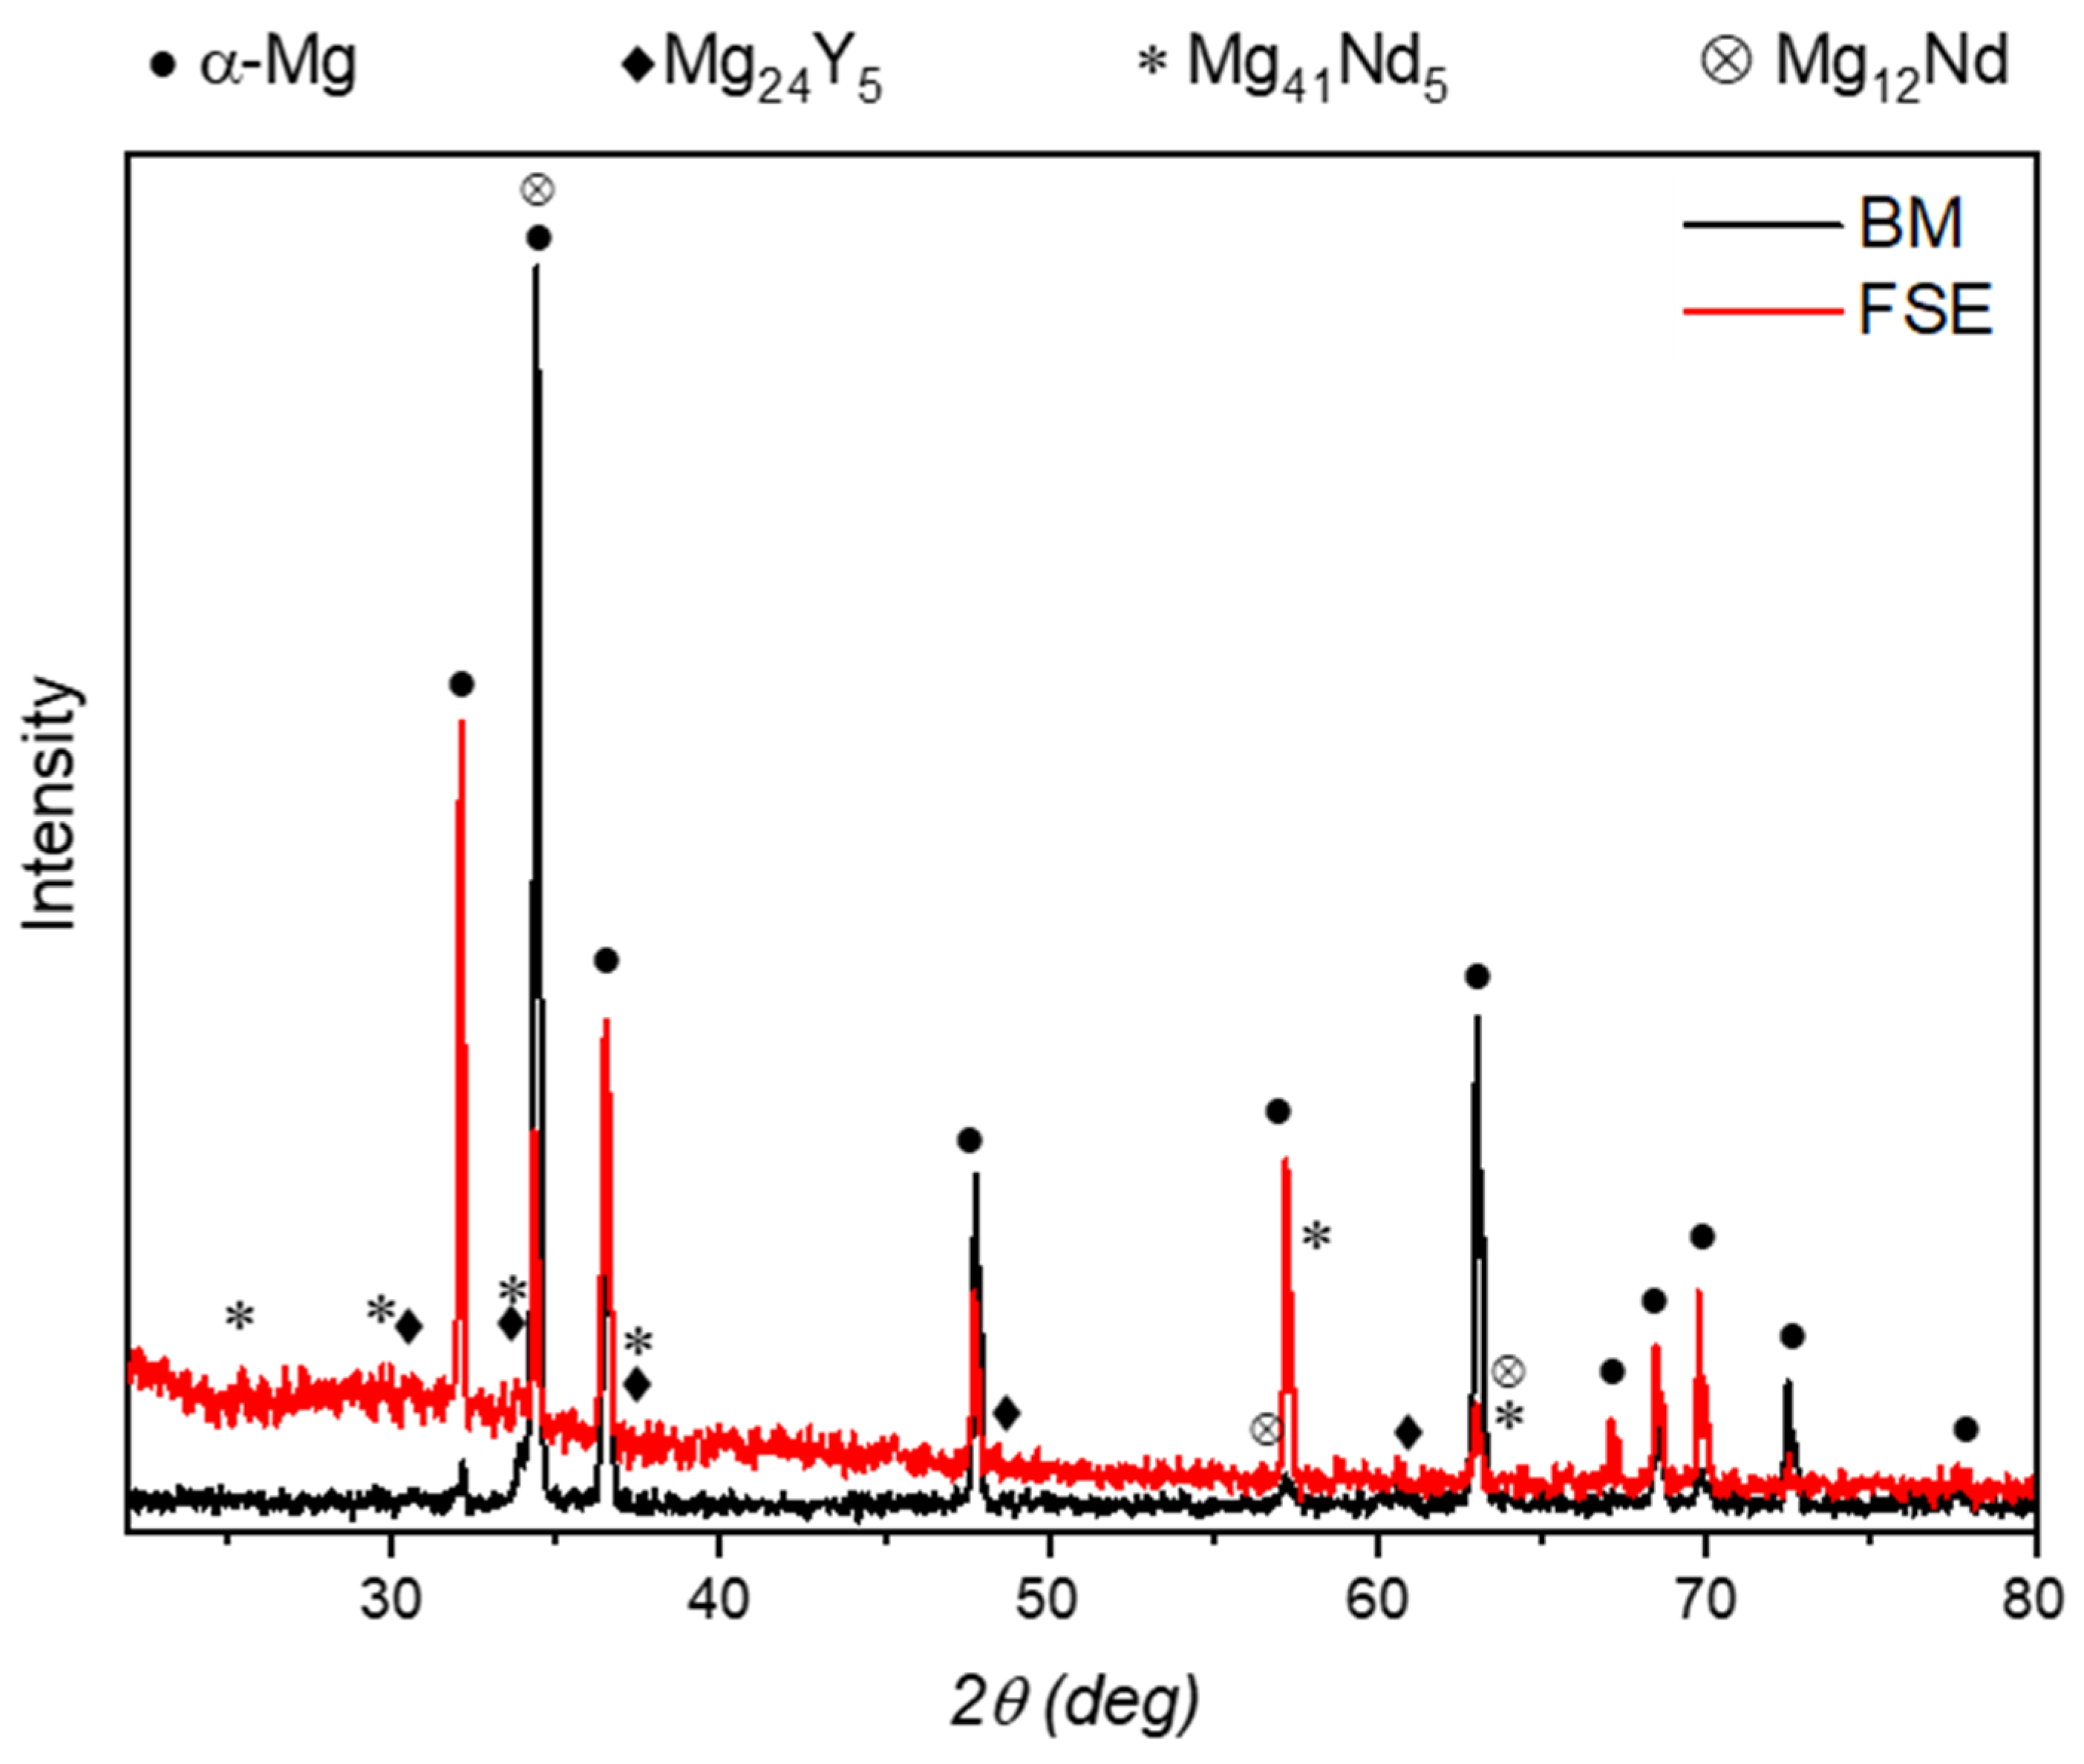
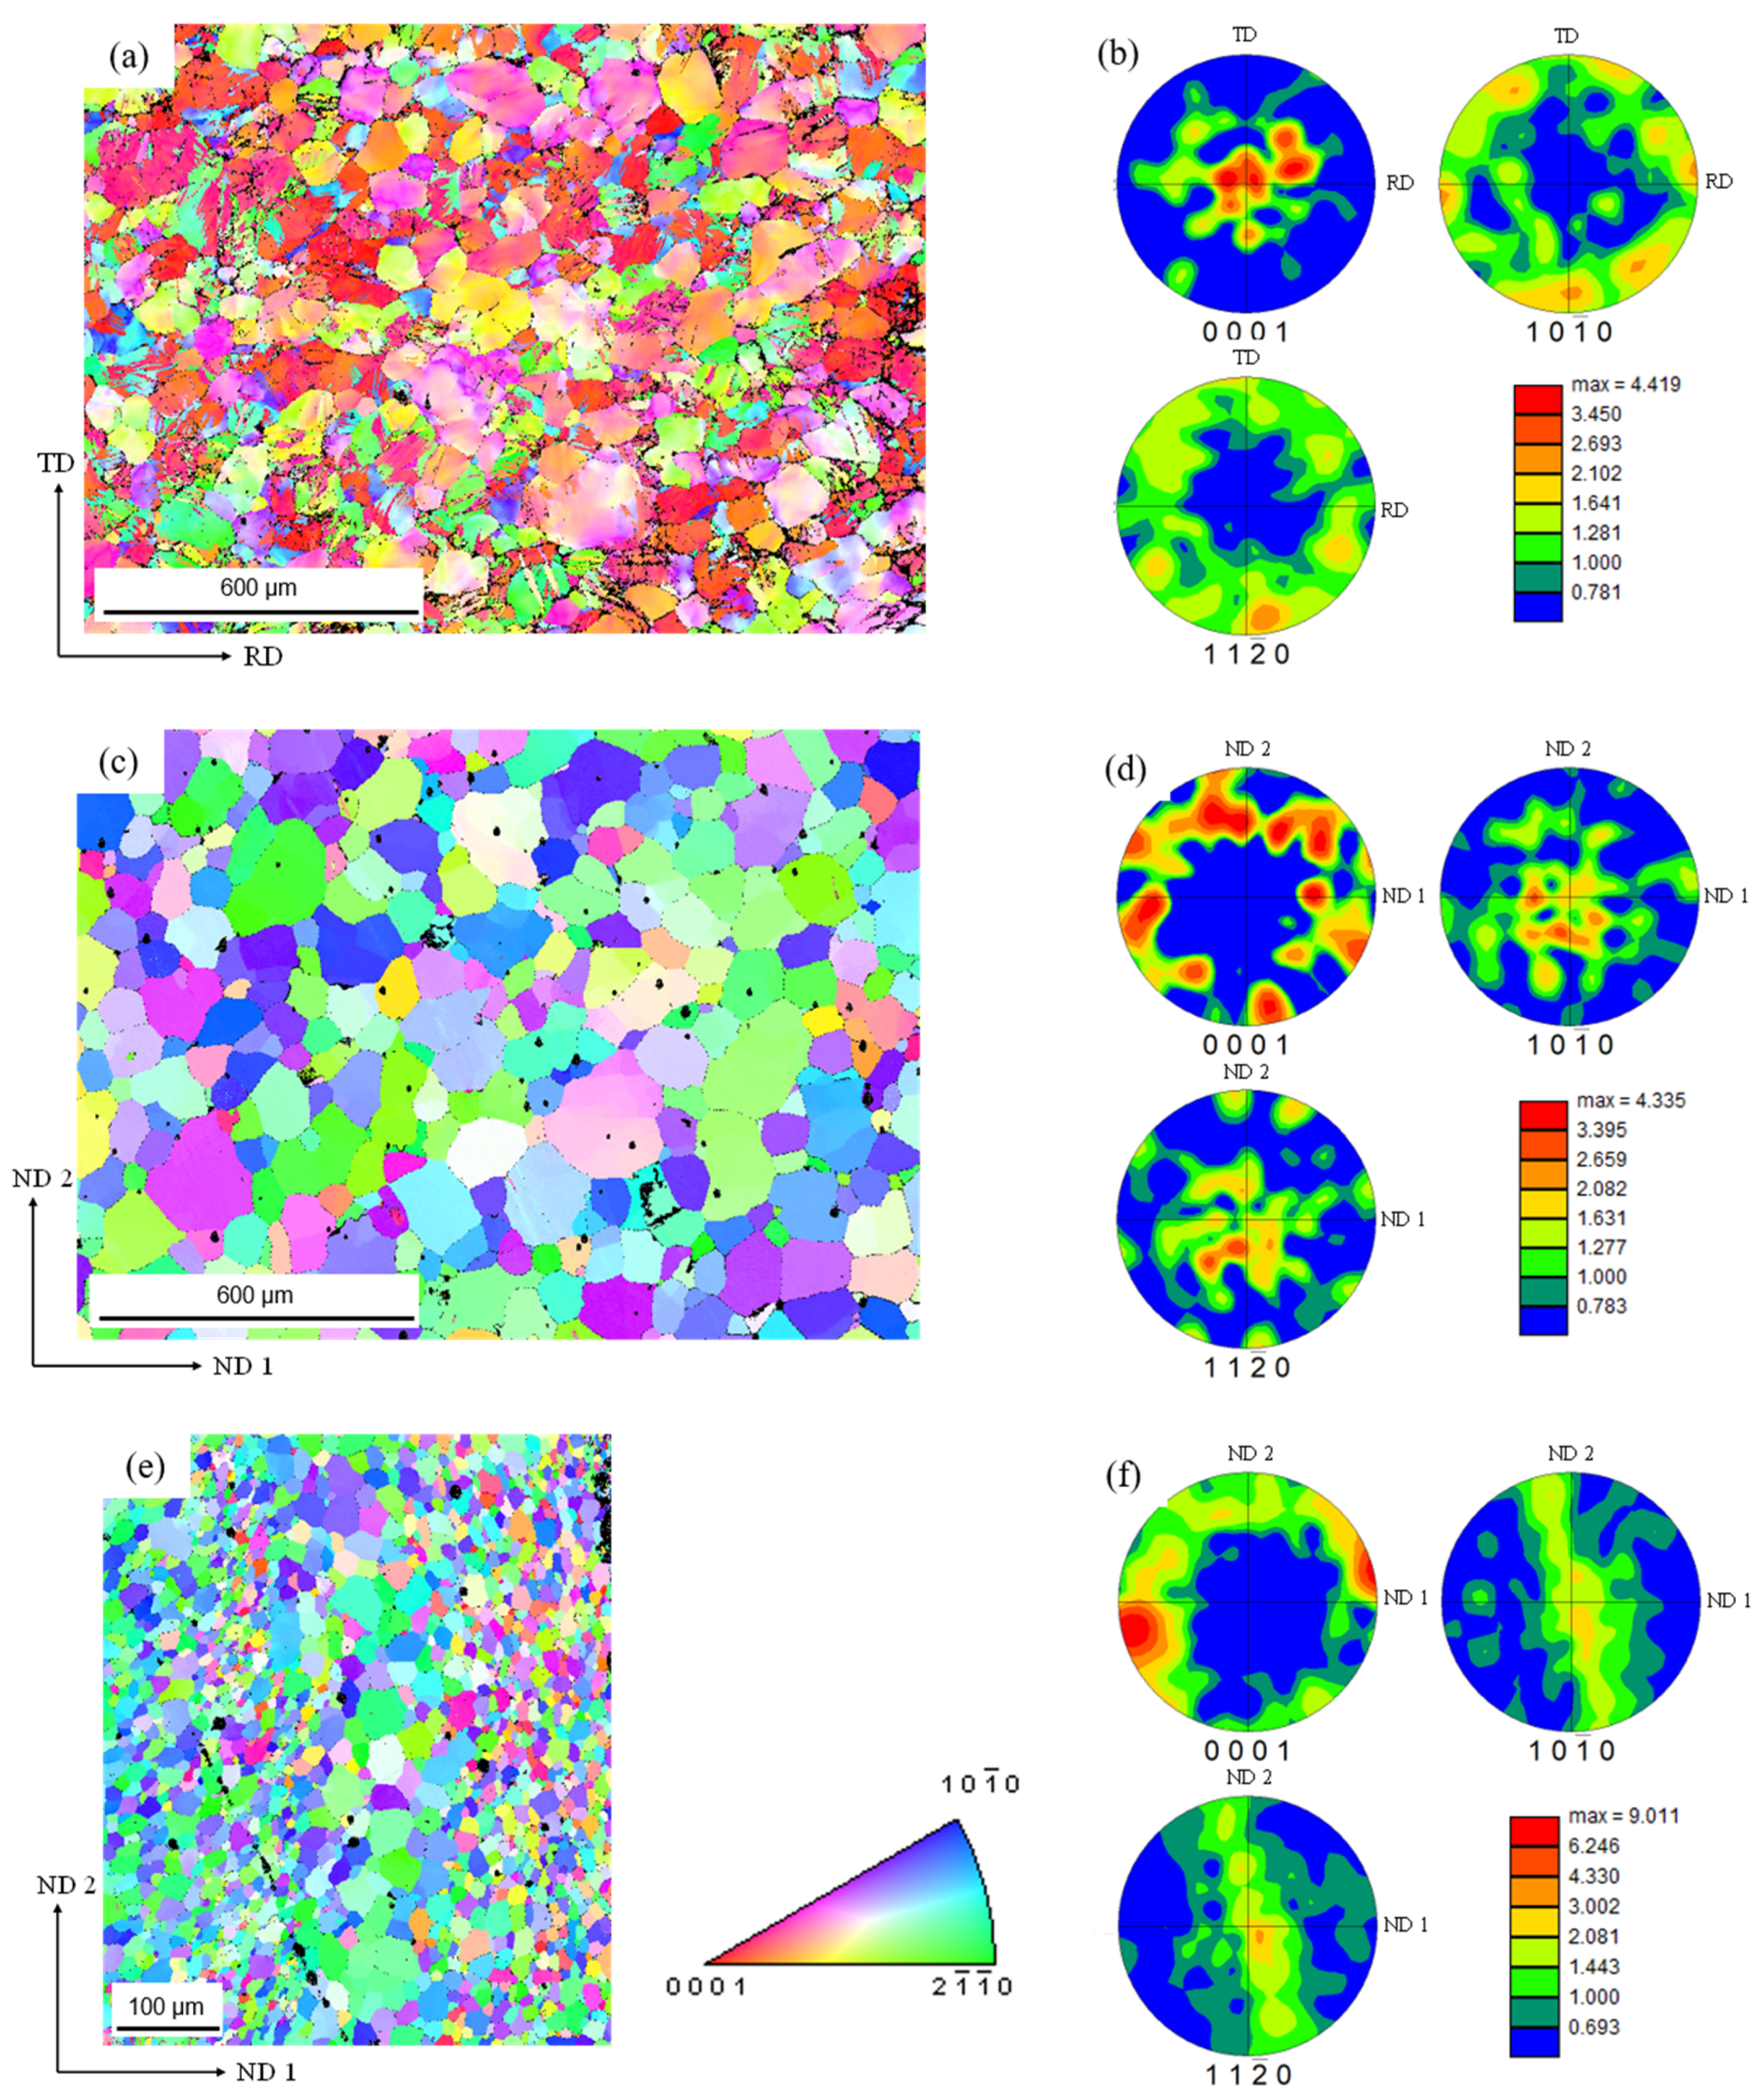
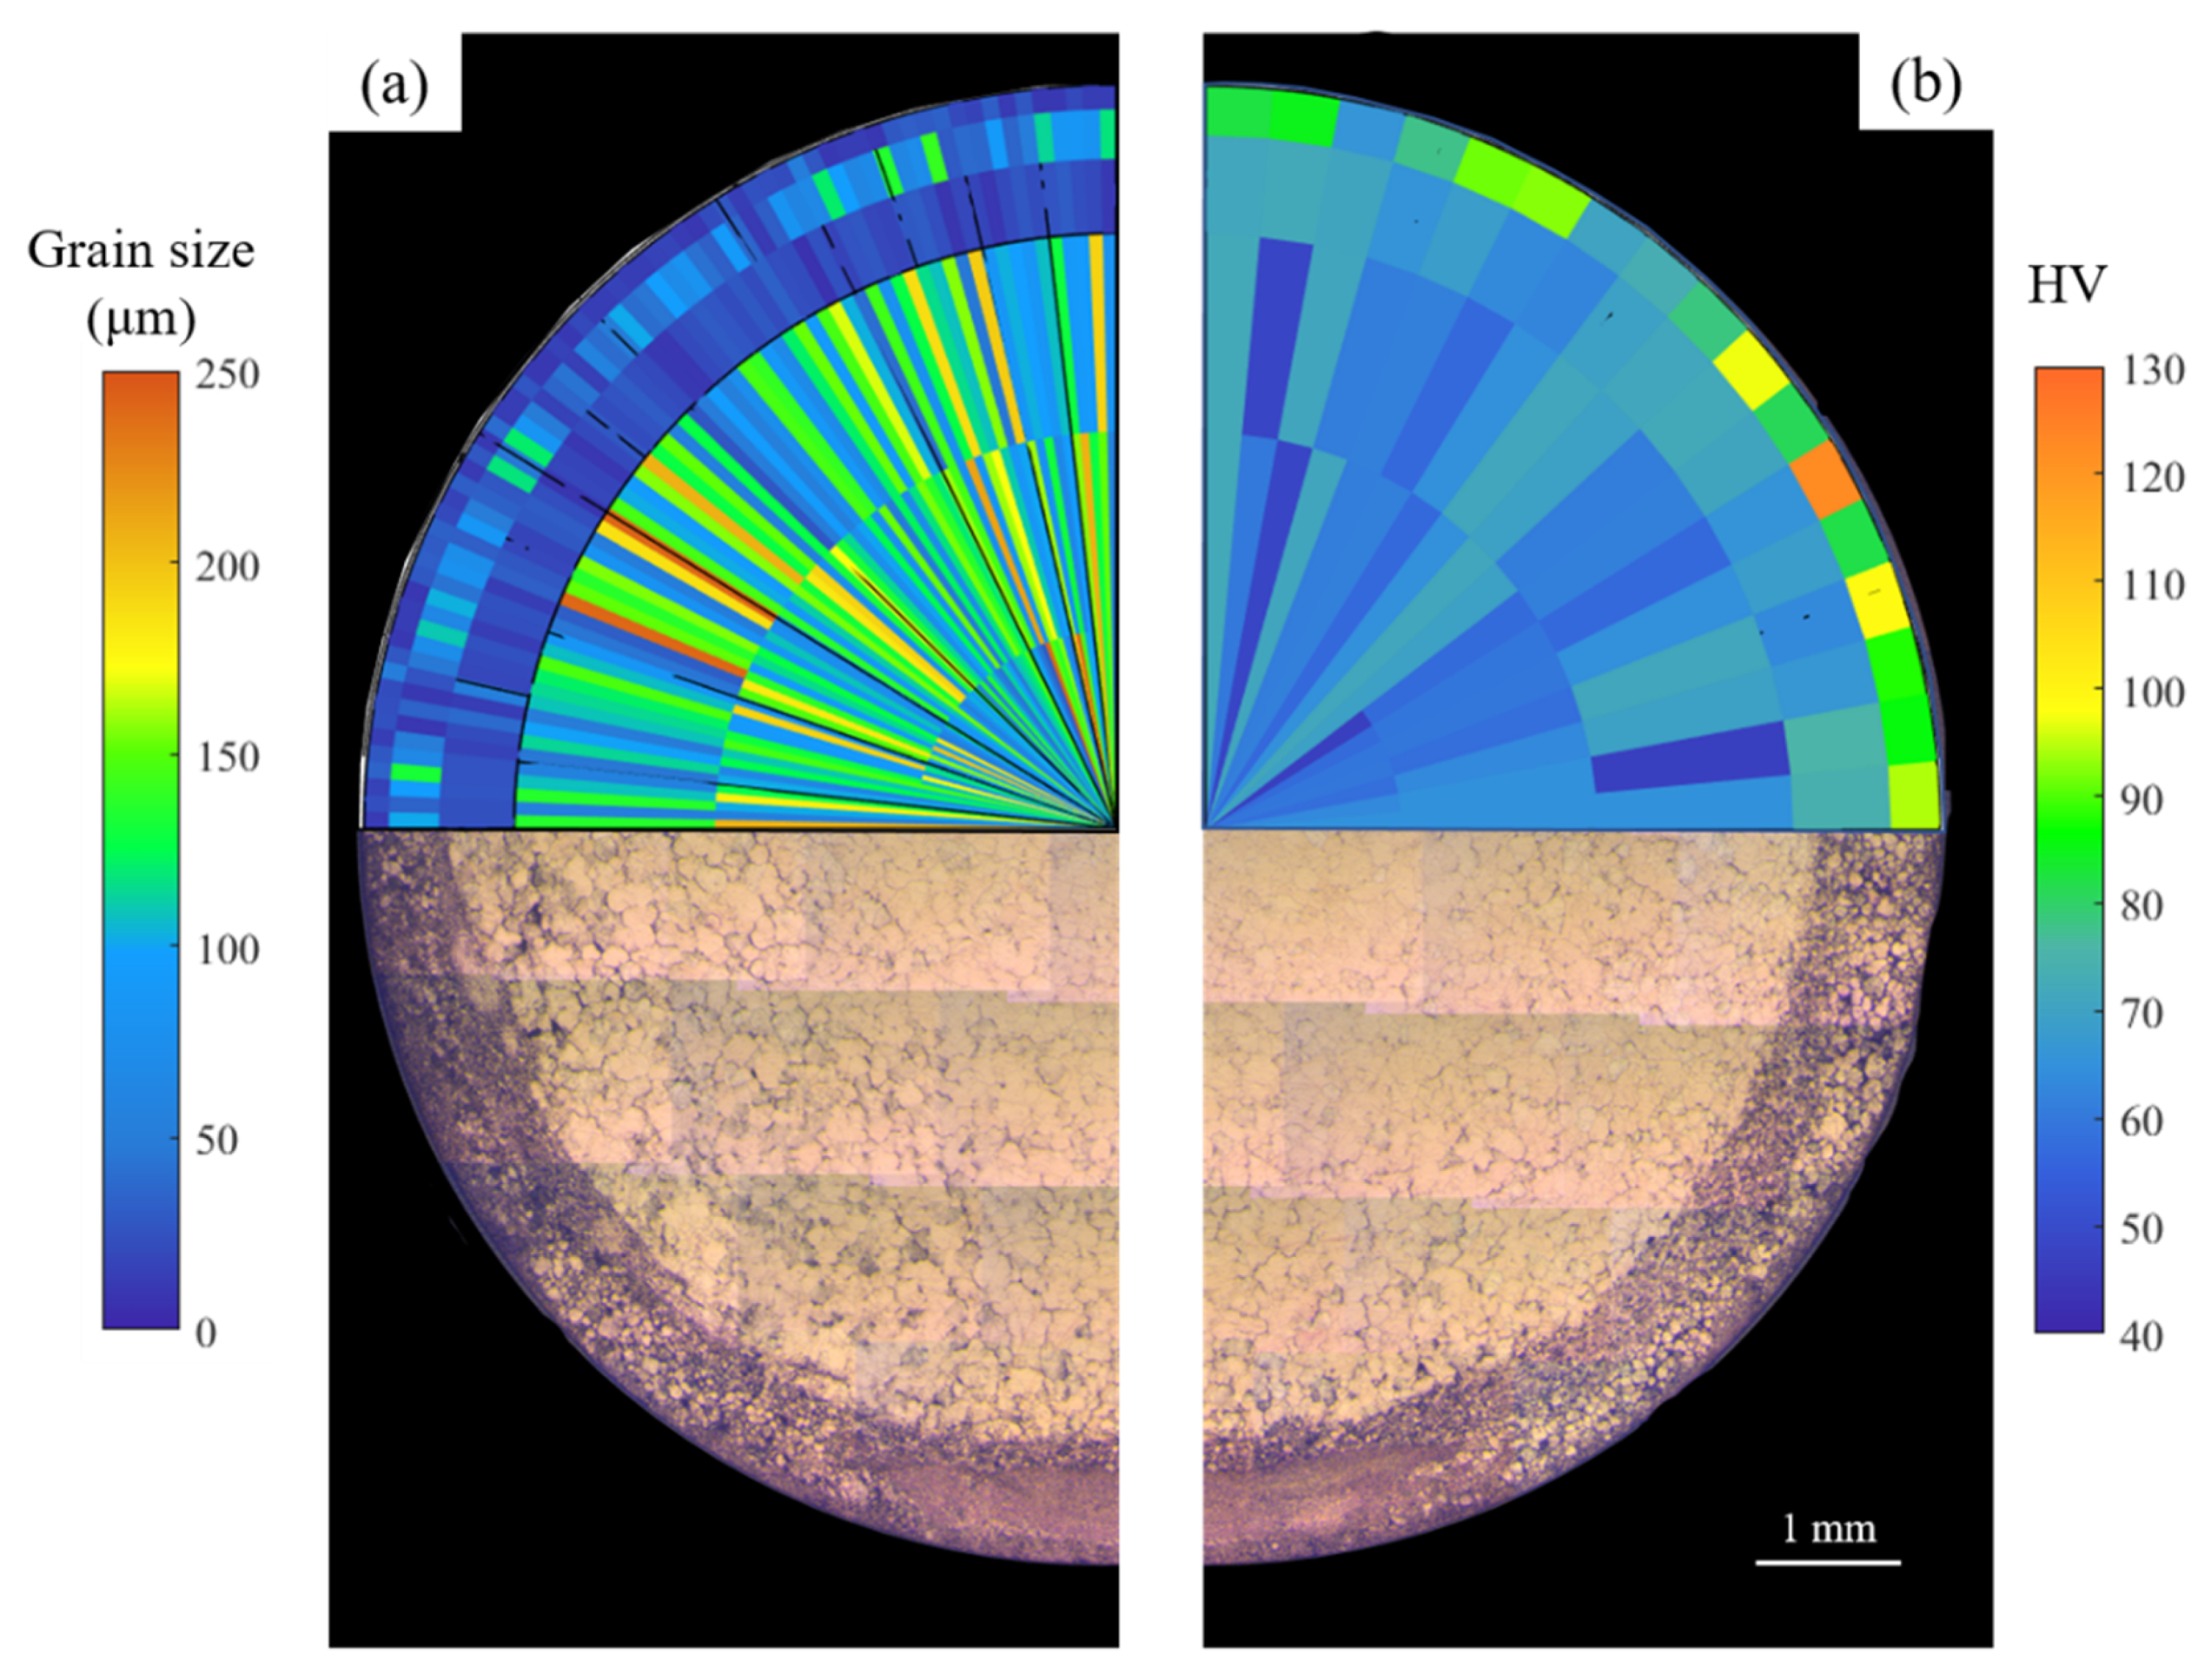
  • The FSE process resulted in a hybrid microstructure with rod edge regions having smaller grains (82.5% smaller) compared to the rod core. Due to the FSE process, it was observed that higher concentrations of the RE (Nd, Y, Gd) and Zr elements accumulate toward the edge compared to the core. The edge region showed a basal pole orientation perpendicular to the extrusion direction along the rod’s outer surface. The grain size, precipitate distribution, and texture all affected the rod’s mechanical and corrosion response.
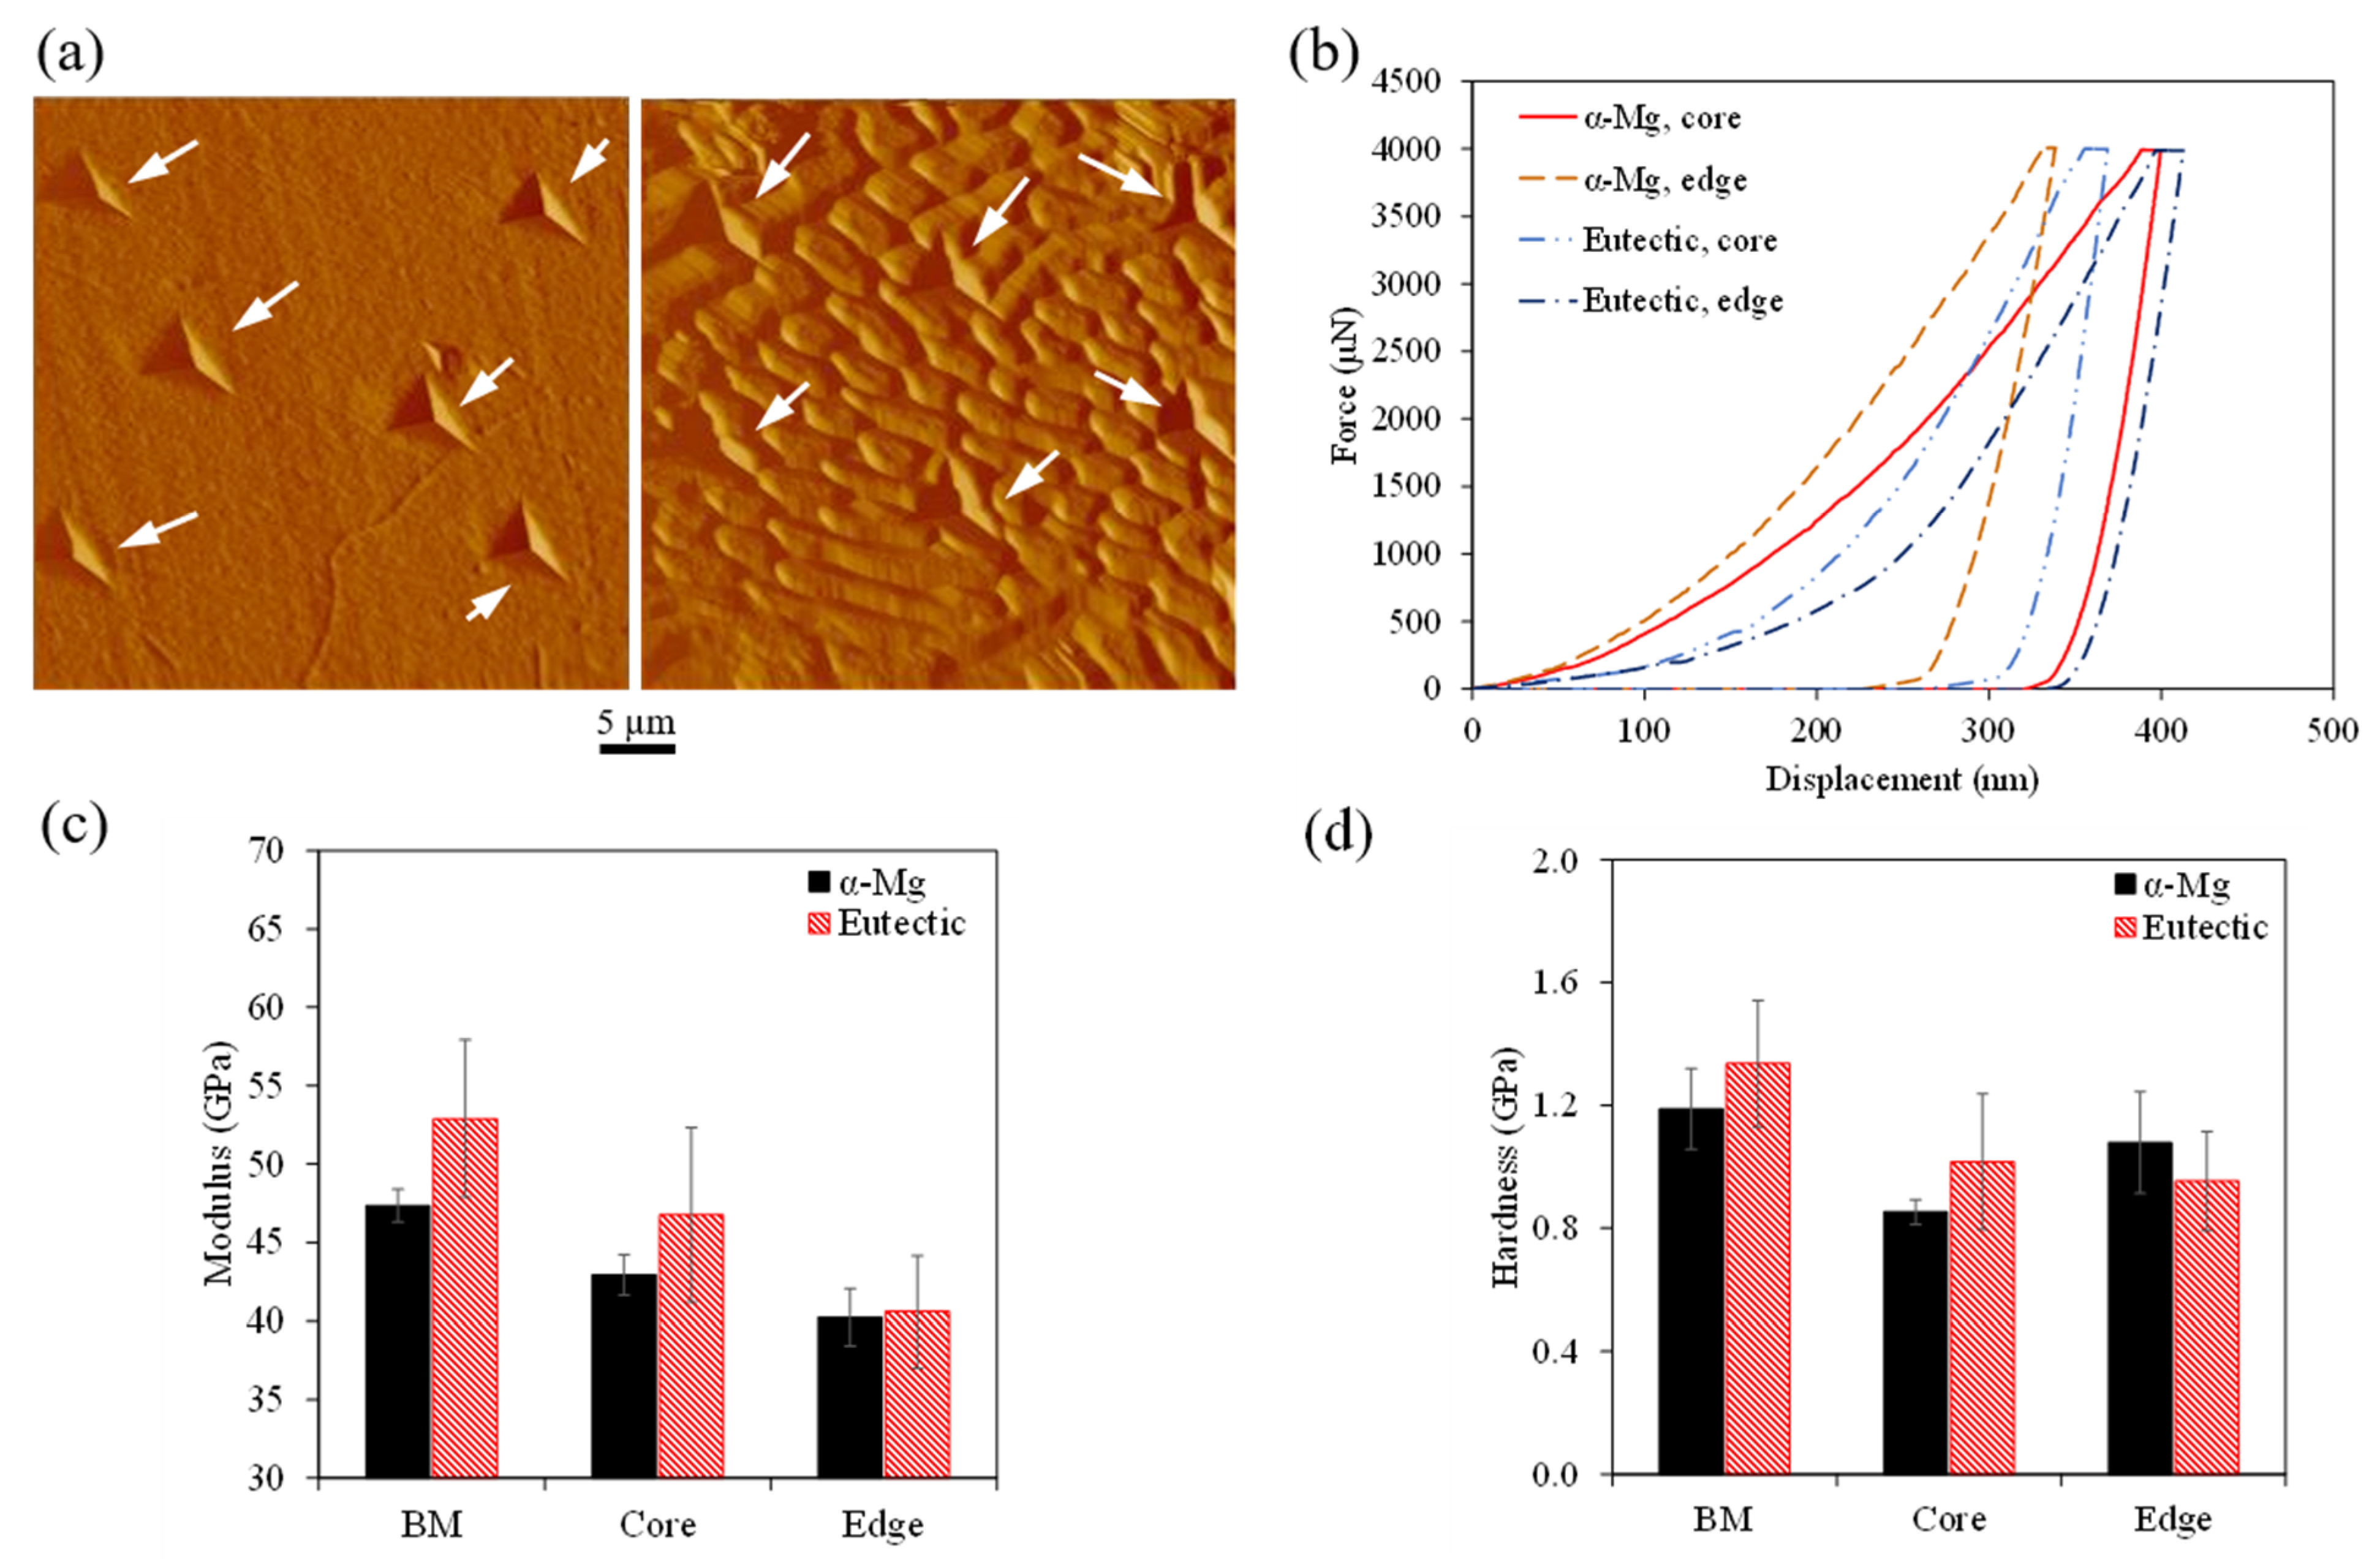
  • The higher concentration of precipitates observed in the rod edge resulted in a higher observed microhardness (up to 61.6% higher) due to precipitate strengthening. In addition, the α-Mg matrix also showed a higher hardness in nanoscale testing resulting from solid–solution strengthening as the α-Mg matrix showed higher concentrations of RE elements at the edge. The hybrid microstructure resulted in having hybrid mechanical properties by having a strengthened edge and a ductile core.
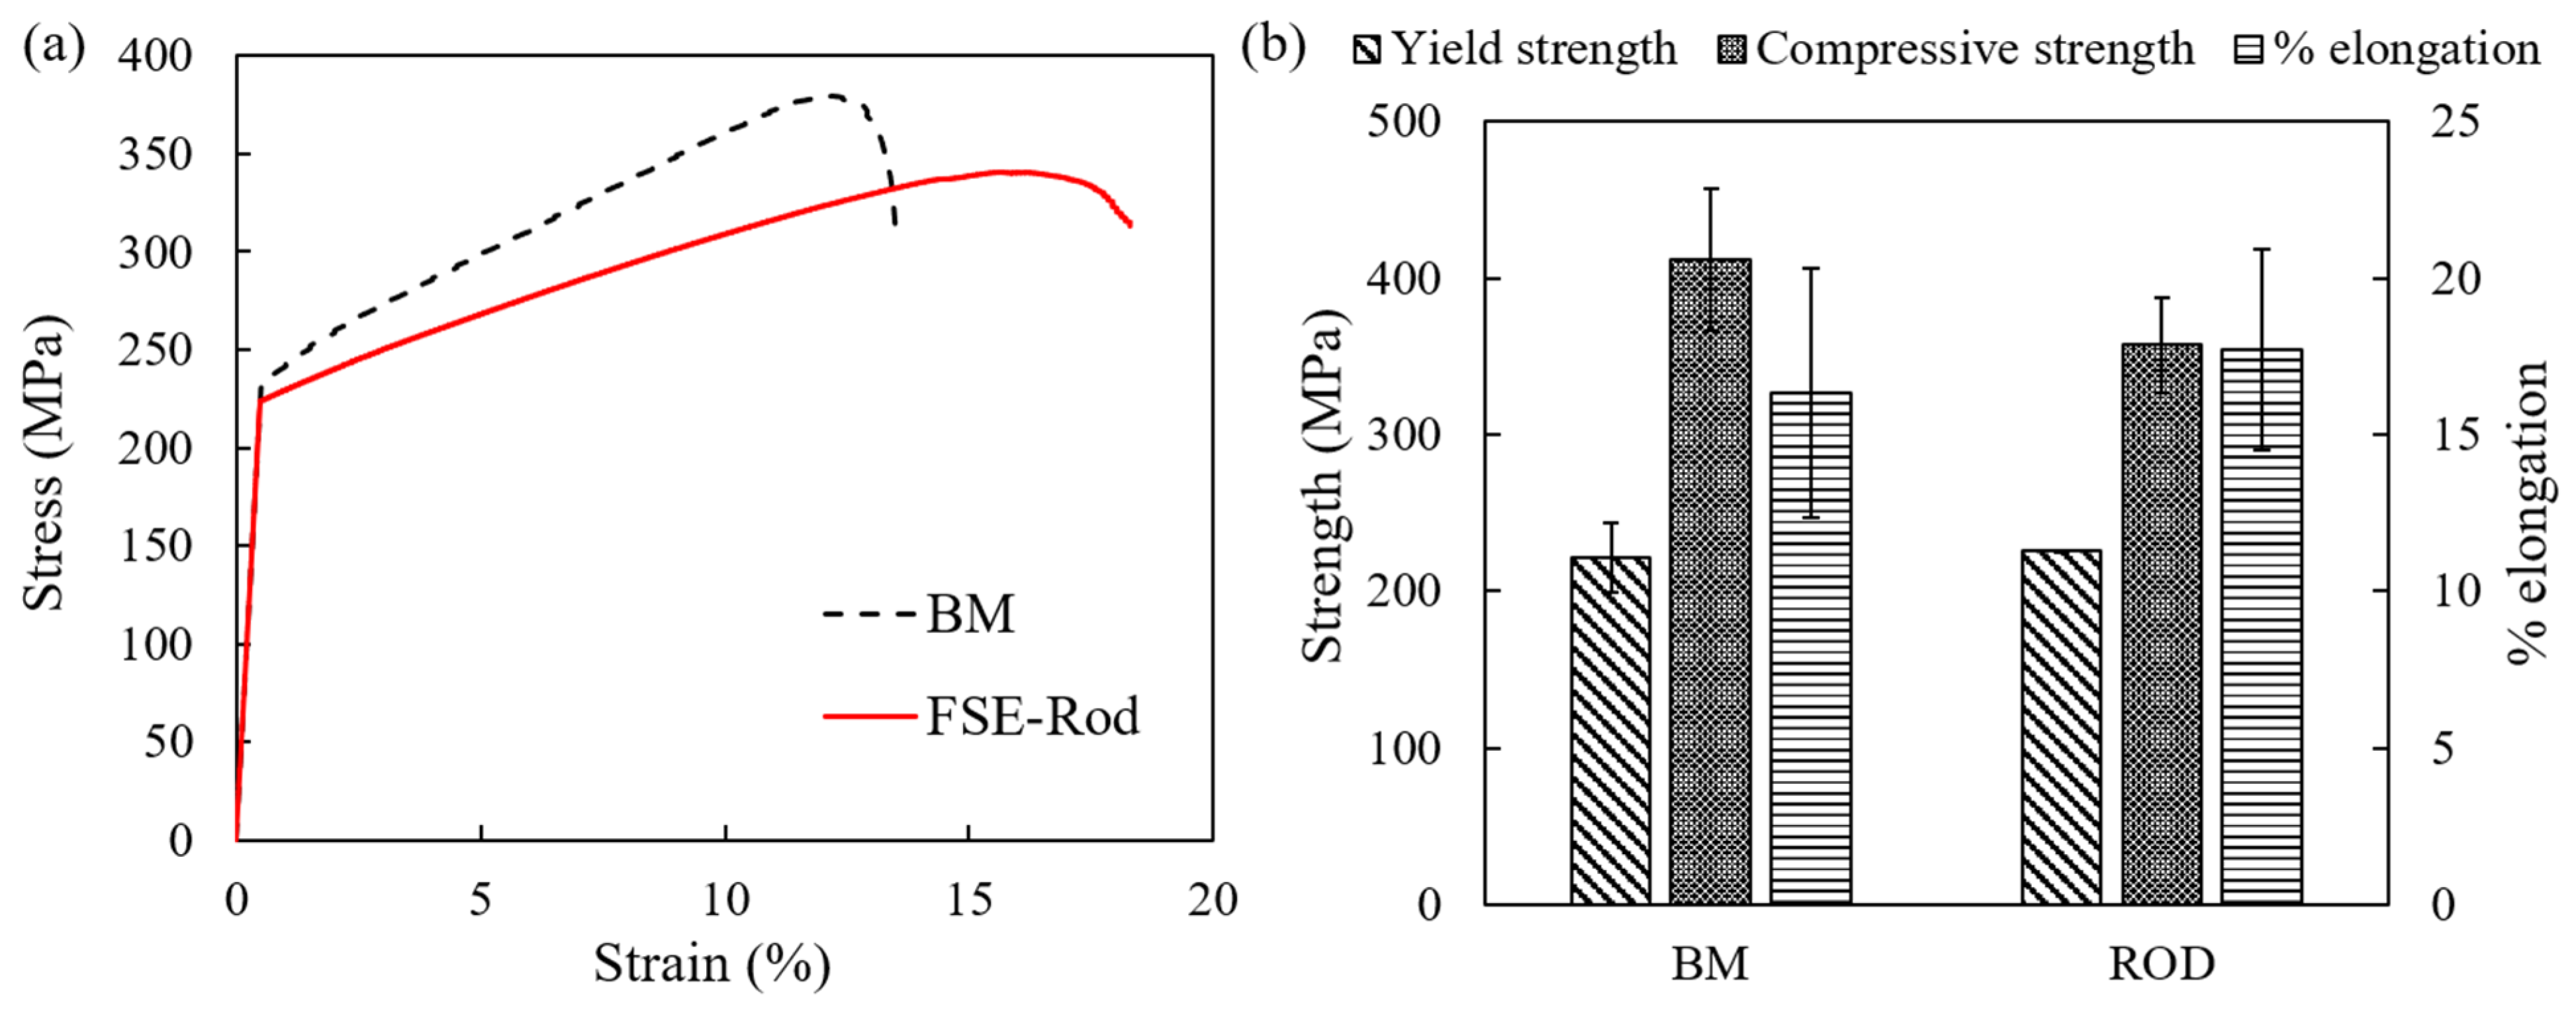
  • Under compression testing, the rod core governed the overall compression response of the rod resulting in an 8.4% increase in ductility. The rod also showed a similar yield strength and 87% of compressive strength, compared to the base material.
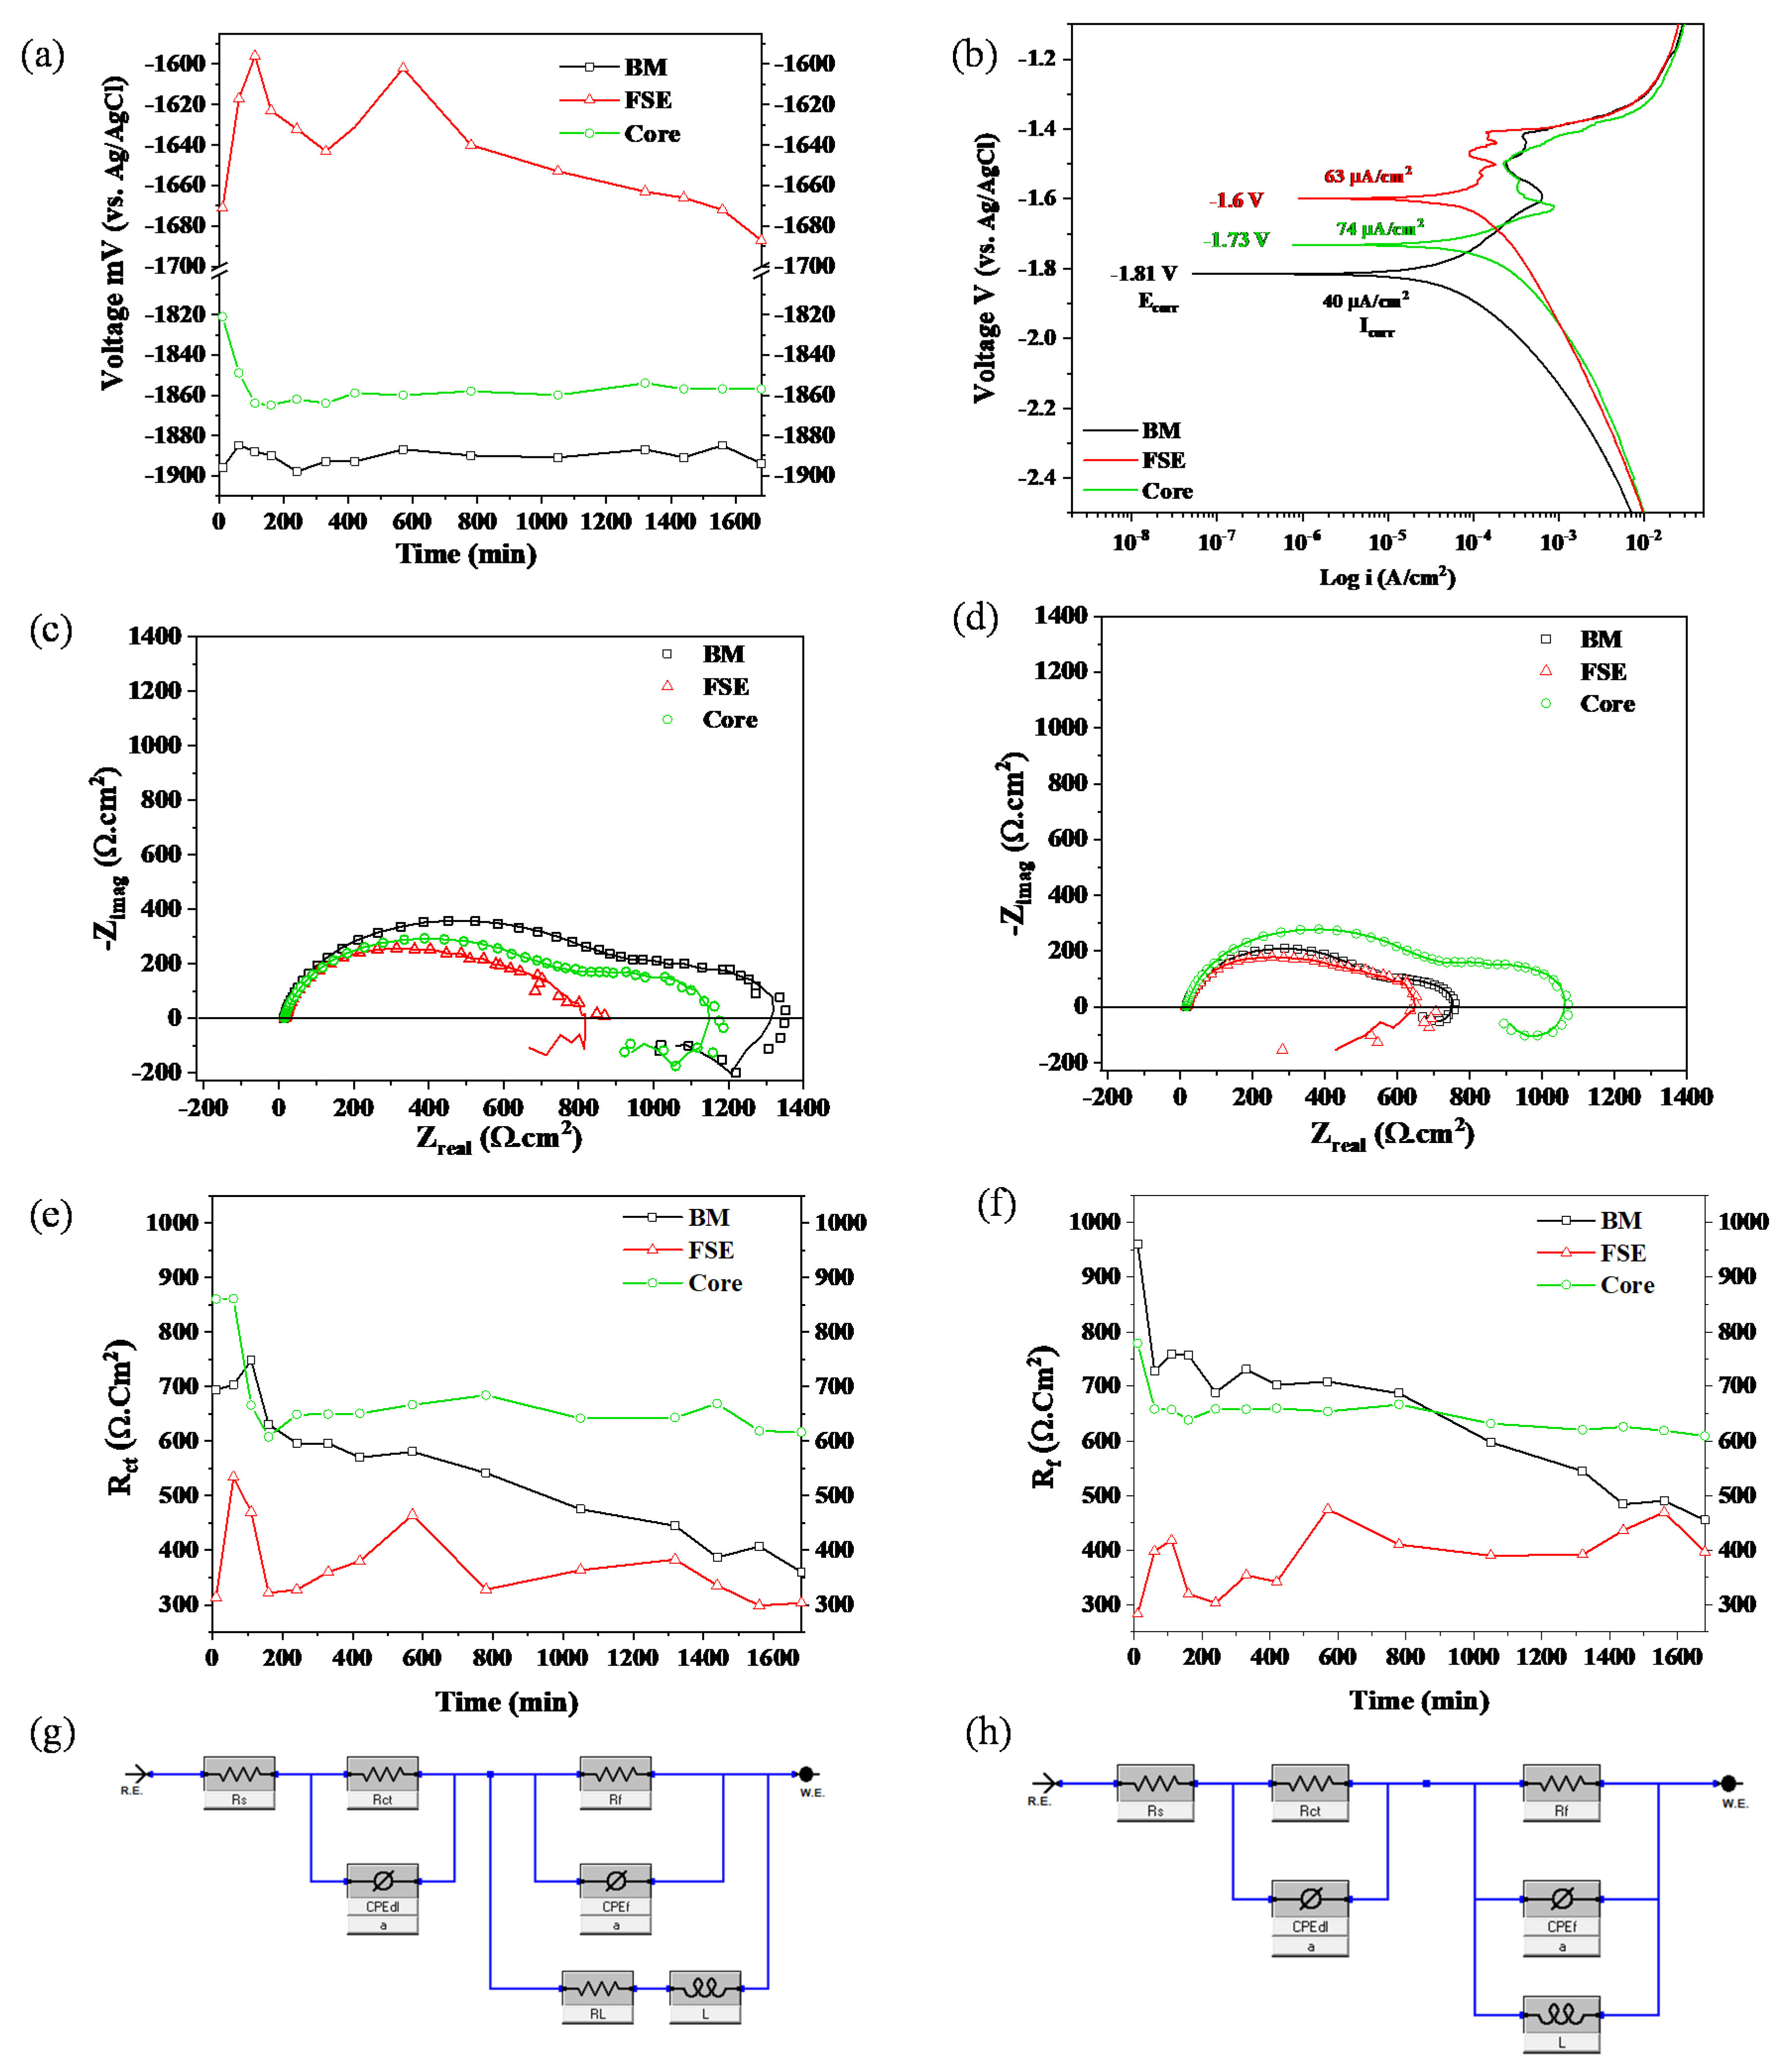
  • The friction stir-extruded WE43 Mg rod showed lower corrosion resistance compared to the BM, due to the evolved hybrid microstructure. However, removing the edge region from the friction stir-extruded rod improved the corrosion resistance relative to the BM and friction stir-extruded samples. The rod with the edge removed showed the most stable film resistance throughout the immersion time of the study. This is highly beneficial for applications such as frac plugs and biomedical devices, that require a tailored corrosion rate.
  • The results show that by utilizing FSE to prepare Mg alloy rods, the multiscale mechanical and corrosion response of the rod can be tailored. The FSE process can be further optimized by tool design and process parameter studies with the goal of minimizing heat input to the extruding material while facilitating intense plastic deformation. This can result in further control of the size and distribution of precipitates in the rod cross-section.

Author Contributions

M.A.-B.: Investigation, writing—original draft and editing, visualization, and formal analysis; V.C.S.: investigation, writing—review and editing, and visualization.; C.A.U.: investigation, writing—review and editing, and visualization; B.M.: methodology, formal analysis, writing—review and editing, supervision, project administration, and funding acquisition. All authors have read and agreed to the published version of the manuscript.

Funding

This publication was made possible by the grant QRLP11-G-2007018 from the Qatar National Research Fund (a member of The Qatar Foundation) and an internal grant provided by the Texas A&M University in Qatar under a Responsive Research Seed Grant (RRSG). The statements made herein are solely the responsibility of the authors.

Institutional Review Board Statement

Not applicable.

Informed Consent Statement

Not applicable.

Data Availability Statement

The raw/processed data required to reproduce these findings cannot be shared at this time as the data also forms part of an ongoing study.

Acknowledgments

The authors are thankful for support of the Mechanical Engineering Department, Texas A&M University, Qatar.

Conflicts of Interest

The authors declare no conflict of interest. The funders had no role in the design of the study, in the collection, analyses, or interpretation of data, in the writing of the manuscript, or in the decision to publish the results.

References

  1. Pollock, T.M. Weight Loss with Magnesium Alloys. Science 2010, 328, 986. [Google Scholar] [CrossRef] [PubMed]
  2. Charyeva, O.; Dakischew, O.; Sommer, U.; Heiss, C.; Schnettler, R.; Lips, K.S. Biocompatibility of Magnesium Implants in Primary Human Reaming Debris-Derived Cells Stem Cells in Vitro. J. Orthop. Traumatol. 2016, 17, 63–73. [Google Scholar] [CrossRef] [PubMed] [Green Version]
  3. Luo, A.A. Magnesium Casting Technology for Structural Applications. J. Magnes. Alloy. 2013, 1, 2–22. [Google Scholar] [CrossRef] [Green Version]
  4. Mordike, B.L.; Ebert, T. Magnesium: Properties—Applications—Potential. Mater. Sci. Eng. A 2001, 302, 37–45. [Google Scholar] [CrossRef]
  5. Dunne, T.R.; Yue, W.; Zhao, L.; Nettles, D.; Cheng, P.; Ren, J.; Liu, Y. Addressing Corrosion Stress Cracking Issue of Magnesium Frac Plugs Used in Ultra HPHT Shale Well Development. In Proceedings of the International Petroleum Exhibition & Conference, Abu Dhabi, UAE, 15–18 November 2021; p. D041S107R004. [Google Scholar]
  6. Fripp, M.; Walton, Z. Degradable Metal for Use in a Fully Dissolvable Frac Plug. In Proceedings of the Offshore Technology Conference, Houston, TX, USA, 5 May 2016; p. D021S021R003. [Google Scholar]
  7. Doege, E.; Droder, K. Sheet Metal Forming of Magnesium Wrought Alloys—Formability and Process Technology. J. Mater. Process. Technol. 2001, 115, 14–19. [Google Scholar] [CrossRef]
  8. Di Mario, C.; Griffiths, H.; Goktekin, O.; Peeters, N.; Verbist, J.; Bosiers, M.; Deloose, K.; Heublein, B.; Rohde, R.; Kasese, V.; et al. Drug-Eluting Bioabsorbable Magnesium Stent. J. Interv. Cardiol. 2004, 17, 391–395. [Google Scholar] [CrossRef]
  9. Levy, G.; Aghion, E. Effect of Diffusion Coating of Nd on the Corrosion Resistance of Biodegradable Mg Implants in Simulated Physiological Electrolyte. Acta Biomater. 2013, 9, 8624–8630. [Google Scholar] [CrossRef]
  10. Rapetto, C.; Leoncini, M. Magmaris: A New Generation Metallic Sirolimus-Eluting Fully Bioresorbable Scaffold: Present Status and Future Perspectives. J. Thorac. Dis. 2017, 9, S903–S913. [Google Scholar] [CrossRef] [Green Version]
  11. Kulekci, M.K. Magnesium and Its Alloys Applications in Automotive Industry. Int. J. Adv. Manuf. Technol. 2008, 39, 851–865. [Google Scholar] [CrossRef]
  12. Alaneme, K.K.; Okotete, E.A. Enhancing Plastic Deformability of Mg and Its Alloys—A Review of Traditional and Nascent Developments. J. Magnes. Alloy. 2017, 5, 460–475. [Google Scholar] [CrossRef]
  13. Langelier, B.; Esmaeili, S. Effects of Ce Additions on the Age Hardening Response of Mg–Zn Alloys. Mater. Charact. 2015, 101, 1–8. [Google Scholar] [CrossRef]
  14. Renna, G.; Leo, P.; Casavola, C. Effect of ElectroSpark Process Parameters on the WE43 Magnesium Alloy Deposition Quality. Appl. Sci. 2019, 9, 4383. [Google Scholar] [CrossRef] [Green Version]
  15. Eivani, A.R.; Mehdizade, M.; Chabok, S.; Zhou, J. Applying Multi-Pass Friction Stir Processing to Refine the Microstructure and Enhance the Strength, Ductility and Corrosion Resistance of WE43 Magnesium Alloy. J. Mater. Res. Technol. 2021, 12, 1946–1957. [Google Scholar] [CrossRef]
  16. Cao, G.; Zhang, D.; Zhang, W.; Zhang, W. In Vitro Corrosion Study of Friction Stir Processed WE43 Magnesium Alloy in a Simulated Body Fluid. Materials 2016, 9, 542. [Google Scholar] [CrossRef] [Green Version]
  17. Marwa, A.; Usman, C.A.; Shunmugasamy, V.C.; Karaman, I.; Mansoor, B. Corrosion Behavior of Mg-Zn-Zr-RE Alloys under Physiological Environment—Impact on Mechanical Integrity and Biocompatibility. J. Magnes. Alloy. 2021, 10, 1542–1572. [Google Scholar]
  18. Kalb, H.; Rzany, A.; Hensel, B. Impact of Microgalvanic Corrosion on the Degradation Morphology of WE43 and Pure Magnesium under Exposure to Simulated Body Fluid. Corros. Sci. 2012, 57, 122–130. [Google Scholar] [CrossRef]
  19. Song, G.; St John, D. The Effect of Zirconium Grain Refinement on the Corrosion Behaviour of Magnesium-Rare Earth Alloy MEZ. J. Light Met. 2002, 2, 1–16. [Google Scholar] [CrossRef]
  20. Ramesh, S.; Lakshminarayanan, A.K.; Raghavan, Y.; Harathi, Y. Fabrication and Numerical Analysis of Friction Stir Back Extruded Lightweight Magnesium Alloy Heat Pipes. Mater. Sci. Forum 2020, 979, 129–134. [Google Scholar] [CrossRef]
  21. Abu-Farha, F. A Preliminary Study on the Feasibility of Friction Stir Back Extrusion. Scr. Mater. 2012, 66, 615–618. [Google Scholar] [CrossRef]
  22. Shunmugasamy, V.C.; Khalid, E.; Mansoor, B. Friction Stir Extrusion of Ultra-Thin Wall Biodegradable Magnesium Alloy Tubes—Microstructure and Corrosion Response. Mater. Today Commun. 2021, 26, 102129. [Google Scholar] [CrossRef]
  23. Al-Buainain, M.; Shunmugasamy, V.C.; Mansoor, B. Friction Stir Extrusion of AZ31 Magnesium Alloy Rod BT—Magnesium Technology 2022; Maier, P., Barela, S., Miller, V.M., Neelameggham, N.R., Eds.; Springer International Publishing: Cham, Switzerland, 2022; pp. 207–212. [Google Scholar]
  24. Buffa, G.; Campanella, D.; Fratini, L.; Micari, F. AZ31 Magnesium Alloy Recycling through Friction Stir Extrusion Process. Int. J. Mater. Form. 2016, 9, 613–618. [Google Scholar] [CrossRef]
  25. Rokhlin, L.L. Dependence of the Rare Earth Metal Solubility in Solid Magnesium on Its Atomic Number. J. Phase Equilibria 1998, 19, 142–145. [Google Scholar] [CrossRef]
  26. Chen, Y.; Xu, Z.; Smith, C.; Sankar, J. Recent Advances on the Development of Magnesium Alloys for Biodegradable Implants. Acta Biomater. 2014, 10, 4561–4573. [Google Scholar] [CrossRef] [PubMed]
  27. Hort, N.; Huong, Y.; Kainer, K.U. Intermetallics in Magnesium Alloys. Adv. Eng. Mater. 2006, 8, 235–240. [Google Scholar] [CrossRef]
  28. Rzychoń, T.; Kiełbus, A. Microstructure of WE43 Casting Magnesium Alloy. J. Achiev. Mater. Manuf. Eng. 2007, 21, 31–34. [Google Scholar]
  29. Mengucci, P.; Barucca, G.; Riontino, G.; Lussana, D.; Massazza, M.; Ferragut, R.; Aly, E.H. Structure Evolution of a WE43 Mg Alloy Submitted to Different Thermal Treatments. Mater. Sci. Eng. A 2008, 479, 37–44. [Google Scholar] [CrossRef]
  30. Cai, Y.; Wei, J.; Yan, H.; Chen, Y.; Chen, R. Low-Cycle Fatigue Behavior of Solutionized and Aged WE43 Magnesium Alloys at Room Temperature. J. Magnes. Alloy. 2022. [Google Scholar] [CrossRef]
  31. Kang, Y.; Huang, Z.; Zhao, H.; Gan, C.; Zhou, N.; Zheng, K.; Zhang, J.; Pan, F.; Huang, J.C.; Wang, S. Comparative Study of Hot Deformation Behavior and Microstructure Evolution of As-Cast and Extruded WE43 Magnesium Alloy. Metals 2020, 10, 429. [Google Scholar] [CrossRef] [Green Version]
  32. Gladman, T. On the Theory of the Effect of Precipitate Particles on Grain Growth in Metals. Proc. R. Soc. London. Ser. A. Math. Phys. Sci. 1966, 294, 298–309. [Google Scholar]
  33. Lee, H.J.; Lee, S.K.; Jung, K.H.; Lee, G.A.; Ahn, B.; Kawasaki, M.; Langdon, T.G. Evolution in Hardness and Texture of a ZK60A Magnesium Alloy Processed by High-Pressure Torsion. Mater. Sci. Eng. A 2015, 630, 90–98. [Google Scholar] [CrossRef]
  34. Kulakov, M.; Mail, M.; Kulagin, R. The Effect of the Die Rotation During Extrusion on the Shape of Embedded Markers. Mater. Lett. 2022, 322, 132486. [Google Scholar] [CrossRef]
  35. Baffari, D.; Buffa, G.; Fratini, L. A Numerical Model for Wire Integrity Prediction in Friction Stir Extrusion of Magnesium Alloys. J. Mater. Process. Technol. 2017, 247, 1–10. [Google Scholar] [CrossRef]
  36. Wang, Y.N.; Huang, J.C. Texture Analysis in Hexagonal Materials. Mater. Chem. Phys. 2003, 81, 11–26. [Google Scholar] [CrossRef]
  37. Rodriguez, A.K.; Ayoub, G.A.; Mansoor, B.; Benzerga, A.A. Effect of Strain Rate and Temperature on Fracture of Magnesium Alloy AZ31B. Acta Mater. 2016, 112, 194–208. [Google Scholar] [CrossRef]
  38. Milner, J.L.; Abu-Farha, F. Friction Stir Back Extrusion of Mg AZ31B-F: A Preliminary Investigation. In Magnesium Technology 2014; Alderman, M., Manuel, M.V., Hort, N., Neelameggham, N.R., Eds.; Springer International Publishing: Cham, Switzerland, 2014; pp. 497–503. ISBN 978-3-319-48231-6. [Google Scholar]
  39. Afrin, N.; Chen, D.L.; Cao, X.; Jahazi, M. Strain Hardening Behavior of a Friction Stir Welded Magnesium Alloy. Scr. Mater. 2007, 57, 1004–1007. [Google Scholar] [CrossRef]
  40. Dorbane, A.; Ayoub, G.; Mansoor, B.; Hamade, R.F.; Kridli, G.; Shabadi, R.; Imad, A. Microstructural Observations and Tensile Fracture Behavior of FSW Twin Roll Cast AZ31 Mg Sheets. Mater. Sci. Eng. A 2016, 649, 190–200. [Google Scholar] [CrossRef]
  41. Liu, J.; Li, S.; Zhang, N.; Liu, Q.; Ma, Q.; Han, Z. Study on the Evolution of the Microstructure, Phase Composition, Three-Dimensional Morphology, and Hardness in the Solution Treatment of Mg−7.80Gd−2.43Y−0.38Zr Alloy. Materwiss. Werksttech. 2021, 52, 847–859. [Google Scholar] [CrossRef]
  42. Xiang, C. Magnesium Alloy WE43 and WE43-T5—Mechanical and Thermal Properties. Ph.D. Thesis, New York University, New York, NY, USA, 2016. [Google Scholar]
  43. Gao, L.; Chen, R.S.; Han, E.H. Solid Solution Strengthening Behaviors in Binary Mg–Y Single Phase Alloys. J. Alloy. Compd. 2009, 472, 234–240. [Google Scholar] [CrossRef]
  44. Li, J.; Meng, X.; Li, Y.; Wan, L.; Huang, Y. Friction Stir Extrusion for Fabricating Mg-RE Alloys with High Strength and Ductility. Mater. Lett. 2021, 289, 129414. [Google Scholar] [CrossRef]
  45. Yang, C.; Gupta, N.; Ding, H.; Xiang, C. Effect of Microstructure on Corrosion Behavior of WE43 Magnesium Alloy in as Cast and Heat-Treated Conditions. Metals 2020, 10, 1552. [Google Scholar] [CrossRef]
  46. Feng, B.; Liu, G.; Yang, P.; Huang, S.; Qi, D.; Chen, P.; Wang, C.; Du, J.; Zhang, S.; Liu, J. Different Role of Second Phase in the Micro-Galvanic Corrosion of WE43 Mg Alloy in NaCl and Na2SO4 Solution. J. Magnes. Alloy. 2022, 10, 1598–1608. [Google Scholar] [CrossRef]
  47. Brady, M.P.; Rother, G.; Anovitz, L.M.; Littrell, K.C.; Unocic, K.A.; Elsentriecy, H.H.; Song, G.-L.; Thomson, J.K.; Gallego, N.C.; Davis, B. Film Breakdown and Nano-Porous Mg(OH)2 Formation from Corrosion of Magnesium Alloys in Salt Solutions. J. Electrochem. Soc. 2015, 162, 140–149. [Google Scholar] [CrossRef]
  48. Song, D.; Ma, A.; Jiang, J.; Lin, P.; Yang, D.; Fan, J. Corrosion Behavior of Equal-Channel-Angular-Pressed Pure Magnesium in NaCl Aqueous Solution. Corros. Sci. 2010, 52, 481–490. [Google Scholar] [CrossRef]
  49. Coy, A.E.; Viejo, F.; Skeldon, P.; Thompson, G.E. Susceptibility of Rare-Earth-Magnesium Alloys to Micro-Galvanic Corrosion. Corros. Sci. 2010, 52, 3896–3906. [Google Scholar] [CrossRef]
  50. Chu, P.W.; Marquis, E.A. Linking the Microstructure of a Heat-Treated WE43 Mg Alloy with Its Corrosion Behavior. Corros. Sci. 2015, 101, 94–104. [Google Scholar] [CrossRef]
  51. Gerashi, E.; Alizadeh, R.; Langdon, T.G. Effect of Crystallographic Texture and Twinning on the Corrosion Behavior of Mg Alloys: A Review. J. Magnes. Alloy. 2022, 10, 313–325. [Google Scholar] [CrossRef]
  52. Torbati-Sarraf, H.; Torbati-Sarraf, S.A.; Poursaee, A.; Langdon, T.G. Electrochemical Behavior of a Magnesium ZK60 Alloy Processed by High-Pressure Torsion. Corros. Sci. 2019, 154, 90–100. [Google Scholar] [CrossRef] [Green Version]
  53. Song, D.; Ma, A.B.; Jiang, J.H.; Lin, P.H.; Yang, D.H.; Fan, J.F. Corrosion Behaviour of Bulk Ultra-Fine Grained AZ91D Magnesium Alloy Fabricated by Equal-Channel Angular Pressing. Corros. Sci. 2011, 53, 362–373. [Google Scholar] [CrossRef]
  54. Op’t Hoog, C.; Birbilis, N.; Estrin, Y. Corrosion of Pure Mg as a Function of Grain Size and Processing Route. Adv. Eng. Mater. 2008, 10, 579–582. [Google Scholar] [CrossRef]
  55. Yang, Z.; Ma, A.; Xu, B.; Jiang, J.; Sun, J. Corrosion Behavior of AZ91 Mg Alloy with a Heterogeneous Structure Produced by ECAP. Corros. Sci. 2021, 187, 109517. [Google Scholar] [CrossRef]
  56. Bender, S.; Goellner, J.; Heyn, A.; Schmigalla, S. A New Theory for the Negative Difference Effect in Magnesium Corrosion. Mater. Corros. 2012, 63, 707–712. [Google Scholar] [CrossRef]
  57. Zhang, K.; Zhang, X.; Deng, X.; Li, X.; Ma, M. Relationship between Extrusion, Y and Corrosion Behavior of Mg-Y Alloy in NaCl Aqueous Solution. J. Magnes. Alloy. 2013, 1, 134–138. [Google Scholar] [CrossRef] [Green Version]
  58. Jamesh, M.I.; Wu, G.; Zhao, Y.; McKenzie, D.R.; Bilek, M.M.M.; Chu, P.K. Electrochemical Corrosion Behavior of Biodegradable Mg-Y-RE and Mg-Zn-Zr Alloys in Ringer’s Solution and Simulated Body Fluid. Corros. Sci. 2015, 91, 160–184. [Google Scholar] [CrossRef]
  59. Müller, W.D.; Nascimento, M.L.; Zeddies, M.; Córsico, M.; Gassa, L.M.; de Mele, M.A.F.L. Magnesium and Its Alloys as Degradable Biomaterials. Corrosion Studies Using Potentiodynamic and EIS Electrochemical Techniques. Mater. Res. 2007, 10, 5–10. [Google Scholar] [CrossRef] [Green Version]
  60. Baril, G.; Galicia, G.; Deslouis, C.; Pébère, N.; Vivier, V.; Baril, G.; Galicia, G.; Deslouis, C.; Pébère, N.; Tribollet, B. An Impedance Investigation of the Mechanism of Pure Magnesium Corrosion in Sodium Sulfate Solutions. J. Electrochem. Soc. 2013, 154, 108–113. [Google Scholar] [CrossRef]
Figure 1. A schematic of the friction stir extrusion process showing tool and die with a heating coil. An example extruded WE43 Mg alloy rod of 1 cm diameter is also shown.
Metals 13 00191 g001
Figure 2. Microstructure of as-received WE43 Mg alloy. (a) Optical micrograph of as-received material showing α-Mg matrix and precipitates. SEM image along with EDS map scan presenting elemental distribution showing (b) intermetallic, and (c) cuboid-shaped precipitate.
Metals 13 00191 g002
Figure 3. (a) Collage of OM images showing WE43 Mg alloy extruded rod overall macrostructure. Optical micrographs showing (b) three distinct regions, (c) edge, (d) core, and (e,f) transition zone.
Metals 13 00191 g003
Figure 4. (a) SEM image of rod’s edge and (b) elemental compositional analysis across line shown in (a). (c) EDS elemental maps of the precipitate cluster in the edge region.
Metals 13 00191 g004
Figure 5. (a) SEM image of the α-Mg matrix in the core region and (b) elemental compositional analysis across line shown in (a). (c) Eutectic observed in core region and (d) EDS elemental maps of eutectic intermetallic in the core region.
Metals 13 00191 g005
Figure 6. EDS line compositional analysis across (a) core grains and (b) from the core toward the edge region.
Metals 13 00191 g006
Figure 7. Energy-dispersive spectroscopy (EDS) spot analysis for the (a) core, and (b) edge for the α-Mg matrix, eutectic phase, and cuboid-shaped precipitate.
Metals 13 00191 g007
Figure 8. X-ray diffraction pattern for the base material and friction stir-extruded rod.
Metals 13 00191 g008
Figure 9. EBSD images showing orientation maps for (a) the BM in the TD–RD plane, rod cross-section (ND1-ND2 plane)—(c) the core, and (e) the edge; (b,d,f) represent pole figures for the BM, rod core, and rod edge, respectively.
Metals 13 00191 g009
Figure 10. Variation of (a) grain size and (b) Vickers microhardness of different regions in the rod cross-section (ND1-ND2 plane).
Metals 13 00191 g010
Figure 11. (a) Scanning probe tomography image of α-Mg and eutectic phase showing nanoindents, (b) representative load–displacement curves for α-Mg and eutectic phase in the FSE rod. (c,d) show the variation of modulus and hardness obtained from the load–displacement curves for the rod zones compared with the BM.
Metals 13 00191 g011
Figure 12. (a) Compression stress–strain curve for the base material and FSE rod. (b) Comparison of yield strength, compressive strength, and ductility obtained from the compression stress–strain curves.
Metals 13 00191 g012
Figure 13. (a) Evolution of open circuit potential of BM, FSE, and core, during 1680 min of immersion in HBSS at 37 ± 1 °C. (b) Potentiodynamic polarization curves obtained after 30 min of immersion. Evolution of Nyquist plots after (c) 110 min and (d) 1680 min of immersion. Variation of (e) charge transfer resistance and (f) film resistance, equivalent circuit utilized for (g) BM and core samples, (h) FSE sample.
Metals 13 00191 g013
Disclaimer/Publisher’s Note: The statements, opinions and data contained in all publications are solely those of the individual author(s) and contributor(s) and not of MDPI and/or the editor(s). MDPI and/or the editor(s) disclaim responsibility for any injury to people or property resulting from any ideas, methods, instructions or products referred to in the content.

