Article

Numerical Simulation and Deformation Behavior of a Ti/Steel Clad Plate during the Rolling Process

1
State Key Laboratory of Rolling and Automation, Northeastern University, Shenyang 110819, China
2
Shandong Iron & Steel Group Rizhao Co. Ltd., Rizhao 276800, China
*
Author to whom correspondence should be addressed.
Metals 2023, 13(2), 218; https://doi.org/10.3390/met13020218
Submission received: 15 December 2022 / Revised: 16 January 2023 / Accepted: 19 January 2023 / Published: 23 January 2023

Abstract

:
The deformation mechanism is complex in the hot rolling process of clad plates, and head bending is a common defect. In this paper, an analytical computational mechanical model of a metal plate was established by the classical elastic mechanics method, and the relationship between uneven thickness extension and warpage was obtained. The hot rolling bonding process of dissimilar bimetallic plates of Ti/Steel was investigated. On this basis, the mechanical origins of the plate bending defects and the influence of various factors on the evolution of the plate bending defects of the metal plates were revealed. The results indicated that the rolling forces increased with the increase in reduction ratio and thickness ratio. As the total reduction ratios of the clad plates increased, the reduction ratio of each layer increased. Furthermore, it was found that the thickness reduction ratios of steel were larger than those of Ti at a certain total reduction ratio, which could reach up to 59.6%. When the reduction ratios were 0.4 and 0.45, the bending degree increased with the thickness ratio of the upper and lower plates increasing gradually. The maximum warpage could reach 0.349 m. The clad plate shape was better when the roll speed ratio was 1.02 and the reduction rate was 0.4. The present numerical results provide a valuable insight into the deformation behaviors and mechanisms involved in the hot rolling of clad plates.

1. Introduction

A metal clad plate is made of two or more kinds of metal plates with different physical, chemical and mechanical properties by means of a composite technology [1]. Metal clad plates are widely used in petrochemical, chemical, aeronautics and astronautics, marine engineering and other fields because of its excellent performance [2]. Among the production technologies of composite materials, the hot rolling process is an efficient and high-quality production technique, which is used to produce laminates especially in mass production, allowing saving energy [3]. However, a few studies have been carried out on the manufacturing of Ti/steel clad plates [4,5,6].
Because of its high speed and reliability, more and more scholars have applied the finite element method to theoretical research, and great achievements have been made in the hot rolling process of metal clad plates. Hwang et al. [7] developed a mathematical model using the stream function method and upper-bound theorem to study the plastic deformation behavior of the layers in the roll gap, as well as the asymmetrical rolling process of bimetal layer strips. In this research, the effects of several parameters on the curvature radius and the thickness ratio of the product as well as the rolling force were investigated [8]. It is worth noting that the results of this study were in good agreement with the experimental results. Jiang et al. [9] analyzed the roll bonding of bimetal layer strips using the stream function methods and the upper bound theorem. Using the presented analysis, not only the radius of curvature of the strip after leaving the roll gap, but also the ratio of the final thickness of the sheets were investigated. Tzou et al. [10] studied the stress field in the hot and cold roll bonding process of double-layer sheets using the slab method. More precisely, the pressure distribution, shear stress at the bond interface, rolling force and moment were evaluated using this method. Mendes et al. [11] studied the formation of the interface zone during accumulative roll bonding of Al/IF steel multilayered composites. Khaledi et al. [12] presented a new version of a cohesion zone element to describe both bonding and debonding processes in FEM. However, the presented interface model could be only used to simulate the bond formation process between metals with similar yield stresses. Pesin et al. [13] used the FEM to analysis the influence of rolls speed ratio, contact friction and layer thicknesses on strain distribution through composite thickness, especially on the interface between the AA1050 and the AA6061 layers, during asymmetric ARB. The results showed that the strain in the soft material (AA1050) at the interface could be extremely increased, while the strain in the hard material (AA6061) remained almost unchanged. However, an opposite tendency was found by Su et al. [14,15] during the fabrication of an AA1050/AA6061 composite with the ARB process. They clarified that both AA1050 and AA6061 layers in the composite accumulated a very close strain no matter if they were deformed in the composite sheets or in the single material sheets. Such a phenomenon was further confirmed during the rolling of an AA5005/AA6061 bimetal composite [16].
However, there are still many problems in the actual production, some of which have not been solved well, such as the low bonding strength of the composite interface, the high residual stress, head warping, drum defects, and so on [17]. It is worth noting that head bending and surface defects are the common problems affecting product quality during hot rolling [18]. In fact, due to the variations of the physical and mechanical properties of dissimilar metal laminates, it is even easier to produce uneven plastic elongation in the hot rolling process causing bending defects in the bulk product. At present, there are few studies considering the bending deformation of metal clad plates. Some recent studies focused on the mechanical properties of the Ti/steel clad interface with various interlayers. Eroglu et al. [19] studied diffusion bonding between the Ti-6Al-4V alloy and micro-duplex stainless steel with a copper interlayer, and the results indicated that TiFe cannot be eliminated by the copper interlayer. Kundu and Chatterjee [20] analyzed the effect of temperature on the microstructural evolution and mechanical properties of the Ti/Nb/stainless steel interface via diffusion cladding. The results indicated the presence of Fe2Nb and Fe7Nb6 under different temperature conditions. Yu et al. [21] studied the shear properties and microstructure of the TA2/Q235B interface through hot-rolling cladding with a DT4-alloy layer, demonstrating the formation of a TiFe intermetallic compound at the interface at low temperature.
In this paper, based on the warpage process of a Ti/Steel composite plate, an analytical model of the bending deformation of double-layer composite plates was established under the assumption of an ideal linear continuous initial strain distribution. In addition to this, ANSYS/LS-DYNA was used to simulate the plastic deformation behavior of Ti/Steel during the hot rolling process entirely, and we analyzed and discussed the influence of the reduction rate, the ratio of upper and lower roller speeds and the ratio of upper and lower plate thicknesses on the bending of clad sheets. Throughout the study, it became clear that the proposed analytical method was applicable for clad sheets rolling and was able to offer useful knowledge for manufacturing clad sheets.

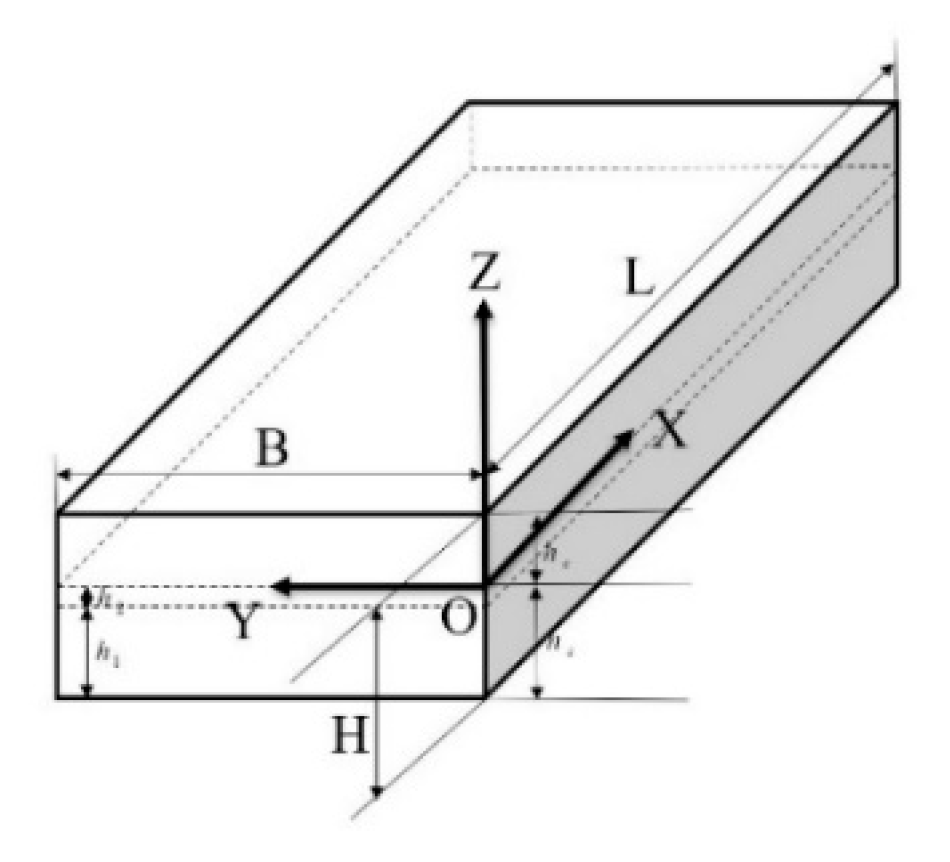
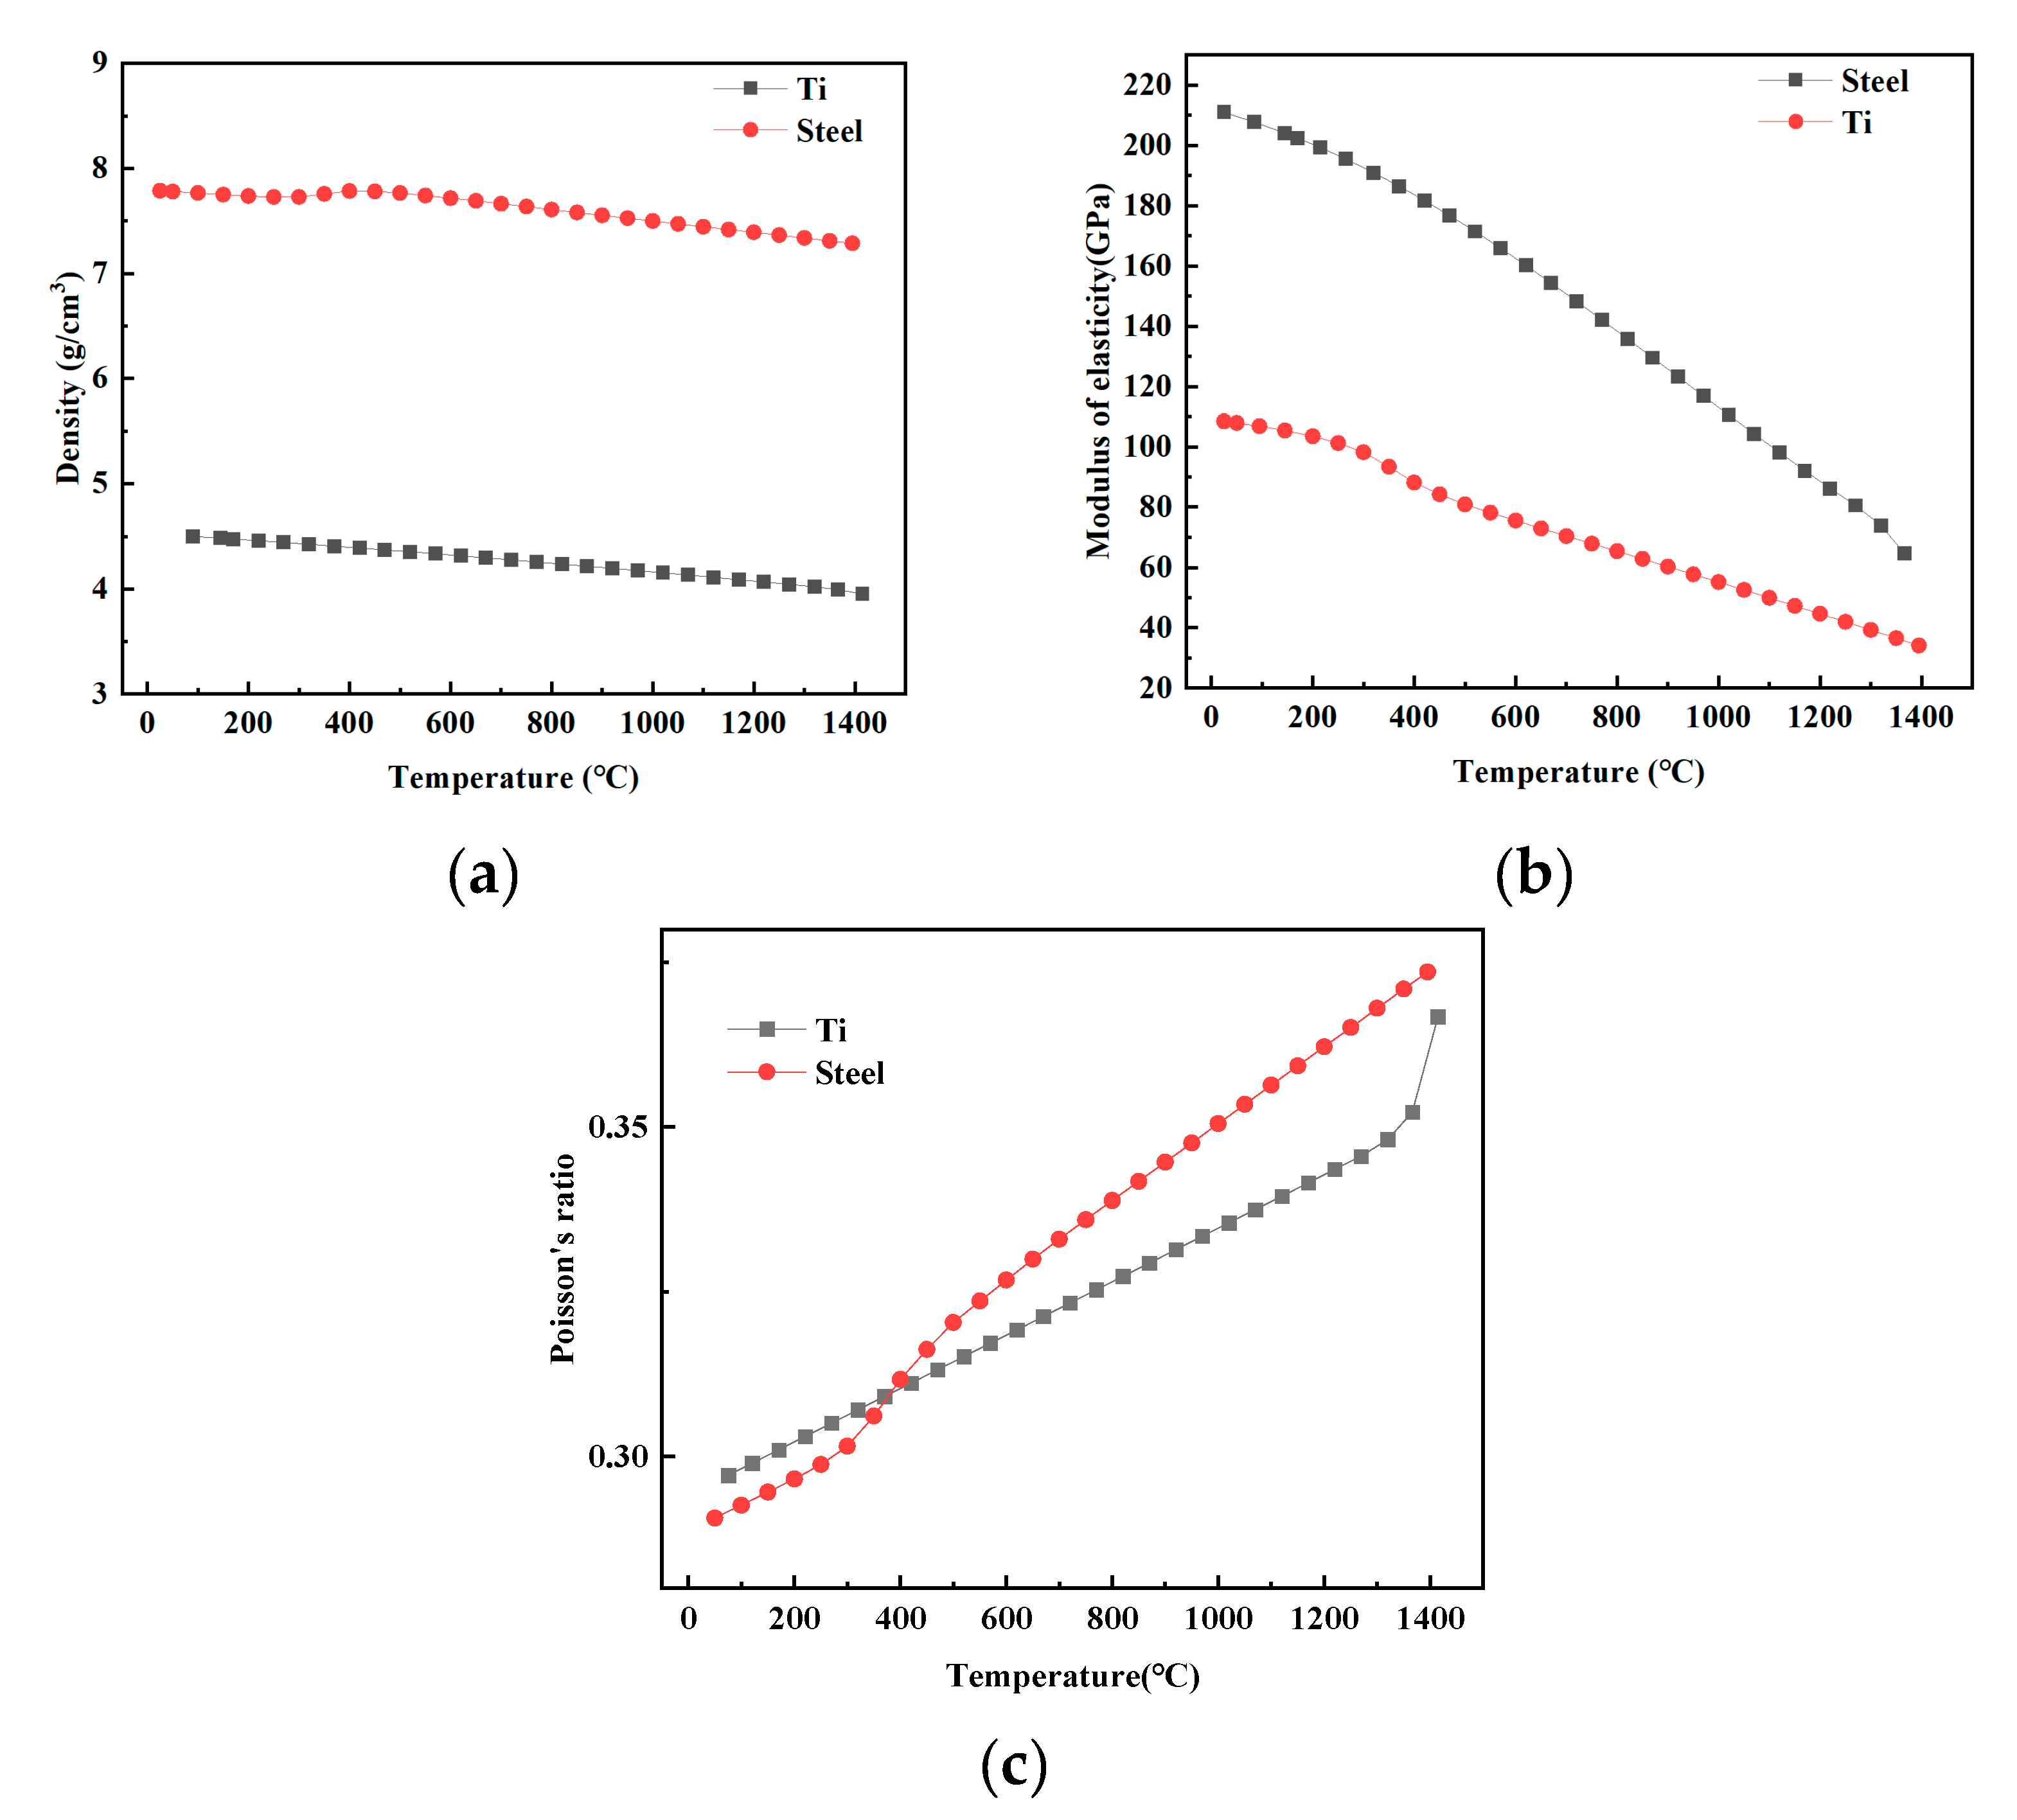
2. Mathematical Modeling

We established a model of a double-layer metal plate, as shown in Figure 1. The X, Y and Z axes coincided with the length, width and thickness of the metal clad plate, respectively. In this Figure, h 1 is the distance between the neutral layer and the lower surface of the clad plate, and h 2 is the distance between the neutral layer and the composite interface of the clad plate. Assuming that the length of the clad plate is L, the width is B, and the total thickness was H, the thickness of the upper material is h c , and the thickness of the lower material is h s . The thickness ratio of the upper metal plate to the lower metal plate is k H = h c / h s ( H = h c + h s ) . Meanwhile, the modulus of elasticity of the upper and lower metal plates are E c and E s , the Poisson’s ratios are μ c and μ s and the shear moduli are G c and G s ( G = E / [ 2 ( 1 + v ) ] ) . In addition to this, it was assumed that the material properties of the upper and lower layers of the metal plate were isotropic.
The non-uniform extension of metal clad plates in the thickness direction leads to the shape bending defect during the hot rolling process, according to elastic mechanics. The difference of the mechanical properties between the upper and the lower metal materials has an important influence on the bending defects. Therefore, based on the medium thickness plate theory, the corresponding relationship between each stress component and the internal force is shown in Equation (1), where M x , M y , Q x , Q y , M x y and M y x are the internal force of each stress component on the width [22].
M x = h 1 h 2 z σ x d z + h 2 H h 1 z σ x d z M y = h 1 h 2 z σ y d z + h 2 H h 1 z σ y d z Q x = h 1 h 2 τ x z d z + h 2 H h 1 τ x z d z Q y = h 1 h 2 τ y z d z + h 2 H h 1 τ y z d z M x y = h 1 h 2 τ x y z d z + h 2 H h 1 τ x y z d z M y x = h 1 h 2 τ y x z d z + h 2 H h 1 τ y x z d z
The stress components σ x , σ y and τ x y = τ y x are linearly distributed along the thickness direction and correspond to zero on the neutral layer. The normal stress σ z in the thickness direction can be calculated from the equilibrium differential equation of the elasticity theory [23]. The internal force is obtained with Equation (2):
σ x = 12 M x h c 3 z + 12 M x h s 3 z σ y = 12 M y h c 3 + z 12 M y h s 3 z τ x y = 12 M x y h c 3 z + 12 M x y h s 3 z τ x z = 3 ( h c 2 4 z 2 ) 2 h c 3 Q x + 3 ( h s 2 4 z 2 ) 2 h s 3 Q x τ y z = 3 ( h c 2 4 z 2 ) 2 h c 3 Q y + 3 ( h s 2 4 z 2 ) 2 h s 3 Q y σ z = [ 2 q ( 1 2 z h c ) 2 ( 1 + z h c ) ] + [ 2 q ( 1 2 z h s ) 2 ( 1 + z h s ) ]
Transverse shear stress should be considered in the process of plates’ bending deformation. Therefore, the relationship between displacement components and strain needs to be further deduced. Each strain component is shown in Equation (3):
{ ε x = u x ε y = v y ε z = w z γ y z = v z + w y γ x z = u z + w x γ x y = u y + v x
The concept of “average displacement” ( φ x and φ y ) is introduced into the medium thickness plate theory, and the specific relation equation is shown in Equation (4):
h 1 h 2 σ x u d z + h 2 H h 1 σ x u d z = M x φ x h 1 h 2 σ y v d z + h 2 H h 1 σ y v d z = M y φ y h 1 h 2 τ x z w d z + h 2 H h 1 τ x z w d z = Q x w h 1 h 2 τ x y v d z + h 2 H h 1 τ x y v d z = M x y φ y h 1 h 2 τ y x u d z + h 2 H h 1 τ y x u d z = M y x φ x h 1 h 2 τ y z w d z + h 2 H h 1 τ y z w d z = Q y w
By combining Equations (2) and (4), the relationship between the average displacement and the actual displacement is obtained, as shown in Equation (5):
w = 3 2 H h 1 h 2 w [ 1 ( 2 z H ) 2 ] + 3 2 H h 2 H h 1 w [ 1 ( 2 z H ) 2 ] φ x = 12 3 H 2 h 1 h 2 u z H d z + 12 3 H 2 h 2 H h 1 u z H d z φ y = 12 H 2 h 1 h 2 v z H d z + 12 H 2 h 2 H h 1 v z H d z
According to the difference in the mechanical properties of different metal layers, the stress–strain relationship is deduced by Hooke’s law, as shown in Equation (6), where σ is the normal stress, and τ is the shear stress.
ε x = 1 E [ σ x μ ( σ y + σ z ) ] ε y = 1 E [ σ y μ ( σ z + σ x ) ] γ y z = 1 G τ y z γ z x = 1 G τ z x γ x y = 1 G τ x y
Combined with Equations (2) and (6), the expression of a simplified average displacement can be obtained:
φ x = [ w x + 12 ( 1 + μ ) 5 E h c Q x ] + [ w x + 12 ( 1 + μ ) 5 E h s Q x ] φ y = [ w y + 12 ( 1 + μ ) 5 E h c Q y ] + [ w y + 12 ( 1 + μ ) 5 E h s Q y ]
Equation (6) is combined with the equilibrium equation Q x x + Q y y = q ( x , y ) :
M x = [ D ( 2 w x 2 + μ 2 w y 2 ) + h c 2 5 Q x x + h c 2 μ q 10 ( 1 μ ) ] + [ D ( 2 w x 2 + μ 2 w y 2 ) + h s 2 5 Q x x + h s 2 μ q 10 ( 1 μ ) ] M y = [ D ( 2 w y 2 + μ 2 w x 2 ) + h c 2 5 Q y y + h c 2 μ q 10 ( 1 μ ) ] + [ D ( 2 w y 2 + μ 2 w x 2 ) + h s 2 5 Q y y + h s 2 μ q 10 ( 1 μ ) ] M x y = [ D ( 1 μ ) 2 w x y + h c 2 10 ( Q x y + Q y x ) ] + [ D ( 1 μ ) 2 w x y + h s 2 10 ( Q x y + Q y x ) ]
From the above equation, it can be seen that the bending moment and torque of the metal plate are determined by the average deflection and load. In addition, it is related to the transverse shearing force of the composite plate.

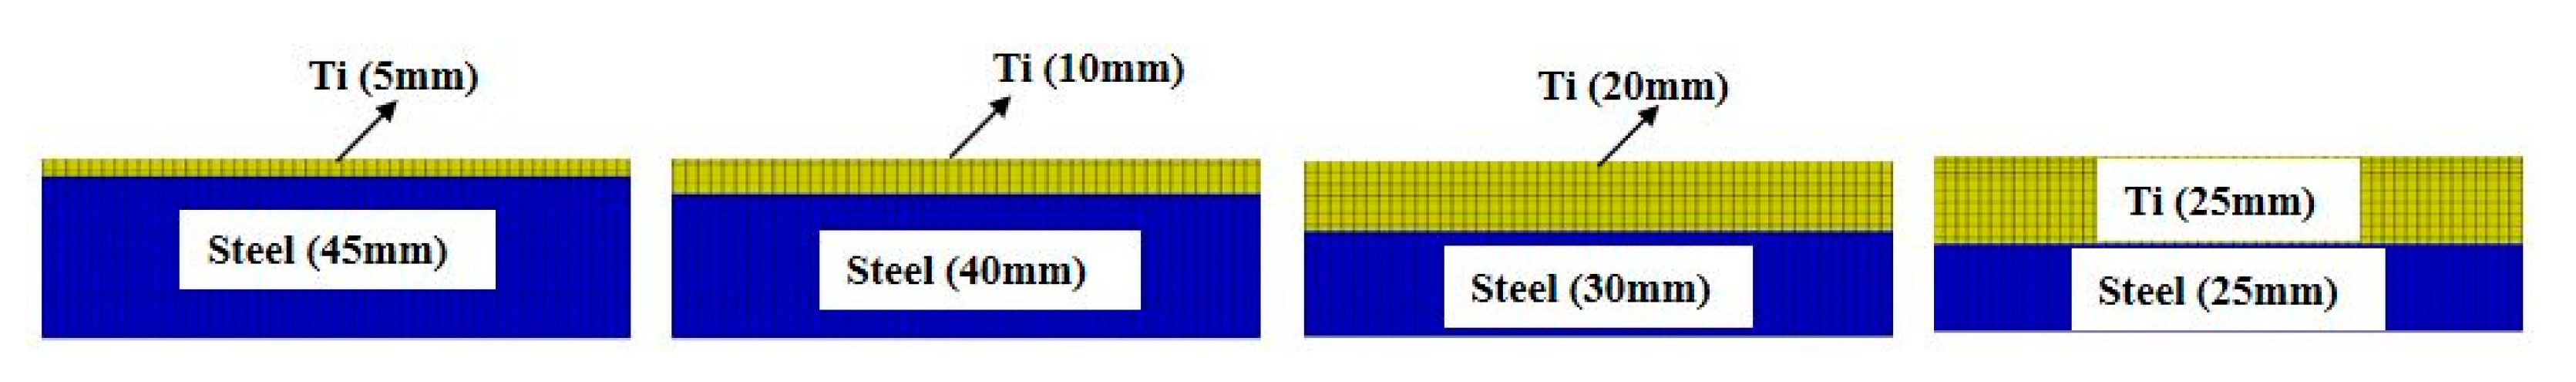
3. Finite Element Simulation

The hot rolling process of clad plates is a high-dimensional nonlinear problem including material nonlinearity, geometric nonlinearity, multiple-object contact nonlinearity and other complex nonlinear problems. Simulations of the hot rolling process were carried out using the commercial FEM code ANSYS/LS-DYNA. Under the condition of ensuring the accuracy of calculation, it was necessary to make some simple assumptions in the current study.
Since the rolls were defined and modeled as discrete rigid and nondeformable bodies, there was no need to define their properties. However, the mechanical properties of each sheet metal layer should be determined because they were deformable. To ensure the authenticity of the simulation, the properties of each layer of materials were tested and the properties of the materials under rolling condition were obtained. At the same time, two layers were bonded before entering the roll gap so that no slip occurred between the layers during the hot rolling process. The isotropic material model was used.
The chemical composition of a commercial-purity titanium (TA2) plate and a Q345 substrate steel plate are shown in Table 1.
The selection of composite plate and roll material types as well as the corresponding mechanical parameters are shown in Table 2.
Accurate material parameters are among the most important factors to determine the reliability of finite element simulation results. Since the model considered in this process was an elastic–plastic model, the yield stress and tangent modulus of the materials could be obtained by mechanical tests; other thermal properties required for the finite element analysis included density, modulus of elasticity and Poisson’s ratio were calculated by JMatPro. The relationship between these thermo-physical parameters and the temperature are shown in Figure 2.
The modeling of the process was performed at 1200 °C without taking into account the increment of the metallic temperature due to the thermal effect of deformation and friction. The reduction ratios were 20%, 25%, 30%, 35%, 40%, 45% and 50%. The total thickness of the bimetallic composite plates used is 50 mm. The initial thicknesses of the upper layers and lower layers were 5 mm and 45 mm, 10 mm and 40 mm, 20 mm and 30 mm, 25 mm and 25 mm, respectively. As a result, the thickness ratios were 0.11, 0.25, 0.67 and 1. The roll speed ratios of the upper rolls and lower rolls were 1, 1.02, 1.04 and 1.06. The meshing has a great effect on the numerical calculation accuracy and time of a finite element model [24]. When the mesh size is too large, the calculation results will be inaccurate, while the calculation will tend to be time-consuming if the mesh size is too small. Considering of both computational efficiency and accuracy, the nodes of the upper plate and the lower plate should be matched when the mesh is divided. In this paper, mesh refinement was applied to the upper layer and lower layer, and the mesh density was reduced in the rolls. This balanced the calculation accuracy and time. The FE meshing of Ti/Steel bimetal clad plates with layers of different thickness are shown in Figure 3, in which the material properties of titanium alloy were obtained from reference [25] The width-to-thickness ratio was smaller than 10, and we could not ignore the spread in width; therefore, a 3-D finite element model was built to simulate the composite behavior during the hot rolling process. The geometry model is shown in Figure 4.
Both rolls and sheets were used with Element type Solid164 (eight-node hexahedral element). The penalty function method was used for the contact calculation in the explicit dynamic analysis, and a “surface-to-surface contact” interaction property was used. According to the existing research, the Coulomb friction coefficient between clad plates and rolls was set to 0.3. In the rolling process, the two rolls were only allowed to rotate with a stable angular velocity and only around their centers, being constrained in the other directions. There was no constraint on the clad sheet while it was rolled between the two rolls. In order to guarantee the work piece fed into the roll gap smoothly, an initial velocity v = 2 m/s was applied to the clad plate, which was slightly less than the rolls’ linear speed. After the clad plate was fed into the roll gap, the rolling process could be successfully accomplished with the help of interfacial friction.

4. Results and Discussion

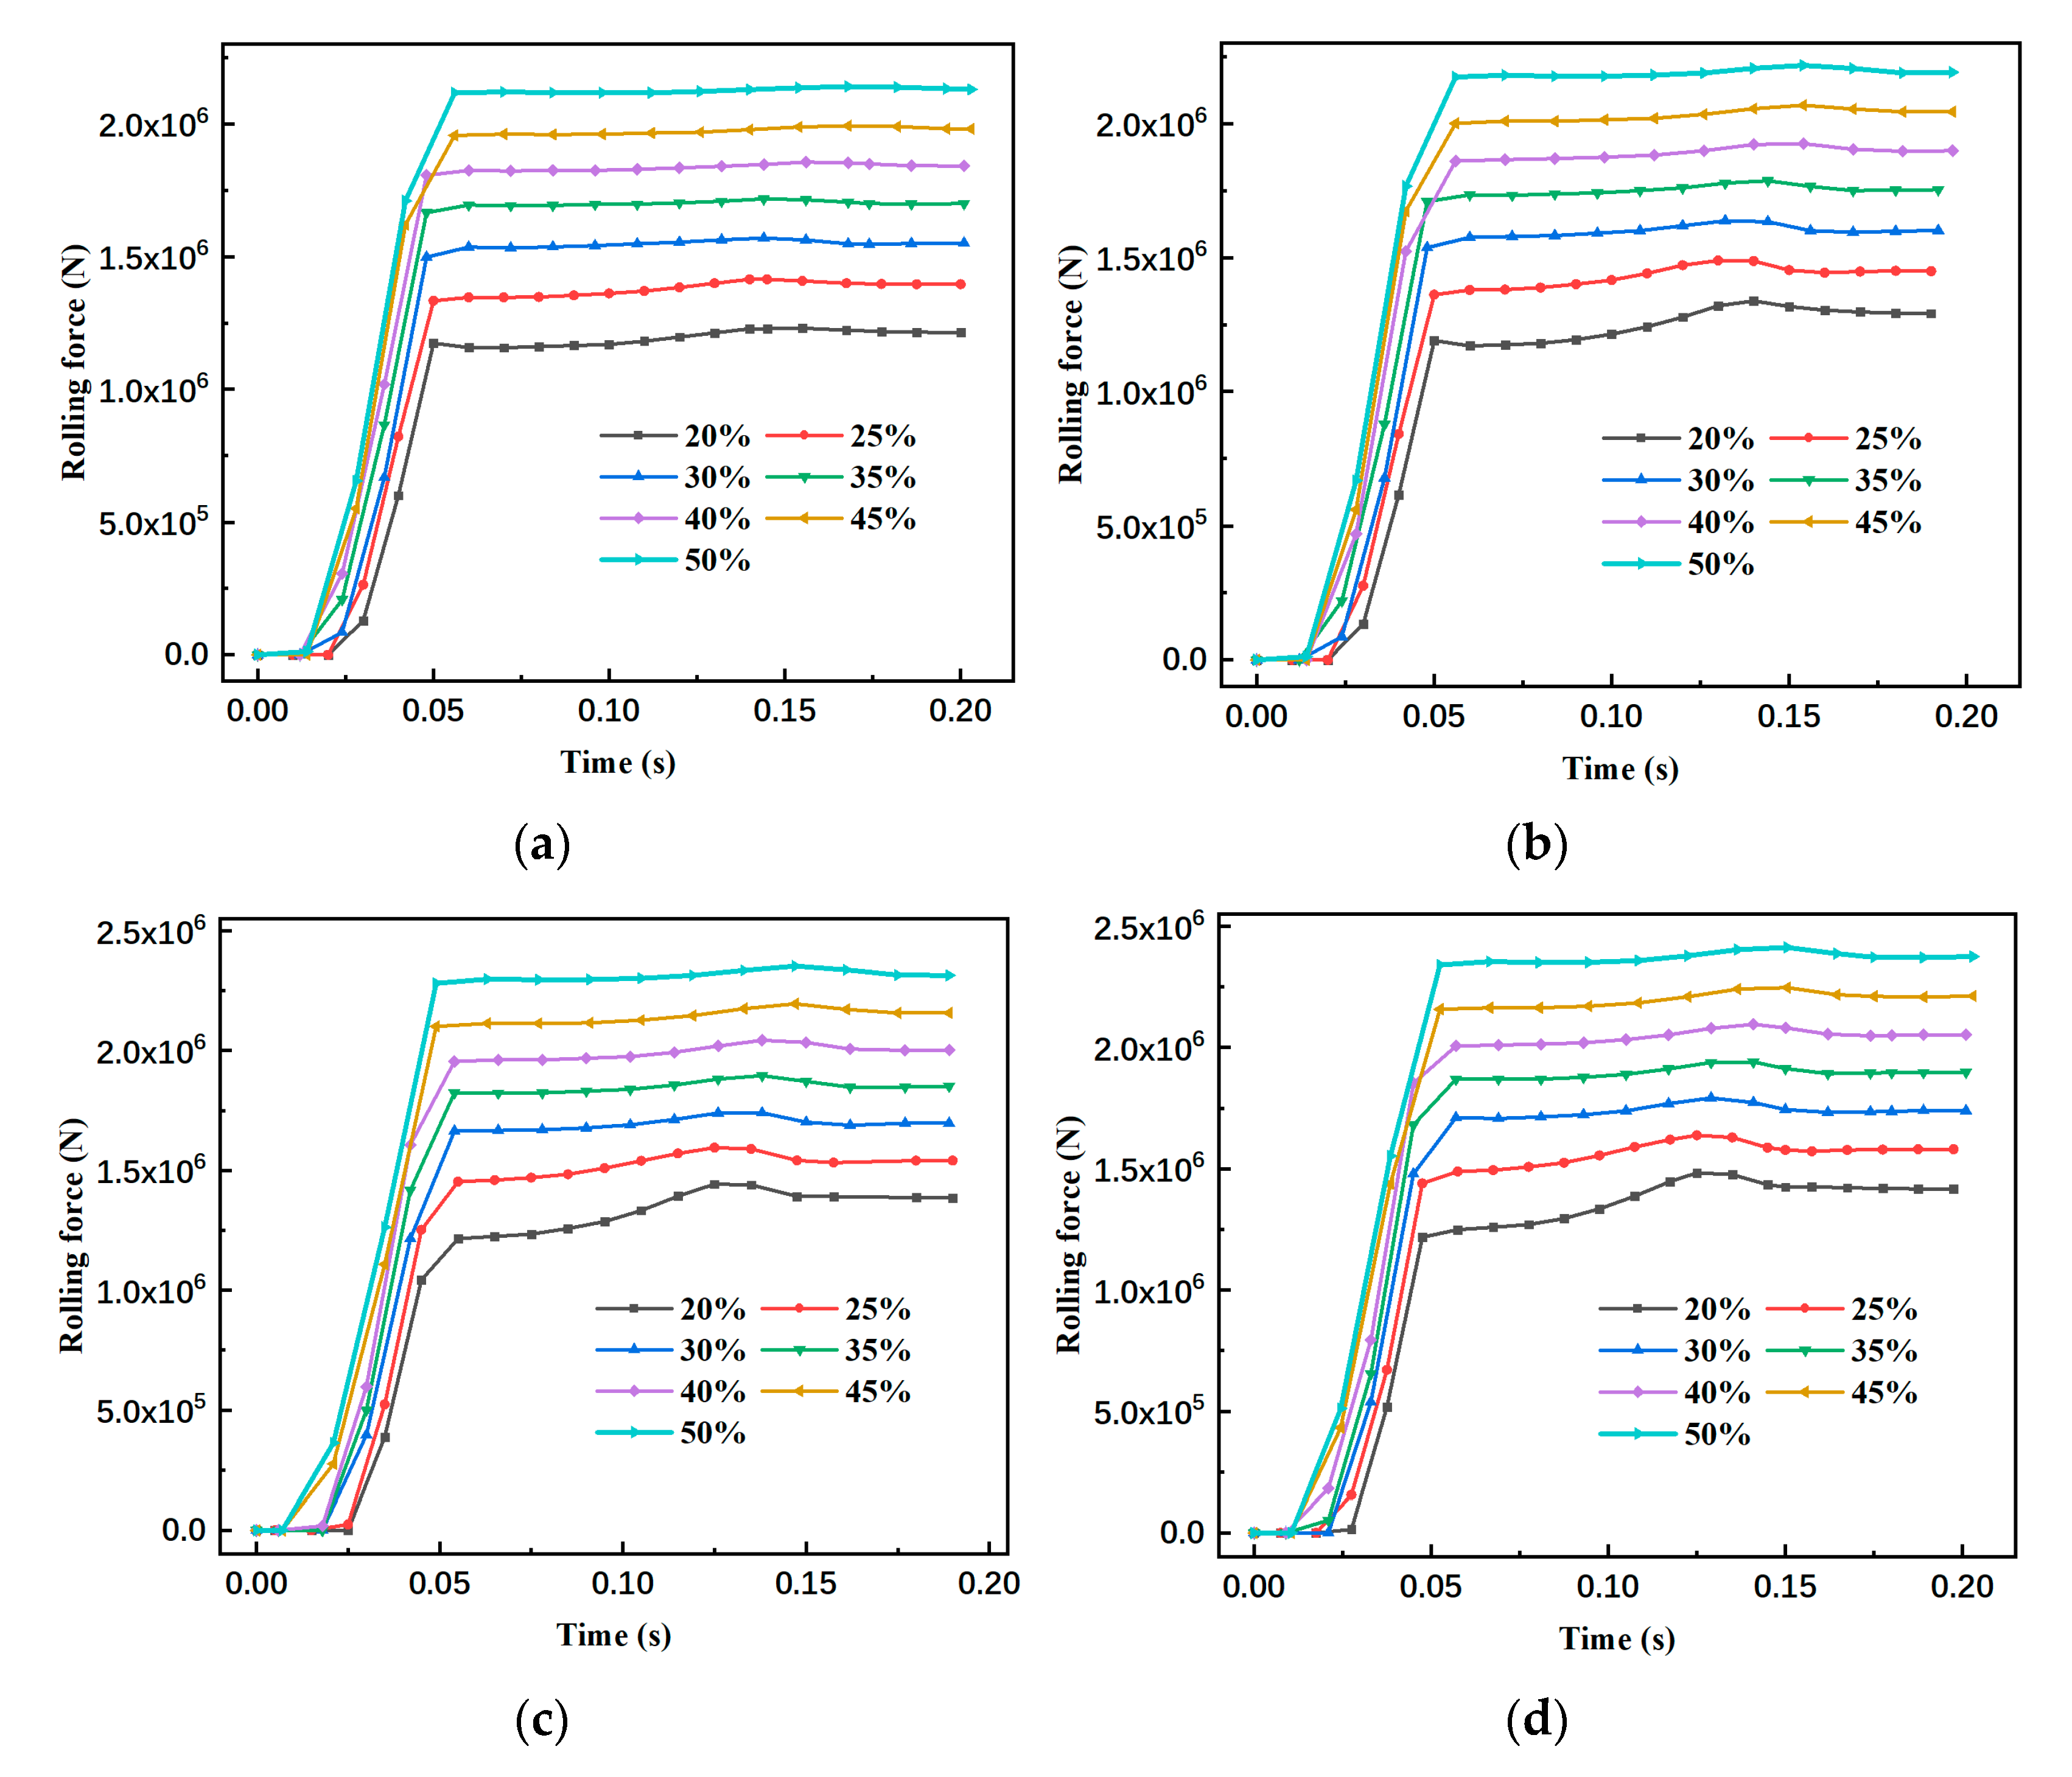
4.1. Effects of Different Parameters on the Hot Roll Bonding of Dissimilar Layers

It is well known that a lower rolling force could save energy in the hot rolling process. Therefore, this section mainly analyzed and studied the relationship between the reduction ratio and the rolling force of the clad plate. The relationship between the variations of the rolling force and the rolling time of the Ti/Steel clad plates at seven different reduction ratios are shown in Figure 5. Due to the large number of data, let us consider the roll speed ratio of 1.02 as an example.
As can be seen in Figure 5, the amount of rolling force increased when increasing the rolling time. Eventually, the value of the rolling force became constant as the steady-state conditions were achieved in the hot rolling process. Four kinds of clad plates with thickness ratios of 0.11, 0.25, 0.67 and 1 all showed the same change. As a result, we could determine the amount of the rolling force required for any reduction ratio. Figure 6 shows the relationship between the variations of the rolling force and the total reduction ratio of the clad plate when the thickness ratios were 0.11, 0.25, 0.67 and 1. It is worth noting that the force required for rolling increased as the reduction ratio increased. In addition to this, it is evident that the rolling force increased by increasing the thickness of Ti. The reason is that applying larger deformations to the clad plate required higher rolling forces. Moreover, the rolling force required was greater because the yield stress of Ti was higher than that of Steel when the thickness of Ti increased.
It is noteworthy that the deformation behavior of the layers during the hot rolling process is a challenge because when rolling multilayer components with a combination of dissimilar metals, different amounts of deformation occur in each layer. Therefore, the production of a system with the desired dimensional accuracy requires a complete knowledge of the deformation behavior of layers and of the parameters affecting it. Let us take the speed ratio of 1.02 as an example.
Figure 7 shows the relationship between the thickness distribution of each layer of the bimetal Ti/Steel clad plate and the reduction ratios. It should be noted that the initial thicknesses of Ti and Steel were different. As can be seen, the thickness of each layer decreased with the increase of the reduction rates when the initial thickness was constant. Furthermore, all the curves in the graphs show a downward trend, which is almost linear. The curve presented in Figure 8 shows the relationship between the deformation percentage of each layer of the clad plate and the total deformation percentage of the clad plate. As we can see in Figure 8, the deformation of each layer increased as the total deformation percentage of the clad plate increased. It is worth noting that the deformation percentage of each layer was different from that of the other layer at a certain total reduction ratio. The thickness reduction of Steel was larger than that of Ti. As a result, there was a non-homogeneity in the deformation of the layers at a certain total deformation percentage because of the difference in their yield stress. The reduction percentage in the thickness of the Steel plate, which possessed a lower yield stress than the Ti plate, was higher than that of the Ti plate.
One of the most important parameters that influence the bonding process between bimetal layers in hot rolling process is the ratio of the layers’ thicknesses. Therefore, in order to investigate the effect of the thickness ratio, the hot rolling process of the Ti/Steel clad plate was simulated. Due to the large number of data, let us take the roll speed ratio of 1.02 as an example. It should be noted that the above studies were carried out at seven different total reduction ratios, i.e., 20%, 25%, 30%, 35%, 40%, 45% and 50%. The simulation results are shown in Figure 9.
Figure 9 shows the relationship between the thickness ratios and the variations of the rolling force. As shown in this figure, the rolling forces required in the hot rolling process increased with the increase in the thickness ratio. At the same time, a higher rolling force was needed with the increase of the reduction ratio for a certain total reduction ratio of the clad plate. The reason is that with the increase in the thickness ratio of the Ti layers to the Steel layers at a given total reduction ratio of the clad plate, the thickness of the hard metallic layer (Ti plate) increased, while the thickness of the soft metallic layer (Steel plate) decreased. In other words, it could be stated that a larger deformation of the hard metallic layer (Ti plate) required a higher rolling force. Thus, increasing the rolling force for the clad plate was needed with the increase in the thickness ratio of the clad plate.
The rolling speed ratio is one of the most important parameters that affect the rolling force in the hot rolling process. Figure 10 shows the relationship between the rolling speed ratios and the variations of the rolling forces. It should be noted that the above studies were carried out at four different total reduction ratios, i.e., 20%, 30%, 40% and 50%. The simulation results are shown in Figure 10.
As can be seen in the figure above, the rolling force required during the hot rolling process did not change much with the increase in the roll speed ratio under the same thickness ratio. As mentioned above, due to the different mechanical properties of dissimilar metal layers in the upper and lower plates, head bending occurs in the hot rolling process of clad plates. When the rolling speed ratio of the upper and lower rolls was different, the symmetry of the upper and lower layers was destroyed, and this could easily cause the head bending of the clad plates. Considering the two aspects, asynchronous rolling with different upper and lower roll speeds should be selected in the hot rolling process of clad plates, which could not only alleviate the head bending defect, but also reduce the rolling force.

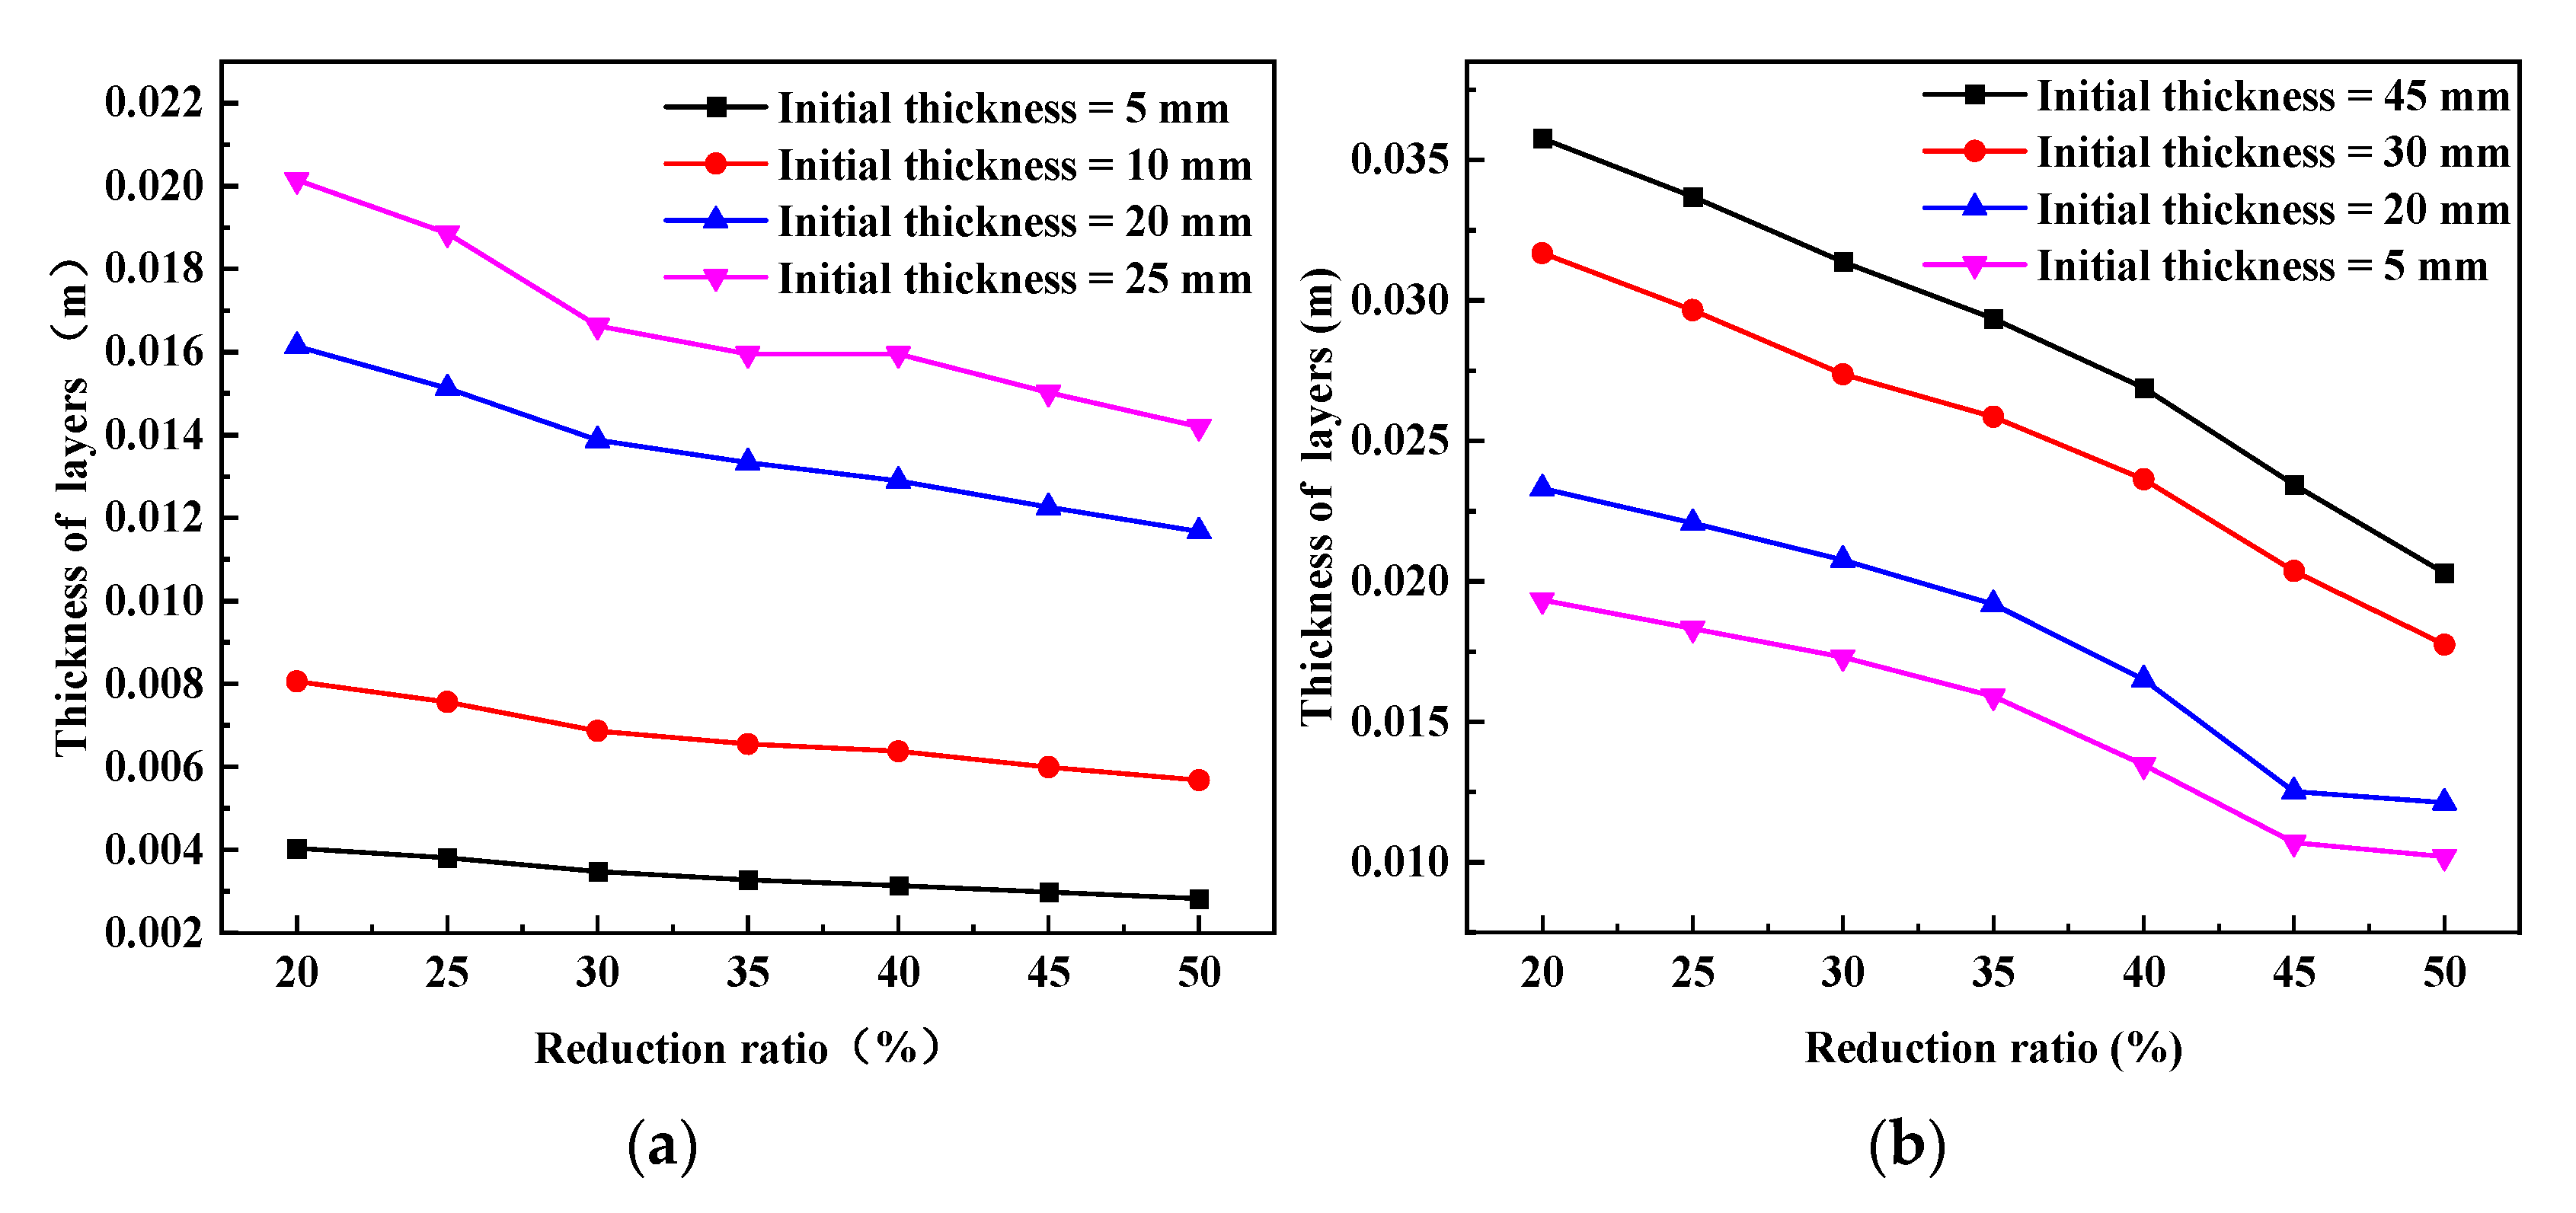
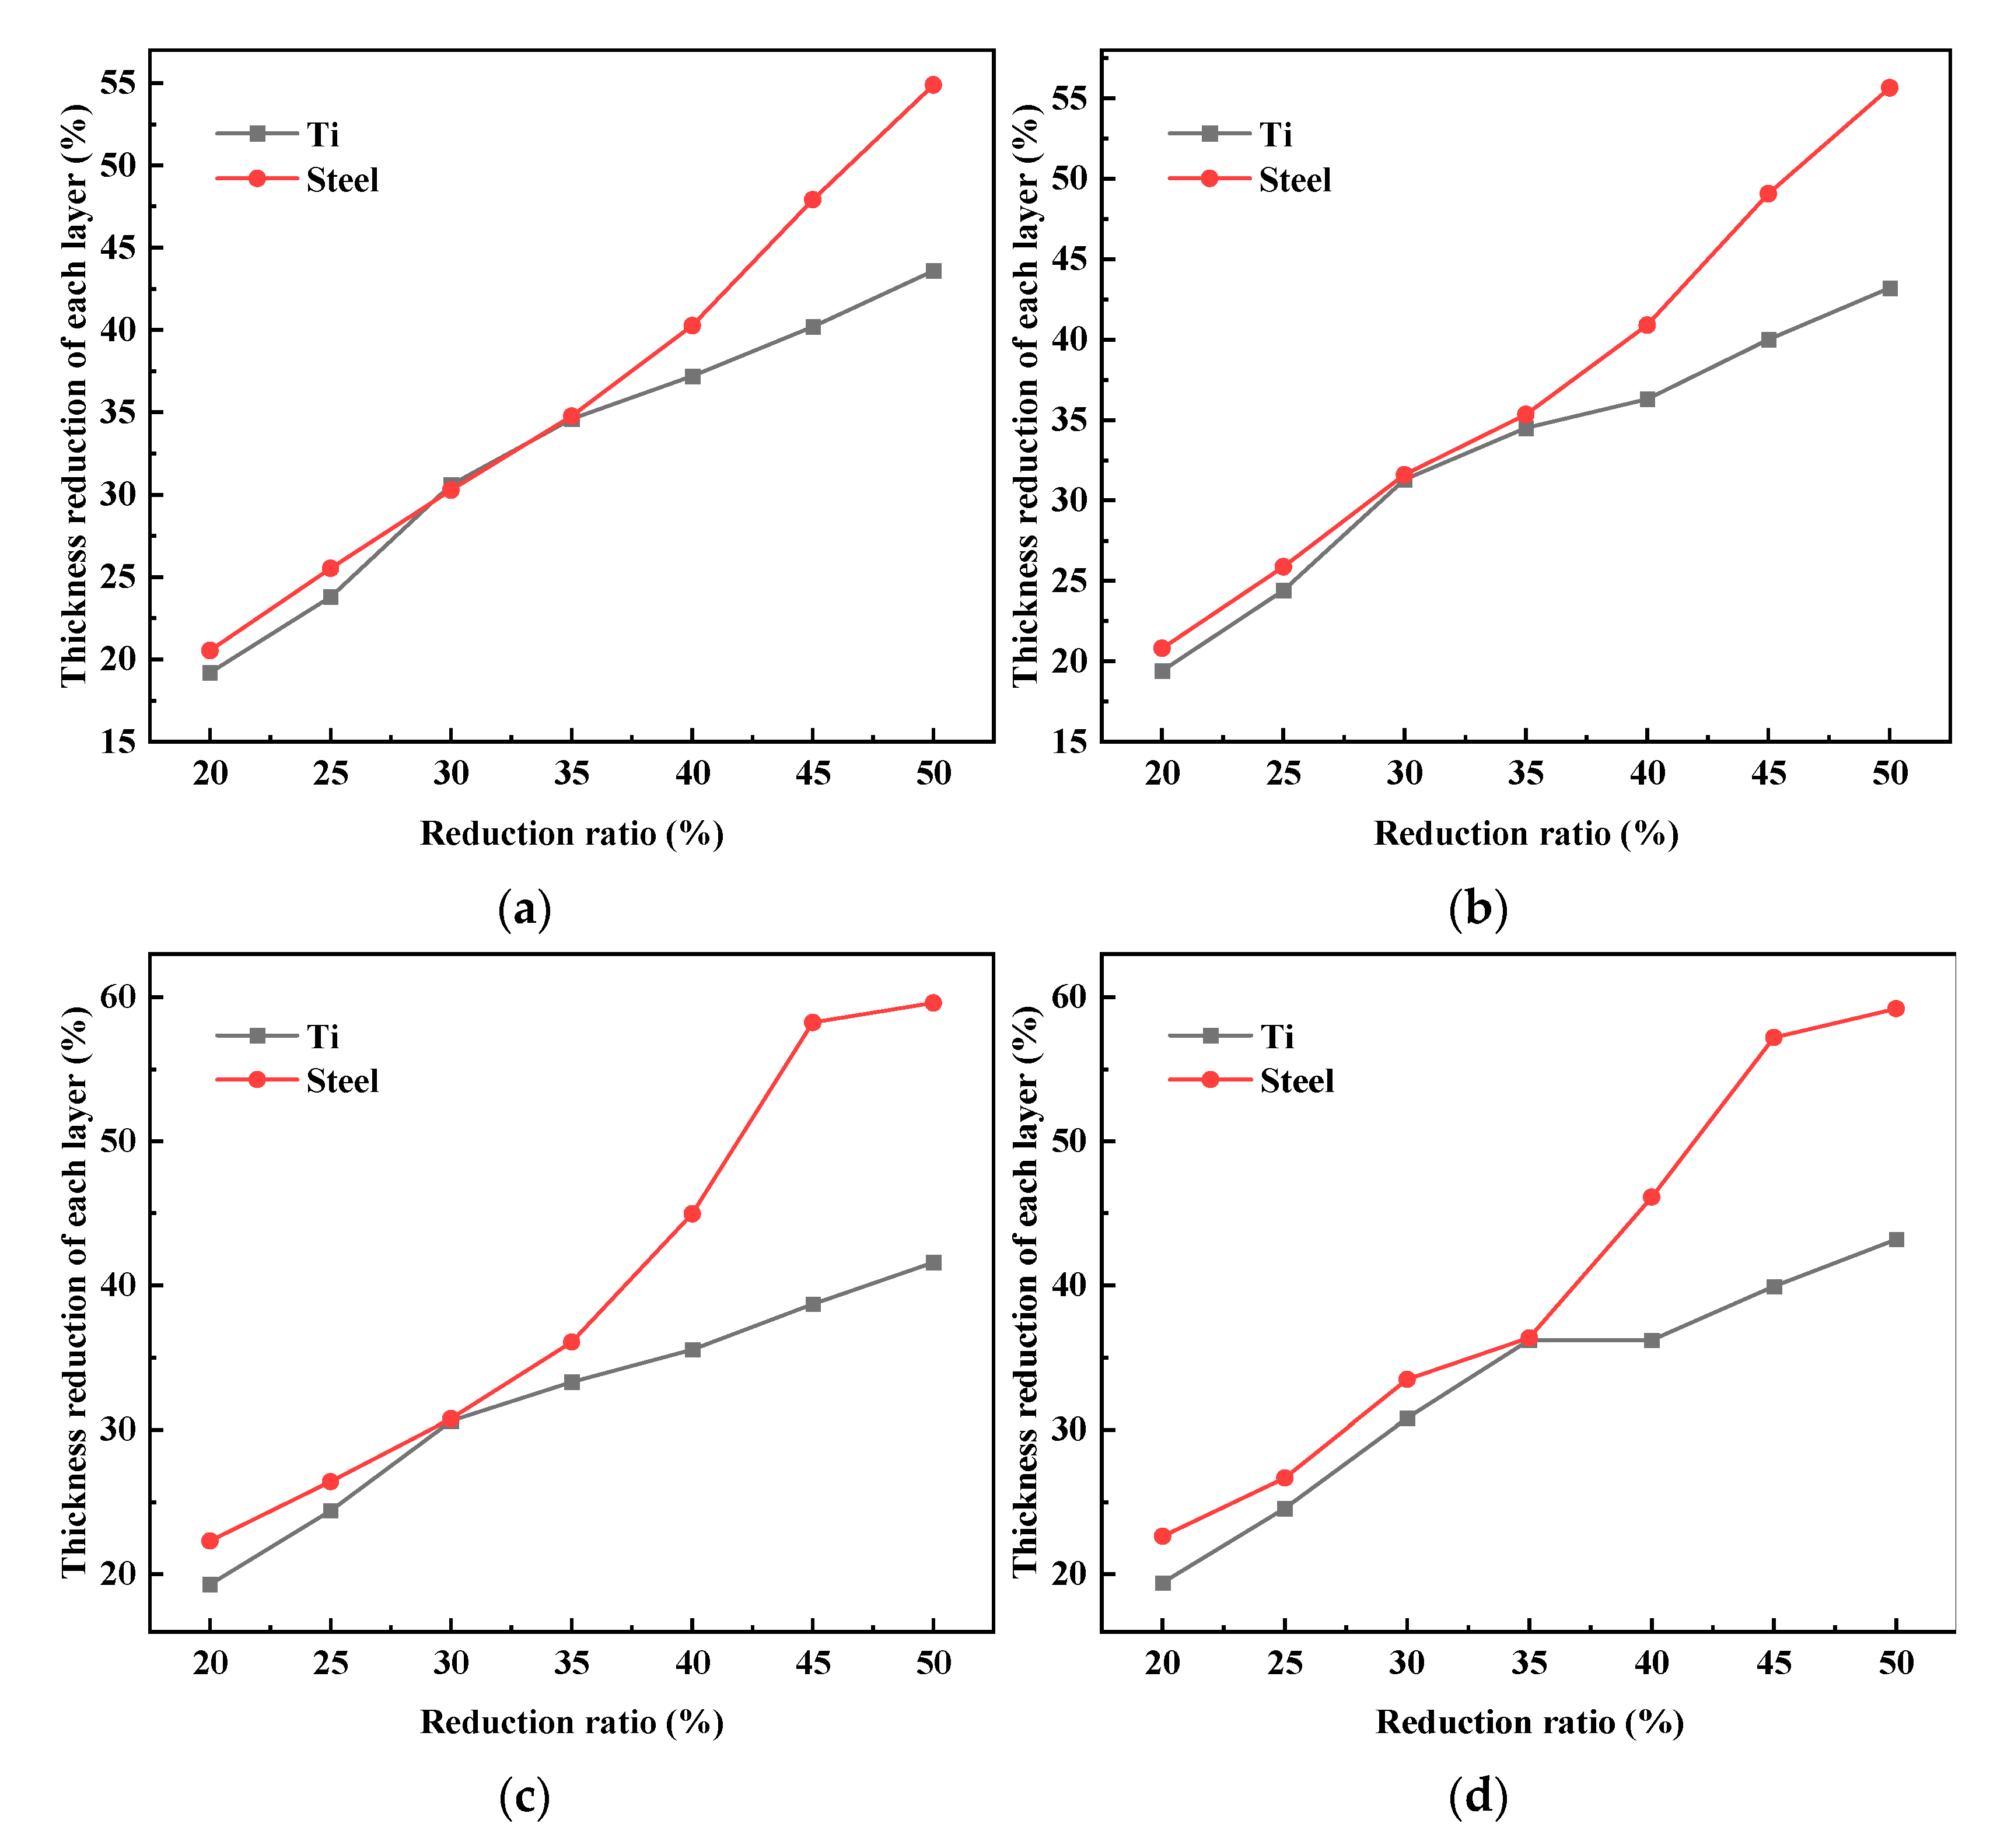
4.2. Evaluation of the Deformation Behavior of Dissimilar Layers during Hot Rolling

Figure 11 shows the deformation behavior of dissimilar layers before the hot rolling process and after the hot rolling process of the Ti/Q345B clad plate. The hot rolling process was carried out with a thickness reduction rate of 20%, as shown in Figure 11c, and with a thickness reduction rate of 25%, as shown in Figure 11d. The deformation behavior of the dissimilar layers in the hot rolling process was different because the layers had different mechanical properties.
As shown in Figure 11a, the clad plate was flat before hot rolling, and the mesh was divided evenly. As seen in Figure 11b, as soon as the clad plate was rolled between the rolls, the Ti sheet and Steel sheet entered the plastic deformation zone, and their thickness decreased. Under these conditions, the thicknesses of the Ti sheet and Steel sheet decreased until the clad plate left the rolls. Figure 11c,d shows the shape of the clad plate with different thickness reduction rates after hot rolling. It can be seen that the thickness reduction rate changed, and the clad plate showed the bending deformation phenomenon.
The warping phenomenon of a clad plate is obvious in the process of hot rolling and causes a common shape defect. In serious cases, the clad plates may even come close to the equipment. In the rolling process of a clad plate, there are many complex factors affecting the warpage of the clad plate. It is reported in the literature that the friction coefficient has little influence on the head upwarping of clad plates, so the friction coefficient was not studied in this paper. By controlling the reduction ratio, rolling speed ratio and thickness ratio in the hot rolling process, the warpage was studied. The bending degree of the clad plate can be obtained by considering the longitudinal bending value of the head of the clad plate (the difference between the nodes on the simulated carrier in the Y direction and the original position). When one parameter was inspected, the other parameters were fixed; corresponding control measures were adopted.
In the formulation of the hot rolling process, thickness reduction is one of the most important parameters of the rolling bonding. As a result, it is important to distribute the thickness reduction ratios. Under different thickness reduction rates, the geometric coefficient of the deformation zone is different, which directly affects the bonding effect and the shape of the clad plate. Now, simulations were carried out for the thickness reduction rates of 20%, 25%, 30%, 35%, 40%, 45% and 50%, respectively. The simulation results of the hot rolling of the Ti/Steel clad plate are shown in Figure 12.
It can be seen in Figure 12 that when the upper and lower roll speed ratio was determined, the clad plates changed from up-warped to down-warped with the increase in the reduction ratios. However, as the reduction ratios increased, the clad plate turned from up-warped to down-warped; the degree of change was large, and the maximum change could reach 0.349 m. Let us take the roll speed ratio of 1.04 and the thickness ratio of 0.67 as an example. When the reduction ratio was 20%, the clad plate was up-warped, and the height of the warpage was about 0.001 m; when the reduction ratio was 25%, the clad plate was slightly down-warped; when the reduction ratio was 35%, the warpage height could reach about 0.025 m. Let us now take the reduction ratio of 40% as an example. When the thickness ratio was 0.11, the down-warped height of the clad plate was about 0.033 m; when the thickness ratio was 0.25, the clad plate was up-warped, and its height was about 0.033 m; when the thickness ratio was 0.67, the degree of upward warping of the clad plate increased, and the height was about 0.108 m. As can be seen in the above Figures, with the increase in the reduction ratio, the down-warping effect of the clad plate was weakened, and the up-warping effect was enhanced. At the same time, the degree of upward warping of the clad plate was greater when the reduction rate was more than 0.4.
When the speed of the upper and lower rollers is different, the friction of the upper and lower rollers is different in a certain area, which leads to a greater torque of the faster roller compared to that of the slower roller. In addition to this, different speeds of the upper and lower rolls would result in uneven metal flowing along the thickness direction of bimetal clad plates. At the same time, the upper and lower rolls roll out different amounts of metal, which results in warping. The influence of the roll speed ratio on the warpage of the clad plate was analyzed without considering other asymmetric factors. The roll speed ratios were 1, 1.02, 1.04 and 1.06, as shown in Figure 13.
When the thickness ratio was constant, the downward warping trend of the head of the clad plate was weakened, and the upward warping trend of the head of the clad plate was strengthened with the increase of the speed ratio. It can be seen in the above Figures that the degree of upward warping of the head of the clad plate was larger when the reduction rate was large. The head shape of the clad plate was flat and slightly upward, and the shape of the clad plate was better when the roll speed ratio was 1.02 and the reduction rate was 0.4. It was proved that when the speeds of the lower roller and the upper roller were different, the clad plate moved towards the slower speed roll. With a greater difference in velocity between the upper and the lower rollers, the influence of the reduction ratio on the head bending was greater than the influence of the rollers speed ratio. At the same time, the clad plate head’s down-warping increased within a certain range. Therefore, different upper and lower rollers’ speed ratios could be formulated according to the different thicknesses of the upper and lower plates and the reduction rates to reduce the bending problem of the head.
The thickness ratio also has a great influence on the shape of clad plates. When different metals are combined into multilayer parts in hot rolling, the deformation behaviors of each metal layer are different. Let us take the speed ratio of 1.02 as an example, as shown in Figure 14.
As can be seen in the above Figures, in the case of a small reduction rate (0.2, 0.25, 0.3, 0.35), as the thickness ratio of the upper and lower plates increased gradually, the bending degree of the clad plate was small. Therefore, it is fair to say that the different thicknesses of the upper and lower plates had little influence on the bending of the clad plates at low reduction rates. When the reduction ratios were 0.4 and 0.45, the bending degree of the clad plate increased with the thickness ratio of the upper and lower plates increasing gradually. When the reduction rate was large (0.5), the head of the clad plates were upwarped, and the bending height is less affected by the thickness ratio. It is worth noting that when the thickness ratio of the upper and lower plates was 0.67 and 1.0, the bending degree of the head of the clad plate was similar.

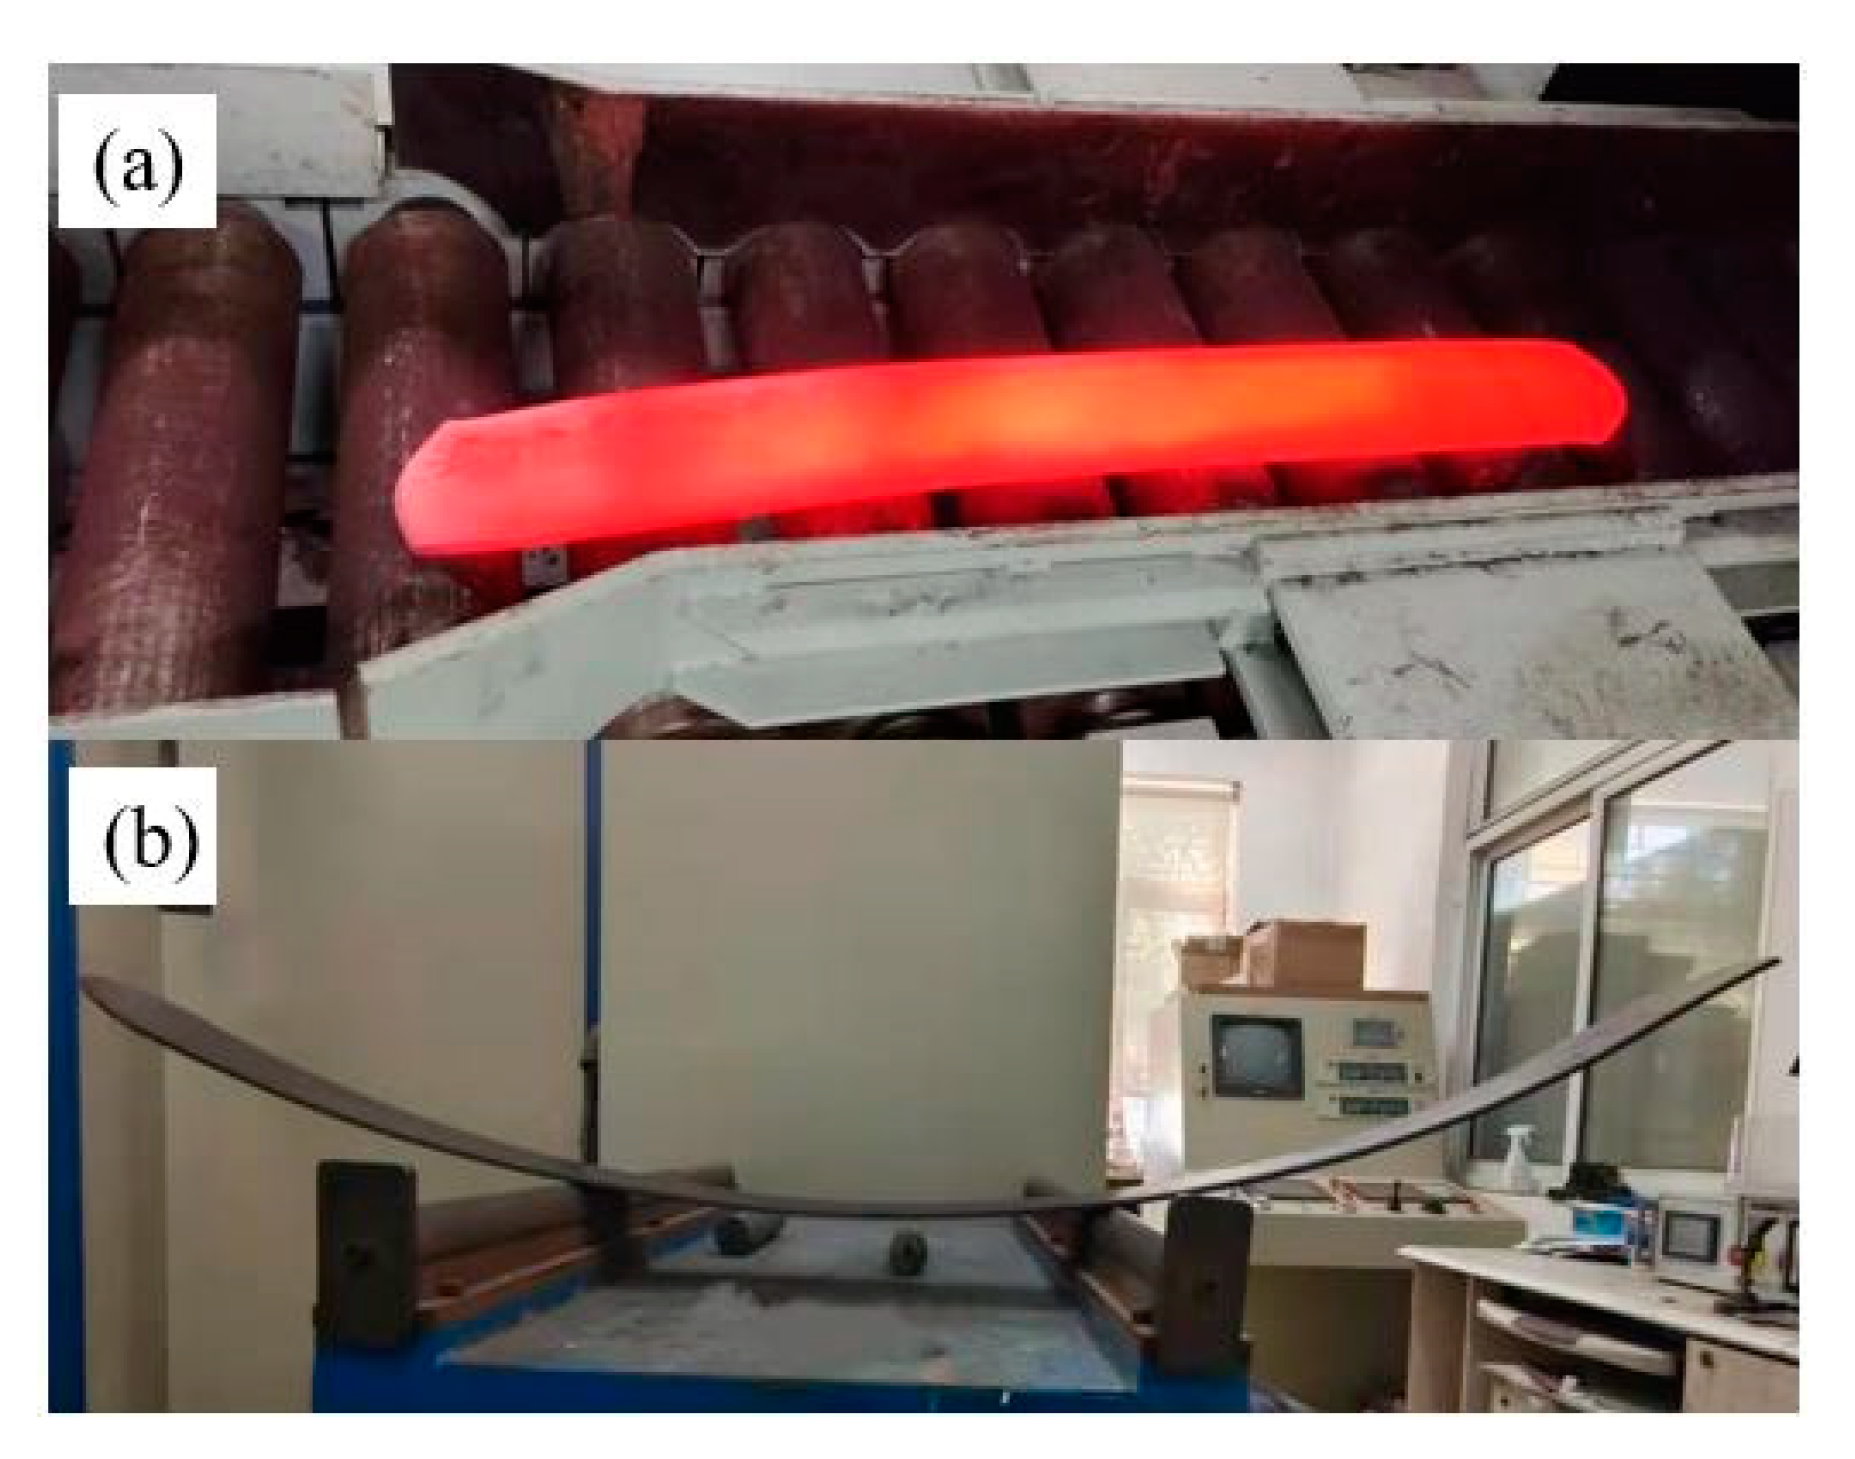
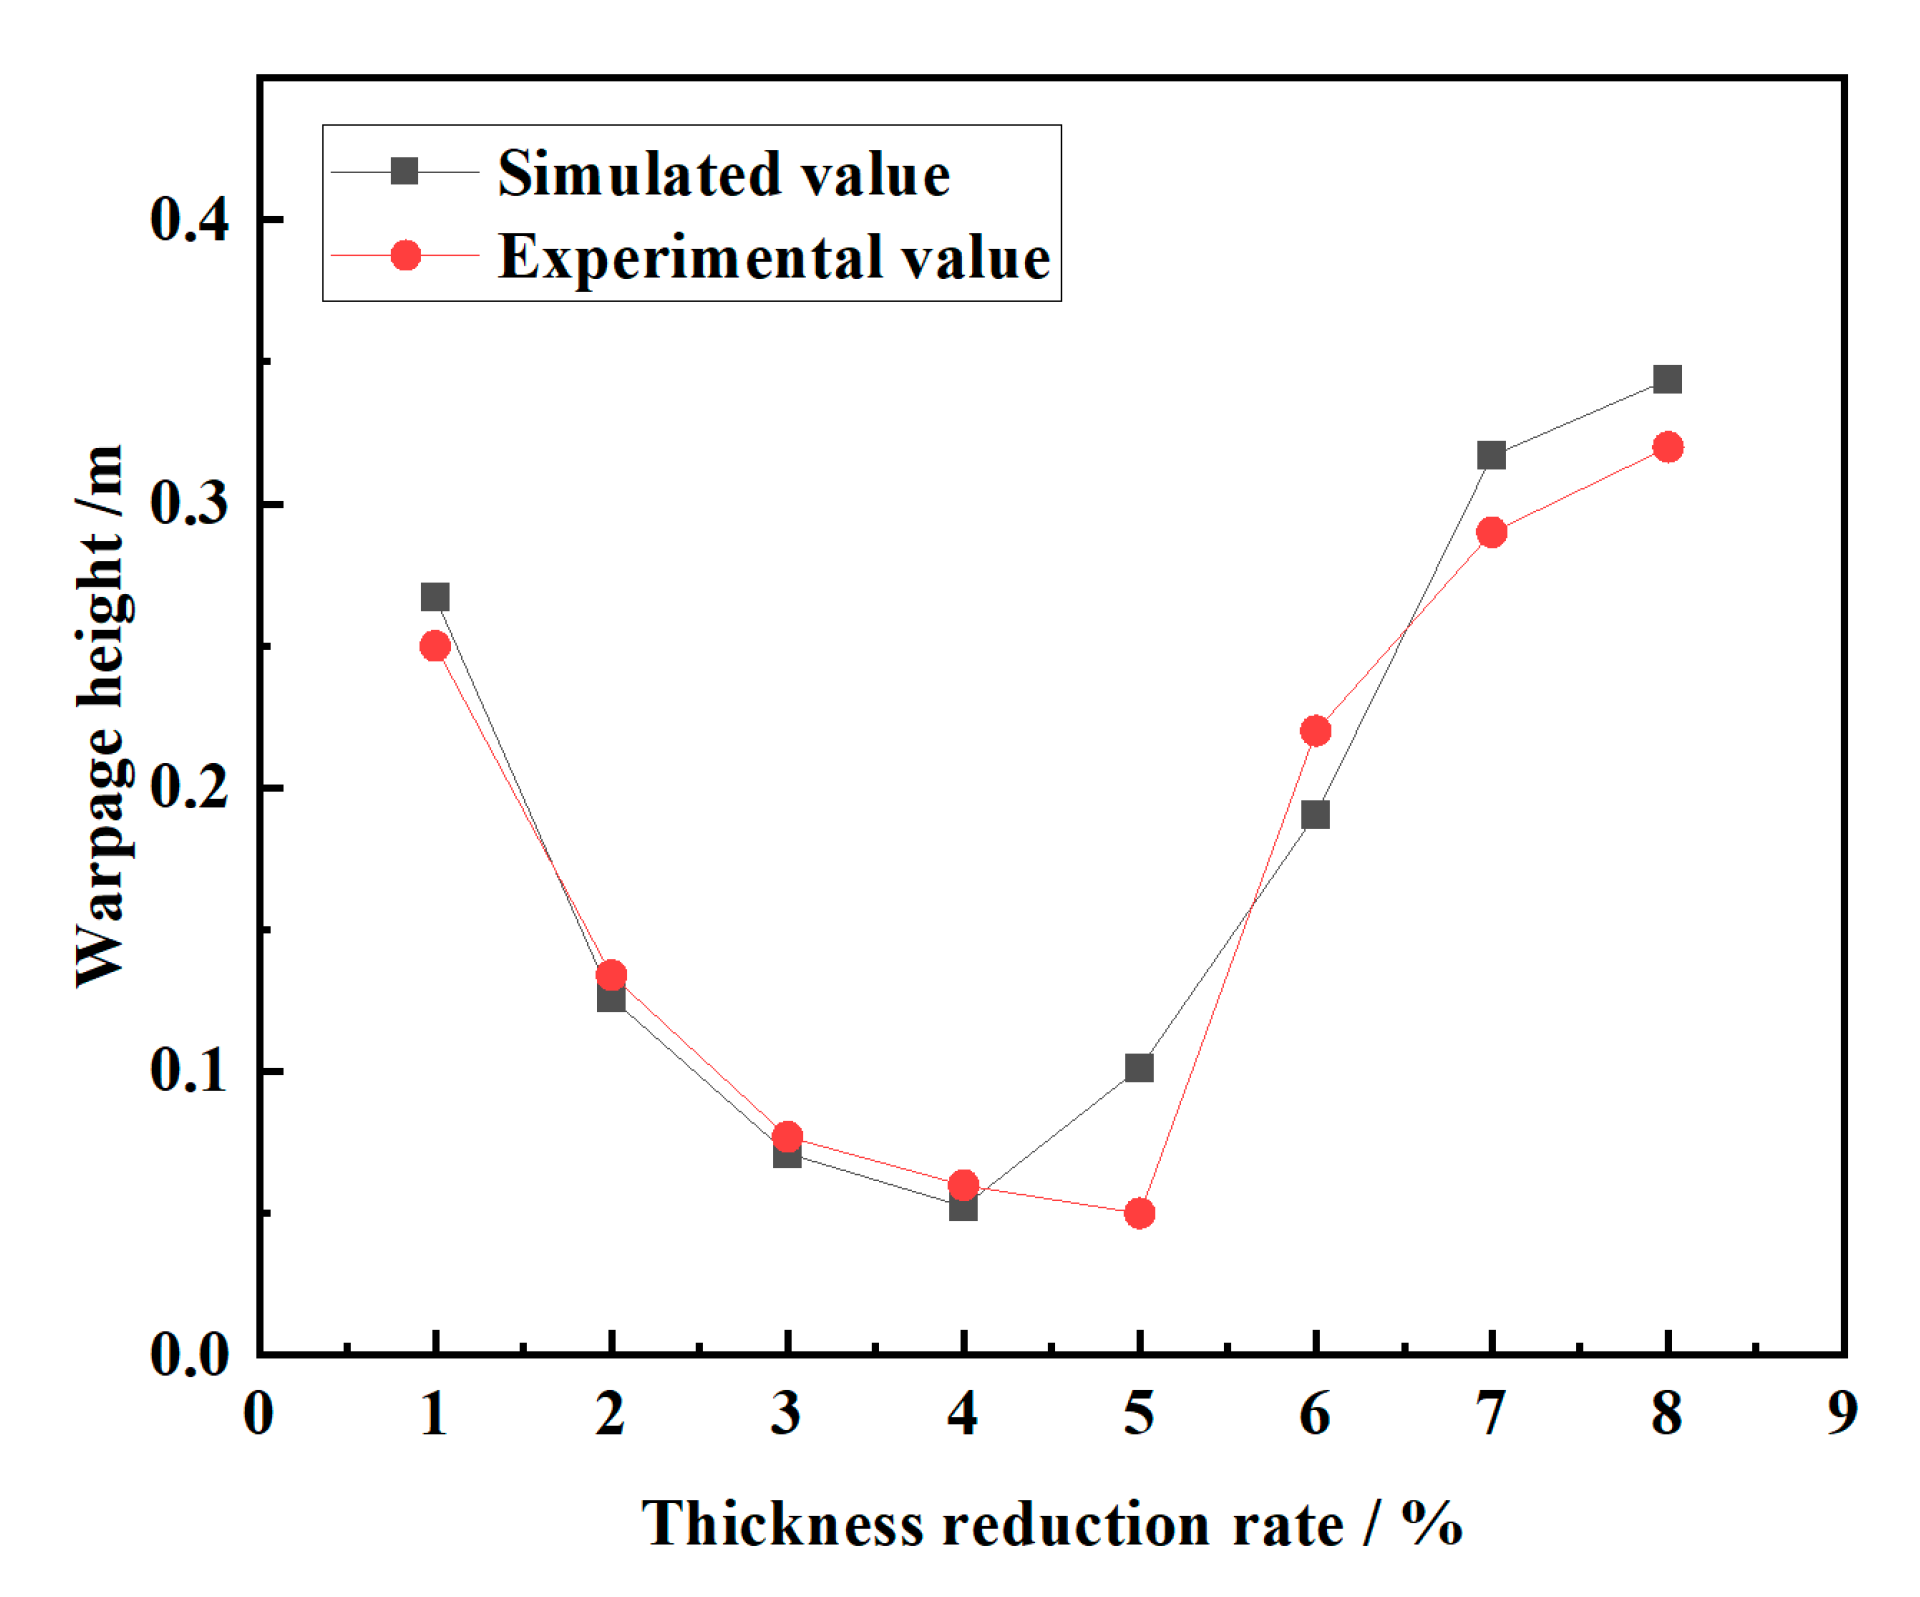
4.3. Experimental Verification and Analysis

In order to verify the validity of the finite element simulation results, a hot rolling experiment of the Ti/Steel composite plate was carried out. Table 3 shows the main equipment parameters of a 450 mm hot mill.
A titanium plate with the size of 10 mm × 200 mm × 800 mm and a Q345B steel plate with the size of 30 mm × 200 mm × 800 mm were compounded and then heated and rolled. After eight rolling passes, the plate was rolled with a final thickness of 8 mm. Figure 15 shows the experimental hot rolling diagram of the clad plate. It can be seen in the diagram that the head of the clad plate after hot rolling showed an obvious warpage phenomenon.
After the completion of the rolling experiment, we measured the thickness of each layer, the force and energy parameters and the warpage height of the head of the rolled plate. The warpage value of the clad plate head measured in the experiment was compared with the simulated value, as shown in Figure 16.

5. Conclusions

In the present study, an analytical computational mechanical model of a metal plate was established by the classical elastic mechanics method, and the relationship between uneven thickness extension and shape bending was obtained. The hot rolling process of dissimilar bimetal plates of Ti/Steel was simulated and investigated using the commercial finite element simulation software ANSYS/LS-DYNA. The results can be presented as follows:
  • The bending moment and torque of the metal plate were determined by the average deflection and load. In addition, they were related to the transverse shearing force of the composite plate.
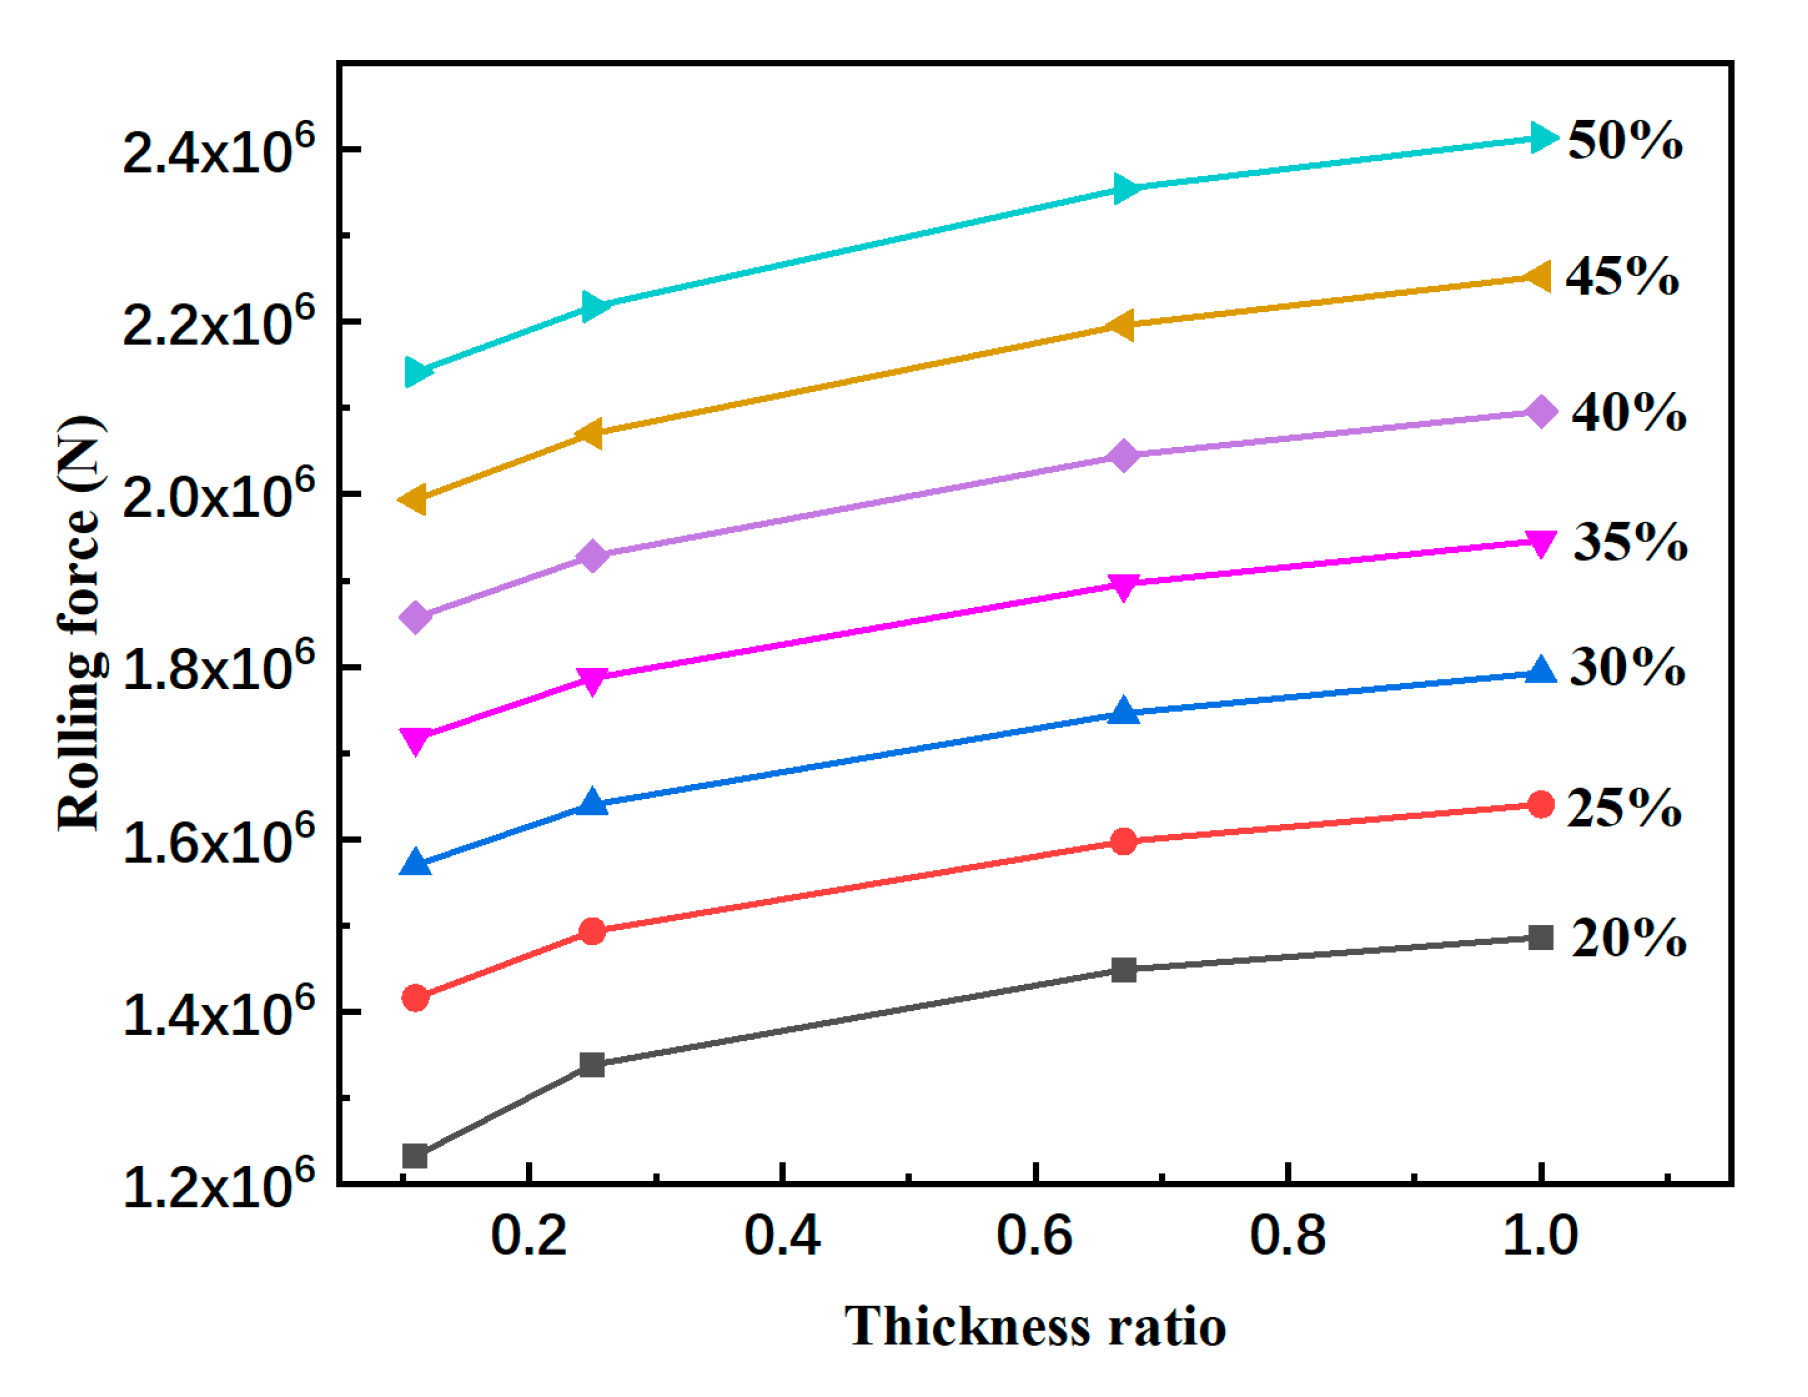
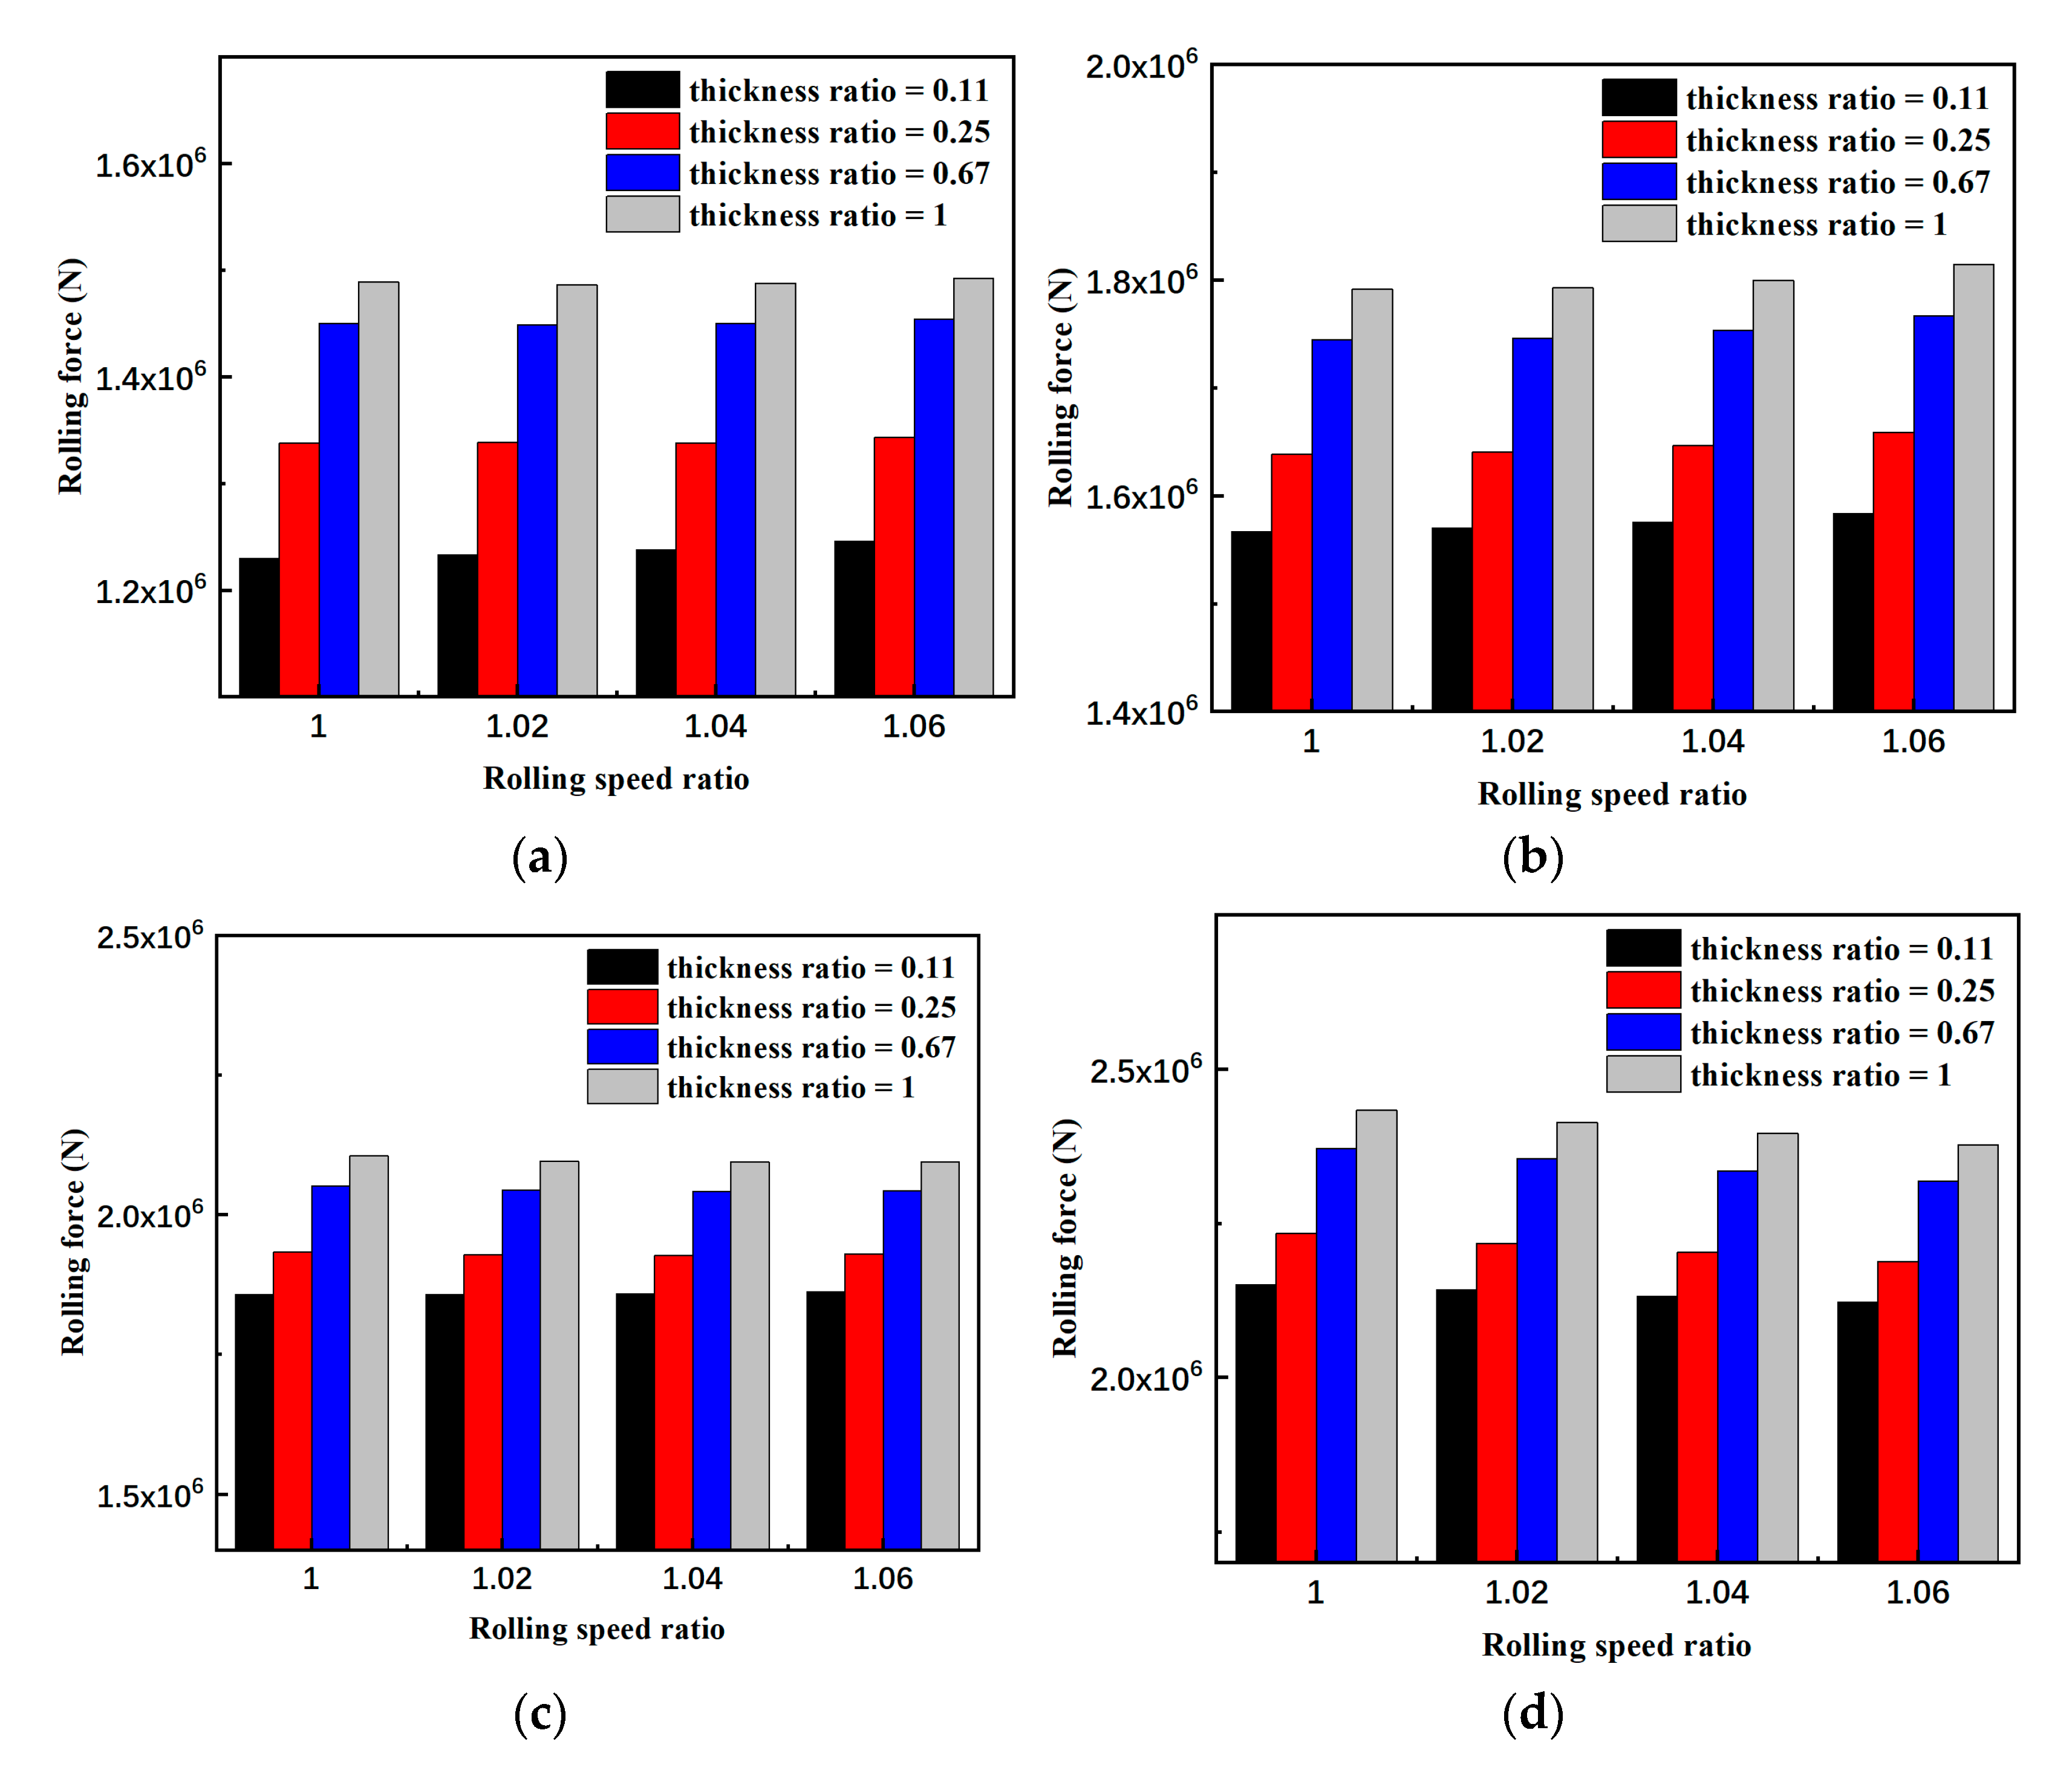
  • The amount of rolling force increased until the value of the rolling force reached the steady-state conditions. The rolling forces required in the hot rolling process increased with the increase of the reduction ratios and the thickness ratios.
  • With the increase in the total reduction ratios of the clad plates, the reduction ratios of each layers increased. Furthermore, it was found that the thickness reduction ratios of Steel were larger than those of Ti at a certain total reduction ratio, which could reach up to 59.6%.
  • When the reduction ratios were 0.4 and 0.45, the bending degree of the clad plate increased with the thickness ratio of the upper and lower plates increasing gradually. The maximum warpage could reach 0.349 m. The shape of the clad plate was better when the roll speed ratio was 1.02 and the reduction rate was 0.4.
  • Different upper and lower rollers’ rolling speed ratios could be formulated according to the different thicknesses of the upper and lower plates and the reduction rates to reduce the bending problem of the head.

Author Contributions

Conceptualization, L.S. and J.D.; methodology, L.S. and J.Z.; validation, G.W. and H.L.; formal analysis, J.D.; investigation, J.D.; resources, L.S. and J.D.; writing—original draft preparation, L.S.; writing—review and editing, L.S., J.D. and J.Z.; visualization, H.L.; supervision, G.W.; project administration, L.S., J.D. and H.L.; funding acquisition, J.D. All authors have read and agreed to the published version of the manuscript.

Funding

The authors wish to acknowledge the financial support received from the State Key Laboratory of Rolling and Automation, Northeastern University, China, under the National Key R&D Program of China (Grant No. 2022YFB3304800), the National Natural Science Foundation of China (Grant No. U21A20475) and the central government guides local funds for science and technology development (Grant No. 2022JH6/100100019).

Data Availability Statement

The data presented in this study are available on request from the corresponding author.

Conflicts of Interest

The authors declare no conflict of interest.

References

  1. Qwamizadeh, M.; Kadkhodaei, M.; Salimi, M. Slab Analysis of Asymmetrical Rolling of Bonded Two-layer Sheets. ISIJ Int. 2013, 53, 265–273. [Google Scholar] [CrossRef] [Green Version]
  2. Parvizi, A.; Afrouz, F. Slab analysis of asymmetrical clad sheet bonded before rolling process. Int. J. Adv. Manuf. Tech. 2016, 87, 137–150. [Google Scholar] [CrossRef]
  3. Yahiro, A.; Masui, T.; Yoshida, T. Development of Nonferrous Clad Plate and Sheet by Warm Rolling with Different Temperature of Materials. Trans. Iron Steel Inst. Jpn. 1991, 31, 647–654. [Google Scholar] [CrossRef]
  4. Su, H.; Luo, X.; Chai, F. Manufacturing technology and application trends of titanium clad steel plates. J. Iron Steel Res. Int. 2015, 22, 977–982. [Google Scholar] [CrossRef]
  5. Orhan, N.; Khan, T.; Eroglu, M. Diffusion bonding of a microduplex stainless steel to Ti-6Al-4V. Scr. Mater. 2001, 45, 441–446. [Google Scholar] [CrossRef]
  6. Zhao, D.; Yan, J.; Wang, Y. Relative slipping of interface of titanium alloy to stainless steel during vacuum hot roll bonding. Mater. Sci. Eng. A 2009, 499, 282–286. [Google Scholar] [CrossRef]
  7. Deng, W.; Zhao, D.W.; Qin, X.M. Simulation of central crack closing behavior during ultra-heavy plate rolling. Comp. Mater. Sci. 2009, 47, 439–447. [Google Scholar] [CrossRef]
  8. Hwang, Y.; Chen, T.H.; Hsu, H.H. Analysis of asymmetrical clad sheet rolling by stream function method. Int. J. Mech. Sci. 1996, 38, 443–460. [Google Scholar] [CrossRef]
  9. Jiang, Y.; Peng, D.; Lu, D. Analysis of clad sheet bonding by cold rolling. J. Mater Proc. Tech. 2000, 105, 32–37. [Google Scholar]
  10. Tzou, G.; Huang, M. Analytical modified model of the cold bond rolling of unbounded double-layers sheet considering hybrid friction. J. Mater. Proc. Tech. 2003, 140, 622–627. [Google Scholar] [CrossRef]
  11. Mendes, A.; Timokhina, I.; Molotnikov, A. Role of Shear in Interface Formation of Aluminium-Steel Multilayered Composite Sheets. Mater. Sci. Eng. A 2017, 705, 142–152. [Google Scholar] [CrossRef]
  12. Khaledi, K.; Rezaei, S.; Wulfinghoff, S. Modeling of joining by plastic deformation using a bonding interface finite element. Int. J. Solid Struct. 2019, 160, 68–79. [Google Scholar] [CrossRef]
  13. Pesin, A.; Pustovoytov, D. Interface shear strain of 1050/6061 laminated composite processed by asymmetric accumulative roll bonding. In Proceedings of the 22nd International Esaform Conference on Material Forming: Esaform, Vitoria, Spain, 8–10 May 2019; Volume 2113, p. 040013. [Google Scholar]
  14. Su, L.H.; Lu, C.; Tieu, A.K.; Deng, G.; Sun, X.D. Ultrafine grained AA1050/AA6061 composite produced by accumulative roll bonding. Mater. Sci. Eng. A 2013, 559, 345–351. [Google Scholar] [CrossRef]
  15. Su, L.H.; Lu, C.; Deng, G.; Tieu, A.K.; Sun, X.D. Microstructure and mechanical properties of 1050/6061 laminated composite processed by accumulative roll bonding. Rev. Adv. Mater. Sci. 2013, 33, 33–37. [Google Scholar]
  16. Su, L.H.; Lu, C.; Deng, G.; Tieu, A.K. Microstructure and mechanical properties of AA5005/AA6061 laminated composite processed by accumulative roll bonding. Mater. Sci. Eng. B 2013, 45, 515–522. [Google Scholar] [CrossRef]
  17. Nie, N.; Su, L.; Deng, G.; Li, H.; Yu, H.; Tieu, A.K. A review on plastic deformation induced surface/interface roughening of sheet metallic materials. J. Mater. Res. Tech. 2021, 15, 6574–6607. [Google Scholar] [CrossRef]
  18. Yu, H.L.; Tieu, A.; Lu, C.; Deng, G.; Liu, X. Occurrence of surface defects on strips during hot rolling process by FEM. Int. J. Adv. Manuf. Tech. 2013, 67, 1161–1170. [Google Scholar] [CrossRef] [Green Version]
  19. Eroglu, M.; Khan, T.; Orhan, N. Diffusion bonding between Ti-6Al-4V alloy and microduplex stainless steel with copper interlayer. Mater. Sci. Tech. 2002, 18, 68–72. [Google Scholar] [CrossRef]
  20. Kundu, S.; Chatterjee, S. Effects of temperature on interface microstructure and strength properties of titanium-niobium stainless steel diffusion bonded. Mater. Sci. Technol. 2013, 27, 1177–1182. [Google Scholar] [CrossRef]
  21. Yu, C.; Xiao, H.; Yu, H. Mechanical properties and interfacial structure of hot-roll bonding TA2-Q235B plate using DT4 interlayer. Mater. Sci. Eng. A 2017, 695, 120–125. [Google Scholar] [CrossRef]
  22. Wang, C.H.; Zhang, Q.D.; Li, H.; Zhang, L.Y.; Zhang, B.Y. Warpage deformation behavior of metal laminates. Chin. J. Eng. 2021, 43, 409–421. [Google Scholar]
  23. Qwamizadeh, M.; Kadkhodaei, M.; Salimi, M. Asymmetrical rolling analysis of bonded two-layer sheets and evaluation of outgoing curvature. Int. J. Adv. Manuf. Technol. 2014, 73, 521–533. [Google Scholar] [CrossRef]
  24. Burkhart, T.A.; Andrews, D.M. Finite element modeling mesh quality, energy balance and validation methods: A review with recommendations associated with the modeling of bone tissue. J. Biomech. 2013, 46, 1477–1488. [Google Scholar] [CrossRef] [PubMed]
  25. Wang, G.L.; Luo, Z.A.; Xie, G.M.; Wang, L.P.; Zhao, K. Effect of heating temperature on the bonding property of the Titanium/stainless steel plate by hot-rolling bonding. Rare Metal Mat. Eng. 2013, 42, 387–391. [Google Scholar]
Figure 1. Structural model of the metal clad plate.
Metals 13 00218 g001
Figure 2. Parameters of the materials Ti and Steel. (a) Density, (b) modulus of elasticity, (c) Poisson’s ratio.
Metals 13 00218 g002
Figure 3. FE meshing of Ti/Steel bimetal clad plates with layers of different thickness.
Metals 13 00218 g003
Figure 4. Geometry model of a Ti/Steel bimetal clad plate.
Metals 13 00218 g004
Figure 5. Variations of rolling force vs. rolling time obtained at different reduction ratios of the clad plate. (a) Thickness ratio = 0.11, (b) thickness ratio = 0.25, (c) thickness ratio = 0.67, (d) thickness ratio = 1.0.
Metals 13 00218 g005
Figure 6. Changes in rolling force vs. reduction ratio of the clad plate.
Metals 13 00218 g006
Figure 7. Thickness distribution of each layer at different initial thicknesses. (a) Ti, (b) Steel.
Metals 13 00218 g007
Figure 8. Difference between the thickness reductions of Ti and Steel. (a) Thickness ratio = 0.11, (b) thickness ratio = 0.25, (c) thickness ratio = 0.67, (d) thickness ratio = 1.0.
Metals 13 00218 g008
Figure 9. Changes in rolling force vs. thickness ratio of the clad plate.
Metals 13 00218 g009
Figure 10. Changes in rolling force vs. rolling speed ratio of the clad plate. (a) Reduction ratio = 20%, (b) reductio ratio = 30%, (c) reductio ratio = 40%, (d) reductio ratio = 50%.
Metals 13 00218 g010
Figure 11. Shape of the clad plate (a) before hot rolling, (b) during hot rolling, (c) during hot rolling with thickness reduction rate of 20%, (d) during hot rolling with thickness reduction rate of 25%.
Metals 13 00218 g011
Figure 12. Simulation results of warpage height with different reduction ratios and thickness ratios. (a) Vupper roll/Vlower roll = 1.06, (b) Vupper roll/Vlower roll = 1.04, (c) Vupper roll/Vlower roll = 1.02, (d) Vupper roll/Vlower roll = 1.0.
Metals 13 00218 g012
Figure 13. Simulation results of the warpage height for different roll speed ratios and different reduction ratios. (a) Thickness ratio = 0.11, (b) thickness ratio = 0.25, (c) thickness ratio = 0.67, (d) thickness ratio = 1.0.
Metals 13 00218 g013
Figure 14. Simulation results showing the warpage height with different thickness ratios and different roll speed ratios. (a) Reduction ratio = 0.2, (b) reduction ratio = 0.25, (c) reduction ratio = 0.3, (d) reduction ratio = 0.35, (e) reduction ratio = 0.4, (f) reduction ratio = 0.45, (g) reduction ratio = 0.5.
Metals 13 00218 g014
Figure 15. Hot rolling experiment diagram of the clad plate. (a) warpage diagram of the clad plate during hot rolling, (b) warpage diagram of the clad plate after hot rolling.
Metals 13 00218 g015
Figure 16. Comparison between measured and simulated head warpage values of the Ti/Steel clad plate after rolling.
Metals 13 00218 g016
Table 1. Chemical composition of the base and clad materials (mass fraction) %.
MaterialTiCNHOFeMnSiAlV
TA2Bal0.010.020.0020.140.07----
Q345B-----Bal1.20.550.020.05
Table 2. Simulation calculation of the rolling process parameters.
ItemsTA2Q345BRoll
Material modelBilinear follow-up modelBilinear hardening modelRigid body model
Density (kg/m3)451077397850
Elasticity modulus (GPa)108206210
Poisson ratio0.340.360.3
Yield strength (MPa)760355
Tangent modulus (GPa)4680
Table 3. Main equipment parameters of the hot rolling mill.
Roll Size of Hot Rolling MillMaximum of Rolling Force Maximum Speed Maximum Roll GapMaximum Motor Power
ϕ 450 × 450 mm4000 kN0~2.5 m/s170 mm400 kW
Disclaimer/Publisher’s Note: The statements, opinions and data contained in all publications are solely those of the individual author(s) and contributor(s) and not of MDPI and/or the editor(s). MDPI and/or the editor(s) disclaim responsibility for any injury to people or property resulting from any ideas, methods, instructions or products referred to in the content.

