Article

Life Assessment of Corroded Wire for Prestressing

1
Institute for Testing of Materials IMS, 11000 Belgrade, Serbia
2
Mathematical Institute of the Serbian Academy of Sciences and Arts, 11000 Belgrade, Serbia
3
Institute of Information Technologies, University of Kragujevac, 34000 Kragujevac, Serbia
4
Department of Industrial Engineering, University of Bologna, Viale Risorgiemnto 2, 40126 Bologna, Italy
*
Author to whom correspondence should be addressed.
Metals 2023, 13(2), 387; https://doi.org/10.3390/met13020387
Submission received: 28 January 2023 / Revised: 9 February 2023 / Accepted: 10 February 2023 / Published: 14 February 2023

Abstract

:
The repair of structural elements for the prestressing of reinforced concrete is necessary when existing prestressing wires are damaged or after a certain period of time. The objective of this paper is to describe the methodology for the life assessment of corroded prestressing wires, sampled from prestressed concrete elements after a few decades of use. The aim of the presented research was to determine the real properties of corroded wire in terms of the evaluation of remaining load capacity using the Theory of Critical Distances (TCD). The methodology also includes spatial 3D characterization of corroded surfaces, determination of mechanical properties, and Finite Element Analysis (FEA) of a model of wire with corrosion pits. The final goal of the presented methodology is to enable more efficient evaluation of repair range and options for the elements of mechanical prestressing systems within various structures. The results and conclusions indicate that the developed methodology, based on the interdisciplinary approach and implementation of state-of-the-art methods, has a high applicability potential for both static and fatigue fracture prediction in the case of prestressed wires. The proposed method has a huge potential for simple and fast prediction of the life assessment of engineering structures, particularly for damaged elements with arbitrary geometry features.

1. Introduction

In the modern construction industry, Reinforced Concrete (RC) has high importance as the most used material, due to its many advantages, related to mass production, versatility, reliability, performance, and ecological and economic reasons, as emphasized by Cui et al. [1]. General building materials are indeed challenging when it comes to meeting the requirements of special projects such as bridges, so researchers have performed a significant amount of research work, such as adding fibers and nanomaterials to strengthen and toughen construction materials for the development of ultra-high-performance concrete for bridges and offshore wind turbine platforms. Nanomaterials are often used in reinforced concrete to improve its performance [2]. The development of prestressed concrete technology over the last two decades can be attributed to the research, development, improvement, and advancement of materials, technology, and construction techniques. The tailoring of elements of RC structures enables them to sustain higher loads by replacing reinforcement, usually ribbed bars or welded mesh, with steel elements with different properties that enable prestressing. The use of prestressed concrete as a structural medium for bridge construction has been gaining popularity recently. With the increasing demands in transportation, the requirements for bridges have become higher, and the shortage of general building materials gives momentum for the use of prestressed concrete in all civil engineering constructions. The elements used for the prestressing of concrete members are steel wires and steel wire ropes, so called tendons.
The use of Prestressed Concrete (PC) structures is superior, both technically and economically, compared to other methods of construction. This is because the size of the prestressed elements is smaller compared to the conventional reinforced concrete elements (reinforced with ribbed bars), and the dead weight of the PC structure is reduced compared to conventional RC structures. Therefore, implementation of solutions based on PC saves on the materials used in structures and reduces costs. However, PC structures deteriorate in many ways, where the corrosion of steel rebars or wires and tendons (elements made from high strength steel wire ropes) is the prime mechanism, which affects the integrity during service life and the cost of structure maintenance, as described in detail by Broomfield [3] and analyzed by Dixit and Gupta [4].
The life assessment of corroded structural elements is not a simple task. This is mainly because corrosion is an electro-chemical process with a variable rate due to the changing external conditions. At some point, with the progression of corrosion damage, the mechanistic aspects of damage acting as a stress concentration feature of reinforcement (wire or tendons) take a leading role in the deterioration of PC. The subject of the research presented in this paper is the development of a methodology suitable for assessing corroded steel wire for PC. Corroded wire was chosen because it can be reduced to the single axis strain problem and is suitable for checking the methodology with the aim of further application of wire ropes (tendons), which have a more complex stress state. Because the general principles of the corrosion of steel in concrete is well described by Broomfield [3] and Dixit and Gupta [4], and its importance is explained by Yang et al. [5], the key question remaining is how to assess the residual load capacity of corroded wire, as Kioumarsi [6] highlighted. Different similar problems considering the mechanistic aspect and the importance of geometrical evaluation is noted by De Queiroz et al. [7]. In addition, a novel innovative method of piezoelectric materials represented by PZT (Piezoceramic Lead-Zirconate-Titanate) patch have been increasingly investigated in structural health monitoring due to low-cost and high-frequency bandwidth, as well as fast response properties [8].
The previously defined problem has different possible answers. Chuanjie et al. [9] proposed a model of an improved continuum damage mechanics model for evaluating corrosion–fatigue life, and Jie et al. [10] proposed a Strain Energy Density (SED) approach in assessing the fatigue strength of corroded metallic wires. If we remove corrosion as an electro-chemical phenomenon from consideration, as proposed by Turnbull [11,12], any surface damage can be considered as stress concentration, presented, for example, in real case studies demonstrated by Lan et al. [13] and Wang et al. [14]. The state-of-the-art in understanding the influence of arbitrary geometry features on static load and fatigue was created by Taylor and Susmel [15,16] by developing the Theory of Critical Distances (TCD). This new approach enables the consideration of small-diameter specimens or samples with stress concentration features, as demonstrated by Martinez et al. [17] and Jie [18]. It is important to emphasize that the chosen TCD method did not take into account the physical process of corrosion itself and included only the mechanistic approach of corrosion damage as a source of stress concentration, making the analysis simpler and more applicable.
In the case of real engineering components, which are characterized by complex geometries, resulting in local stress concentration phenomena, a practical and applicable solution is necessary. Providing structural engineers with design methods suitable for evaluating the detrimental effect of different stress concentration features, such as weakened reinforcement in beams, on the overall strength of engineering components is an everlasting goal. Among the highly applicable design formulations that account for this effect is the TCD proposed by Taylor [16]. TCD is recognized as one of the most popular and applicable methods due to its simplicity and good matching between theoretical and experimental results for different stress concentration features. The main idea of the TCD is the definition of an effective stress, which is equal to the stresses at a point located at a critical distance from the stress concentrator (so called Point TCD method). In this definition, TCD uses half of the characteristic material length parameter, the so-called critical distance, L/2, which is equal to the critical length of the crack (crack with the capacity to grow further due to failure), to predict both brittle fracture and fatigue fracture [16]. Failure is expected to occur if effective stress exceeds a reference material strength. The precursor of failures of construction elements are cracks, and the prediction of their initiation is very important, as noted by Hao Zhang [8] and Terekhina [19].
The research analyzed above considered the problem of corrosion damage of reinforcement based on theoretical models, as well as the application of the TCD on the standard samples from healthy material, while this paper describes the implementation of the theoretical TCD postulates on real case problems. The research results based on a case study and development of the methodology to evaluate the influence of corrosion surface damage on steel wire residual load capacity is the key importance of this paper. The mechanistic approach is chosen in this research, neglecting the electro-chemical aspect of corrosion phenomenon, and the problem is reduced to stress concentration only. The stress concentration due to corrosion damage is presented as semi-spherical corrosion pits, according to state-of-the-art knowledge [20].

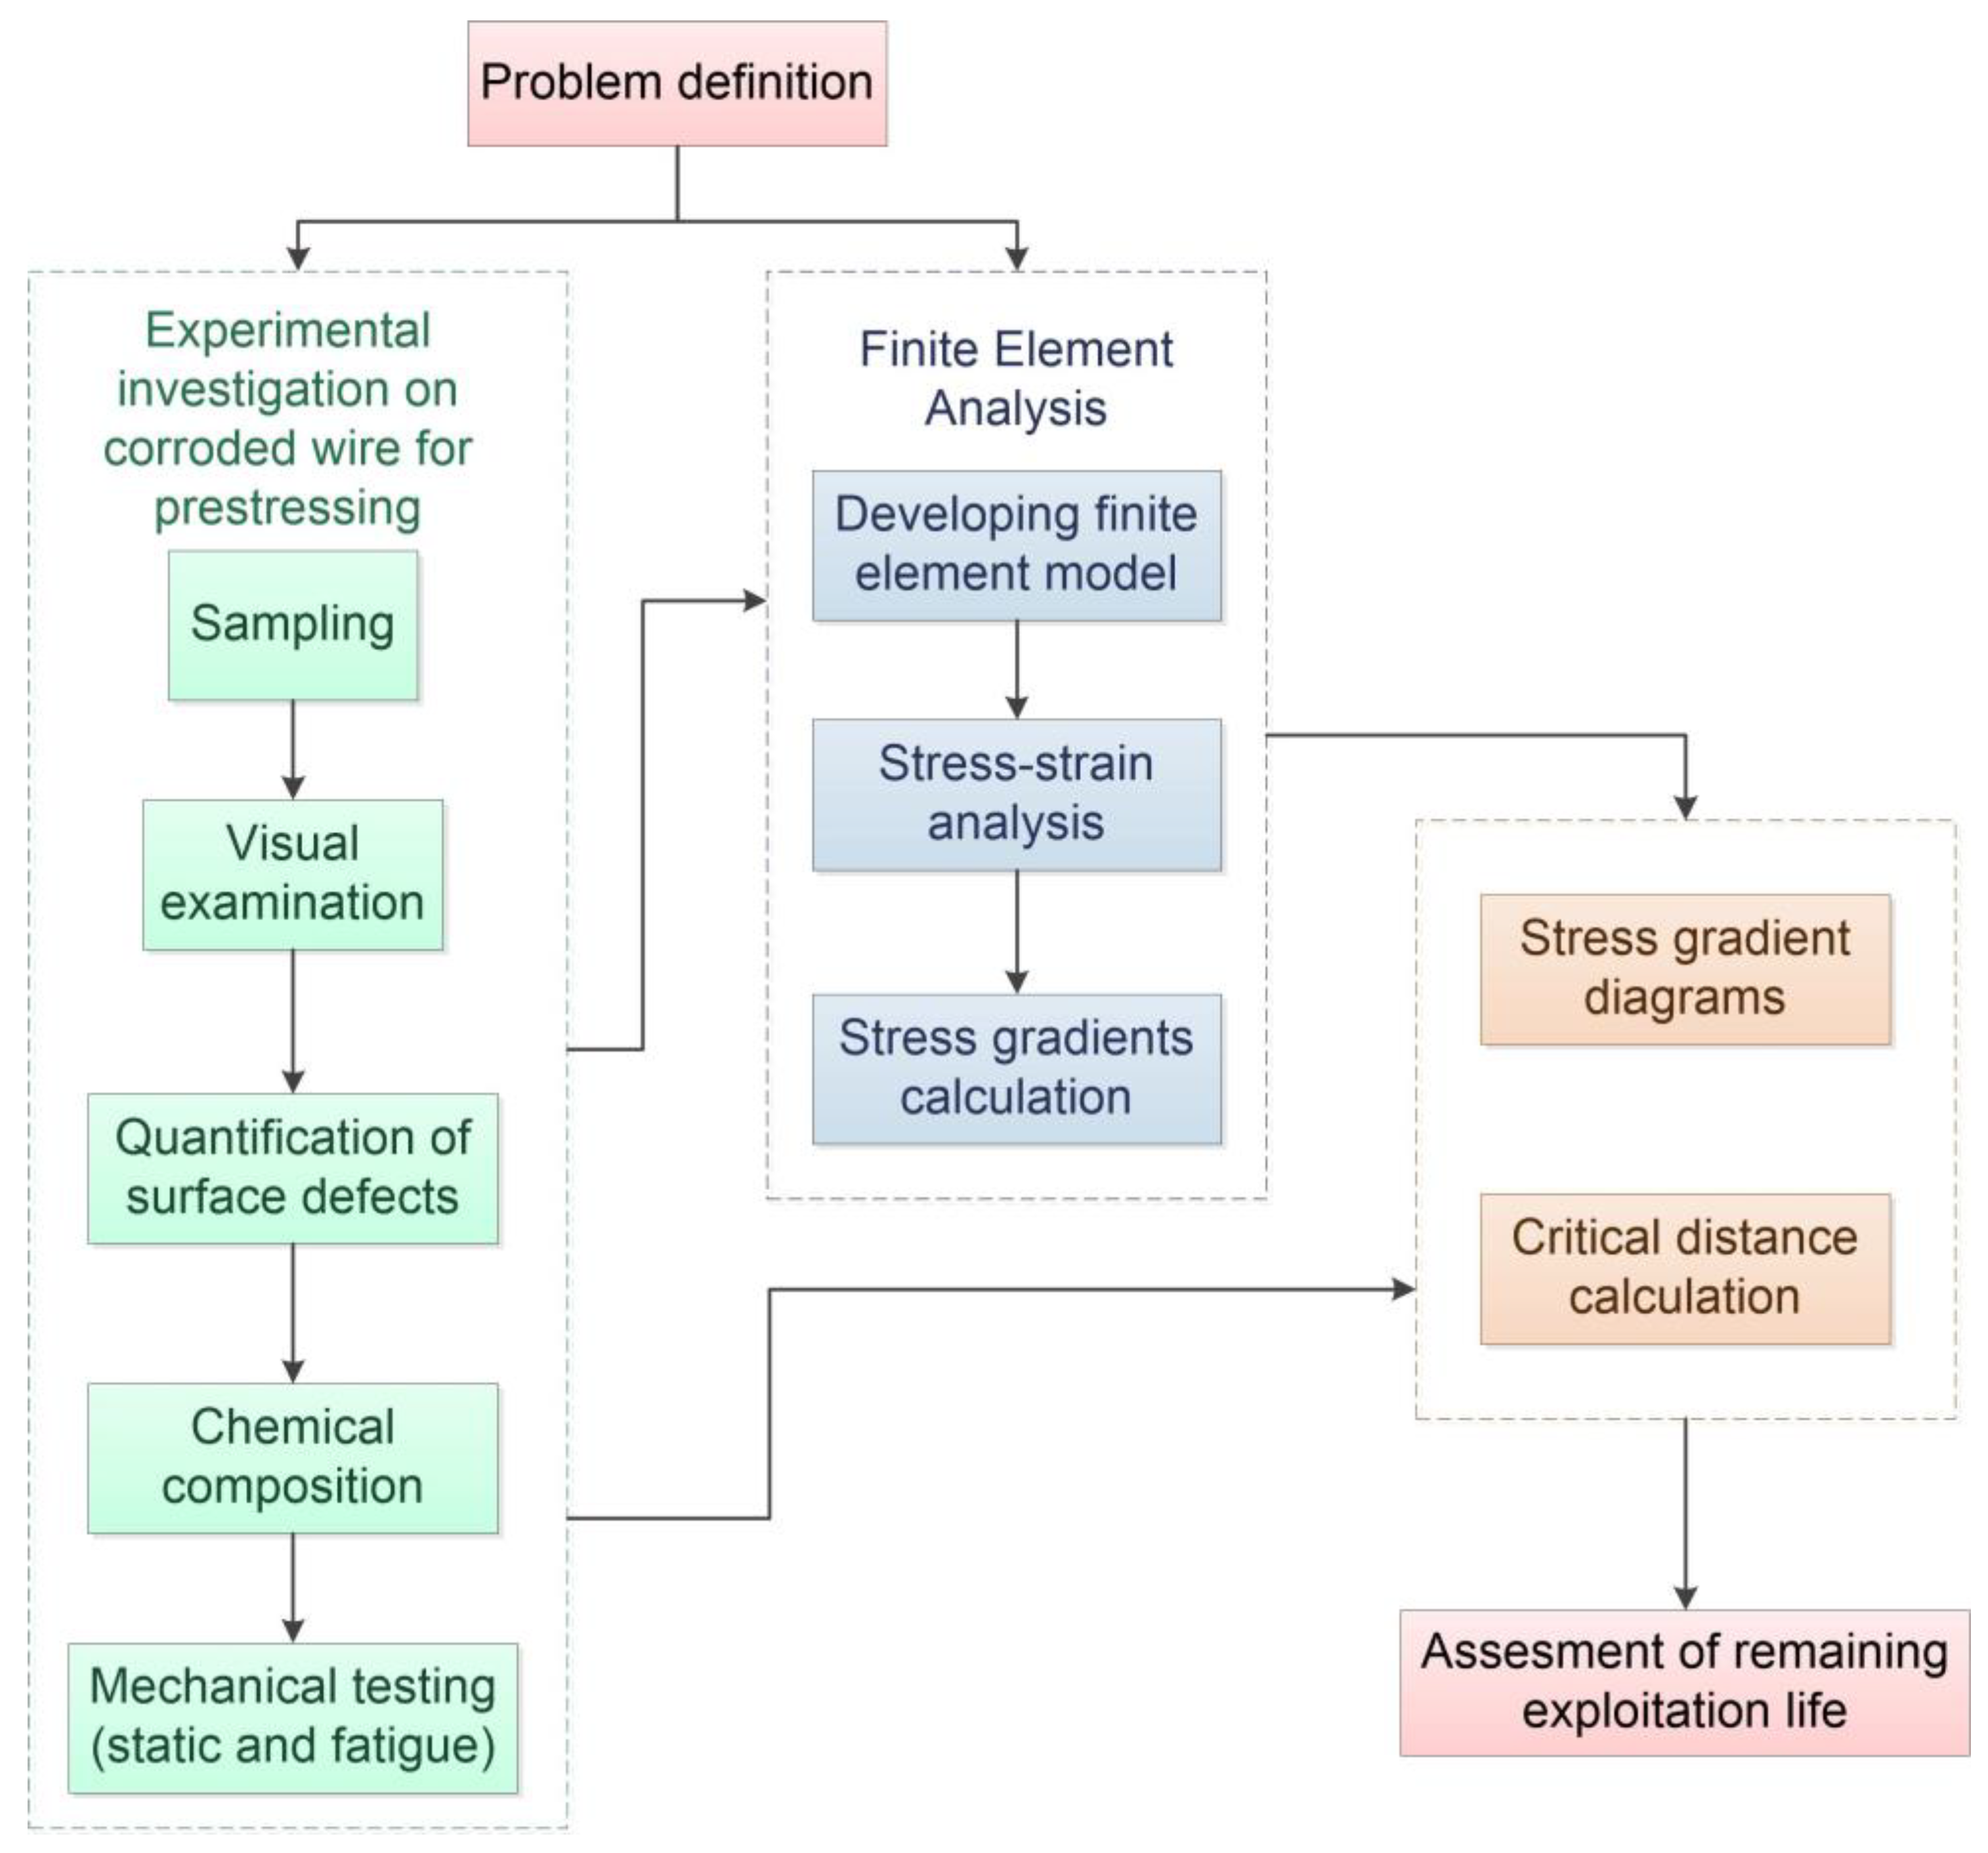
2. Methodology for Life Assessment of Corroded Wire for Prestressing

The methodology for the life assessment of corroded wire for prestressing is developed and shown with an algorithm, Figure 1. This new methodology is a partial modification of similar methodologies developed for fatigue life assessment of a few standard machine elements, developed and presented by Atanasovska et al. [21], Momcilovic et al. [22], and Atanasovska et al. [23], and is based on the main postulates of the Theory of Critical Distances (TCD).
In the first step of this methodology, the problem needs to be defined from the aspect of the use of the prestressing wire and the observation from the prestressed concrete elements themselves. These data most often come from facility maintenance services or their expert support.
The second step presents the comprehensive experimental investigation, starting from the sampling and visual examination at the structure, which is still in use, followed by quantification of observed surface defects, their clarification and classification, and finally experimental testing of samples in the laboratory. The laboratory testing can be separated into the testing of chemical composition and the testing of mechanical characteristics (under static and fatigue loads).
The results of experimental testing of the samples give the data required for stress–strain analysis of the investigated elements, which are performing by Finite element method. The output of Finite Element Analysis in this phase of the methodology is stress gradients shown by diagrams of the stress variation along the direction normal to the tangential surface of the visualized damages.
The main calculation part of the methodology consists of calculating the critical distance according to the material characteristics obtained for the sampled material, drawing the stress gradient diagrams and estimation of the calculated effective stresses. The last step of the methodology is assessment of the remaining life of the materials based on the TCD method.

2.1. Experimental Investigation on Corroded Wire for Prestressing

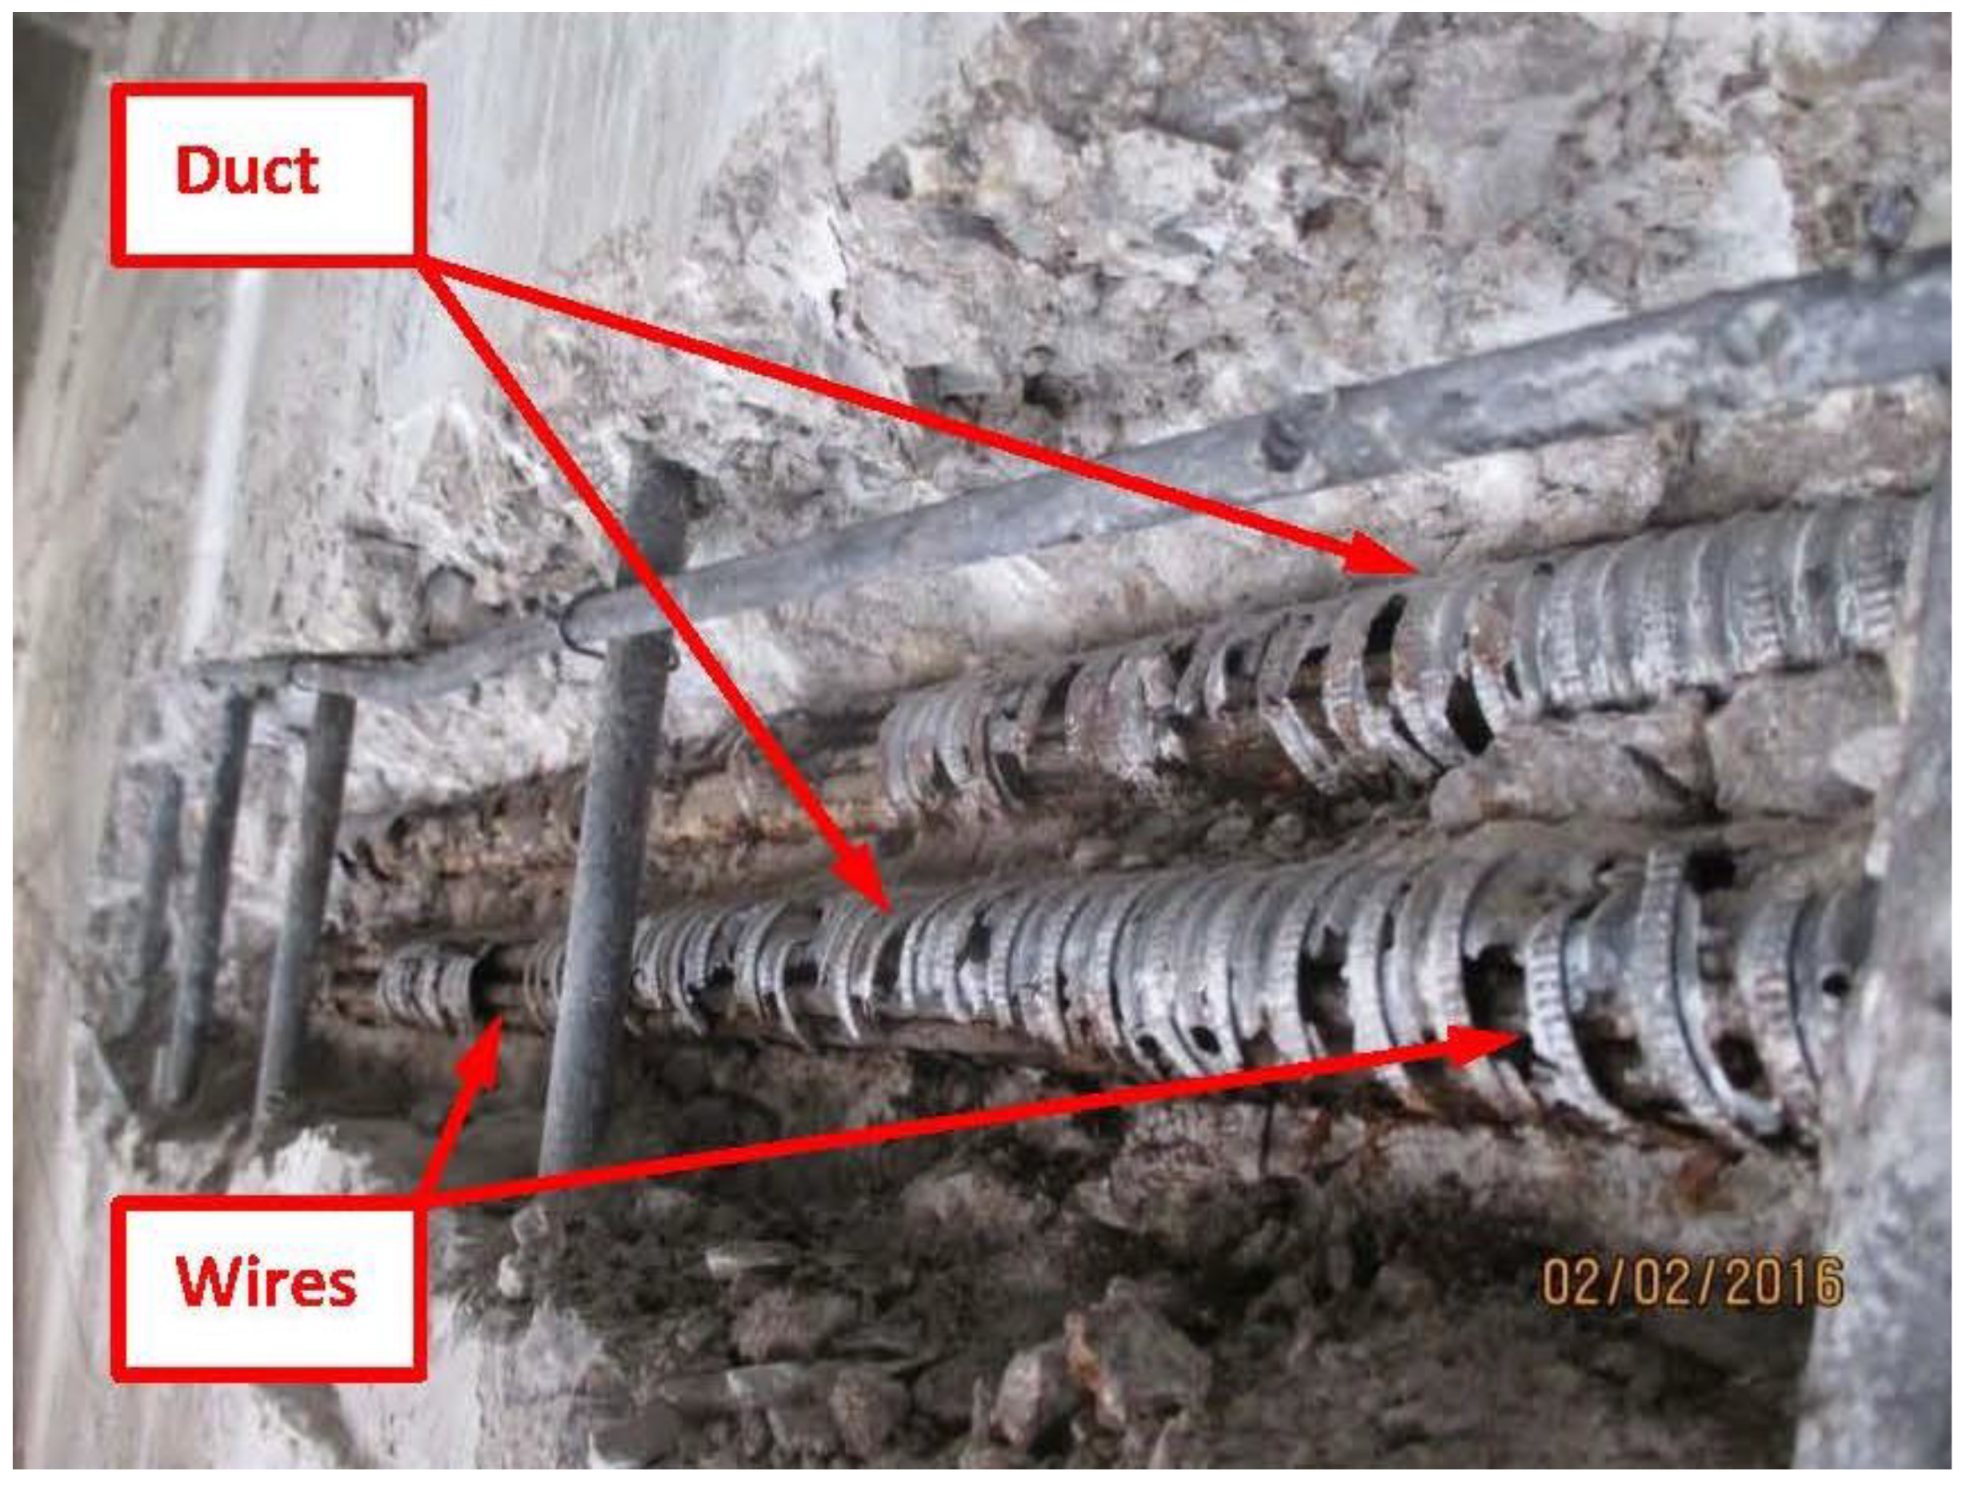
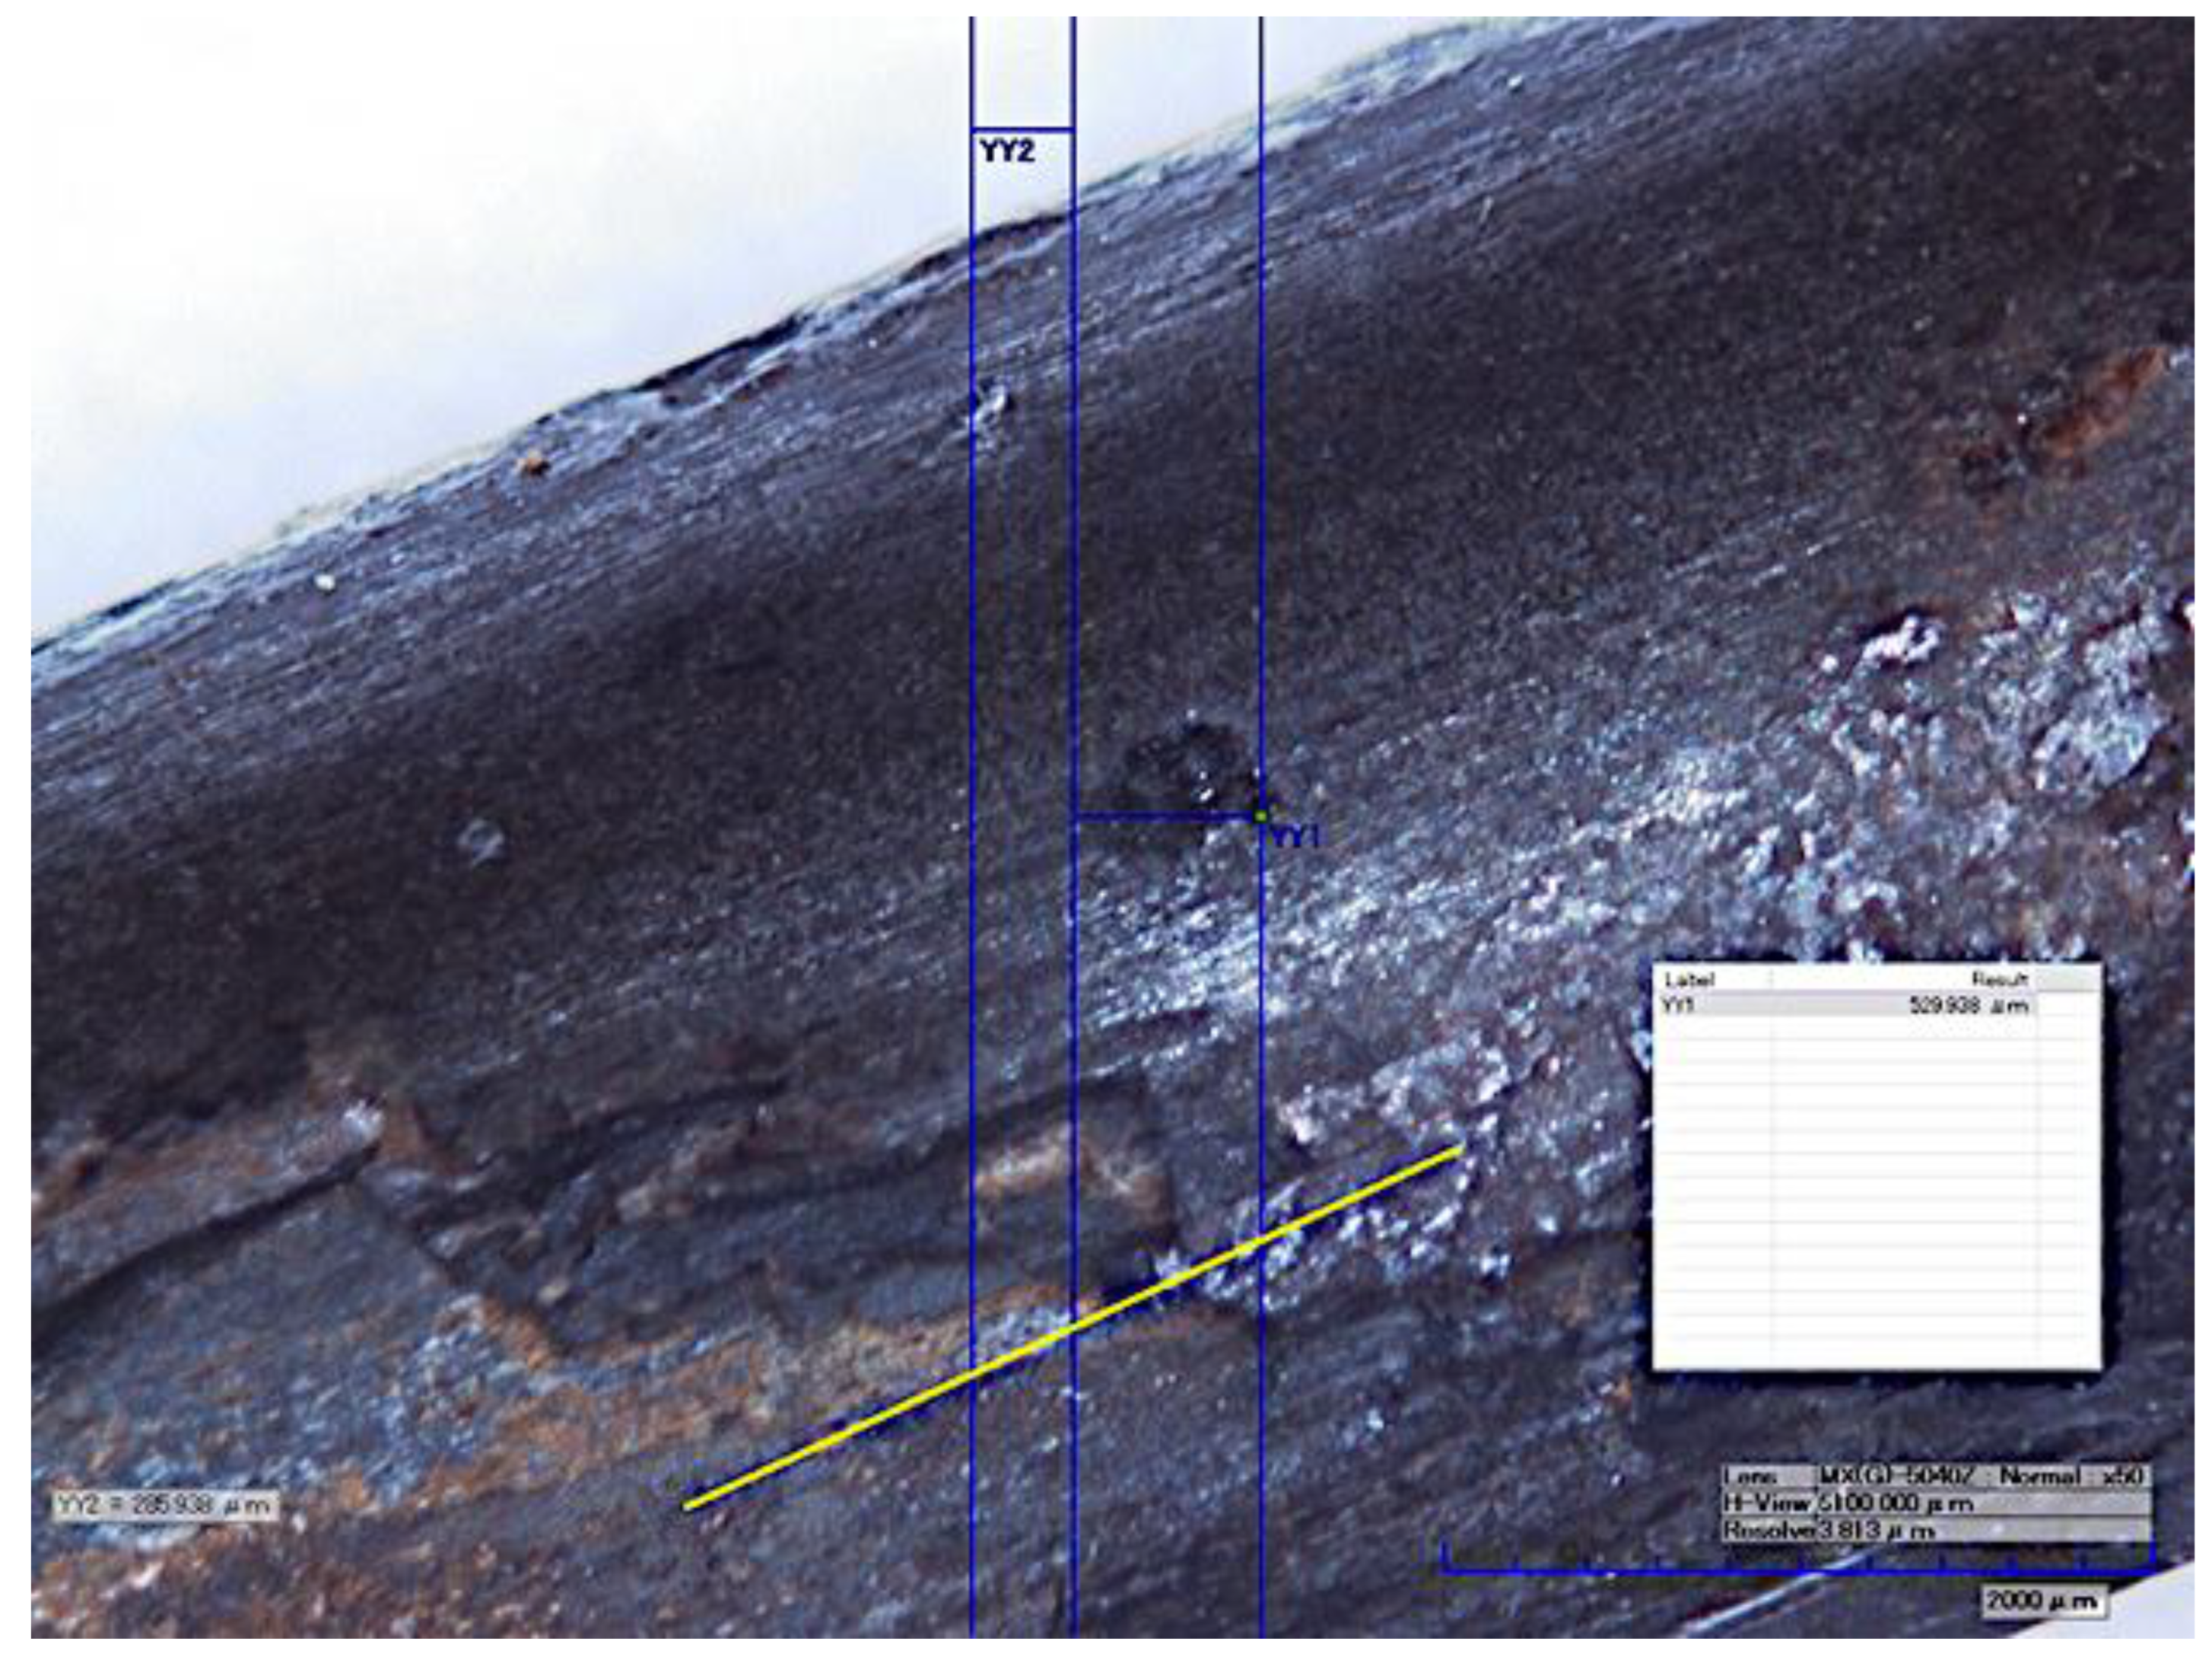
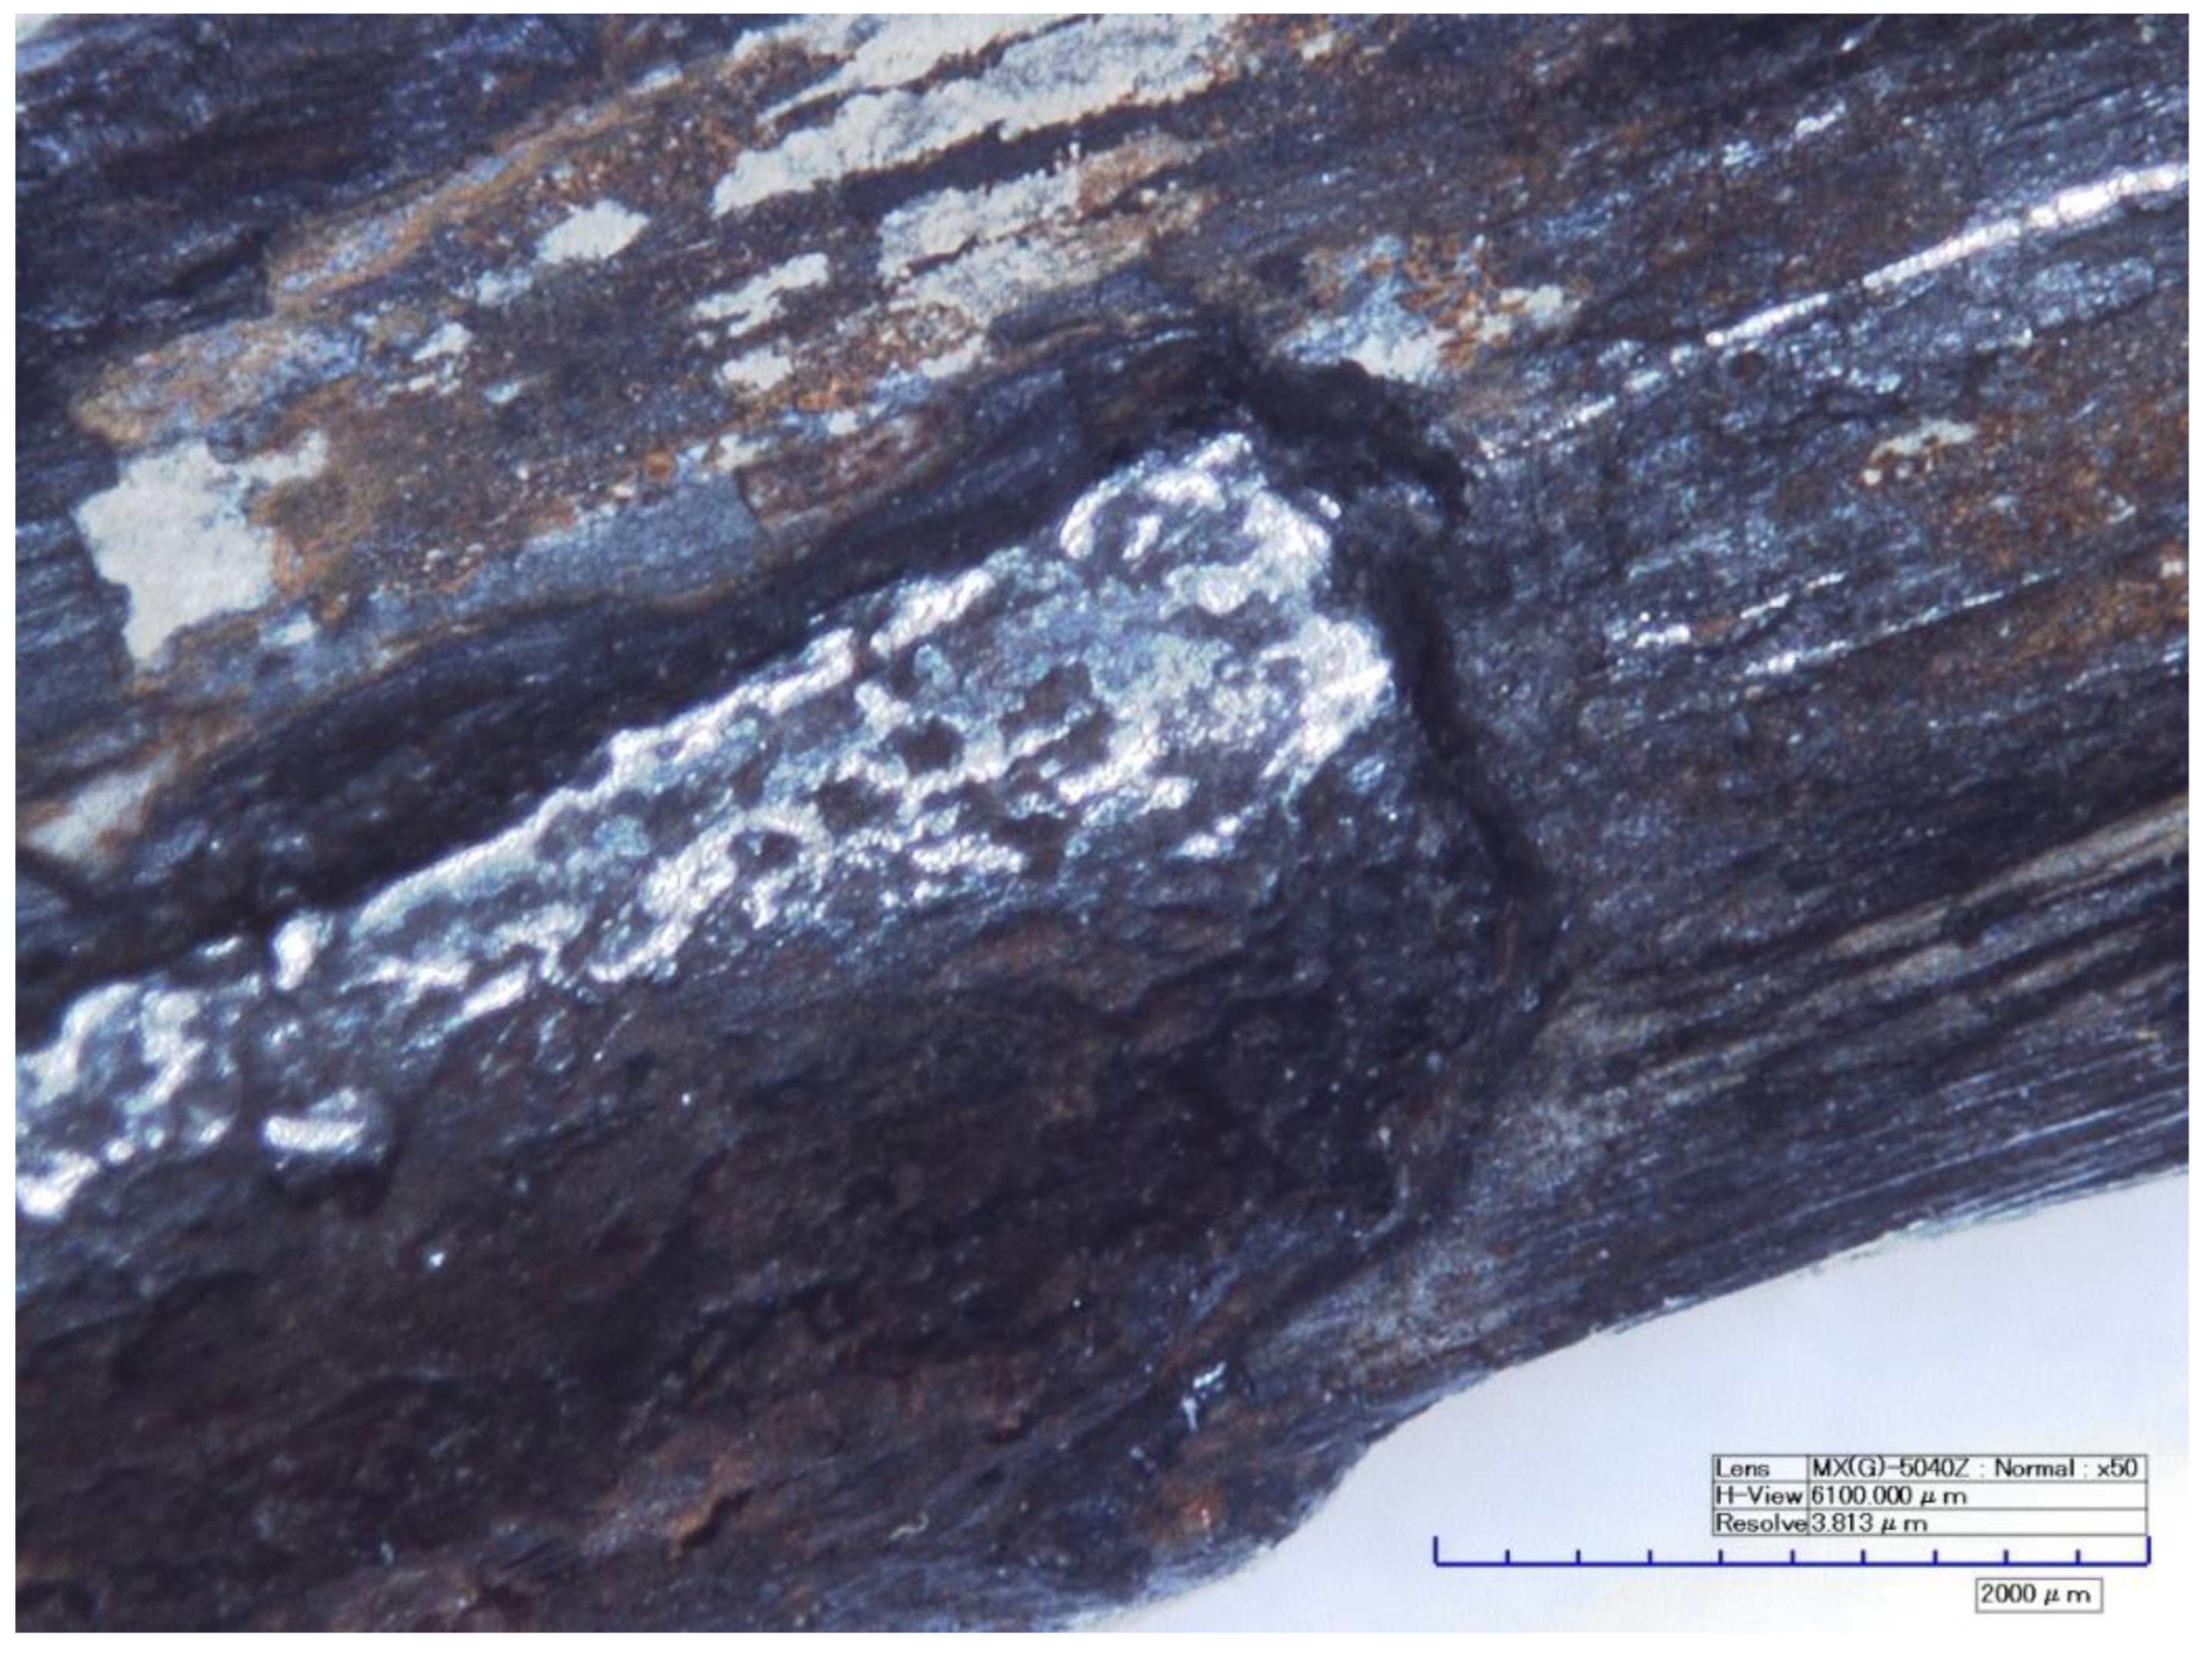
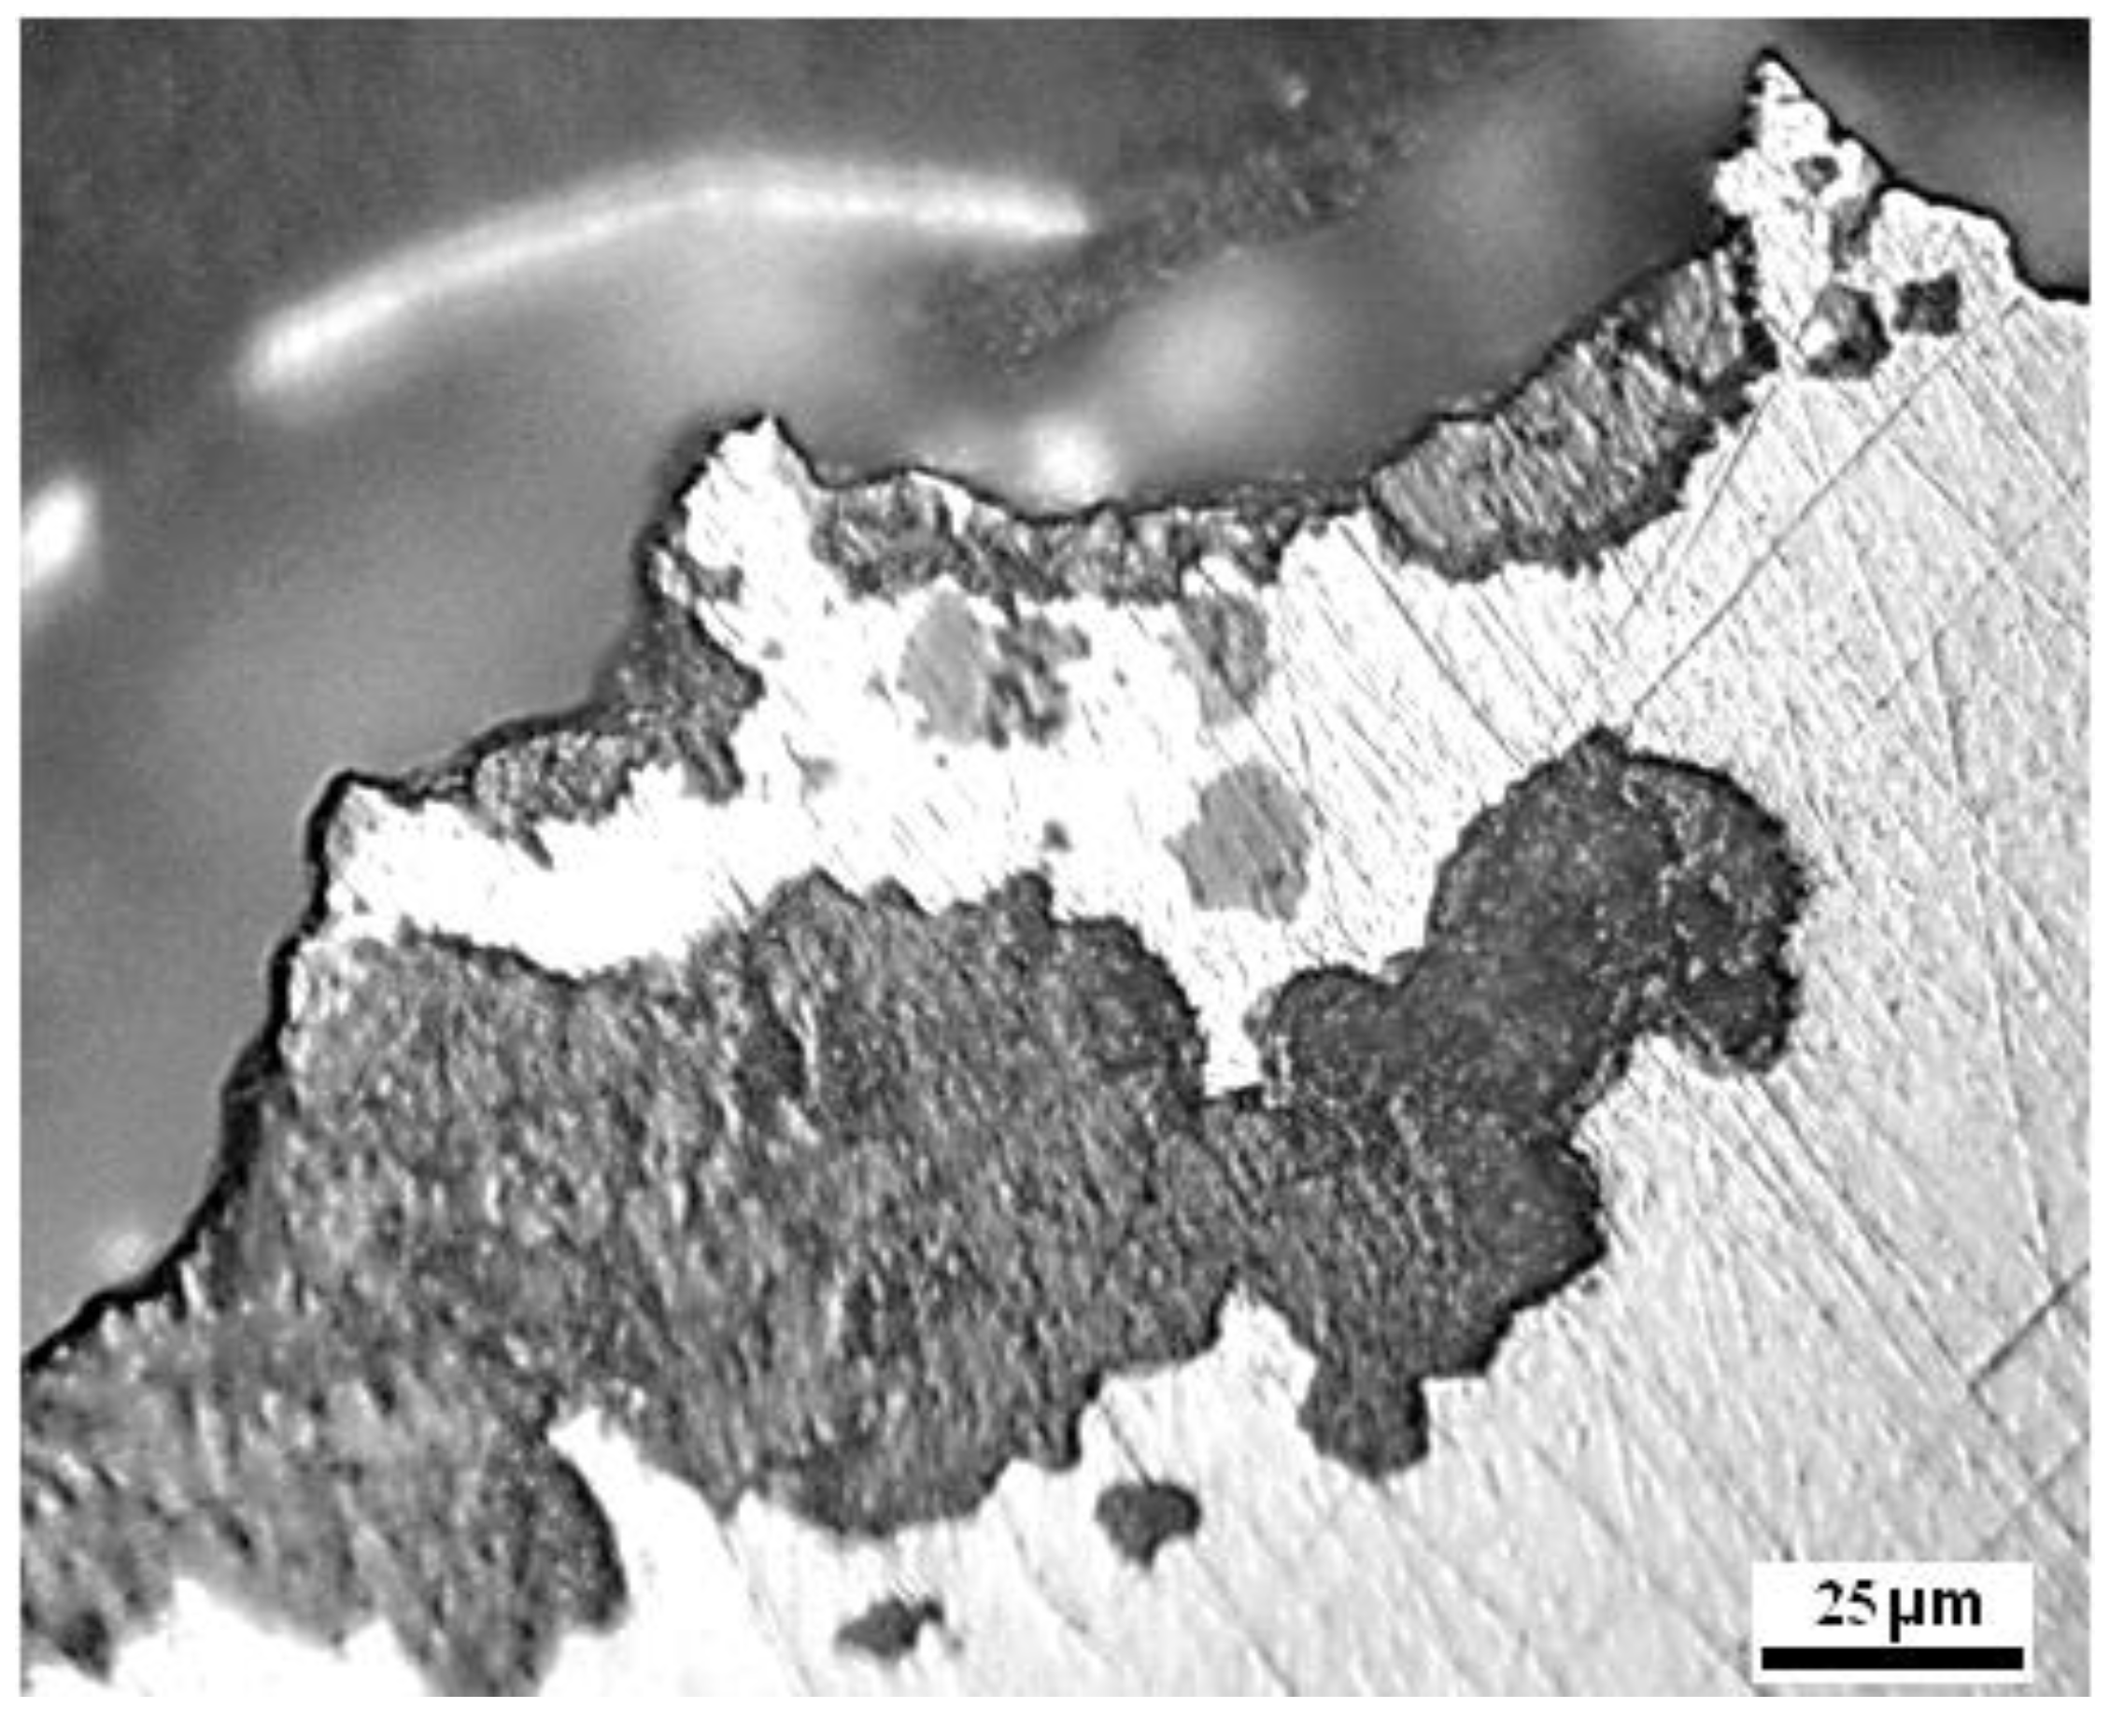
2.1.1. Visual Examination

The first part of the experimental investigation on corroded wire for prestressing is visual examination, performed on the samples taken from the beams of a railway bridge on a 40 kilometer stretch of the Vrbnica–Bar railway, as shown on Figure 2 and Figure 3, [24].
The protection of the wires is achieved by injecting cement grout into the duct after the wires have been tensioned and anchored. Due to the damaged state of the ducts, it is not clear what kind of protection was applied 45 years ago. Visual examination revealed that the minimum size of corrosion damages varied from 0.4 mm (Figure 4) up to 5 mm (Figure 5) in length, and 0.3 mm up to 1.5 mm in depth. The diameter of the ducts containing the corroded wires was 40 mm.
Quantification of surface defects was performed on a 3D digital microscope, HIROX RH-2000 (HIROX, Tokyo, Japan), Figure 6. The real geometry and profile of the corrosion damage were analyzed in order to check the presumption that there was a possibility for reducing the geometry on these high-tensile steel wires.
The mechanical properties of steel wires are very sensitive to corrosion. This is because corrosion and other pre-existing superficial defects reduce the cross-sectional area significantly and cause severe localized stress concentration [18].
Within the behavior of the corroded element, local pits act as sharp geometrical features that significantly reduce the strength of the steel wires. This explains why pitting corrosion is usually considered more detrimental than uniform/general corrosion. If attention is focused on pitting, the presence of an aggressive environment leads to the formation on the steel wires’ surfaces of cavities with different shapes. In this context, the simplest assumption that can be made for assessing the detrimental effect of corrosion pits is modelling them as hemispherical notches. More realistic geometrical configurations may also include bullet shapes [11,12]. A visual examination of the cross section of the actual corrosion pits presented in Figure 5 is shown in Figure 7, to confirm the above noted statement.
The geometric characteristics of the wire were measured on the sample of the corroded wire. Considering that the cross-section of the wire is no longer circular, the cross-section was determined based on the mass measurement. The test results are shown in Table 1. It should be emphasized that the variable “calculated diameter” refers to the mathematical mean value of the diameter based on the longitudinal mass, and not to the actual diameter of the tested wire.

2.1.2. Experimental Testing

The chemical composition of the corroded wires was tested to compare them with similar new wires. The testing of the sample was performed on a BELEC LAB 3000s OES (Belec, Osnabrück, Germany). The obtained results are given in Table 2. The main aim of the presented research and developed methodology is the assessment of the residual load carrying capacity of prestressing wires; therefore, an extensive chemical testing, for example with a method such as Energy Dispersive Scanning (EDS), was not performed.
In order to determine the reduction of the tensile strength of corroded wire, a tensile test was performed. Testing was performed on a SHIMADZU AGX-V 100 kN testing machine (SHIMADZU, Kyoto, Japan), with a strain rate of 0.1 mm/min; Figure 8. Testing of the corroded specimens is very sensitive from the aspect of gripping force; therefore, such specimens must be tested with controlled gripping, as shown in Figure 8. The obtained experimental results are given in Table 3. The number of specimens for dimension control and tensile testing does not match, because one of the samples was used for chemical testing and microscopy analysis; Figure 9.
The results of the tensile test indicate a strong influence of the local level of corrosion damage, particularly the inclusion of “hidden” subsurface damage, as shown on Figure 7 and Figure 9. The experimentally obtained results of dimensional analysis (Table 1) and tensile testing (Table 3) show that the diameter of the corroded wire is significantly reduced by approximately 10%, and the cross-section is even more reduced, by approximately 18%. The tensile strength is reduced by only 5.5%, based on the comparison of the experimental results for tensile strength given in Table 3 with the referent value from the literature [25].

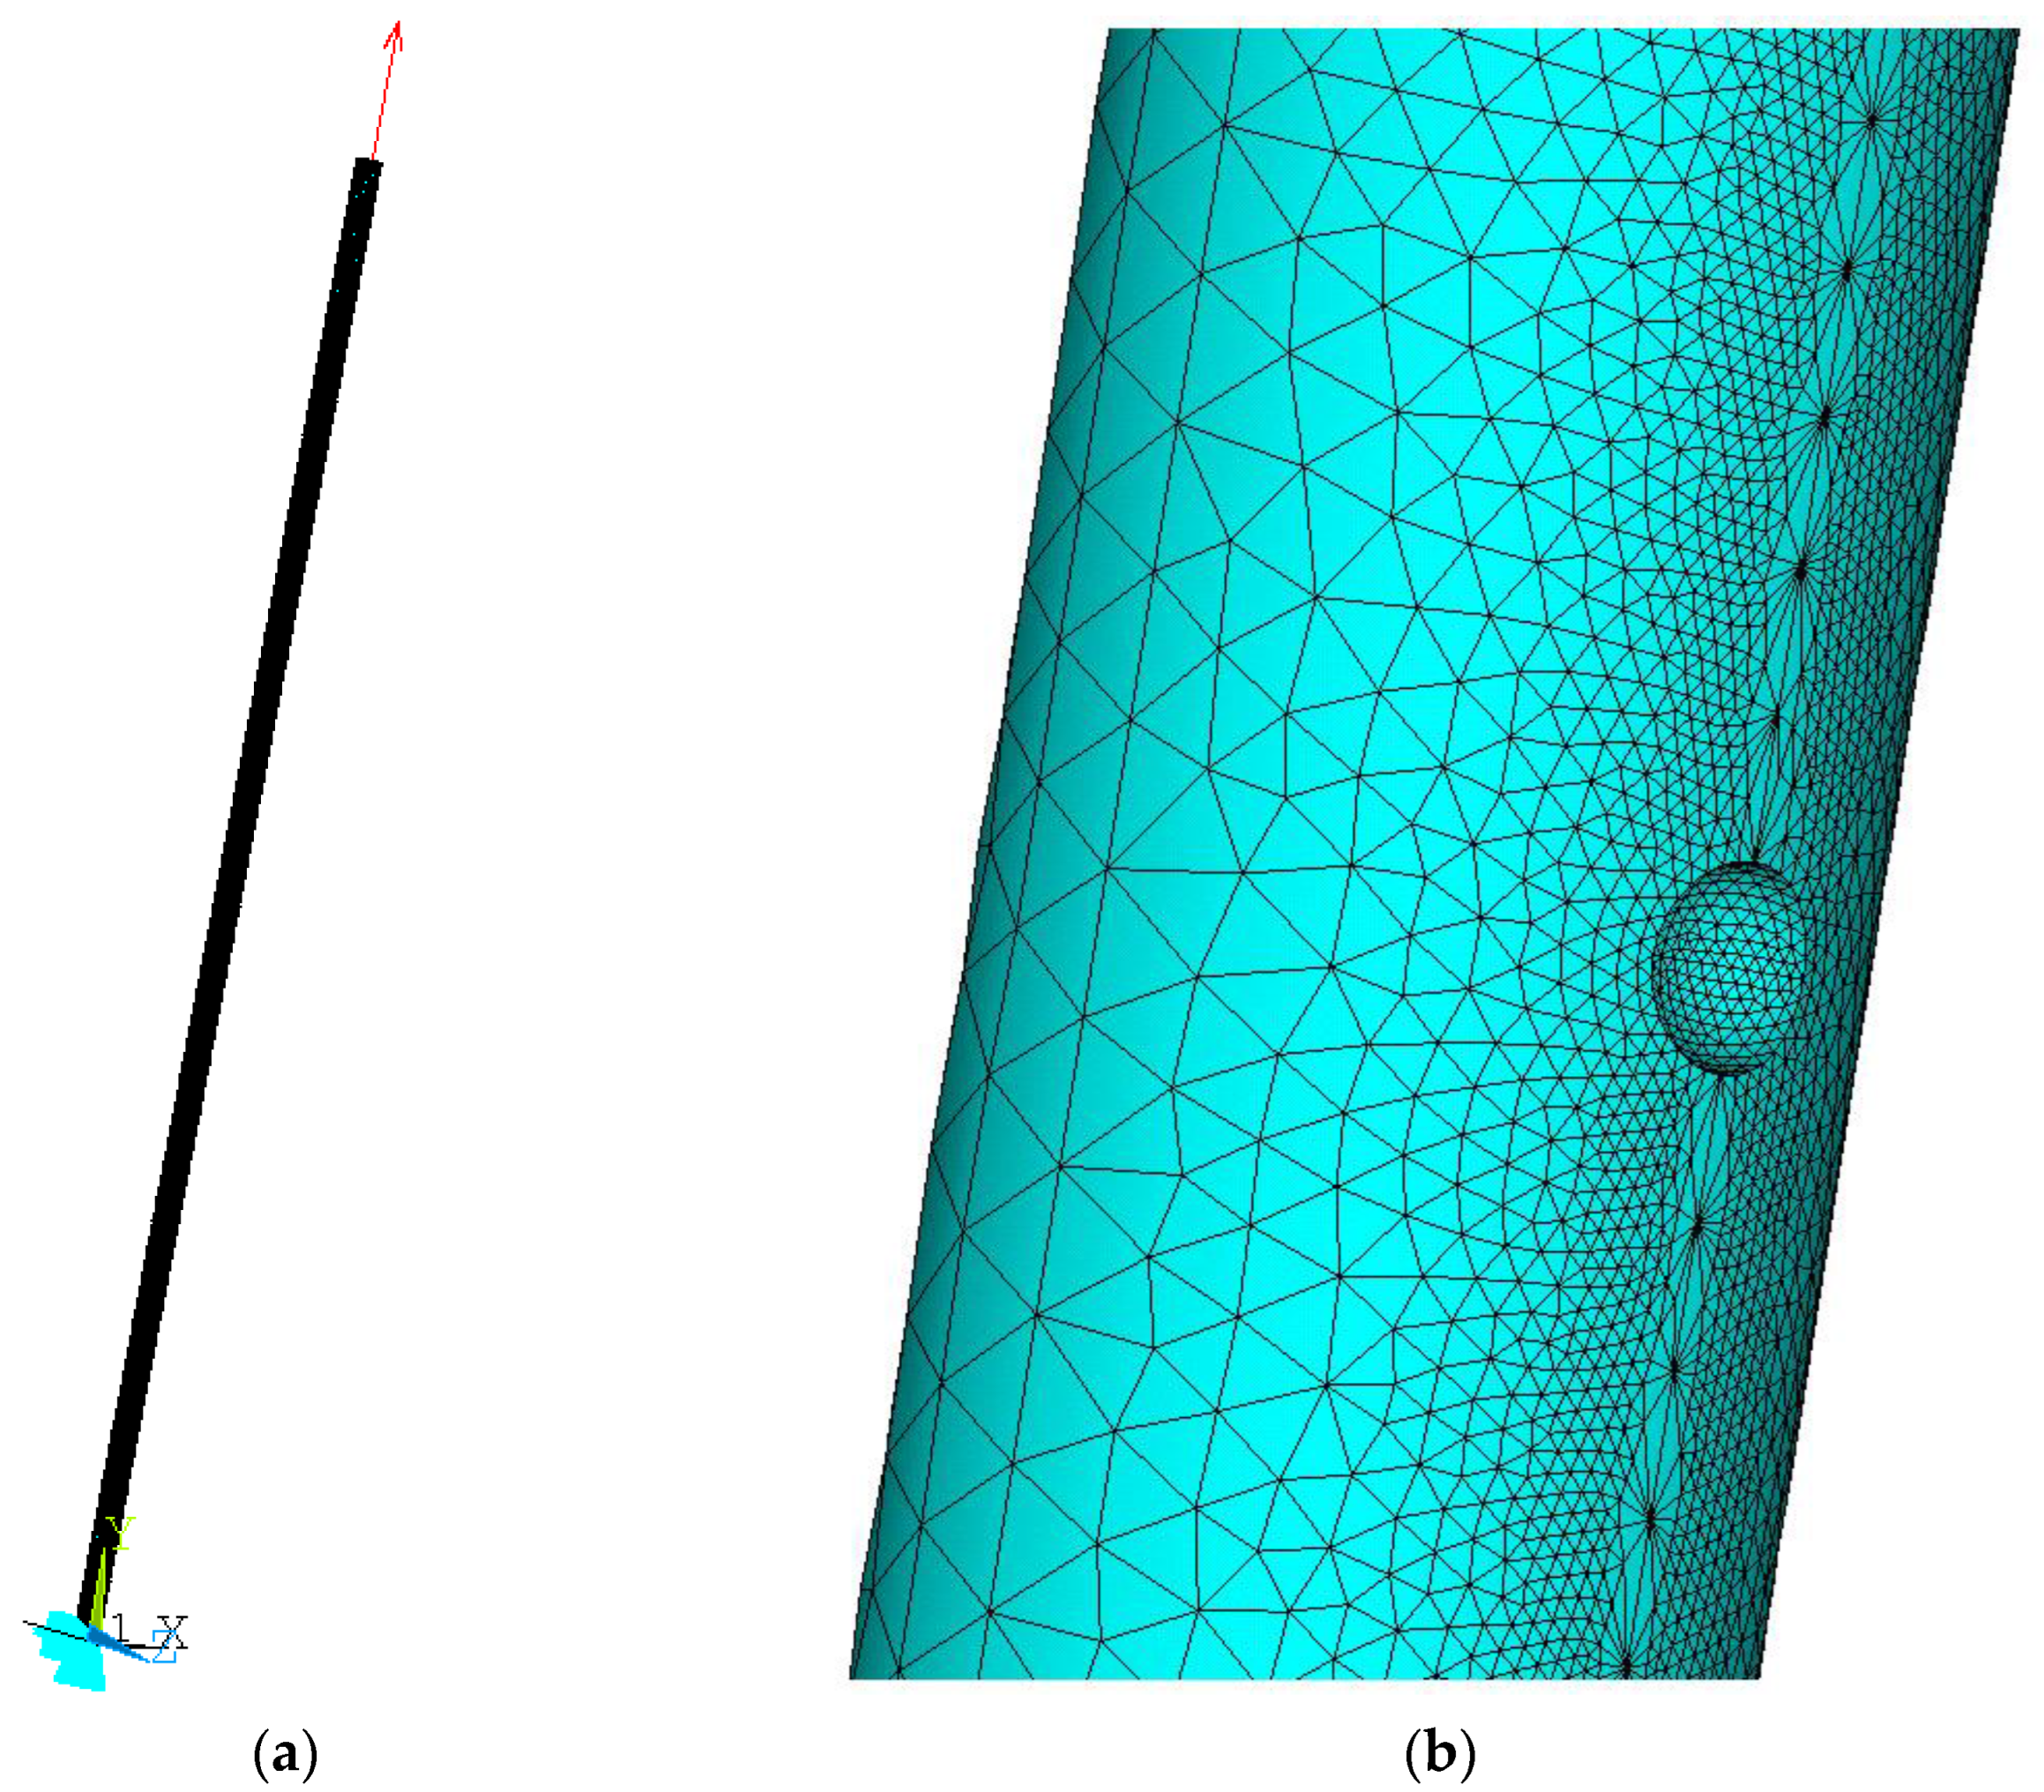
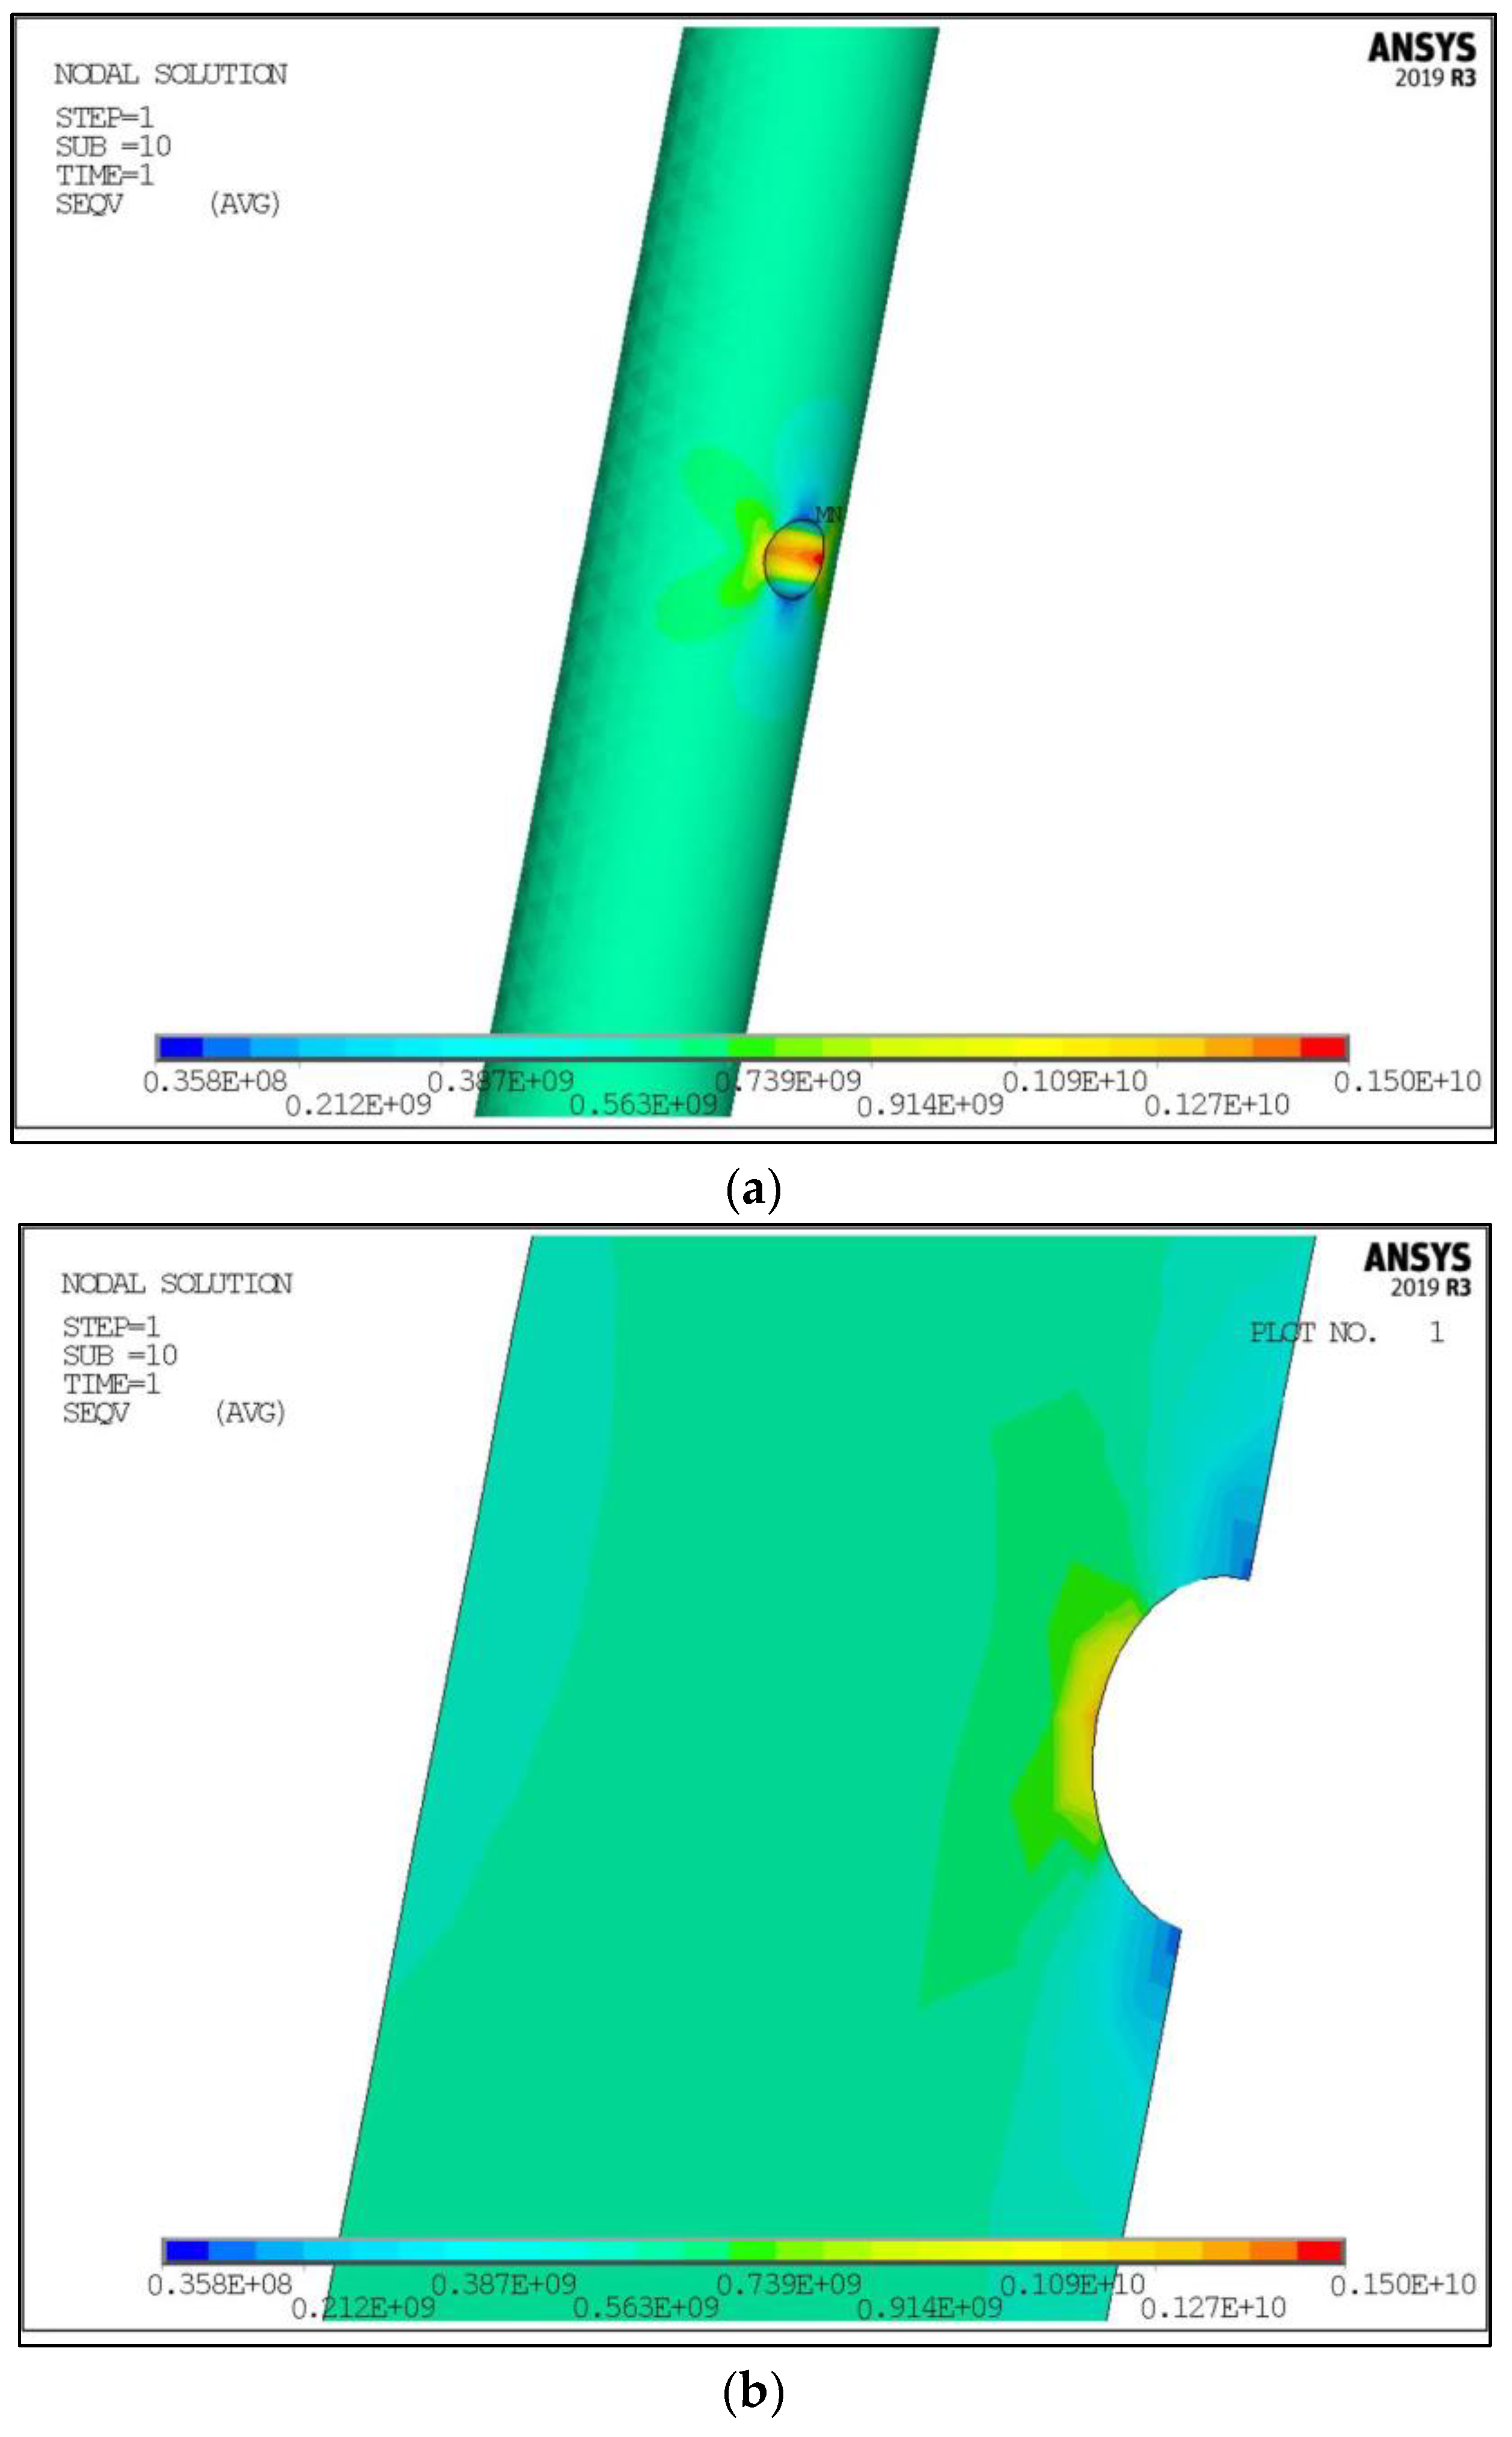
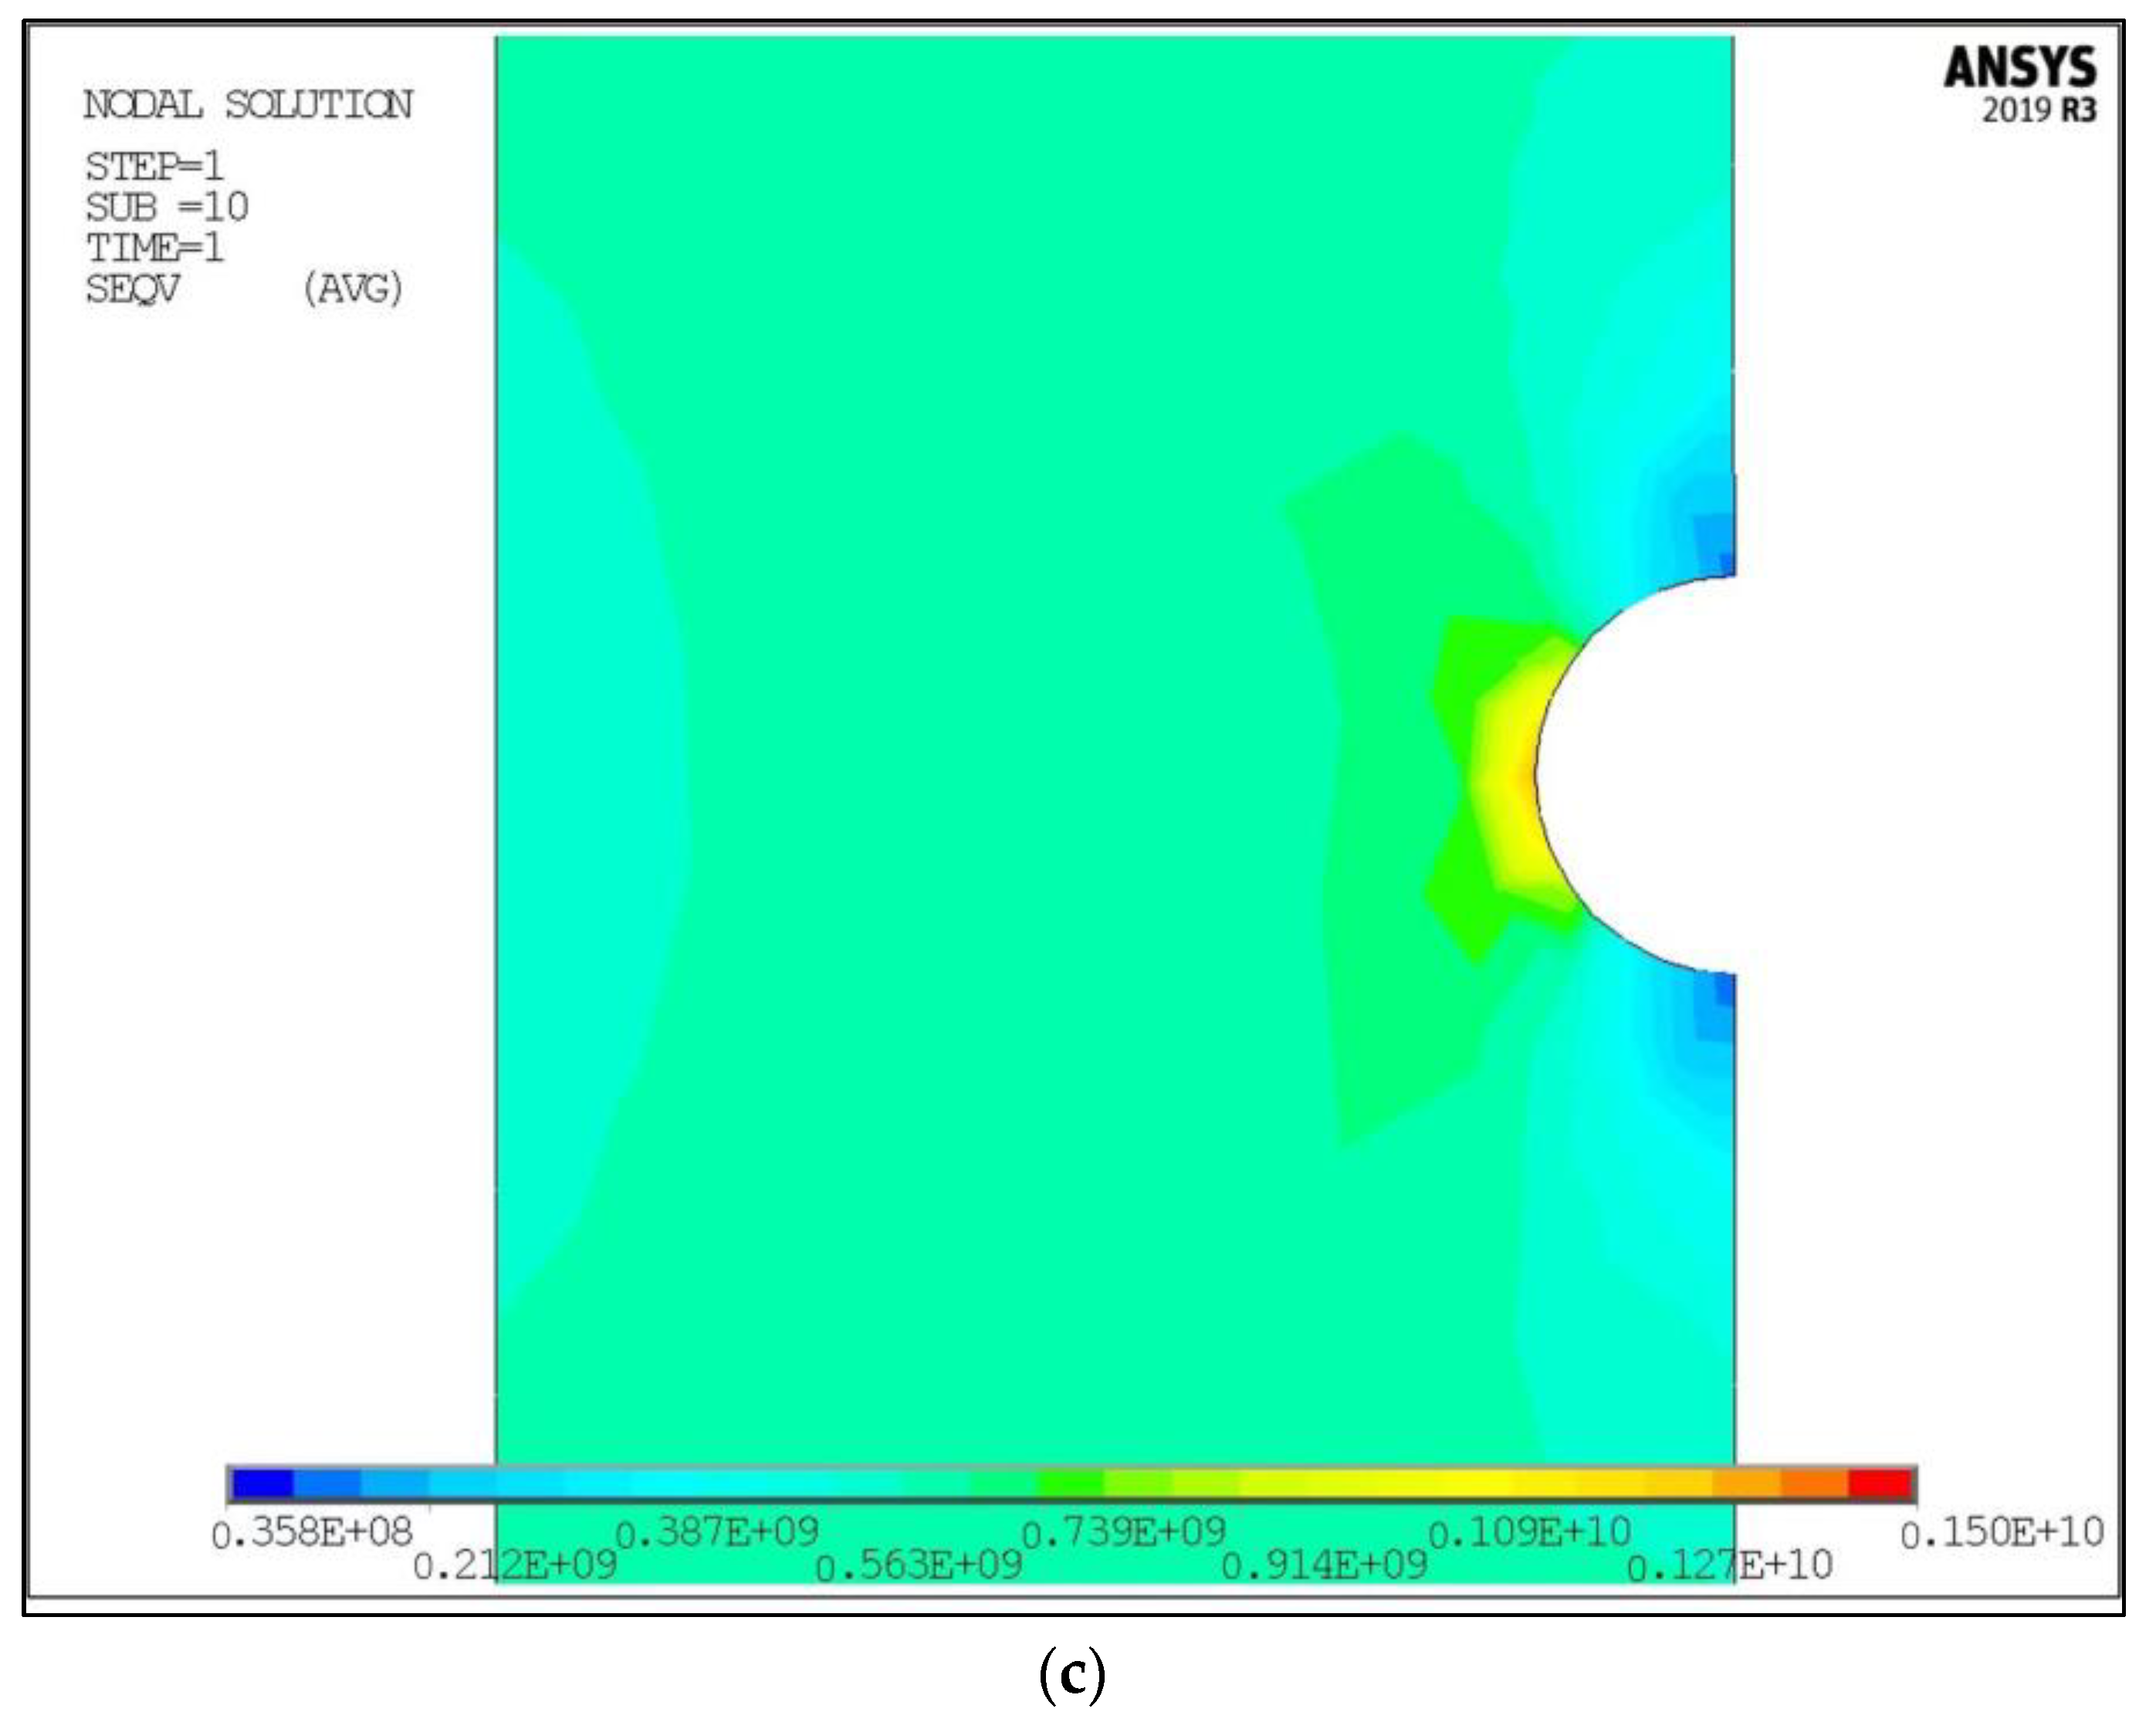
2.2. Finite Element Analysis

In order to determine the remaining strength of the damaged wire, numerical modeling was performed under static and dynamic loading—simulating the size of previously measured damages according to the data obtained from the materials in use. As the maximum measured depth of corrosion damage is 0.56 mm, dimples with a radius of 0.3 mm, 0.6 mm, and 0.8 mm were chosen for modeling. Tension was modeled up to a force of 12.6 kN, in a static load, and fatigue was modeled around the tension force (12.6 kN), with amplitude Δσ = 2 kN at the ratio of main stresses R = 0. The tension force of 12.6 kN was chosen as a force for prestressing for a nominal wire diameter of 5.0 mm.
Finite Element Analysis (FEA) of the wire with corrosion pits was performed in order to calculate the stress state of the investigated cases of corrosion damages on the wire for the prestressing of reinforced concrete [12,20,21,22,26]. This Finite Element Analysis was performed using ANSYS Mechanical APDL commercial software (ANSYS 19R3 version, ANSYS, Inc., Canonsburg, PA, USA), which successfully solves different kinds of problems related to specific geometry as the source of stress concentration, such as the problem of geometric evaluation and constructal design [7], as well as the optimization of the geometrical and material characteristics of specific products [27] or coupled problems including nonlinear contact phenomenon [23].
The modelled wire samples were simulated with three different radiuses of semi-spherical corrosion pits—0.3 mm, 0.6 mm, and 0.8 mm. The number of nodes in the finite element models was 220,382, and the number of elements was 137,922; Figure 10. The material model chosen for FEA was a linear elastic material model. This model is required to model material behavior in accordance with the main postulates of the Theory of Critical Distances (TCD) implemented in the next step of the presented methodology. The modulus of elasticity in this material model was simulated in accordance with the experimental results presented in Table 3. The Finite Element Analysis was performed under static tensile loading of 12.6 KN, which is the force used for prestressing in real concrete elements [24].

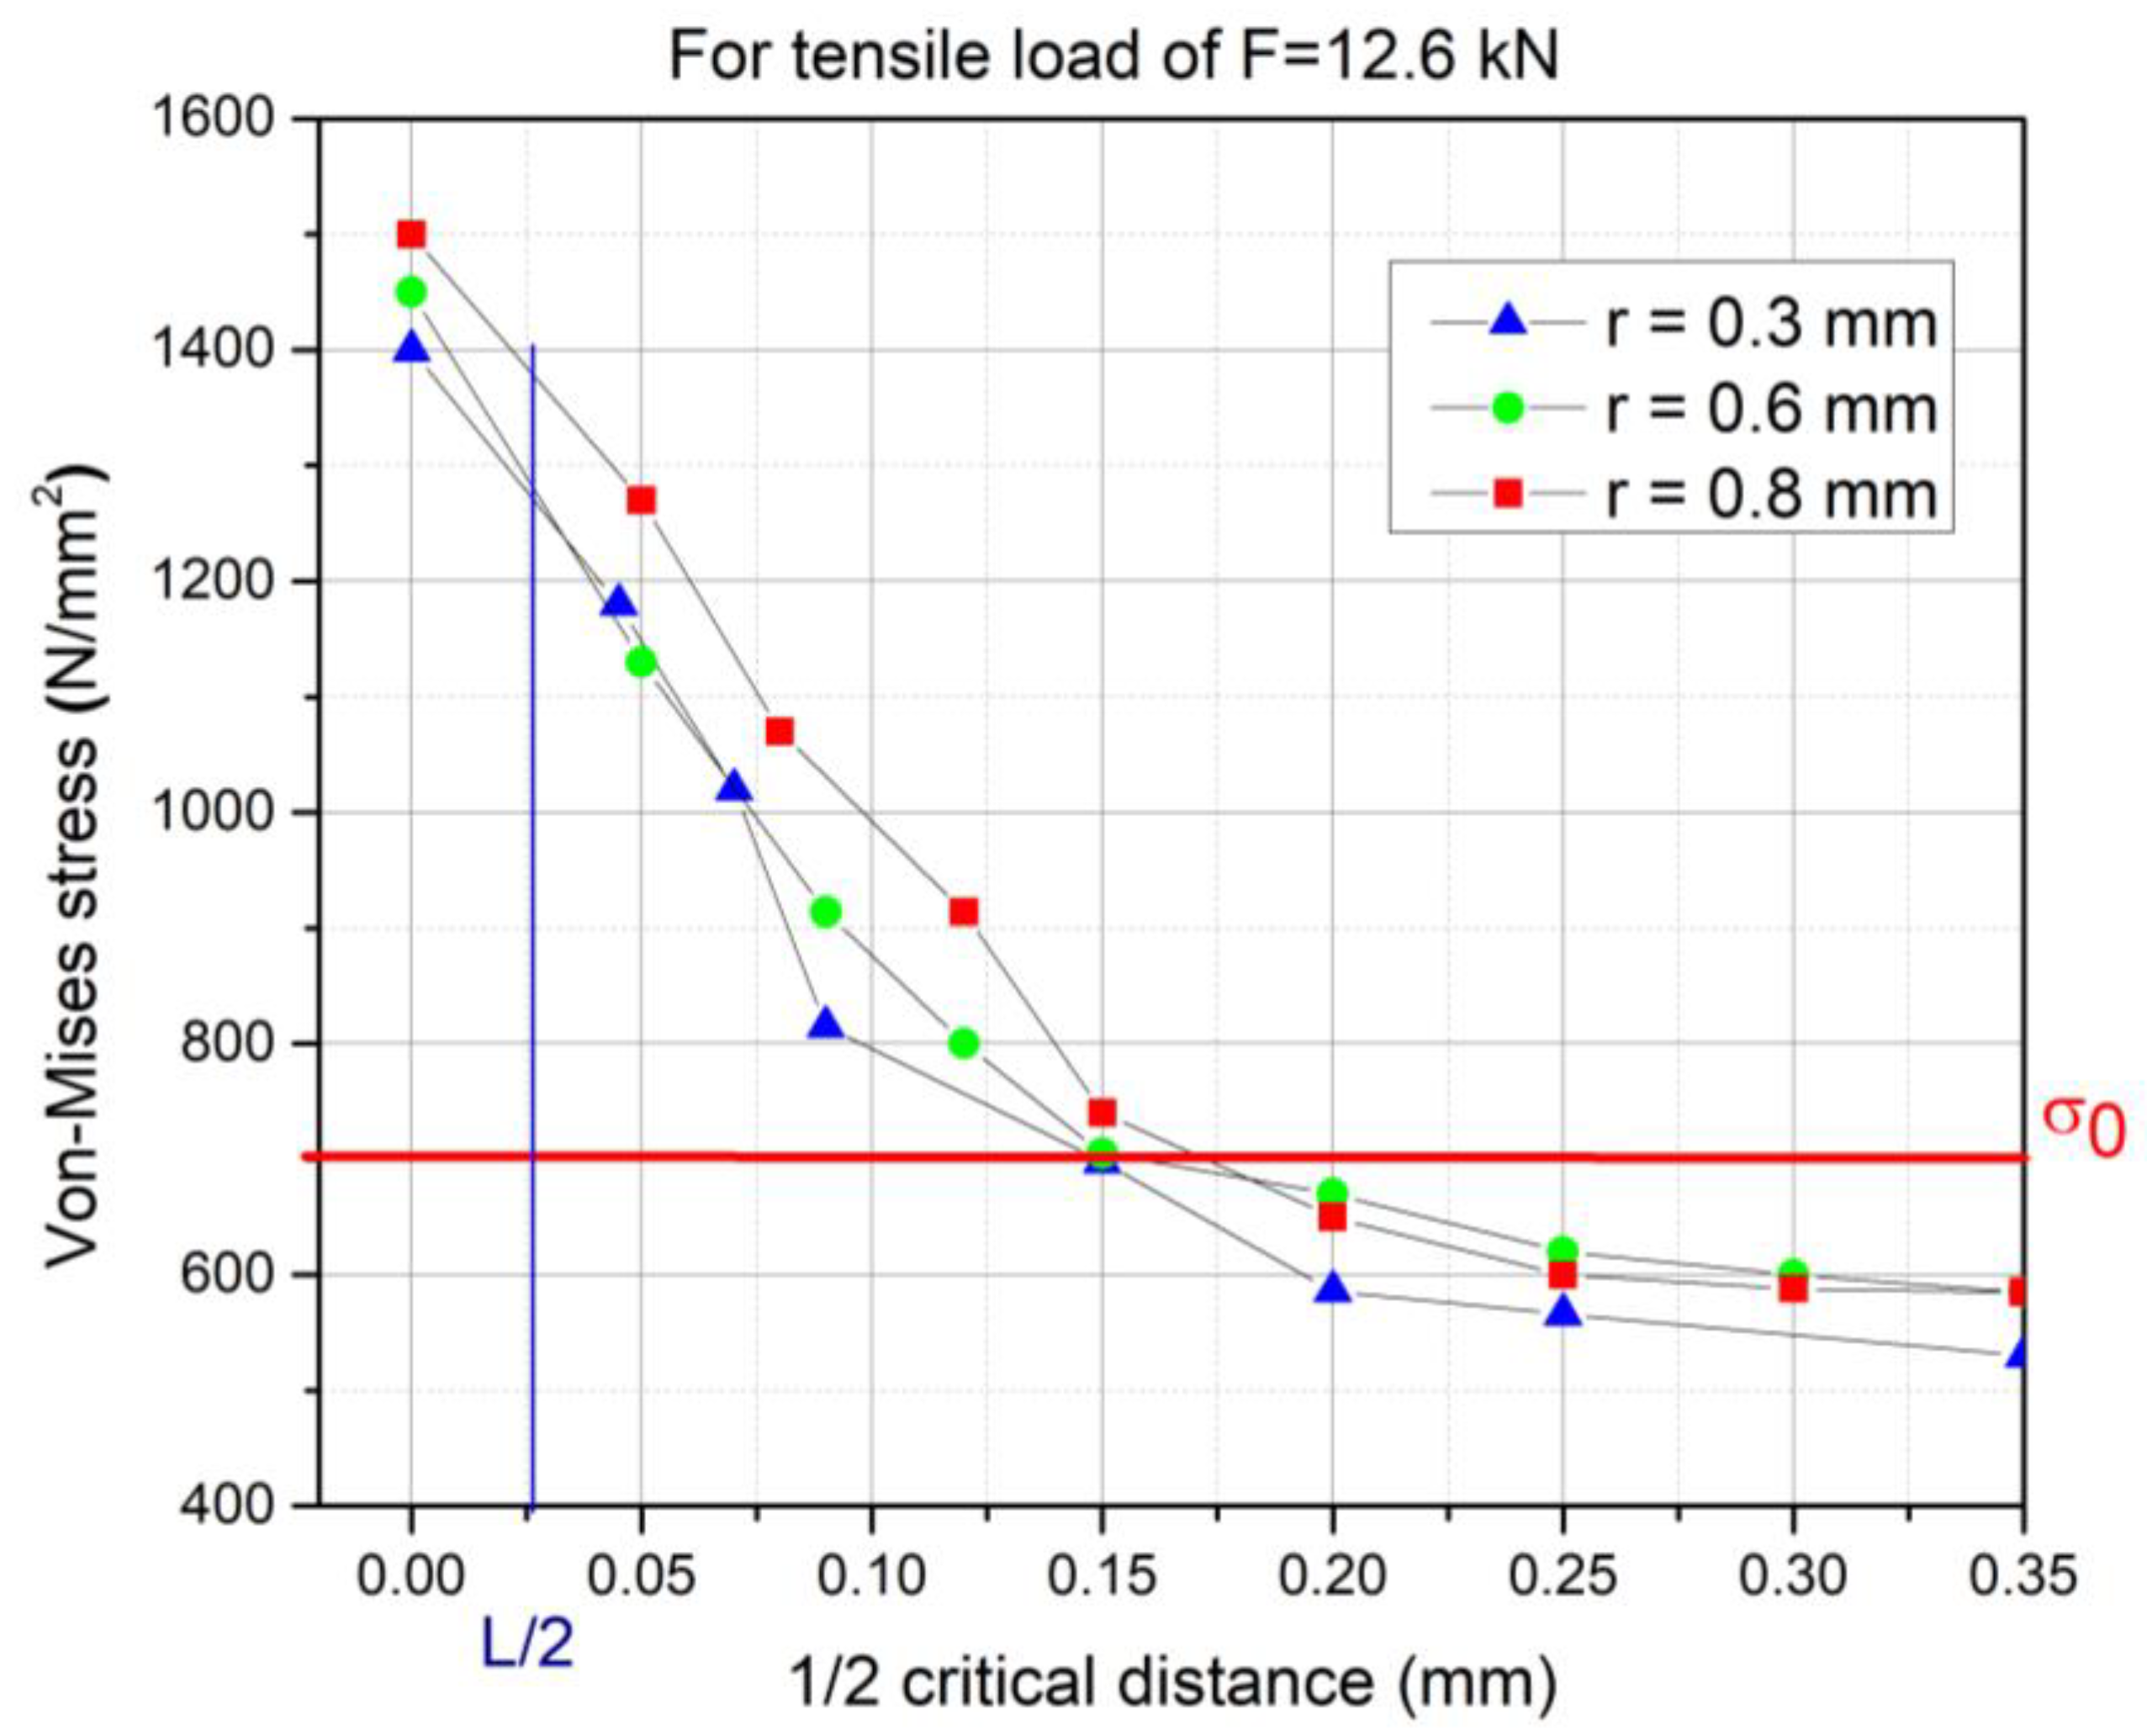
2.3. Theory of Critical Distances

For structural components subjected to in-service time-variable loading, it is well known that the overall fatigue performance of metallic materials is significantly affected by stress concentration phenomena arising from conventional notches. To understand and model the harmful effect of any kinds of geometrical features on the fracture and fatigue behavior of metallic materials, in his well-known book [28], David Taylor recommends using the so-called Theory of Critical Distances (TCD). The TCD assesses the presence of stress raisers by directly post-processing simple linear-elastic FEA. This is one of the key advantages of the TCD. Thanks to its specific features, the TCD is suitable for predicting the fatigue lifetime of notched components, not only in the high-cycle [28], but also in the medium-cycle fatigue regime [29,30].
The different formalizations of the TCD are based on the assumption that fatigue damage in notched metallic components can be quantified accurately, provided that a specific material length scale parameter is incorporated into the stress analysis [28,31,32,33]. In this method, this critical distance is treated as an intrinsic material property, and its value is closely related to the size of the dominant source of microstructural heterogeneity [31]. Another important aspect of TCD in its simplest formulation, is performing the fatigue assessment of notched/cracked ductile metals by directly postprocessing the local stress fields determined by using a linear-elastic constitutive law [25,28]. The importance of the geometry of the corrosion pit was demonstrated by Cerit [34], and the influence on premature failure was demonstrated by Torribio and Valiente [35].
Another important advantage of TCD is the fact that it is the first developed method with implementation of well-known critical distance variables based on Linear Elastic Fracture Mechanics (LEFM) in order to estimate fatigue strength in the high-cycle fatigue regime [36,37]. The required critical distance, L, can be simply calculated based on the Linear Elastic Fracture Mechanics (LEFM) according to following formula [28,38]:
L = 1 / π · K I c / σ t 2 for static loading
L = 1 / π · Δ K t h / σ 0 2 for fatigue loading
where K I c is critical stress intensity factor, σ t is tensile strength, Δ K t h is fatigue threshold, and σ 0 is fatigue strength.
The TCD method uses half of the critical distance calculated in accordance with Formulae (1) and (2) to read the values of the effective stresses from the stress gradients calculated by FEA. The stresses at the distance from the tip of the stress concentration feature (corrosion pit) equal to half of the calculated critical distance are the effective stresses for further comparison with material strength characteristics and assessment or remaining service life.

3. Results and Discussion

After the detailed experiment investigation presented in Section 2.1, the main parameters for FEA and TCD implementation are recognized. The experimentally identified shape and dimensions of damages on the corroded wire for prestressing are modelled by FEA. FEA provides the necessary results of stress state and gradients in the vicinity of stress concentration features due to corrosion damage, as Section 2.2. describes. The obtained FEA results are analyzed based on the Von-Mises equivalent stresses; Figure 11. The cross-sections of the obtained results for Von-Mises equivalent stresses for the different analyzed radii of the pits are drawn and compared with the material characteristics; Figure 12. In Figure 11 and Figure 12, the min–max stress values are presented in the contour-color bar for the zones with stress concentrator analyzed in this research. The values of the output results are given in SI system units. In these figures, the local maximum stresses of the simulated model, which is only the result of the simulation of tensile force at a single node of the finite element model, are excluded, because they are not valuable for the presented discussion. The comparative diagram of stress gradients was prepared based on these FEA results; Figure 13.
In the next step, a very simply procedure for assessment of the conditions of static failure or initiation of fatigue damages is performed by implementation of the Theory of Critical Distances (TCD).
The calculation of critical distance, L, which is necessary for TCD implementation, can be performed by Equations (1) and (2). For the statical loading case, the experimentally determined value of tensile strength is taken from Table 3 ( σ t = 1483 MPa), and critical stress intensity factor is taken from the literature [39] ( K I c = 84   M P a m ):
L = 1 / π · K I c / σ t 2 = 1 / π · 84 / 1483 2 = 1.02   mm
The value obtained from Equation (3) for half of the critical distance for statical loading (0.51 mm) is far from the zone with intensive stress gradients, as shown at the cross-sections in Figure 12. Therefore, for the specified real investigated prestressing wire, further consideration of static loading for life assessment calculation is not necessary.
For the fatigue loading case, the fatigue strength can be calculated based on the correlation with material hardness. According to values for hardness of the specified steel grade, taken from the experiments of Casagrande et al. [40], the estimated value of fatigue strength for this particular wire is:
σ 0 = 1.6 · HV = 1.6 · 440 = 700   MPa
and the value of fatigue strength is taken from the literature [41] and is equal to 9 MPa m .
The critical distance can be calculated in accordance with Formula (2):
L = 1 / π · Δ K t h / σ 0 2 = 1 / π · 9 / 700 2 = 0.053   mm
Half of the obtained critical distance is shown with a blue line and marked as L/2 in the diagram of FEA-calculated stress gradients; Figure 13.
After completion of the diagrams, Figure 13, the effective stresses for different dimensions of stress concentrator can be read at the intersections of the blue line, presenting a value of L/2, and the stress gradient diagrams. Conclusions regarding the remaining service life of these corroded elements can be defined based on considering two different loading cases (static and fatigue). For the static loading case, the critical value of stresses is equal to the tensile strength given in Table 3 (with an average value of 1483 MPa). It is obvious that in the presented case-study the tested corroded wires have high safety for static loading. For fatigue, the same read values are compared with fatigue strength, given by Equation (4), and equal to 700 MPa. It can be concluded from this comparison that the tested corroded wires have reduced load capacity for fatigue loading. Therefore, the testing elements have a high possibility for fatigue failure if the construction is continuously subjected to fatigue loading.
The implication of the previous discussion is that this methodology enables the determination of the critical size of a pit at the corroded element for static load, as well as for fatigue. This means that the periodical implementation of the developed methodology on structures still in use can prevent catastrophic failures.

4. Conclusions

The presented research of corroded steel elements for reinforced concrete shows that different research points in this problem are still open for investigation. This conclusion is also verified by other authors [42]. The new methodology for the life assessment and load capacity of these corroded elements is explain and verified. The main highlights and conclusions of the presented research are as follows:
(1)
The developed methodology has a specific potential for investigation of the elements of concrete prestressing that have already been in use for many years;
(2)
The developed methodology presents a unique set of already well-known methods (experimental testing, visual examination, chemical characteristics, tensile testing, Finite Element Analysis, and Theory of Critical Distances), coupled with specific connections in an original methodology for estimation of the remaining life of investigated structures;
(3)
The presented procedure gives the possibility for assessing the remaining service life of corroded elements in current use, obtained with consideration of two different loading cases (static and fatigue);
(4)
The obtained results in the presented case-study show that the tested corroded wires have reduced load capacity for fatigue loading and high safety for static loading. Because the construction (railway bridge) investigated in this research is not subjected to the fatigue loading case continuously, the static loading case can be considered as the critical loading case. This is in line with the fact that these elements are still in use after 45 years, and is also supported by the experimental results given in this paper, which show that the tensile strength of the tested wire samples is reduced by only 5.5%;
(5)
The results can be used for effective determination of the critical size of a pit at the corroded element, i.e., by the periodical implementation of the presented methodology, catastrophic failures can be prevented.
Finally, it can be concluded that the main advantage and contribution of the presented methodology is the possibility to quantify the conditions of occurrence of both static and fatigue fracture. The developed methodology has a high potential for implementation on different geometric stress concentrators, separately or grouped, in order to give prompt and accurate prediction of the life assessment of engineering structures, particularly for damaged elements with arbitrary geometry features. The very specific and state-of-the-art perspectives of the proposed method could be used in the field of artificial intelligence as a part of health monitoring systems.

Author Contributions

Conceptualization, D.M. and I.A.; methodology, I.A.; validation, D.M., I.A. and S.V.; experimental investigation, D.M.; supervision, I.A. and A.P.; writing—original draft preparation, D.M. and I.A.; writing—review and editing, S.V. and A.P.; visualization, D.M. and I.A. All authors have read and agreed to the published version of the manuscript.

Funding

This research was funded by the Ministry of Education, Science and Technological Development, Republic of Serbia, Grant numbers: 451-03-68/2022-14/200012; 451-03-68/2022-14/20029; 451-03-9/2021-14/200378.

Institutional Review Board Statement

Not applicable.

Informed Consent Statement

Not applicable.

Data Availability Statement

Not applicable.

Conflicts of Interest

The authors declare no conflict of interest.

References

  1. Cui, K.; Liang, K.; Chang, J.; Lau, D. Investigation of the macro performance, mechanism, and durability of multiscale steel fiber reinforced low-carbon ecological UHPC. Constr. Build. Mater. 2022, 327, 126921. [Google Scholar] [CrossRef]
  2. Cui, K.; Chang, J. Hydration, reinforcing mechanism, and macro performance of multi-layer graphene-modified cement composites. J. Build. Eng. 2022, 57, 104880. [Google Scholar] [CrossRef]
  3. Broomfield, J.P. Corrosion of Steel in Concrete: Understanding, Investigation and Repair, 3rd ed.; CRC Press: Boca Raton, UK, 2023. [Google Scholar] [CrossRef]
  4. Dixit, M.; Gupta, A.K. A Review of Different Assessment Methods of Corrosion of Steel Reinforcement in Concrete. Iran J. Sci. Technol. Trans. Civ. Eng. 2022, 46, 735–752. [Google Scholar] [CrossRef]
  5. Yang, J.; Guo, T.; Chai, S. Experimental and numerical investigation on seismic behaviours of beam-column joints of precast prestressed concrete frame under given corrosion levels. Structures 2020, 27, 1209–1221. [Google Scholar] [CrossRef]
  6. Kioumarsi, M.; Benenato, A.; Ferracuti, B.; Imperatore, S. Residual Flexural Capacity of Corroded Prestressed Reinforced Concrete Beams. Metals 2021, 11, 442. [Google Scholar] [CrossRef]
  7. De Queiroz, J.P.T.; Cunha, M.L.; Pavlovic, A.; Rocha, L.A.O.; Dos Santos, E.D.; Troina, G.D.S.; Isoldi, L.A. Geometric evaluation of stiffened steel plates subjected to transverse loading for naval and offshore applications. J. Marine Sci. Eng. 2019, 7, 7. [Google Scholar] [CrossRef]
  8. Hao Zhang, H.; Wang, L.; Li, J.; Kang, F. Embedded PZT aggregates for monitoring crack growth and predicting surface crack in reinforced concrete beam. Const. Build. Mater. 2023, 364, 129979. [Google Scholar] [CrossRef]
  9. Chuanjie, C.; Airong, C.; Rujin, M. An improved continuum damage mechanics model for evaluating corrosion–fatigue life of high-strength steel wires in the real service environment. Int. J. Fatigue 2020, 135, 105540. [Google Scholar] [CrossRef]
  10. Jie, Z.; Berto, F.; Susmel, L. Fatigue behaviour of pitted/cracked high-strength steel wires based on the SED approach. Int. J. Fatigue 2020, 135, 105564. [Google Scholar] [CrossRef]
  11. Turnbull, A.; Horner, D.A.; Connolly, B.J. Challenges in modelling the evolution of stress corrosion cracks from pits. Eng. Frac. Mech. 2009, 76, 633–640. [Google Scholar] [CrossRef]
  12. Turnbull, A.; Wright, L.; Crocker, L. New insight into the pit-to-crack transition from finite element analysis of the stress and strain distribution around a corrosion pit. Corr. Sci. 2010, 52, 1492–1498. [Google Scholar] [CrossRef]
  13. Lan, C.; Xu, Y.; Liu, C.; Li, H.; Spencer, B.F., Jr. Fatigue life prediction for parallel-wire stay cables considering corrosion effects. Int. J. Fatigue 2018, 114, 81–91. [Google Scholar] [CrossRef]
  14. Wang, G.; Ma, Y.; Wang, L.; Zhang, J. Experimental study and residual fatigue life assessment of corroded high-tensile steel wires using 3D scanning technology. Eng. Fail. Anal. 2021, 124, 105335. [Google Scholar] [CrossRef]
  15. Susmel, L.; Taylor, D. On the use of the Theory of Critical Distances to predict static failures in ductile metallic materials containing different geometrical features. Eng. Frac. Mech. 2008, 75, 4410–4421. [Google Scholar] [CrossRef]
  16. Taylor, D. Applications of the theory of critical distances in failure analysis. Eng. Fail. Anal. 2011, 18, 543–549. [Google Scholar] [CrossRef]
  17. Martínez, J.M.G.; Adriano, V.S.R.; Araújo, J.A.; Ferreira, J.L.A.; da Silva, C.R.M. Geometrical size effect in the fatigue life predictions of aluminum wires with micro holes using methods of the critical distance. Eng. Frac. Mech. 2019, 209, 147–161. [Google Scholar] [CrossRef]
  18. Jie, Z.; Susmel, L. High-strength steel wires containing corrosion pits: Stress analysis and critical distance based fatigue life estimation. Fatigue Frac. Eng. Mater. Struct. 2020, 43, 1611–1629. [Google Scholar] [CrossRef]
  19. Terekhina, A.; Kostina, A.; Plekhov, O.; Susmel, L. Elasto-plastic TCD as a method of failure prediction. Proc. Struct. Integ. 2017, 5, 569–576. [Google Scholar] [CrossRef]
  20. Mitrovic, R.; Momcilovic, D.; Atanasovska, I. Assessment of the effect of pitting corrosion on fatigue crack initiation in hydro turbine shaft. AMR 2013, 633, 186–196. [Google Scholar] [CrossRef]
  21. Atanasovska, I.; Jelic, M.; Mitrovic, R.; Momcilovic, D. The influence of corrosion on stress concentration factor at shaft to flange radius. In Mechanisms and Machine Science (Book Series); Ceccarelli, M., Ed.; Springer Science: Berlin/Heidelberg, Germany; Business Media Dordrecht: Berlin/Heidelberg, Germany, 2013; Volume 13, pp. 657–666. [Google Scholar] [CrossRef]
  22. Momcilovic, D.; Mitrovic, R.; Atanasovska, I.; Vuherer, T. Methodology of determination the influence of corrosion pit on decrease of hydro turbine shaft fatigue life. J. Mach. Des. 2012, 4, 231–236. [Google Scholar]
  23. Atanasovska, I.; Momcilovic, D. Spur gear model for prediction of fatigue damage initiation in contact zone. Int. J. Powertrains 2016, 5, 213–229. [Google Scholar] [CrossRef]
  24. Momcilovic, D.; Mitrovic, R.; Atanasovska, I. Stress Concentration and Fatigue—Novel Approach on Mechanical Design; Faculty of Mechanical Engineering, University in Belgrade: Belgrade, Serbia, 2016; ISBN 978-86-7083-915-1. (In Serbian) [Google Scholar]
  25. Hobst, L.; Zajic, J. Anchoring in Rock and Soil; Elsevier: Amsterdam, The Netherlands, 1983. [Google Scholar]
  26. Rocha, P.H.C.; Díaz, J.I.M.; Silva, C.R.M.; Araújo, J.A.; Castro, F.C. Fatigue of two contacting wires of the ACSR Ibis 397.5 MCM conductor: Experiments and life prediction. Int. J. Fatigue 2019, 127, 25–35. [Google Scholar] [CrossRef]
  27. Pavlovic, A.; Fragassa, C. Numerical modelling of ballistic impacts on flexible protection curtains used as safety protection in woodworking. Proc. Inst. Mech. Eng. Part C J. Mech. Eng. Sci. 2017, 231, 44–58. [Google Scholar] [CrossRef]
  28. Taylor, D. The Theory of Critical Distances: A New Perspective in Fracture Mechanics; Elsevier: Oxford, UK, 2007. [Google Scholar]
  29. Susmel, L.; Taylor, D. A novel formulation of the Theory of Critical Distances to estimate lifetime of notched components in the medium-cycle fatigue regime. Fatigue Frac. Eng. Mater. Struct. 2007, 30, 567–581. [Google Scholar] [CrossRef]
  30. Susmel, L.; Taylor, D. The Theory of Critical Distances to estimate lifetime of notched components subjected to variable amplitude uniaxial fatigue loading. Int. J. Fatigue. 2011, 33, 900–911. [Google Scholar] [CrossRef]
  31. Susmel, L. Multiaxial Notch Fatigue: From Nominal to Local Stress-Strain Quantities; Woodhead & CRC: Cambridge, UK, 2009. [Google Scholar]
  32. Susmel, L. The Theory of Critical Distances: A review of its applications in fatigue. Eng. Frac. Mech. 2008, 75, 1706–1724. [Google Scholar] [CrossRef]
  33. Louks, R.; Gerin, B.; Draper, J.; Askes, H.; Susmel, L. On the multiaxial fatigue assessment of complex three-dimensional stress concentrators. Int. J. Fatigue 2014, 63, 12–24. [Google Scholar] [CrossRef]
  34. Cerit, M.; Genel, K.; Eksi, S. Numerical investigation on stress concentration of corrosion pit. Eng. Fail. Anal. 2009, 16, 2467–2472. [Google Scholar] [CrossRef]
  35. Toribio, J.; Valiente, A. Failure analysis of cold drawn eutectoid steel wires for prestressed concrete. Eng. Fail. Anal. 2006, 13, 301–311. [Google Scholar] [CrossRef]
  36. Tanaka, K. Engineering formulae for fatigue strength reduction due to crack-like notches. Int. J. Fracture 1983, 22, R39–R45. [Google Scholar] [CrossRef]
  37. Taylor, D. Geometrical effects in fatigue: A unifying theoretical model. Int. J. Fatigue. 1999, 21, 413–420. [Google Scholar] [CrossRef]
  38. El Haddad, M.H.; Topper, T.H.; Smith, K.N. Prediction of nonpropagating cracks. Eng. Frac. Mech. 1979, 3, 573–584. [Google Scholar] [CrossRef]
  39. Toribio, J. Stress-Corrosion of Cold Drawn Prestressing Steels in Simulation of Electrochemical Processes; Wessex Institute of Technology: Ashurst Lodge, UK, 2005; p. 228. [Google Scholar]
  40. Casagrande, A.; Cammarota, G.P.; Micele, L. Relationship between fatigue limit and Vickers hardness in steels. Mater. Sci. Eng. A 2011, 528, 3468–3473. [Google Scholar] [CrossRef]
  41. Verpoest, I.; Aernoudt, E.; Deruyttere, A.; De Bondt, M. The fatigue threshold, surface condition and fatigue limit of steel wire. Int. J. Fatigue 1985, 7, 199–214. [Google Scholar] [CrossRef]
  42. Benes, L.; Mouralova, K.; Midula, P.; Snow, J.; Lysonkova, I.; Pilnaj, D.; Burdova, H.; Prokes, T.; Zahradnicek, R.; Fries, J.; et al. The Corrosion Behavior of WEDM Machined Stainless Steels in a Pyrolysis Environment. Metals 2023, 13, 144. [Google Scholar] [CrossRef]
Figure 1. Methodology for life assessment of corroded wire for prestressing.
Metals 13 00387 g001
Figure 2. Sampling spot of corroded wires with 40-mm diameter ducts.
Metals 13 00387 g002
Figure 3. Detail of sampling spot of corroded wires.
Metals 13 00387 g003
Figure 4. The width of the smallest determined corrosion damage. The yellow line marks observation path on HIROX 2000.
Metals 13 00387 g004
Figure 5. The length of the greatest detected surface corrosion damage.
Metals 13 00387 g005
Figure 6. Three-dimensional profile of corrosion damage after checking with a microscope, HIROX RH2200. The result is derived from the profile marked with the yellow line shown in Figure 4.
Metals 13 00387 g006
Figure 7. Cross section of corrosion pit from Figure 5.
Metals 13 00387 g007
Figure 8. Tensile testing of wire sample.
Metals 13 00387 g008
Figure 9. Subsurface corrosion damage on visually uncorroded surface.
Metals 13 00387 g009
Figure 10. Finite element model of wire with a semi-spherical corrosion pit with a radius of 0.8 mm: (a) Loading definition; (b) Detail of a finite element model in the zone of the modelled pit.
Metals 13 00387 g010
Figure 11. Von-Mises equivalent stresses for a wire with a semi-spherical corrosion pit with a radius of 0.8 mm: (a) Contour plot; (b) Cross-section plot.
Metals 13 00387 g011
Figure 12. Detail of the cross-section plot of Von-Mises equivalent stresses for a wire with semi-spherical corrosion pits with different radii: (a) 0.3 mm; (b) 0.6 mm; (c) 0.8 mm.
Metals 13 00387 g012aMetals 13 00387 g012b
Figure 13. Comparative diagram of stress gradients and TCD method implementation.
Metals 13 00387 g013
Table 1. Dimension control of samples.
Sample Nr.Cross-Sectional Area of Samples
A0 (mm²)
Calculated Diameter
d (mm)
Deviation from Nominal Diameter
(%)
115.90434.50−10.00
215.97514.51−9.80
316.04604.52−9.60
415.97514.51−9.80
516.04604.52−9.60
615.90434.50−10.00
715.90434.50−10.00
816.05904.53−9.40
915.97514.51−9.80
1015.90454.50−10.00
Average Values15.98934.51−9.76
Nominal Values19.234 ÷ 20.0195 ± 0.05max ± 1%
Table 2. Chemical composition of corroded wire.
%C%Mn%Si%P%S%Cr%V%Al
0.670.880.350.0280.0210.210.04traces
Table 3. Tensile test results.
Sample Nr.Elasticity Modulus
(GPa)
Tensile Strength σt (MPa)Elongation (%)
119614565.1
219715074.7
319615094.9
419614365.4
519815194.3
619714825.1
719614915.0
819914665.5
919814845.3
Average Values19714835.0
Reference Value [25]20015704.0
Disclaimer/Publisher’s Note: The statements, opinions and data contained in all publications are solely those of the individual author(s) and contributor(s) and not of MDPI and/or the editor(s). MDPI and/or the editor(s) disclaim responsibility for any injury to people or property resulting from any ideas, methods, instructions or products referred to in the content.

