Abstract
Fracture failure of super 13Cr can occur in complex and harsh environments such as high temperature, high pressure, and corrosive gas wells, which damages the economic benefit of oil and gas development and also poses a great threat to wellbore integrity. Therefore, it is urgent to study the corrosion mechanism of super 13Cr tubing in oil and gas wells, and this study performed an on-site experimental analysis on failed super 13Cr tubing, employing the microarea electrochemical scanning Kelvin probe (SKP) method to investigate the causes of corrosion of super 13Cr material. In addition, the thermodynamics of the mechanism by which pits turn into cracks was examined in light of the experimental findings on the nucleation and development of pitting corrosion. The findings reveal scale and clear pits on the surface of the failed super 13Cr tubing and that CaCO3 as well as FeCO3 are the scale’s primary constituents. According to the SKP scan results, the super 13Cr tubing has a risk of pitting under wells, and the galvanic cell with microcorrosion is the primary cause of pitting corrosion, which also shows that the potential difference between the anode area and the cathode area of the super 13Cr material gradually increases with the increase in immersion time. Under the autocatalytic effect of the occlusive corrosion cell and the applied load, the corrosion pits and cracks of super 13Cr tubing propagate, eventually leading to tubing breaks and failure.
1. Introduction
Since super 13Cr tubing has superior mechanical qualities and great corrosion resistance, it is frequently used in ultra-deep, high-temperature, high-pressure, and other challenging environments where oil and gas exploitation has continued to advance [1]. However, the fracture failure phenomenon of super 13Cr tubing can occur due to its own characteristics and the effects of complex and harsh environments [2]. In one gas field of China, the average well depth exceeds 5000 m, the bottom hole temperature is 100~170 °C, the bottom hole pressure can reach 100 MPa, and with the CO2 partial pressure up to 3.5 MPa and Cl− content as high as 150,000 mg/L, the medium is highly corrosive. For the severe downhole condition, many failure accidents of super 13Cr tubing happen. To date, there has been 17 wells whose tubing has failed, accounting for 15.5% of the production wells in this block. The failure of the tubing will impact the well integrity, lead to production suspension and expensive workover operation, and even cause leakage, blowouts, and other accidents, posing a great threat to the safety of on-site production and personnel [3].
At present, scholars have carried out a lot of research on the corrosion behavior of super 13Cr tubing. Wang, Zhang, and Liu et al. have studied the corrosion mechanism of super 13Cr tubing in different environments [4,5,6], Ngomo and Morana et al. analyzed the influence of different environmental factors on the corrosion behavior of super 13Cr tubing materials [7,8]. However, the preceding research primarily focuses on the corrosion of CO2 environments or CO2/H2S coexistence environments, and there are relatively few reports on the scaling and corrosion analysis of fracture failure of super 13Cr tubing.
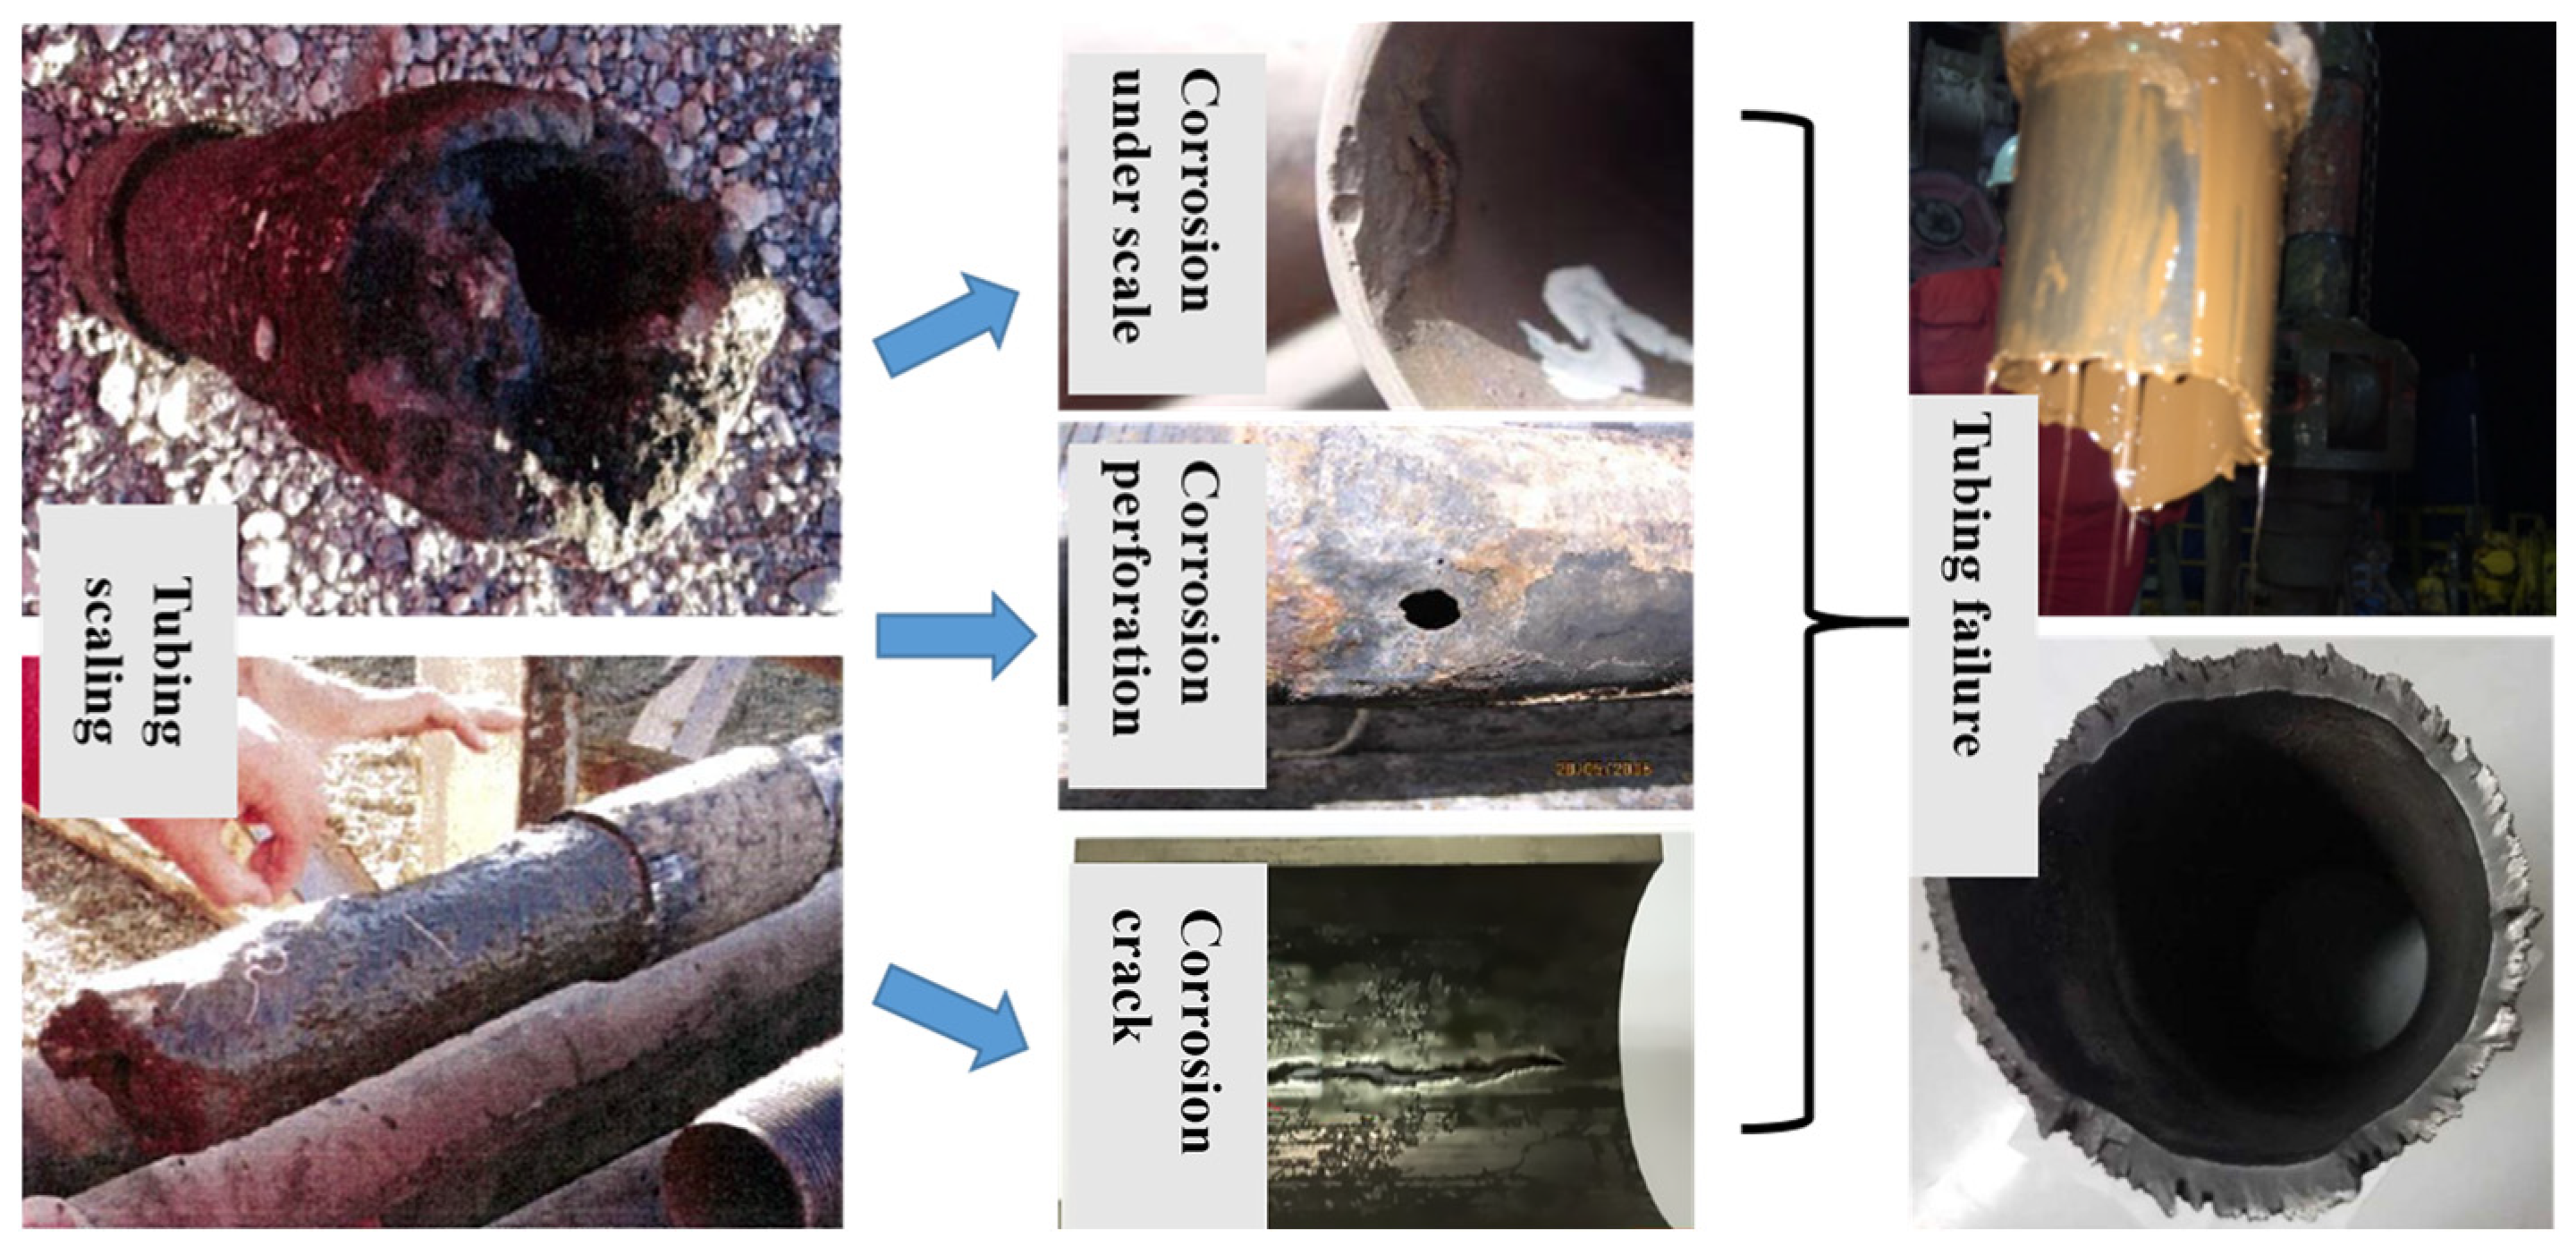
During the production process of oil and gas wells, particularly in complex and high-temperature and high-pressure downhole environments, the flow and phase state of fluid in the tubing are complex; additionally, the formation fluid contains a significant amount of acid gas and salt-containing ions, and the temperature, pressure, flow rate, pH value, and other factors of the fluid in the wellbore are constantly changing, which can easily lead to scaling on the inner surface of the tubing, and result in corrosion, bubbling, and pitting of tubing under scale [9,10]. Pits can easily induce cracks under the action of autocatalytic effect and applied load, which will lead to the fracture of the tubing. Taking one failure case as an example, it can be seen from the fractured tubing taken out of an oil field that the surface of the tubing was severely scaled. Tubing scaling can promote three type of corrosion failure on site, including corrosion under scale, corrosion perforation and corrosion crack, which eventually developed into tubing failure and posed a great threat to the tubing integrity (Figure 1).

Figure 1.
Morphological Diagram of On-site Tubing Scaling and Corrosion under Scale.
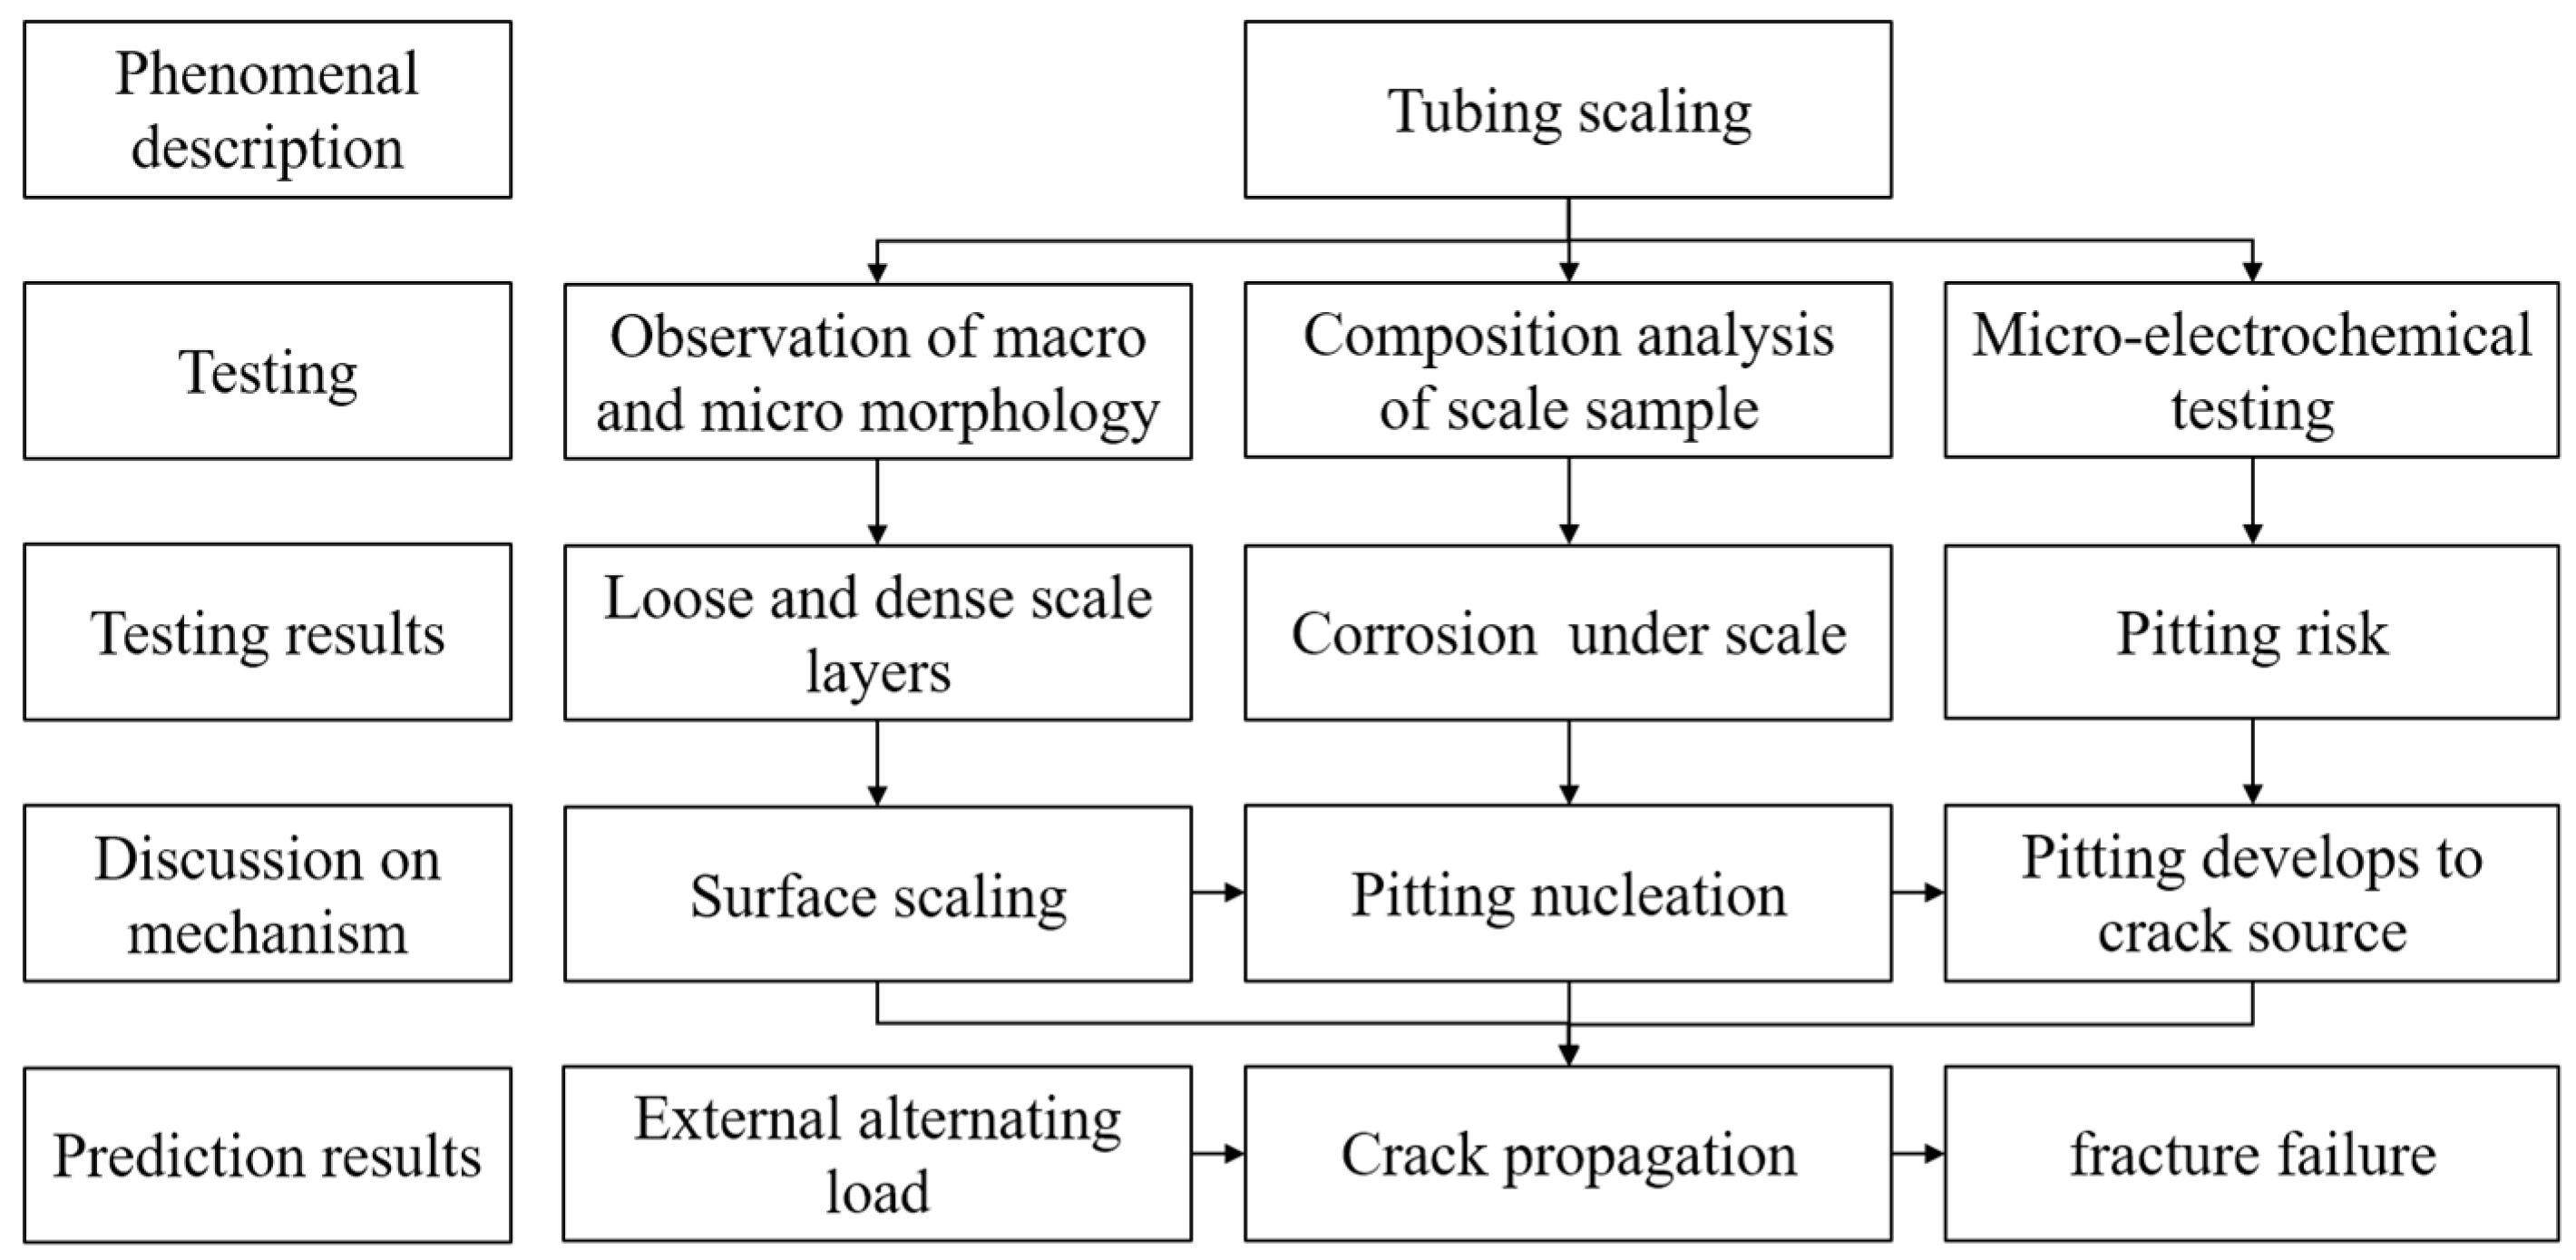
Therefore, in order to provide reference for the corrosion prevention of tubing in similar environments, this study examined the corrosion and scale formation of failed super 13Cr tubing on site, investigated the causes of corrosion under scale using the microarea electrochemical scanning Kelvin probe (SKP) test, and examined the formation and development of pitting corrosion under tubing scale. The research concept is shown in Figure 2.
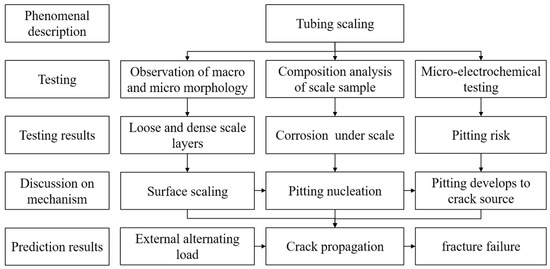
Figure 2.
Schematic Diagram of Research Concept in This Paper.
2. Materials and Methods
2.1. Test Materials
The super 13Cr tubing (UNS S41426) in well X of oil field A is used as the experimental material in this paper. Carbon and sulfur analysis methods were used to test the chemical composition, and the results are shown in Table 1. The well was developed in 2010, with a reservoir buried depth of 6765 m, an original formation temperature of 165.7 degrees Celsius, a temperature gradient of 2.45 °C/100 m, an original formation pressure of 76.05 MPa, a saturation pressure of 16.32 MPa, and a pressure coefficient at 1.35. The produced gas contains 10.2% CO2 on average and a trace of H2S (0.0038~0.2000%). Formation water is high in CaCl2, partially acidic (pH = 6.40), with a high degree of mineralization (21 × 104 mg/L) and a high Cl− content (15 × 104 mg/L).

Table 1.
Chemical Composition Test Results of Super 13Cr Tubing (wt%, PREN = 19.89) of Well X.
Some combustible gas was detected in the annulus during the production of well X, so repair work started. After the tubing was pulled out, it was discovered that severe corrosion and scaling had occurred. Corrosion in well X can be divided into 3 categories: above 1600 m, the surface of tubing is rough and no obvious corrosion is found; 1600~2947 m, the outer wall of tubing has obvious corrosion, and the corrosion degree increases with the depth; and below 3950 m, there is obvious corrosion on the outer wall of tubing, and some parts have about 1 mm perforation. Based on this, we needed to select the most serious part of the corrosion and conduct a series of tests and analysis to find out the cause and mechanism of corrosion. As a result, we took one section of tubing below 3950 m, and took samples of 10 mm × 10 mm × 3 mm from two areas of this section, as shown in Figure 3. Samples from area 1 had cracks, which were used for metallographic analysis and crack observation. There were pitting pits in area 2, so we use samples in this area for SKP testing. In addition, the structure of the corrosive substance adhered to the inner wall of the tubing was tested and analyzed by XRD. All the samples were sealed with epoxy resin, and polished by grades to 2000 meshes with waterproof abrasive paper, then burnished, degreased with acetone, and dried for standby application.
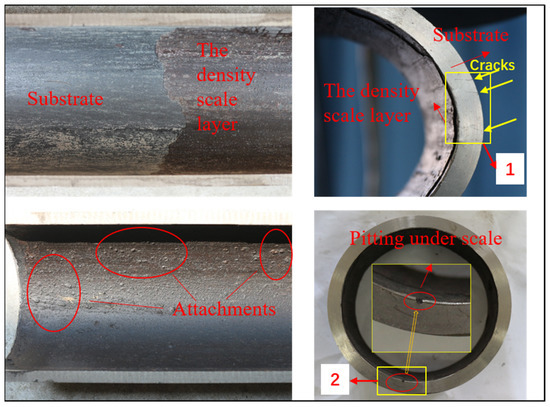
Figure 3.
Corrosion Morphology of Failed Tubing in Well X and Schematic Diagram of Test Sampling Area.
2.2. Test Methods
A ZSA302 integrated microscope is provided by the manufacturer Chongqing Photoelectric Instrument Co., Ltd. In Chongqing, China and it was used to examine the macroscopic morphology of the inner surface of the tubing. ZEISS EV0 MA15 scanning electron microscope (SEM) is bought from the manufacture Carl Zeiss Microimage Co., Ltd in Oberkochen, Germany and it was used to examine the micromorphology of the corrosion layer. X Pert PRO MPD X-ray diffraction (XRD) instrument is bought from the manufacture PANalytical B.V. in Almelo, Netherlands, and it was used to examine the material with Cu Kα radiation (λ = 0.154060 nm) over an angle range of 2θ values from 10°~80°.
Each sample taken from area 2 in Figure 3 was immerged in the formate solution of the oil field for 12, 24, 36, 48, and 72 h. The composition of the formate solution was H2O + 1%Na2SO3 + 1%SA + 0.5%NaOH + HCOONa + 1.5~2%TC-3 + 1%WD-T + 0.8%SAT, and its density was 1.3 g/cm3. Then, samples were removed from the solution, rinsed with deionized water, and allowed to air dry, after which the scanning Kelvin probe testing was conducted. The manufacturer of VersaScan scanning Kelvin probe (AMETEK, Inc. Berwyn, PA, U.S.A.) is Princeton Applied Research in America and the probe was used with the Princeton Versa Scan electrochemical scanning workstation, also made by Princeton Applied Research (PAR) (). The test was conducted in ambient temperature, with the relative humidity of RH60%, in Sweep Scan mode. The diameter of the tungsten wire probe was 50 μm, scanning step was 100 μm, scanning rate was 50 μt/s, the scanning scope was 4 × 4 mm, the vibration amplitude of probe was 30 μm, the average distance between probe and surface of the sample was kept at 100 μm, and a saturated calomel electrode (SCE) was used to calibrate the scanning Kelvin probe test system before testing.
2.3. Simulation Method
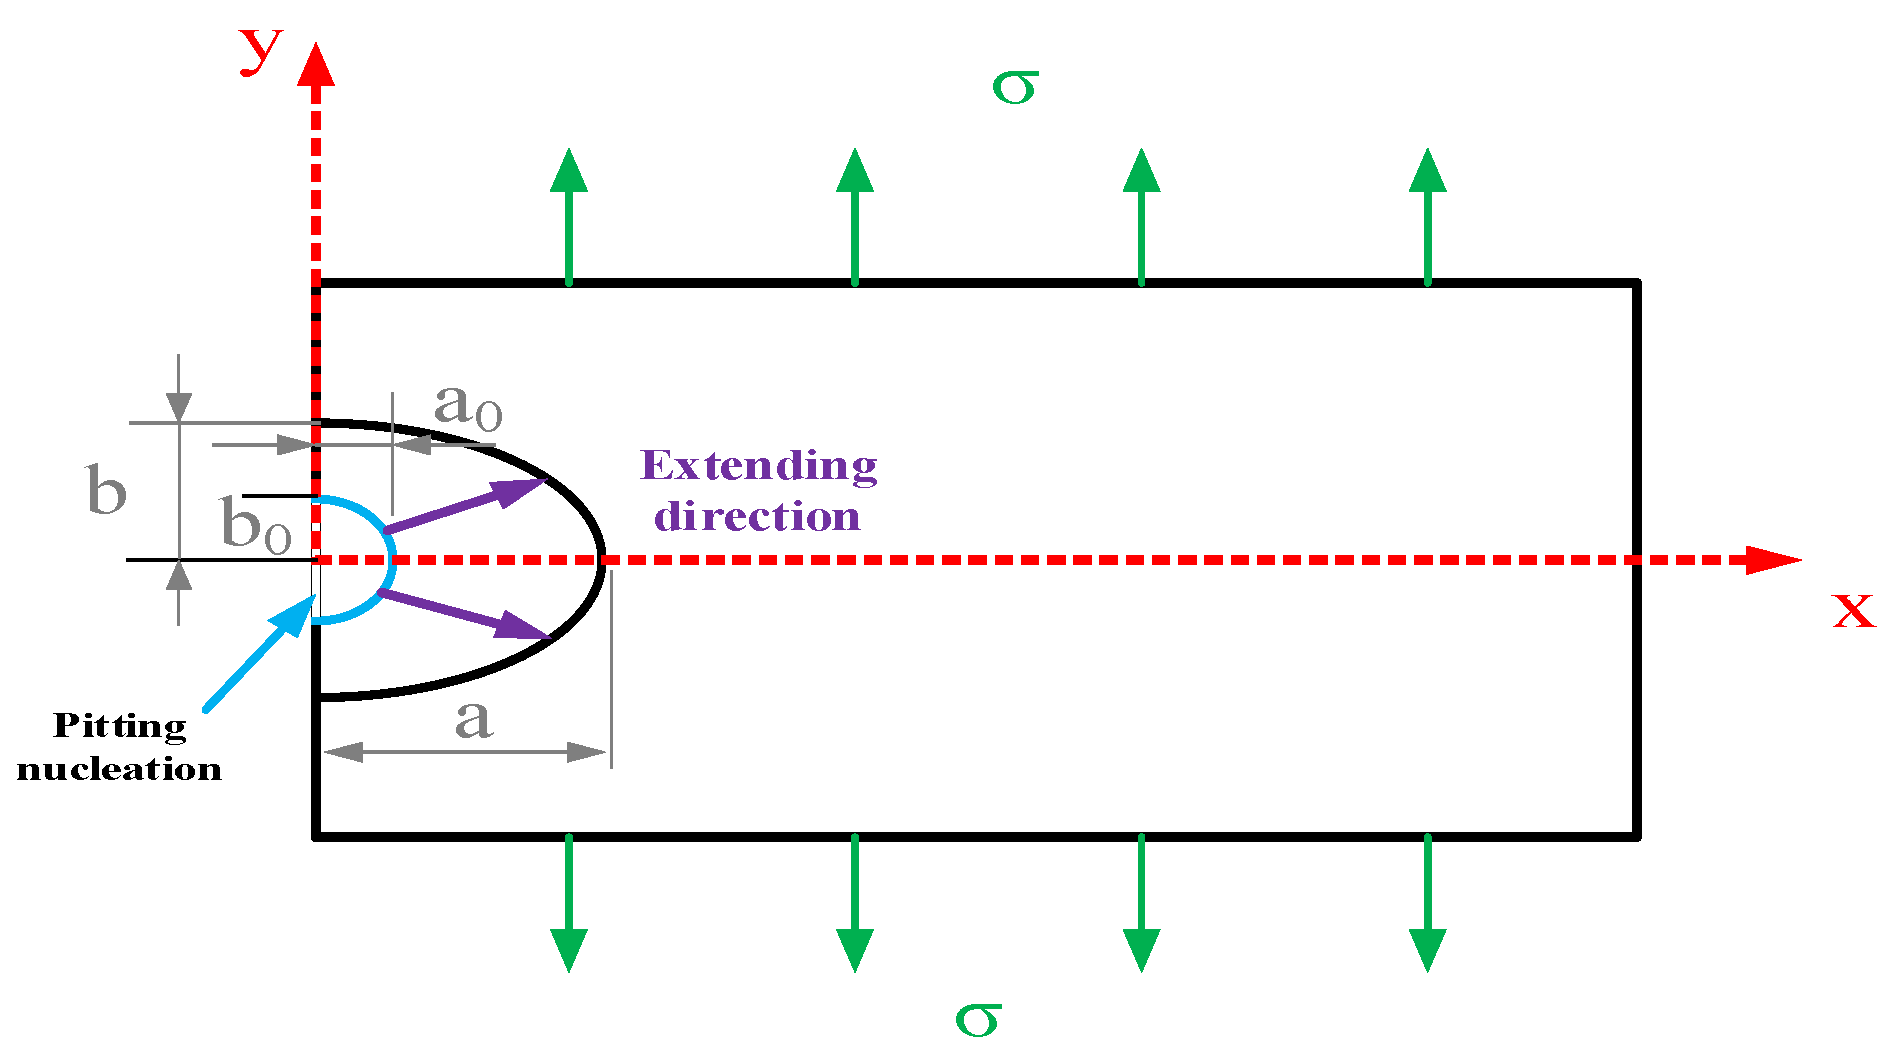
In order to further discuss the relationship between the pitting corrosion development process and pitting-induced stress corrosion cracking, the model of pitting corrosion developing into a crack source was developed. Consider a scenario where a corrosion pit forms on the surface of an infinitely large elastomer in a corrosive solution, and the pit grows into a crack as a result of an external force, as shown in Figure 4. Introduce the elliptic shape parameter m and consider the pitting model as the half-elliptic form given below:
where a is the major semi-axis of the ellipse and b is the minor semi-axis.

Figure 4.
Schematic Diagram of the Development Direction of Pitting Corrosion.
Pitting turning into a crack source is an irreversible thermodynamic process [11], which ultimately results in a change in energy at the pit. This change will unquestionably lead to a change in the material’s internal structure, which will then impact the material’s mechanical properties. The thermodynamic potential energy of an elastic material with a corrosion pit can be expressed as Equation (2).
where US is surface energy of material, UE is strain energy of material, and UC is electrochemical energy of material in the corrosion process.
Pit shape parameters are affected by material surface energy, strain energy, and electrochemical energy. Three aspects are derived from describing the influence of change in the developing process from pitting to crack source.
- (1)
- Change in surface energy from pitting to crack source during the development process
When the pit develops to a and b from a0 and b0, the surface energy of the pit will change, and the variation ΔUS of surface energy can be expressed as:
where γS represents surface energy on the surface of the unit corrosion pit.
- (2)
- Variation in the strain energy of elastic material during the developing process of pit
According to the hybrid theory [12], when an infinitely large elastomer has an elliptical cavity, the strain field in the cavity is even, and the strain at the pit is εij, under the action of exterior stress σij, the strain energy of the pit after deformation can be obtained.
Strain energy can be expressed in terms of circumferential stress and circumferential strain on the pit’s surface.
When the shape parameter of the pit turns from m0 to m, the variation of elastic strain energy in the system is:
- (3)
- Change in electrochemical energy during pit development
The electrochemical energy released during the pit development process translates into work by the electric charge in the electric field, which is the electric quantity of dissolved metal band.
Corrosion electrodynamic potential [13] is introduced and, during the developing process of the pit, the corrosion electrodynamic potential can be expressed as:
where is standard electrode potential when metal is at 298.15 k, 0.1 MPa; R is gas constant; T is ambient temperature, K; Mn+ is ionic activity, Mn+ = γl; γ is activity coefficient; and l is ion solubility.
During the developing process of the pit, electrodynamic potential of the corrosion cell remains unchanged. Electrochemical energy can be described by the formula below:
Substituting changes in surface energy, strain energy, and electrochemical energy into the equation of thermodynamic potential energy, Equation (10) can be obtained.
Based on the principle of minimum potential energy, the minimum value of the thermodynamic potential energy in pitting development should be taken. The partial derivative of thermodynamic potential energy with respect to shape parameter m is:
Taking strain energy parameter and electrochemical energy parameter and substituting Formula (10) into Formula (11), it can be obtained that:
Therefore, the change function of the shape parameter m with respect to a can be obtained:
3. Results
3.1. Tubing Scaling Analysis
The macroscopic appearance of the failed tubing in well X is depicted in Figure 3. The scale on the interior of the tubing is 2~15 mm thick, and it becomes denser and harder toward the bottom. After the loose scale layer on the surface was removed, there was still a dense layer near the inner side of the tubing. This dense layer was roughly 1 mm thick, and it is evident that there were many corrosion products stuck to the inner side of the tube wall. It was discovered that the substrate had elliptical, apparent pits (about 0.5 mm in length) once the dense layer was removed.
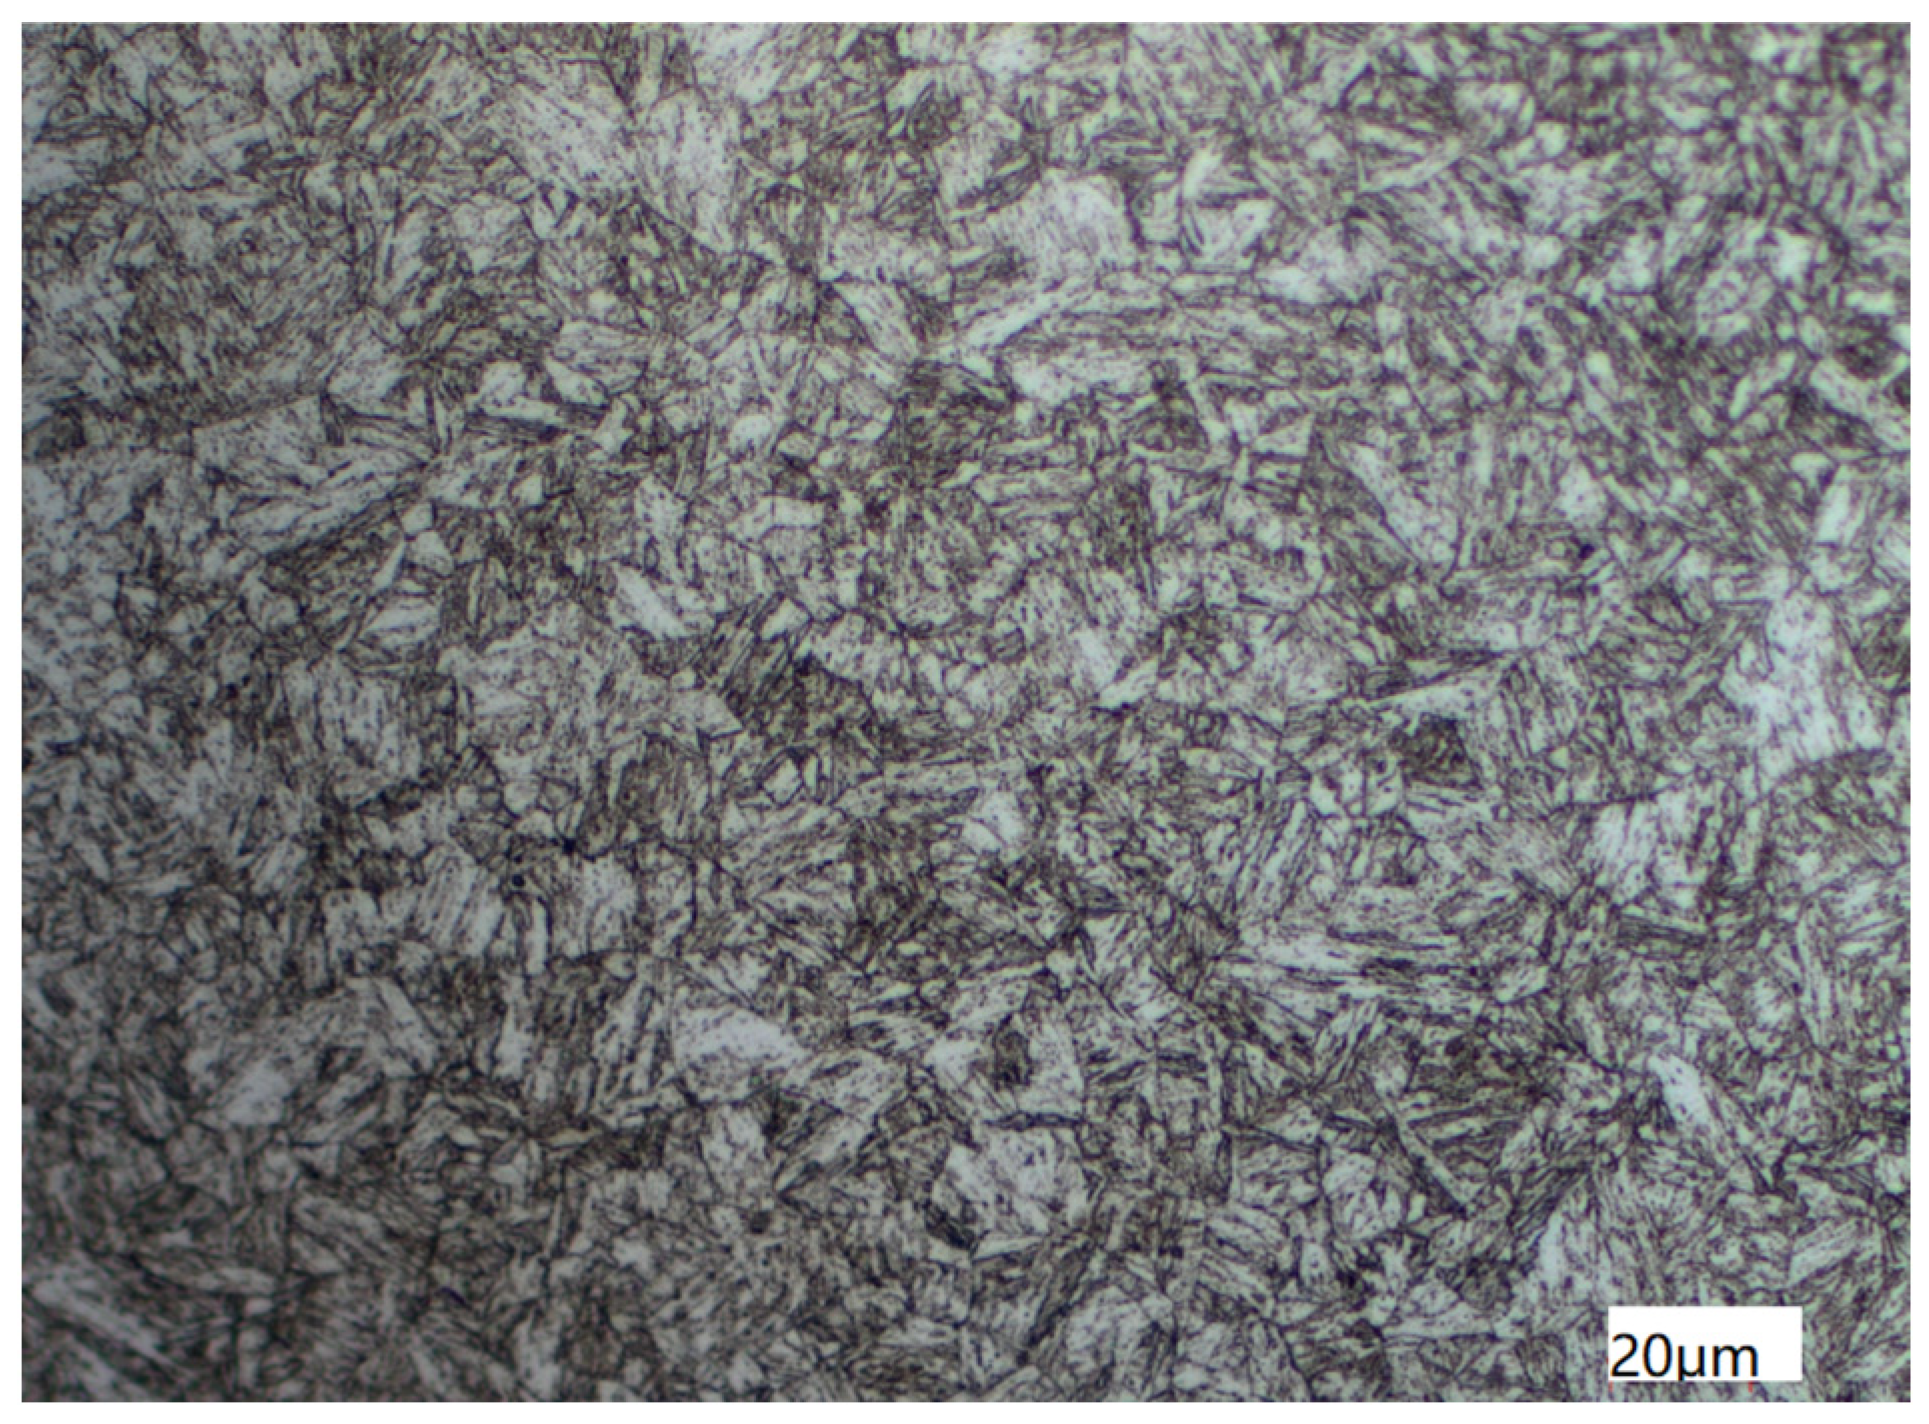
The metallographic structure of the tubing was observed by an Axio Scope A1 ( ZEISS Axioscope, Oberkochen, Germany) research level upright metallographic microscope, whose manufacture is ZEISS in Germany, as illustrated in Figure 5. The test was based on the national standard of the People’s Republic of China titled “Steel-Determination of content of nonmetallic inclusions-Micrographic method using standards diagrams(GB/T 10561-2005)”, “Determination of estimating the average grain size of metal(GB/T 6394-2017)”, and “Metellographic grading atlas and assessing method for steel die forgings(GB/T 13320-2007)” [14,15,16]. Results show that the non-metallic inclusions of the sample are grade D, fine system, grade 0.5, and grain size 8. Sorbite with martensite orientation and a small amount of granular ferrite make up the metallographic structure.
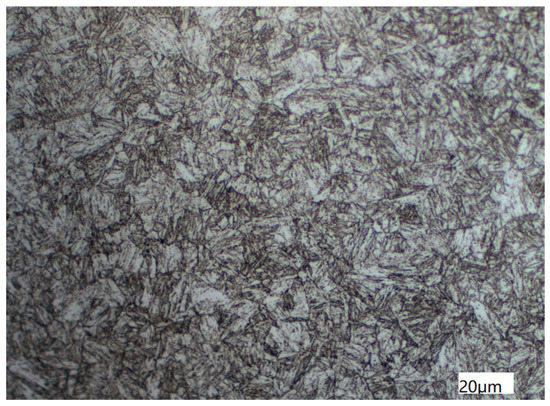
Figure 5.
Metallographic Structure of Tubing Observed by Axio Scope A1.
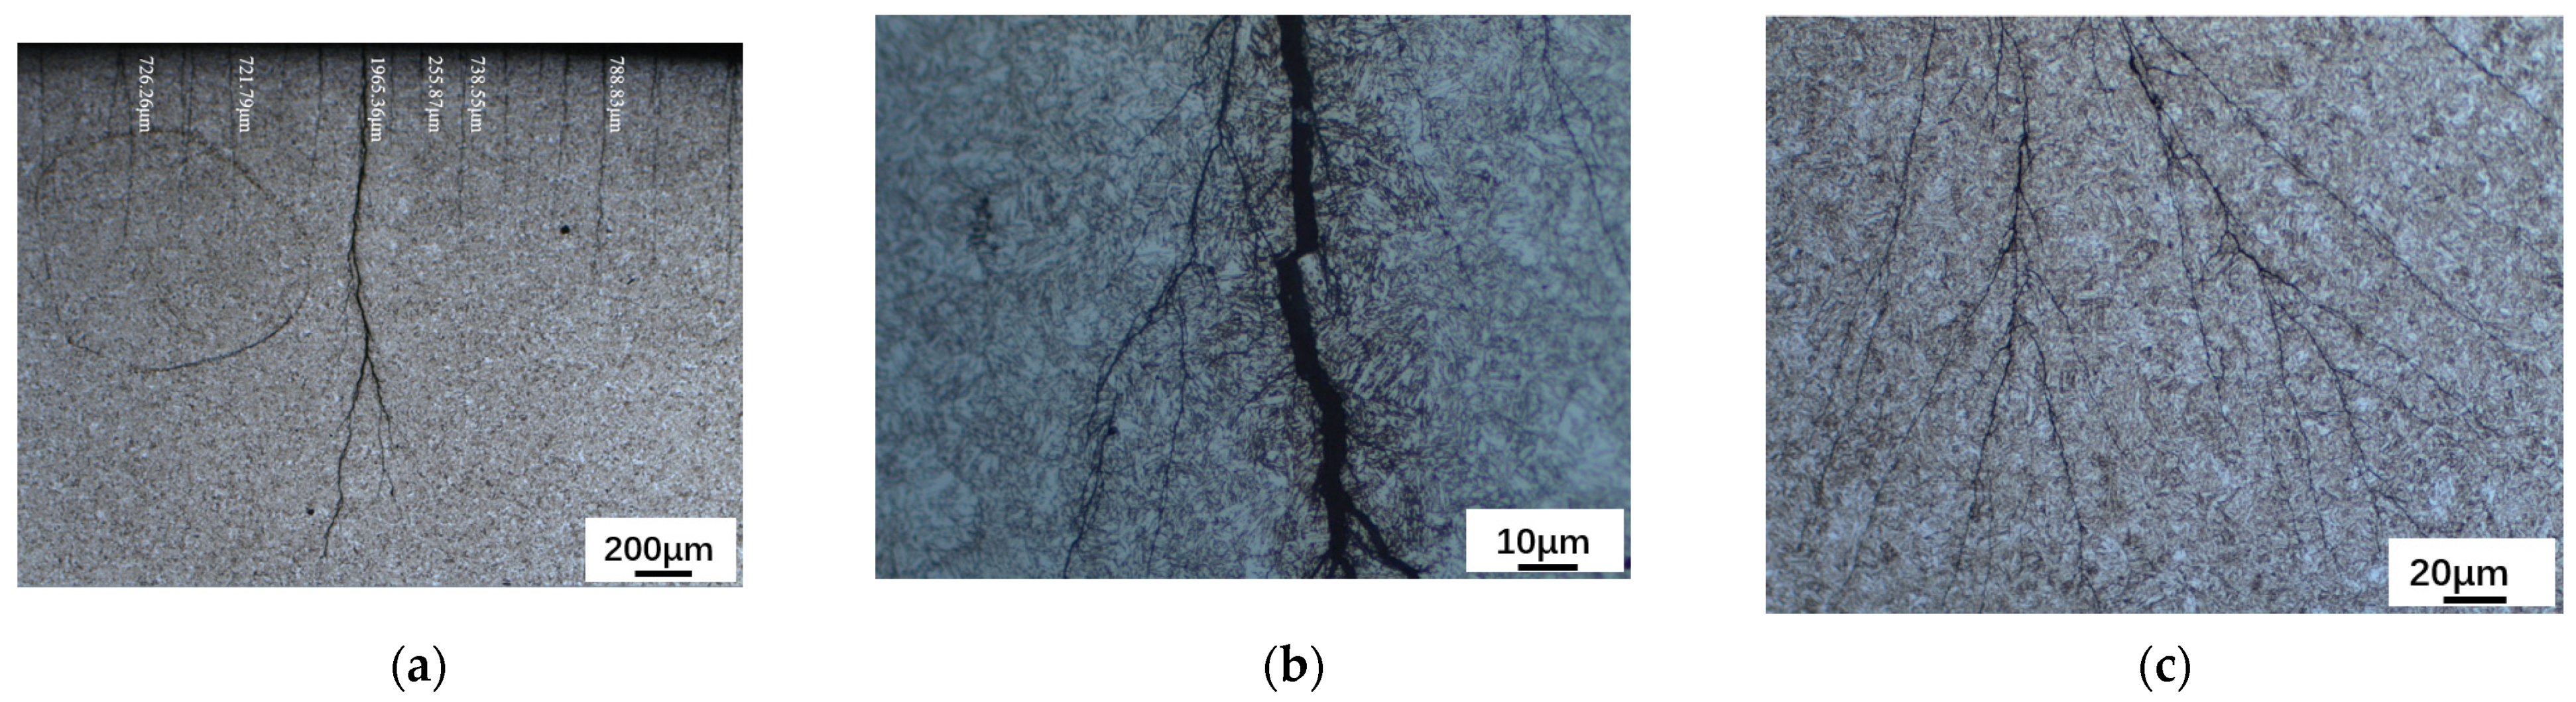
A ZSA302 stereomicroscope was used to observe the macromorphology of the inner surface of the tubing, the results are shown in Figure 6. According to Figure 6a, the minimum crack depth is 255.87 μm, the maximum crack depth of the sample is 1965.36 μm, and no abnormal microstructure developed around the crack after corrosion. Meanwhile, the main crack of the sample is dendritic and root-like, extending from the outside to the inside. As demonstrated in Figure 6b,c, once the cracks were magnified, the main crack’s propagation morphology could be seen. There are numerous secondary cracks all over.
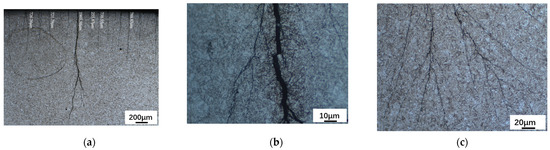
Figure 6.
Macromorphology of the Inner Surface of the Tubing after Corrosion Observed by ZSA302 Stereomicroscope. (a) Cracks on the Inner Surface of Tubing (200 μm). (b) Cracks on the Inner Surface of Tubing (10 μm). (c) Cracks on the Inner Surface of Tubing (20 μm).
The metallographic cross-section of the tubing was observed using a scanning electron microscope. As shown in Figure 7, there are many pits on the surface of the tubing, with a length of about 164.8 μm and a depth of about 152.3 μm. The crack sources are located under the pits, and the cracks spread into the material substrate. The scale layer, which is roughly 80 μm thick, is one of three primary components of the crack source, together with the corrosion product film layer and the material substrate part from the outside to the inside. The substrate is located below the corrosion product coating, which has a thickness of around 70 μm. In addition, it was discovered that the cracks primarily started at the bottom of the corrosion pit and continued all the way inside the material, as illustrated in Figure 7b. The non-corrosion pit area has crack initiation in addition to the cracks at the bottom of the corrosion pit.
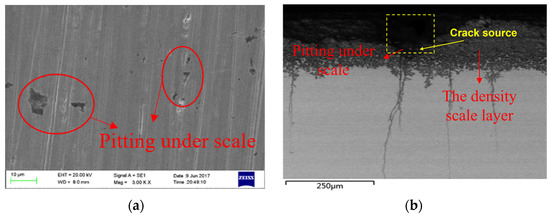
Figure 7.
Micromorphology of Corrosion under Scale of Tubing (SEM). (a) Micromorphology of Corrosion Pits on Oil Pipe Surface. (b) Corrosion Microtopography of Tubing Section.
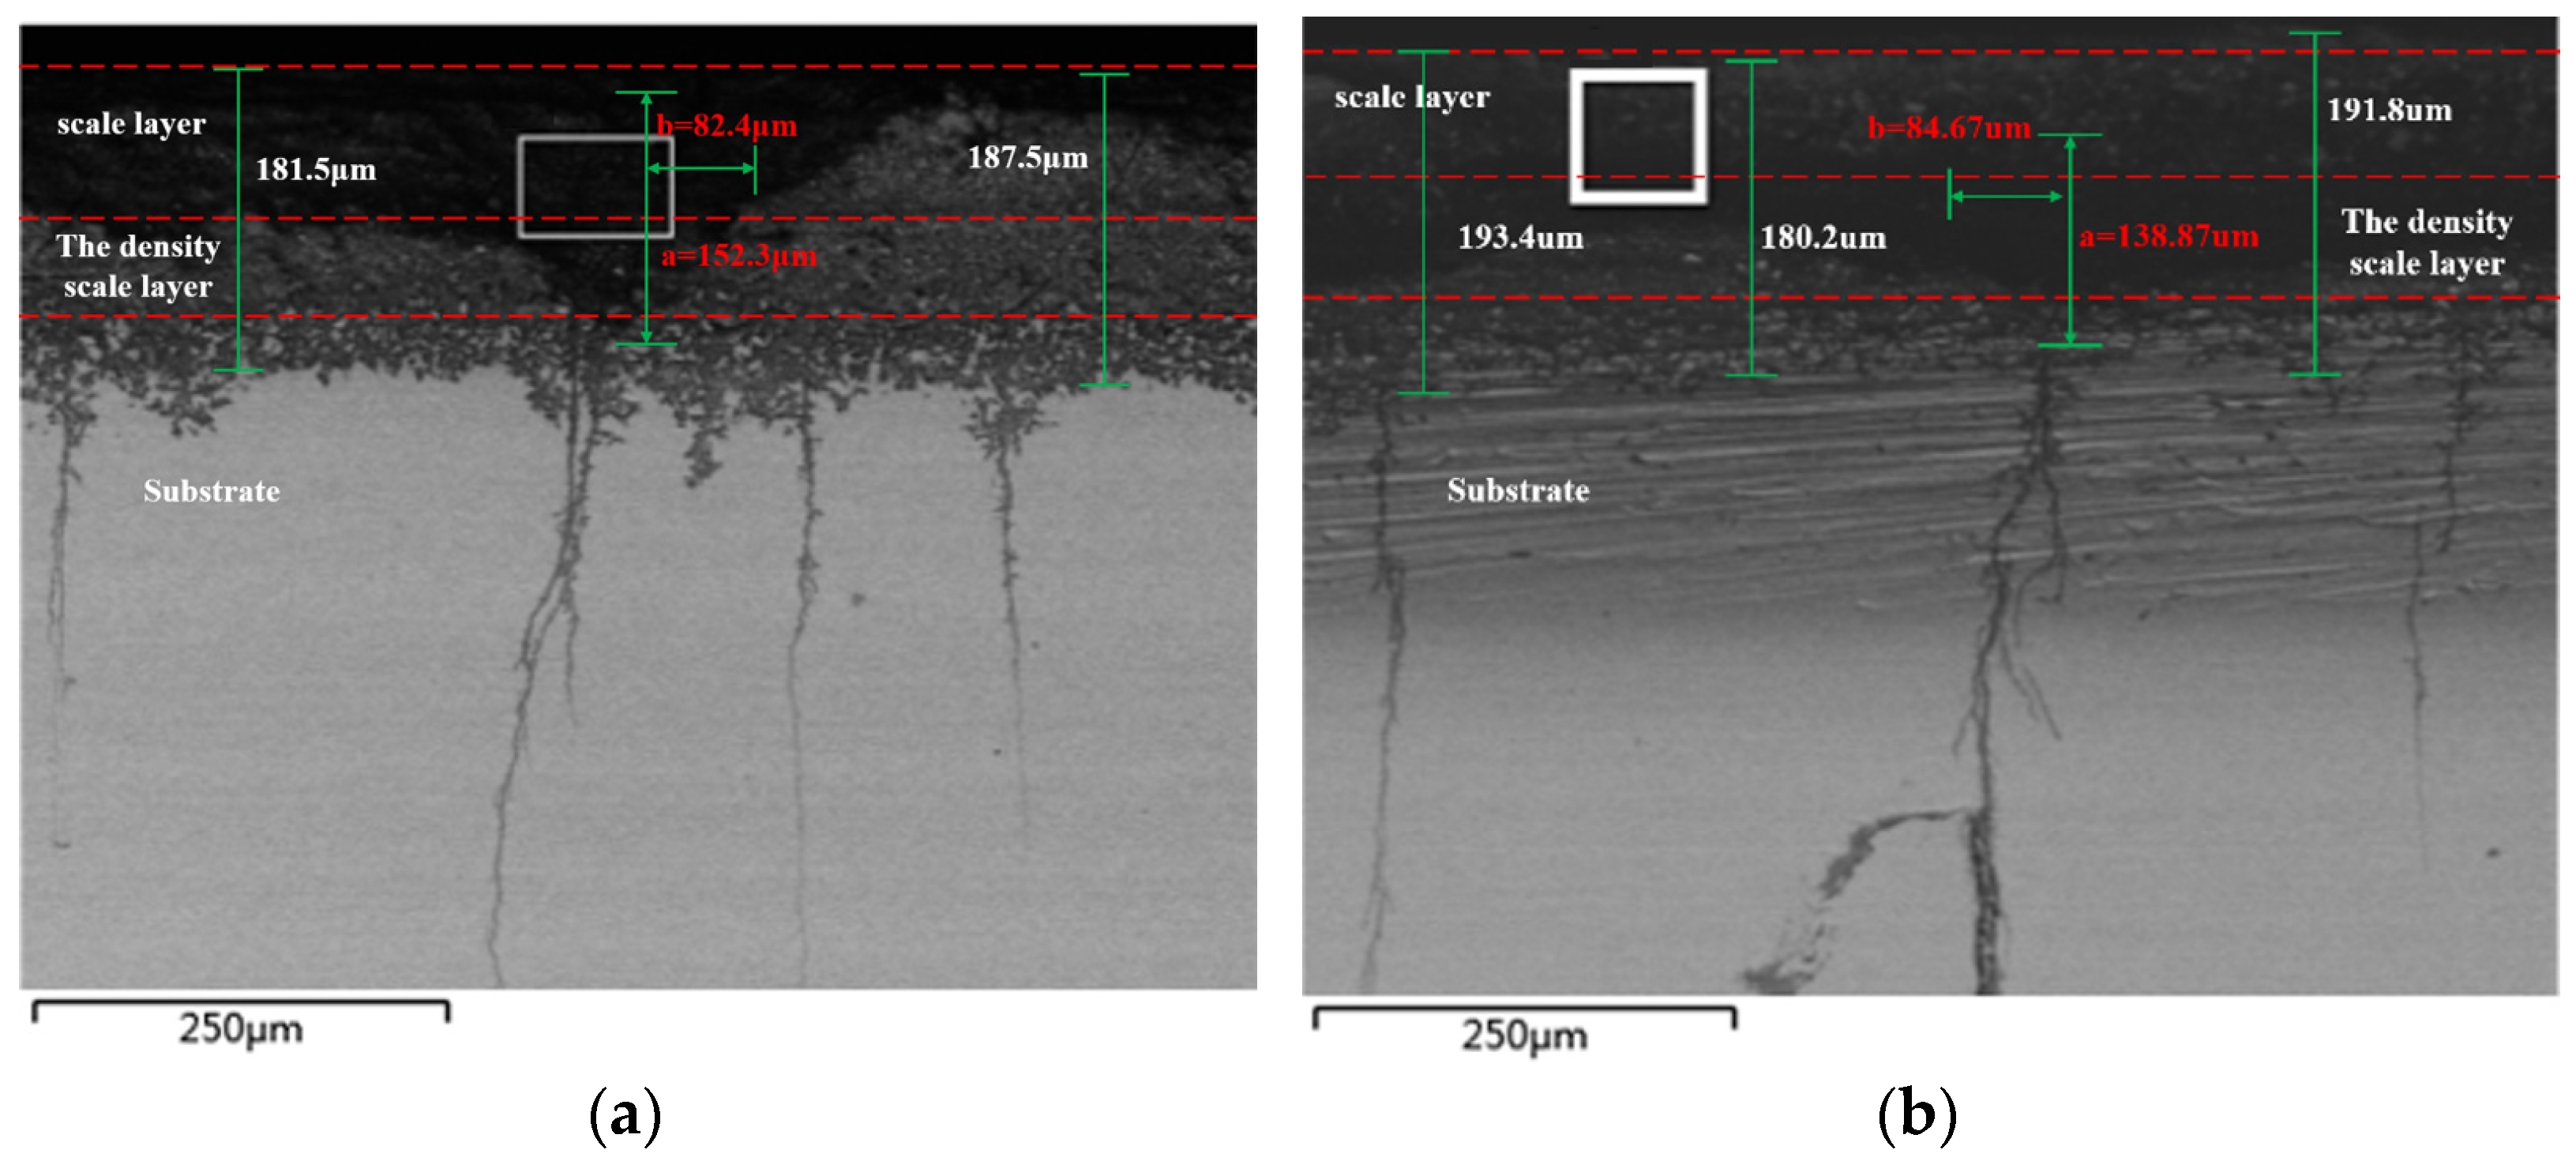
The metallographic sample’s cross-section was magnified in a different position for more in-depth examination, as illustrated in Figure 8. After amplifying, it can be seen that pits in both figures develop into cracks. The parameters for the pitting shape in Figure 8a,b are 0.243 and 0.296, respectively. It is crucial to note that if the pitting form parameter rises by 0.3 above the thermodynamic potential limit, the pitting’s development process will be unstable. As a result, the pitting will eventually turn into a crack.
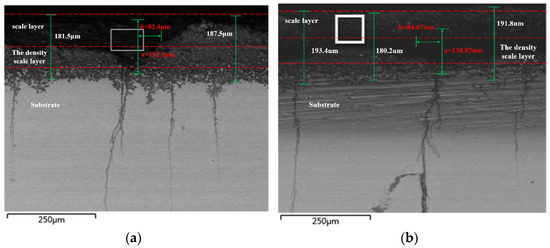
Figure 8.
Morphology of Corrosion Pits in Super 13Cr Tubing. (a) Morphology of Corrosion Pits When the Pitting Shape Parameter Is 0.243. (b) Morphology of Corrosion Pits When the Pitting Shape Parameter Is 0.296.
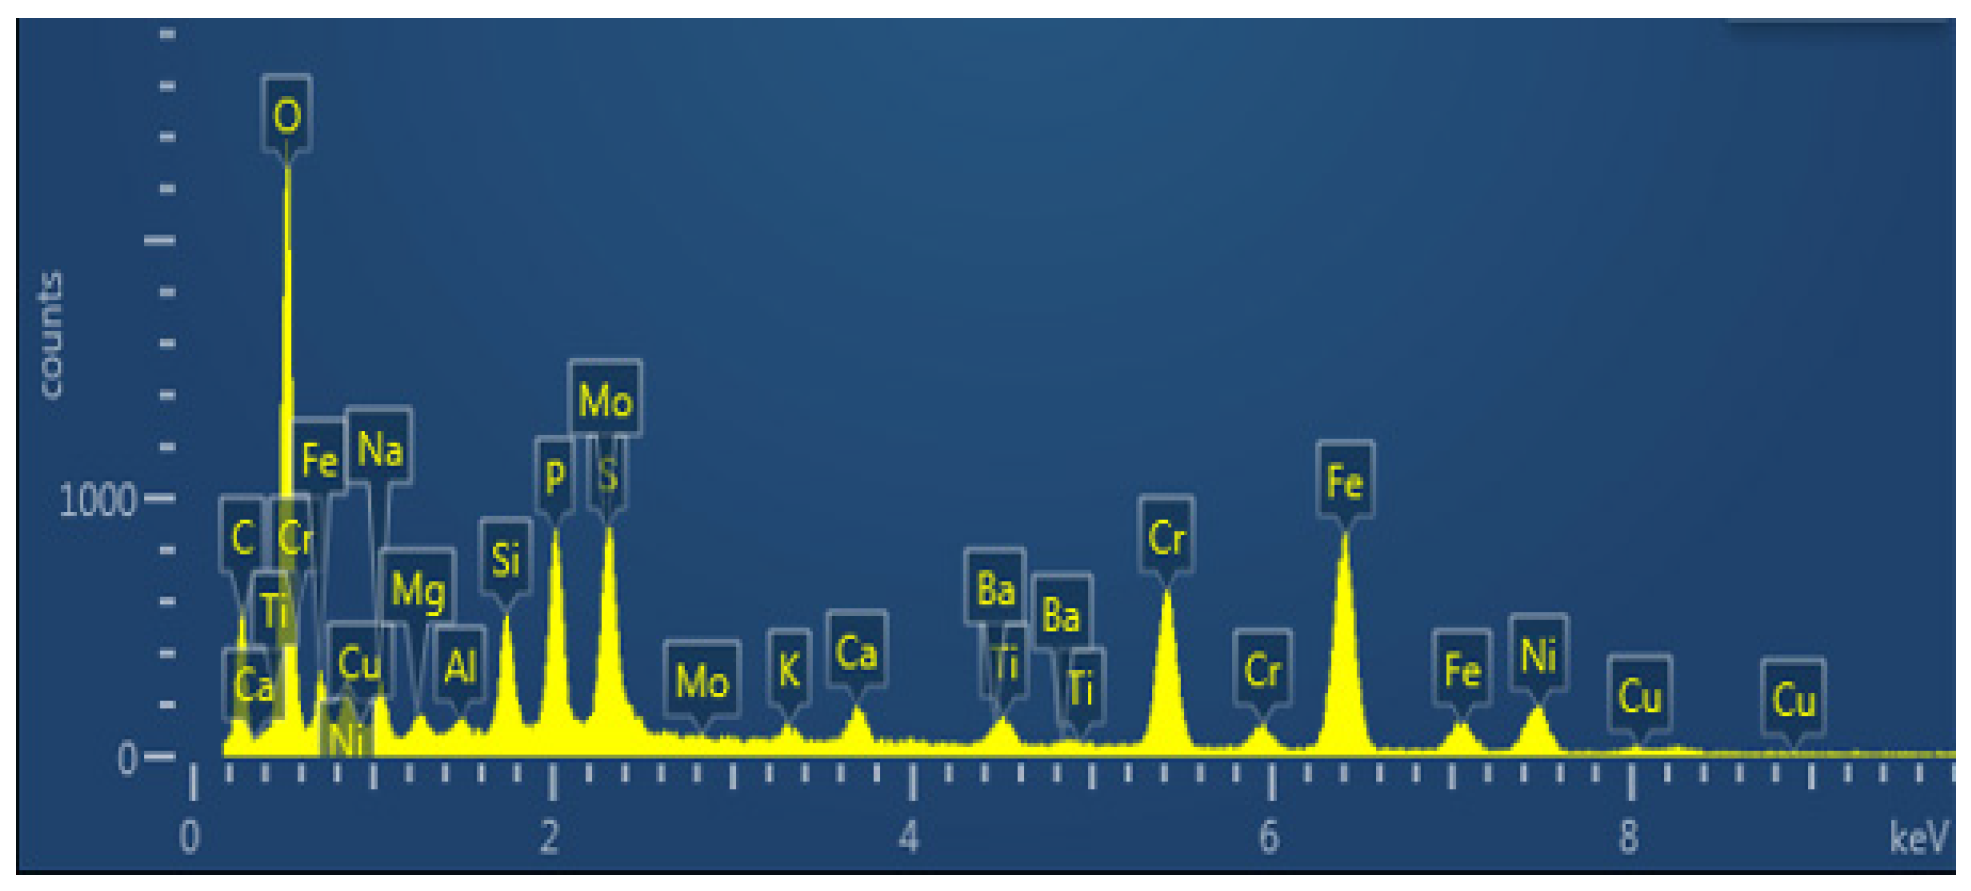
As shown in Figure 9 and Table 2, it can be determined that the dense scale’s primary constituent elements are Fe, Cr, and O, as well as a significant amount of P and S, and a specific amount of Ba, which is the main component of drilling fluid or killing fluid. Sulfide and phosphate also play a role in promoting the formation of corrosion product film and crack propagation.
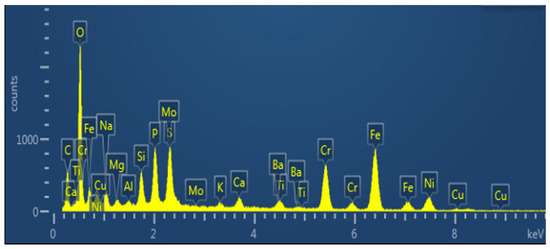
Figure 9.
Section Energy Spectrum Analysis Diagram of Corrosion Scale Layer (EDS Surface Scan).
Table 2.
Content of O, C, Na, Mg, Al, Si, P, S, K, Ca, etc. in the Dense Scale Layer.
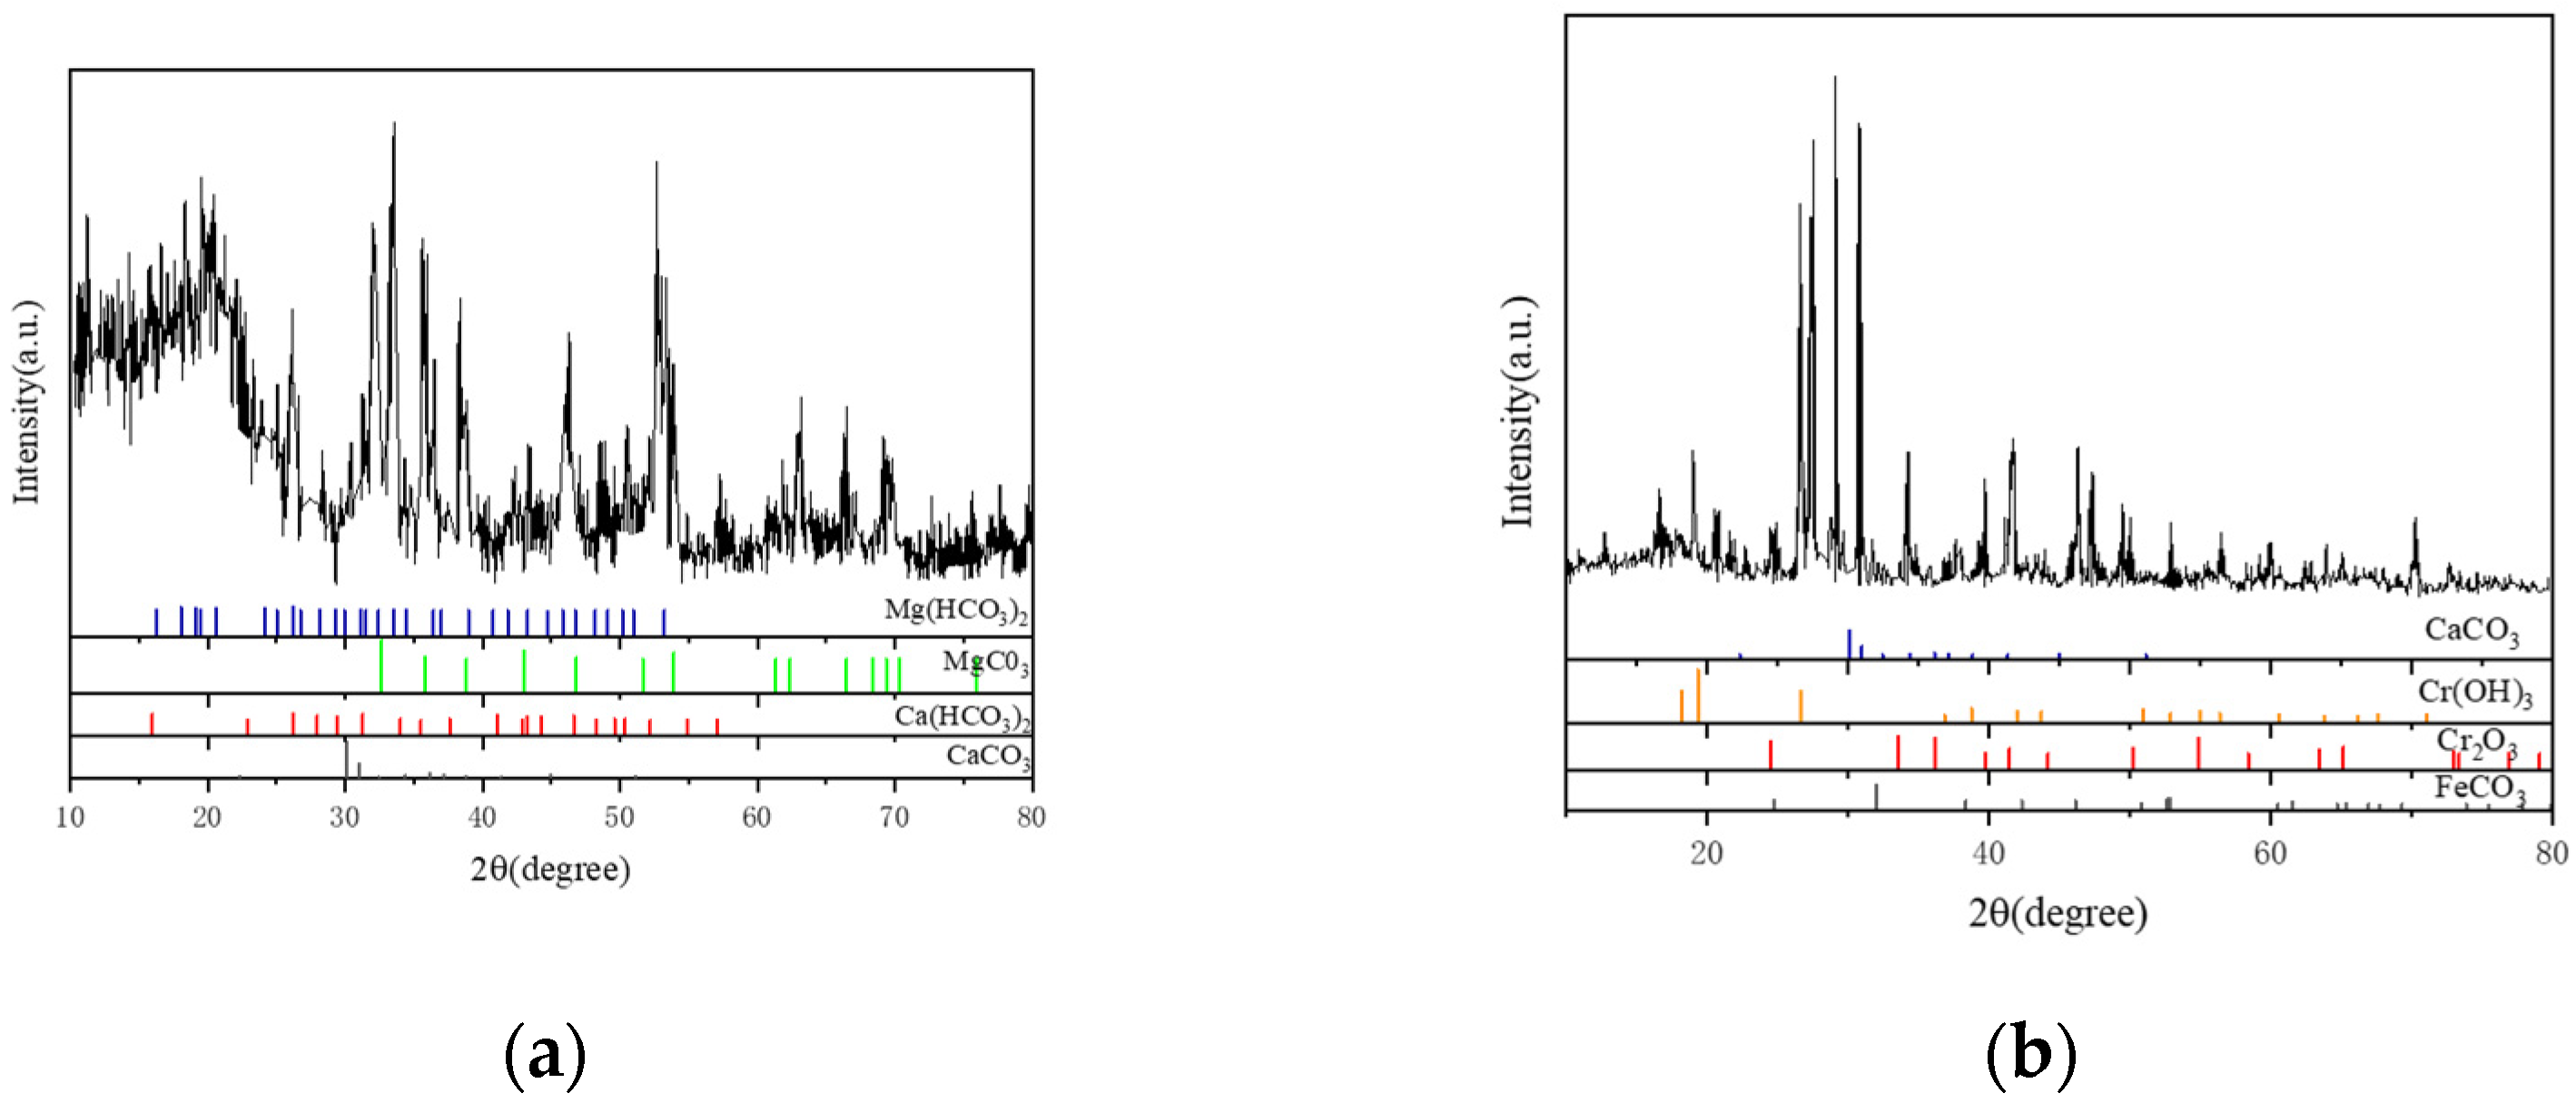
X-ray diffraction was used to examine the material components of the scale layer in order to precisely determine the primary components of the scale sample. The outcomes displayed in Figure 10 demonstrate that the loose scale layer primarily consists of CaCO3 with a trace quantity of MgCO3. Figure 10a shows the results of the phase structure analysis of the corrosive substance easily scraped off the outermost layer; Figure 10b shows the phase structure analysis results of the inner dense corrosion product film tested by directly cutting the inner wall test piece after removing the outermost loose corrosion product. As CaCO3 is generally stable, MgCO3 readily breaks down into CO2 at high temperatures and pressures, leading to secondary corrosion of the tubing. Results from EDS and XRD analyses demonstrate that FeCO3 and Cr2O3 make up the majority of the dense layer scale (Figure 9 and Figure 10).
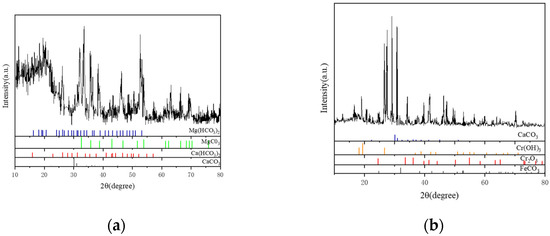
Figure 10.
Analysis of Material Components of the Scale Layer by XRD Analysis Diagram. (a) Material Components of the Loose Layer. (b) Material Components of the Dense Layer.
3.2. SKP Test
The surface potential distribution of the sample was found using the continuous mode in microarea electrochemistry, known as the Sweep Scan mode, as displayed in Figure 11. In the early time period (0 h), the surface potential distribution of the sample is uniform, in the stage of the beginning of corrosion product film, and there is no visible local corrosion, as can be observed from the SKP potential distribution on the sample surface. After 12 h of immersion, the sample’s surface potential has significantly changed compared to 0 h. The local potential is noticeable and exhibits some local corrosion characteristics, but the sample’s surface potential is incredibly low because of sample inclusions and other variables. After being submerged for 24 h, the sample’s surface potential still varies on a 12 h basis, potential develops in a gradient, the potential maximum appears at the top of the local high potential, and local corrosion usually becomes apparent. After being submerged for 48 h, the sample’s surface potential keeps rising, the potential difference between the anode and cathode areas keeps growing, and the local corrosion becomes worse. The sample’s surface potential tends to be uniform after 72 h of immersion, with the exception of the larger local potential. However, the potential is noticeably higher in the higher local potential area than in other areas, and as a result, visible local corrosion takes place due to the potential difference.
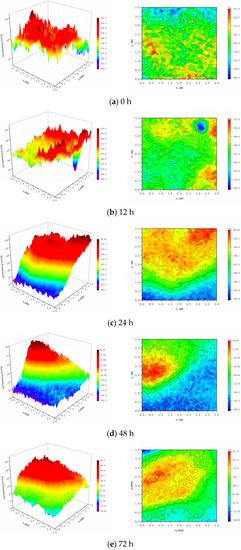
Figure 11.
SKP Potential Distribution on the Surface of Sample.
As potential distribution varies with time and location on the sample’s surface, it is hard to describe its potential distribution and compare the low and high potential. Gaussian distribution is a probability distribution widely used in engineering. After testing, the experimental data are fitted by the Gaussian distribution. In this way, it is easier to find the potential range and the irregularity of distribution of the anode and cathode, and display the change trend of point distribution at different times more directly. Following testing, different periods of SKP potential were applied with Gaussian fitting by Equation (14):
where A is constant, E0 is potential offset, xc is central location of the potential distribution, and w2 is concentration of the potential distribution, and the smaller the value of w2, the more concentrated the potential distribution is in xc.
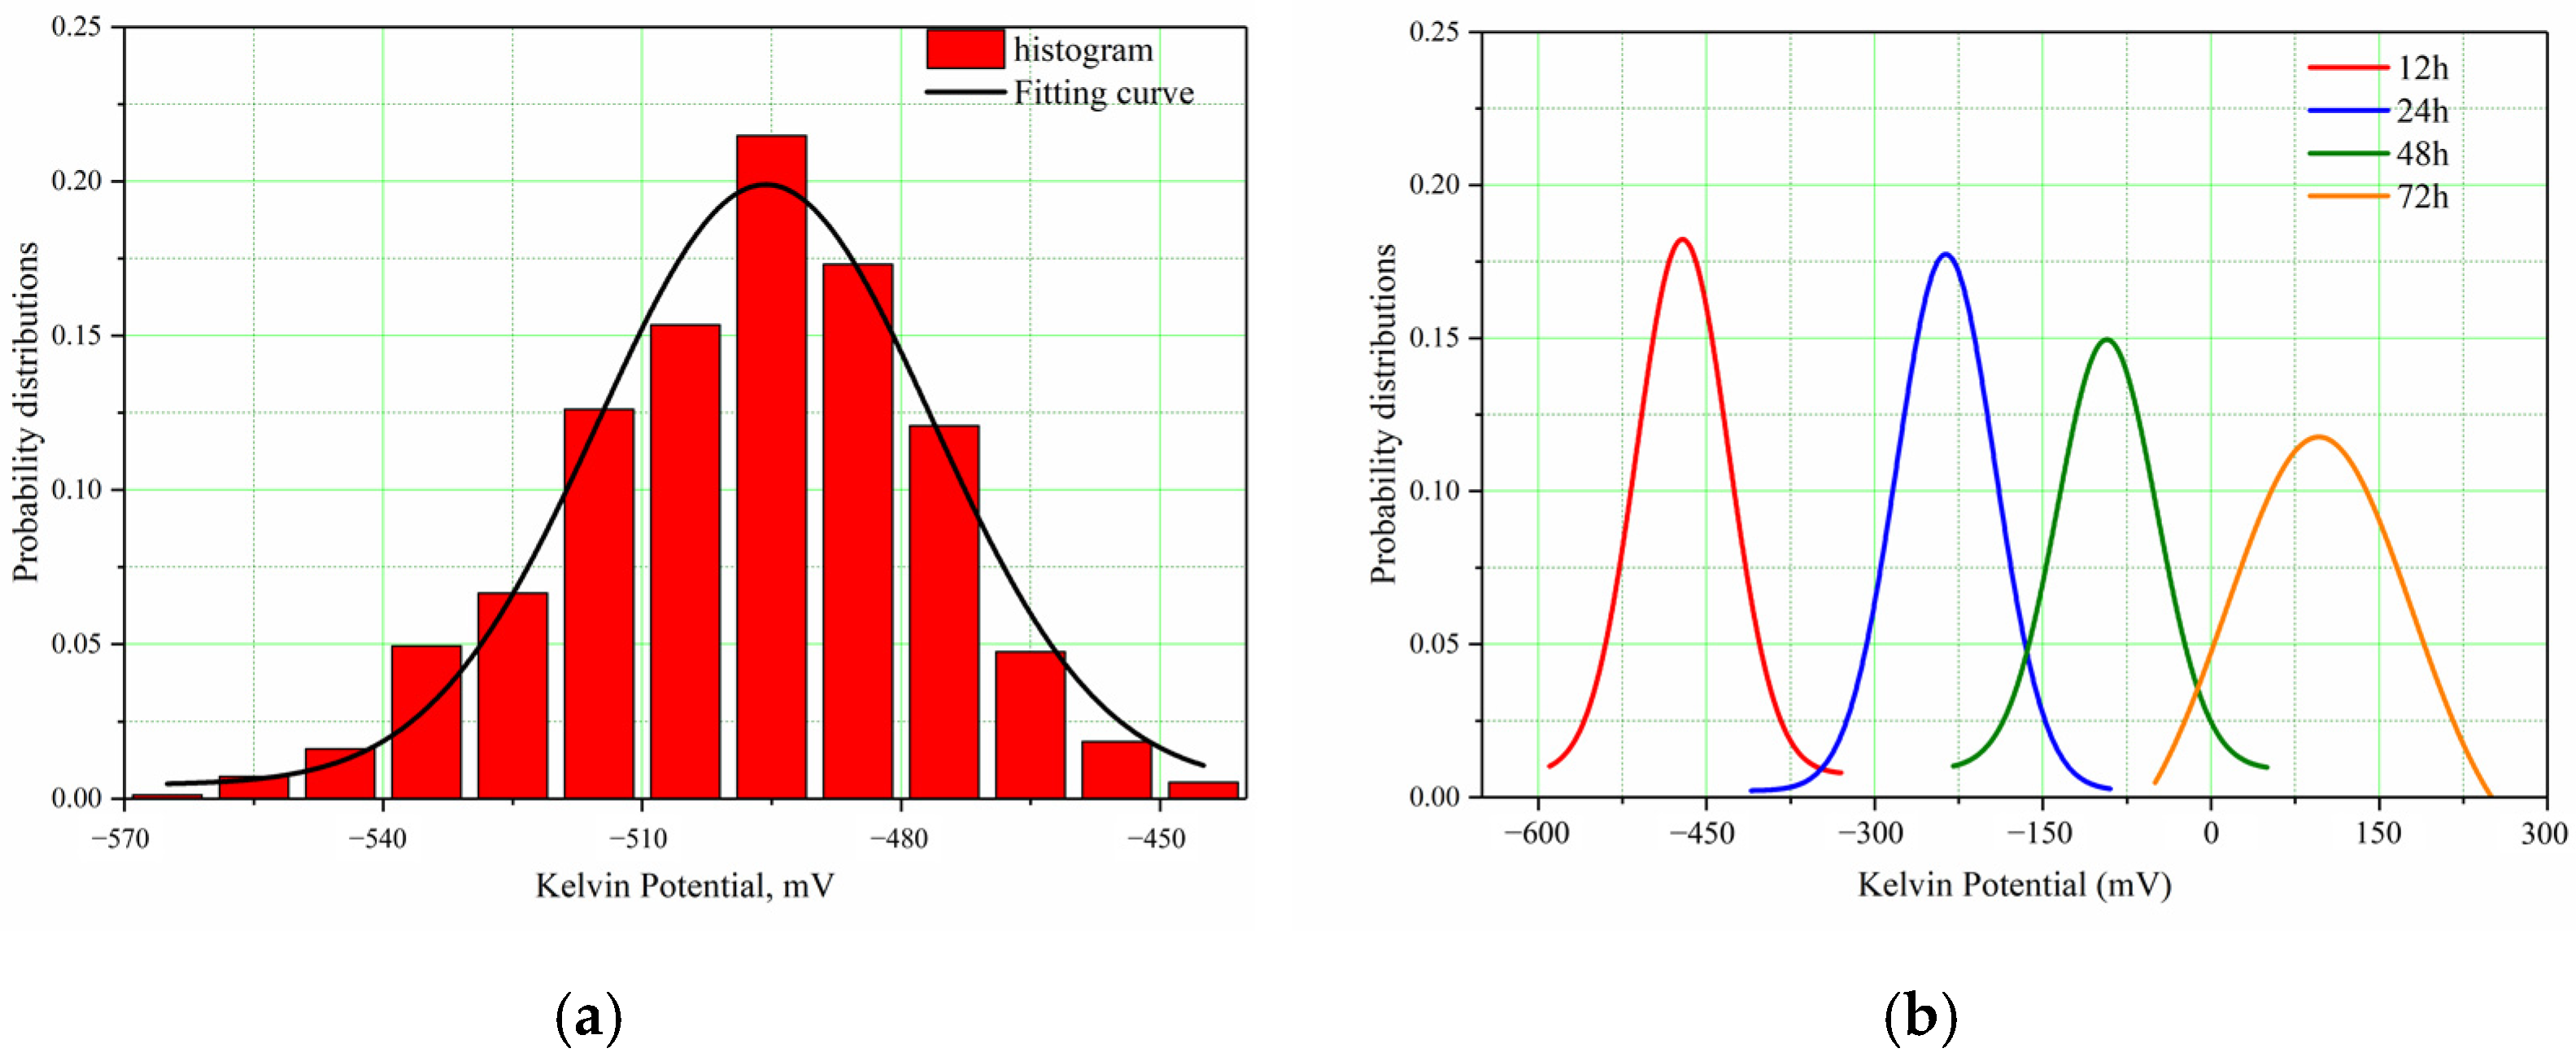
Figure 12a shows the histogram and fitting curve of potential distribution in the initial period after performing Gaussian fitting for corrosion potentials in different time periods and Figure 12b shows fitting curves of potential distribution in the different time periods.

Figure 12.
SKP Potential Distribution of Super 13Cr in Formate Solution. (a) The Histogram and Fitting Curve of Initial Potential Distribution. (b) The Fitting Curves of Potential Distribution of Different Time Periods.
The Gaussian fitting results of the xc value and w2 value of Sweep Scan mode potential distribution at different times and the fitting error R-square are shown in Table 3.
Table 3.
Surface SKP Potential Gaussian Fitting of Super 13Cr Tubing after Different Times of Soaking in the CO2-Saturated Formate Solution.
By comparing the data in Table 3 with data in Figure 12, the change in surface state of samples soaked in the formate solution saturated with CO2 over the time can be found. They indicate that the anode and cathode distribution of the super 13Cr tubing is very irregular in the experimental environment, and the active points are random.
At 0 h, the potential distribution on the surface of uncorroded samples is uniform, and the three-dimensional point map of the sample surface is relatively flat.
After 12 h, compared with 0 h, the potential difference increases a little, which means the material is mainly subject to uniform corrosion in this period of time and the effect of pitting is not obvious.
After 24 h and 48 h, compared with 0 h, the potential difference on the surface of samples increases apparently, the maximum potential appears in the anode region, and a certain local corrosion occurs at this time. The potential difference between the anode and cathode is the main driving force causing surface corrosion of samples.
After 72 h, the corrosion potential further increases, and the potential difference increases to 301 mV. There is an obvious potential peak in the anode region, which shows that local corrosion develops further from the previous step and there is a tendency of pitting in this area.
4. Discussion
4.1. Cause of Corrosion under Scale
4.1.1. Formation of Scale
Scaling is the process in which molten salt crystallizes and deposits itself outside of a solution [17], whose formation can be shown by Equation (15) [18].
Tubing corrosion and scaling constitute an autocatalytic system for mutual promotion [19]. According to Equation (16) [20], corrosion under tubing scale is the main source of dense scale layers. As Cr to some extent inhibits corrosion, its creation can prevent further corrosion of the metallic matrix. However, some insoluble organic oils and silica sand may dope in the dense layer, which could lead to corrosive pitting. Additionally, the dense layer has the ability to encourage the precipitation and crystallization of molten salt; microcrystal is more likely to stick to it and accumulate as scale. Small pores on a loose scale layer may serve as pathways for corrosion reactants, fostering corrosion under the scale. After passing via microscopic pores and coming into contact with the metallic matrix, CO2 and Cl− produce an occlusive reaction under the combined action of scale, which causes corrosive pitting and perforating [21].
4.1.2. Formation of Corrosive Pitting
When super 13Cr tubing is submerged in the formate corrosive environment, local corrosion is prone to happening. From a small area or partial defect position on the metal’s surface, corrosive pitting develops internally on the metal material in corrosive medium [22].
In the initial stage, there appears to be a low-potential cathode area and a high-potential anode area because the active area on the surface of the super 13Cr tubing uniformly corrodes and pits. Inclusions and dislocation outcrops (such as quartz sand particles in a dense layer) are examples of weak points on a material’s surface where corrosive pitting is most likely to occur [23]. Microscopic corrosion galvanic cells can also easily develop and speed up the corrosion in the meantime. Pitting is caused by activation–passivation cells, which become more severe when the cathode area exceeds the anode area [24].
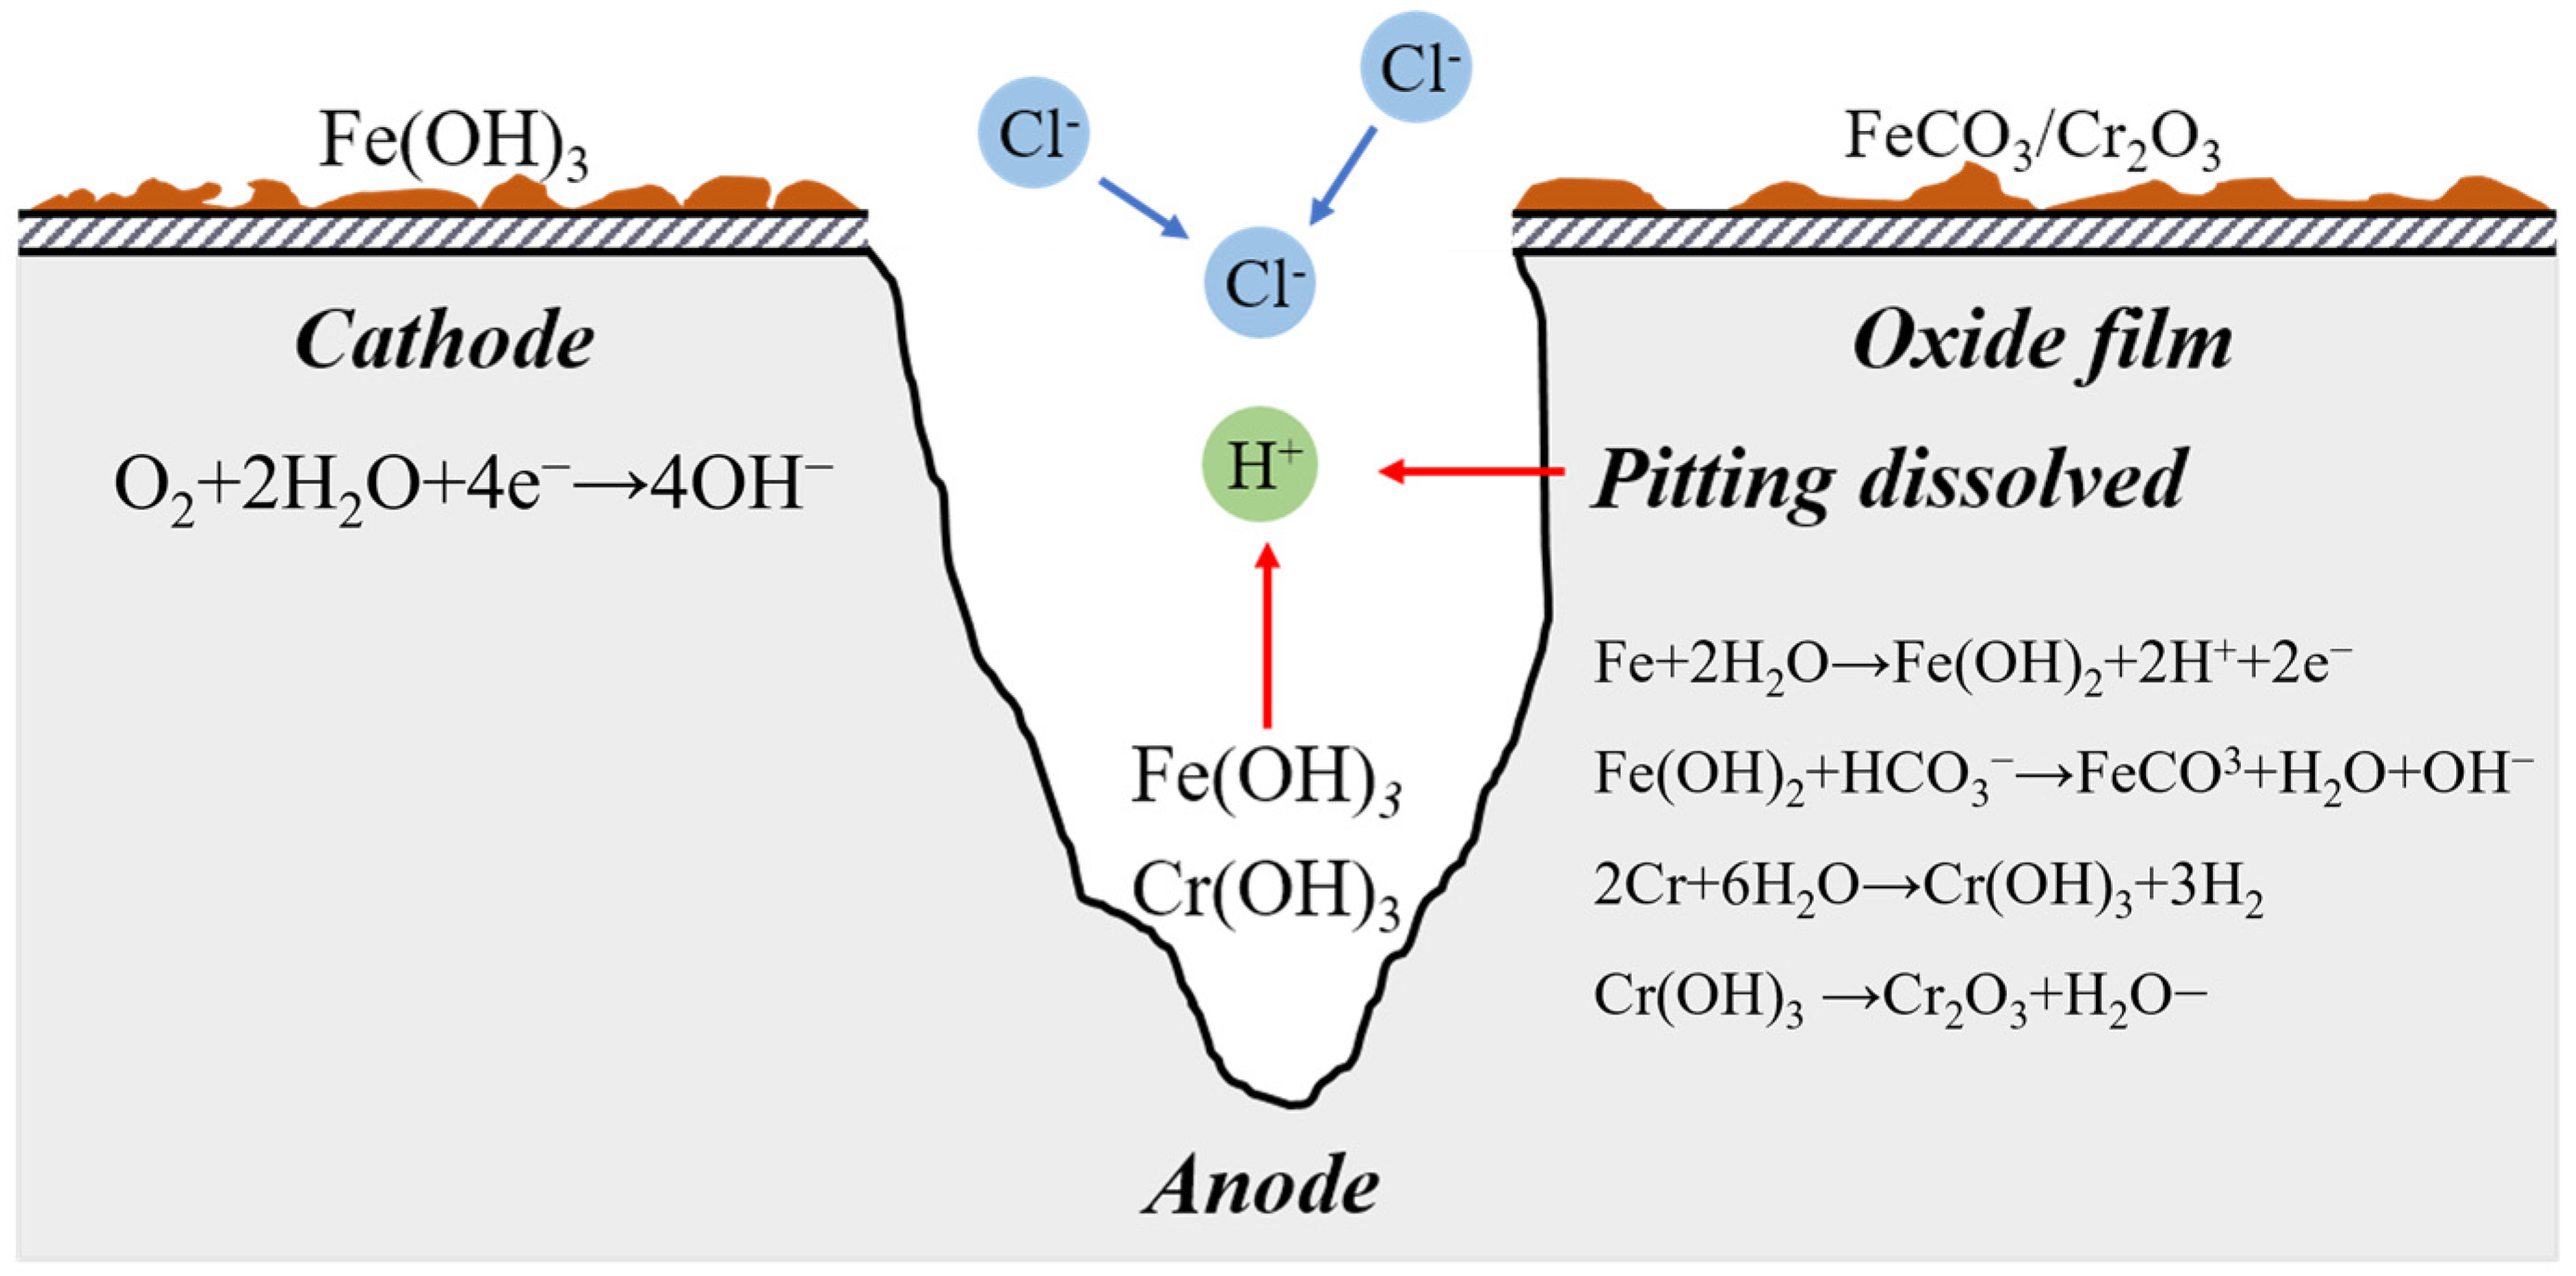
The autocatalytic effect of blocked corrosion cells in pits is unusually highly acknowledged during pitting development [25] (Figure 13). A small-anode and a large-cathode activation–passivation cell is produced by the active area at the bottom of the pit and the passive area on the exterior surface of the pit after the formation of corrosive pitting, which exacerbates the corrosion pit’s dissolution. Equation (17) can be used to illustrate the dissolution response of metal in the anode area at the bottom of the corrosion pit.

Figure 13.
Electrochemical Process of Pitting Initiation.
Additionally, the following is the equation for the reaction at the cathode on the metal surface:
Fe2+ and Cr3+ in the corrosion pit expand outwards and have secondary reactions with OH− in the anode area [26,27], namely:
Deposits of Fe(CO)3 and Cr2O3 near the corrosion pit’s opening will thwart ion exchange. The anodic dissolution of metal in the pit is accelerated by the formation of a closed compartment at the bottom because the ions inside the pit cannot exchange with those outside it.
4.2. Pitting Inducing Cracks
Based on the simulation method developed earlier, if the surface energy density of super 13Cr tubing material γs = 2.4 J/m2, surface energy density Γ = 0.27 J/mm2, and external loads σ are 60 MPa, 90 MPa, and 120 MPa, respectively, strain energy is Λ1 = 0.0393, Λ2 = 0.0883, and Λ3 = 0.157. Figure 14 depicts how the pitting shape parameter changes as pitting depth changes. It indicates that pit shape parameter m is initially about 0, resembling a semi-circle. As corrosive pitting develops, the semi-circle transforms into an ellipse, and the shape parameter become stable at 0.3. The pitting shape parameter changes as pit depth increases and tends to be stable with an increase in the strain energy parameter.

Figure 14.
Curve of Shape Parameter with the Change in Pit Depth in the Pitting Developing Process.
4.3. Corrosion under Scale Leads to Cracking
The scale layer contains many tiny pores that act as corrosion reactant channels, resulting in corrosion under scale. Formation fluid is rich in Cl−, CO2, and HCO3− with a high degree of mineralization. Tubing has an occlusive effect, forms a corrosive microbattery, and results in corrosion pits on the internal and external walls of the tubing due to the combined action of CO2, Cl−, and scale. From Figure 15, the initiation and development of corrosive pitting are critical in the early stages. Then, as a result of the external relatively high strain load and corrosive environment, crack development takes precedence.
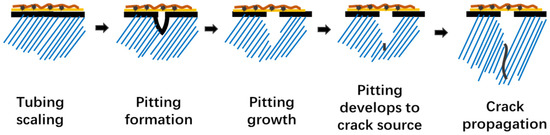
Figure 15.
Development Process of Tubing Fracture Failure Caused by Corrosion under Scale.
Cl− is the catalyst for the occlusion effect in the pitting initiation and development process, CO2 accelerates environmental degradation in the occluded corrosion microbattery and facilitates corrosion rate, and external load and corrosive environment play a critical role in crack expansion.
Loads (internal and external extrusion forces) on service tubing vary constantly. This paper investigates the variation of tubing effective pressure (the absolute value of the difference between the internal and external pressures of tubing) in 52 wells in one oil field (Figure 16). According to Figure 16, effective pressure on tubing varies greatly (0–90 MP), namely, the external extrusion force of tubing can reach a maximum of 90 MPa, approaching the upper limit of tubing strength, despite meeting the requirements of tubing collapse resistance (93.28 MPa) and internal pressure strength (96.12 MPa) for tubing designed in API 5C3 standards.

Figure 16.
Fluctuation of Annular Pressure on 52 Wells in One Oil Field.
From Figure 16, it is clear that the fluctuation of effective pressure on tubing, while corrosive ions in the environment solution, such as Cl−, are at work, encourages pitting defects to turn into cracks and aids the expansion of fractures. The strain around fracture tips is substantially greater than the yield strength of materials because the strain concentrates there. Strength, plasticity, and resistance to environmental cracking and degradation of tube materials decline fast and lead to tubing fracture failure when effective pressure and crack length surpass the threshold values [28].
Based on the analysis above, tubing develops scale under service conditions, corrosion under scale results in corrosion pits on the surface of tubing, corrosion pits develop into cracks that spread under the action of alternating loads, with increasing service time, the mechanical property of tubing materials is severely damaged, and fracture failure occurs when tubing loses the resistance to environmental cracking.
5. Conclusions
(1) The tubing’s macroscopic examination results demonstrate that considerable surface scaling has taken place, with an outside loose scale layer and an inner compact scale layer. Microanalysis reveals that the corrosion under scale is severe, that there are elliptical pits under the scale, and that these pits cause the beginning of microcracks. FeCO3 and CaCO3 are the primary corrosives that have stuck to the surface of the tubing.
(2) The results of the microelectrochemical tests indicate that partial corrosion of super 13Cr occurs readily in the wellbore solution medium. With a longer reaction time, the local corrosion becomes worse. Additionally, when corrosion time lengthens, the potential difference grows, and the local corrosion quickens. At the tip of pitting pits, microcracks finally start under the influence of load.
(3) As corrosion pits and cracks in super 13Cr material continue to form under the influence of alternating loads and corrosion, the mechanical qualities of tubular materials are severely compromised. Fracture failure happens when a tube loses its resistance to environmental cracking.
Author Contributions
Conceptualization, Y.W. and J.D.; methodology, Z.Z.; formal analysis, Y.W. and J.D.; investigation, Y.W.; resources, Y.W. and J.D.; writing—original draft preparation, Y.Z.; writing—review and editing, N.C.; funding acquisition, Z.Z. All authors have read and agreed to the published version of the manuscript.
Funding
The authors are grateful for the support of the National Natural Science Foundation of China (Grant No. U22A20164), National Natural Science Foundation of China (Grant No. 52074234), Innovative Research Team of Sichuan Province (2020JDTD0016), Science and Technology Cooperation Project of the CNPC-SWPU Innovation Alliance (2020CX040100).
Institutional Review Board Statement
Not applicable.
Informed Consent Statement
Not applicable.
Data Availability Statement
Not applicable.
Conflicts of Interest
The authors declare no conflict of interest.
References
- Liu, W.Y.; Shi, T.H.; Li, S.; Lu, Q.; Zhang, Z.; Feng, S.; Ming, C.; Wu, K. Failure analysis of a fracture tubing used in the formate annulus protection fluid. Eng. Fail. Anal. 2019, 95, 248–262. [Google Scholar] [CrossRef]
- Ueda, M.; Nakamura, K.; Hudson, N.; Ibrahim, M.Z.; Selamat, K.; Chen, P. Corrosion Behavior of Super 13Cr Martensitic Stainless Steels in Completion Fluids. In Proceedings of the CORROSION 2003, San Diego, CA, USA, 16–20 March 2003. [Google Scholar]
- Tavares, S.S.M.; Almeida, B.B.; Corrêa, D.A.L.; Pardal, J.M. Failure of super 13Cr stainless steel due to excessive hardness in the welded joint. Eng. Fail. Anal. 2018, 91, 92–98. [Google Scholar] [CrossRef]
- Wang, Z.; Cui, R.; Ma, W.; Qu, H.; Dou, Y.; Li, Z. Experimental Study on CO2 Corrosion of Super 13Cr Integrated Tubing with Erosion Damage. J. Fail. Anal. 2019, 19, 1826–1831. [Google Scholar] [CrossRef]
- Zhang, Z.; Zheng, Y.; Li, J.; Liu, W.; Liu, M.; Gao, W.; Shi, T. Stress corrosion crack evaluation of super 13Cr tubing in high-temperature and high-pressure gas wells. Eng. Fail. Anal. 2019, 95, 263–272. [Google Scholar] [CrossRef]
- Liu, W.Y.; Shi, T.H.; Lu, Q.; Zhang, Z.; Ming, C.; Gong, J.; Ren, J. Failure analysis on fracture of S13Cr-110 tubing. Eng. Fail. Anal. 2018, 90, 215–230. [Google Scholar] [CrossRef]
- Ngomo, V.; Fonlupt, S.; Coudreuse, L.; Baron, G. Environmental Cracking Performance of Super Martensitic Stainless Steels 13Cr in High Chloride Reservoir Fluids Containing H2S/CO2. In Proceedings of the CORROSION 2011, Houston, TX, USA, 13–17 March 2011. [Google Scholar]
- Morana, R.; Piccolo, E.L.; Scoppio, L.; Nice, P.I. Environmental Cracking Performance of Super Martensitic Stainless Steels “13-5-2” (Grades 110Ksi and 125Ksi) for Tubing Applications in High Chloride Reservoir Fluids Containing H2S/CO2. In Proceedings of the CORROSION 2010, San Antonio, TX, USA, 14–18 March 2010. [Google Scholar]
- Qi, W.; Wang, J.; Li, X.; Cui, Y.; Zhao, Y.; Xie, J.; Zeng, G.; Gao, Q.; Zhang, T.; Wang, F. Effect of oxide scale on corrosion behavior of HP-13Cr stainless steel during well completion process. J. Mater. Sci. Technol. 2021, 64, 153–164. [Google Scholar] [CrossRef]
- Jing, G.L.; Li, S.L.; Xing, L.J.; Guo, Y.Y.; Kong, L.R. Studing on the Scaling Mechanism of Injection Well Pipe. Adv. Mater. Res. 2010, 113–116, 231–234. [Google Scholar] [CrossRef]
- Gaudet, G.T.; Mo, W.T.; Hatton, T.A.; Tester, J.W.; Tilly, J.; Isaacs, H.S.; Newman, R.C. Mass transfer and electrochemical kinetic interactions in localized pitting corrosion. AIChE J. 1986, 32, 949–958. [Google Scholar] [CrossRef]
- Tarantseva, K.R. Models and methods of forecasting pitting corrosion. Prot. Met. Phys. Chem. Surf. 2010, 46, 139–147. [Google Scholar] [CrossRef]
- Batista, S.; Kuri, S.E. Aspects of selective and pitting corrosion in cast duplex stainless steels. Anti-Corros. Methods Mater. 2004, 51, 205–208. [Google Scholar] [CrossRef]
- GB/T 10561-2005; Steel-Determination of Content of Nonmetallic Inclusions-Micrographic Method Using Standards Diagrams. National Standard of the People’s Republic of China: Beijing, China, 2005.
- GB/T 6394-2017; Determination of Estimating the Average Grain Size of Metal. National Standard of the People’s Republic of China: Beijing, China, 2017.
- GB/T 13320-2007; Metellographic Grading Atlas and Assessing Method for Steel Die Forgings. National Standard of the People’s Republic of China: Beijing, China, 2007.
- Branch, C.A.; MÜller-Steinahagen, H.M. Influence of Scaling on the Performance of Shell-and-Tube Heat Exchangers. Heat Transf. Eng. 1991, 12, 37–45. [Google Scholar] [CrossRef]
- Qi, W.; Gao, Q.; Zhao, Y.; Zhang, T.; Wang, F. Insight into the stress corrosion cracking of HP-13Cr stainless steel in the aggressive geothermal environment. Corros. Sci. 2021, 190, 109699. [Google Scholar] [CrossRef]
- Vignal, V.; Ringeval, S.; Thiébaut, S.; Tabalaiev, K.; Dessolin, C.; Heintz, O.; Herbst, F.; Chassagnon, R. Influence of the microstructure on the corrosion behaviour of low-carbon martensitic stainless steel after tempering treatment. Corros. Sci. 2014, 85, 42–51. [Google Scholar] [CrossRef]
- Li, X.; Zhao, Y.; Qi, W.; Xie, J.; Wang, J.; Liu, B.; Zeng, G.; Zhang, T.; Wang, F. Effect of extremely aggressive environment on the nature of corrosion scales of HP-13Cr stainless steel. Appl. Surf. Sci. 2019, 469, 146–161. [Google Scholar] [CrossRef]
- Subramanian, S.; Ling, S.; Ramanarayanan, T.A. Characterization of Corrosion Scales on Fe-13Cr Stainless Steel. Microsc. Microanal. 1998, 4, 542–543. [Google Scholar] [CrossRef]
- Burstein, G.T.; Liu, C.; Souto, R.M.; Vines, S.P. Origins of pitting corrosion. Corros. Eng. Sci. Technol. 2004, 39, 25–30. [Google Scholar] [CrossRef]
- Frankel, G.S. Pitting Corrosion of Metals: A Review of the Critical Factors. J. Electrochem. Soc. 1998, 145, 2186. [Google Scholar] [CrossRef]
- Almarshad, A.I.; Jamal, D. Electrochemistry, Electrochemical investigations of pitting corrosion behaviour of type UNS S31603 stainless steel in thiosulfate-chloride environment. J. Appl. Electrochem. 2004, 34, 67–70. [Google Scholar] [CrossRef]
- Ogundele, G.; White, W.E. Some Observations on Corrosion of Carbon Steel in Aqueous Environments Containing Carbon Dioxide. Mater. Sci. 1986, 42, 71–78. [Google Scholar] [CrossRef]
- Nesic, S.; Postlethwaite, J.; Olsen, S. An Electrochemical Model for Prediction of Corrosion of Mild Steel in Aqueous Carbon Dioxide Solutions. Corrosion 1996, 52, 280–294. [Google Scholar] [CrossRef]
- Davies, D.H.; Burstein, G.T. The Effects of Bicarbonate on the Corrosion and Passivation of Iron. Mater. Sci. 1980, 36, 416–422. [Google Scholar] [CrossRef]
- Wang, H.; Li, Z. Diffusive shrinkage of a void within a grian of a stressed polycrystal. J. Mech. Phys. Solids 2003, 51, 961–976. [Google Scholar] [CrossRef]


Disclaimer/Publisher’s Note: The statements, opinions and data contained in all publications are solely those of the individual author(s) and contributor(s) and not of MDPI and/or the editor(s). MDPI and/or the editor(s) disclaim responsibility for any injury to people or property resulting from any ideas, methods, instructions or products referred to in the content. |
© 2023 by the authors. Licensee MDPI, Basel, Switzerland. This article is an open access article distributed under the terms and conditions of the Creative Commons Attribution (CC BY) license (https://creativecommons.org/licenses/by/4.0/).