Abstract
The aim of this study is to develop a methodology for static strength and failure mode simulation of hot-driven riveted joints. The purpose is to be able to accurately estimate a rivet joint’s static strength behaviour and its failure mode without relying on experiments, to save both time and resources during the design of joints. The non-linear finite element analysis modelling framework considered the rivet joint configurations and geometry, the material properties of the plate and rivet as well as the clamping force of the hot-driven rivet. A ductile damage model was also implemented to capture the stress softening of the materials and the failure modes of the joints. Using experimental data from literature, the modelling framework is validated, and it is shown that it is able to capture the strength behaviour and failure modes of different configurations of rivet joints markedly well. The effect of the rivet pre-load on the mechanical response of the joint is also studied and it is shown that the strength of the joint increased with the increase in rivet pre-load. The modelling framework is then applied to an industrial component. The modelling framework is used to compare welding and riveting as joining methods in a component built in two grades of high-strength steel. It is found that the welded joint possessed greater strength compared to the proposed riveted joint. However, using the proposed simulation methodology developed, a riveted joint with matching strength to the welded joint could be designed.
1. Introduction
The ultimate strength of a component is a crucial aspect to consider during the design process, and especially the ability to estimate the strengths of joints in order to ensure the integrity of the structure. One of the most common joining methods used in steel structures today is welding, however bolt joints and rivet joints are still employed throughout the industry. Different joining methods provide different advantages and disadvantages for the structural joint, and it is therefore important to be able to motivate the choice of joining method in a structure based on its structural integrity, weight, and cost effectiveness. Strength estimations have traditionally been performed through hand calculations and experimental studies in which the hand calculations often do not capture the true behaviour of the joints and experiments are expensive and time consuming. With the development of Finite Element Analysis (FEA), new opportunities to make accurate predictions are possible while reducing the number of experiments needed [1]. FEA is used for all types of joints to make more accurate predictions. Khurshid et al. [2] employed FEA modelling on welded butt joints in high strength steel (HSS) to determine the strength dependency on filler material and weld penetration and Nassiraei et al. [3] used FEA to determine the strength increase of x-joints through collar plate reinforcement.
For riveted joints, Finite Element (FE) simulation can be utilised both in studying the manufacturing process of the riveted joint and defining its static and fatigue strength. Baha II et al. [4] examined how the parameters in the installation process of solid rivets affect the joints’ mechanical properties using FEA. Experiments on rivet installations were used to validate the model and it showed good agreement with both the formed shape of the rivet head and force displacement curves. A parametric study was also performed to examine the installation parameters effect on the residual contact force and the residual stress in the solid rivet joint. It was shown that an increased grip length of rivets decreased residual radial stress, and increased rivet clearance fit decreased residual radial stress. A similar study was performed by Chen et al. [5] where the installation process of two different types of rivets were simulated using an FEA model and compared with experimental testing results. The FEA model was validated by showing similar results of the final shape of the rivet after forming, similar force-displacement behaviours and similar distributions of strain hardening compared to the experiments. The installation parameters could also affect the joint fatigue strength, something shown by [6,7]. Zhao et al. [8] studied the shear capacity of blind-rivet connections made in steel through FE analysis. Using data from a parametric experimental study of blind-rivet connections, a validated FEA model was developed and used to extend the parametric study mainly to investigate the spacing between rivets and the number of rivets in the joint. They concluded that the strength of the joint improved both with increased number of rivets and increased space between rivets. Theoretical models can also be used to predict the shear behaviour of riveted joints [9,10,11]. Simpler models for modelling bolted joints using FEA has been developed by Belardi, showing good accuracy [12]. Sire et al. [13] studied the impact of the clamping force of the strength of a hot-driven rivet. This was performed through shear tests on joints consisting of hot-driven rivets, which imposed a clamping force on the joint, and joints joined by a pin which imposed no clamping force. The experimental results showed that the clamping force increased joint strength by ca. 10%. Al-Bahkali [14] studied the effect of thermal stresses from hot-driven solid-rivet joints through FEA. The study showed that the clamping forces introduced from the rivet increased the strength of the joint. Leonetti et al. [15] also examined the clamping force from hot-driven rivets. The study was to look at the clamping force of rivets found in old steel bridges. It was found that the average clamping force was 100 MPa, however there was a large scatter in the results. Stevens et al. [16] studied the correlation between surface hardness and shear strength of hot-driven solid rivets in order to evaluate the strength of a riveted structure by measuring surface hardness only. A relationship between hardness and shear strength was proposed as 4.8 MPa/HRB. In field tests, a large spread of hardness of rivets was identified and it was therefore deemed inappropriate to extrapolate that hardness and strength to all the rivets in the structure. The method could, however, be used on more local joints to provide strength predictions. Lepretre et al. [17] studied the process of hot driving rivets in old steel structures using experiments and numerical methods. By measuring strains and temperatures during the manufacturing of hot-driven rivet joints, the residual stress in the joint could be evaluated. Using these experimental results, a FEA model was developed and verified. The FEA model showed a pre-stress of 90 MPa between the plates and it was concluded that the pre-stress distribution around the rivet holes could be useful for predicting where cracks would emerge in fatigue loading. The fatigue life of rivet joints in ageing steel bridges has been studied by [18,19]. Xu and Wang [20] proposed a multi-purpose optimisation for magnesium/aluminium alloy solid rivets. The optimisation considered the material, the structure, the manufacturing process, and the performance. Experiments were performed to establish the material properties and the strengths of the riveted joints. FEA models were developed for the manufacturing process of joints and strength tests on joints, and these models were verified by the experimental data. The FEA models were then used for the optimisation with optimisation goals of, e.g., maximising joint shear strength. By optimising the design variables such as material properties and joint dimensions, the shear strength of the joint could be increased by 13 %. Silva et al. [21] studied multiple-site damage in riveted lap joints and could show that fatigue cracks often initiated at the rivet holes where they could not be seen without non-destructive testing methods. It was also shown that fatigue cracks drastically reduced the joint residual static strength. Amiri [22] studied the use of equivalent initial flaw size (EIFS) using two methods of measuring the stress, the coefficient of cyclic intensity and the cyclic integral. Conclusions were that when using the coefficient of cyclic intensity, the EIFS value was dependent on the loading compared to using the cyclic integral which reduced the dependency on the loading state. Models for prediction of fatigue life in riveted joints have also been made in [23,24]. Fuiorea et al. [25] studied the influence of rivet parameters on the fatigue strength of riveted joints in aircraft structures. The parameters examined included rivet installation force, rivet size, plate thickness, rivet type, and the number of rows of rivets. Conclusions from the study were that increased rivet diameters increased fatigue life and that countersunk rivets outperformed round head in fatigue strength.
Baghous and Barsoum [26] developed ductile failure criteria based on the stress triaxiality and the Lode parameter for multiple steel grades. The failure criteria developed were extensions of current ASME failure criteria, and it was concluded that the newly developed criteria could assess ductile failure to a higher level of accuracy compared to current ASME standards. This was shown by applying the failure criterion assessment methodology developed, and the current ASME failure criteria, on an industrial structure and comparing the predicted results. In this study, the objective was to develop a methodology for FEA simulation of the static strength of hot-driven riveted joints, including damage modelling. The modelling framework will examine the parameters in the modelling of the rivet joint that conduct the joint strength behaviour as well as including a damage model for the different failure modes of the rivet joint. The modelling framework is validated by experimental data found in literature where rivet joints, built from aged steel parts, were tested in lap shear tests [27]. The validated modelling framework is then applied to an industrial component where an optimised riveted joint is developed that matches the strength of the current welded joint. Strength analyses on welded joints in similar components have been performed in [2,28,29,30]. A similar strength model has also been developed for hot-driven rivets in [31] and for self-piercing rivets in [32,33,34] and for spotwelds in [35]. Unlike these studies, this paper will focus on the assessment of solid riveted joints applied on an industrial component in order to investigate new design solutions without relying on experimental testing, therefore saving time and resources.
2. Experiments on Riveted Joints
D’Aniello et al. [27] performed extensive testing on different configurations of hot-driven solid rivet joints. In their study, various riveted joint configurations and arrangements were manufactured and tested. The parameters examined in their study included load eccentricity, dimensions of plates and rivets, number of rivets, and the length of the rivet joint.
2.1. Rivet Joint Configuration
The configurations of the rivet joints were dependent on the parameters to be studied, i.e., load eccentricity, dimensions of plates and rivets, number of rivets, and the length of the rivet joint. A joint consisting of two plates would give unsymmetric loading leading to a secondary bending moment in the joint, while a joint consisting of three plates would give a symmetric load, as shown in Figure 1a,b, respectively. The rivet joints configuration consist of plate width w, plate thickness t, rivet shank diameter d, rivet shank length (dependent on plate thickness and number of plates in joint), rivet distance from the plate edge r and the rivets pitch p, all of which can be observed in Figure 1a. A total of 22 configurations of rivet joints were examined in the study by D’Aniello et al. [27] and nine of these were chosen to be modelled in this paper. They were chosen as they cover all the dimensional parameters and capture all the governing failure modes observed. The specifications of the selected joints can be seen in Table 1 and in Figure 1. The configurations are named based on their characteristic features such as c-d-t-n, where c is the plate configuration (i.e., symmetric or unsymmetric), d is the rivet shank diameter, t is the plate thickness, and n is the number of rivets in joint.
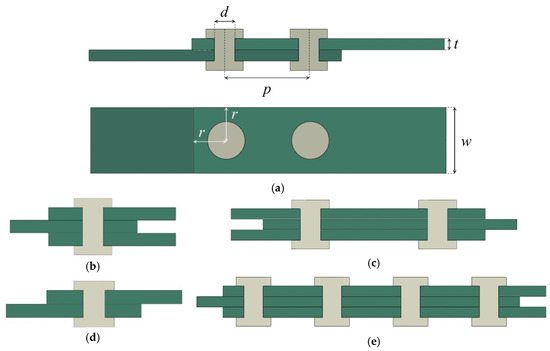
Figure 1.
Specimen (a) SN-8, (b) SN-1, (c) SN-7, (d) SN-2, (e) SN-9, as per Table 1.

Table 1.
Configurations for riveted specimens adapted from [27].
2.2. Experimental Results
The experimental results from testing of riveted joints by D’Aniello et al. [27] are utilised in this study in order to verify the FEA modelling framework. The manufactured rivet joints in [27] were tested through lap shear tests. Using displacement-controlled loading, the mechanical response was recorded until joint failure. In view of Figure 2, the results from the lap shear tests in [27] are provided as force versus displacement (δ), the maximum ultimate force Fu, the displacement corresponding to the ultimate force δu, and the conventional elastic force Fe. The conventional elastic force Fe is determined by a bi-linear response up to the ultimate force Fu, with the bi-linear response having the same area under the graph as the actual force-displacement curve with the same initial stiffness and ultimate force. The displacement corresponding to the elastic force is denoted δe, and the force and displacement equal to 80% of the ultimate force after the peak load are denoted Fmax and δmax, respectively. These quantities are depicted schematically in Figure 2. These quantities were presented for all the rivet joint cases in [27] and five full force-displacement curves (SN-1, SN-2, SN-3, SN-8, and SN-9 in Table 1) were extracted and digitalised for the purpose of validating the FEA modelling framework. Three different failure modes were observed in [27]: (i) rivet shear failure, (ii) bearing at the rivet hole of the plate, and (iii) failure in the net section of the plate.
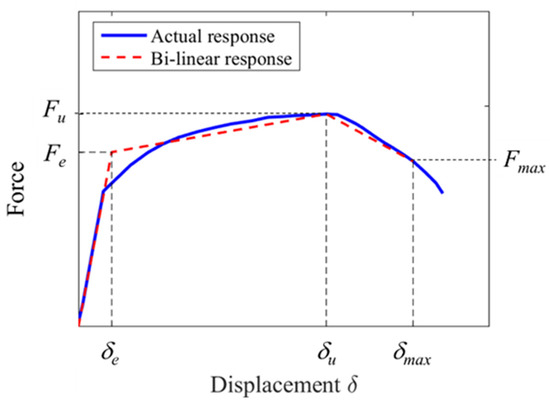
Figure 2.
Bi-linear response approximation of the rivet joint tests force vs. displacement results.
2.3. Plate and Rivet Material
As the plates and rivets were manufactured in the 1950s, the steel grades for the rivet and plate material were not initially known in [27]. Therefore, both the plate and the rivet material was tested in [27] to determine their tensile stress–strain behaviour until failure. Tensile tests were conducted on four plate specimens and the corresponding extracted stress–strain curves, up to the maximum stress where necking is initiated, are shown in Figure 3a. Similarly, tensile tests on nine different rivet specimens were conducted, and the corresponding extracted stress–strain curves, up to the maximum stress, are shown in Figure 3b. The materials damage behaviour was also considered and will be presented under Section 3.1. The stress–strain curves in Figure 3 are fitted to an isotropic elasto-plasticity model given by
where is the initial yield strength, the initial yield strain, a normalizing strain, an offset strain, and is the hardening exponent [26]. In the strain region the stress is constant at , pertaining to a Lüder Plateau as evident in some tensile tests on the rivet material in Figure 3b. For no exhibition of a Lüder Plateau, the offset strain is set to zero and the normalising strain is equal to the initial yield strain . The parameters in Equation (1) are provided for both the plate and rivet material in Table 2. Results in Table 2 show that the plate material has an average yield () and ultimate tensile strength () of 300 MPa and 514 MPa, respectively, and with a standard deviation of ±4 MPa and ±6 MPa, respectively, indicating little variation in strength properties. Based on the experimental results, the plate material was identified as a modern S 275 steel in [27]. Contrarily, the rivet material shows a significant spread in strength properties, with average yield and ultimate strength of 325 MPa and 480 MPa, respectively, and with a standard deviation of ±23 MPa and ±21 MPa, respectively. This is mainly attributed to the lack of control in manufacturing when the rivets were produced [27]. No modern equivalent for the rivet material could be identified in [27].
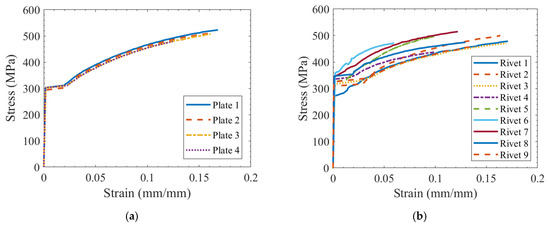
Figure 3.
Experimental true stress–strain curves for the (a) plate material and (b) rivet material.
Table 2.
Material model parameters (Equation (1)) for plates and rivets.
3. Finite Element Modelling
In order to model the rivet joint experiments in Table 1, a three dimensional non-linear FEA model with quasi-static loading was built in Abaqus/Explicit [36] for all cases in Table 1. In Figure 4, the FEA model is shown pertaining to Case SN-2 in Table 1. The rivets and plates are meshed with linear hexahedron and tetrahedral elements (e.g., C3D8R). The global element size in both rivets and plates is set to 2 mm, however, refinements in the mesh down to the size 0.3 mm is used in critical regions, as shown in Figure 4. The number of elements in the models ranged from 90,000 to 350,000. Contact interaction is defined between the plates and between the plate and the rivets, with a friction coefficient [37]. The rivet diameter was set equal to the rivet hole diameter, resulting in zero clearance. This is attributed to the hot driving installation process of the rivets [13]. The boundary conditions of the riveted joint, as shown in Figure 4, consist of a fixed displacement at left end, a prescribed displacement at the right end while a symmetry condition in the y-direction was used in the symmetry plane shown in Figure 4.
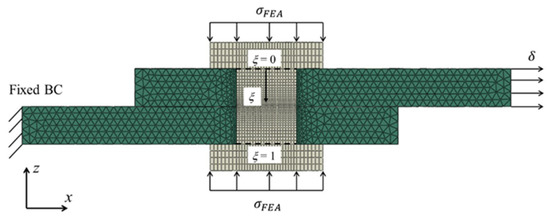
Figure 4.
Boundary conditions and mesh on the rivet joint.
3.1. Material Model
The material model used, for both the plate and rivet material, is the isotropic elasto-plastic model given in Equation (1). Damage in the materials were also modelled, and the damage behaviour was represented by a ductile damage model. A ductile damage criterion, based on accumulated plastic strain, is used by [2,26], in which it is assumed that the onset of ductile failure, i.e., damage initiation, occurs when the accumulated effective plastic strain in a material point in the model reaches a critical value , which corresponds to the strain attained at the ultimate strength () and is obtained from tensile tests. The critical strain at onset of ductile failure is listed in Table 2 for both the plate and rivet material. A schematic representation of the material damage in relation the stress–strain curve of the material is shown in Figure 5a.
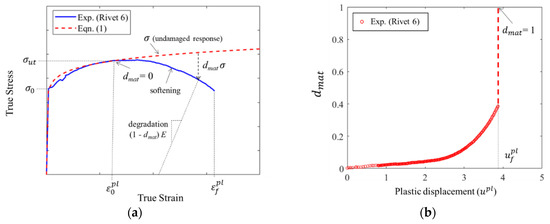
Figure 5.
(a) Schematic representation of damage model and (b) evolution of damage variable vs. plastic displacement for rivet 6.
After initiation of damage [38], the ductile damage evolution is modelled through a scalar damage approach in which the experimental true stress–strain softening response () of the material is related to the undamaged theoretical response () through
where is given by Equation (1), is the stress softening response, and is the damage parameter ranging between zero at onset of damage and one at complete loss of stiffness at equivalent plastic strain at failure , [39], i.e., at complete failure, as depicted in Figure 5a. Stiffness softening due to material damage is modelled through
where is the initial Young’s modulus and is the degraded Young’s modulus after damage initiation. The softening in the post damage initiation stage and the evolution of the scalar damage parameter is characterised by a stress-displacement response [40], and requires the introduction of characteristic length associated with a material point which is computed automatically in the FEA model based on element geometry and size. The evolution of the damage parameter as function of plastic equivalent displacement measured over the gauge length (i.e., = as shown in Figure 5b, is determined from the stress–strain values in the softening branch in Figure 5a. Hence, the plastic displacement at failure can be determine at = 1. Complete loss of load-carrying capacity in an element is achieved when the effective plastic displacement in the element, i.e., = , reaches the where is the characteristic length of the finite element [41]. The values for the plastic displacement at failure ranged between 0.05 to 2.1 mm.
3.2. Contact Interaction and Boundary Conditions
Contact interaction is defined between the plates and between the plates and the rivets using self contact in Abaqus, allowing Abaqus to define the relevant contact pairs. A friction coefficient of was used for all contacts. The boundary conditions of the riveted joint, shown in Figure 4, consist of a fixed displacement boundary condition on the left end, and a prescribed displacement δ in the x-direction applied through a reference point which is kinematically coupled to the right end of the model. Symmetry condition in the y-direction was used in the symmetry xz-plane shown in Figure 4.
3.3. Pre-Load in Rivets
The pre-load in the rivets was modelled through a pressure applied on the rivet head, as shown in Figure 4, resulting in a stress distribution through the rivet shank and hence a clamping force on the plates. The axial stress distribution through the rivet shank along the normalised axis ξ, as defined in Figure 4, is determined after the application of the pressure , and the corresponding FEA results are shown in Figure 6a. As can be seen, the stress distribution is rather uniform throughout the shank length and the approach used here to model the pre-load in the rivets is adequate.
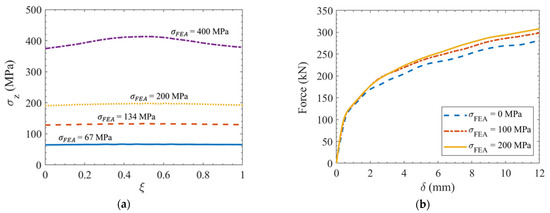
Figure 6.
(a) Stress distribution through rivet shank at various pre-load levels and (b) effect of pre-load on force vs. displacement of rivet joint case SN-2.
The effect of the pre-load on the force-displacement behaviour was studied for Case SN-2, using three different pre-load levels. The results in Figure 6b show that the pre-load level exerts a moderate effect on the force vs. displacement response of the rivet joint, with a moderate increase in joint strength with an increase in pre-load, which has also been noted by Al-Bahkali [14] and Sire et al. [13].
4. Validation of FEA Modelling Framework
To validate the FEA modelling framework, the force-displacement responses and the corresponding failure modes were compared between the FEA simulation results and the experiments extracted and digitalised from [27]. Initially, the five cases with the full force vs. displacement responses, i.e., SN-1, SN-2, SN-3, SN-8, and SN-9 as per Table 1, were modelled and compared, as shown in Figure 7. An additional four cases, SN-4, SN-5, SN-6, and SN-7, as per Table 1, were also simulated, and the results compared with the experimentally obtained characteristic strength parameters of the rivet joints depicted in Figure 2. The material properties of the rivet and plate materials were chosen in the range determined in the material experiments, tabulated in Table 2, and the pre-load in the rivets was set in the range between 20 and 220 MPa, following [27].
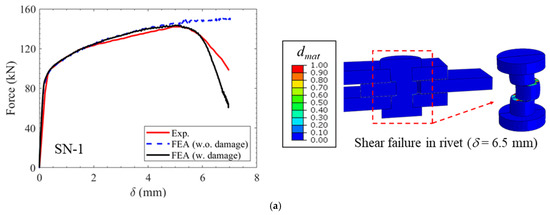
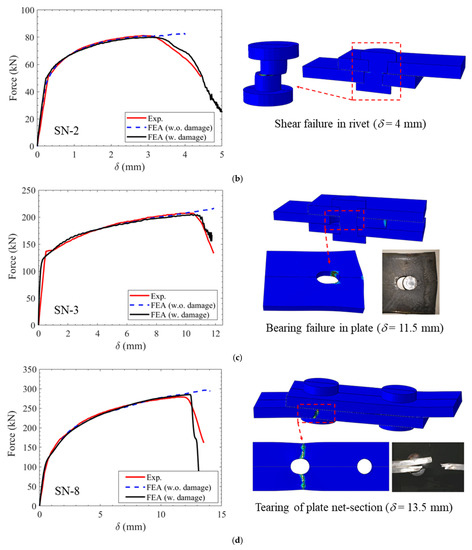
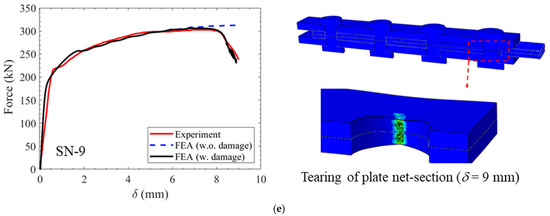
Figure 7.
Force vs. displacement curves comparing experimental data with FEA results and deformed configuration at instance of governing mode of failure: (a) SN-1, (b) SN-2, (c) SN-3, (d) SN-8, and (e) SN-9. Experiments are adapted from [27].
As can be observed in Figure 7, the FEA results compare markedly well with the experimental mechanical response, i.e., force vs. displacement. The FEA force vs. displacement results are provided for both the cases modelled, with and without the ductile damage criterion. It is clear that without accounting for material damage in the FEA simulations, it is not possible to capture the full softening behaviour associated with the various failure modes in the experiments. Especially as softening of the structure is attributed to both geometrical and material softening, by disregarding the material damage model, only the geometrical softening is captured. Figure 7 also shows the contour plots at instance of failure for each of the cases considered, pertaining to the scalar damage parameter dmat. It reveals that for the double lap shear joint in Figure 7a and the single lap shear joint in Figure 7b, the governing failure mode is shear failure in the rivets, where the plates do not develop any damage. For Figure 7c,d the governing failure modes are bearing failure in the plate and tearing of the net-section of the plate, respectively, as also confirmed by the experiments. It should be emphasised here that all failure modes predicted by the FEA model agree extremely well with the governing failure modes in the experiments.
In Table 3, the characteristic strength parameters (c.f. Figure 2) of all nine rivet joints obtained through FEA and experiments are tabulated. It can be seen that there is a rather a high level of agreement between FEA and experiments for all rivet joint strength parameters (i.e., Fe, δe, Fu, δu, and δmax), including the predicted versus actual modes of failure in the joint.
Table 3.
Comparison of experimental and FEA simulation results for rivet joint strength parameters.
Through the nine simulated cases, the effect of rivet joint configuration on the overall joint strength and governing failure mode may be fully studied. It can be concluded that the most influential factors are the diameter of the rivet shank, the thickness and width of the plates, the number of rivets in the joint and the symmetric or unsymmetric configuration of the joint with respect to loading.
While the strength of the joint is governed by the strength of the rivet, an increase in rivet shank diameter will also increase joint strength until a different failure mode governs. This can be observed for the two un-symmetric cases SN-2 (d = 16 mm) and SN-4 (d = 19 mm) showing 34% increase in Fu when the rivet diameter is increased from 16 mm to 19 mm. In both these cases, shear failure of the rivet is the governing failure mode. With a further increase of the rivet diameter a different failure mode, e.g., tearing of the plate or plate bearing, would govern. This can be seen by comparing the two symmetric cases SN-1 (d = 16 mm) and SN-3 (d = 19 mm) in Table 3 showing approximately a 42% increase in ultimate force Fu. For these two cases, SN-1 is governed by shear failure of the rivet, while in SN-3, the failure is governed by bearing failure of the plate. It is worth noting that the plate width for the two cases is also different. This, however, should not impact the bearing strength of the plate as this is mainly dependent on the plate thickness and the rivet diameter [42].
The impact of the joint being symmetric or unsymmetric can be seen by comparing the cases SN-1 and SN-2. Here, the strength of the joint is increased in the symmetric joint. This because both joints are governed by the strength of the rivet, as both experience shear failure of the rivet. When a symmetric configuration is used, two shear planes of the rivet are loaded, thus decreasing shear load on each of the shear planes.
The examination of the influence of plate thickness appears to be most viable between SN-4 and SN-5 as they have the same joint configurations except for the plate thickness, t = 10 mm for SN-4 and t = 12 mm for SN-5. The governing failure mode for both these cases, however, is shear failure of the rivet which is not affected by plate thickness. This is also reflected in the results, as both cases have similar ultimate force Fu strengths as shown in Table 3.
The effect of number of rivets on joint strength can be seen when comparing cases SN-3 (n = 1) and SN-7 (n = 2), both having same rivet diameter and plate thicknesses, showing an 80% increase in Fu in Table 3, which is a conclusion also drawn in [8,27]. For these two cases, it can also be observed that the failure mode changes due to the increased number of rivets used, from bearing failure in the plate in SN-3 to tearing failure of the net section of the plate in SN-7.
5. Application to Industrial Component
In order to verify the simulation modelling framework developed, a study on a beam component common in spreaders [28] was performed. Spreaders are large steel structures used in lifting systems in, e.g., ports. The use of spreader and their loading conditions have been studied in [43]. The component consists of a rectangular hollow beam structure with four welded stiffener cover plates attached to its top surface and being symmetric about the yz-plane as shown in Figure 8. The current reference beam structure shown in Figure 8 has its stiffener cover plates attached through an all-around welded joint, as shown in Figure 9, and the beam and stiffener plates are manufactured from two grades of high strength steel. High strength steels exhibit high strength and excellent mechanical properties, such as toughness, ductility, and fatigue resistance. These properties are a result of the unique microstructure, which is typically characterized by a fine-grained, homogeneous structure through a combination of alloying and processing techniques. The microstructure of High Strength Steels (e.g., S600 and S900) is typically a combination of ferrite, pearlite, and small amounts of other phases, such as bainite and martensite. The purpose of the analysis is to examine whether the component could be joined with rivets, instead of the current weld joint, and yet achieve the same overall strength and stiffness as the current configuration of the attachment. Additional aspects, other than the overall strength and stiffness, must also be considered, such as ability to manufacture the joint and its overall weight. The study was conducted using the FEA-developed modelling framework, which is applied to the component in its welded and riveted joint configuration.
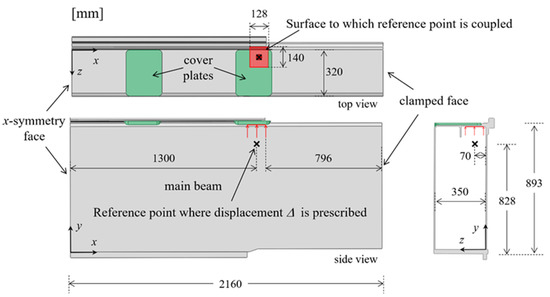
Figure 8.
Overview of the beam structure showing top and side view of the component, with its symmetry yz-plane.
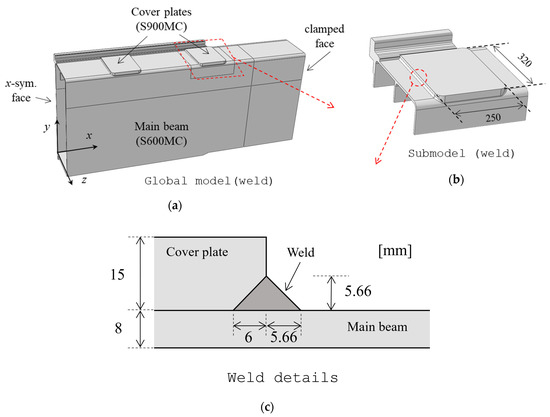
Figure 9.
Model for the welded configuration showing: (a) the global model, (b) the submodel and (c) dimensions of the weld.
The non-linear FEA model is built in Abaqus/Explicit with large deformation theory. The load and boundary conditions applied to the beam structure are such that a realistic loading scenario of the spreader beam component can be modelled [28]. Clamped boundary conditions are applied on both ends of the full beam, and since only half of the beam is modelled, a clamped condition is used on the right side and x-symmetry boundary condition is used on the left side as indicated Figure 8. The beam structure is subjected to displacement-controlled loading Δ in the y-direction and is prescribed on a surface located beneath the rightmost cover plate shown in Figure 8. This is achieved through a kinematic coupling of the prescribed surface to a reference point to which the displacement Δ is applied, and the reaction force at the reference point is monitored throughout the loading history.
Considering the substantial size of the component, and thus the computational cost, a submodelling routine was used in the analysis in order to capture both the global behaviour in the component and the local phenomenon in the region of interest, which is at the right cover plate where the displacement is applied. Similar submodelling routines applied to welded structures have been used in [29,44,45]. A global model and submodel created for both the welded and the riveted case can be seen in Figure 9 and Figure 10 for the weld and rivet case, respectively. The global model for both the welded and riveted case are meshed with quadratic tetrahedral elements (C3D8R) using a global element size of 80 mm and mesh refinements down to 10 mm in critical regions, which resulted in a total of 20,862 elements in the global welded model and 52,681 elements in the global riveted model. The submodels were built in a similar fashion, with a global mesh size of 20 mm and refined regions with element size 2 mm, which resulted in a total of 98,640 elements in the welded submodel and 554,560 elements in the riveted submodel. The main beam is made of HSS S600MC, with properties given in [46], and the cover plates are made of HSS S900, with properties given in [47]. The materials are modelled as elasto-plastic with isotropic hardening, following Equation (1), and the corresponding material true stress–strain curves and material model parameters are provided in Figure 11 and Table 4, respectively. The global models were run without the consideration of damage, and the displacement results from the global models corresponding to the boundaries of the submodel are used as displacement boundary conditions in the submodel. The damage criterion was applied in the submodels, and the simulations were run until component failure in the submodels.
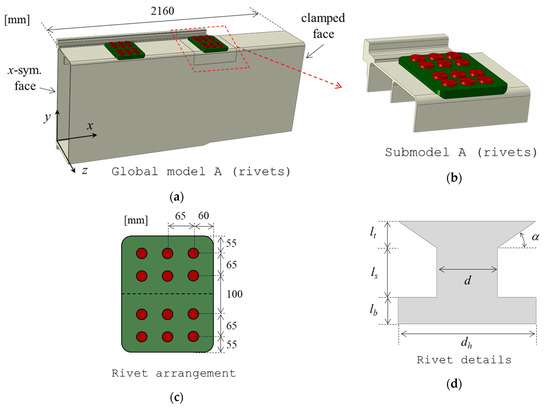
Figure 10.
Model A for the riveted configuration showing: (a) the global model, (b) the submodel, (c) the rivet arrangement, and (d) the dimensions of the rivet.
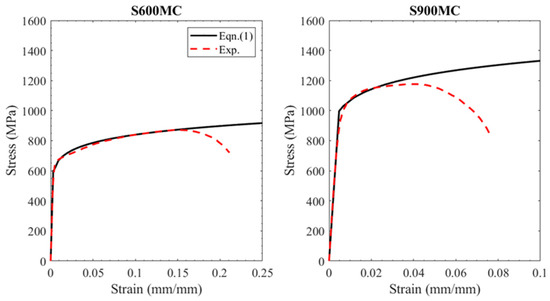
Figure 11.
True stress–strain curves, with both the elasto-plastic model and the experimental values, for the materials S600MC and S900MC.
Table 4.
Material properties for the S600MC and S900MC steels.
As shown in Figure 9, the welded joint consisted of a fillet weld which stretched fully around the stiffener cover plate. The weld was made with matching filler material to the S900MC steel, and its dimensions are stated in Figure 9.
The proposed riveting joint, model A as shown in Figure 10, consisted of 12 hot driven rivets in a 4 × 3 pattern, with a shank diameter of d = 22 mm. The placement of the rivets in Figure 10c was guided by the Eurocode 3 standard [48]. The component required a flushed surface on the inside of the main beam and therefore countersunk rivets were used with a head height of lt = 8 mm and head angle of α = 30°, as shown in Figure 10d, with shank lengths ls = 15 mm, lb = 8 mm, and dh = 50 mm. The hot driven rivets are assumed to be made of the S900MC steel and a rivet pre-load of 100 MPa was applied to the rivets, corresponding to the rivet pre-load in hot-driven rivets as indicated in [9,37]. The plate thickness was kept at 15 mm, as seen in Figure 9c.
5.1. Results of Joining Methods
The force versus displacement (Δ) curves of the submodels for the welded and riveted case can be seen in Figure 12. The forced and displacement was recorded in the y-direction at the reference point seen in Figure 8. Comparing the two cases, the welded joint is stiffer and has a 26% higher peak force than the riveted joint. Hence, the proposed riveted solution does not match the strength of the welded joint, which is mainly attributed to the lack of clamping force that can be achieved with the riveted joint.
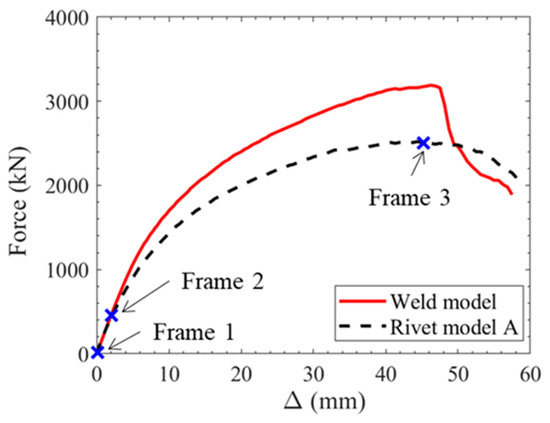
Figure 12.
Force vs. displacement curve from the submodels of the welded and the riveted (model A) cases.
Figure S1, Supplementary Material, shows the contour plots of the contact stress between the stiffener cover plate and the main beam plate after the pre-load in the rivets has been applied, i.e., at displacement Δ = 0 pertaining to Frame 1 in Figure S1a, Supplementary Material.
It can be observed that the pre-load in the rivets is transferred to a contact stress between the plates, giving rise to an insignificant friction joint. However, the contact stress is only present locally and non-uniformly around the rivet holes and is not distributed throughout the plate. As the prescribed load increased to Δ = 2 mm (i.e., Frame 2 in Figure S1b, Supplementary Material), the contact stress distribution changed slightly as can be seen from Figure S1b, Supplementary Material, where higher contact stresses are presented in the middle of the beam arising from the base plate pushing the cover plate upwards as displacement increases. At the load of Δ = 2 mm, yielding occurs in the base plate, seen in Figure S1e, Supplementary Material, in the cover plate, seen in Figure S1h, Supplementary Material, and in the rivets, seen in Figure S1k, Supplementary Material. This indicates that the structure is no longer operating in the elastic range.
At the ultimate force (i.e., Δ = 45 mm, frame 3 in Figure S1c, Supplementary Material), the contact stress distribution shown in Figure S1c, Supplementary Material, changes rather significantly as a consequence of the prominent level of deformation and it can be noted that the rivet holes undergo significant deformation due to high bearing stresses. The main beam base plate also starts to fail, as seen in Figure S1f, Supplementary Material, is followed by a gradual drop in the force vs. displacement response. The lack of a uniform contact stress distribution between the two plates, caused by the pre-load in the rivets, is insufficient to creating an adequate friction joint between the two plates, hence this rivet joint configuration yields an unsatisfactory static stiffness and strength in comparison to its welded counterpart.
Notwithstanding, using the proposed modelling framework, a riveted pattern and joint may be found to match the strength of the welded joint by modification of the characteristics of the rivets and the stiffener plates.
5.2. Re-Design of the Riveted Joint
Alluding to the results obtained for the rivet model A above, it is here examined whether a different configuration of stiffener cover plate and riveted joint could be designed to match the strength of the reference welded joint. An extended riveted stiffener cover plate design, Model B, is therefore considered by merging the two existing stiffener cover plates as shown in Figure 13a. The extended plate consists of a 4 × 15 rivet pattern, resulting in a total of 60 rivets. The distance between the rivets and between the rivets and the plate edges were kept the same as in the initial riveting pattern, i.e., model A. In order to achieve a more uniform contact stress distribution between the plates after the rivet pre-load is applied, counter-bored rivets were used in model B using dimensions d = 25 mm, lt = 4 mm, α = 0, ls = 19 mm, lb = 8 mm, and dh = 57 mm (c.f. Figure 10d).
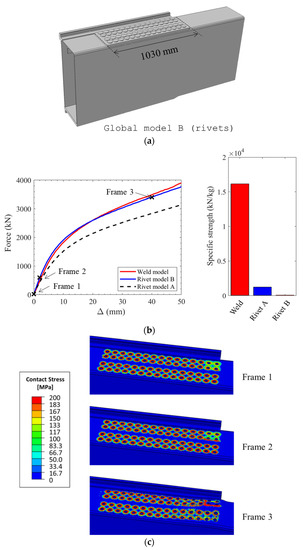
Figure 13.
(a) Global model of the extended riveted joint, (b) force vs. displacement response and specific strength, and (c) contour plot of contact stress.
A rivet pre-stress of = 200 MPa was applied, corresponding to the highest pre-stress value indicated in [49]. Due to the increased computational cost of model B, only the global model was considered and the force versus displacement response, recorded in the y-direction at the reference point seen in Figure 8, was compared with the corresponding global model results for the weld and Rivet Model A as shown in Figure 13b. It is evident from Figure 13b that initial stiffness is slightly increased for Rivet Model B as compared to its other two counterparts, but overall, the new Rivet Model B matches the weld stiffness and strength quite well. This is mainly attributed to the increased size of the stiffener cover plate, but also due to the more uniformly distributed and increased level of contract stress pattern between the two plates, resulting in an increased clamping effect, as shown in the contract stress contours in Figure 13c. The drawback of the new riveted joint design, i.e., Model B, is its significant increase in weight. In order to make a more adequate comparison of the performance of the various joints studied, the specific strengths, i.e., the ultimate force divided by the weight of the joint, is compared in Figure 13b. It can be noted that the specific strength of the welded joint is orders of magnitudes greater than the specific strength of the initial (Model A) and the extended riveted joint (Model B). It can be concluded that the riveted joints can achieve the stiffness and strength level of the welded joint, and hence be a good candidate for replacement in the spreader structure studied if the total weight of the joint is not a design concern. Apart from the increased weight of the joint, other concerns related to replacing the welded joint with a riveted joint is the lack of knowledge of riveting in HSS. The use of HSS in hot riveted structures has, to the authors’ knowledge, not been explored experimentally in any literature. Therefore, the true behaviour of hot driven rivets in HSS is not fully understood, which is a limitation to this study. Some concerns that could arise in hot driven HSS rivets could be the change of material properties when heating the HSS as indicated in [50], and changes in HSS material properties due to large-scale deformations during the riveting process. This is something that could be explored in future studies.
Regarding the methodology used in this study, one point which should not be overlooked is the discrepancy in loading cases and materials used in the verification of the simulation methodology and its application on the industrial component. As the loading case in the industrial component is more complex, compared to the shear loading used in the validation of the methodology, the framework might be seen as unconservative as it might not be able to capture all possible failure modes related to the more complex loading. This would however only be a concern to this study if the outcome would be in favour of the riveted joining solution. Then, the modes which could further weaken the rivet joint would have to be explored through experiments and development of the simulation methodology to make the framework more robust and give a more accurate strength prediction for the structure.
6. Conclusions
In this study, an advanced FEA modelling framework is proposed, capable of predicting the strength and failure modes of riveted joints in steel engineering structures. The model considers the joint geometry, the material properties of the rivet, and the plate and the clamping pre-load forces of the rivets. The governing failure modes of the rivet joints are rivet shear failure, bearing at the rivet hole of the plate and tearing of the net section of the plate, which are captured extremely well in the proposed modelling framework based on a continuum damage modelling approach. The modelling framework is validated through experimental results available in literature and is able tox predict the effect of the geometric parameters of the joint, such as rivet shank diameter, number of rivets in joint, and the symmetrical or unsymmetrical configuration of the joint, on the overall mechanical response of the joint up to the instance of failure.
The modelling framework was utilised to compare a welded joint in an industrial component, commonly used in spreaders, with a proposed riveted counterpart. The initially proposed riveted joint for this industrial component did not achieve the same strength level as the welded joint. A riveted solution could be found matching the initial strength of the welded joint, however at an increased weight. Hence, it can be concluded that a riveted joint can achieve the stiffness and strength level of the welded joint, and hence would be a good candidate replacement in the spreader structure studied as long as the total weight of the joint is not a design concern.
Supplementary Materials
The following supporting information can be downloaded at: https://www.mdpi.com/article/10.3390/met13030500/s1, Figure S1. Contact stress distribution from rivet submodel A on the main beam at displacement (a) Δ = 0 mm, (b) Δ = 2 mm and (c) Δ = 45 mm. Effective stress distribution on the main beam at displacement (d) Δ = 0 mm, (e) Δ = 2 mm and (f) Δ = 45 mm. Effective stress distribution on the cover plate at displacement (g) Δ = 0 mm, (h) Δ = 2 mm and (i) Δ = 45 mm. Effective stress distribution on the rivets at displacement (j) Δ = 0 mm, (k) Δ = 2 mm and (l) Δ = 45 mm. Deformation magnification is set to 1.
Author Contributions
Conceptualization, A.L., I.B., Z.B. and M.K.; methodology, A.L. and I.B.; formal analysis, A.L.; investigation, A.L.; resources, Z.B. and M.K.; writing—original draft preparation, A.L.; writing—review and editing, A.L., I.B. and M.K.; supervision, I.B., Z.B. and M.K.; project administration, M.K.; funding acquisition, M.K. All authors have read and agreed to the published version of the manuscript.
Funding
Cargotec Sweden AB Bromma Conquip is gratefully acknowledged for the financial support of this work.
Institutional Review Board Statement
Not applicable.
Informed Consent Statement
Not applicable.
Data Availability Statement
Data will be shared upon request.
Conflicts of Interest
The authors declare no conflict of interest.
Nomenclature
| c | Configuration of plates |
| d | Rivet shank diameter |
| dmat | Damage in material |
| E | Young’s modulus |
| E’ | Diminished Young’s modulus |
| Fu | Ultimate strength |
| Fe | Conventional elastic strength |
| Fmax | Force equal to 80% of the ultimate strength after the peak load |
| lb | Bottom rivet head height |
| le | Characteristic length |
| lg | Gauge length |
| ls | Rivet shank length |
| lt | Top rivet head height |
| n | Number of rivets |
| N | Hardening exponent |
| p | Pitch between rivets |
| r | Rivet distance from plate edge |
| SN | Specimen number |
| t | Plate thickness |
| upl | Plastic equivalent displacement |
| ufpl | Plastic equivalent displacement at fracture |
| w | Plate width |
| α | Rivet head angle |
| δ | Displacement |
| δu | Displacement corresponding to ultimate strength |
| δe | Displacement corresponding to elastic strength |
| δmax | Displacement corresponding to force equal to 80% of ultimate strength |
| Δ | Displacement-controlled loading |
| ε | Strain |
| ε0 | Initial yield strain |
| εN | Normalizing strain |
| εS | Offset strain |
| Strain rate | |
| Equivalent plastic strain at onset of fracture | |
| σ0 | Yield strength |
| σFEA | Pressure applied on rivet heads |
| σut | Ultimate strength |
| Experimental true stress following softening response | |
| ξ | Normalized length of rivet shank |
References
- Koç, M.; Allen, T.; Jiratheranat, S.; Altan, T. Use of FEA and design of experiments to establish design guidelines for simple hydroformed parts. Int. J. Mach. Tools Manuf. 2000, 40, 2249–2266. [Google Scholar] [CrossRef]
- Khurshid, M.; Barsoum, Z.; Barsoum, I. Load carrying capacities of butt welded joints in high strength steels. J. Eng. Mater. Technol. 2015, 137, 041003. [Google Scholar] [CrossRef]
- Nassiraei, H.; Mojtahedi, A.; Lotfollahi-Yaghin, M.A. Static strength of X-joints reinforced with collar plates subjected to brace tensile loading. Ocean Eng. 2018, 161, 227–241. [Google Scholar] [CrossRef]
- Baha II, S.; Klapp, O.; Hesebeck, O. Simulation of the solid rivet installation process. SAE Int. J. Aerosp. 2010, 3, 187–197. [Google Scholar] [CrossRef]
- Chen, N.; Ducloux, R.; Pecquet, C.; Malrieux, J.; Thonnerieux, M.; Wan, M.; Chenot, J.-L. Numerical and experimental studies of the riveting process. Int. J. Mater. Form. 2011, 4, 45–54. [Google Scholar] [CrossRef]
- Li, G.; Shi, G.; Bellinger, N.C. Residual stress/strain in three-row, countersunk, riveted lap joints. J. Aircr. 2007, 44, 1275–1285. [Google Scholar] [CrossRef]
- Rans, C.; Straznicky, P.V.; Alderliesten, R. Riveting process induced residual stresses around solid rivets in mechanical joints. J. Aircr. 2007, 44, 323–329. [Google Scholar] [CrossRef]
- Zhao, J.; Peng, Y.; Su, W.; Dong, J. Finite element analysis of the shear capacity of stainless-steel blind-rivet connections. J. Constr. Steel Res. 2021, 179, 106558. [Google Scholar] [CrossRef]
- Vivio, F.; Fanelli, P.; Ferracci, M. Experimental characterization and numerical simulation of riveted lap-shear joints using Rivet Element. Int. J. Adv. Struct. Eng. 2018, 10, 37–47. [Google Scholar] [CrossRef]
- Bedair, O.K.; Eastaugh, G.F. A numerical model for analysis of riveted splice joints accounting for secondary bending and plates/rivet interaction. Thin-Walled Struct. 2007, 45, 251–258. [Google Scholar] [CrossRef]
- Kumar, D.V.T.G.P.; Naarayan, S.S.; Sundaram, S.K.; Chandra, S. Further numerical and experimental failure studies on single and multi-row riveted lap joints. Eng. Fail. Anal. 2012, 20, 9–24. [Google Scholar] [CrossRef]
- Belardi, V.G.; Fanelli, P.; Vivio, F. Theoretical definition of a new custom finite element for structural modeling of composite bolted joints. Compos. Struct. 2021, 258, 113199. [Google Scholar] [CrossRef]
- Sire, S.; Mayorga, L.G.; Plu, B. Observation of Failure Scenarios in Riveted Assemblies: An Innovative Experimental Strategy. Procedia Eng. 2015, 114, 430–436. [Google Scholar] [CrossRef]
- Al-bahkali, E. Finite Element Modeling for Thermal Stresses Developed in Riveted and Rivet-Bonded Joints. Int. J. Eng. 2011, 11, 86–92. [Google Scholar]
- Leonetti, D.; Maljaars, J.; Pasquarelli, G.; Brando, G. Rivet clamping force of as-built hot-riveted connections in steel bridges. J. Constr. Steel Res. 2020, 167, 105955. [Google Scholar] [CrossRef]
- Stevens, R.T.; Sherman, R.J.; Hebdon, M.H. Correlating Surface Hardness to Shear Strength of Driven Rivets and Distribution of In Situ Rivet Hardness. J. Mater. Civ. Eng. 2021, 33, 04020476. [Google Scholar] [CrossRef]
- Lepretre, E.; Chataigner, S.; Dieng, L.; Gaillet, L.; Cannard, H. Numerical and experimental investigations of hot driven riveting process on old metal structures. Eng. Struct. 2016, 127, 583–593. [Google Scholar] [CrossRef]
- Pipinato, A.; Molinari, M.; Pellegrino, C.; Bursi, O.S.; Modena, C. Fatigue tests on riveted steel elements taken from a railway bridge. Struct. Infrastruct. Eng. 2011, 7, 907–920. [Google Scholar] [CrossRef]
- Larsson, T. Fatigue Assessment of Riveted Railway Bridges. Ph.D. Thesis, Luleå University of Technology, Luleå, Sweden, 2009. [Google Scholar]
- Xu, W.; Wang, D. Material–Structure–Process–Performance Integration Multi-Objective Optimization Design for Solid Rivet Joint. J. Mater. Eng. Perform. 2021, 30, 5541–5556. [Google Scholar] [CrossRef]
- Silva, L.F.M.; Gonçalves, J.P.M.; Oliveira, F.M.F.; De Castro, P.M.S.T. Multiple-site damage in riveted lap-joints: Experimental simulation and finite element prediction. Int. J. Fatigue 2000, 22, 319–338. [Google Scholar] [CrossRef]
- Amiri, M. Fatigue Life Prediction of Rivet Joints. J. Fail. Anal. Prev. 2019, 19, 1844–1852. [Google Scholar] [CrossRef]
- Maljaars, J.; Leonetti, D.; Maas, C. Fatigue life prediction of hot riveted double covered butt joints. Int. J. Fatigue 2019, 124, 99–112. [Google Scholar] [CrossRef]
- Leonetti, D.; Maljaars, J.; Snijder, H.H. Fatigue life prediction of hot-riveted shear connections using system reliability. Eng. Struct. 2018, 186, 471–483. [Google Scholar] [CrossRef]
- Fuiorea, I.; Bartis, D.; Nedelcu, R.; Mocanu, A. The Rivet Parameter Influence in Fatigue Strength. Fatigue Aircr. Struct. 2009, 2009, 50–57. [Google Scholar] [CrossRef]
- Baghous, N.; Barsoum, I. Effect of Material Strength on Ductile Failure of Steel in Pressure Vessel Design. J. Press. Vessel Technol. 2021, 143, 021503. [Google Scholar] [CrossRef]
- D’Aniello, M.; Portioli, F.; Fiorino, L.; Landolfo, R. Experimental investigation on shear behaviour of riveted connections in steel structures. Eng. Struct. 2011, 33, 516–531. [Google Scholar] [CrossRef]
- Zhu, J.; Khurshid, M.; Barsoum, I.; Barsoum, Z. Computational weld-mechanics assessment of welding distortions in a large beam structure. Eng. Struct. 2021, 236, 112055. [Google Scholar] [CrossRef]
- Bhatti, A.A.; Barsoum, Z.; Khurshid, M. Development of a finite element simulation framework for the prediction of residual stresses in large welded structures. Comput. Struct. 2014, 133, 1–11. [Google Scholar] [CrossRef]
- Maalouf, M.; Barsoum, Z. Failure strength prediction of aluminum spot-welded joints using kernel ridge regression. Int. J. Adv. Manuf. Technol. 2017, 91, 3717–3725. [Google Scholar] [CrossRef]
- Milone, A.; D’Aniello, M.; Landolfo, R. Influence of camming imperfections on the resistance of lap shear riveted connections. J. Constr. Steel Res. 2023, 203, 107833. [Google Scholar] [CrossRef]
- Siahaan, R.; Keerthan, P.; Mahendran, M. Finite element modeling of rivet fastened rectangular hollow flange channel beams subject to local buckling. Eng. Struct. 2016, 126, 311–327. [Google Scholar] [CrossRef]
- Hanssen, A.G.; Olovsson, L.; Porcaro, R.; Langseth, M. A large-scale finite element point-connector model for self-piercing rivet connections. Eur. J. Mech. A/Solids 2010, 29, 484–495. [Google Scholar] [CrossRef]
- Kim, C.; Min, K.M.; Choi, H.; Kim, H.J.; Lee, M.G. Development of analytical strength estimator for self-piercing rivet joints through observation of finite element simulations. Int. J. Mech. Sci. 2021, 202, 106499. [Google Scholar] [CrossRef]
- Vivio, F. A new theoretical approach for structural modelling of riveted and spot welded multi-spot structures. Int. J. Solids Struct. 2009, 46, 4006–4024. [Google Scholar] [CrossRef]
- Dassault Systèmes. Abaqus/Explicit. 2021. Available online: https://www.3ds.com/products-services/simulia/products/abaqus/abaqusexplicit/ (accessed on 22 February 2023).
- Barsoum, I.; Khalaf, A.M. Evaluation of a pipe-flange connection method based on cold work. J. Press. Vessel Technol. 2015, 137, 061407. [Google Scholar] [CrossRef]
- Hooputra, H.; Gese, H.; Dell, H.; Werner, H. A comprehensive failure model for crashworthiness simulation of aluminium extrusions. Int. J. Crashworthiness 2004, 9, 449–464. [Google Scholar] [CrossRef]
- Dassault Systèmes. About Damage and Failure for Ductile Metals. Available online: https://abaqus-docs.mit.edu/2017/English/SIMACAEMATRefMap/simamat-c-damageductile.htm#simamat-c-damageductile-t-DamageEvolution-sma-topic2 (accessed on 8 October 2021).
- Hillerborg, A.; Modéer, M.; Petersson, P.E. Analysis of crack formation and crack growth in concrete by means of fracture mechanics and finite elements. Cem. Concr. Res. 1976, 6, 773–781. [Google Scholar] [CrossRef]
- Dassault Systèmes. Damage Evolution and Element Removal for Ductile Metals. Available online: https://abaqus-docs.mit.edu/2017/English/SIMACAEMATRefMap/simamat-c-damageevolductile.htm#simamat-c-damageevolductile-t-DefiningDamageEvolutionBasedOnEffectivePlasticDisplacement-sma-topic4 (accessed on 7 July 2021).
- Budynas, R.G.; Nisbett, J.K. Shigley’s Mechanical Engineering Design, 10th ed.; McGraw Hill: New York, NY, USA, 2015. [Google Scholar]
- Khurshid, M.; Meurling, L. Evolution of Scientific Methods for Structural Life Assessment and Its Application on Lightweight Spreader Design. No. 1–9 February 2021. Available online: https://bromma.com/bromma-white-paper-evolution-of-scientific-methods-and-designing-lightweight-spreader/ (accessed on 26 April 2022).
- Zhu, J.; Khurshid, M.; Barsoum, Z. Accuracy of computational welding mechanics methods for estimation of angular distortion and residual stresses. Weld. World 2019, 63, 1391–1405. [Google Scholar] [CrossRef]
- Kuether, R.J.; Allen, M.S.; Hollkamp, J.J. Modal substructuring of geometrically nonlinear finite element models with interface reduction. AIAA J. 2017, 55, 1695–1706. [Google Scholar] [CrossRef]
- Khurshid, M.; Barsoum, Z.; Mumtaz, N.A. Ultimate strength and failure modes for fillet welds in high strength steels. Mater. Des. 2012, 40, 36–42. [Google Scholar] [CrossRef]
- Khurshid, M.; Leitner, M.; Barsoum, Z.; Schneider, C. Residual stress state induced by high frequency mechanical impact treatment in different steel grades—Numerical and experimental study. Int. J. Mech. Sci. 2017, 123, 34–42. [Google Scholar] [CrossRef]
- EN1993-1-8; Eurocode 3: Design of Steel Structures—Part 1–8: Design of Joints. The European Union: Brussels, Belgium, 2005.
- Sedlacek, G.; Kammel, C.; Kühn, W.H.B. Condition Assessment and Inspection of Steel Railway Bridges, Including Stress Measurements in Riveted, Bolted and Welded Structures. Sustainable Bridges—Assessment for Future Traffic Demands and Longer Lives. 2007. pp. 1–94. Available online: http://www.diva-portal.org/smash/record.jsf?pid=diva2%3A1337394&dswid=3747 (accessed on 26 April 2022).
- Maraveas, C.; Fasoulakis, Z.C.; Tsavdaridis, K.D. Mechanical properties of High and Very High Steel at elevated temperatures and after cooling down. Fire Sci. Rev. 2017, 6, 3. [Google Scholar] [CrossRef]


Disclaimer/Publisher’s Note: The statements, opinions and data contained in all publications are solely those of the individual author(s) and contributor(s) and not of MDPI and/or the editor(s). MDPI and/or the editor(s) disclaim responsibility for any injury to people or property resulting from any ideas, methods, instructions or products referred to in the content. |
© 2023 by the authors. Licensee MDPI, Basel, Switzerland. This article is an open access article distributed under the terms and conditions of the Creative Commons Attribution (CC BY) license (https://creativecommons.org/licenses/by/4.0/).