Abstract
Storage canisters used in nuclear power plants operating in seaside areas—where the salt content in the atmosphere is high—may be susceptible to chloride-induced stress corrosion cracking (CISCC). Chloride-induced stress corrosion cracking is one of the ways in which dry storage canisters made of stainless steel can degrade. Stress corrosion cracking depends on the microstructure and residual stress, and it is therefore very important to improve the surface properties of materials. Laser shock peening both greatly deforms the material surface and refines grains, and it generates compressive residual stress in the deep part from the surface of the material. This study focused on the effect of laser shock peening on the stress corrosion cracking of 304L stainless steel. The laser shock peening was found to induce compressive residual stress from the surface to a 1 mm depth, and the SCC properties were evaluated by a U-bend test. The results showed that the SCC resistance of laser-peened 304L stainless steel in a chloride environment was enhanced, and that it was closely related to grain size, the pitting potential of the cross section, and residual stress.
1. Introduction
Austenitic stainless steel is used in various industries, such as nuclear power plant construction, because of its excellent corrosion resistance. However, it is known to be susceptible to localized corrosion including pitting, crevices, and intergranular corrosion (IGC) [1,2]. Austenitic stainless steels are also sensitive to stress corrosion cracking (CISCC) in chloride environments [3]. The mechanism of stress corrosion cracking is caused by three kinds of factors—susceptible materials, corrosive environments, and tensile stress [4,5]. Stress corrosion cracking can easily occur when a sensitive material with tensile residual stress by welding and cold forming is exposed to a corrosive environment, and tensile stress accelerates the generation and propagation of corrosion cracks, which ultimately lead to fracture. These tensile residual stresses are attributable to external factors, such as material processing, constraint welding residual stress, working pressure, or the external loads applied to the structure.
In an austenitic stainless steel, the SCC susceptibility of the steel showing coarse grains has been shown to be higher than that of the steel showing fine grains [6]. Increased grain size has been associated with increased SCC population in 304 stainless steel [7]. In a recent study, SCC propagation paths including crack detour and termination were analyzed through crystallography using the electron backscatter diffraction (EBSD) method [8]. If it is not dealt with in advance, stress corrosion cracking can lead to serious accidents, because there are no predictable signs of fracture in the material, such as extreme corrosion of the surface, reduced thickness by corrosion, or dimensional changes during the fracture process [9]. Therefore, the use of austenitic stainless steels in corrosive environments may be limited. The stress corrosion cracking of these metals and alloys depends on the microstructure, tensile residual stress, and the properties of the material; therefore, it is highly important to improve the surface properties of materials [10].
Recent studies have changed surface properties in attempts to improve SCC sensitivity using various surface modification methods, such as: shot peening (SP) [11,12,13,14], laser shock peening (LSP) [15,16,17,18], water jet peening (WJP) [19,20,21], ultrasonic peening (UP) [22,23,24], and ultrasonic nanocrystal surface modification (UNSM) [25,26]. These technologies are known to plastically deform the surface of the material to add a compressive residual stress to the surface, and to refine the surface grains. It has also been reported that grain refinement can inhibit surface corrosion by reducing the interatomic distance, promoting interatomic diffusion, and maintaining a passive film [27,28,29,30,31]. However, the application of surface modification should consider surface roughness and overlap, because the surface of the material is not uniform, and if an overlap site is present, it can serve as a corrosion initiation site [32].
Among the peening methods, laser shock peening both greatly deforms the material surface and refines grains, and it also generates compressive residual stress to the deep part from the surface of the material. When high-energy laser pulses are irradiated, plasma is instantaneously generated by absorbing laser energy from the surface of the material; at this time, an overlay layer (i.e., water [33]) is created to suppress the expansion of the plasma, and a shock wave is consequently formed. The material affected by the shock wave causes plastic deformation, and compressive residual stress is generated on the surface. To effectively form this residual stress, an absorption layer (Al [34], vinyl tape [35], etc.) is used.
We have recently reported on the effects of surface modification technology [36,37]. In one of these studies, laser shock peening of 304L stainless steel roughened the surface, refined grains in the outermost area, and increased the hardness due to the relatively high dislocation density [36]. In the other study, the increased area of grain boundaries by refined grains during laser shock peening slightly reduced the intergranular corrosion resistance, while the compressive residual stress induced by laser shock peening improved the passivation properties [37]. As described above, there have been many recent studies attempting to improve SCC properties by laser shock peening treatment using the following methods: changing the various properties of materials by laser shock peening treatment to affect the SCC property, such as the suppression of crack propagation by refined grain on the outermost surface, reduction of SCC sensitivity due to the compressive residual stress, increase in surface hardness due to increased surface dislocation density [10,38], and high strain plastic deformation of 304 stainless steel [39]. Higher laser power density during laser shock peening treatment has shown superior performance in terms of SCC susceptibility by a higher magnitude of compressive residual stress [40], and laser shock peening has been shown to prevent SCC for sensitized 304 stainless steel in a corrosive environment [41]. Y. Sano et al. reported that SCC initiation and propagation can be inhibited by laser shock peening without protective coating [41]. J.Z. Lu et al. also reported that SCC resistance by laser shock peening can be achieved due to compressive residual stress and refined grains [10]. However, it remains unclear how laser shock peening specifically affects the initiation and propagation of SCC.
Therefore, this work is focused on evaluating the effect of laser shock peening on CISCC of 304L stainless steel, discussing the peening’s effect on the SCC mechanism regarding crack initiation and growth based on the microstructure, corrosion properties, and residual stress, and proposing a model of the relationship between laser shock peening and SCC. The effect of welding on the SCC resistance is also discussed.
2. Materials and Methods
2.1. Specimen
Table 1 lists the chemical composition of commercial 304L stainless steel and its filler metal used in this work [36]. The specimen had a thickness of 25 mm. The welding method used was gas tungsten arc welding (GTAW). The welding conditions are summarized in Table 2 [36], and the designation of the specimen’s condition is described in Table 3 [36].

Table 1.
Chemical composition of 304L stainless steel and filler metal (wt%) (Reprinted with permission from [36]. 2022, MDPI).).

Table 2.
Welding conditions of the experimental specimen (Reprinted with permission from [36]. 2022, MDPI).

Table 3.
Designation of the experimental specimen (Adapted with permission from [36]. 2022, MDPI).
2.2. Laser Shock Peening (LSP)
The laser shock peening process in this work has been well described elsewhere [36]. Reference [36] includes a schematic diagram on the laser beam, overlay, and ablative layer of laser shock peening treatment. The laser shock peening condition is described in Table 4 [36]. The water used in the laser shock peening experiment was supplied by filtering tap water and a water layer was dynamically overlaid.

Table 4.
Conditions of laser shock peening treatment (Reprinted with permission from [36]. 2022, MDPI).
2.3. U-Bend SCC Test
The specimen for the U-bend SCC test was prepared on the basis of ASTM G 30 (d size) [42], and the welded specimen was prepared based on ASTM G58 [43].
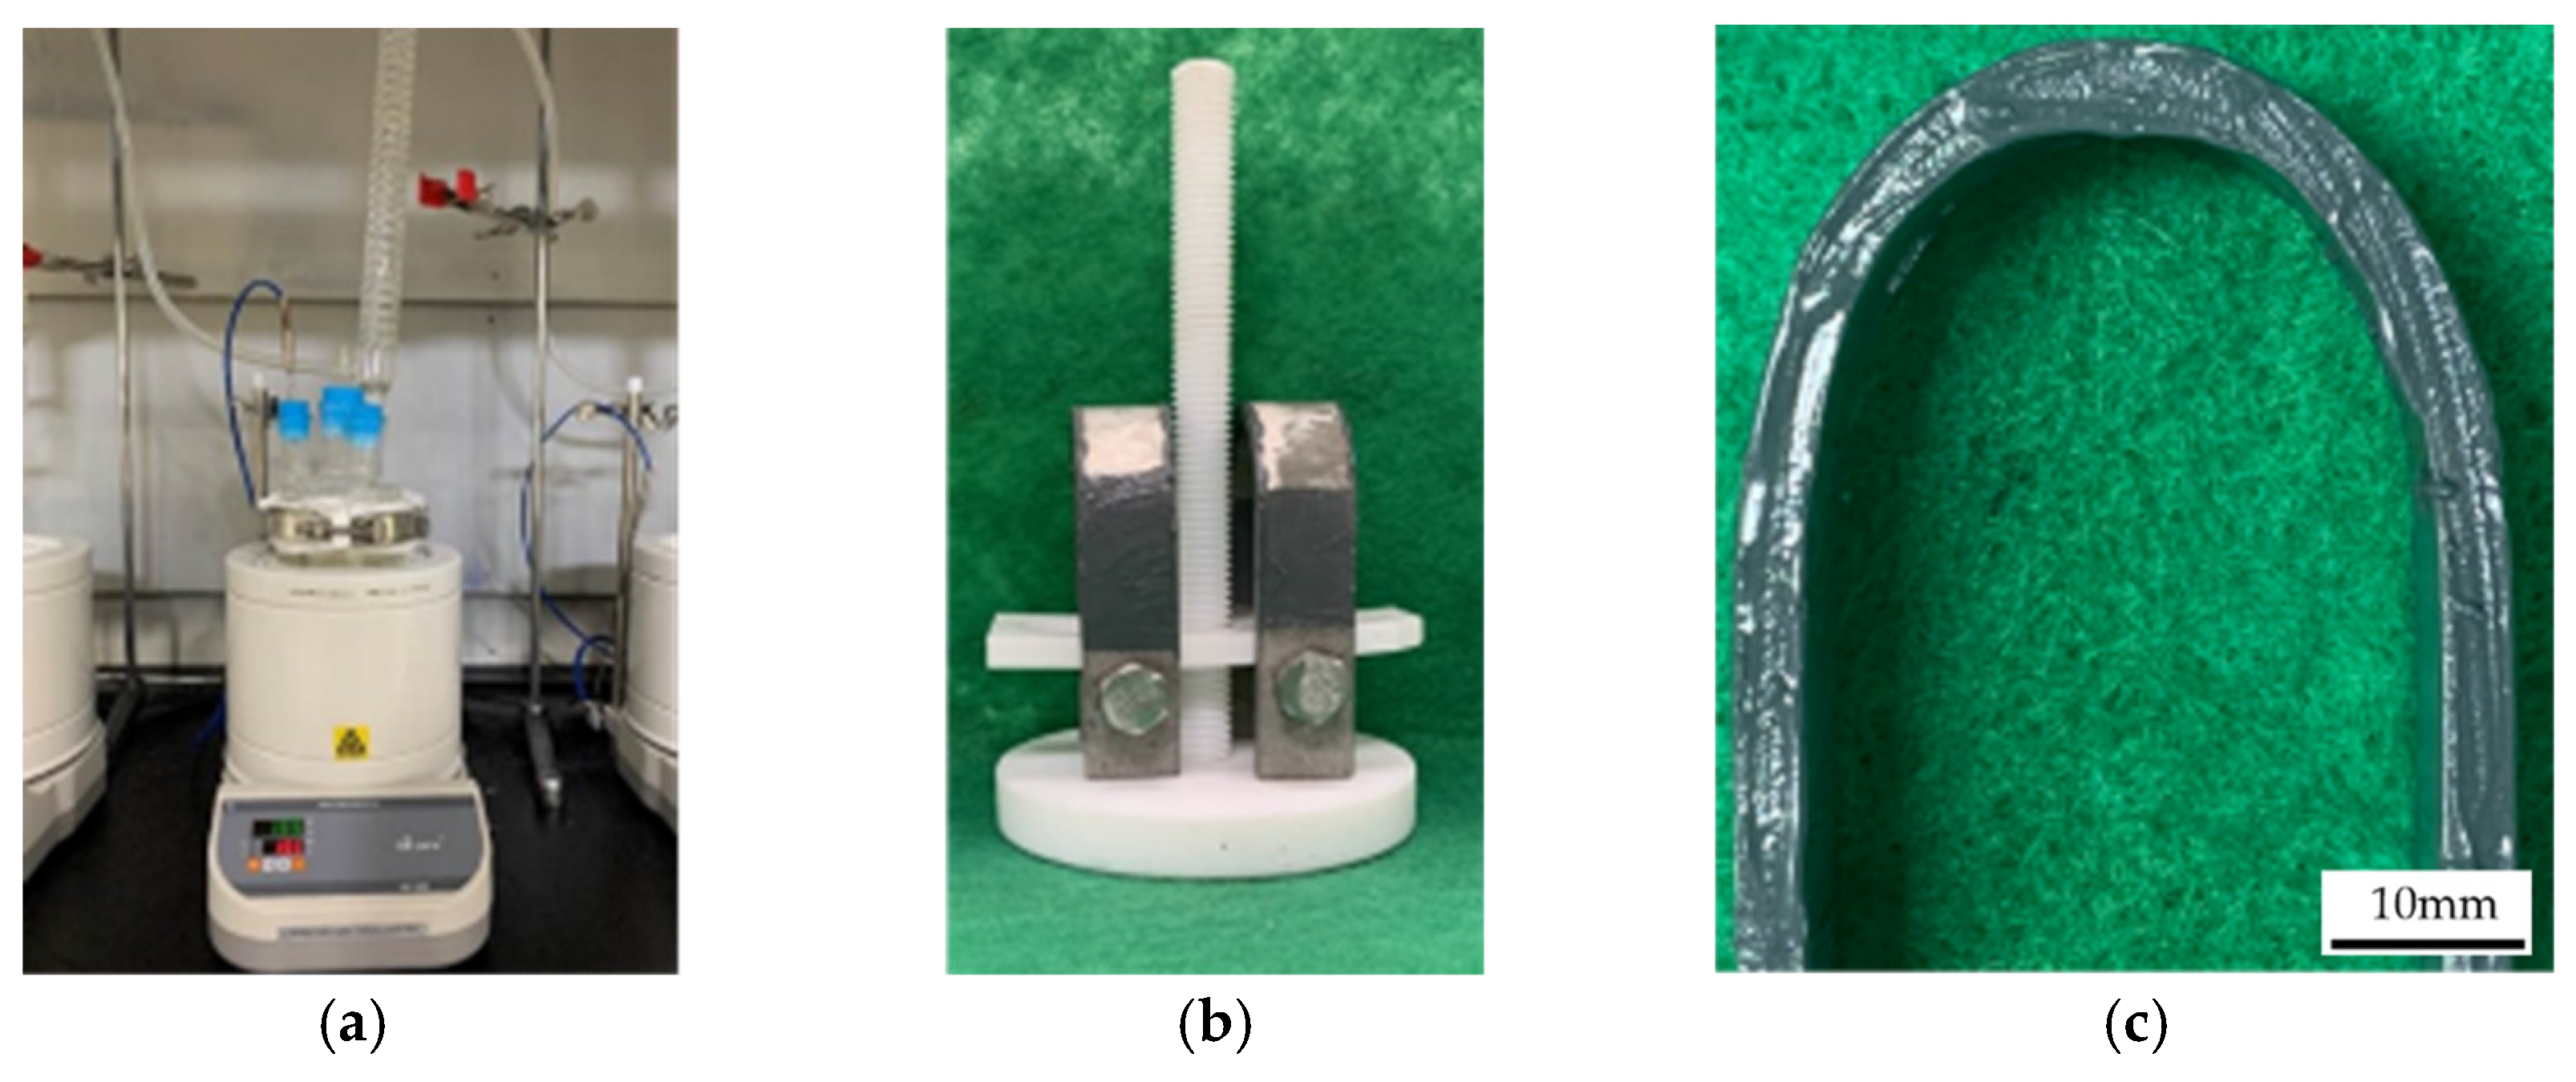
An SCC test was performed based on ASTM G36 [44], with the test solution of 42% MgCl2 at a boiling temperature of 155 °C. The U-bent area during the test was periodically observed every 3 or 1.5 h, depending on the alloy. Figure 1 shows (a) the corrosion cell for the U-bend SCC test, (b) setup of the U-bend specimen, and (c) insulation on the sides of the U-bend specimen. Insulation using a high-temperature adhesive prevented cracking on the side on which peening was not applied.
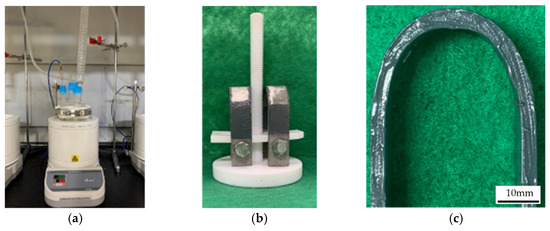
Figure 1.
(a) Corrosion Cell for U-Bend SCC Test; (b) Setup of U-Bend Specimen; (c) Insulation on the Sides of U-Bend Specimen.
The SCC resistance was evaluated in terms of the “total crack time” and the “crack initiation time”. The total crack time refers to the time that cracks were observed by periodic observation. Crack initiation time refers to the last time that cracks were not observed by periodic observation; thus, this is the estimated crack initiation time. After the SCC test, cracks on the cross section were observed using an optical microscope. The cross section was ground from #200 to #2000 SiC paper, then polished using diamond paste (3 μm). Next, the polished surface was etched using an electrochemical etching instrument (LectroPol–5, Struers, Copenhagen, Denmark) in 10% oxalic acid. At this point, the etched surface was observed using an optical microscope (AXIOTECH 100 HD, ZEISS, Oberkochen, Germany). The linear crack length was determined. Crack propagation rates were also calculated using the following equations:
- Total Crack Propagation Rate = Crack Length/Total Crack Time;
- Net Crack Propagation Rate = Crack Length/(Total Crack Time − Crack Initiation Time);
- Moreover, crack mode was observed by SEM (VEGA II LMU).
2.4. Optical Microscopic Observation
The specimen was cut to a size of 15 × 15 × 10 mm3, then ground and polished to the surface of a mirror using SiC paper and diamond paste. The etching for the microstructure and crack morphologies was performed using an electrolytic etcher (LectroPol–5, Struers, Copenhagen, Denmark). In this process, a 10% oxalic acid (100 g (H2C2O4·2H2O) + 900 mL distilled water) solution was used. To observe the microstructure of the specimen, we used an optical microscope (AXIOTECH 100 HD, ZEISS, Oberkochen, Germany). Average grain size of the cross section of the peened specimen was calculated by the ASTM E1382 method [45].
2.5. SEM-EDS and EBSD Analysis
For SEM-EDS, the specimen was cut to a size of 15 × 15 mm2, but in the case of the laser-peened specimen, energy dispersive X-ray spectrometry (SEM-EDS) was analyzed without polishing to the peened surface. The surface morphology and composition analysis were performed using SEM-EDS (VEGA II LMU, Tescan, Brno, Czech Republic) and EBSD (Oxford Instruments, Bognor Regis, UK).
2.6. Residual Stress Measurement
The surface residual stress was obtained using the hole drilling method (RS-200 Assembly, VMM, Raleigh, NC, USA). A strain gauge (CEA−06−062UL−12, VMM, Raleigh, NC, USA) was attached to the specimen, and holes were fabricated using a drilling device. The residual stresses released during the drilling were then measured. Residual stress was measured on the apex area of the specimen peened after U-bending.
2.7. Corrosion Tests
Intergranular corrosion rate was determined through a test repeated 5 times with 3 h immersion in 65% HNO3 at boiling point by modified ASTM A262 [46]. The degree of sensitization (DOS) was calculated by a double loop electropotentiokinetic reactivation (DL-EPR) test [47]. Test solution was 30 °C, 0.5 M H2SO4 + 0.01 M KSCN, and anodic scan to vertex potential (+400 mV(SCE)) and reactivation were swept, and the scan rate was at a rate of 1.677 mV/s and the ratio of reactivation/activation current peaks (Ir/Ia) was calculated. An anodic polarization test was performed by ASTM G5 [48], and the reference electrode was a saturated calomel electrode (SCE) and the counter electrode was Pt wire and the scanning rate was 0.33 mV/s. DL-EPR and polarization tests were performed on the peened surface (“surface” in this work) and the cross section of the peened specimen (“cross section” in this work).
3. Results
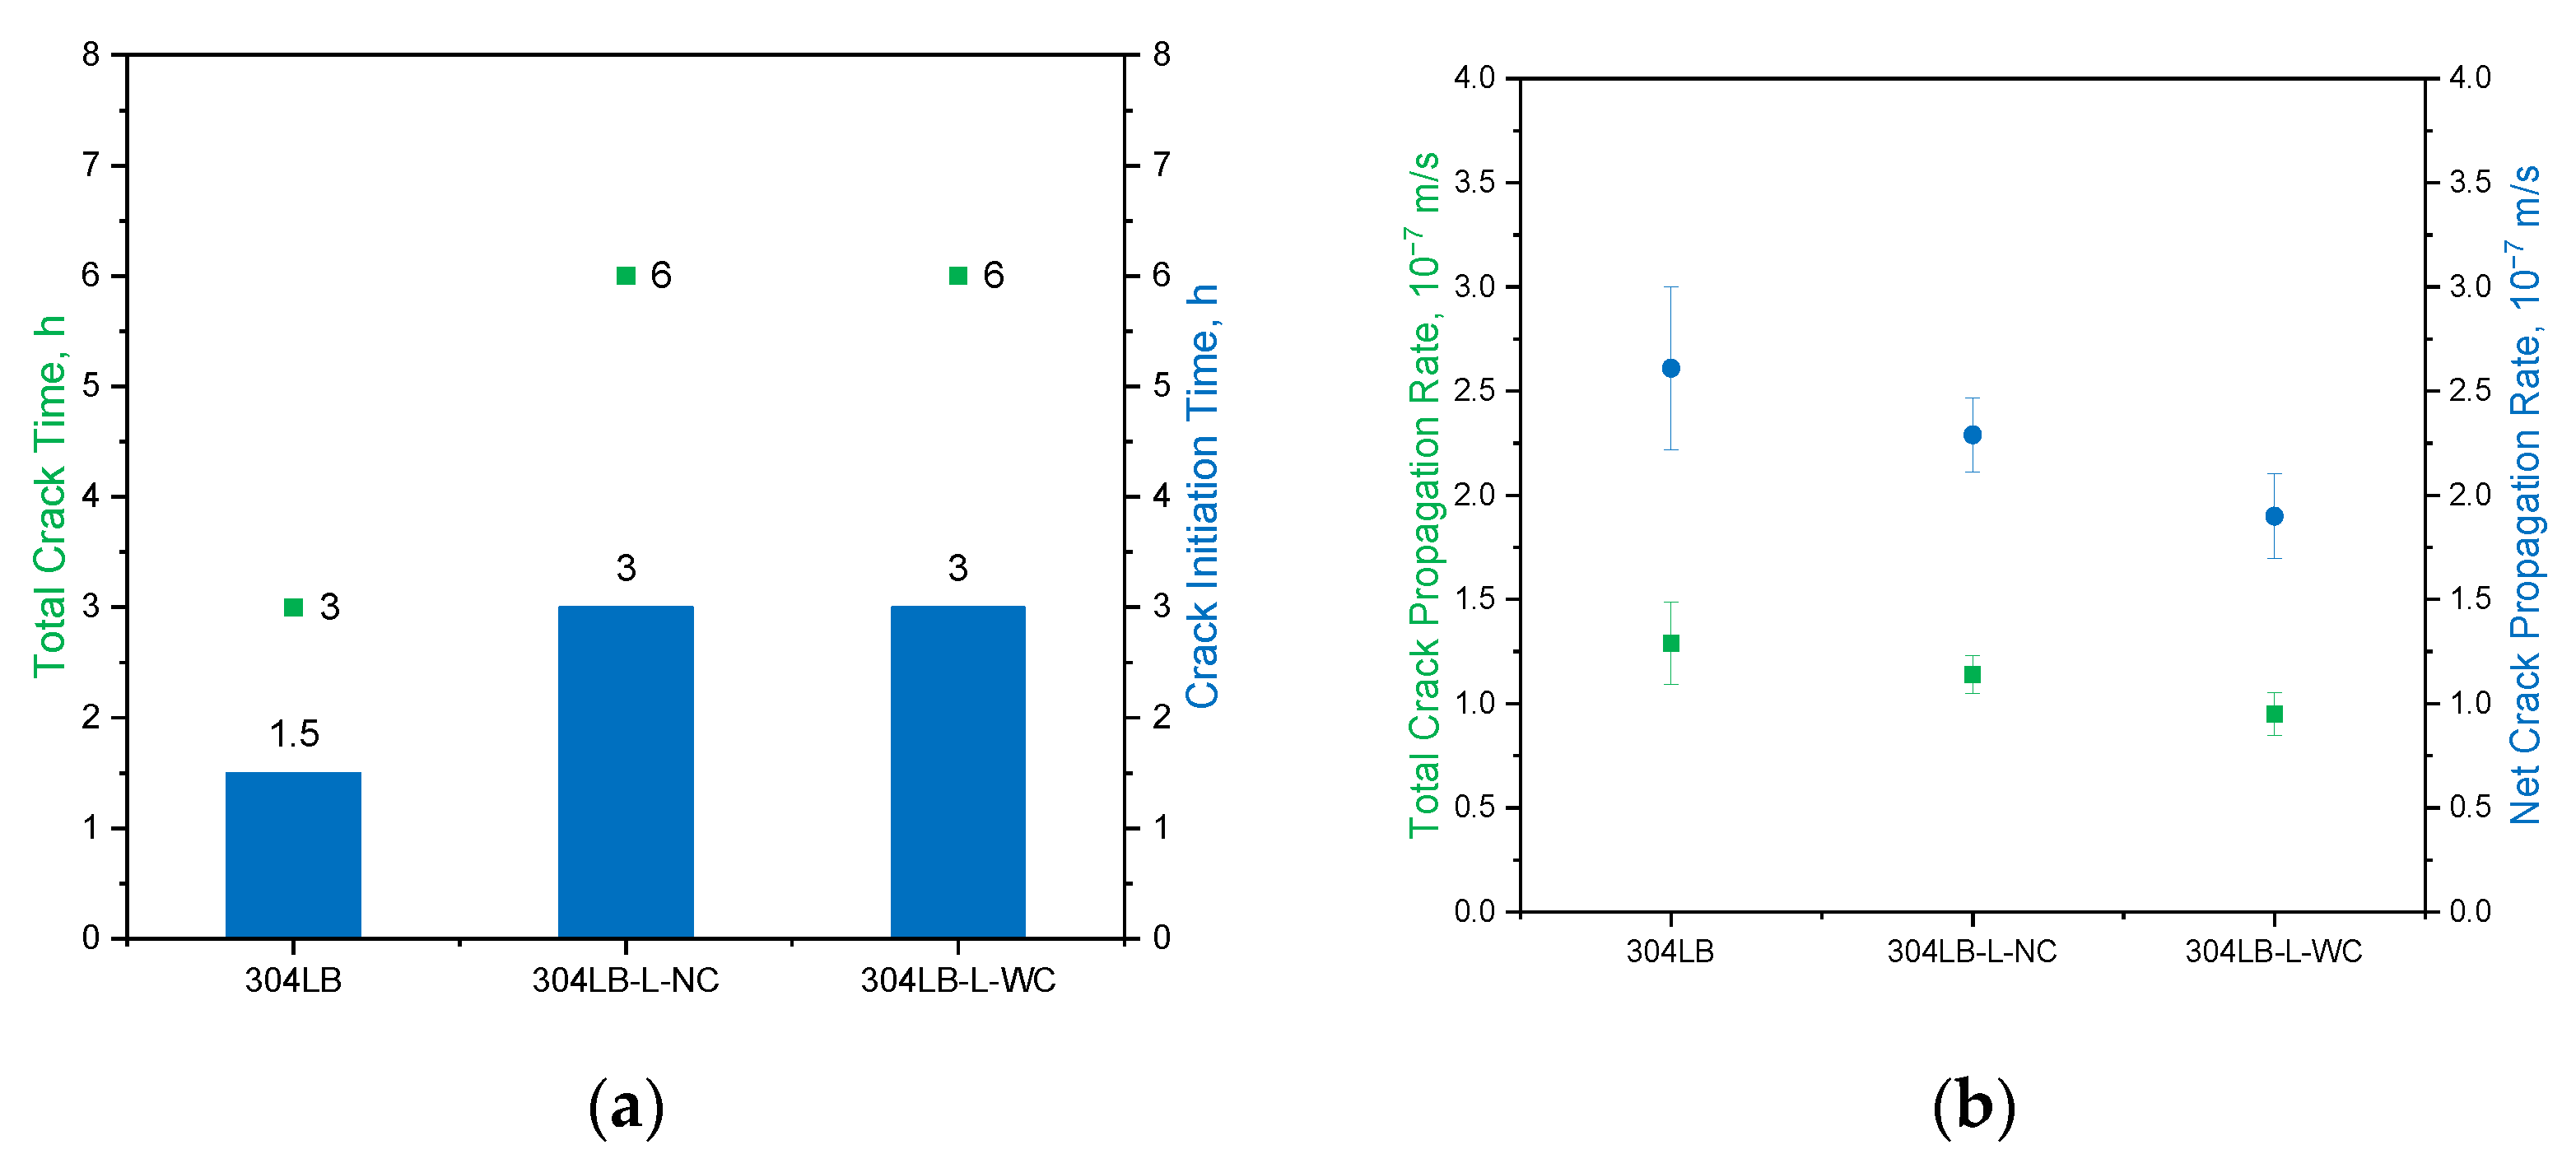
Figure 2 shows the effect of laser shock peening on the crack times of non-welded 304LB by the U-bend SCC test under the conditions of 155 °C and 42% MgCl2. The formation of cracks was observed every 1.5 h, and all of the test specimens (tested three times) revealed the same cracking time. Figure 2a shows that the total crack time of the non-peened 304LB was 3 h, while it was 6 h for laser-peened 304LB−L−NC and 304LB−L−WC. The crack initiation time of the non-peened 304LB was 1.5 h, while it was 3 h for the laser-peened 304LB−L−NC and 304LB−L−WC.
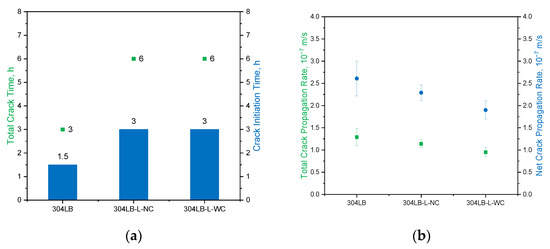
Figure 2.
Effect of laser shock peening on the crack times of 304LB by U−bend SCC test at 155 °C, 42% MgCl2: (a) total crack time; (b) crack propagation rates.
The crack propagation rate can be calculated from Figure 2a and the measured crack length. The crack propagation rates refer to the maximum rates because the longest crack was determined among the sliced crack areas. Figure 2b shows the effect of laser shock peening on the crack propagation rates of the non-welded 304LB by the U-bend SCC test (155 °C, 42% MgCl2). The total crack propagation rates of 304LB, 304LB−L−NC, and 304LB−L−WC were (1.29, 1.14, and 0.95) × 10−7 m/s, respectively. The net crack propagation rates of 304LB, 304LB−L−NC, and 304LB−L−WC were (2.61, 2.29, and 1.90) × 10−7 m/s, respectively. Therefore, the laser shock peening treatment increased the total crack time and crack initiation time whereas it reduced the total crack propagation rate and the net crack propagation rate. These results mean that laser shock peening enhanced the SCC resistance of 304L stainless steel in a chloride environment.
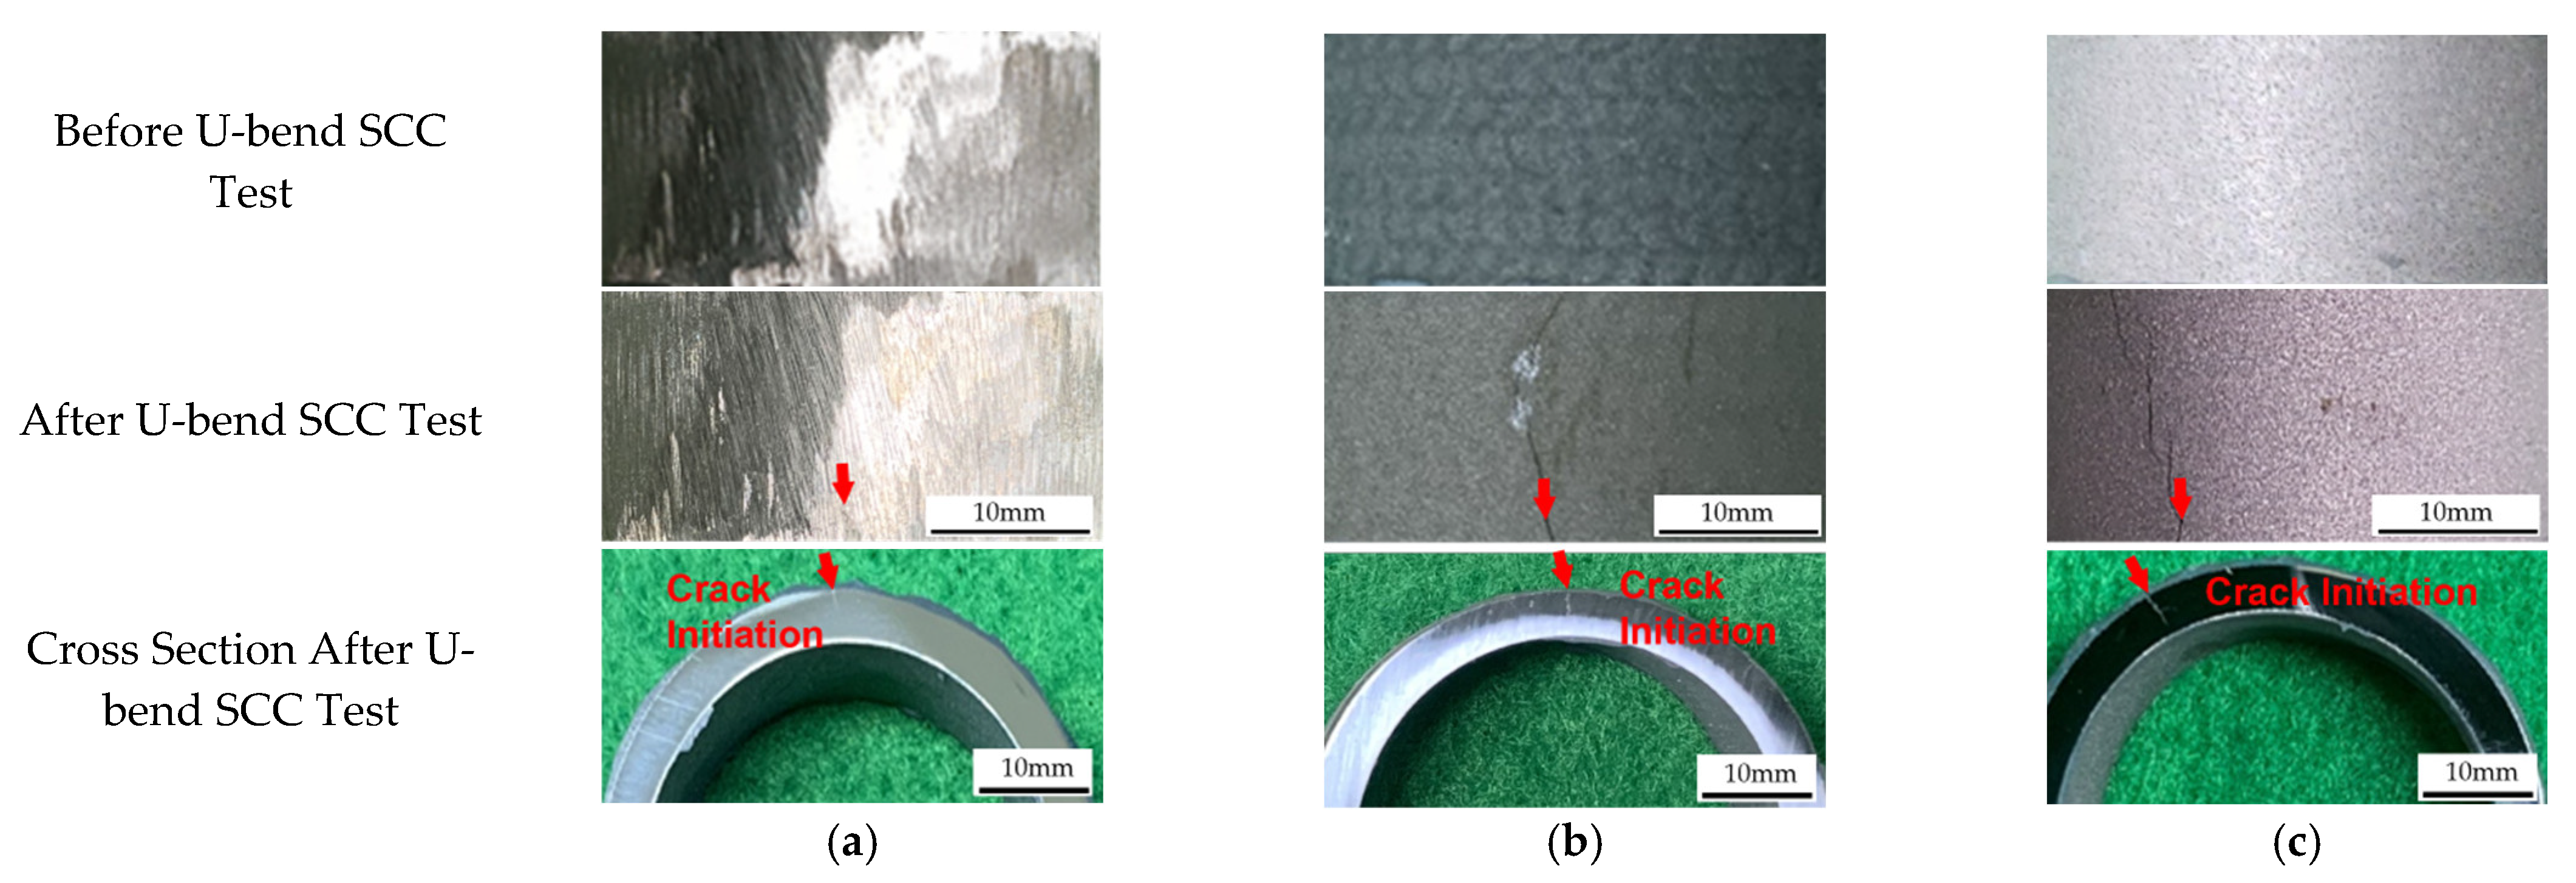
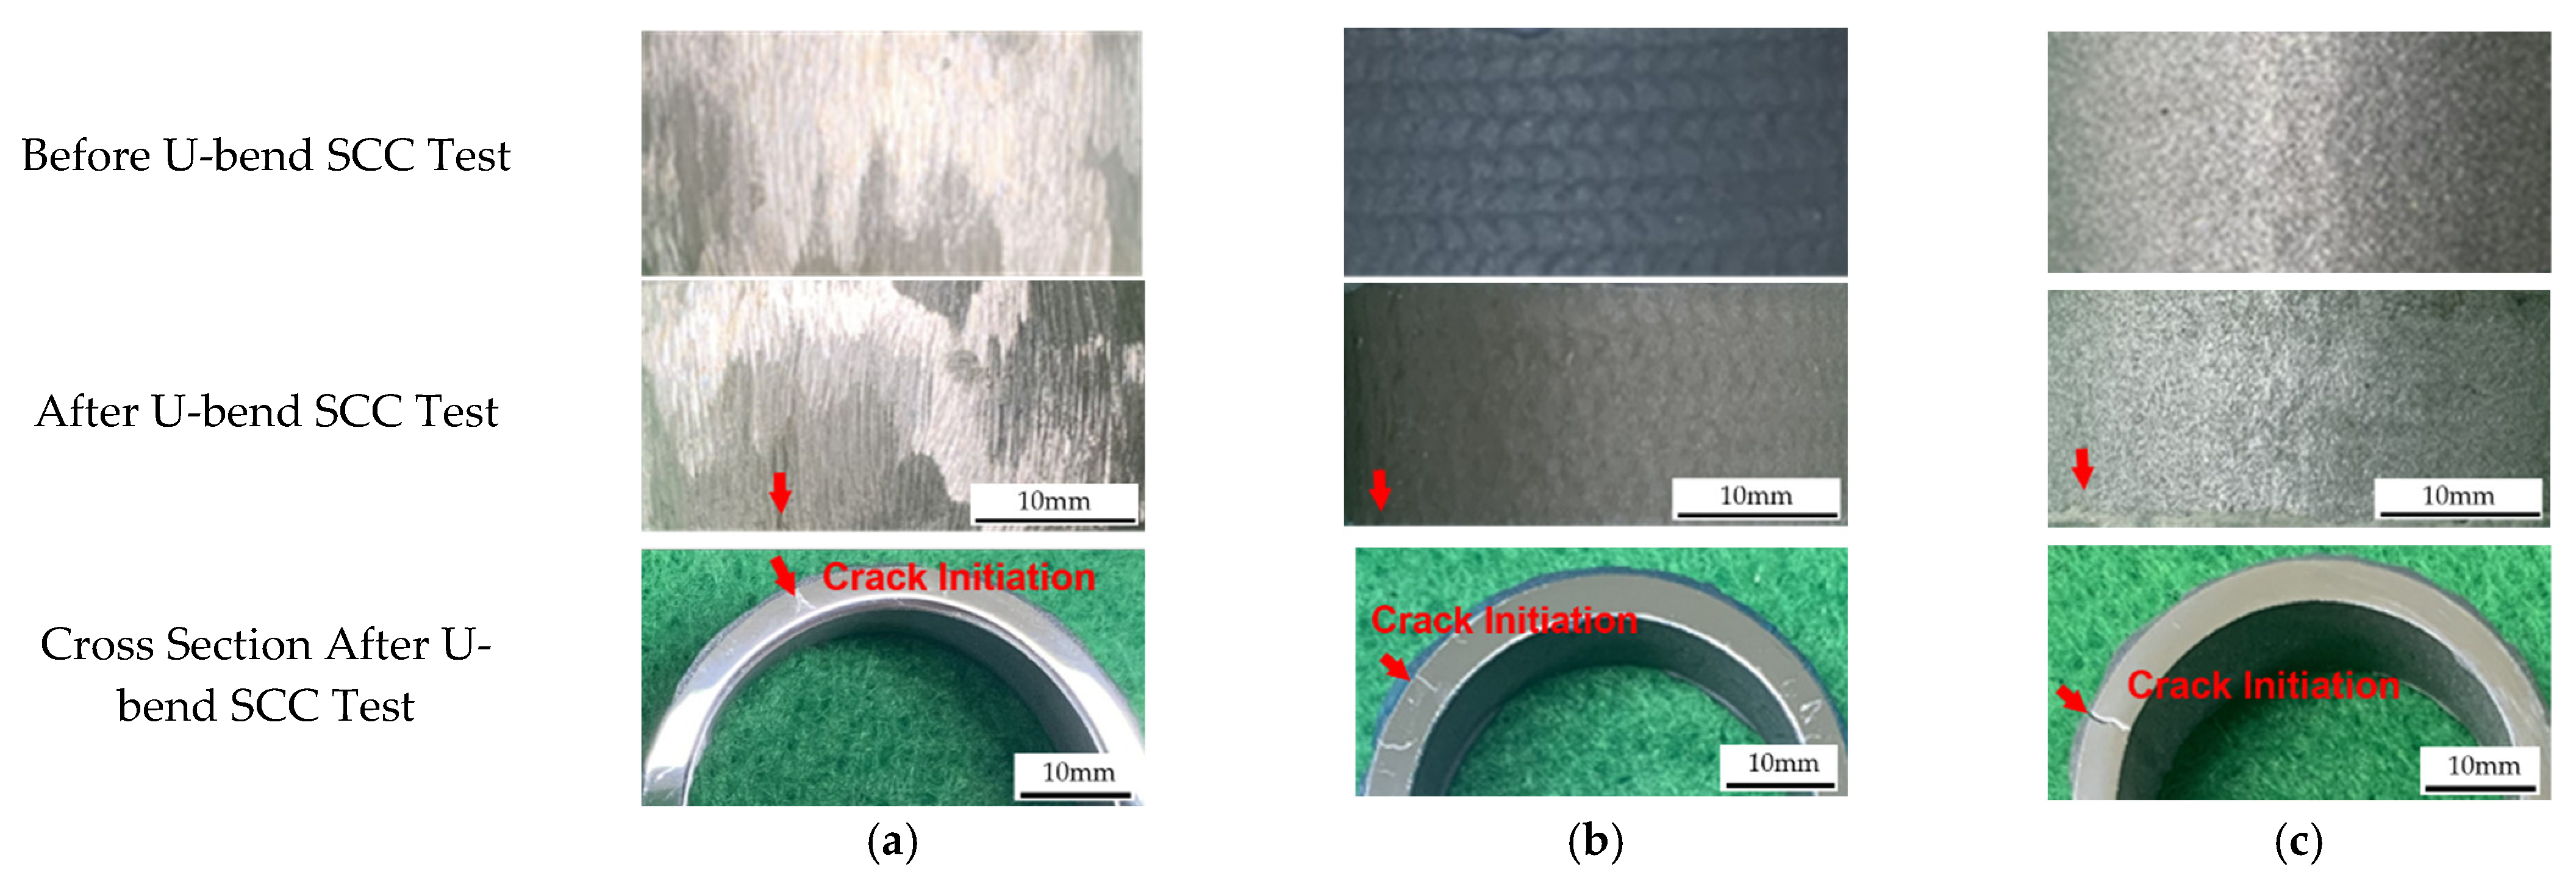
Figure 3 shows the surface appearance of 304LB by laser shock peening treatment. Figure 3a shows the morphologies of 304LB before and after the U-bend test, Figure 3b shows the morphologies of 304LB−L−NC before and after the U-bend test, while Figure 3c shows the morphologies of 304LB−L−WC before and after the U-bend test. After the U-bend test, cracks were observed at the apex and the cross section. In the figures, the red arrow denotes the area in which the cracks were observed. In all cases, cracks were formed at the apex area of the U-bend specimen.
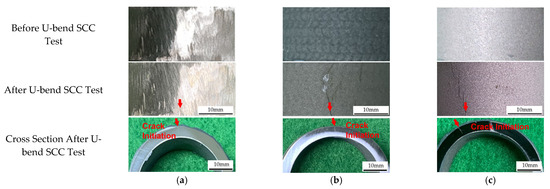
Figure 3.
Surface appearance of 304LB by laser shock peening: (a) 304LB; (b) 304LB−L−NC; (c) 304LB−L−WC.
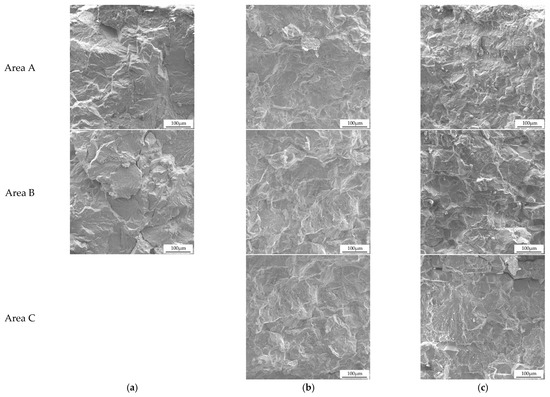
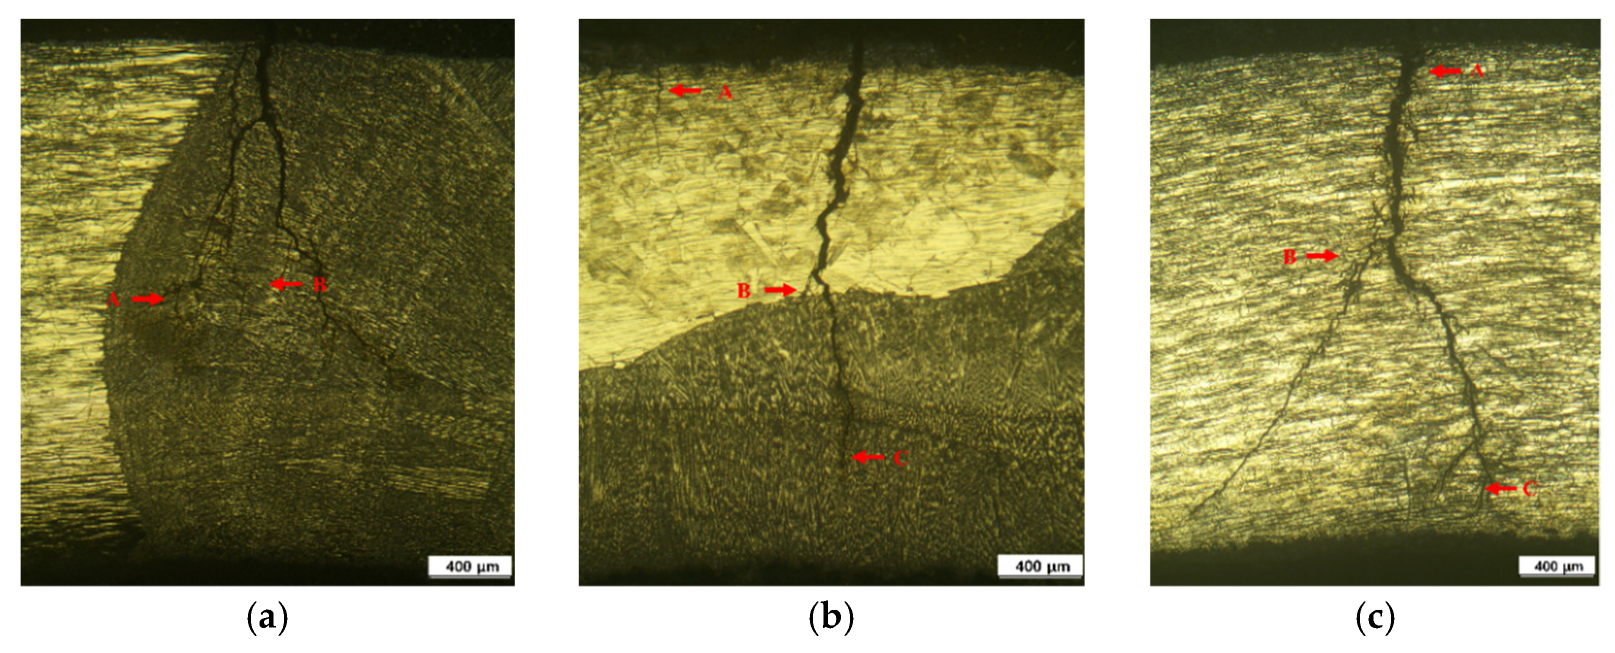
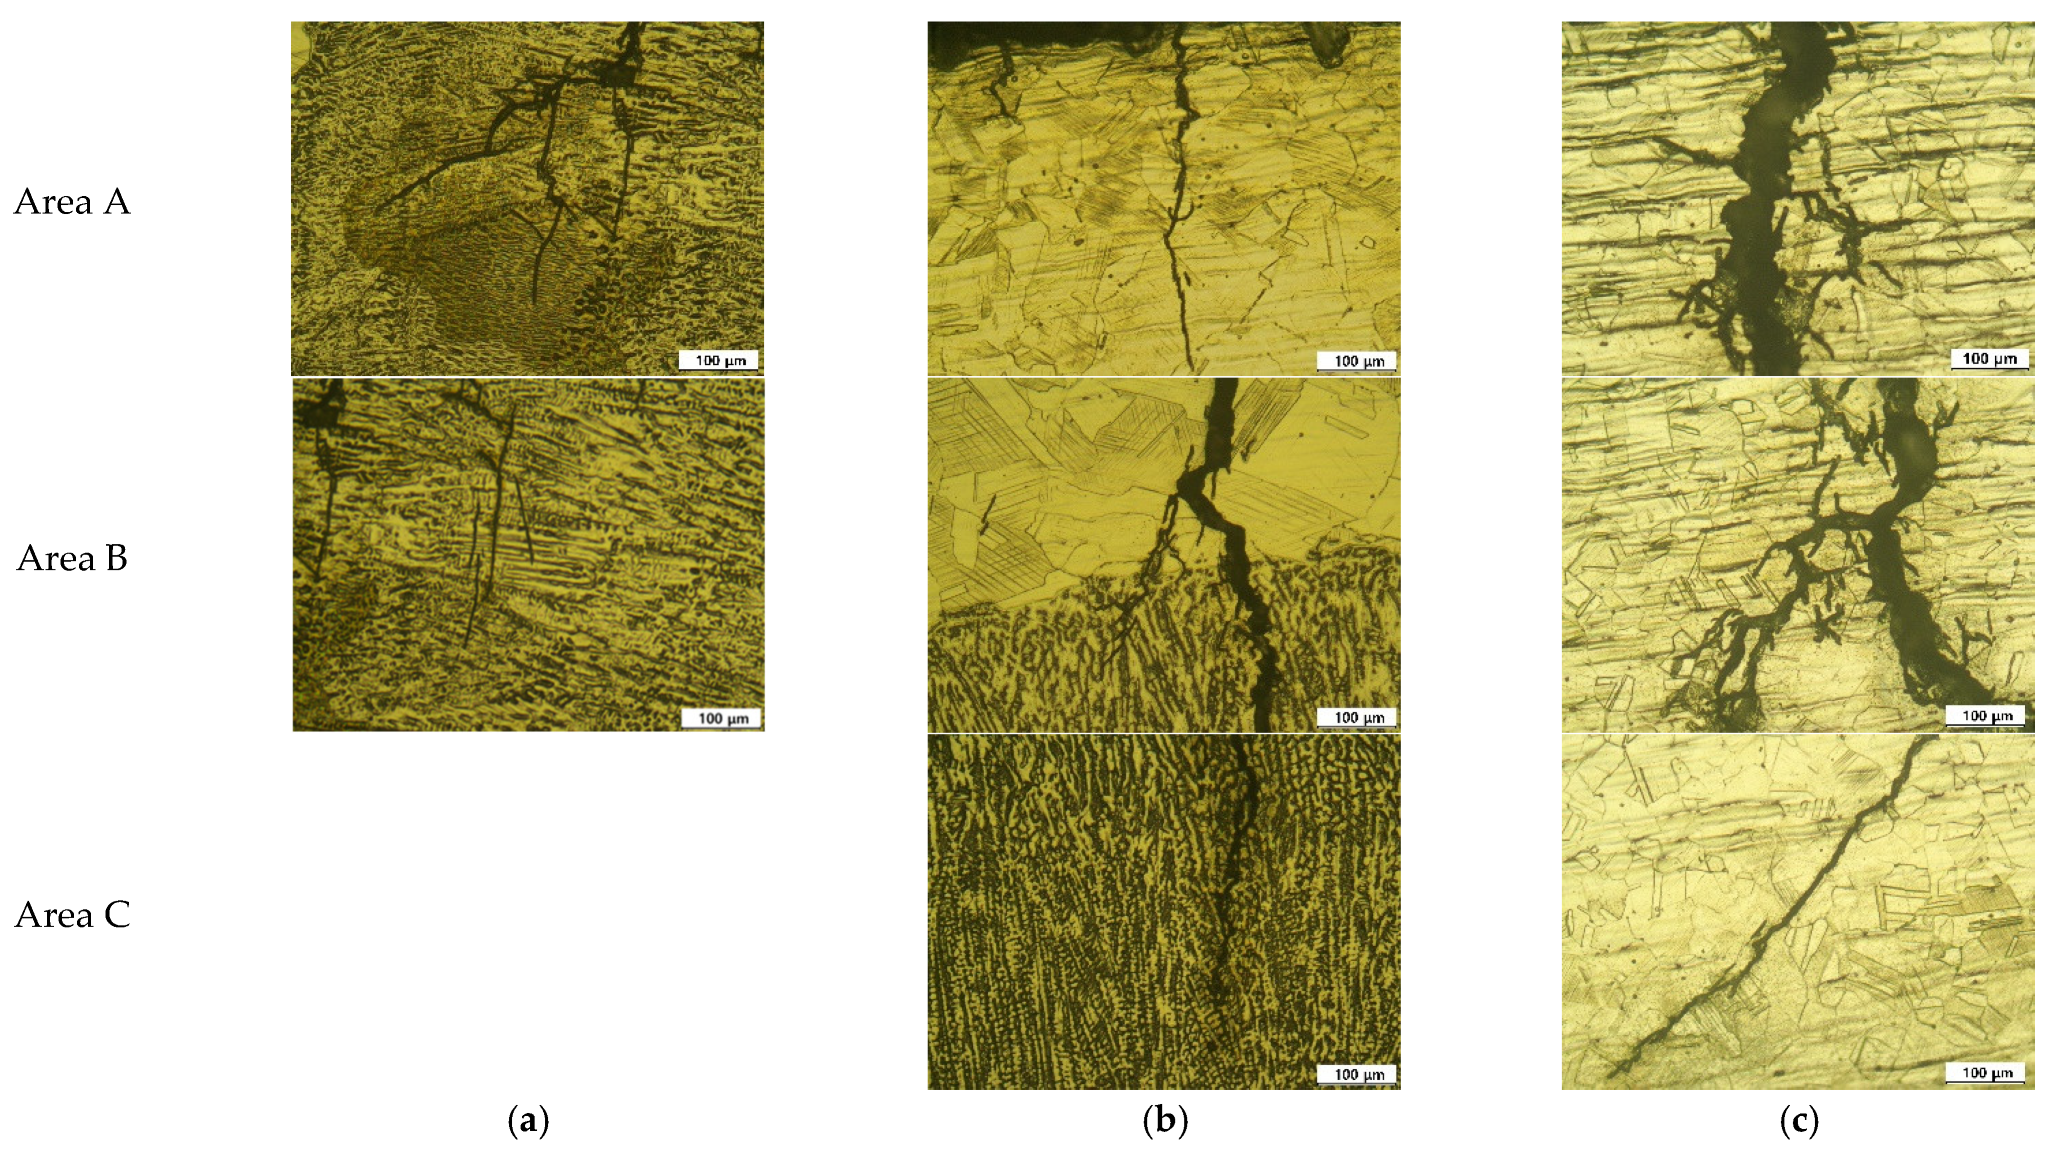
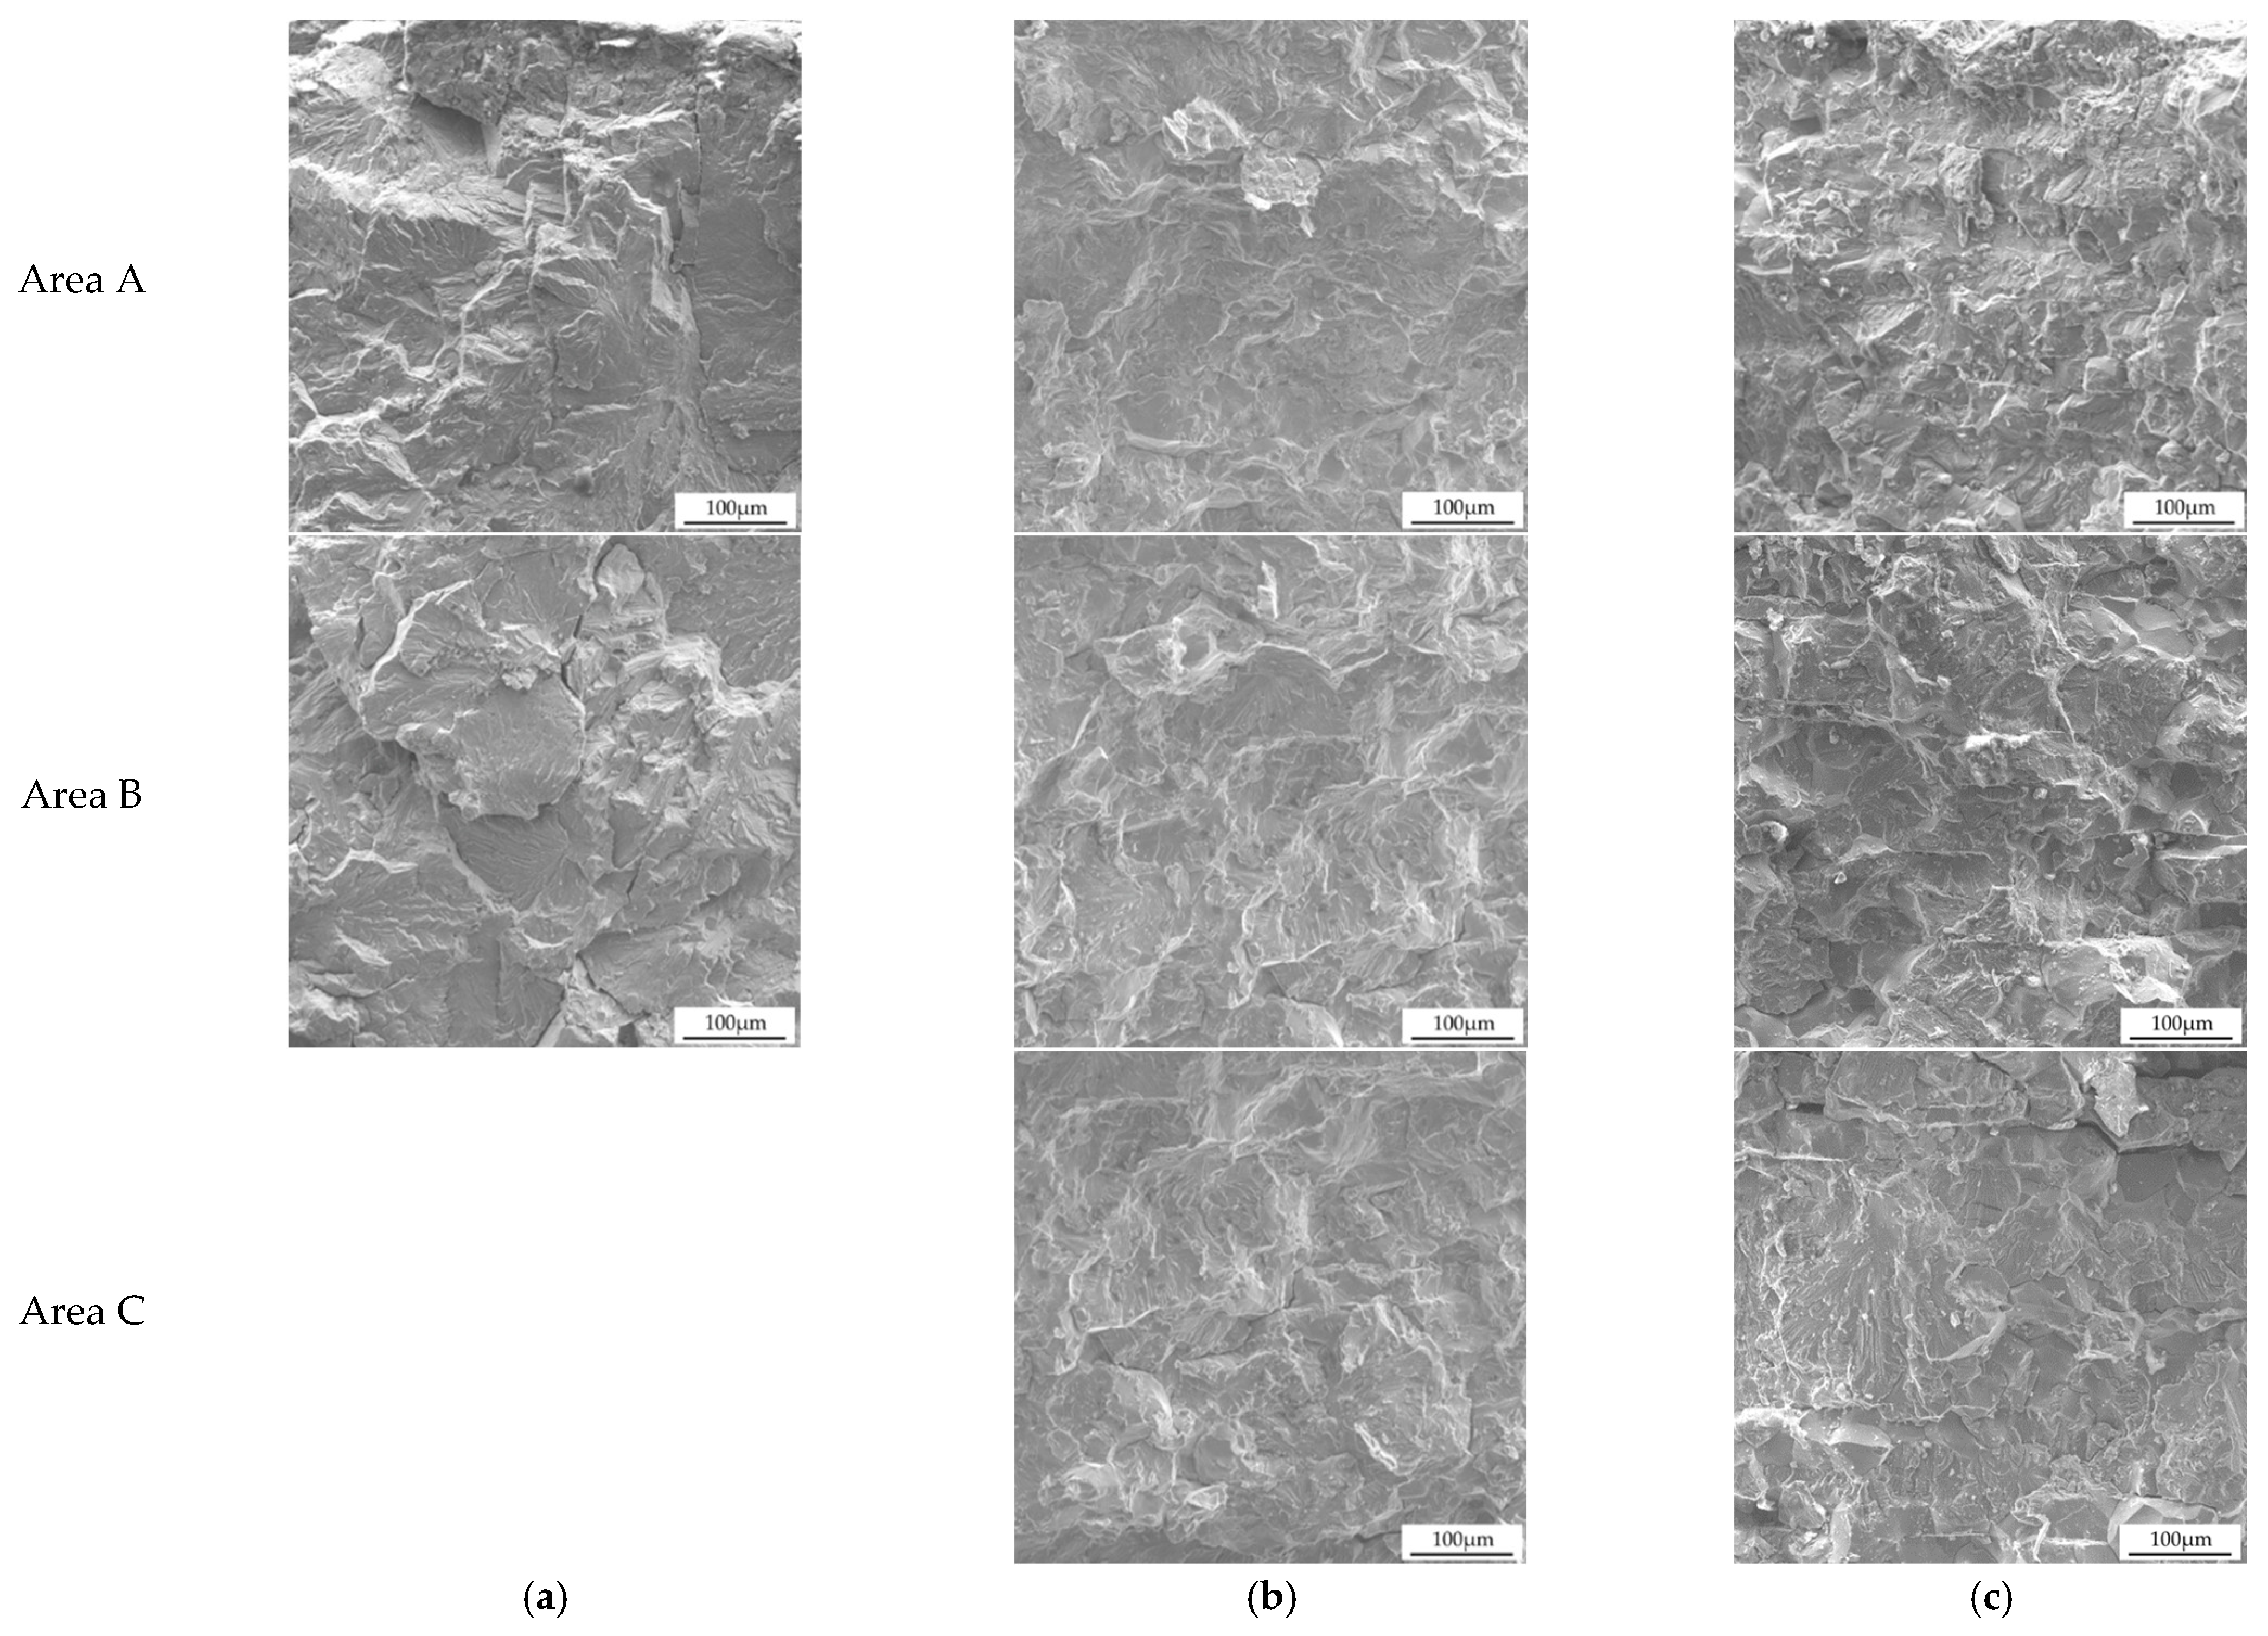
Figure 4 shows the crack morphologies of 304LB after the U-bend SCC test (OM ×50, 155 °C, 42% MgCl2). Figure 4a shows the crack in 304LB, Figure 4b shows the crack in 304LB−L−NC, and Figure 4c shows the crack in 304LB−L−WC. The red box areas in Figure 4 were observed at high magnification, as shown in Figure 5, which shows the crack morphologies of 304LB after the U-bend SCC test (OM, ×200, 155 °C, 42% MgCl2, Areas A, B, and C in Figure 4); the non-peened 304LB specimen shows mixed mode cracking (i.e., intergranular and transgranular cracking), while the laser peened 304LB−L−NC and 304LB−L−WC show transgranular cracking. To confirm the crack mode, the cracked specimens were intentionally broken, and the fractured surfaces were observed as depicted in Figure 6, which shows the cracking mode of 304LB after the U-bend SCC test (SEM, ×400, 155 °C, 42% MgCl2, top, middle, and bottom areas in Figure 4). All the specimens mainly show the transgranular cracking mode, which can be seen in the cross sectional optical micrographs of the crack.
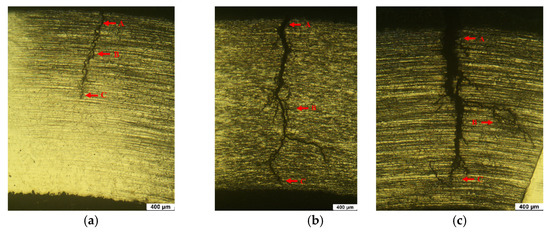
Figure 4.
Photographs of the cross section of 304LB after U-bend SCC test (OM, ×50, 155 °C, 42% MgCl2): (a) 304LB; (b) 304LB−L−NC; (c) 304LB−L−WC.
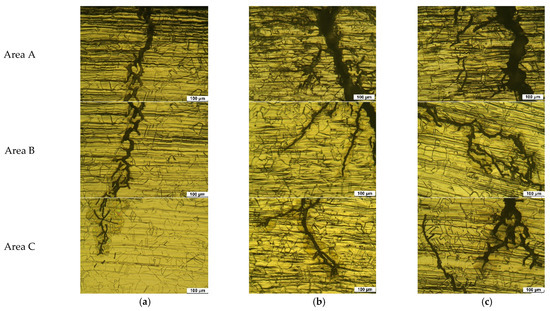
Figure 5.
Crack morphologies of 304LB after U-bend SCC test (OM, ×200, 155 °C, 42% MgCl2, Areas A, B, and C in Figure 5): (a) 304LB; (b) 304LB−L−NC; (c) 304LB−L−WC.
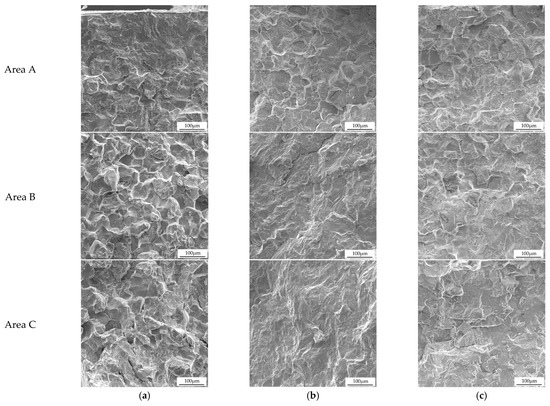
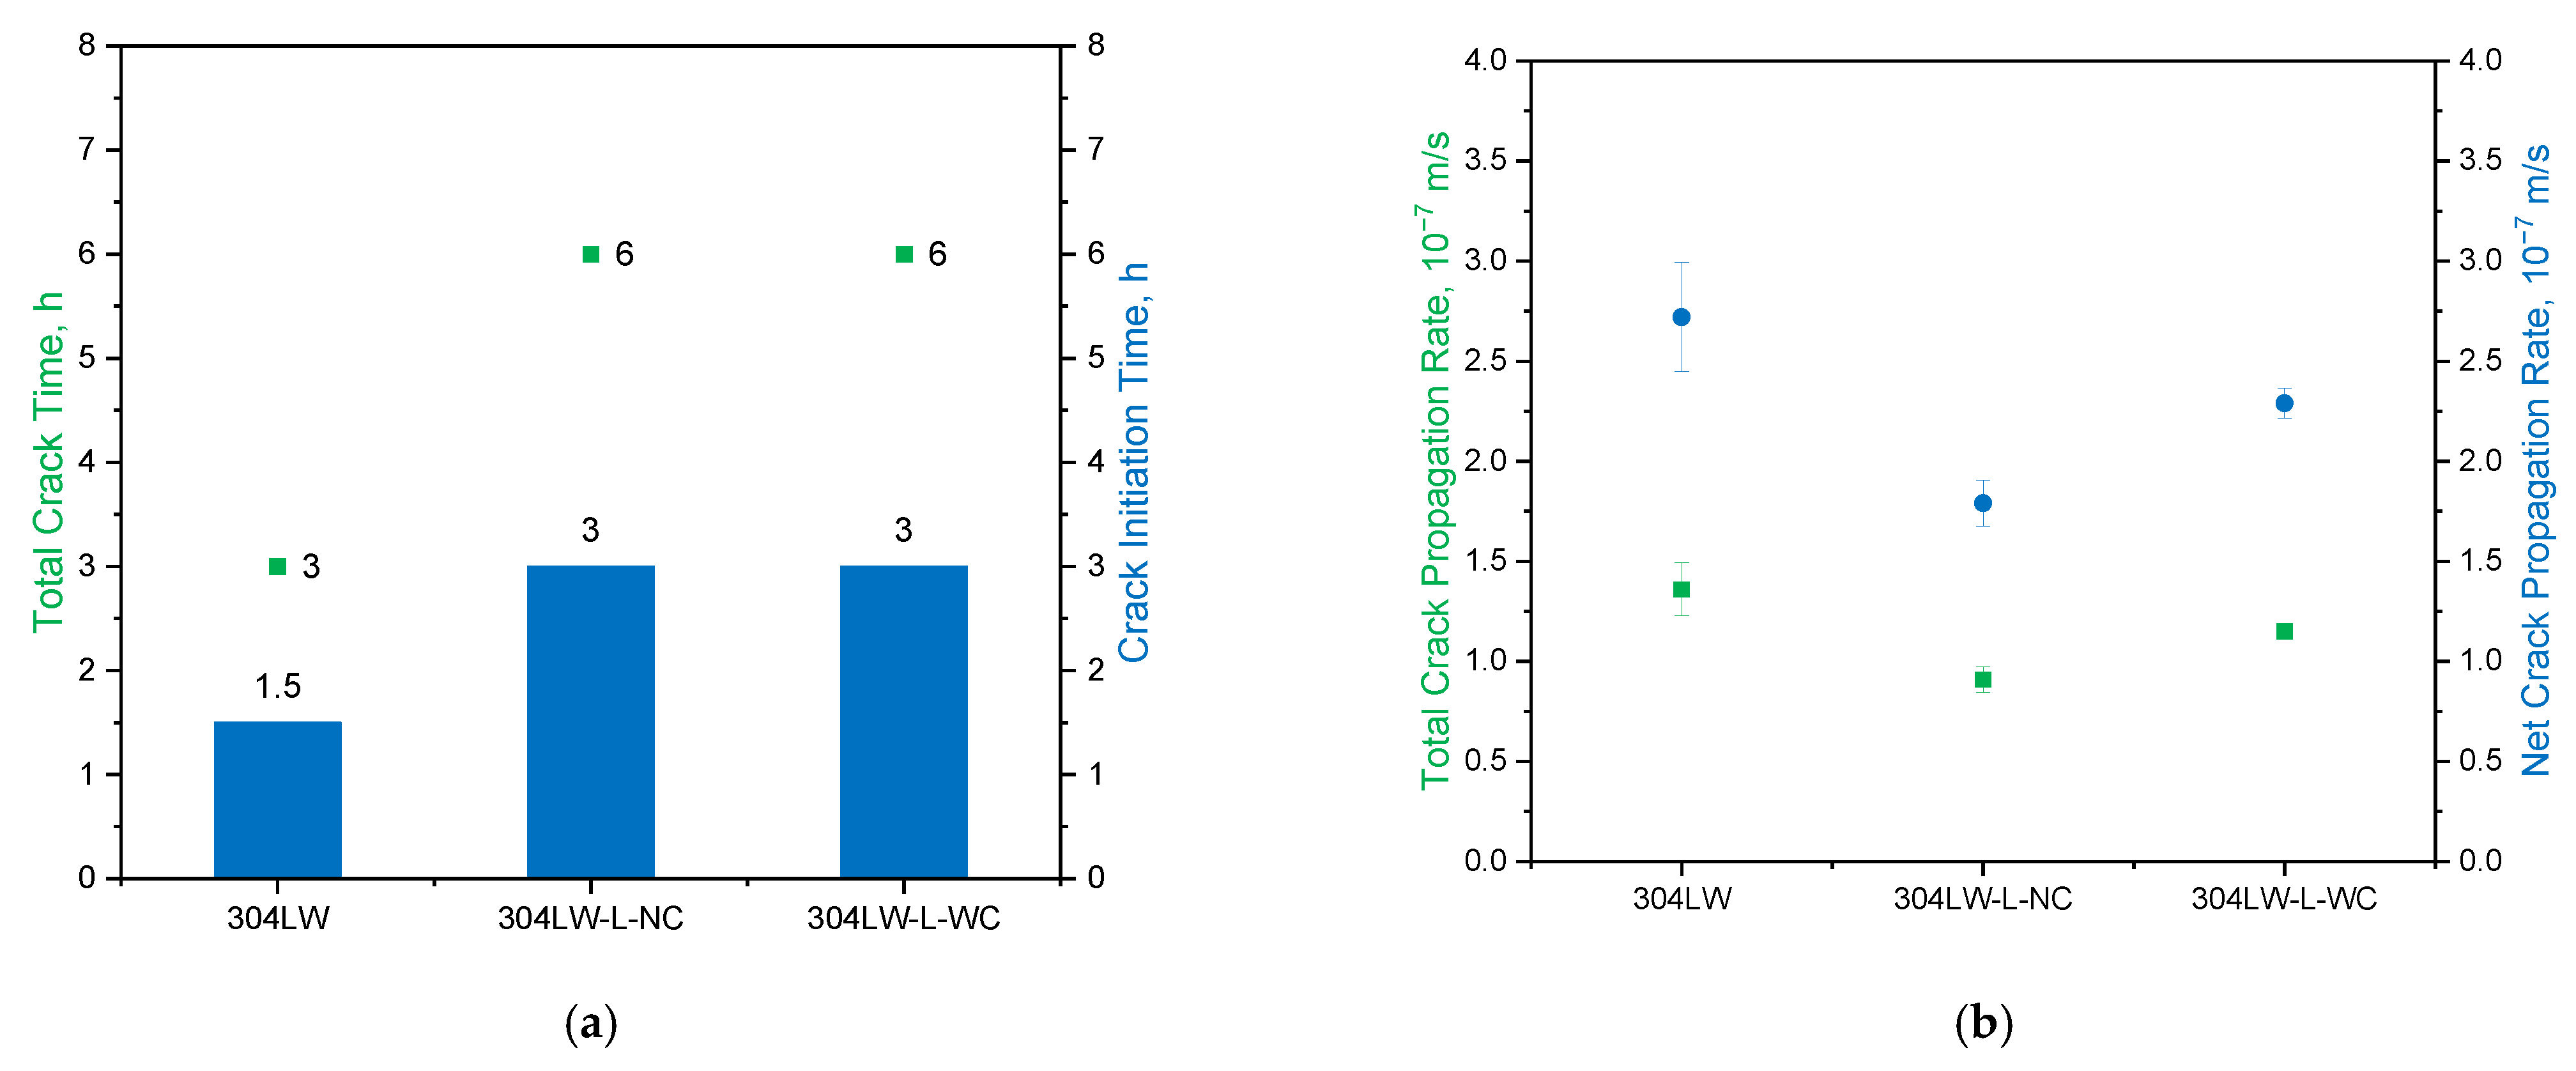
Figure 7 shows the effect of laser shock peening on the crack time of welded 304LW by the U-bending SCC test under the conditions of 155 °C, 42% MgCl2. In the case of non-peened 304LW, the total crack time is 3 h, and the crack initiation time is 1.5 h. The total crack time and the crack initiation time of laser-peened 304LW−L−NC are 6 and 3 h, respectively. In the case of laser-peened 304LW−L−WC, the same result as that obtained for 304LW−L−NC is shown. Regardless of the peening condition, the laser shock peening on welded 304 W increased the total crack time and the crack initiation time by a multiple of two. Figure 7b shows the effect of laser shock peening on the crack propagation rates of welded 304LW according to the U-bend SCC test (155 °C, 42% MgCl2). The total crack propagation rates of 304LW, 304LW−L−NC, and 304LW−L−WC were (1.36, 0.91, and 1.15) × 10−7 m/s, respectively. The net crack propagation rates of 304LW, 304LW−L−NC, and 304LW−L−WC were (2.72, 1.79, and 2.29) × 10−7 m/s, respectively. These results show that laser shock peening treatment on the surface of welded 304LW reduced both the total crack time and crack initiation time, while laser shock peening enhanced the SCC resistance of 304L stainless steel in a chloride environment.
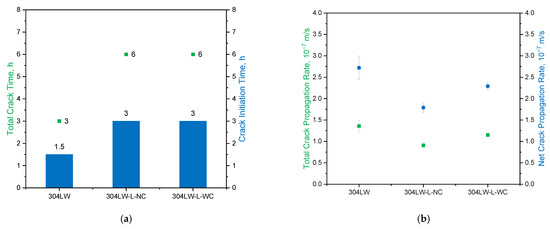
Figure 7.
Effect of laser shock peening on the total crack times of welded 304LW by U−bend SCC test at 155 °C, 42% MgCl2: (a) crack time; (b) crack propagation rates.
Figure 8 shows the surface appearance of 304LW following laser shock peening. Figure 8a shows the apex and cross section of 304LW before and after the SCC test, while Figure 8b shows the same for 304LW−L−NC, and Figure 8c shows the same for 304LW−L−WC. After the U-bend test, cracks were observed at the apex and the cross section. In the figures, the red arrow denotes the area in which the cracks were observed. Cracks were formed at the apex area of the U-bend specimen.
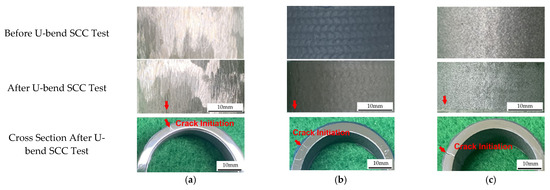
Figure 8.
Surface appearance of 304LW by LP: (a) 304LW; (b) 304LW−L−NC; (c) 304LW−L−WC.
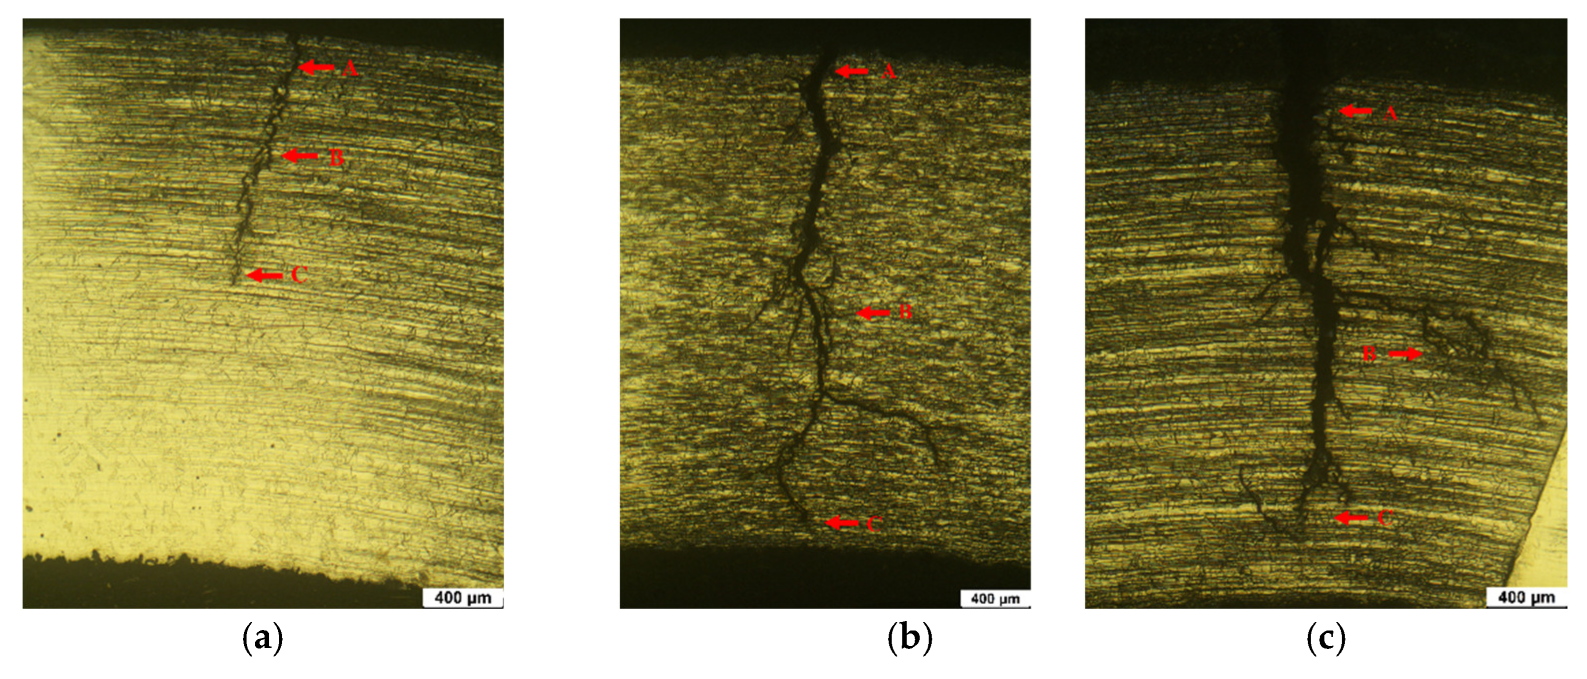
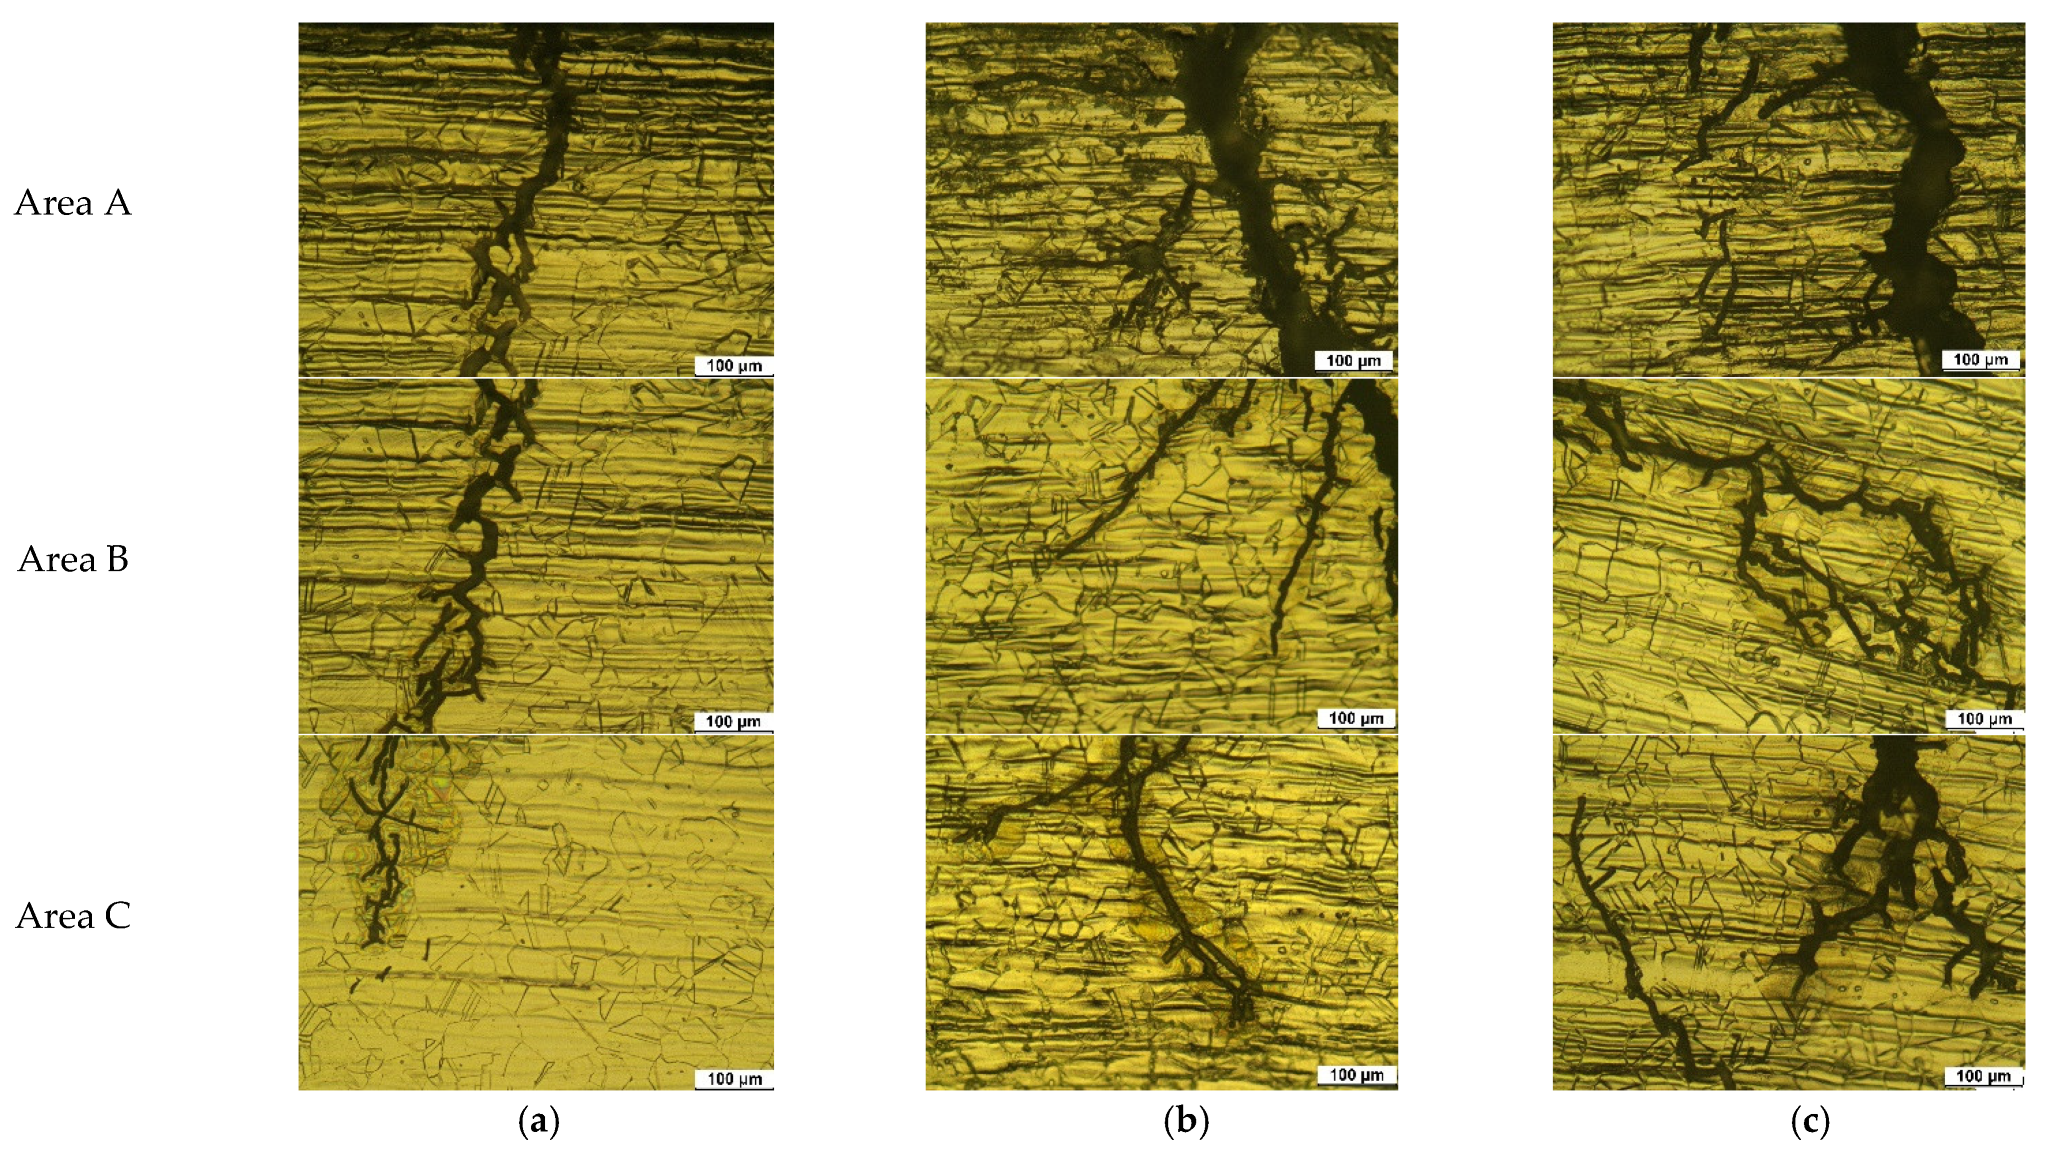
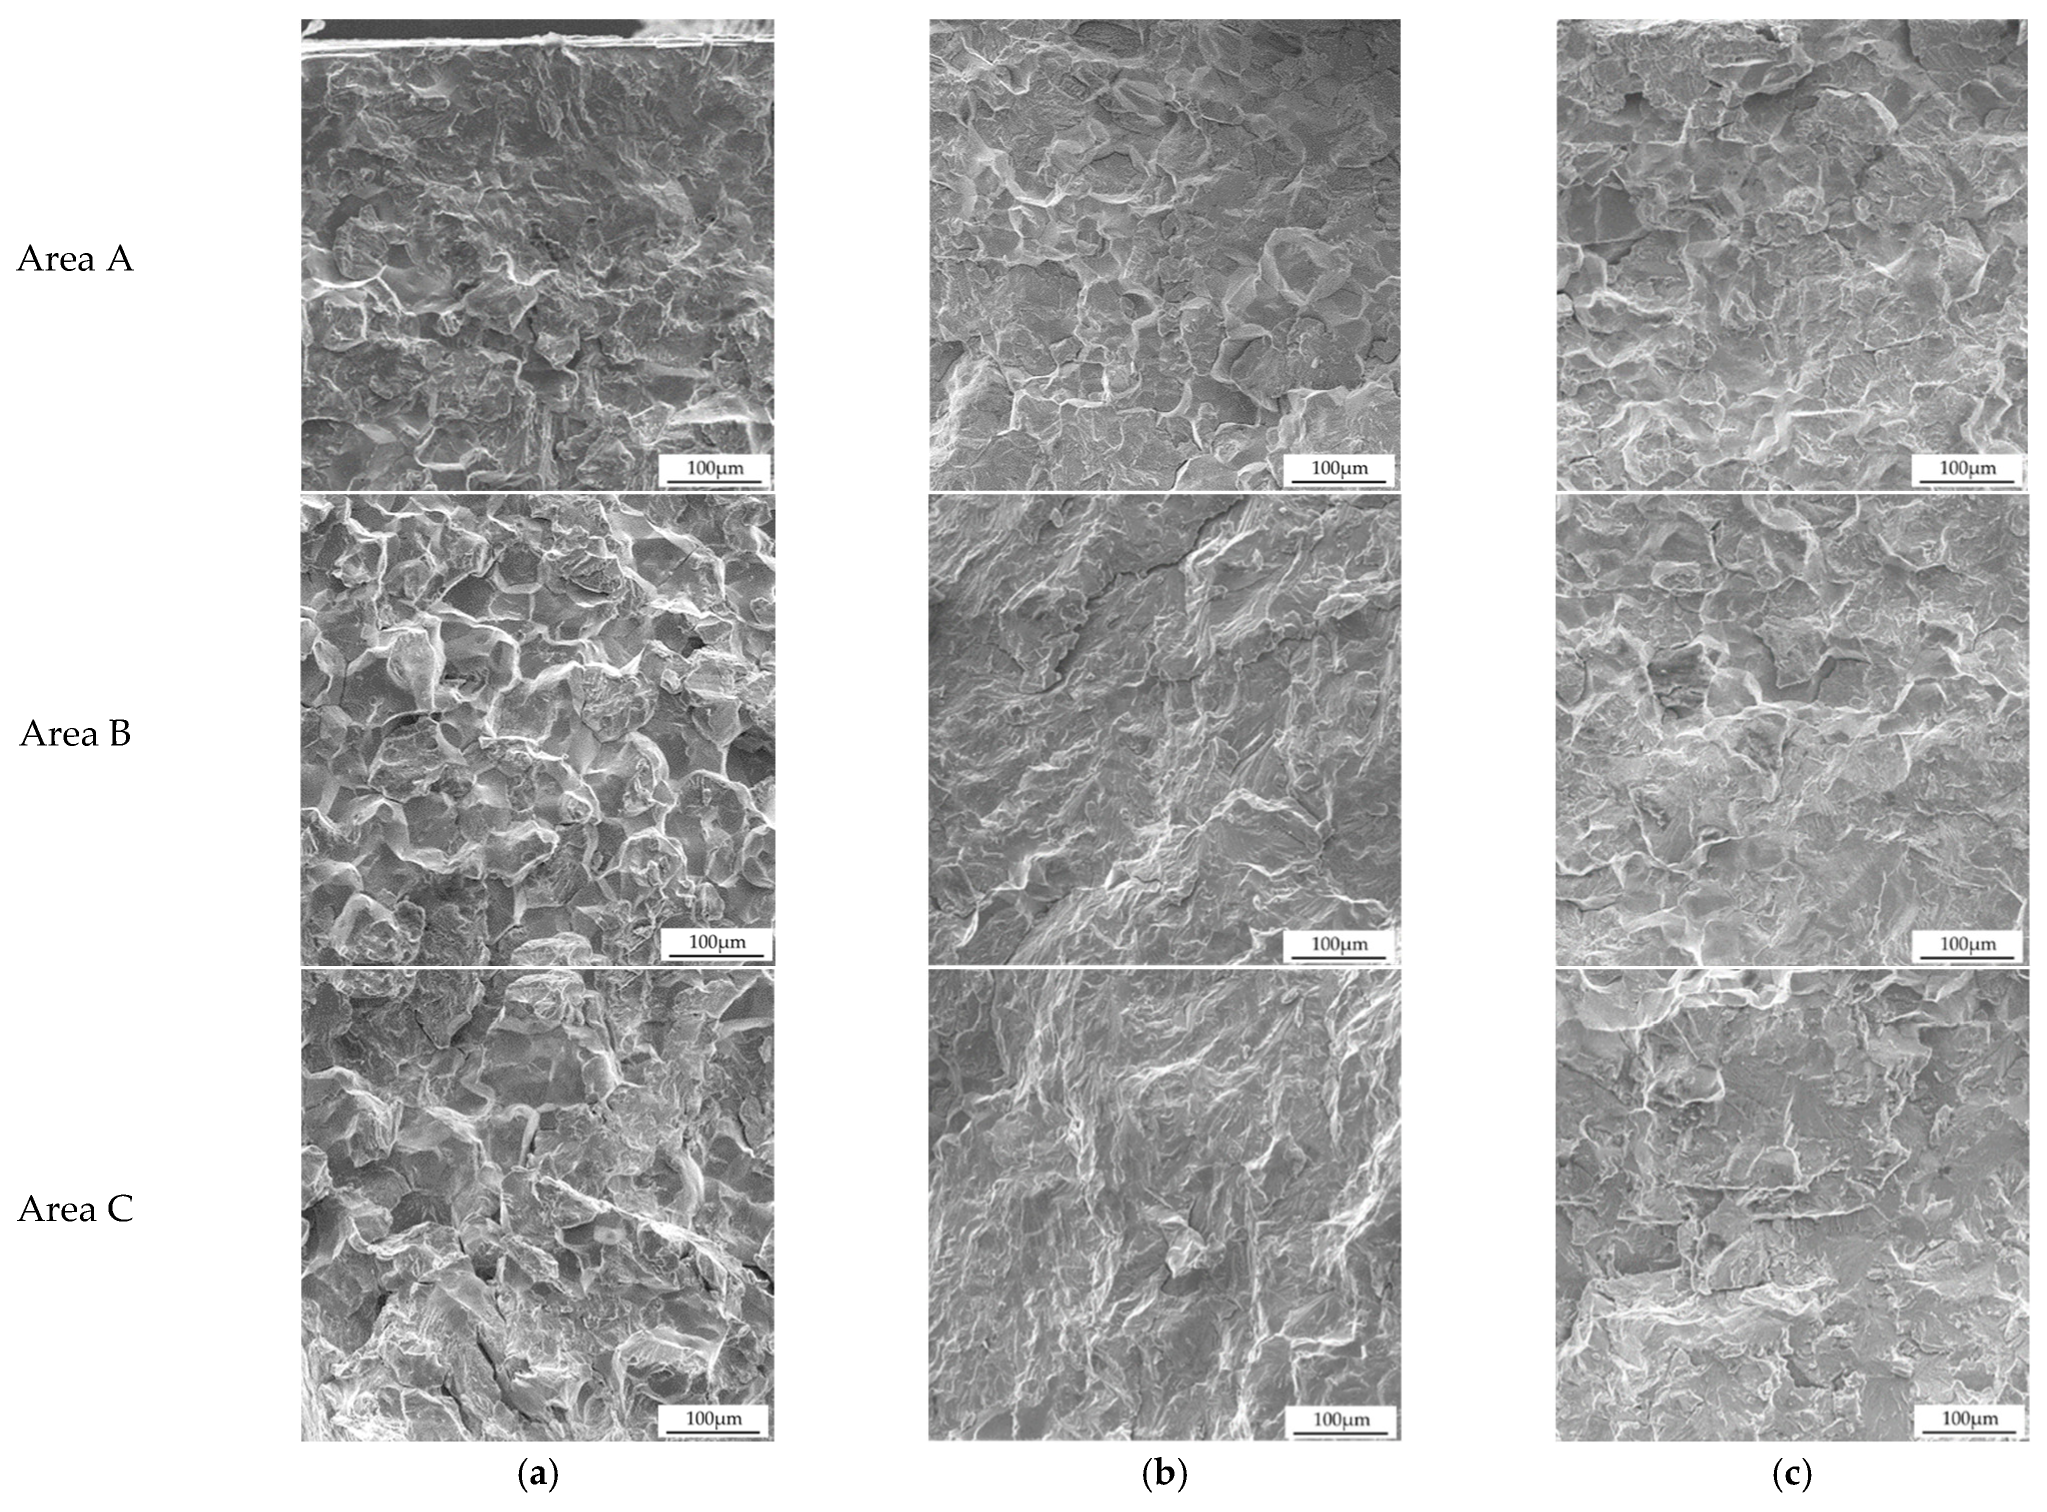
Figure 9 shows the crack morphologies of 304LW after the U-bend SCC test (OM, ×50, 155 °C, 42% MgCl2). Figure 9a shows the crack in 304LW, Figure 9b shows the crack in 304LW−L−NC, and Figure 9c shows the crack in 304LW−L−WC. The red box areas in Figure 9 were observed at high magnification, as shown in Figure 10, which shows the crack morphologies of 304LW after the U-bend SCC test (OM, ×200, 155 °C, 42% MgCl2, Areas A, B, and C in Figure 9); the non-peened 304LW specimen shows transgranular cracking whereas the laser peened 304LW−L−NC and 304LW−L−WC both show transgranular cracking. To confirm the crack mode, the cracked specimens were intentionally broken, and the fractured surfaces were observed, as can be seen in Figure 11, which shows the transgranular cracking mode of 304LW after the U-bend SCC test (SEM, ×400, 155 °C, 42% MgCl2, top, middle, and bottom areas in Figure 9). All the specimens mainly show transgranular cracking mode, which can be seen in the cross sectional optical micrographs of the crack.
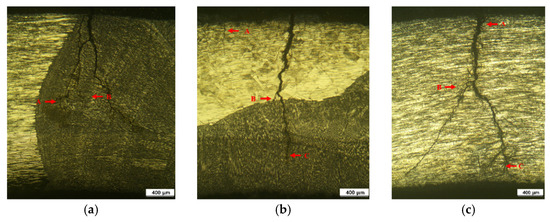
Figure 9.
Photographs of the cross section of 304LW after U-bend SCC test (OM, ×50, 155 °C, 42% MgCl2): (a) 304LW; (b) 304LW−L−NC; (c) 304LW−L−WC.
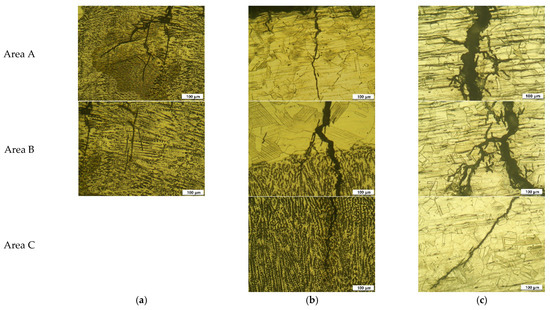
Figure 10.
Crack morphologies of 304LW after U-bend SCC test (OM, ×200, 155 °C, 42% MgCl2, Areas A, B, and C in Figure 10): (a) 304LW; (b) 304LW−L−NC; (c) 304LW−L−WC.
4. Discussion
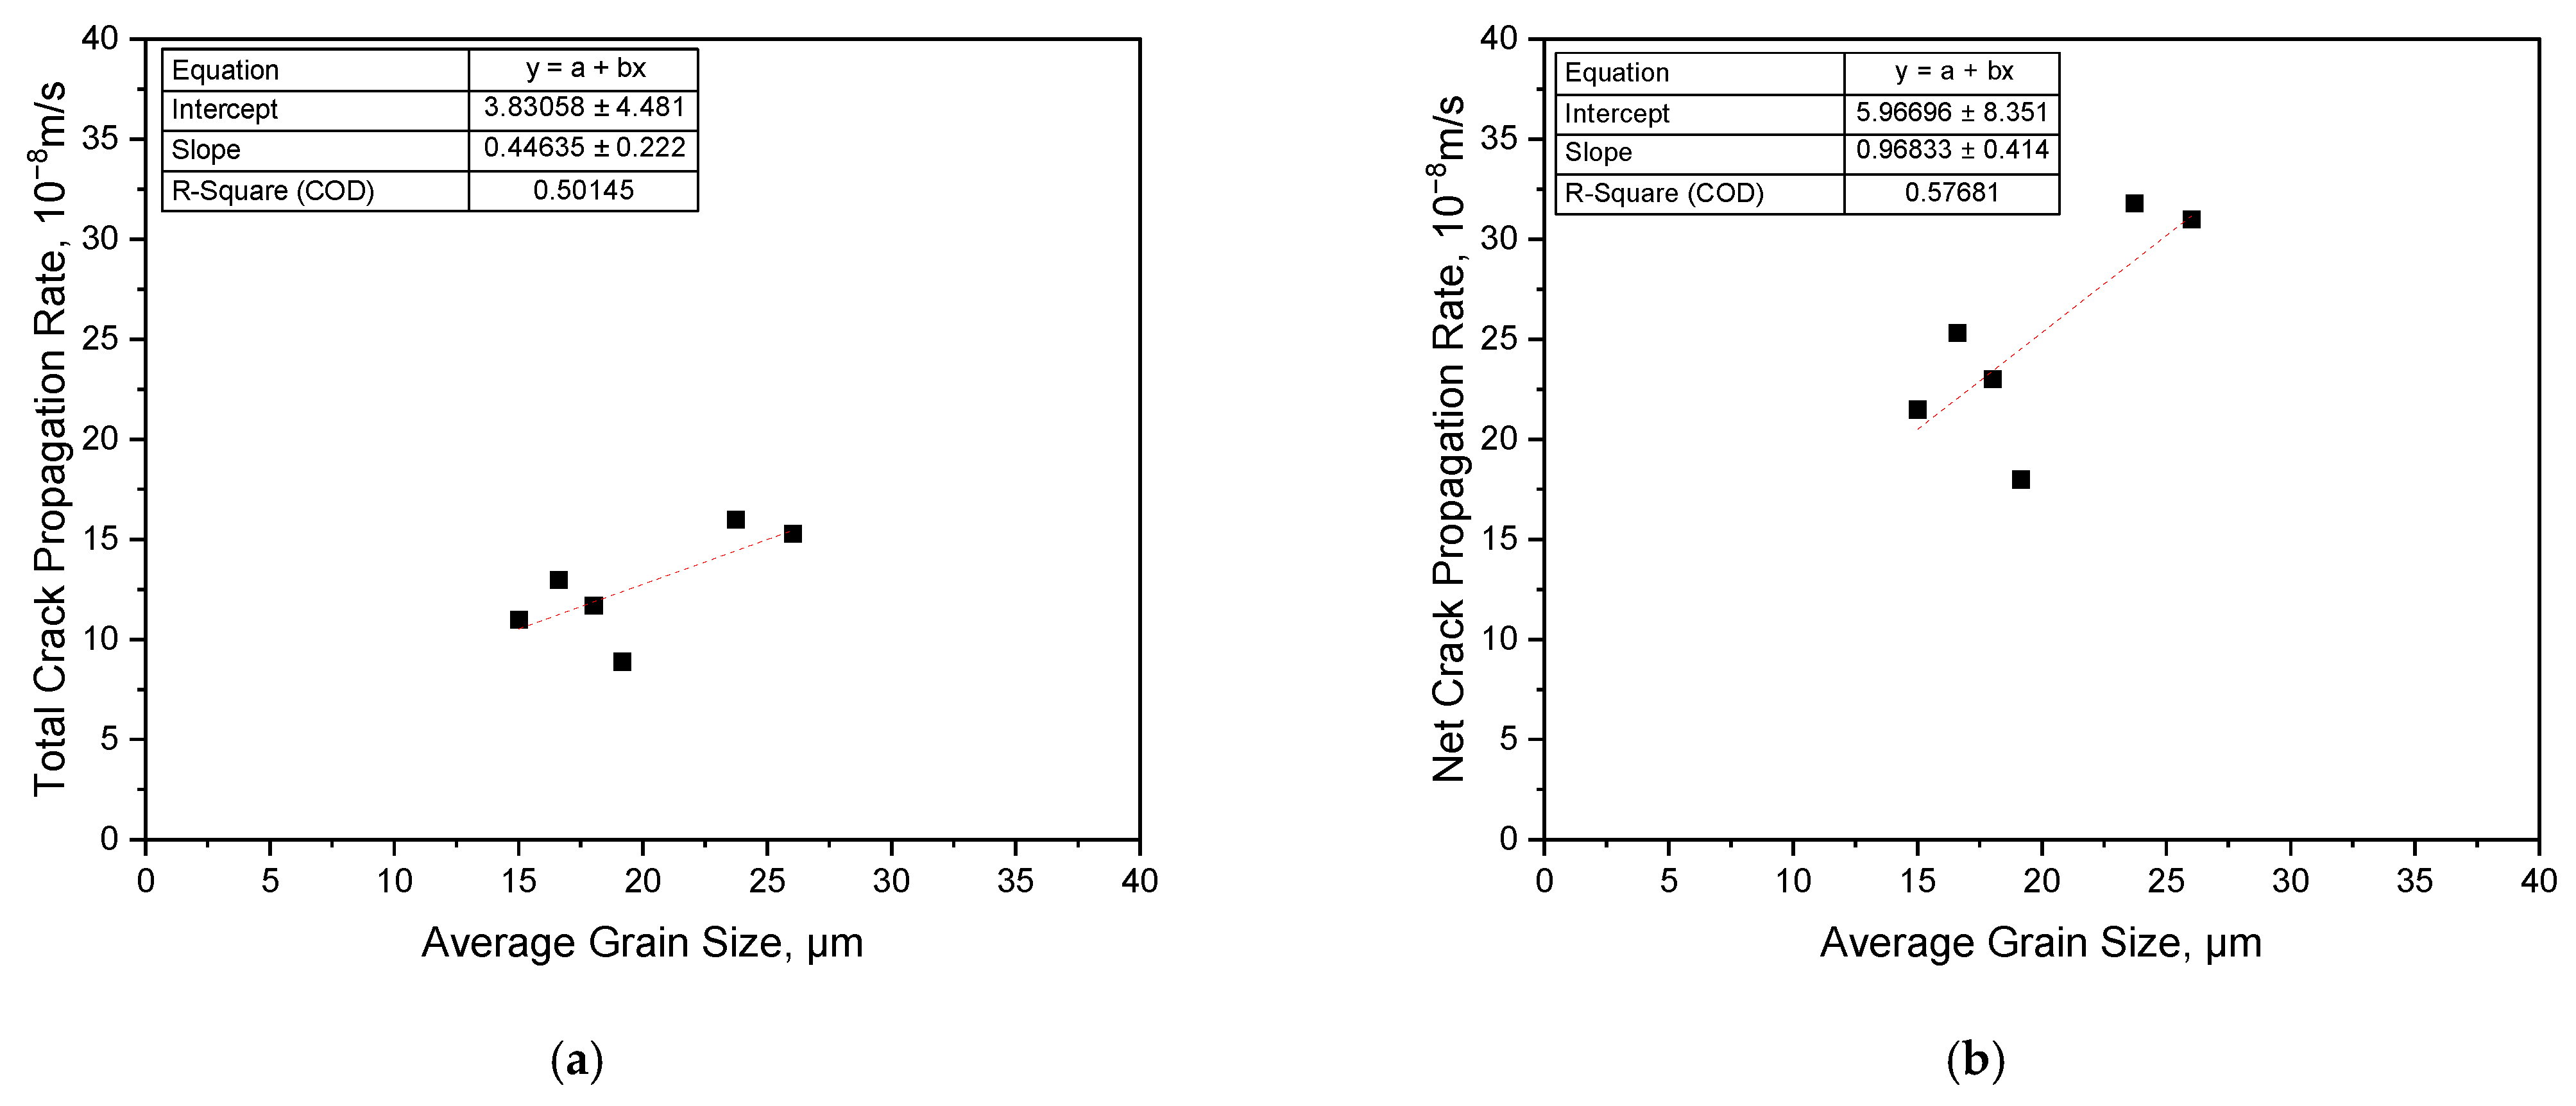
As we already reported [36], regardless of the thin Al coating, the laser shock peening roughened the surface, whereas it refined the grain size of the outermost area of 304L stainless steel [17,28]. We measured the average grain size and the corrosion properties of 304L stainless steel by LSP and summarized them in Table 5. The data in Table 5 were used to find the correlation between the properties and crack propagation rates. The relationship between SCC resistance and the microstructural variables was analyzed, to confirm the nature of that relationship. Figure 12 shows the relationship between crack propagation rates and average grain size [36]. As the average grain size increases, the total crack propagation rate increases, albeit with a slightly low determination coefficient (R2 of 0.5265). In addition, as the average grain size increases, the net crack propagation rate also increases. These results appear to be correlated with each other, as the crack propagation rate tends to decrease with decreasing average grain size [6,7].

Table 5.
Peening effect on average grain size and corrosion properties of 304L base and welded metals [36,37].
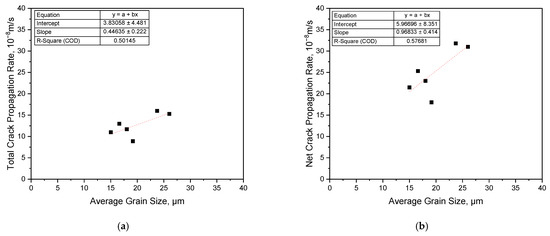
Figure 12.
Relationship between the crack propagation rate and average grain size: (a) total crack propagation rate, (b) net crack propagation rate.
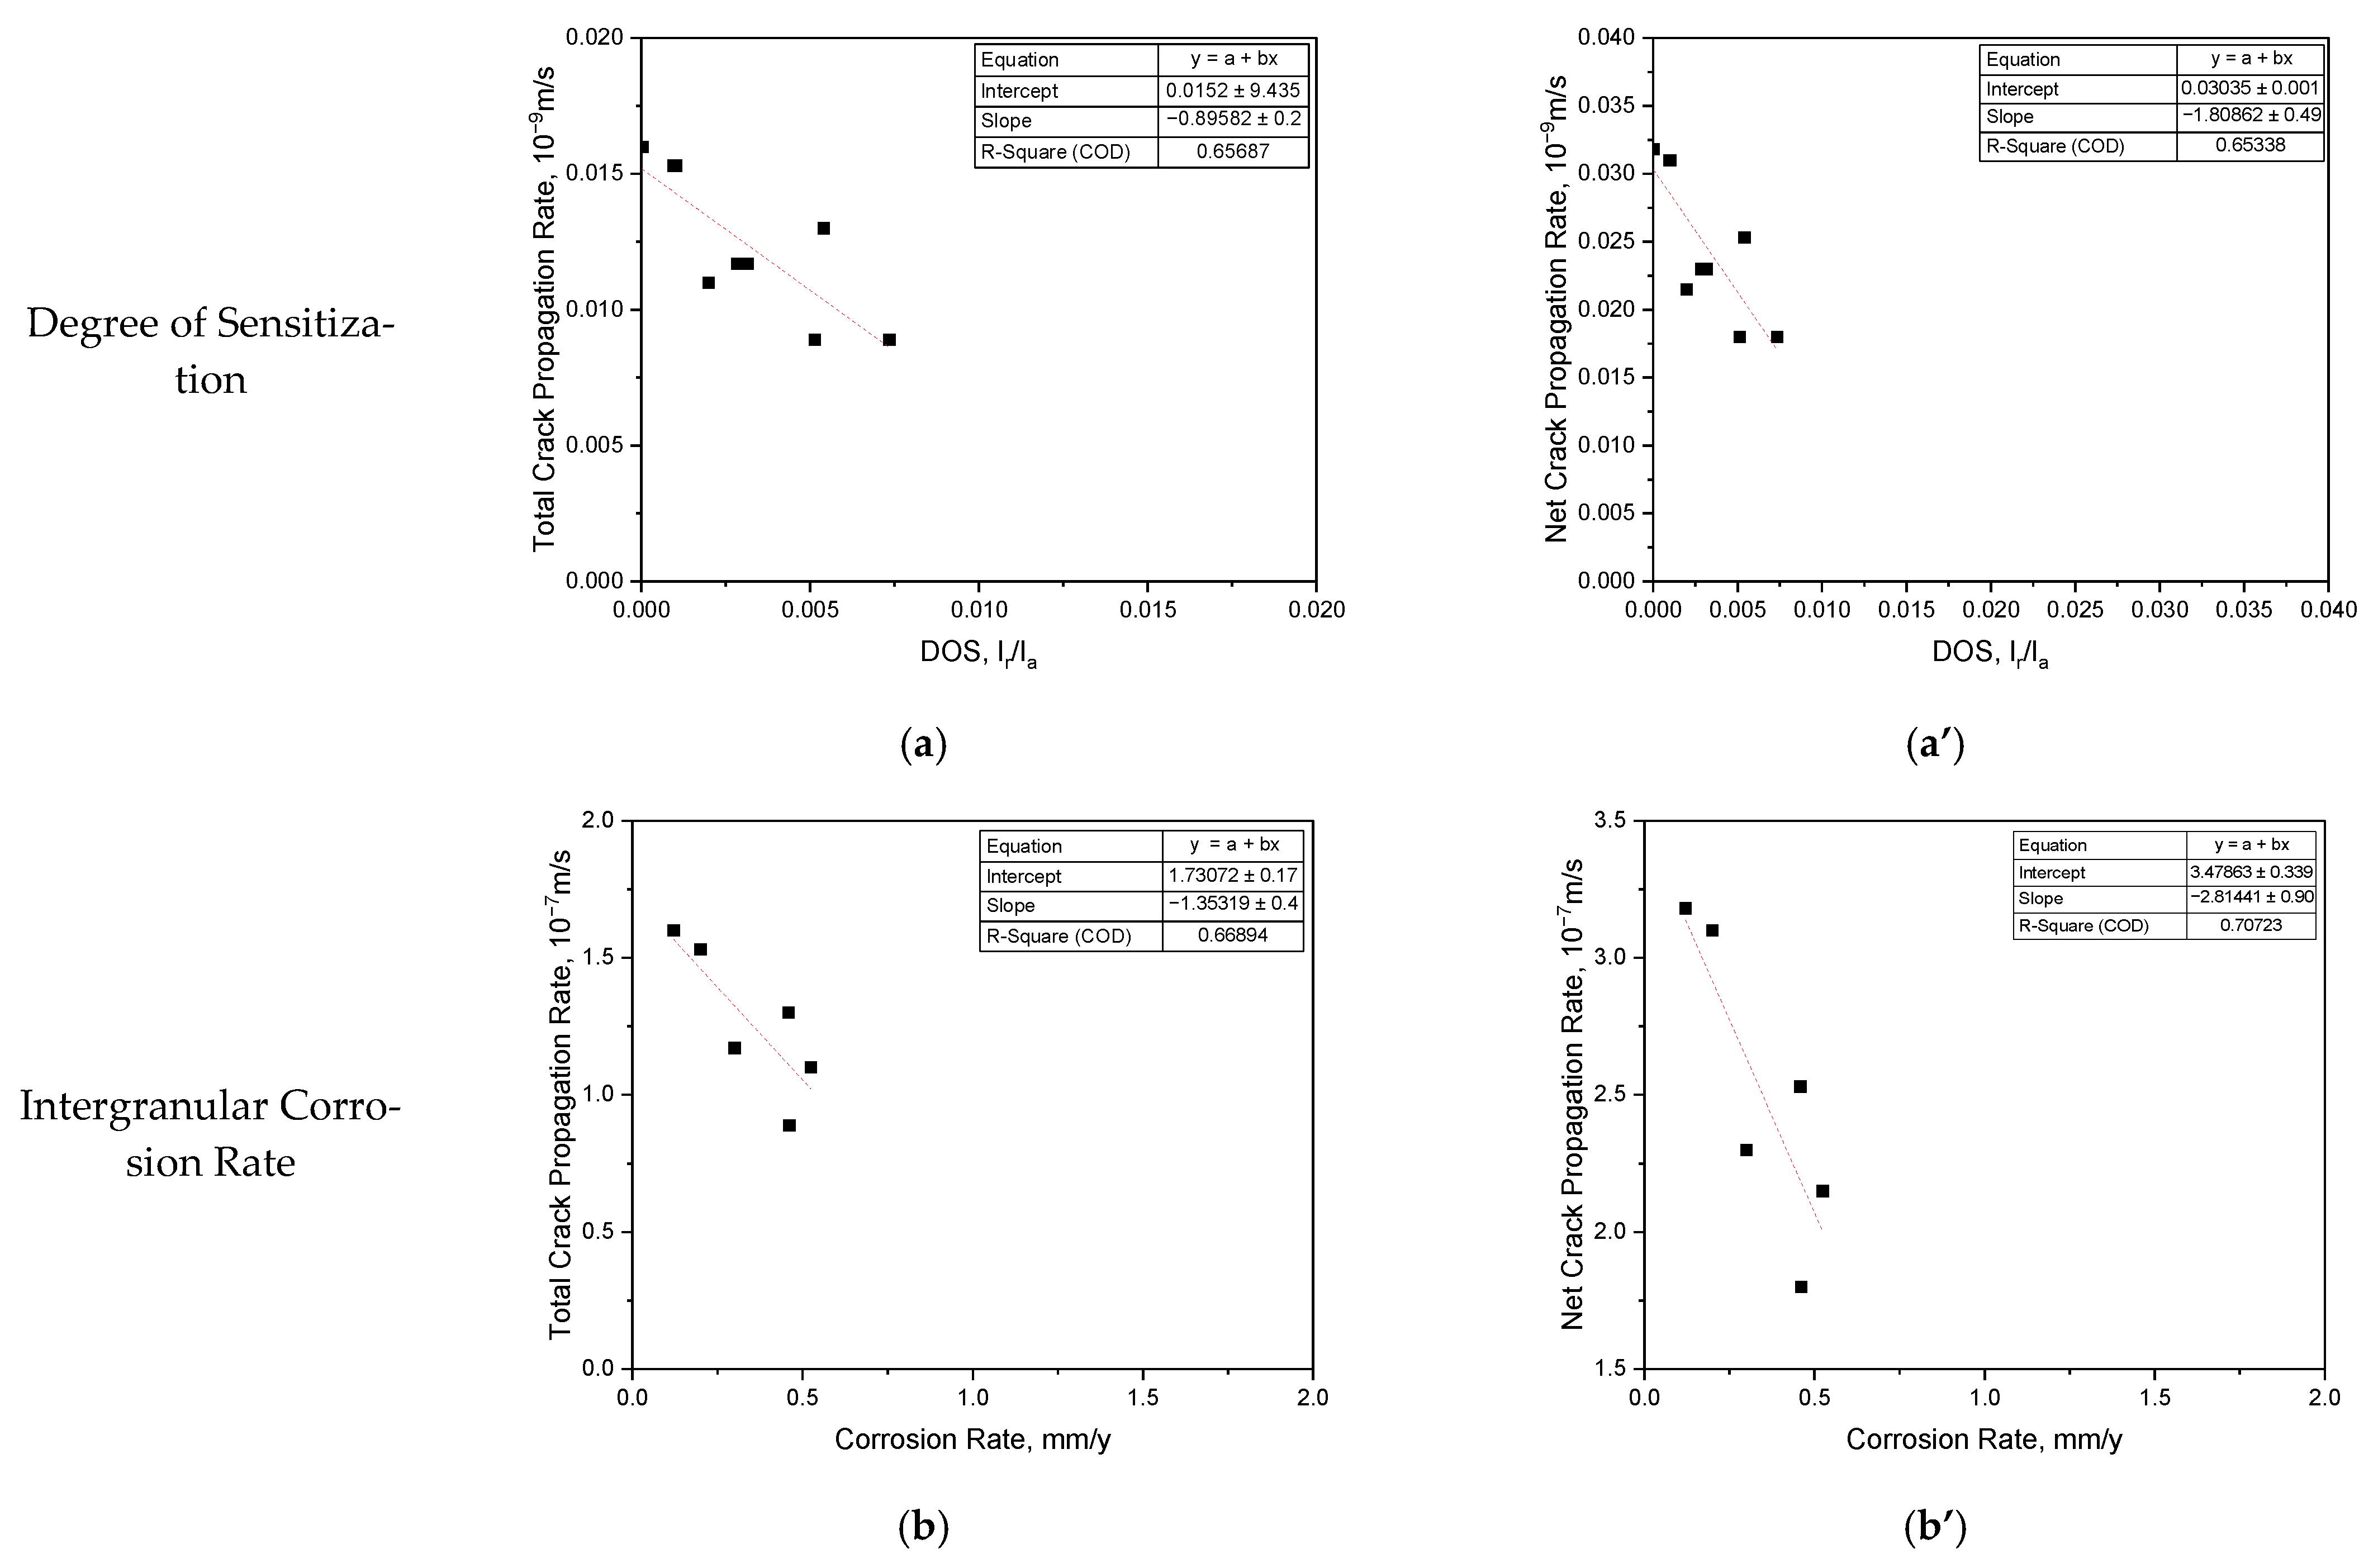
As described elsewhere [37], the intergranular corrosion rate of the laser-peened specimen was slightly higher than that of the non-peened specimen. The increased area of grain boundaries by laser shock peening influenced the intergranular corrosion resistance, but the Al coating in the laser shock peening process did not affect the resistance. Figure 13 shows the relationship between the crack propagation rate and intergranular corrosion properties. With an increasing degree of sensitization, the total crack propagation rate and net crack propagation rate were reduced. Moreover, with an increase in the intergranular corrosion rate, the total crack propagation rate and net crack propagation rate were also reduced. As shown in Figure 5, Figure 6, Figure 9 and Figure 10, the crack mode was mainly transgranular, indicating that the intergranular corrosion properties did not affect the SCC resistance of 304L stainless steel much, regardless of welding or laser shock peening.
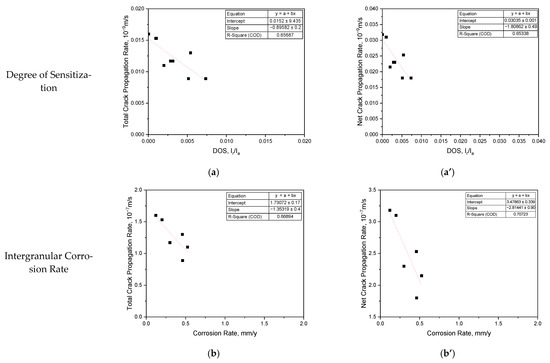
Figure 13.
Relationship between crack propagation rate and intergranular corrosion: (a,b) total crack propagation, (a’,b’) net crack propagation rate.
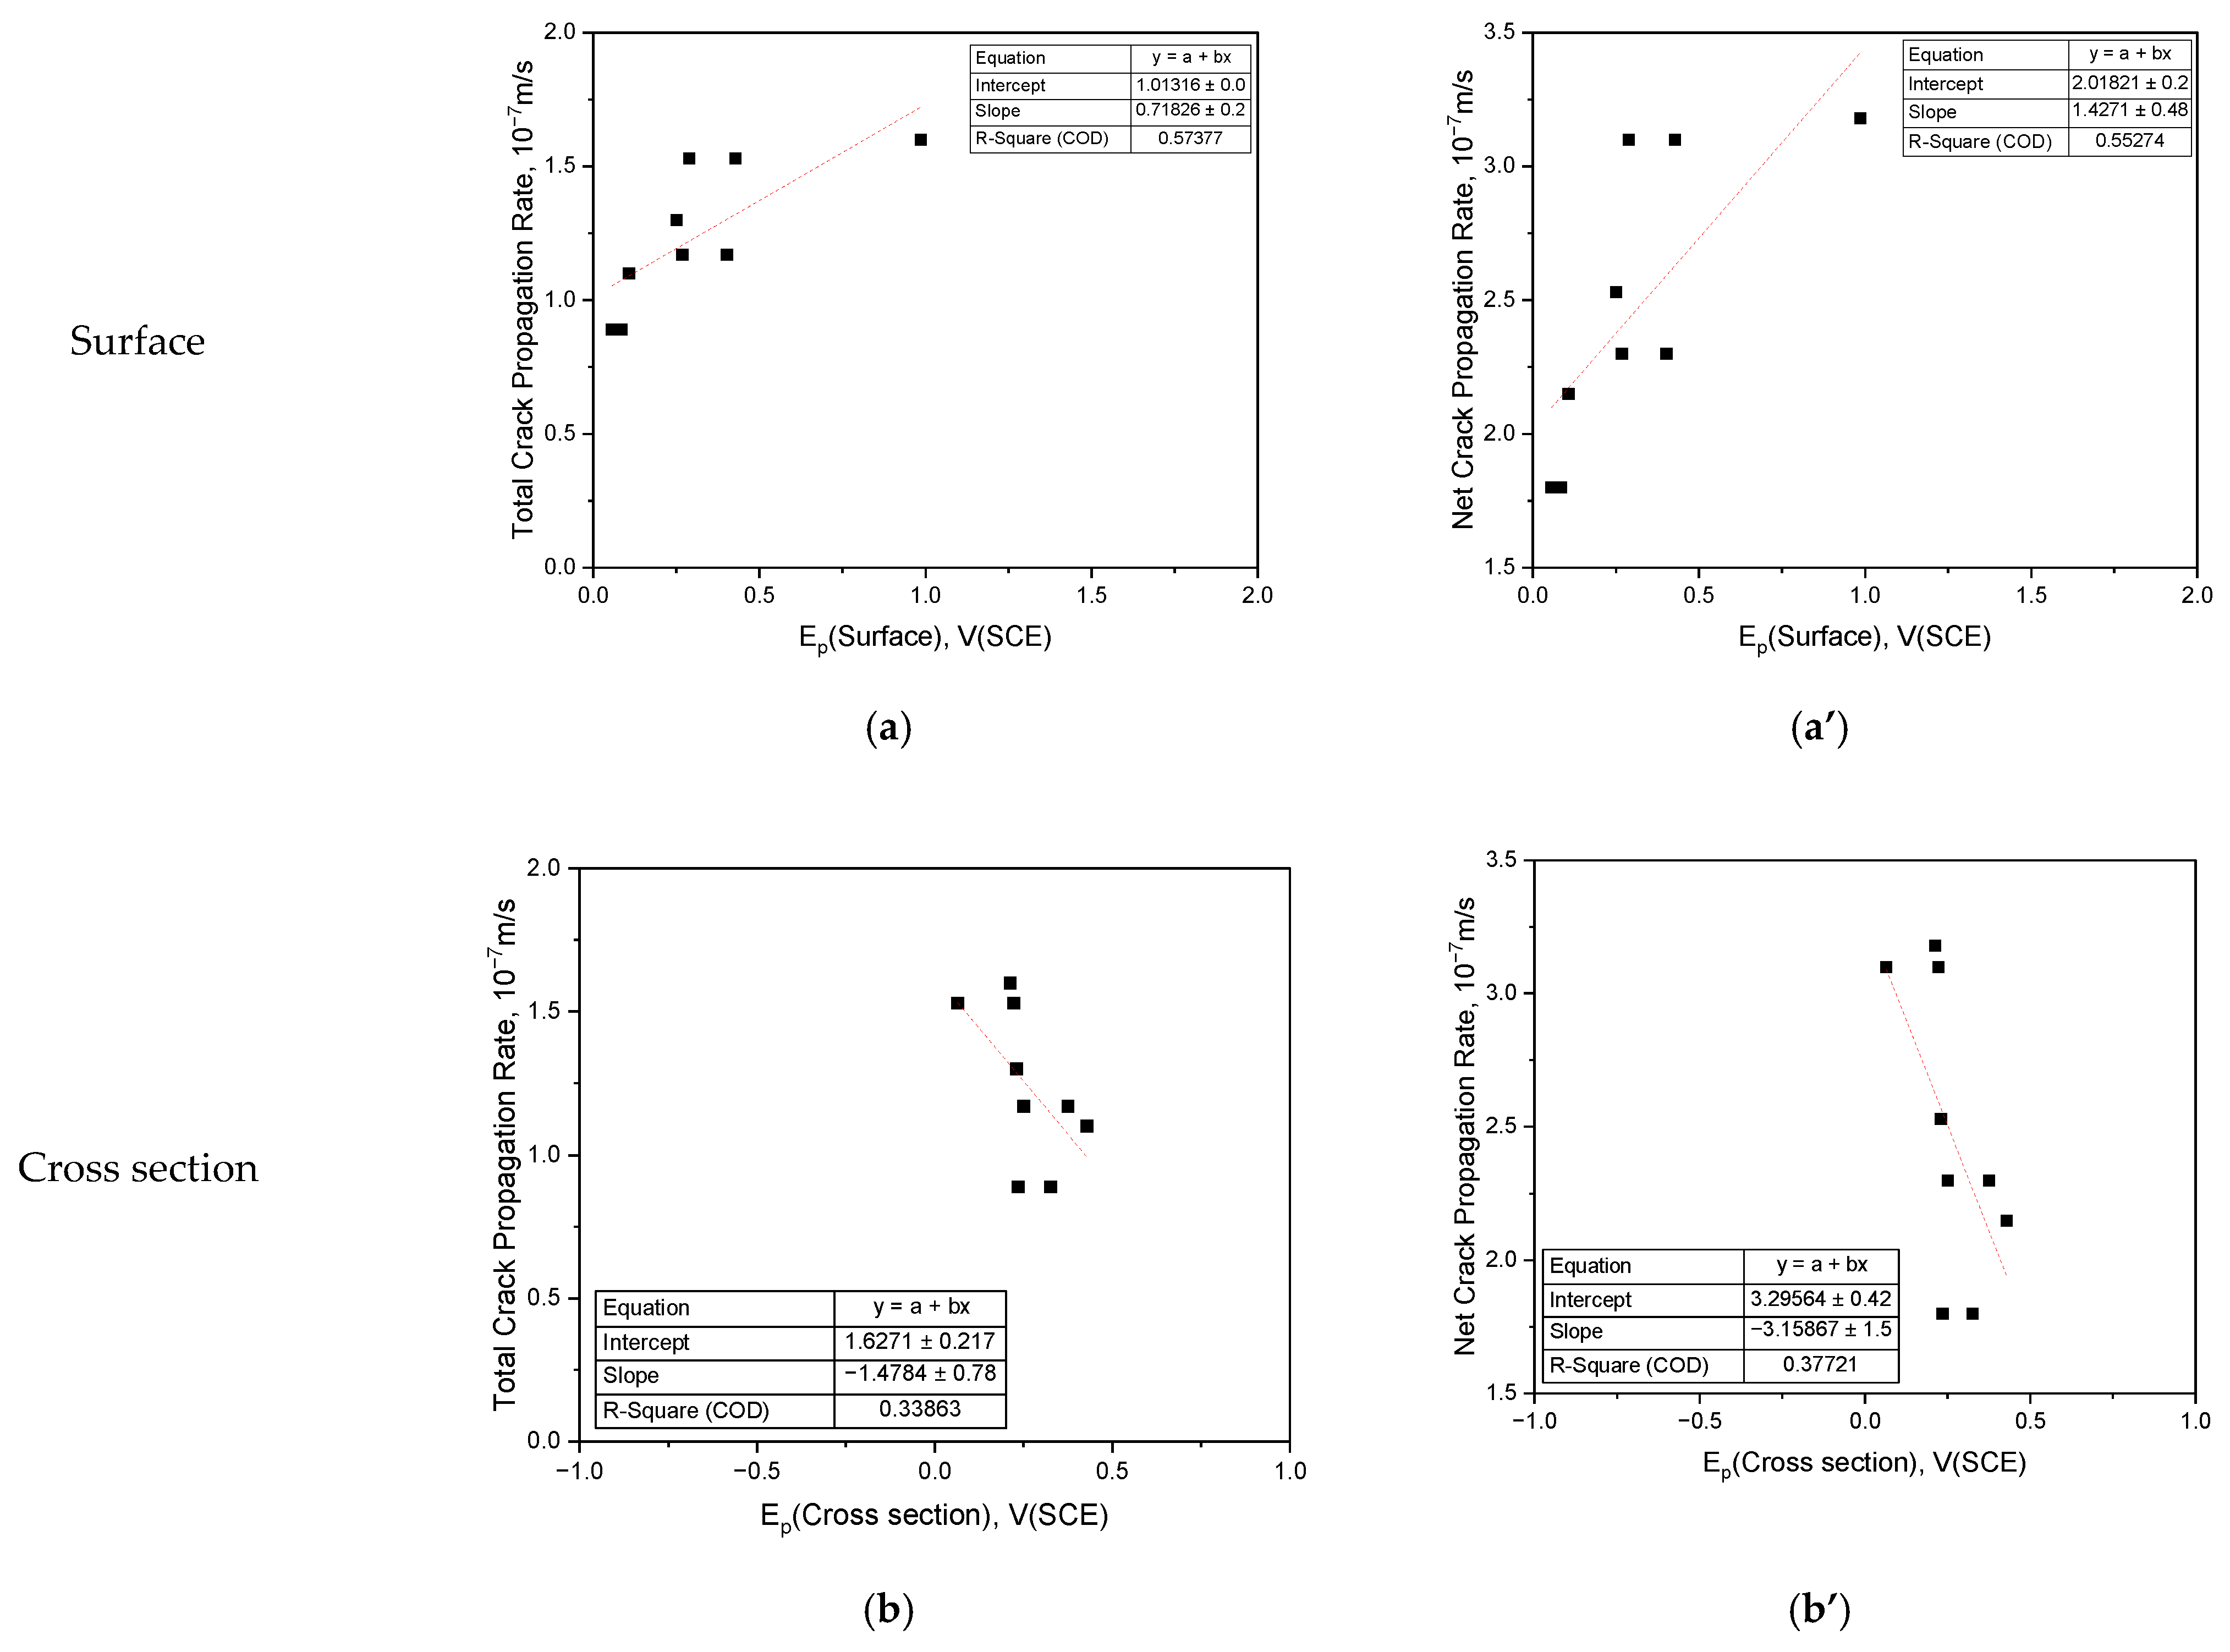
Figure 14 shows the relationship between the crack propagation rate and the pitting potential, where Figure 14a,a’ are both graphs showing the correlation between the total crack propagation rate and the pitting potential of the surface of 304L stainless steel. Even though the pitting potential of the surface increased, the crack propagation rates also increased. Figure 14b,b’ show the correlation between the pitting potential of the cross section and the crack propagation rates. Increasing the pitting potential of the cross section of 304L decreased the crack propagation rates. This behavior can be explained based on the microstructural change by laser shock peening treatment. As described elsewhere [36,37], the laser shock peening decreased the pitting resistance of the surface of 304L stainless steel, which was related to the surface roughness; however, laser shock peening on the outermost area in the cross section of 304L stainless steel enhanced the polarization properties, which was related to the microstructural change by laser shock peening, irrespective of Al coating. In other words, as shown in Figure 14, the SCC resistance of 304L stainless steel depends upon the corrosion properties of the cross section, rather than those of the surface, because of the surface roughness by laser shock peening.
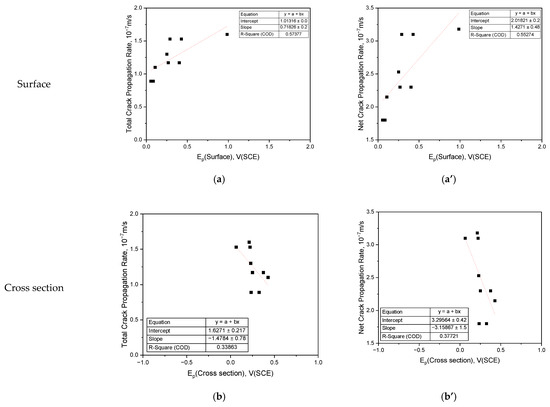
Figure 14.
Relationship between the crack propagation rate and pitting potential: (a,b) total crack propagation, (a’,b’) net crack propagation rate.
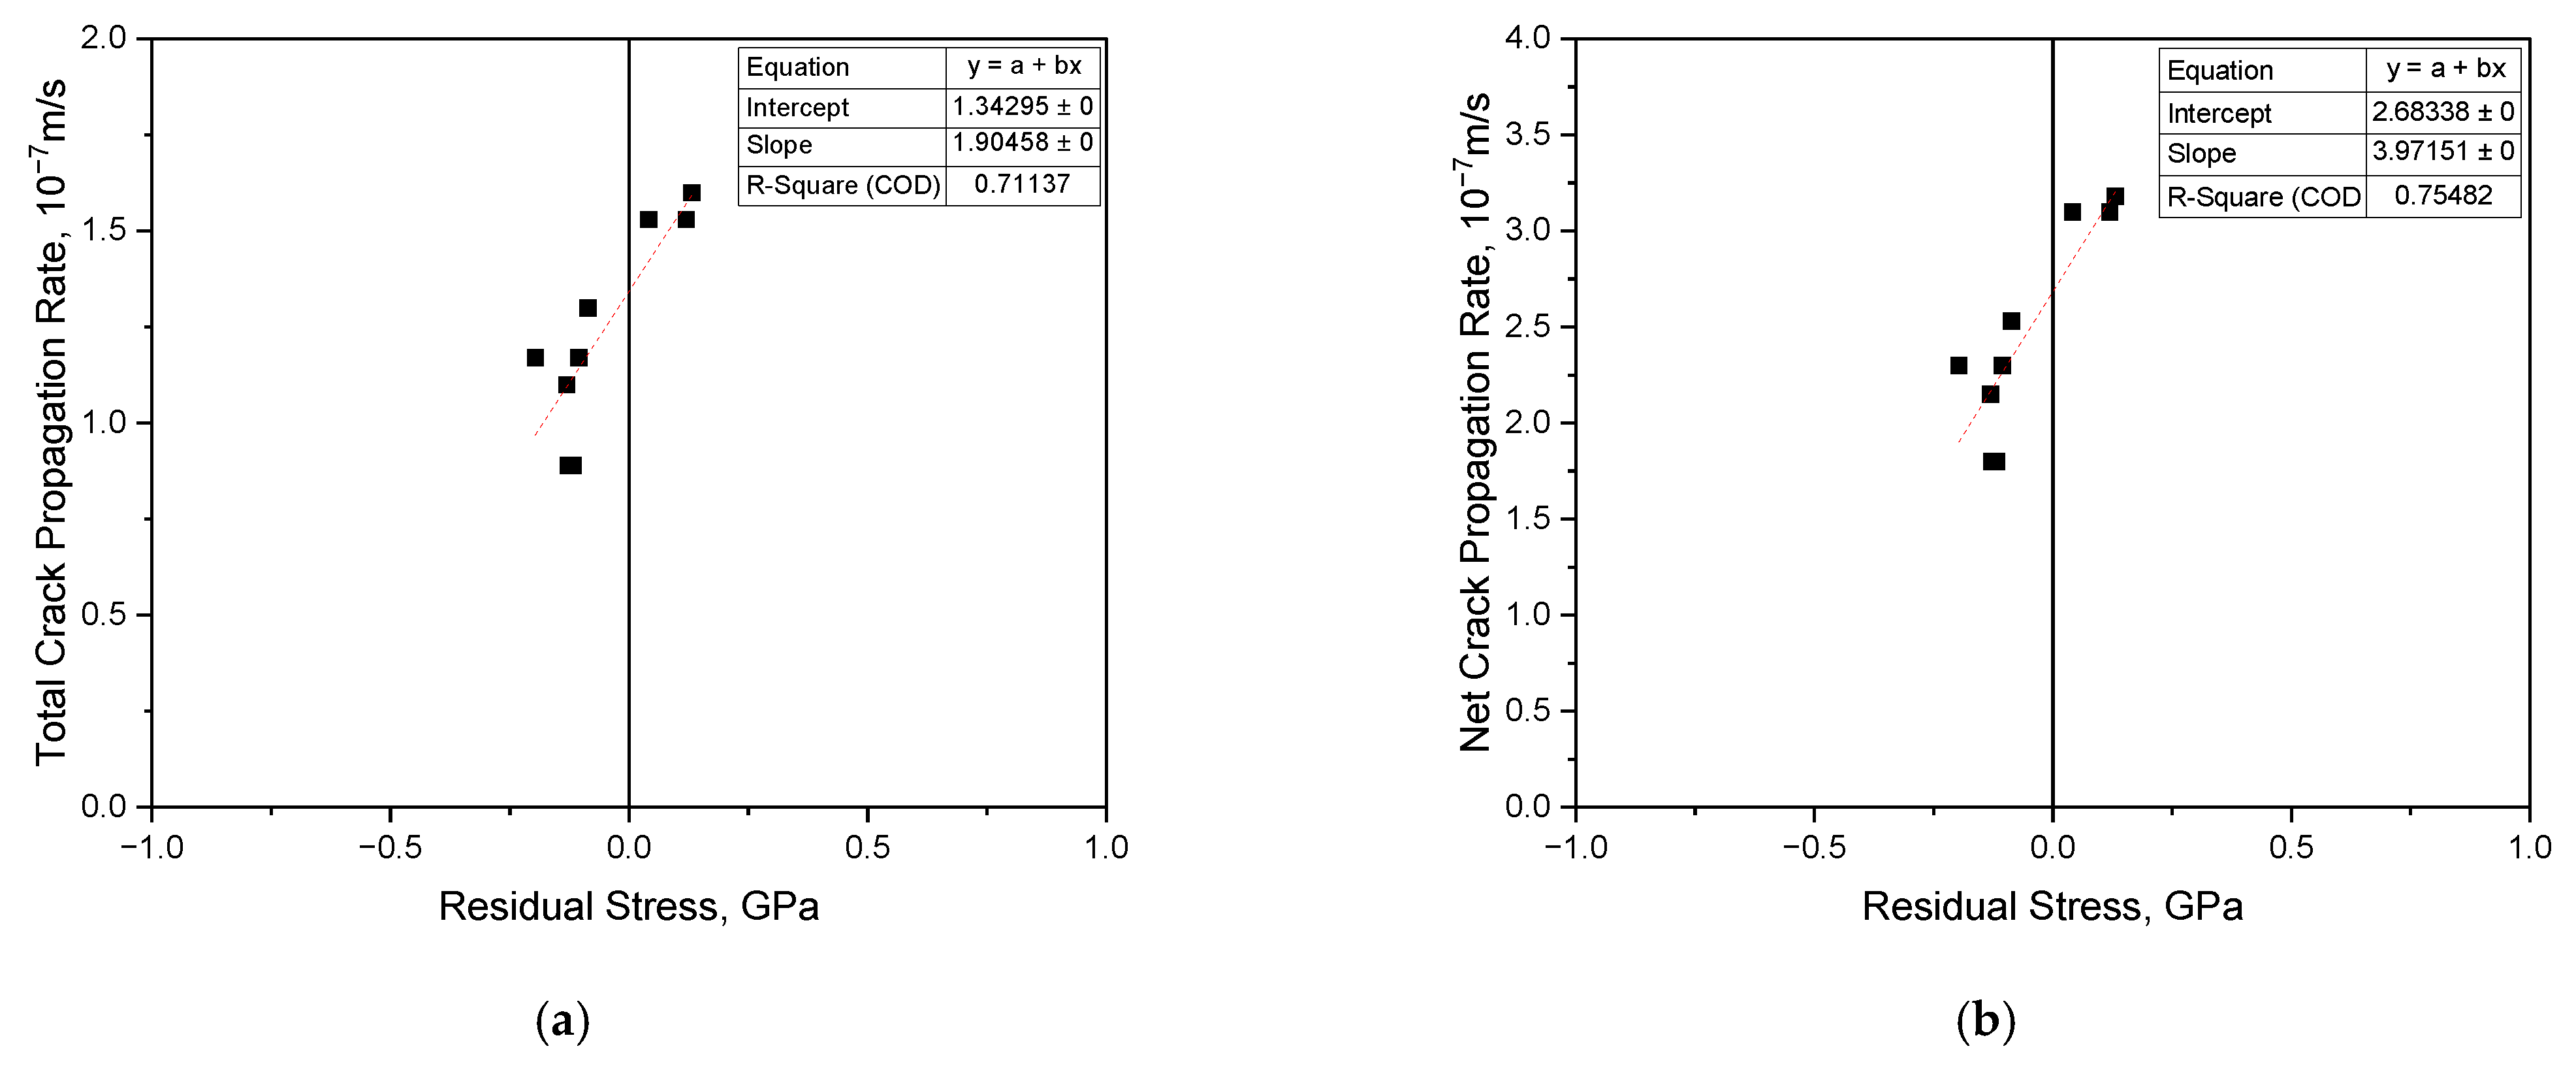
Figure 15 shows the correlation between crack propagation rate and residual stress in the base metal, HAZ, and weldment of 304L stainless steel by laser shock peening. As described in Reference [37], the residual stress was measured on the surface and at a 1 mm depth of 304L stainless steel by the hole drilling method, and the surface and 1 mm depth of non-peened 304L stainless steel showed tensile residual stress; meanwhile, in the case of a peened specimen, compressive residual stress was formed regardless of the measuring area. Figure 15a shows the correlation between the total crack propagation rate and the residual stress, which is divided into tensile residual stress and compressive residual stress. As the tensile residual stress increases, the total crack propagation rate increases as well; by contrast, as the compressive residual stress increases, the total crack propagation rate decreases. This trend shows the same result in the correlation between net crack propagation rate and residual stress after crack initiation. Laser shock peening treatment increased the pitting resistance of the cross section and induced the compressive residual stress, and it also enhanced the SCC resistance of 304L stainless steel in a chloride environment [10,40,41].
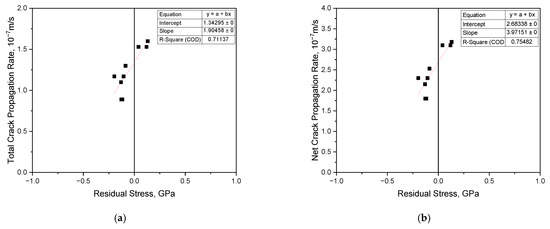
Figure 15.
Relationship between the crack propagation rate and residual stress: (a) total crack propagation, (b) net crack propagation rate.
The progress of stress corrosion cracking was divided into crack initiation and crack propagation. Table 6 summarizes the estimated SCC initiation time of 304L stainless steel, obtained by boiling 42% MgCl2, from Figure 2 and Figure 7. Laser shock peening increased the crack initiation time of 304L stainless steel regardless of whether or not welding was used. Its beneficial effect on SCC was 100% on the basis of time. This leads to the question of how the laser shock peening process inhibited crack initiation. The initiation of cracking of metals and alloys may occur at discontinuities of a surface such as grain boundaries, pits, inclusions, overlapped areas, etc. However, it is controversial whether these discontinuities are essential conditions to initiate the cracking. Turnbull et al. [49] reported that cracks occurred at corrosion pits, but Spencer et al. [50] reported that pitting was not a necessary condition for stress corrosion cracking.

Table 6.
Laser shock peening effect on the estimated SCC initiation time of 304L stainless steel in boiling 42% MgCl2.
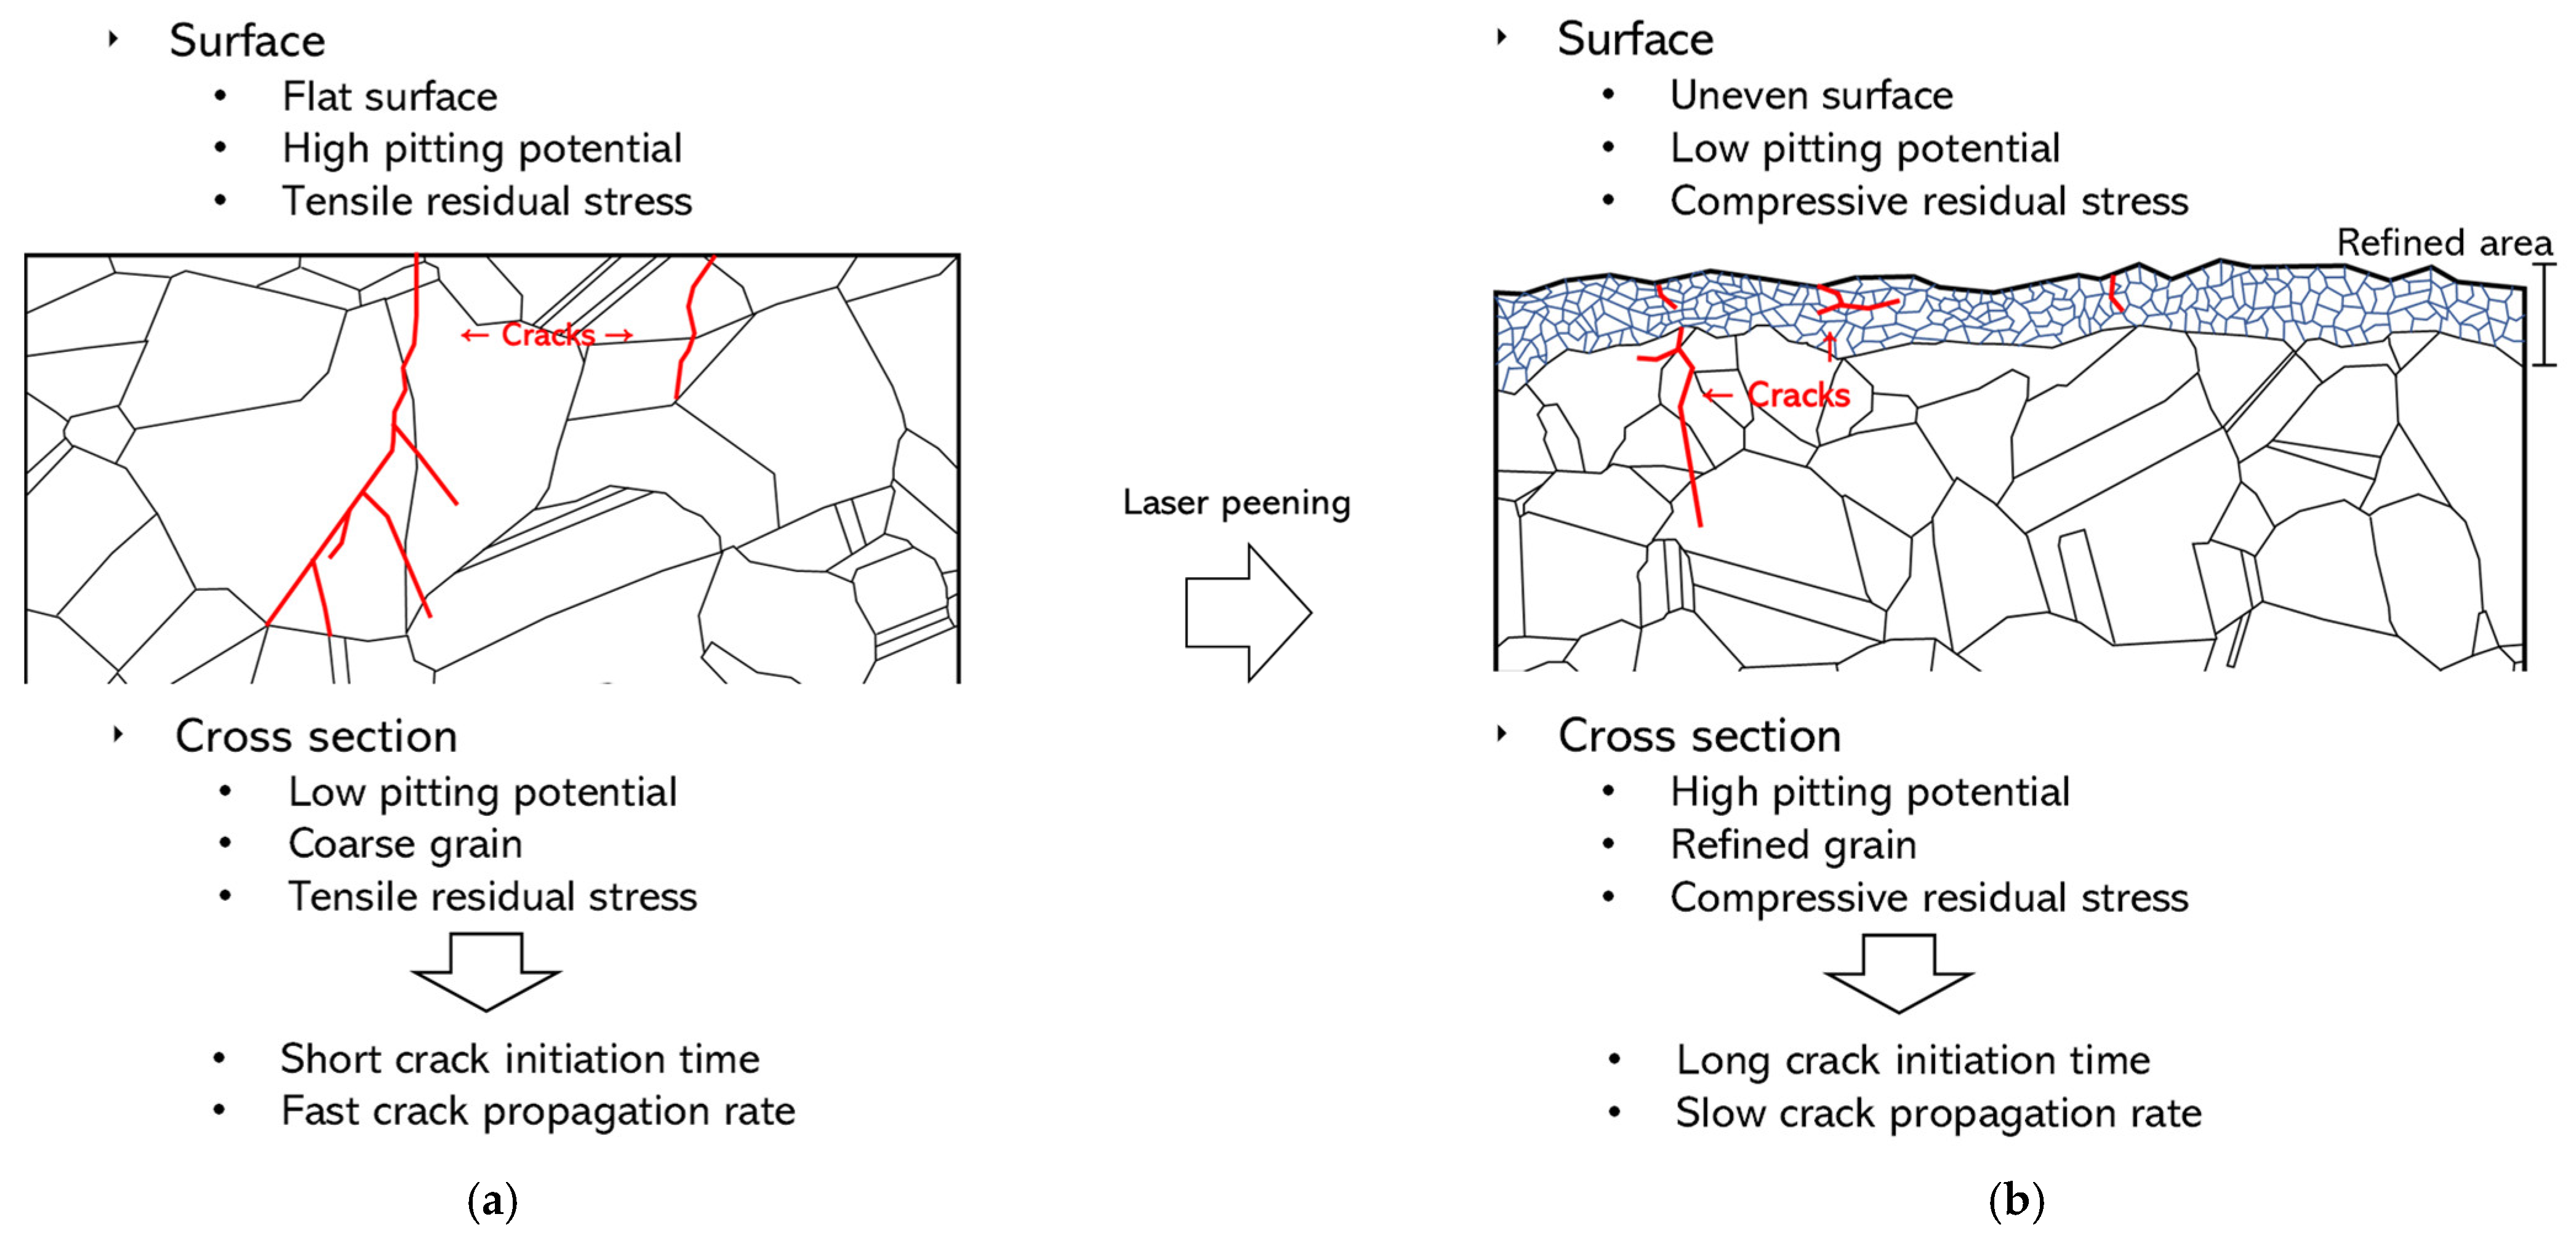
Figure 16 shows EBSD results of the cracking area of non-peened 304L base metal after the SCC test. For the non-peened specimen, the outer surface was flat, and the crack propagation path of 304LB was almost perpendicular to the applied stress direction. Since a small number of cracks were observed in this work, the crack population was not clear. However, the long crack cuts across the grains and the short crack discontinues (Figure 16c). However, in the case of the laser-peened specimen, as seen in Figure 17, the outer surface was uneven. Aside from the major crack, two cracks detoured and stopped growing at the outermost area, the grains of which were refined by laser shock peening (Figure 17c shows very small grains at the outermost area, even though it is not clear). As seen in Figure 16, the surface of the non-peened specimen was flat, and its pitting potential was very high [37], but the surface of the peened specimen was uneven and overlapped [36], and its pitting potential was very low [37].

Figure 16.
EBSD results of the cracking area of non-peened 304L base metal after SCC test: (a) SEM image, (b) band contrast, (c) inverse pole figure (IPF) coloring.

Figure 17.
EBSD results of the cracking area of laser-peened 304L base metal after SCC test: (a) SEM image, (b) band contrast, (c) inverse pole figure (IPF) coloring.
Based on the surface morphologies and pitting resistance, the crack initiation time of the peened specimen can be expected to be shortened, but on the contrary, the time was actually longer. Therefore, it is confirmed that laser shock peening inhibited stable crack initiation due to the compressive residual stress, even though the peening could not prevent the formation of cracks.
Table 7 summarizes the net crack propagation rates of 304L stainless steel, obtained by boiling 42% MgCl2, from Figure 2 and Figure 7. Laser shock peening reduced the crack propagation rate of 304L stainless steel regardless of whether or not welding was used. Its beneficial effect on SCC was 41.9~19.9% on the basis of the rate reduction. How did the laser shock peening process reduce the crack propagation rate?

Table 7.
Laser shock peening effect on SCC propagation rate of 304L stainless steel in boiling 42% MgCl2.
Table 8 summarizes the correlation between crack propagation rates and several important parameters and their meanings from metallurgical and SCC aspects.

Table 8.
Correlation between crack propagation rates and several important parameters and their meanings from metallurgical and SCC aspects.
- ①
- As shown in Figure 15, the relationship between residual stress and crack propagation rates showed a positive slope. In metallurgical aspects, when residual tensile stress reduces, stress corrosion resistance improves [4]. Therefore, as residual compressive stress by LSP increases, the crack growth rates decrease. That is, residual compressive stress by LSP is beneficial to inhibit crack growth in this case. On the other hand, based on the multiple regression analysis, the determination coefficient explains how much variance of the data is “explained” by the linear model. When the determination coefficient is over 0.65, the linear model can be generally explained, and when the correlation coefficient is over 0.7, the correlation between two parameters is strong [51]. In this case, since the determination coefficients were 0.7114~0.7548 and the correlation coefficients were 0.8434~0.8688, it is considered that the relationship between residual stress and crack growth rate is strong.
- ②
- As shown in Figure 12, the relationship between average grain size and crack propagation rates showed a positive slope. In metallurgical aspects, when average grain size refines, mechanical properties improve [52,53]. Therefore, as average grain size by LSP refines, the crack growth rates decrease. That is, grain refinement by LSP is beneficial to inhibit crack growth in this case. On the other hand, based on the multiple regression analysis, in this case, since the determination coefficients were 0.5015~0.5768, the linear relation model is somewhat explained, but the correlation coefficients were 0.7081~0.7595, so it is considered that the relationship between average grain size and crack growth rate is moderate.
- ③
- As shown in Figure 14b,b’, the relationship between pitting potential of the cross section and crack propagation rates showed a negative slope. In metallurgical aspects, when pitting potential is high, pitting corrosion resistance improves [54]. In other words, as pitting potential of the cross section by LSP increases, the crack growth rates decrease, and it means that high pitting potential by LSP is beneficial to inhibit crack growth in this case. However, based on the multiple regression analysis, in this case, since the determination coefficients were 0.3386~0.3772, the two parameters do not present a linear dependency, even though the correlation coefficients were 0.5819~0.6142 (moderate). Therefore, it is considered that the relationship between pitting potential of the cross section and crack growth rate is weak.
- ④
- As shown in Figure 13b,b’, the relationship between intergranular corrosion rate and crack propagation rates showed a negative slope. In metallurgical aspects, when IGC rate decreases, corrosion resistance improves [54]. However, as IGC rate by LSP decreases, the crack growth rate increases. In other words, it means that IGC rate by LSP is not an effective parameter for SCC resistance in this case because a low IGC rate is harmful to SCC resistance, even though there are a good determination coefficient and strong correlation coefficient between the two parameters.
- ⑤
- As shown in Figure 13a,a’, the relationship between the degree of sensitization and crack propagation rates showed a negative slope. In metallurgical aspects, when DOS decreases, corrosion resistance improves [54]. However, as DOS by LSP decreases, the crack growth rate increases. In other words, it means that DOS by LSP is not an effective parameter for SCC resistance in this case because low DOS is harmful to SCC resistance, even though there are a good determination coefficient and strong correlation coefficient between the two parameters.
- ⑥
- As shown in Figure 14a,a’, the relationship between pitting potential of the surface and crack propagation rates showed a positive slope. In metallurgical aspects, when Ep is high, pitting corrosion resistance improves [54]. However, as Ep by LSP increases, the crack growth rate increases. In other words, it means that Ep by LSP is not an effective parameter for SCC resistance in this case because high Ep is harmful to SCC resistance, even though there are a low determination coefficient and strong correlation coefficient between the two parameters.
As discussed above, the intergranular corrosion properties and the pitting potential of the surface did not influence the crack propagation inhibition, but the residual compressive stress greatly influenced the crack propagation inhibition by laser shock peening. In addition, the refined grain and the high pitting potential of the cross section improved the SCC resistance, but it should be noted that a linear dependency between the two parameters was low. In other words, it can be explained that compressive residual stress suppressed a crack opening during crack growth [51], and refined grain may act as a barrier to crack propagation like serrated grain boundaries [55], and high pitting potential reduced slip step dissolution [51]. In summary, the crack propagation rate could be decreased by laser shock peening and the effects of laser shock peening on crack initiation and propagation of 304L stainless steel in a chloride environment are schematically suggested in Figure 18.
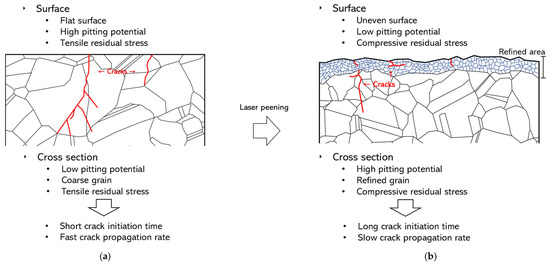
Figure 18.
Proposed model of crack initiation and propagation of 304L stainless steel by laser shock peening: (a) non-peening; (b) laser shock peening.
5. Conclusions
This work evaluated and discussed the effect of laser shock peening on the stress corrosion cracking of 304L stainless steel. Laser shock peening induced the compressive residual stress from the surface to a 1 mm depth, and the SCC properties were evaluated by the U-bend test in 42% MgCl2 at a boiling temperature of 155 °C. The conclusions are as follows:
- (1)
- Laser shock peening on 304L stainless steel induced a residual compressive stress in the depth direction and a grain refinement and an increased pitting potential of the cross section, and thus total and net crack propagation rates by the U-bend SCC test were reduced. However, based on the multiple regression analysis, the relationship between residual stress and crack propagation rates was strong, but the relationships between average grain size or pitting potential of the cross section and crack propagation rates were moderate or weak, respectively.
- (2)
- For the intergranular corrosion properties or the pitting potential of the surface peened by laser shock peening and crack growth rates, their relationships were weak in metallurgical and multiple regression analysis aspects.
Author Contributions
Conceptualization, Y.-R.Y. and S.-H.C.; methodology, S.-H.C.; validation, Y.-R.Y.; investigation, S.-H.C.; data curation and analysis, Y.-R.Y.; writing—original draft preparation, Y.-R.Y. and S.-H.C.; writing—review and editing, Y.-R.Y. and Y.-S.K.; supervision, Y.-S.K. All authors have read and agreed to the published version of the manuscript.
Funding
This work was supported by a grant from the 2021–2022 research funds of Andong National University, Korea Institute for Advancement of Technology (KIAT) grant funded by the Korea Government (MOTIE) (P0008458, HRD Program for Industrial Innovation, 2022).
Institutional Review Board Statement
Not applicable.
Informed Consent Statement
Not applicable.
Data Availability Statement
Not applicable.
Conflicts of Interest
The authors declare no conflict of interest.
References
- Lu, B.T.; Chen, Z.K.; Luo, J.L.; Patchett, B.M.; Xu, Z.H. Pitting and stress corrosion cracking behavior in welded austenitic stainless steel. Electrochim. Acta 2005, 50, 1391–1403. [Google Scholar] [CrossRef]
- Ghosh, S.; Rana, V.P.S.; Kain, V.; Mittal, V.; Baveja, S.K. Role of residual stresses induced by industrial fabrication on stress corrosion cracking susceptibility of austenitic stainless steel. Mater. Des. 2011, 32, 3823–3831. [Google Scholar] [CrossRef]
- Alyousif, O.M.; Nishimura, R. The stress corrosion cracking behavior of austenitic stainless steels in boiling magnesium chloride solution. Corros. Sci. 2007, 49, 3040–3051. [Google Scholar] [CrossRef]
- Fontana, M.G. Corrosion Engineering, 3rd ed.; McGraw-Hill Book Company: New York, NY, USA, 1987; pp. 109–139. [Google Scholar]
- Chawla, S.L.; Gupta, R.K. Materials Selection for Corrosion Control; ASM International: Novelty, OH, USA, 1993; pp. 142–143. [Google Scholar]
- Banaszkiewicz, M.; Rehmus, F.A. Stress corrosion cracking of a 60 MW steam turbine rotor. Eng. Fail. Anal. 2015, 51, 55–68. [Google Scholar] [CrossRef]
- Lopez, H.F.; Cisneros, M.M.; Mancha, H.; Garcia, O.; Perez, M.J. Grain size effects on the SCC susceptibility of a nitrogen steel in hot NaCl solutions. Corros. Sci. 2006, 48, 913–924. [Google Scholar] [CrossRef]
- Rahimi, S.; Marrow, T.J. Influence of microstructure and stress on short intergranular stress corrosion crack growth in austenitic stainless steel type 304. In Proceedings of the 17th European Conference on Fracture, Brno, Czech Republic, 2–5 September 2008; pp. 1273–1280. [Google Scholar]
- Qu, H.J.; Tao, F.; Gu, N.; Montoya, T.; Taylor, J.M.; Schaller, R.F.; Schindelholz, E.; Wharry, J.R. Crystallographic effects on transgranular chloride-induced stress corrosion crack propagation of arc welded austenitic stainless steel. Mater. Degrad. 2022, 6, 43. [Google Scholar] [CrossRef]
- Lu, J.Z.; Luo, K.Y.; Yang, D.K.; Cheng, X.N.; Hu, J.L.; Dai, F.Z.; Qi, H.; Zhang, L.; Zhong, J.S.; Wang, Q.W.; et al. Effects of laser peening on stress corrosion cracking (SCC) of ANSI 304 austenitic stainless steel. Corros. Sci. 2012, 60, 145–152. [Google Scholar] [CrossRef]
- Soyama, H.; Chighizola, C.R.; Hill, M.R. Effect of compressive residual stress introduced by cavitation peening and shot peening on the improvement of fatigue strength of stainless steel. J. Mater. Process. Technol. 2011, 288, 116877. [Google Scholar] [CrossRef]
- Azar, V.; Hashemi, B.; Yazdi, M.R. The effect of shot peening on fatigue and corrosion behavior of 316L stainless steel in Ringer’s solution. Surf. Coat. Technol. 2010, 204, 3546–3551. [Google Scholar] [CrossRef]
- Sanjurjo, P.; Rodríguez, C.; Pariente, I.F.; Belzunce, F.J.; Canteli, A.F. The influence of shot peening on the fatigue behaviour of duplex stainless steels. Procedia Eng. 2010, 2, 1539–1546. [Google Scholar] [CrossRef]
- Fargas, G.; Roa, J.J.; Mateo, A. Effect of shot peening on metastable austenitic stainless steels. Mater. Sci. Eng. A 2015, 641, 290–296. [Google Scholar] [CrossRef]
- Kim, J.H.; Lee, W.R.; Kim, T.G.; Cheong, S.K. Micro-shockwave measurement and evaluation of laser shock peening. Trans. Korean Soc. Mech. Eng. B 2011, 35, 1041–1046. [Google Scholar] [CrossRef]
- Kim, J.D.; Sano, Y. Laser peening application for PWR power plants. J. Weld. Join. 2016, 34, 13–18. [Google Scholar] [CrossRef]
- Sathyajith, S.; Kalainathan, S. Effect of laser peening without coating on 316L austenitic stainless steel. In Proceedings of the IOP Conference Series: Materials Science and Engineering, Kerala, India, 10–14 June 2015; Volume 73, p. 012152. [Google Scholar] [CrossRef]
- Hill, M.R.; Dewald, A.T.; Demma, A.G.; Hackel, L.A.; Chen, H.L.; Dane, C.B.; Specht, R.C.; Harris, F.B. Laser peening technology. Adv. Mater. Process. 2003, 8, 65–67. [Google Scholar]
- Srivastava, M.; Hloch, S.; Gubeljak, N.; Milkovic, M.; Chattopadhyaya, S.; Klich, J. Surface integrity and residual stress analysis of pulsed water jet peened stainless steel surfaces. Measurement 2019, 143, 81–92. [Google Scholar] [CrossRef]
- Jiang, W.; Luo, Y.; Wang, H.; Wang, B.Y. Effect of impact pressure on reducing the weld residual stress by water jet peening in repair weld to 304 stainless steel clad plate. J. Press. Vessel Technol. 2015, 137, 031401. [Google Scholar] [CrossRef]
- Okimura, K.; Konno, T.; Narita, M.; Ohta, T.; Toyoda, M. Reliability of water jet peening as residual stress improvement method for alloy 600 Pwscc mitigation. In Proceedings of the 16th International Conference on Nuclear Engineering, Orlando, FL, USA, 11–15 May 2008. [Google Scholar] [CrossRef]
- Amini, S.; Kariman, S.A.; Teimouri, R. The effects of ultrasonic peening on chemical corrosion behavior of aluminum 7075. Int. J. Adv. Manuf. Technol. 2017, 91, 1091–1102. [Google Scholar] [CrossRef]
- Malaki, M.; Ding, H. A review of ultrasonic peening treatment. Mater. Des. 2015, 87, 1072–1086. [Google Scholar] [CrossRef]
- Fereidooni, B.; Morovvati, M.R.; Sadough, V.S.A. Influence of severe plastic deformation on fatigue life applied by ultrasonic peening in welded pipe 316 Stainless steel joints in corrosive environment. Ultrasonics 2018, 88, 137–147. [Google Scholar] [CrossRef]
- Wang, Q.; Li, Y.; Lu, Z.; Zhang, Y.; Zou, Y. Effects of ultrasonic nanocrystal surface modification on mechanical and corrosion behavior of LZ91 Mg–Li alloy. Mater. Trans. 2020, 61, 1258–1264. [Google Scholar] [CrossRef]
- Ma, C.; Andani, M.T.; Qin, H.; Moghaddam, N.S.; Ibrahim, H.; Jahadakbar, A.; Amerinatanzi, A.; Ren, Z.; Zhang, H.; Doll, G.L.; et al. Improving surface finish and wear resistance of additive manufactured nickel-titanium by ultrasonic nano-crystal surface modification. J. Mater. Process. Technol. 2017, 249, 433–440. [Google Scholar] [CrossRef]
- Lu, J.Z.; Qi, H.; Luo, K.Y.; Luo, M.; Cheng, X.N. Corrosion behaviour of AISI 304 stainless steel subjected to massive laser shock peening impacts with different pulse energies. Corros. Sci. 2014, 80, 53–59. [Google Scholar] [CrossRef]
- Karthik, D.; Swaroop, S. Effect of laser peening on electrochemical properties of titanium stabilized 321 steel. Mater. Chem. Phys. 2017, 193, 147–155. [Google Scholar] [CrossRef]
- Kim, K.T.; Kim, Y.S. The effect of the static load in the UNSM process on the corrosion properties of alloy 600. Materials 2019, 12, 3165. [Google Scholar] [CrossRef] [PubMed]
- Lee, J.H.; Kim, K.T.; Pyoun, Y.S.; Kim, Y.S. Intergranular corrosion mechanism of slightly-sensitized and UNSM-treated 316L stainless steel. Corros. Sci. Technol. 2016, 15, 226–236. [Google Scholar] [CrossRef]
- Kim, K.T.; Lee, J.H.; Kim, Y.S. Effect of ultrasonic nano-crystal surface modification (UNSM) on the passivation behavior of aged 316L stainless steel. Materials 2017, 10, 713. [Google Scholar] [CrossRef]
- Kim, K.T.; Kim, Y.S. Effect of the amplitude in ultrasonic nano-crystalline surface modification on the corrosion properties of alloy 600. Corros. Sci. Technol. 2019, 18, 196–205. [Google Scholar] [CrossRef]
- Sadeh, S.; Malik, A. Investigation into the effects of laser shock peening as a post treatment to laser impact welding. Mater. Des. 2021, 205, 109701. [Google Scholar] [CrossRef]
- Huang, S.; Zhou, J.Z.; Sheng, J.; Lu, J.Z.; Sun, G.F.; Meng, X.K.; Zuo, L.D.; Ruan, H.Y.; Chen, H.S. Effects of laser energy on fatigue crack growth properties of 6061-T6 aluminum alloy subjected to multiple laser peening. Eng. Fract. Mech. 2013, 99, 87–100. [Google Scholar] [CrossRef]
- Gornikowska, M.R.; Kusinski, J.; Cieniek, L. Effect of laser shock peening on the microstructure and properties of the inconel 625 surface layer. J. Mater. Eng. Perform. 2020, 29, 1544–1549. [Google Scholar] [CrossRef]
- Yoo, Y.R.; Kim, J.S.; Kim, Y.S. Effect of laser peening on microstructural changes in GTA-welded 304L stainless steel. Materials 2022, 15, 3947. [Google Scholar] [CrossRef]
- Yoo, Y.R.; Choi, S.H.; Kim, Y.S. Effect of laser peening on the corrosion properties of 304L stainless steel. Materials 2023, 16, 804. [Google Scholar] [CrossRef]
- Gupta, R.K.; Sundar, R.; Kumar, B.S.; Ganesh, P.; Kaul, R.; Ranganathan, K.; Bindra, K.S.; Kain, V.; Oak, S.M.; Kukreja, L.M. A hybrid laser surface treatment for refurbishment of stress corrosion cracking damaged 304L stainless steel. J. Mater. Eng. Perform. 2015, 24, 2569–2576. [Google Scholar] [CrossRef]
- Irizalp, S.G.; Koroglu, B.K.; Sokol, D. Influence of laser peening with and without coating on the surface properties and stress corrosion cracking behavior of laser-welded 304 stainless steel. Metall. Mater. Trans. A 2021, 52, 3302. [Google Scholar] [CrossRef]
- Sundar, R.; Ganesh, P.; Kumar, B.S.; Gupta, R.K.; Nagpure, D.C.; Kaul, R.; Ranganathan, K.; Bindra, K.S.; Kain, V.; Oak, S.M.; et al. Mitigation of stress corrosion cracking susceptibility of machined 304L stainless steel through laser peening. J. Mater. Eng. Perform. 2016, 25, 3710. [Google Scholar] [CrossRef]
- Sano, Y.; Obata, M.; Kubo, T.; Mukai, N.; Yoda, M.; Masaki, K.; Ochi, Y. Retardation of crack initiation and growth in austenitic stainless steels by laser peening without protective coating. Mater. Sci. Eng. A 2006, 417, 334–340. [Google Scholar] [CrossRef]
- ASTM G30-2003; Standard Practice for Making and Using U-Bend Stress-Corrosion Test Specimens. ASTM International: West Conshohocken, PA, USA, 2003.
- ASTM G58-2015; Standard Practice for Preparation of Stress-Corrosion Test Specimens for Weldments. ASTM International: West Conshohocken, PA, USA, 2015.
- ASTM G36-2000; Standard Practice for Evaluating Stress-Corrosion-Cracking Resistance of Metals and Alloys in a Boiling Magnesium Chloride Solution. ASTM International: West Conshohocken, PA, USA, 2000.
- ASTM E1382; Standard Test Method for Determining Average Grain Size Using Semiautomatic and Automatic Image Analysis. ASTM International: West Conshohocken, PA, USA, 2015.
- ASTM A262-2002; Standard Practices for Detecting Susceptibility to Intergranular Attack in Austenitic Stainless Steels. ASTM International: West Conshohocken, PA, USA, 2002.
- ASTM G108-2004; Standard Test Method for Electrochemical Reactivation (EPR) for Detecting Sensitization of AISI Type 304 and 304L Stainless Steels. ASTM International: West Conshohocken, PA, USA, 2004.
- ASTM G5-2004; Standard Reference Test Method for Making Potentiostatic and Potentiodynamic Anodic Polarization Measurements. ASTM International: West Conshohocken, PA, USA, 2004.
- Turnbull, A.; Mingard, K.; Lord, J.D.; Roebuck, B.; Tice, D.R.; Motteshead, K.J.; Fairweather, N.D.; Bradbury, A.K. Sensitivity of stress corrosion cracking of stainless steel to surface machining and grinding procedure. Corros. Sci. 2011, 53, 3398–3415. [Google Scholar] [CrossRef]
- Spencer, D.T.; Edwards, M.R.; Wenman, M.R.; Tsitsios, C.; Scatigno, G.G.; Chard-Turkey, P.R. The initiation and propagation of chloride-induced transgranular stress-corrosion cracking (TGSCC) of 304L austenitic stainless steel under atmospheric conditions. Corros. Sci. 2014, 88, 76–88. [Google Scholar] [CrossRef]
- Christine, P.D.; John, R. Statistics without Maths for Psychology, 5th ed.; Prentice Hall: Lincoln, Lincolnshire, UK, 2011; p. 175. [Google Scholar]
- Dieter, G.E. Mechanical Metallurgy; McGraw-Hill Book Company: London, UK, 1988; pp. 188–191. ISBN 0-07-100406-8. [Google Scholar]
- Callister, W.D.; Rethwisch, D.G. Materials Science and Engineering, 9th ed.; John Wiley & Sons, Inc.: Hoboken, NJ, USA, 2015; pp. 266–268. ISBN 978-1-118-31922-2. [Google Scholar]
- Jones, D.A. Principles and Prevention of Corrosion; Macmillan Publishing Company: New York, NY, USA, 1992; pp. 208–220. ISBN 0-02-361215-0. [Google Scholar]
- Kim, H.P.; Choi, M.J.; Kim, S.W.; Kim, D.J.; Lim, Y.S.; Hwang, S.S. Effect of serrated grain boundary on stress corrosion cracking of Alloy 600. Nucl. Eng. Technol. 2018, 50, 1131–1137. [Google Scholar] [CrossRef]
Disclaimer/Publisher’s Note: The statements, opinions and data contained in all publications are solely those of the individual author(s) and contributor(s) and not of MDPI and/or the editor(s). MDPI and/or the editor(s) disclaim responsibility for any injury to people or property resulting from any ideas, methods, instructions or products referred to in the content. |
© 2023 by the authors. Licensee MDPI, Basel, Switzerland. This article is an open access article distributed under the terms and conditions of the Creative Commons Attribution (CC BY) license (https://creativecommons.org/licenses/by/4.0/).

