Article

Investigation of the Mesoscale Damage Evolution Process of AA5754O Aluminum Alloy CMT Welded Joints

1
School of Mechanical Engineering, Nanjing University of Science and Technology, Nanjing 210094, China
2
Material Big Data Platform, Advanced Materials Research Institute, Yangtze Delta, Suzhou 215100, China
3
Key Laboratory for Light-Weight Materials, Nanjing Tech University, Nanjing 210009, China
*
Authors to whom correspondence should be addressed.
Metals 2023, 13(3), 555; https://doi.org/10.3390/met13030555
Submission received: 13 December 2022 / Revised: 27 January 2023 / Accepted: 27 January 2023 / Published: 9 March 2023
(This article belongs to the Special Issue Microstructure Evolution in Welded Joints)

Abstract

:
The microstructure and tensile failure evolution of AA5754O aluminum alloy CMT joints were investigated in this study. First, the microstructure and properties of aluminum alloy were observed using a hardness test and metallographic test. The microstructure and tensile failure evolution of AA5754O aluminum alloy CMT joints were studied using in situ CT tests. The defects in the heat-affected zone were mainly composed of pores with large sphericity. The softening failure was mainly due to the decrease in the effective bearing area due to the increase in the number of defects. There were a large number of shrinkage pores with sphericity less than 0.6 in the fusion zone defects. The softening failure was mainly due to the continuous growth and combination of shrinkage pores, which led to a decrease in the effective bearing area. Meanwhile, the variation process of the mean radii of the meso-defects in the heat-affected zone and fusion zone were analyzed. The material constants αRT and αRTm were 1.87 and 6.20 in the heat-affected zone and 7.21 and 5.31 in the fusion zone, respectively, which were found using the Rich and Tracey model and the improved Rich and Tracey model.

1. Introduction

Weight reduction is one of the effective ways to realize automobile energy conservation and emissio ns reduction, combining lightweight materials with structural optimization is the best way to achieve weight reduction goals in the automotive industry. Commonly used lightweight materials include aluminum alloy, magnesium alloy, titanium alloy, and composite materials [1]. Due to its low density and high strength, aluminum alloy has become the most widely used automotive lightweight material [2,3]. With the wide application of aluminum alloy, it is bound to involve the welding process of aluminum alloy, but the traditional connection methods (such as resistance spot welding and argon arc welding) used in the welding of aluminum alloy often cause a series of problems, such as pores and thermal cracks [4,5]. In order to solve these problems, a series of welding processes, such as cold metal transfer (CMT) welding and friction stir welding (FSW), were developed [6,7]. Among them, cold metal transfer welding has become an important technology for welding aluminum alloys because of its advantages of small heat input and no splash.
Cold metal transition welding is a new spatter-free welding technology that was presented by Fronius at the European Panel Technology Fair 2004. Based on the traditional MIG/MAG welding technology, CMT welding improves the behavior of the melt drop transition, which significantly reduces the heat input and welding spatter in the welding process. CMT welding technology is widely used in sheet aluminum alloy welding because of its advantages of low heat input and no spatter.
The quality of CMT weld of aluminum alloy has an important influence on the strength, fatigue durability, and collision safety of an aluminum alloy structure. An aluminum alloy CMT weld is mainly composed of aluminum welding wire and metal base metal melting and then solidification. During the CMT welding of aluminum alloy, due to the thermo-mechanical coupling effect, the weld microstructure changes in a complex way, resulting in significant differences in the mechanical properties of the fusion zone (FZ) and heat-affected zone (HAZ) materials compared with the base material [8].
Ductile fracture is a key problem that needs special attention in CMT structures. From the microscopic mechanism, ductile fracture of metal is a continuous damage evolution process, including the nucleation, growth, and coalescence of defects. Generally speaking, the damage evolution of materials is closely related to the microstructure of materials, especially with the development of damage, where the growth and coalescence of pores are the main causes of ductile cracks [9,10].
For aluminum alloy, hard particles and a soft matrix coexist in the microstructure. In the process of plastic deformation, due to the discordant deformation of the hard matrix and soft matrix, microcracks easily occur at the interface of hard particles and the soft matrix, and cracks will also occur inside hard particles, thus becoming the source of macroscopic cracks. This mismatch between the hard particles and soft matrix in the deformation process will lead to serious uneven microscopic deformation, resulting in a complex damage evolution, and thus, show different nucleation mechanisms, growth rates, and coalescence behaviors in different regions (heat-affected zone and fusion zone). The damage evolution of a CMT microstructure of the aluminum alloy is more complex than that of the aluminum alloy matrix, which is caused by the uneven distribution of the microstructure in the FZ, HAZ, and base metal (BM) zone [11]. Due to the different local structures, different types of microscopic defects show different distribution characteristics, and thus, each region shows different microscopic damage behavior [12]. Therefore, the in-depth study of the micro-damage mechanism of an aluminum alloy CMT weld will provide theoretical guidance for the aluminum alloy CMT welding process. X-ray computed tomography can be combined with in situ loading to carefully observe microstructure behavior, and can be combined with light, heat, and other different experimental methods to achieve multi-physical field coupling [13]. In the deformation process of aluminum alloy welded joints, there is a complex interaction between damage and microstructure. The damage evolution behavior of aluminum alloy is very complicated due to the uneven distribution of pores in welded joints. Through metallographic experiments, the size, shape, and distribution of pores can only be measured at the 2D level. However, the pores that mainly cause material damage are usually highly connected in space. CT scanning can accurately evaluate the size, shape, and distribution of pores at the 3D level, which can achieve better experimental effects than 2D technology [14]. Parente [15] carried out a visual and quantitative analysis of the evolution of pores in aluminum alloy welding using CT scanning. The experimental results showed that the pore volume fraction increased exponentially in the deformation process, and the critical pore content for material fracture was about 0.2 vol%. Xing [16] established a damage model based on microscopic mechanics by combining the evolution process of various types of pores measured by in situ synchrotron radiation X-ray computed tomography and the load–displacement curve during material deformation. Therefore, X-ray computed tomography (CT) can provide a more direct and reliable basis for the analysis of material deformation, damage, and failure mechanism, and thus, it is necessary to use CT scanning technology to characterize the damage evolution behavior of an aluminum alloy CMT joint.
An in-depth study of the microscopic damage mechanism of CMT welding of aluminum alloy will provide theoretical guidance for the calibration of the CMT welding process and welding joint damage model. However, there are few studies on the microscopic damage evolution behavior of CMT welded joints of an aluminum alloy at present. In this study, in situ X-ray tomography was used to study the damage evolution behavior of AA5754O aluminum alloy CMT welded joints in the fusion zone and HAZ. Due to the small size of each area of the welded joint, especially the small size of the HAZ, to obtain sufficient scanning accuracy, small-size samples needed to be used for the in situ X-ray tomography observation. First, metallographic experiments and hardness tests were conducted to obtain the accurate size of each area of the CMT joint, and different forms of internal defects were observed at the macroscale. Then, the three-dimensional in situ tensile test was carried out. The defect size information of the HAZ and the FZ was collected using three-dimensional reconstruction, and the microscopic damage evolution behavior was numerically characterized.

2. Experimental Procedure

2.1. Materials and Welding Process

The base metal used in the present study was AA5754O with a size of 2 mm × 100 mm × 120 mm, and the welding wire was ER5356. The chemical compositions of AA5754O and ER5356 are shown in Table 1.
CMT welding uses the TPS400i intelligent gas-shielded welding machine produced by the Fronius Company, as shown in Figure 1. The welding joint is a butt welding joint without a groove, and the welding process is cold metal transition welding. Before welding, the oxide film of the welded part of the aluminum alloy was removed with a steel brush and polished, and the polished aluminum alloy surface was cleaned with acetone. The welding process parameters are shown in Table 2, and the sample after welding is shown in Figure 2.

2.2. Microstructural Characterization

A low-speed wire-discharge wire-cutting machine was used to cut the microstructure test samples from the welded joints to observe the cross-section of the weld. The cut sample was then polished to remove surface scratches, residual polishing paste, and other stains. The samples were corroded with Keller reagent. When bubbles appeared on the surface of the metallographic sample, the corrosive solution was quickly flushed with water to avoid excessive corrosion. After that, the macro-morphology and low-magnification microstructure of the relevant areas of the sample were observed using an optical microscope, and the cracks and other defects in the sample were analyzed.

2.3. Hardness Testing

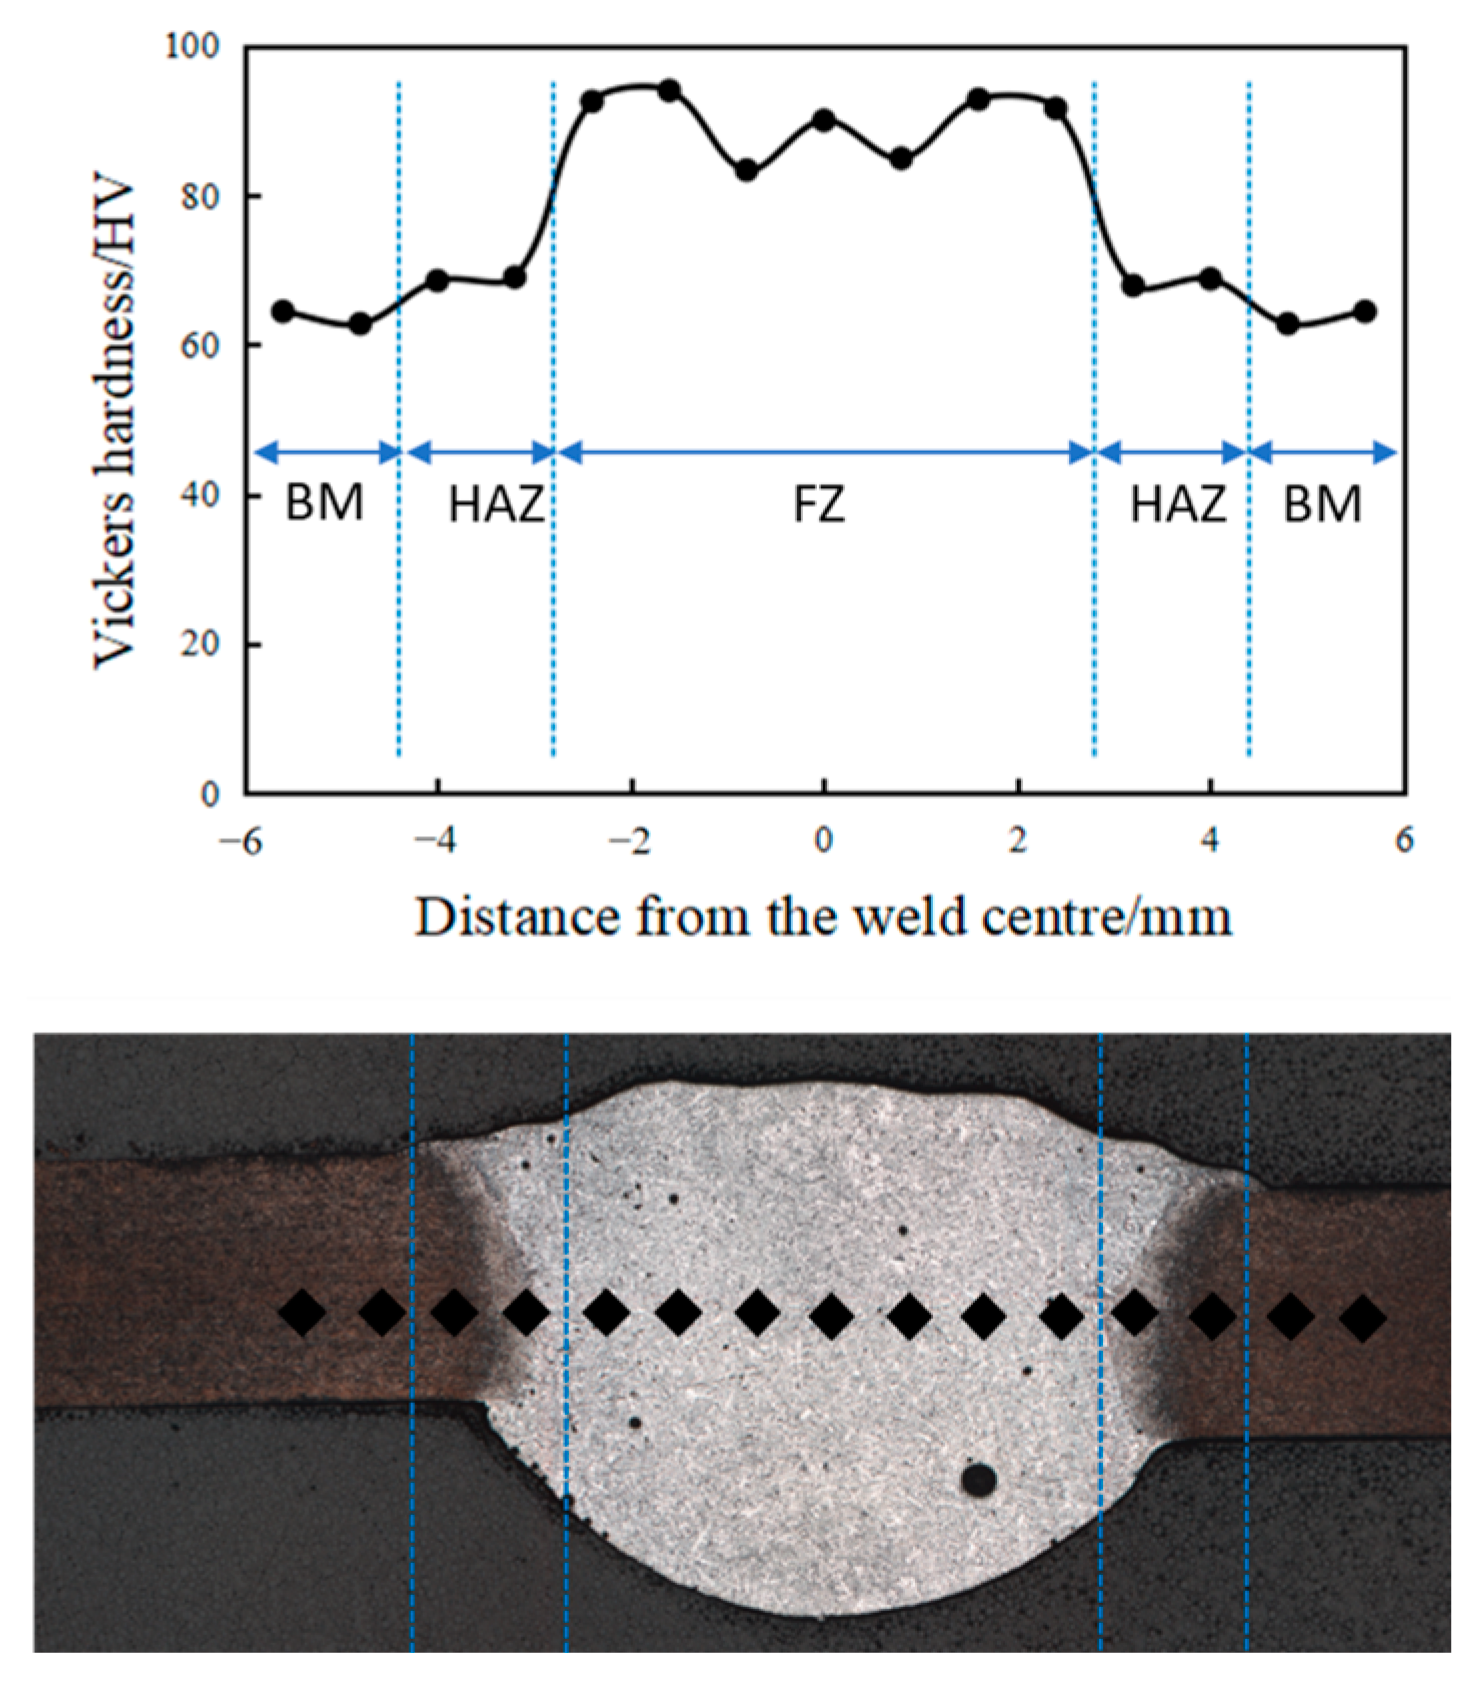
In this study, a VH3100 Vickers hardness testing system (Buehler, Lake Bluff, IL, USA) was used to test the hardness of the metallographic samples. The test area was passed from one side of the base metal area through the HAZ and the FZ to the other side of the base metal area. The distance between the scan line and the bottom was about 0.8 mm, the distance between the adjacent indentations was about 0.8 mm, the dwell time was 10 s, and the loading force was 10 kgf.

2.4. In Situ Tensile Experiments

The experimental scheme designed in this study involved using X-ray tomography for on-site observation during mechanical tests. Small-size samples (Figure 3) were used for in situ X-ray tomography observations to obtain adequate scanning accuracy. In situ experiments in the FZ and HAZ areas were conducted once each. In situ samples were 1 mm thick to produce good CT scan results. In this study, the FZ and the HAZ were each placed in the gauge section of the sample for observation. The sampling position and sample size are shown in Figure 3 and Figure 4.
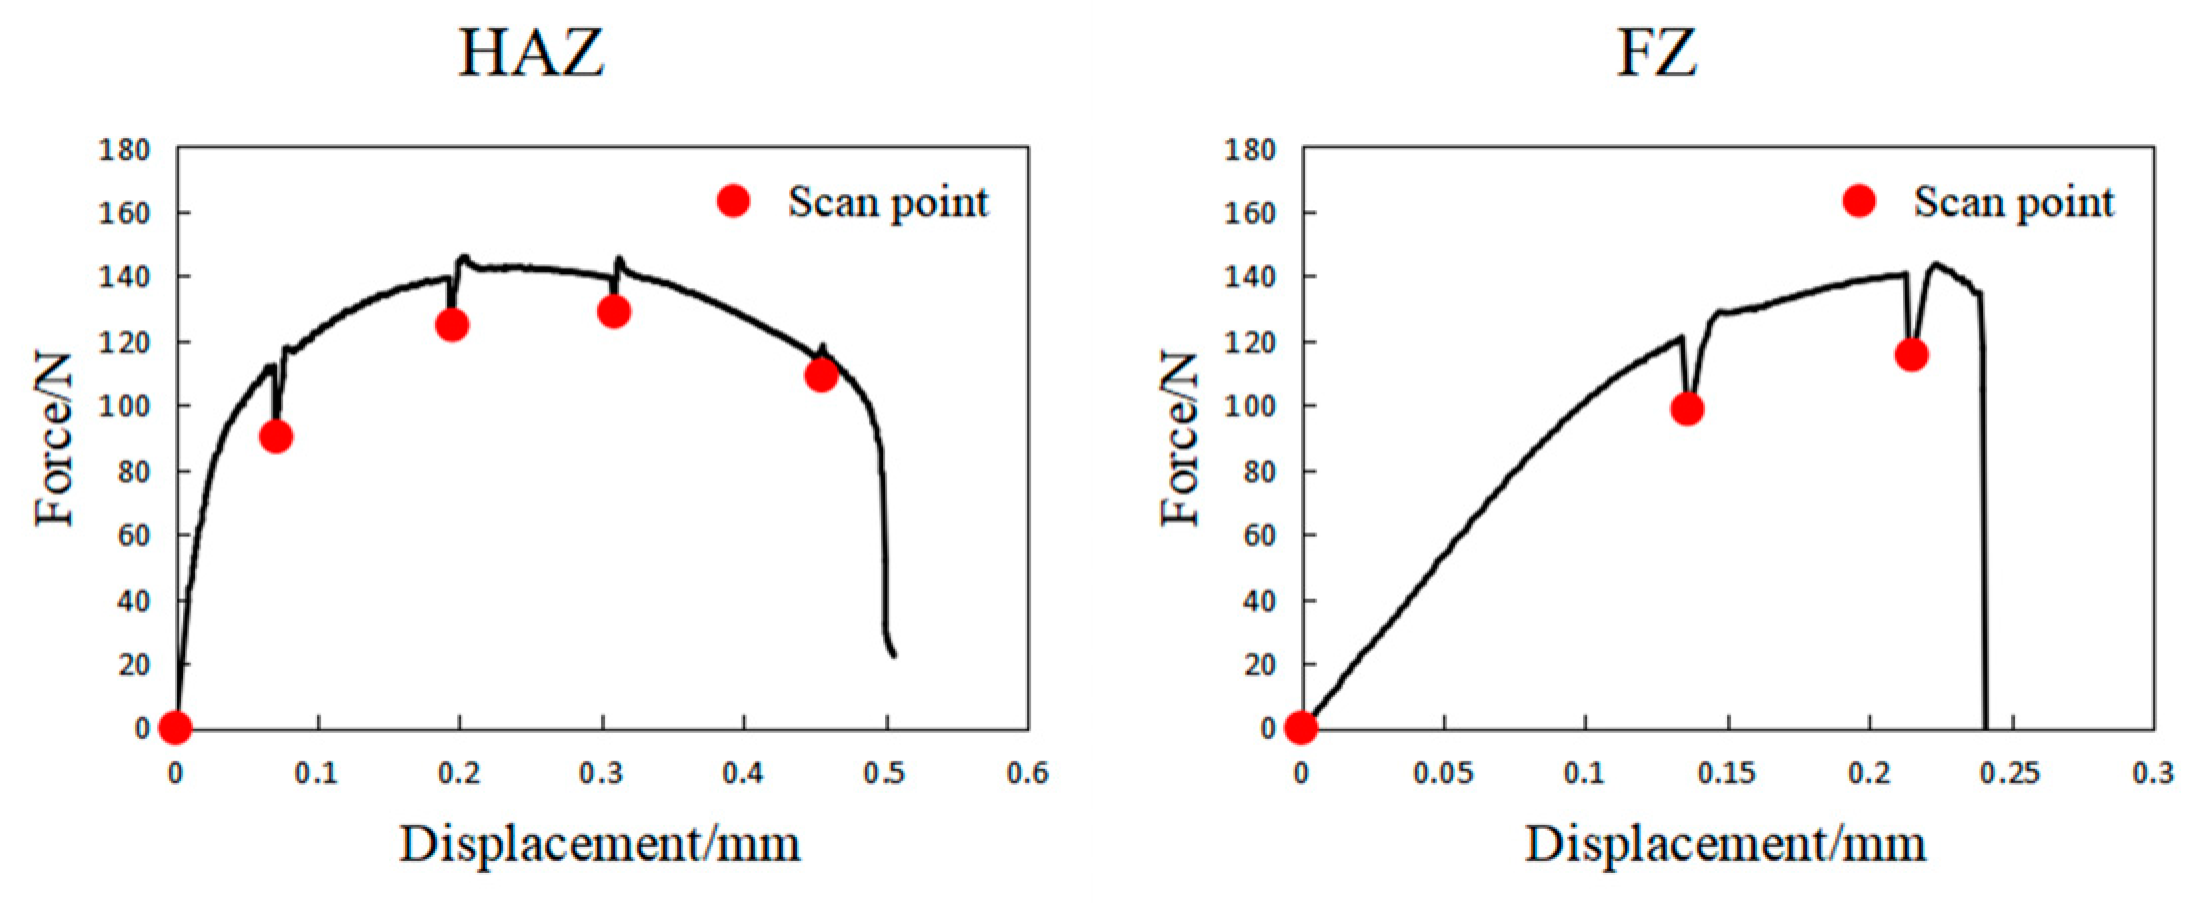
Prior to the in situ tensile test, the in situ specimens cut from the HAZ and FZ needed to be monotone tensile tests to obtain local mechanical properties to identify the scanning points where the tensile test needed to be interrupted for CT scanning. The specific in situ tensile test process design was as follows:
  • Using an Xradia 620 versa high-resolution three-dimensional analysis testbed (Carl Zeiss AG, Oberkochen, Germany), the monotonic axial tensile load was applied to the in situ samples in the HAZ and FZ at the rate of 0.03 mm/min, and the load–displacement curves in the HAZ and FZ were obtained.
  • Scanning points were set on the load–displacement curve of the HAZ and the weld obtained in step (1). The sample was loaded to the corresponding scanning point, loading was stopped, and then 3D CT scanning of the sample was conducted. The X-ray tomography equipment was an Xradia 620 versa high-resolution three-dimensional analysis experimental platform, and the scanning parameters were set as follows: a total of 2985 projection images were collected for each scan. The scanning duration was 90 min, and the voxel size of the scanned image was 2.0194 × 2.0194 × 2.0194 μm3. The loading curve is shown in Figure 5.
  • Based on Dragonfly software (version 2020.1, Object Research Systems, Montréal, QC, Canada), the scanning data of AA5754O aluminum alloy CMT-welded HAZ and FZ samples at different scanning points were post-processed; the volume, surface area, sphericity, and other information of defects in the samples under different loading conditions were counted; and the evolution behavior of the defects under a uniaxial tensile load was further analyzed. To reduce the effect of noise, meso-defects smaller than 2 voxels (16.5 μm3) were not considered.

3. Experimental Results

3.1. Weld Macrostructure and Hardness Variation

The Vickers hardness of an AA5754O aluminum alloy CMT joint is shown in Figure 6. The average hardness of the FZ was approximately 86.62 HV, the average hardness of the HAZ was approximately 70.2 HV, and the average hardness of the base metal zone was approximately 61.4 HV.
As can be seen from Figure 7, the structure of the welding zone was dense and dendritic, indicating that the welding effect obtained using this welding parameter was better, which could make the results of the in situ samples more representative. During the welding process, the metal in the FZ absorbed a lot of heat and melted. In the solidification process, due to the high thermal conductivity of aluminum alloy, the metal solidified and crystallized rapidly in the FZ, and the under-cooling effect resulted in the formation of equiaxed dendrites in the FZ. The HAZ had a slightly coarser microstructure than the FZ. This was because the HAZ of the welded joint was close to the FZ and was subject to strong thermal cycling. Grains obtained enough energy to aggregate and grow. The HAZ was a columnar region that consisted mainly of columnar crystals growing toward the center of the fusion region. The minimal degree of undercooling could be achieved via epitaxial growth. The increase in the temperature in the weld center inhibited the formation of fine grains, and the epitaxial growth of columnar grains occurred in the HAZ [11]. In addition, Rajeshkumar [11] analyzed the CMT microstructure of 5754 aluminum alloy and 5082 aluminum alloy and found that the microstructure of the FZ was composed of an α solid solution, dendritic β (Al3Mg2) phase, and Al6Mn phase, and the heat-affected zone was mainly composed of Mg2Si and Al6Mn.
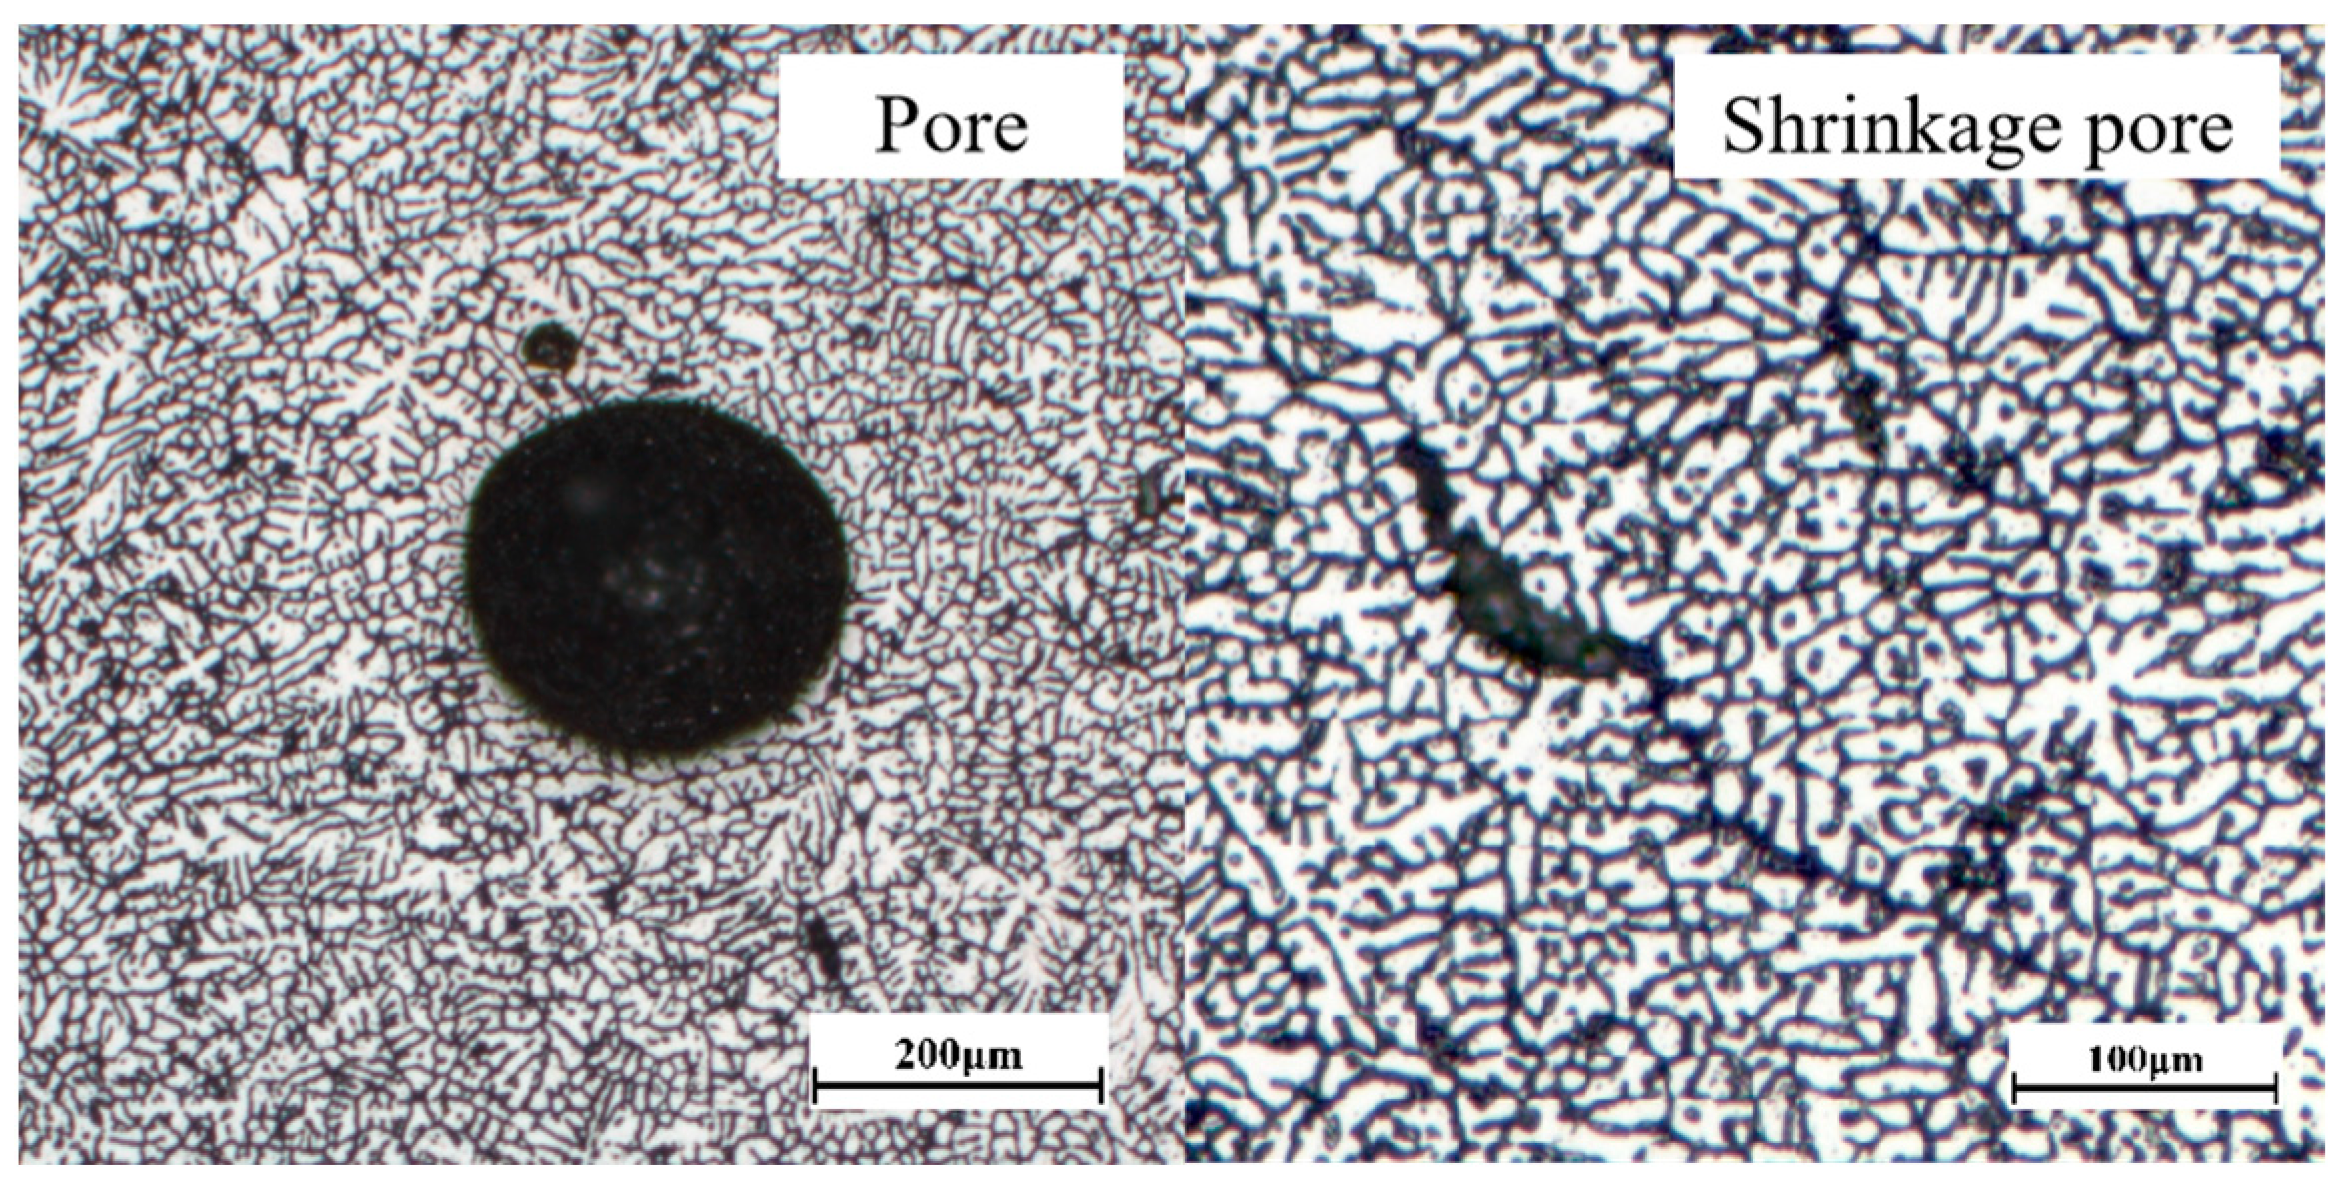
The macro-morphology and defects of the welding area are shown in Figure 8 and Figure 9. The defects in the weld were divided into two main types: (1) Pores, where most of the pores presented as elliptical or oval shapes, as shown in Figure 9, which is a typical metallurgical pore morphology [17]. During the welding process, due to the sharp drop in temperature, supersaturated hydrogen cannot be separated from the molten pool, and thus, circular or elliptical pores are formed in the FZ. Pores are the most common casting defects in aluminum alloys, and their size and distribution are greatly affected by the solidification speed of the molten pool and the floating rate of hydrogen in the molten pool [18]. The higher the solidification speed, the harder it is for supersaturated hydrogen to escape. When the floating speed of hydrogen is less than the solidification speed of the molten pool, the supersaturated hydrogen will eventually stay in the molten pool to form pores [19,20]. (2) Shrinkage pores, which were irregularly shaped cavities formed due to different temperature gradients in different areas of the weld during cooling, as shown in Figure 9. Compared with the usual spherical pores, the shrinkage pores have an irregular 3D shape, which is more likely to lead to stress concentration, and thus, the shrinkage pores have a greater impact on the mechanical properties of welded joints.

3.2. Micro-Characterization of Welded Joints

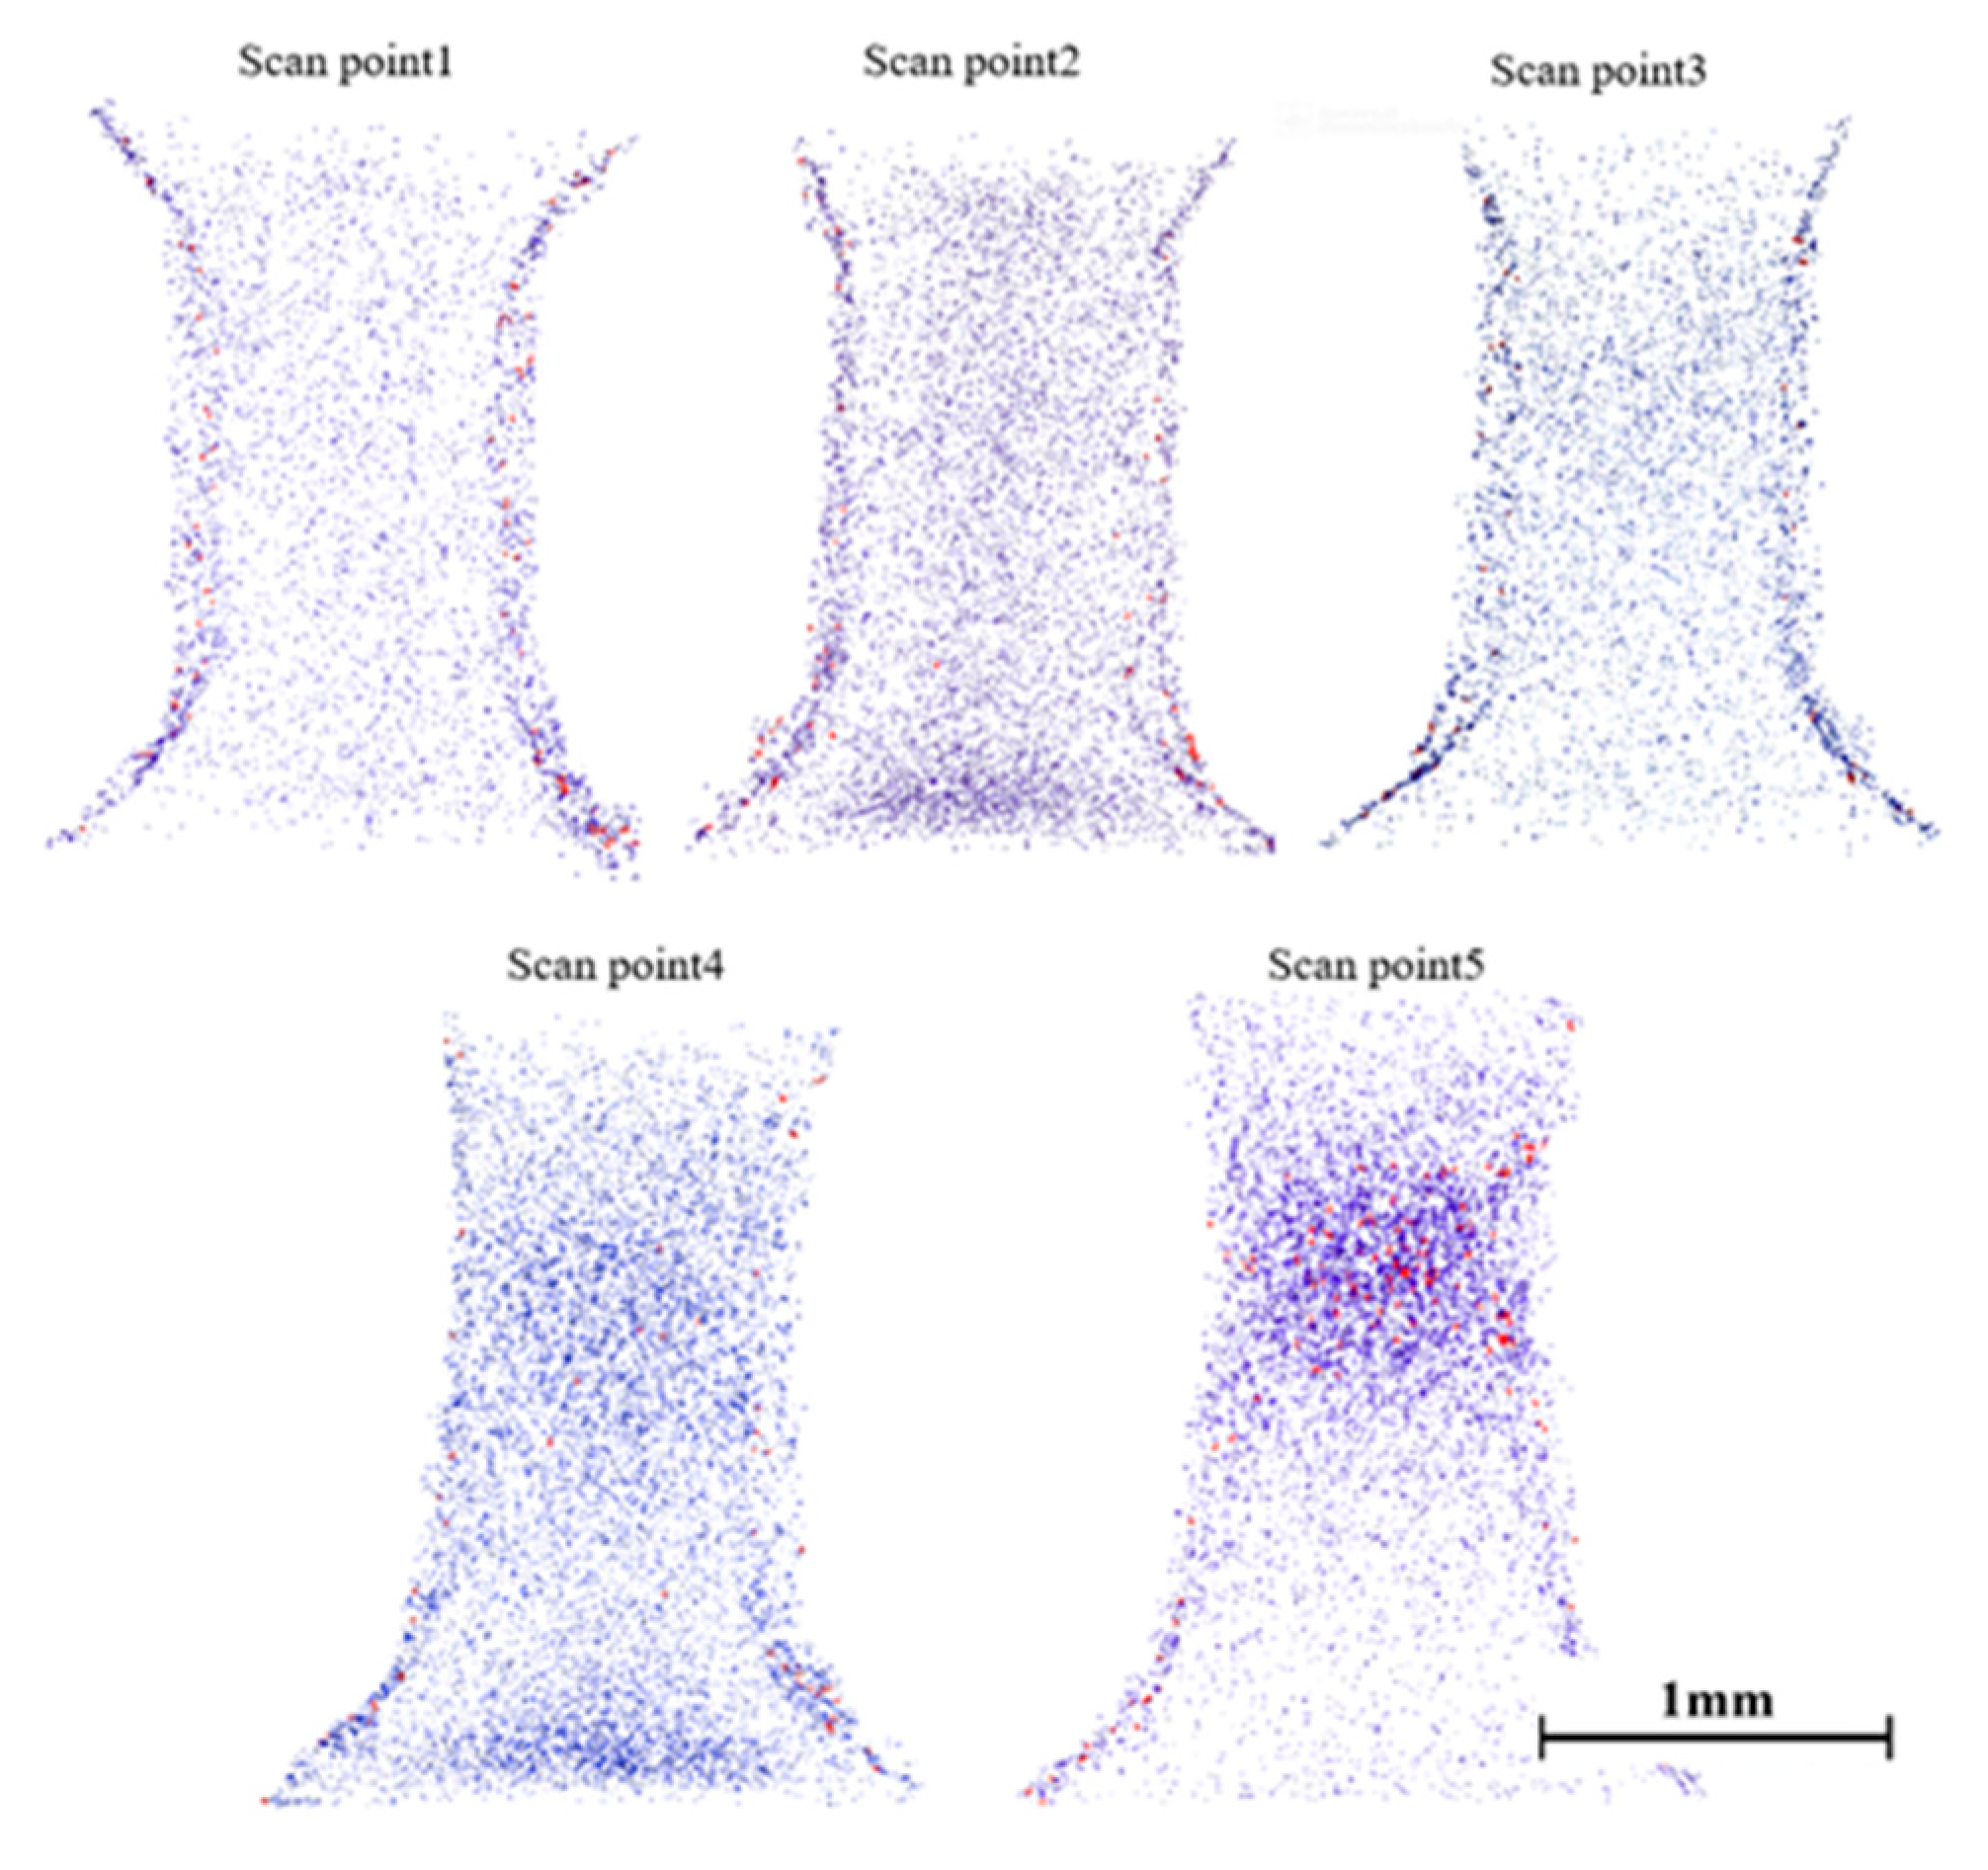
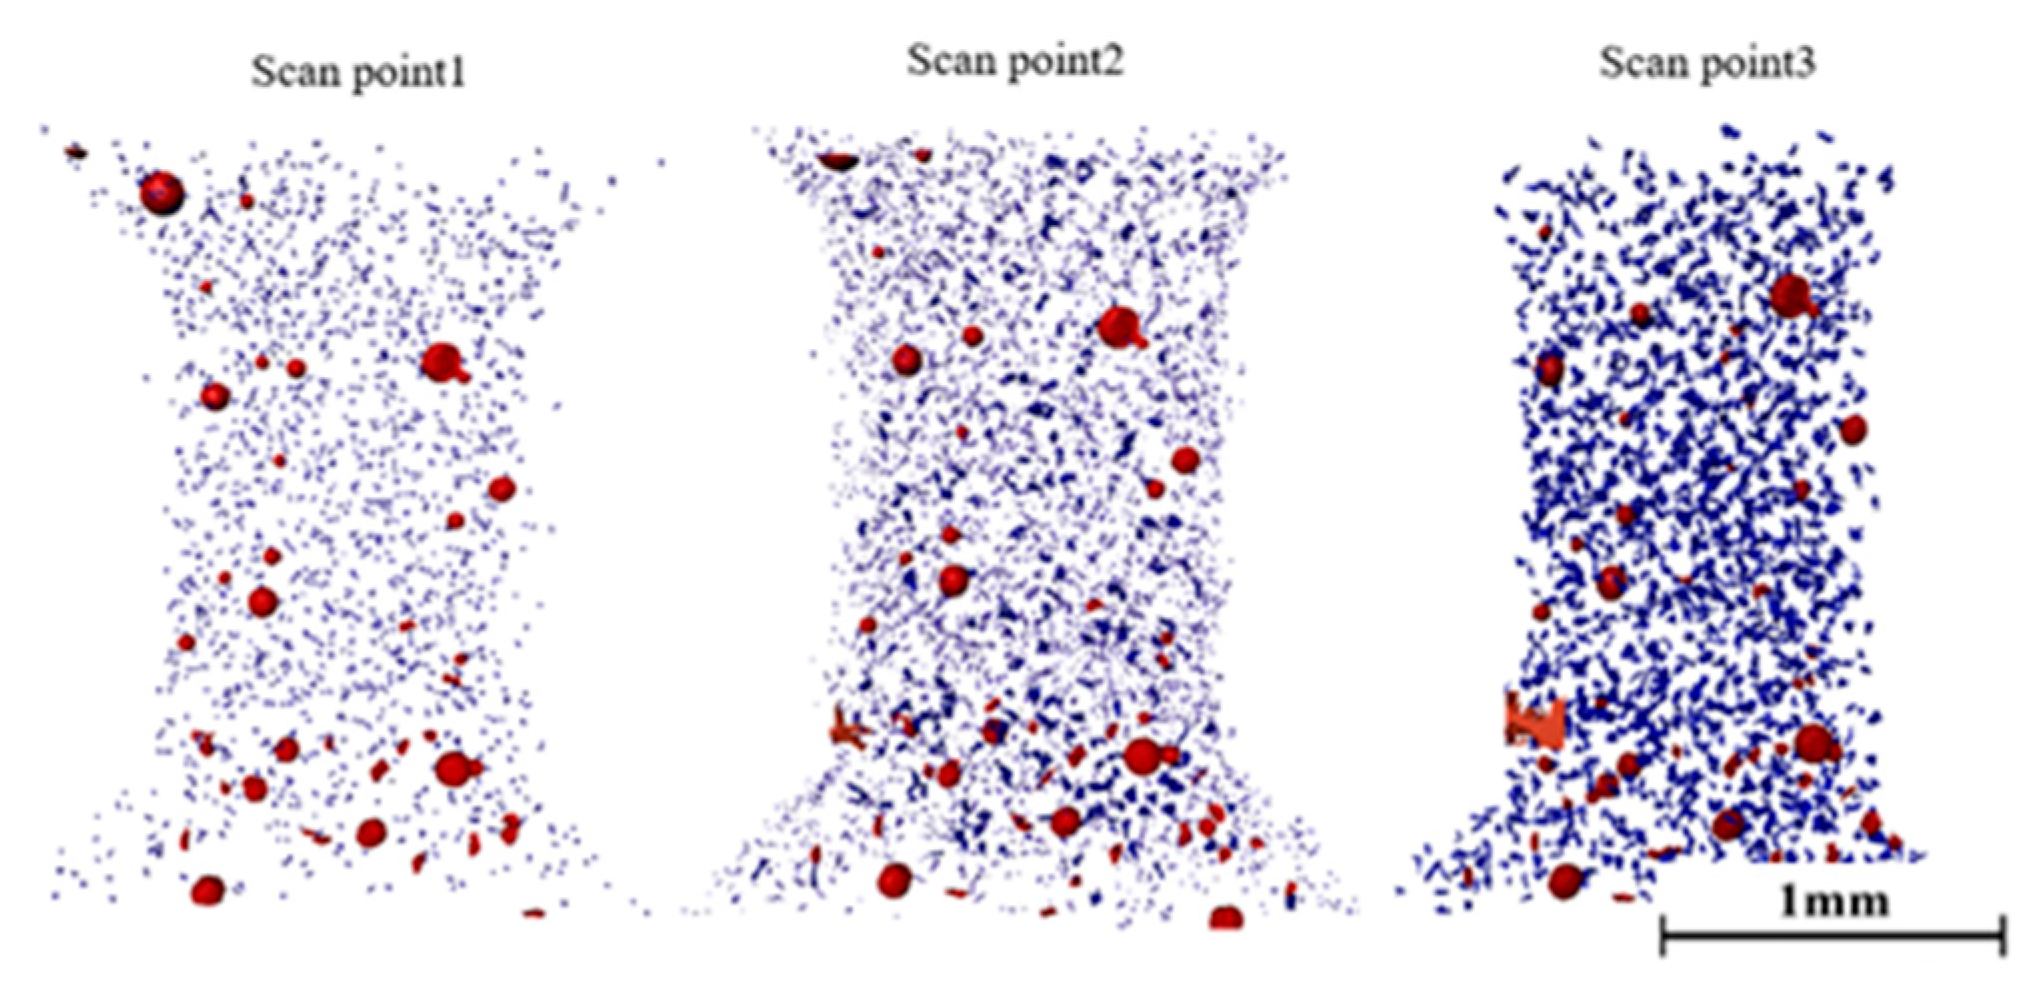
CT is currently the key technology for studying the damage evolution behavior of materials, which can non-destructively characterize the microstructure of materials. In the scan, we obtained a 3D rendering of the pores inside the specimen. The pores were classified into pores and shrinkage pores by using the “sphericity (f)” parameter. Figure 10 and Figure 11 show the 3D CT scanning reconstructed images of the HAZ and the FZ in the in situ tensile experiment. To reflect the sizes of the defects, red was used to more intuitively represent defects larger than 500 μm3 in the HAZ and larger than 5000 μm3 in the FZ. Scanning point 1 was the initial stage, that is, the stage when the sample did not deform before loading. By observing and comparing the imaging results of the same sample at different stages, with the accumulation of strain, the volume of some original defects in the sample continued to grow, new meso-defects formed in the sample, and then adjacent defects were combined into a larger defect, with new meso-defects forming in the sample.
Table 3 shows the statistical information of defects in the HAZ and FZ in situ tensile specimens at different stages. These data were obtained from a single test, and further experimental results are needed for a more accurate assessment. During the analysis of the defect information, it was found that the examined volume at all stages corresponded to the original volume examined at the initial stage, and only the defects in the gauge length of the HAZ and FZ were counted in the in situ tensile specimens. It was found that the number of defects increased gradually with the accumulation of strain, and the mean sphericity of defects decreased gradually with the accumulation of strain. The main reasons for this phenomenon were as follows: during the tensile process, with the increase in strain, cracks initiated from the stress concentration of microscopic defects and expanded continuously. With the expansion of cracks and the growth of defects, the polymerization behavior between adjacent defects caused the average sphericity to gradually decrease with the accumulation of strain. However, the change in the average volume and average surface area of the meso-defects under the uniaxial tensile load was much more complex than the change in their number and average sphericity. For the in situ tensile sample in the HAZ, under the axial tensile load, the growth rate of the number of defects at scan point 2 relative to scan point 1 was 15.75%, and the growth rates of the average volume and the average area were 9.66% and 15.44%, respectively. In contrast, in the second half of the material tension, the growth rate of the number of defects in scan point 3 relative to scan point 2 was 13%, and the growth rates of the average volume and average area of defects were 47.26% and 25.49%, respectively. However, for the in situ tensile specimen in the FZ, under the axial tensile load, the average volume and average surface area of the defects gradually increased with the accumulation of strain. From the above comparative analysis, it can be seen that the nucleation, growth, and polymerization behaviors of the meso-defects in the materials were not completely independent, and different behaviors may have affected each other, resulting in no obvious rule for the characterization variables (average volume, average surface area) of the defect size.

3.3. Analysis of the Meso-Defect Evolution Process

Due to the fact that there were many defects in the actual samples and the formation mechanisms of porosity defects and shrinkage defects were different, the actual defects had certain layered distribution characteristics in the welded joints, and the sizes and shapes of the defects were different. In order to quantitatively characterize the sizes and morphologies of CMT defects in the AA5754O aluminum alloy, the equivalent diameter (Deq) and sphericity (ψ) of the defects are usually used to describe the size and morphology characteristics of defects. The formulae are as follows:
D e q = 2 3 V 4 π 3
ψ = 36 π V 2 S 3 3
where Deq represents the equivalent diameter, ψ represents the defect sphericity, V represents the volume of the defect, and S represents the surface area of the defect.
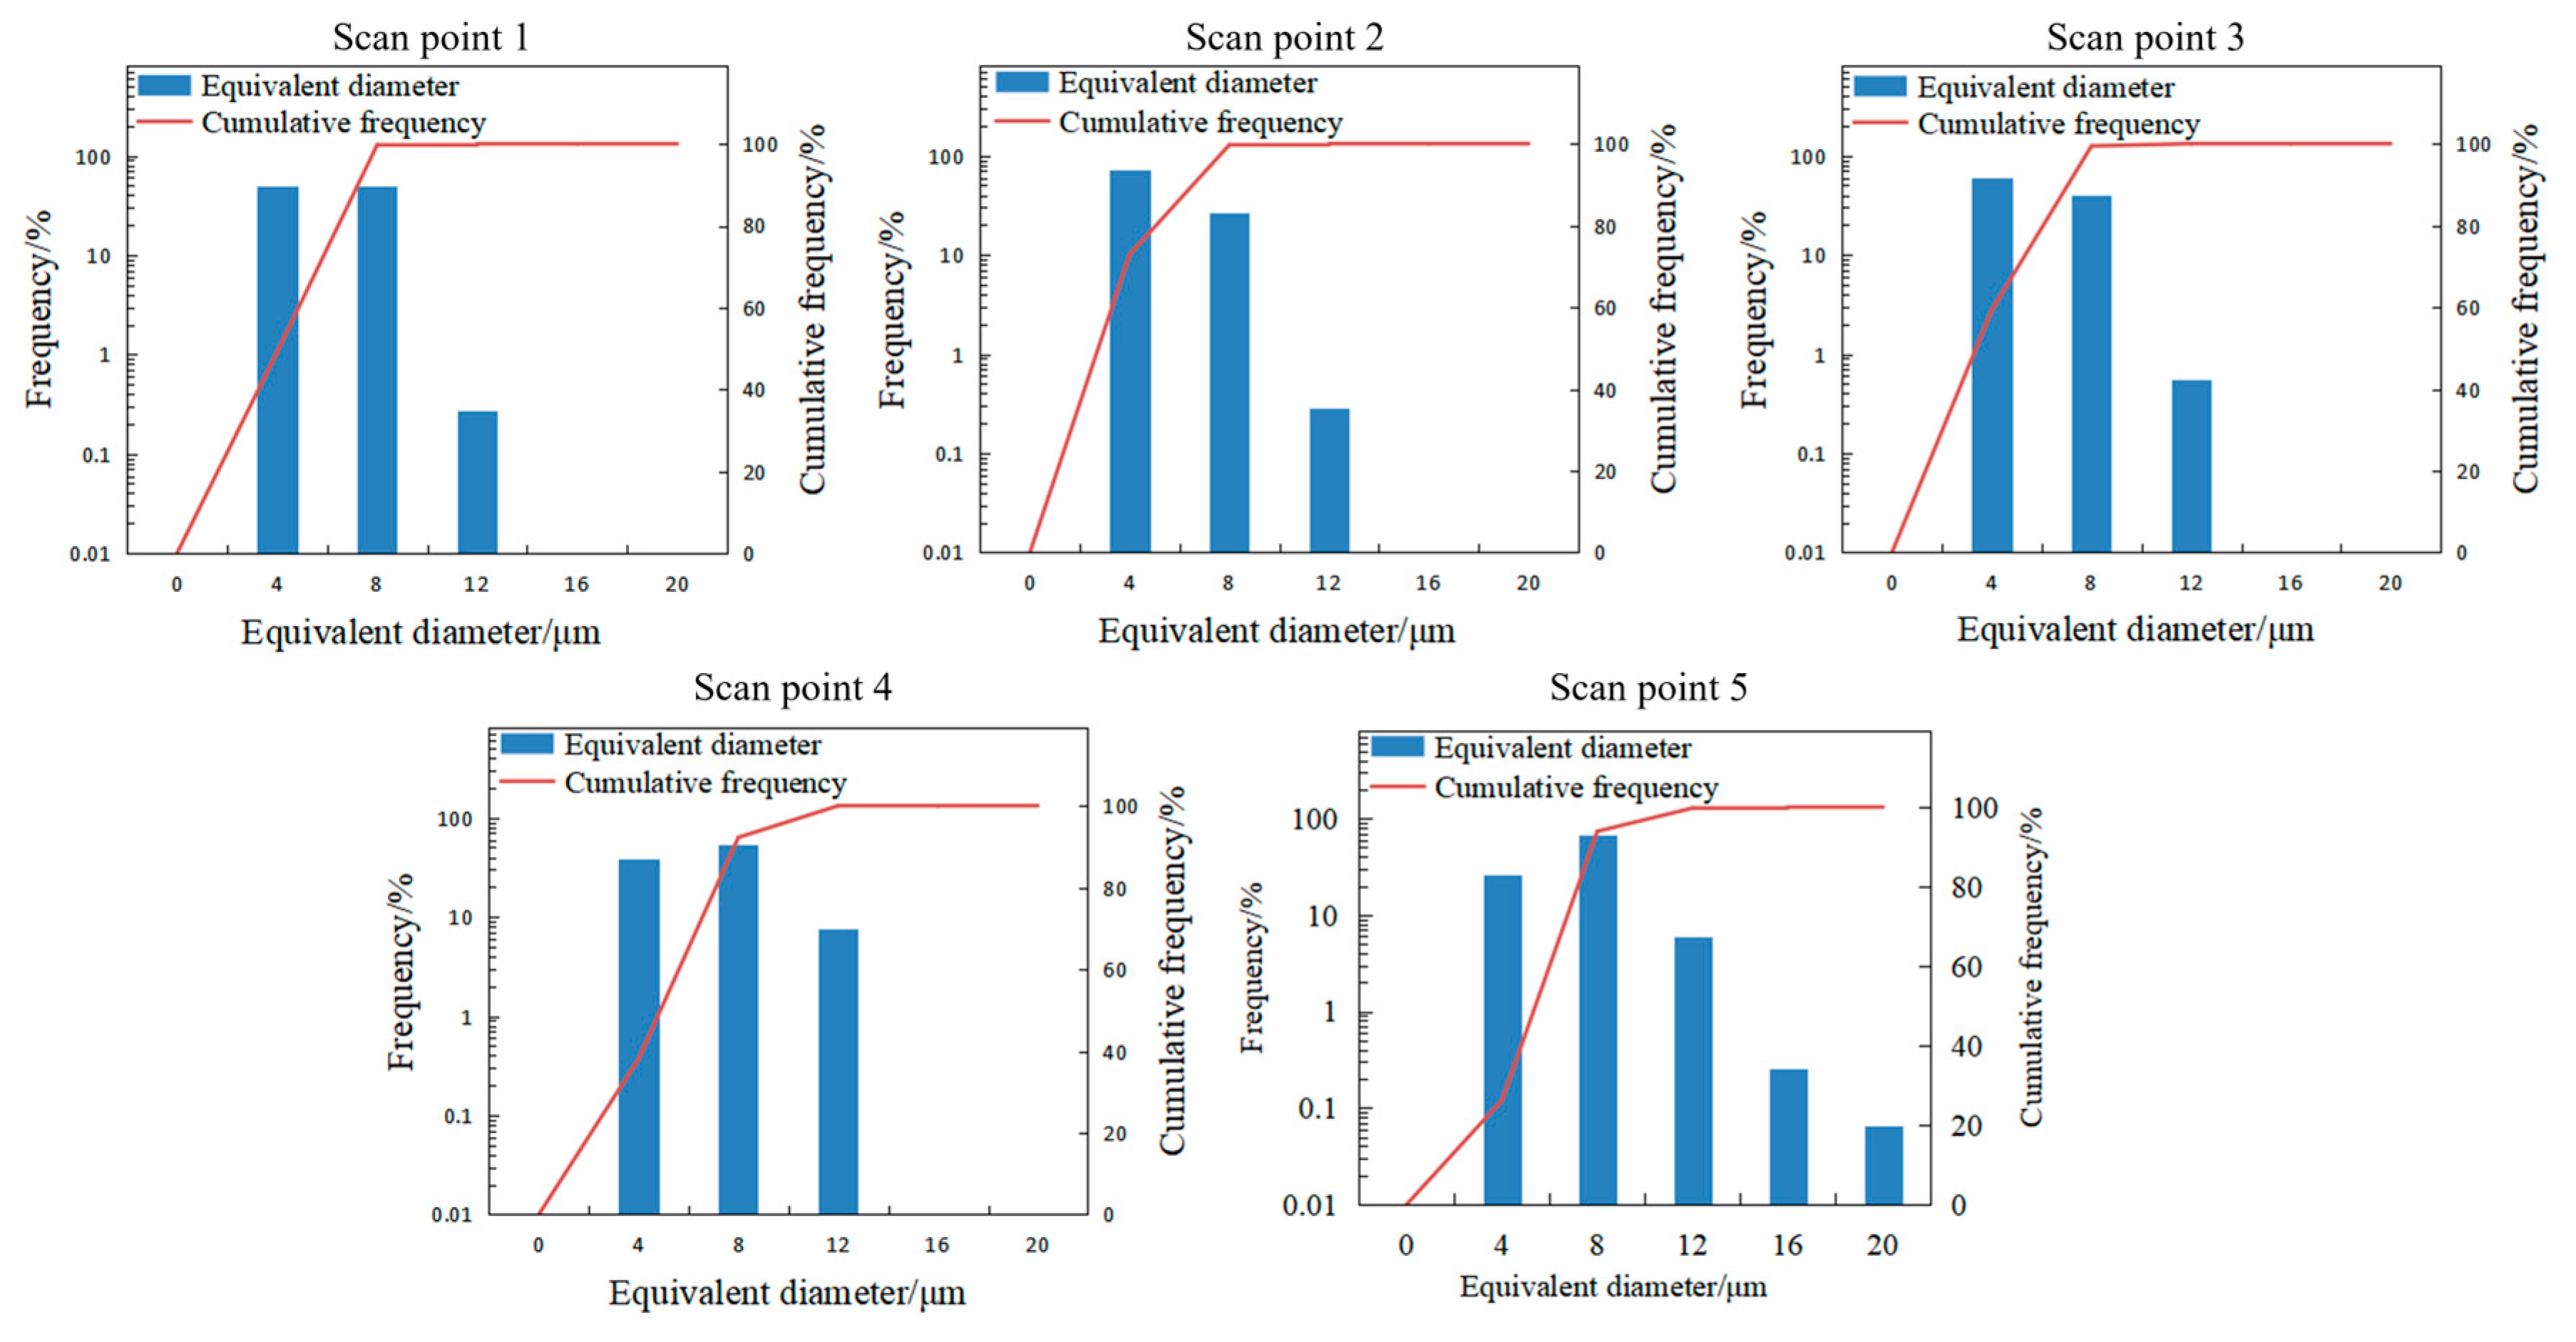
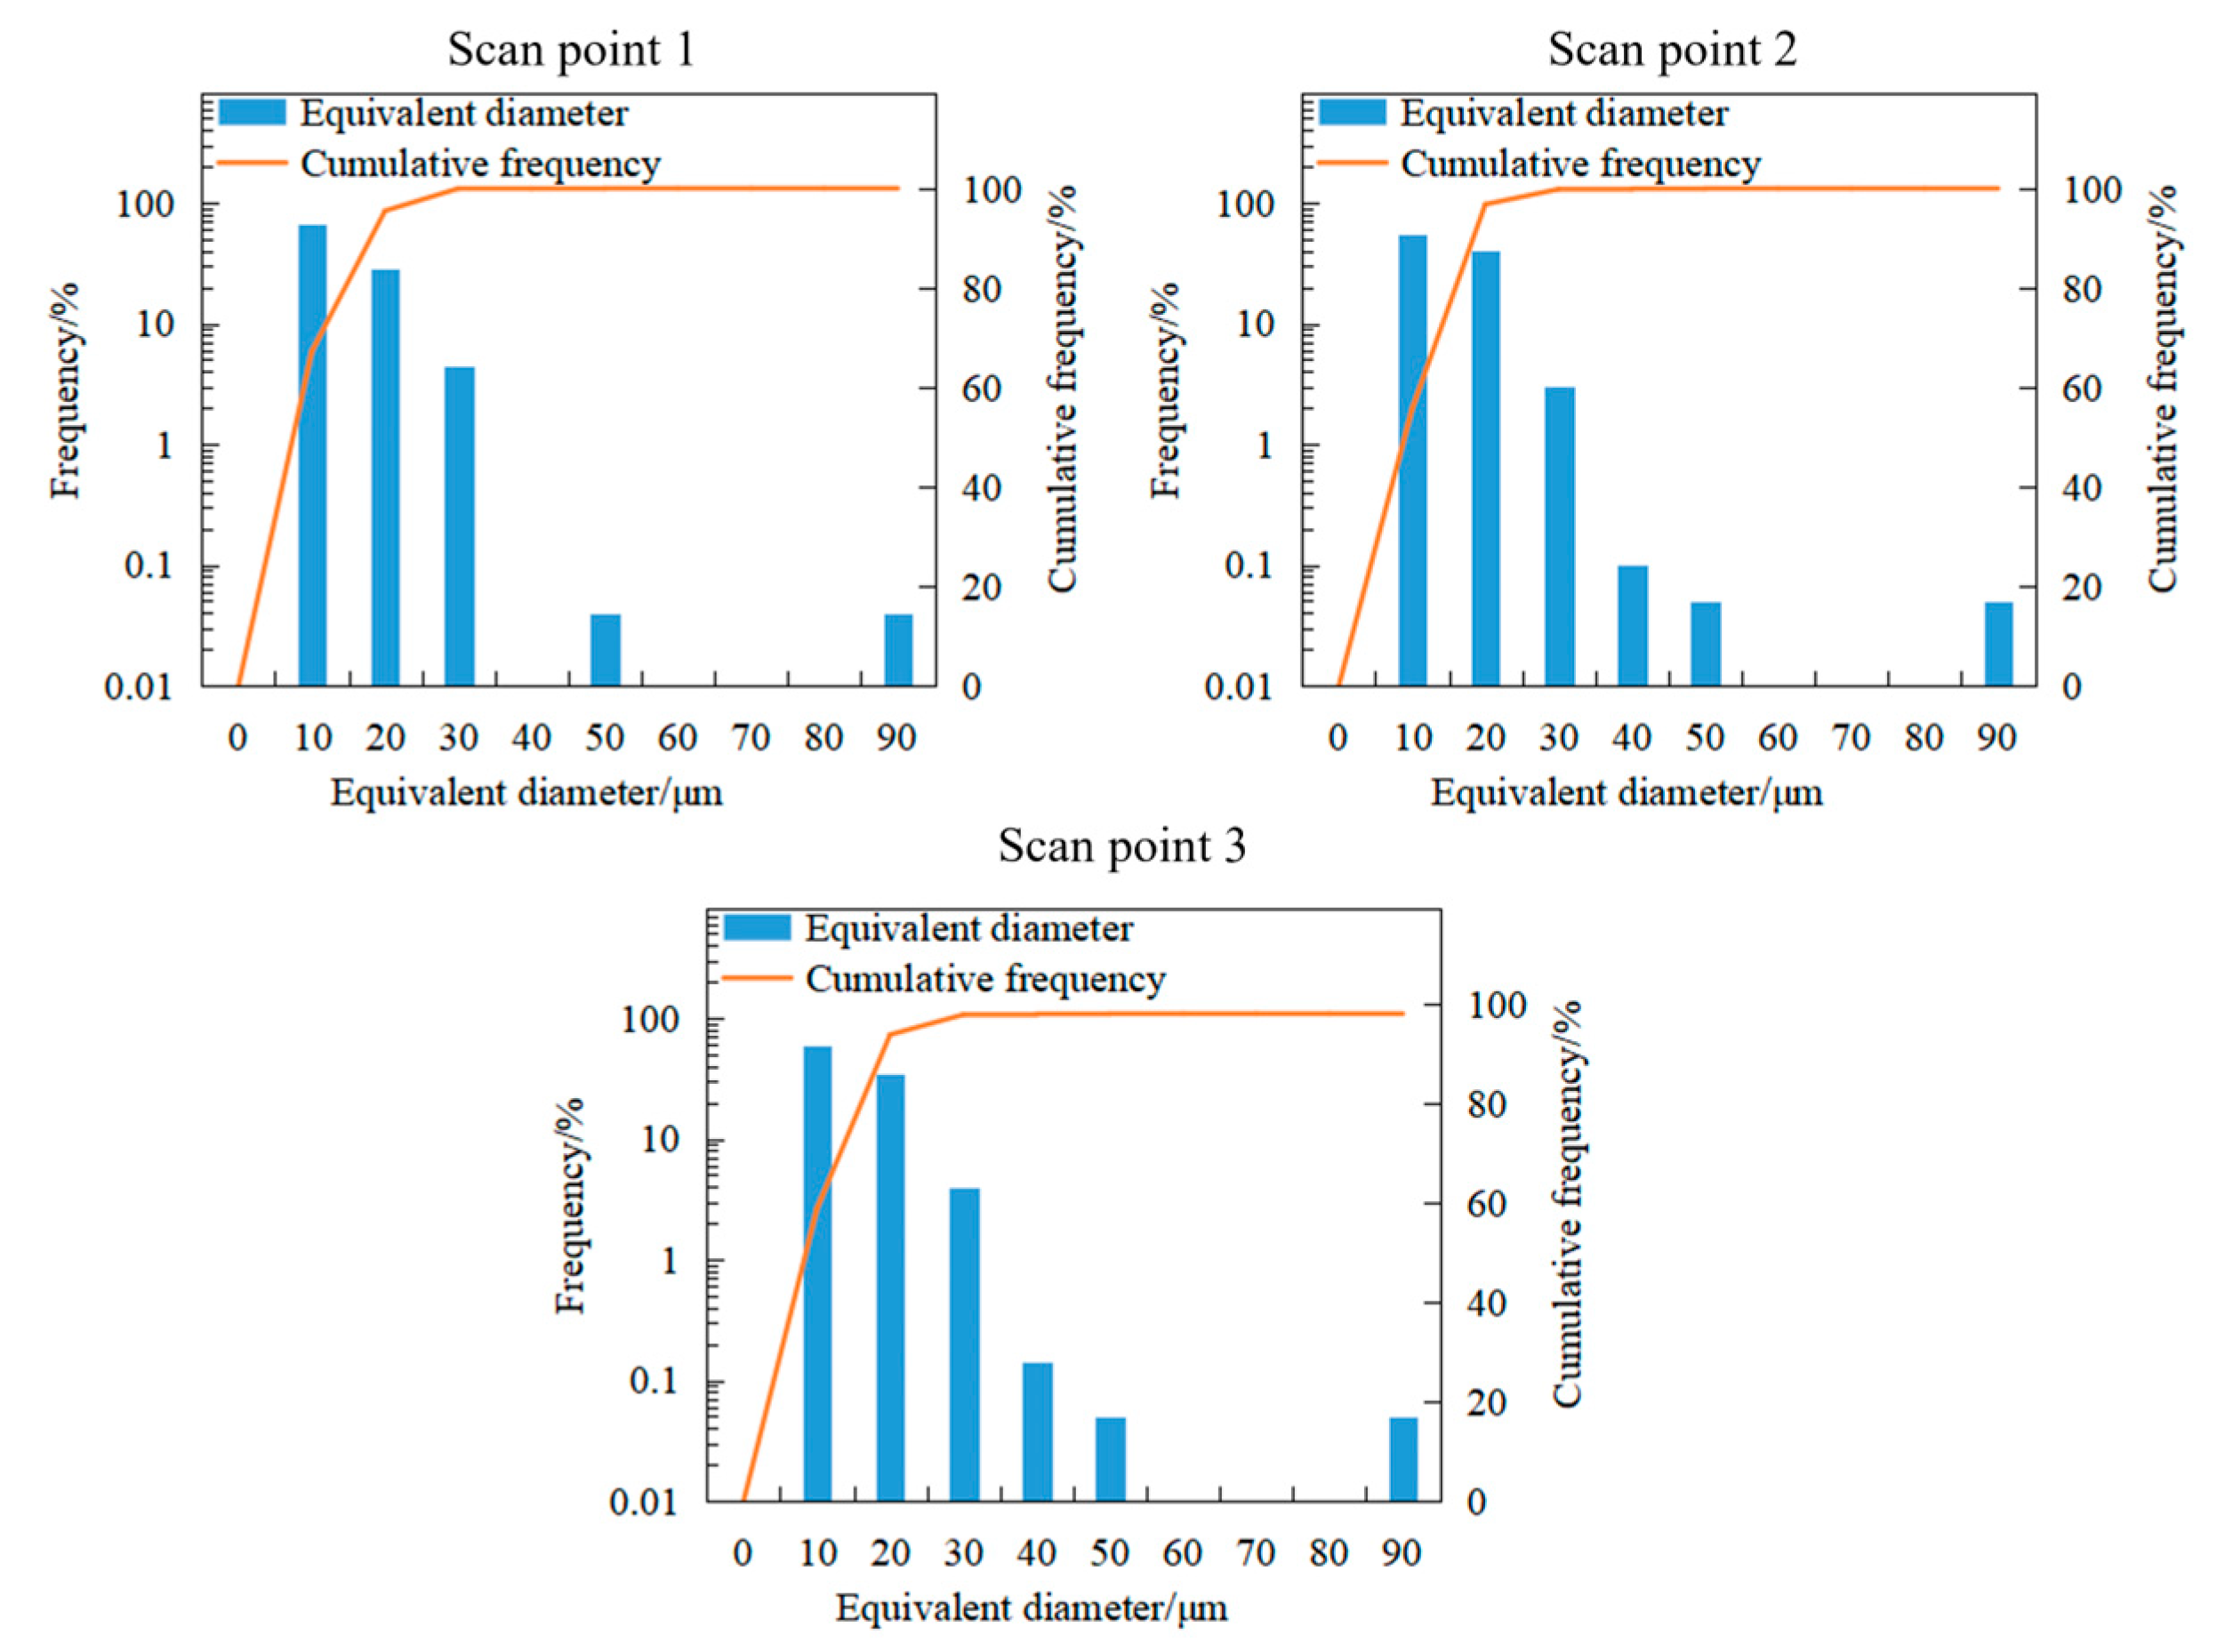
Figure 12 and Figure 13 show the frequency histograms and cumulative frequency curves of the equivalent diameters of defects in the HAZ and FZ, respectively.
The results showed that the frequency of defects with an equivalent diameter of less than 8 μm in the HAZ of the 5754 aluminum alloy CMT welded joints was as high as 90%. With the accumulation of strain, the frequency of large-sized defects increases gradually. However, even at the position of scanning point 1 where the sample was about to fail, the defects larger than 12 μm only accounted for 0.07% of the total number. Figure 12 shows the relationship between the defect sphericity and the equivalent diameter of the HAZ at scan point 5. It can be seen that most of the defects in the HAZ were small-sized pores with sphericity greater than 0.6.
For the 5754 aluminum alloy CMT welding, the frequency of the defects with an equivalent diameter of less than 30 μm in the FZ of the AA5754O aluminum alloy CMT welded joints was as high as 90%, and the frequency of the existence of defects gradually decreased with the increase in the equivalent diameter in the same scanning stage. The frequency of occurrence of larger dimensions increases gradually with the equivalent plastic strain of the specimen. The frequency of defects with a defect equivalent diameter of 20~40 μm gradually increased with the accumulation of strain, while the frequency of defects larger than 40 μm did not change significantly. Figure 14 calculates sphericity and equivalent diameters of all defects in the HAZ and FZ. From Figure 14, it can be seen that the equivalent diameter was between 20~40 μm. Most of the defects were shrinkage cavities with sphericity less than 0.5. Due to the irregular shape of shrinkage cavities, they were more likely to polymerize and grow during the tensile process of the material, which led to material failure, making the elongation of the FZ significantly smaller than that of the HAZ.

3.4. Defect Growth

The quantification of defect growth is one of the most important ways to analyze the process of material damage evolution. The average volume of defects can effectively reflect the growth behavior of defects under a tensile load.
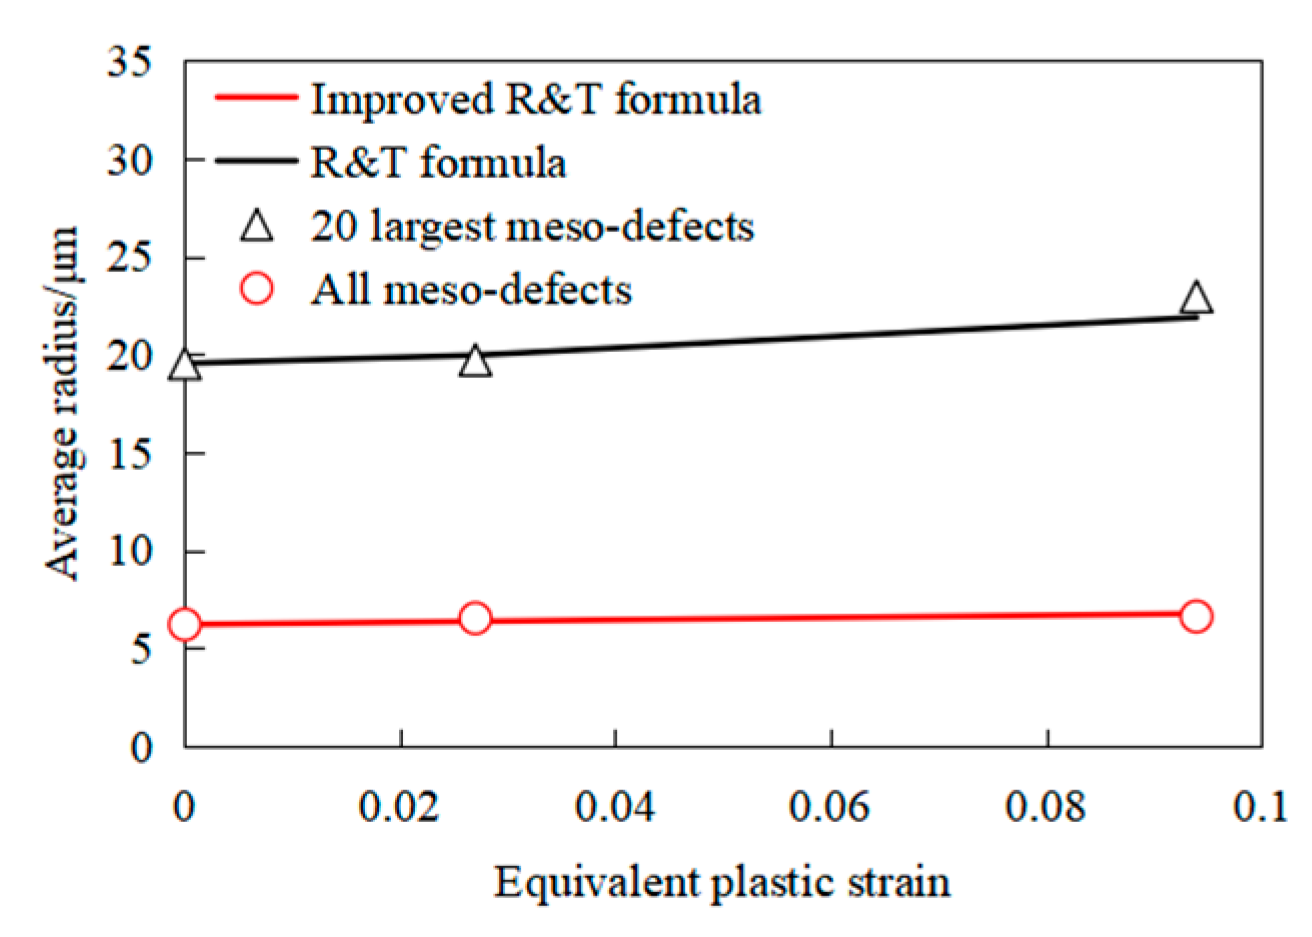
Figure 15 and Figure 16 calculated the average radius of all meso-defects on the normal section of in situ specimens and the average diameter of the 20 largest defects in the group to facilitate the study of the variation trend of average radius under a tensile load.
It can be seen from the figure that with the accumulation of plastic strain, the growth rate of the average radius of the 20 largest meso-defects was higher than that of all meso-defects, which was mainly due to the interaction between the growth behavior of the metal internal defects and the nucleation behavior of the defects. The research of Cao et al. and Bouaziz et al. showed that the defect nucleation behavior of metal materials can be fitted using various forms of functional equations [21,22]. Rice and Tracey proposed using the R&T formula to simulate the growth behavior of defects, which describes the growth of a defect radius r in an ideal plastic matrix [23,24,25]. The R&T formula is
d R R = α R T exp ( 3 2 T ) d ε ¯ p
where R is the defect radius, dR is the growth rate of the defect radius, αRT is the material constant, and T is the stress triaxiality.
In the R&T formula, Rice and Tracey obtained the material constant αRT of 0.238 by analyzing the damage evolution behavior of steel. However, some scholars believe that when Rice and Tracey derived the formula of pore expansion rate, it involved the minimization of a function of the velocities. Their calculation was carried out with two amplitude factors, which caused the model to underestimate the growth rate, that is, αRT should be greater than 0.28. In addition, the material constant αRT should be fitted based on experimental results for different damage evolution behaviors of materials. Therefore, the R&T formula was used in this section to fit the damage evolution behavior of the HAZ and FZ, and the material constant αRT obtained in each of the HAZ and FZ was 1.87 and 7.21, respectively. The fitting results are shown in Figure 15 and Figure 16, and the fitting results were good, with R-squared values of 0.86 and 0.81, respectively. However, since the R&T formula does not involve the nucleation behavior of defects, it is not suitable to describe the growth behavior of all microscopic defects. Inspired by the growth behavior of defect nucleation behavior, some scholars improved the R&T model [25]. The improved R&T formula is
d R d ε ¯ p = α R T m exp ( 3 2 T ) R 1 N d N d ε ¯ p ( R R 0 )
where dN is the defect nucleation rate and R0 is the initial average radius of the defect.
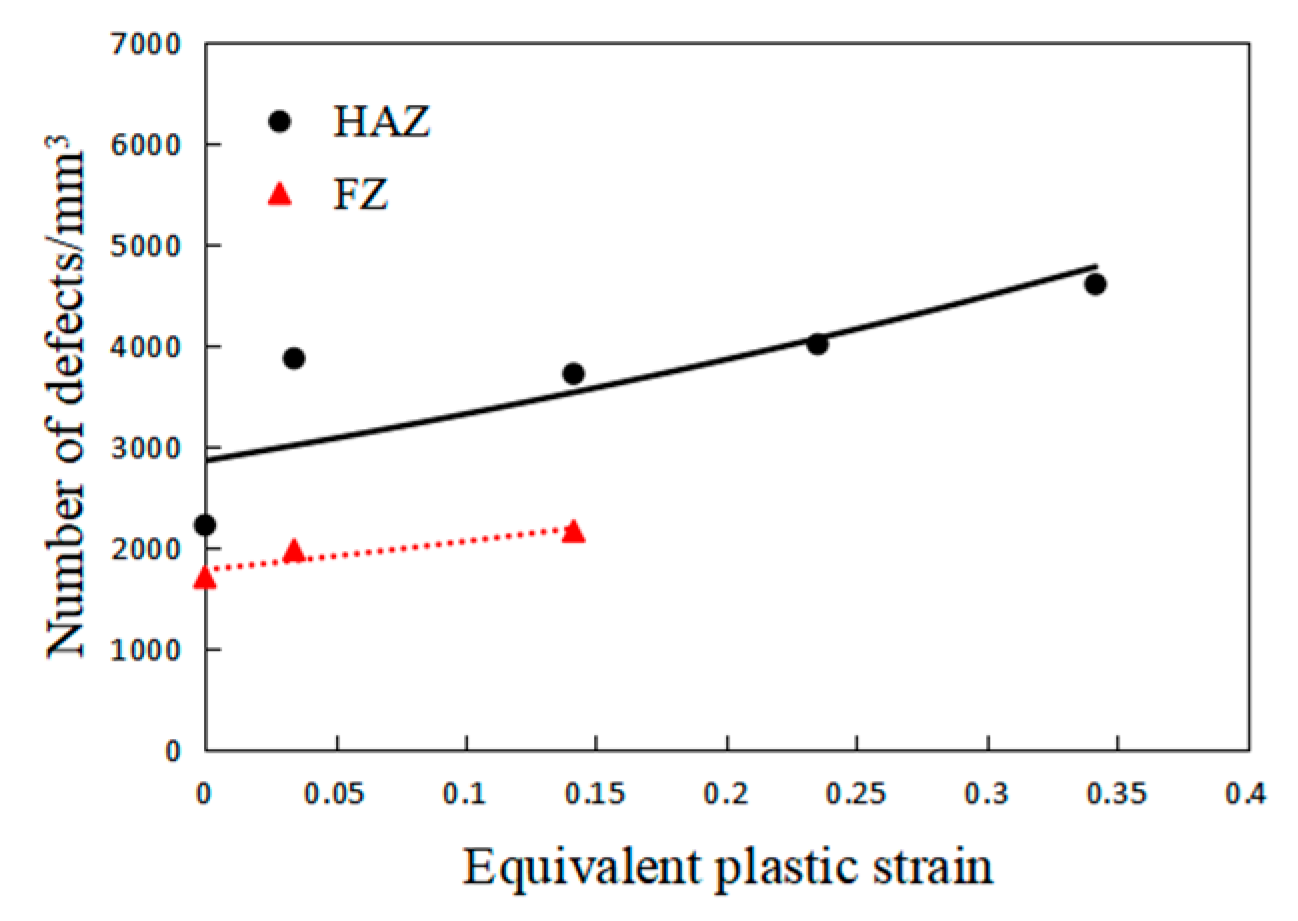
The improved R&T formula introduced the influence of defect nucleation, and thus, the number of defects per cubic millimeter N was measured in different areas of the sample, as shown in Figure 17. Since the number of microscopic defects increased exponentially with the occurrence of damage, an exponential function was used to fit the changing behavior of the defect density. When the evolution of the defect number density N is known, the improved R&T formula is used to fit the growth behavior of all detailed defects in the FZ and HAZ. By fitting the improved R&T formula, αRTm and R0 were 6.2 and 2 in the HAZ and 5.31 and 7 in the FZ, respectively. The fitting curve is shown by the red curve in Figure 13 and Figure 14, where the R-squared values are 0.91 and 0.82, respectively. The improved R&T model can describe the variation process of the mean radius of each mesoscopic defect in the sample well and can be used to predict the evolution of the mean radius of each mesoscopic defect in the sample.

4. Summary

In this study, the microstructure and failure evolution of AA5754O aluminum alloy CMT joints under quasi-static loads were studied through a hardness test, metallographic test, and in situ test. In situ experimental results were used to characterize the damage evolution behavior in the FZ and HAZ of AA5754O aluminum alloy CMT welded joints. However, since the statistical information of the FZ and HAZ defects were obtained from a single test, further experimental results are needed for a more accurate assessment. In addition, due to the limited number of tests conducted in this study, the crack coalescence phenomenon was not specifically analyzed. The results are summarized as follows:
  • The hardness and metallographic experiments showed that the large heat dissipation coefficient of the aluminum alloy promoted the rapid solidification and crystallization of the metal in the FZ, resulting in the refinement of the grain in the FZ, and the overall structure was dendritic. The grain in the HAZ was coarsened with the impact of the thermal cycle. The overall welding area was hardened compared with the base material.
  • Through the analysis of the in situ experimental data, it was found that the defects in the HAZ were mainly composed of pores with sphericity greater than 0.6 as a regular shape, and the softening failure was mainly caused by the decrease in the effective bearing area due to the increase in the number of defects. There was a large number of shrinkage holes with sphericity less than 0.6 in the FZ defects, and the softening failure was mainly caused by the decrease in the effective bearing area due to the continuous growth and consolidation of the shrinkage holes.
  • The R&T formula was used to fit the evolution behavior of the 20 largest defects in the FZ and HAZ, and the material constant αRT in each of the FZ and HAZ was 7.21 and 1.87, respectively. Then, an improved R&T model was used to fit the average radius of all meso-defects in the FZ and HAZ. By fitting the improved R&T formula, αRTm and R0 were 6.2 and 2 in the HAZ and 5.31 and 7 in the FZ, respectively. The improved model could better describe the growth of the average radius of all meso-defects in the samples, and the fitting effect was good, with R-squared values of 0.91 and 0.82, respectively. The improved model could be used to predict the evolution process of meso-defects in CMT-welded joints.

Author Contributions

Conceptualization, W.K., Q.C., L.H., X.W., W.H. and E.W.; data curation, J.Z. and Z.H.; funding acquisition, Q.C.; methodology, W.K.; project administration, Q.C.; software, W.K. and J.Z.; validation, W.K. and X.W.; writing—original draft, W.K.; writing—review and editing, Q.C., L.H., J.Z., Z.H., X.W., W.H. and E.W. All authors have read and agreed to the published version of the manuscript.

Funding

This research was supported by the National Natural Science Foundation (Grant No. 52205377), Key Basic Research Project of Suzhou (Project No. #SJC2022029, #SJC2022031), and Jiangsu Material Big Data Public Technical Service Platform (Project No. BM2021007). We also highly appreciate the support from the Jiangsu Industrial Technology Research Institute and Advanced Materials Research Institute, Yangtze Delta.

Institutional Review Board Statement

Not applicable.

Informed Consent Statement

Not applicable.

Data Availability Statement

All data included in this paper are available upon request by contact with the corresponding authors.

Conflicts of Interest

The authors declare no conflict of interest.

Nomenclature

CMTCold metal transfer
CTX-ray computed tomography
HAZHeat-affected zone
FZFusion zone
BMBase metal

References

  1. Wang, X.-N.; Sun, Q.; Zheng, Z.; Di, H.-S. Microstructure and fracture behavior of laser welded joints of DP steels with different heat inputs. Mater. Sci. Eng. A 2017, 699, 18–25. [Google Scholar] [CrossRef]
  2. İpekoğlu, G.; Çam, G. Effects of initial temper condition and postweld heat treatment on the properties of dissimilar friction-stir-welded joints between AA7075 and AA6061 aluminum alloys. Metall. Mater. Trans. A 2014, 45, 3074–3087. [Google Scholar] [CrossRef]
  3. Xu, W.; Ma, J.; Wang, M.; Lu, H.; Luo, Y. Effect of cooling conditions on corrosion resistance of friction stir welded 2219-T62 aluminum alloy thick plate joint. Trans. Nonferrous Met. Soc. China 2020, 30, 1491–1499. [Google Scholar] [CrossRef]
  4. Çam, G.M.; Koçak, M. Microstructural and mechanical characterization of electron beam welded Al-alloy 7020. J. Mater. Sci. 2017, 42, 7154–7161. [Google Scholar] [CrossRef]
  5. Pakdil, M.; Çam, G.; Koçak, M.; Erim, S. Microstructural and mechanical characterization of laser beam welded AA6056 Al-alloy. Mater. Sci. Eng. A 2011, 528, 7350–7356. [Google Scholar] [CrossRef]
  6. Tian, Y.; Shen, J.; Hu, S.; Wang, Z.; Gou, J. Effects of ultrasonic vibration in the CMT process on welded joints of Al alloy. J. Mater. Process. Technol. 2018, 259, 282–291. [Google Scholar] [CrossRef]
  7. Kashaev, N.; Ventzke, V.; Çam, G. Prospects of laser beam welding and friction stir welding processes for aluminum airframe structural applications. J. Manuf. Process. 2018, 36, 571–600. [Google Scholar] [CrossRef]
  8. Srinivasan, D.; Sevvel, P.; John Solomon, I.; Tanushkumaar, P. A review on Cold Metal Transfer (CMT) technology of welding. Mater. Today Proc. 2022, 64, 108–115. [Google Scholar] [CrossRef]
  9. Gao, P.F.; Guo, J.; Zhan, M.; Lei, Z.N.; Fu, M.W. Microstructure and damage based constitutive modelling of hot deformation of titanium alloys. J. Alloys Compd. 2020, 831, 154851. [Google Scholar] [CrossRef]
  10. Gao, P.; Fu, M.; Zhan, M.; Lei, Z.; Li, Y. Deformation behavior and microstructure evolution of titanium alloys with lamellar microstructure in hot working process: A review. J. Mater. Sci. Technol. 2020, 39, 56–73. [Google Scholar] [CrossRef]
  11. Rajeshkumar, R.; Niranjani, V.L.; Niranjani, K.; Devakumaran, K.; Banerjee, K. Structure-property correlation of weld metal zone and interface regions of cold metal transfer welded dissimilar Al-Mg-Mn alloys joint. Mater. Today Proc. 2021, 46, 2498–2509. [Google Scholar] [CrossRef]
  12. Xing, L.; Zhan, M.; Gao, P.F.; Li, M.; Dong, Y.D.; Wang, T.Y. Effect of void nucleation on microstructure and stress state in aluminum alloy tailor-welded blank. Prog. Nat. Sci. Mater. Int. 2021, 31, 77–85. [Google Scholar] [CrossRef]
  13. Barnard, H.; MacDowell, A.A.; Parkinson, D.Y. Synchrotron X-ray micro-tomography at the advanced light source: Developments in high-temperature in-situ mechanical testing. IOP Conf. Ser. J. Phys. Conf. Ser. 2017, 849, 012043. [Google Scholar] [CrossRef] [Green Version]
  14. Malisano, J.; Kumar, S.; Lui, C.; O’Reilly, K. X-ray Computed Tomography versus Metallography for Porosity Analysis in Aluminium RPT Castings. In Proceedings of the SP17: 6th Decennial International Conference on Solidification Processing, Old Windsor, UK, 25–28 July 2017. [Google Scholar]
  15. Samei, J.; Amirmaleki, M.; Shirinzadeh Dastgiri, M.; Marinelli, C.; Green, D.E. In-situ X-ray tomography analysis of the evolution of pores during deformation of AlSi10Mg fabricated by selective laser melting. Mater. Lett. 2019, 255, 126512. [Google Scholar] [CrossRef]
  16. Xing, L.; Gao, P.F.; Zhan, M.; Ren, Z.P.; Fan, X.G. A micromechanics-based damage constitutive model considering microstructure for aluminum alloys. Int. J. Plast. 2022, 157, 103390. [Google Scholar] [CrossRef]
  17. Huan, P.-C.; Wang, X.-N.; Zhang, J.; Hu, Z.-R.; Chen, W.-G.; Nagaumi, H.; Di, H. Effect of wire composition on microstructure and properties of 6063 aluminium alloy hybrid synchronous pulse CMT welded joints. Mater. Sci. Eng. A 2020, 790, 139713. [Google Scholar] [CrossRef]
  18. Dewan, M.W.; Wahab, M.A.; Okeil, A.M. Influence of weld defects and postweld heat treatment of gas tungsten arc-welded AA-6061-T651 aluminum alloy. J. Manuf. Sci. Eng. 2015, 137, 051027. [Google Scholar] [CrossRef]
  19. Huang, J.L.; Warnken, N.; Gebelin, J.-C.; Strangwood, M.; Reed, R.C. On the mechanism of porosity formation during welding of titanium alloys. Acta Mater. 2012, 60, 3215–3225. [Google Scholar] [CrossRef]
  20. Liang, Y.; Hu, S.; Shen, J.; Zhang, H.; Wang, P. Geometrical and microstructural characteristics of the tig-cmt hybrid welding in 6061 aluminum alloy cladding. J. Mater. Process. Technol. 2017, 239, 18–30. [Google Scholar] [CrossRef]
  21. Cao, T.-S.; Maire, E.; Verdu, C.; Bobadilla, C.; Lasne, P.; Montmitonnet, P.; Bouchard, P.-O. Characterization of ductile damage for a high carbon steel using 3D X-ray micro-tomography and mechanical tests—Application to the identification of a shear modified GTN model. Comput. Mater. Sci. 2014, 84, 175–187. [Google Scholar] [CrossRef]
  22. Bouaziz, O.; Maire, E.; Giton, M. A model for initiation and growth of damage in dual-phase steels identified by X-ray micro-tomography. Rev. De Metall.-Cah. D Inf. Technol. 2018, 105, 102–107. [Google Scholar] [CrossRef]
  23. Maire, E.; Bouaziz, O.; di Michiel, M.; Verdu, C. Initiation and growth of damage in a dual-phase steel observed by X-ray microtomography. Acta Mater. 2008, 56, 4954–4964. [Google Scholar] [CrossRef]
  24. Landron, C.; Maire, E.; Bouaziz, O.; Adrien, J.; Lecarme, L.; Bareggi, A. Validation of void growth models using X-ray microtomography characterization of damage in dual phase steels. Acta Mater. 2011, 59, 7564–7573. [Google Scholar] [CrossRef]
  25. Kahziz, M.; Morgeneyer, T.F.; Mazière, M. In situ 3D Synchrotron Laminography Assessment of Edge Fracture in Dual-Phase Steels: Quantitative and Numerical Analysis. Exp. Mech. 2016, 56, 177–195. [Google Scholar] [CrossRef]
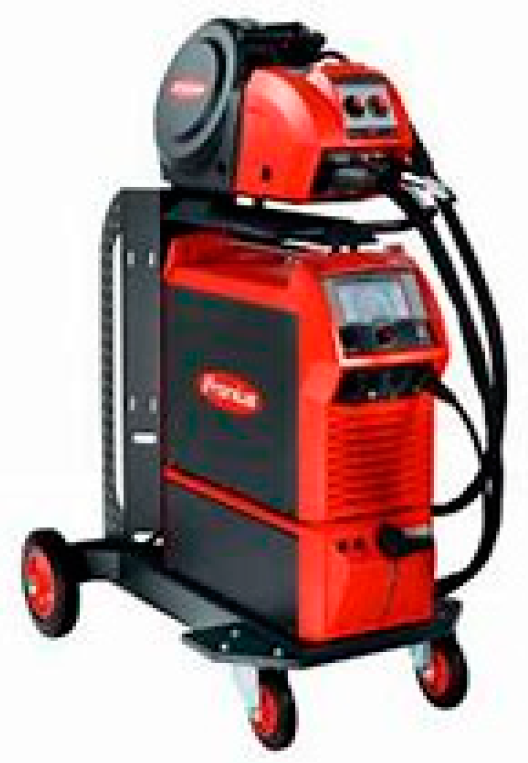
Figure 1. TPS400i full digital pulse welding machine.
Metals 13 00555 g001
Figure 2. CMT welding sample diagram.
Metals 13 00555 g002
Figure 3. The sample geometry of in situ tensile test.
Metals 13 00555 g003
Figure 4. Schematic diagram of sampling position of the in situ sample.
Metals 13 00555 g004
Figure 5. Load–displacement curves and scanning point diagrams from the CT scanning of the HAZ and FZ samples.
Metals 13 00555 g005
Figure 6. Hardness test results.
Metals 13 00555 g006
Figure 7. Microstructure of the welded joint.
Metals 13 00555 g007
Figure 8. Macro-morphology of the CMT welded joint section.
Metals 13 00555 g008
Figure 9. Weld macro-defects.
Metals 13 00555 g009
Figure 10. Three-dimensional reconstruction of the CT scan in the HAZ.
Metals 13 00555 g010
Figure 11. Three-dimensional reconstruction of the CT scan in the FZ.
Metals 13 00555 g011
Figure 12. Frequency histogram and cumulative frequency curve of the equivalent diameter of alloy defects in different stages of the HAZ.
Metals 13 00555 g012
Figure 13. Frequency histogram and cumulative frequency curve of the equivalent diameter of alloy defects in different stages of the FZ.
Metals 13 00555 g013
Figure 14. The relationship between the sphericity of the meso-defects and the equivalent diameter.
Metals 13 00555 g014
Figure 15. Measured and fitted values of different numbers of meso-defect radii in the HAZ samples.
Metals 13 00555 g015
Figure 16. Measured and fitted values of different numbers of meso-defect radii in the FZ samples.
Metals 13 00555 g016
Figure 17. Defect density and fitting results at different stages of the HAZ and FZ.
Metals 13 00555 g017
Table 1. Chemical compositions of the AA5754O and ER5356 alloys (wt.%).
MaterialSiCuMgTiZnMnCrFeAl
AA5754O0.40.13.60.150.20.50.30.494
ER53560.250.14.50.20.10.20.20.494
Table 2. Main CMT welding parameters.
Welding CurrentWelding VoltageWelding SpeedWire Feed RateFiller Wire Diameter
53 A11.1 V80 mm/min3.5 mm/min1.2 mm
Table 3. Information statistics of the meso-defects in the HAZ and FZ samples under different states.
VariableStageHAZFZ
Average volume of defects/μm3Scan point 151.831002.67
Scan point 238.661168.32
Scan point 349.371218.31
Scan point 471.69
Scan point 5102.57
Number of defectsScan point 122171702
Scan point 238711970
Scan point 337182158
Scan point 44012
Scan point 54607
Defect average sphericalityScan point 10.950.84
Scan point 20.960.79
Scan point 30.950.59
Scan point 40.94
Scan point 50.92
Defect porosity/%Scan point 10.435.7
Scan point 20.556.9
Scan point 30.687.4
Scan point 41.32
Scan point 51.75
Average area of the defects/μm3Scan point 169.39550.00
Scan point 256.62634.94
Scan point 366.40660.44
Scan point 485.05
Scan point 5106.73
Disclaimer/Publisher’s Note: The statements, opinions and data contained in all publications are solely those of the individual author(s) and contributor(s) and not of MDPI and/or the editor(s). MDPI and/or the editor(s) disclaim responsibility for any injury to people or property resulting from any ideas, methods, instructions or products referred to in the content.