Article

Clustering and Precipitation during Early-Stage Artificial Aging of Al–Si–Mg(–Cu) Foundry Alloys

by
Sigurd Wenner
1,*,
Constantinos Hatzoglou
2,
Eva Anne Mørtsell
3 and
Petter Åsholt
3
1
Materials and Nanotechnology, SINTEF Industry, 7465 Trondheim, Norway
2
Department of Materials Science and Technology, Norwegian University of Science and Technology, 7034 Trondheim, Norway
3
Research and Technology Development, Hydro Aluminium, 6601 Sunndal, Norway
*
Author to whom correspondence should be addressed.
Metals 2023, 13(3), 557; https://doi.org/10.3390/met13030557
Submission received: 5 January 2023 / Revised: 15 February 2023 / Accepted: 8 March 2023 / Published: 10 March 2023

Abstract

:
High-Si aluminum foundry alloys are an important material class for products with complex 3D geometries where casting is the most suitable production method. With Mg and/or Cu additions, these alloys gain strength upon heat treatment due to the formation of nanoprecipitates. These precipitated phases are of the same kind as in the wrought Al–Mg–Si(–Cu) alloys having much lower Si contents, which have been the subject of a high number of studies. Some of these studies indicate that atomic clusters formed during storage at room temperature have a strong effect on the phases that evolve during artificial aging. In this work, foundry alloys containing Si, Mg, and Cu are investigated. Room-temperature storage is found to have a great influence on kinetics during early aging. Cu additions accelerate the formation of hardening precipitates during early aging, but 1 month of room-temperature storage negates the positive effect of Cu. The maximum achievable strength is found to be limited mainly by the solubility limits of Si and Mg at the solution heat treatment temperature. With insights derived from transmission electron microscopy and atom probe tomography results, this study contributes to the understanding of the solute balance and early aging kinetics and how wrought and foundry alloys differ in these respects.

1. Introduction

Aluminum foundry alloys are produced in large volumes for geometrically complicated products that cannot easily be manufactured by rolling or extrusion followed by forming and welding processes. The majority of aluminum foundry alloys contain 7–10% silicon, as this gives the alloy excellent castability [1]. A combination of high strength, decent elongation, and good corrosion resistance is achieved by the addition of Mg [2,3]. For elevated temperature applications, the addition of Cu is also common [4,5]. The main application of Al–Si alloys is automotive components, such as wheels, engine parts (cylinder heads, engine blocks), drivetrain parts (e.g., transmission), and various structural parts (chassis, car body) [6]. In 2019, European cars contained on average 116 kg of cast aluminum [6]. For optimizing properties such as mechanical strength and fatigue behavior, there are few possibilities to adjust processing parameters; for example, cast alloys cannot be deformed in a multitude of ways such as wrought alloys. Therefore, most of the strength and other properties must come from alloying and heat treatment.
Alloying Al–Si foundry alloys with other elements such as Mg and Cu promotes the precipitation of hardening particles during aging at 150–200 °C [7]. This increases the strength of the material while reducing ductility [8]. The types of precipitates that form are the same as those in the wrought 6xxx (Al–Mg–Si) alloy system, which has been the subject of a great deal of research [9]. Atomic clustering and precipitation are known to occur in these alloys even at room temperature [10,11,12,13,14]. This makes the storage period between solution heat treatment (SHT) or homogenization (both done at 500–600 °C) and artificial aging (AA) (done at 150–200 °C) important, as it can affect the final strength of the alloy both negatively and positively [15,16,17,18,19,20]. This phenomenon has been given focus mostly in the context of wrought Al–Mg–Si(–Cu) alloys with alloying elements Mg, Si, and Cu below or near the solubility limit.
The typical precipitation sequence in Al–Mg–Si alloys is as follows:
SSSS → clusters, pre–β′′ → β′′, disordered → β′ and other over-aging phases → β, Si
SSSS stands for supersaturated solid solution, where solutes are at substitutional positions in the Al fcc lattice after quenching from SHT. The clustering stage normally occurs during storage at room temperature (RT). The atomic clusters are broadly accepted to be branched into clusters that nucleate precipitates (pre–β′′) and clusters that do not [13,16,21,22]. The nucleating clusters have been found to have a composition with Mg/Si ≈ 1 as opposed to following the matrix composition [23,24]. This was recently confirmed with kinetic Monte Carlo simulations [25]. The non-nucleating clusters predominantly form during RT storage in dense alloys and are responsible for the negative effect on hardness after AA [10,26]. The effect has been found to be large in Mg-rich alloys, but more subtle in Si-rich alloys [15,27], which are the object of this paper. Many approaches to prevent the negative effect have been devised, for example, based on multi-step heat treatment schemes such as pre-aging [10,28,29,30] or ramping [31,32], or based on microalloying [10,28,33,34]. For example, Cu additions to Al–Mg–Si alloys can suppress the formation of non-nucleating clusters and the negative effect of RT storage on peak hardness [15,16].
In Cu-free alloys, β′′–Al2Mg5Si4 is the dominant hardening phase [35,36]. Precipitates can also assume fully or partially disordered structures at peak hardness [37], particularly in Cu-containing alloys. Over-aging can produce a plethora of phases, and the dominant phase depends heavily on the Mg/Si/Cu ratio [38,39]. All metastable precipitate phases in this alloy system are needle-shaped and grow along the <001> Al directions, making this the preferred zone axis for observing their structure with transmission electron microscopy (TEM).
The precipitation during the aging of Si-saturated Al–Si–Mg(–Cu) foundry alloys and the influence from room-temperature storage and Mg/Cu content is a subject that has seen little research. In this work, we investigate the precipitation behavior in this alloy system using atom probe tomography (APT) and scanning TEM and relate the evolution of clusters and precipitates in the alloy microstructure to the processing and the final properties.

2. Materials and Methods

Four alloys supplied by the Hydro R&D Centre at Sunndalsøra were used in this study, with measured chemical compositions listed in Table 1. The only variable elements are Mg and Cu. The content in wt.%, for instance, Mg0.45, is used for the alloy designations throughout the paper. The material was cast into cylindrical rods approximately 20 cm long and 2 cm in diameter.
The materials were subjected to the following heat treatment: SHT at 540 °C for 8 h (Cu-free alloys) or 525 °C for 10 h (Mg0.45Cu0.5) in a salt bath, followed by water quenching and storage at RT for 1 h or 28 days, before finally AA at 175 °C in a mineral oil bath for up to 3 days. The difference in SHT temperature is due to a lower eutectic temperature for the Cu-containing alloy, and therefore a lower threshold for local melting. To obtain an indirect indication of precipitation kinetics during aging, Vickers hardness (5 kg force) and electrical conductivity of the alloys were measured using a Durascan 70 (Struers Inc., Cleveland, OH, USA) and a Sigmatest 2.069 (Foerster Instruments, Pittsburgh, PA, USA), respectively. Five measurements of hardness and conductivity were obtained and averaged for each AA condition. The measurements were performed ex situ on the same pieces of material, interrupting the AA by quenching at certain times for the measurements, before resuming AA.
For scanning electron microscopy (SEM), peak hardness samples were mechanically polished, finishing with a 1 µm diamond suspension. Back-scattered images were acquired with an S3400N SEM (Hitachi Ltd., Tokyo, Japan), using an acceleration voltage of 10 kV and a working distance of 6 mm. Energy-dispersive X-ray spectroscopy (EDS) was used to identify phases.
The standard method of preparing TEM specimens of Al alloys is electropolishing. This was attempted first using a TenuPol-5 (Struers Inc., Cleveland, OH, USA). Because of the eutectic Si particles that dominate the microstructure in Al–Si foundry alloys, this does not yield evenly thin samples (see Figure 1a). In addition, the large Al grain size and random grain orientation of foundry alloys make <001> Al zone axes for TEM imaging very tedious to locate. For these reasons, an approach based on focused ion beam (FIB) liftout was used for the preparation of specimens for both APT and TEM investigations. This was performed on the electropolished samples, where the location of the eutectic Si particles is clearly visible. Helios G2 and G4 UX dual-beam instruments (Thermo Fisher Scientific, Waltham, MA, USA) were used for the preparation.
To create APT specimens, a triangular lamella was extracted from the Al matrix far from dendritic Si particles. Following the method outlined in [40], the lamella was cut into 4–6 specimens and attached to posts on a Si coupon. Each specimen was shaped into a sharp cone using the Ga+ ion beam, with the final sharpening performed with 2 kV ions. For RT-stored specimens, FIB preparation was performed after 28 days, and APT data acquisition was performed an additional 26 days after FIB preparation. In the time between FIB preparation and APT, the clusters should not develop further, as they will be at a maximum of about 50 nm away from the specimen surface, meaning that any vacancies that could assist in substitutional diffusion will instead quickly migrate to the surface [41]. FIB preparation is, however, known to generate surface vacancies and dislocation loops, which can in some cases nucleate new clusters [42]. Therefore, the results from this study or others utilizing room-temperature FIB preparation should not be directly compared to any APT measurement of electropolished specimens.
Before TEM specimen preparation, electron backscatter diffraction (EBSD) was used to map the orientations of Al grains, using an SU-6600 scanning electron microscope (Hitachi, Ltd., Tokyo, Japan). Grains with a <001> Al direction parallel to the surface were selected for cross-sectional lamella liftout to enable imaging parallel to <001> Al in the TEM. Figure 1 shows a scanning electron microscopy (SEM) image of the electropolished surface and a typical map of grain orientations. The Al grains are in the 100 µm size range. Each lamella was thinned to a suitable thickness in a 2 × 10 µm2 area, using 2 kV Ga+ ions for the final thinning.
APT was conducted for conditions in the early aging stages. For this purpose, we used a LEAP 5000 XS atom probe (CAMECA, Gennevilliers, France). The specimen temperature was set to 40 K. Laser pulse mode was applied, with a laser wavelength of 355 nm, a pulse repetition rate of 250 kHz, and a laser pulse energy of 42–89 pJ, adjusted for each specimen to have an equivalent voltage pulse fraction of 20%. The standing voltage on the specimen was adjusted such that 0.5% of the pulses lead to a detected ion. The data were reconstructed and analyzed using IVAS version 3.8.10. The voltage curve was used to estimate the evolution of the radius of curvature, assuming a detection efficiency of 80%. The image compression factor was measured by crystallographic pole indexing.
The bulk atomic composition of the acquired volumes was measured using background subtraction and complex ion decomposition. The handling of Mg/Ti peak overlap is described in the Supplementary Material [43]. The maximum separation method (MSM) [44] was used to identify clusters/precipitates and measure their size and composition. The MSM parameters were optimized to avoid the detection of artifact clusters from noise by comparison with a randomized volume containing the same number of atoms of each species [45]. For all conditions, nearest neighbor order 5 was used, with a maximum distance between neighboring Mg/Si/Cu cluster atoms of dmax = 0.80 nm and a minimum of Nmin = 20 atoms in a cluster [46]. Enveloping and erosion were applied with a depth equal to dmax [44].
Scanning TEM was performed using a double-corrected ARM-200F cold field emission gun microscope (JEOL Ltd., Tokyo, Japan) operated at 200 kV. Low-magnification images of the precipitate microstructure were obtained in low-angle annular dark field (LAADF) mode, which enhances lattice strain contrast, similarly to bright-field TEM. The convergence angle was 13 mrad, and the ADF collection angle was 16–37 mrad. The number and cross-sectional area of the rod-shaped precipitates were measured automatically from 10 images using intensity thresholding in ImageJ version 1.52a after appropriate filtering. The lengths of the precipitates were measured manually on the images. The measured number density was corrected for precipitates partially present inside the imaged volume (having contact with the specimen surfaces and being cut during FIB preparation) [47].
High-magnification images of individual precipitates were obtained in high-angle annular dark field (HAADF) mode, which enables the distinction of atomic columns based on atomic number (in particular, Cu vs. Al/Mg/Si). In this case, the convergence angle was 27 mrad, and the ADF collection angle was 69–273 mrad. Images were corrected for shear distortions caused by sample drift, and Gauss filtered to improve visibility. Lastly, EDS using a JEOL Centurio silicon drift detector was used to measure alloying element concentrations close to eutectic Si particles.

3. Results

3.1. Artificial Aging Kinetics

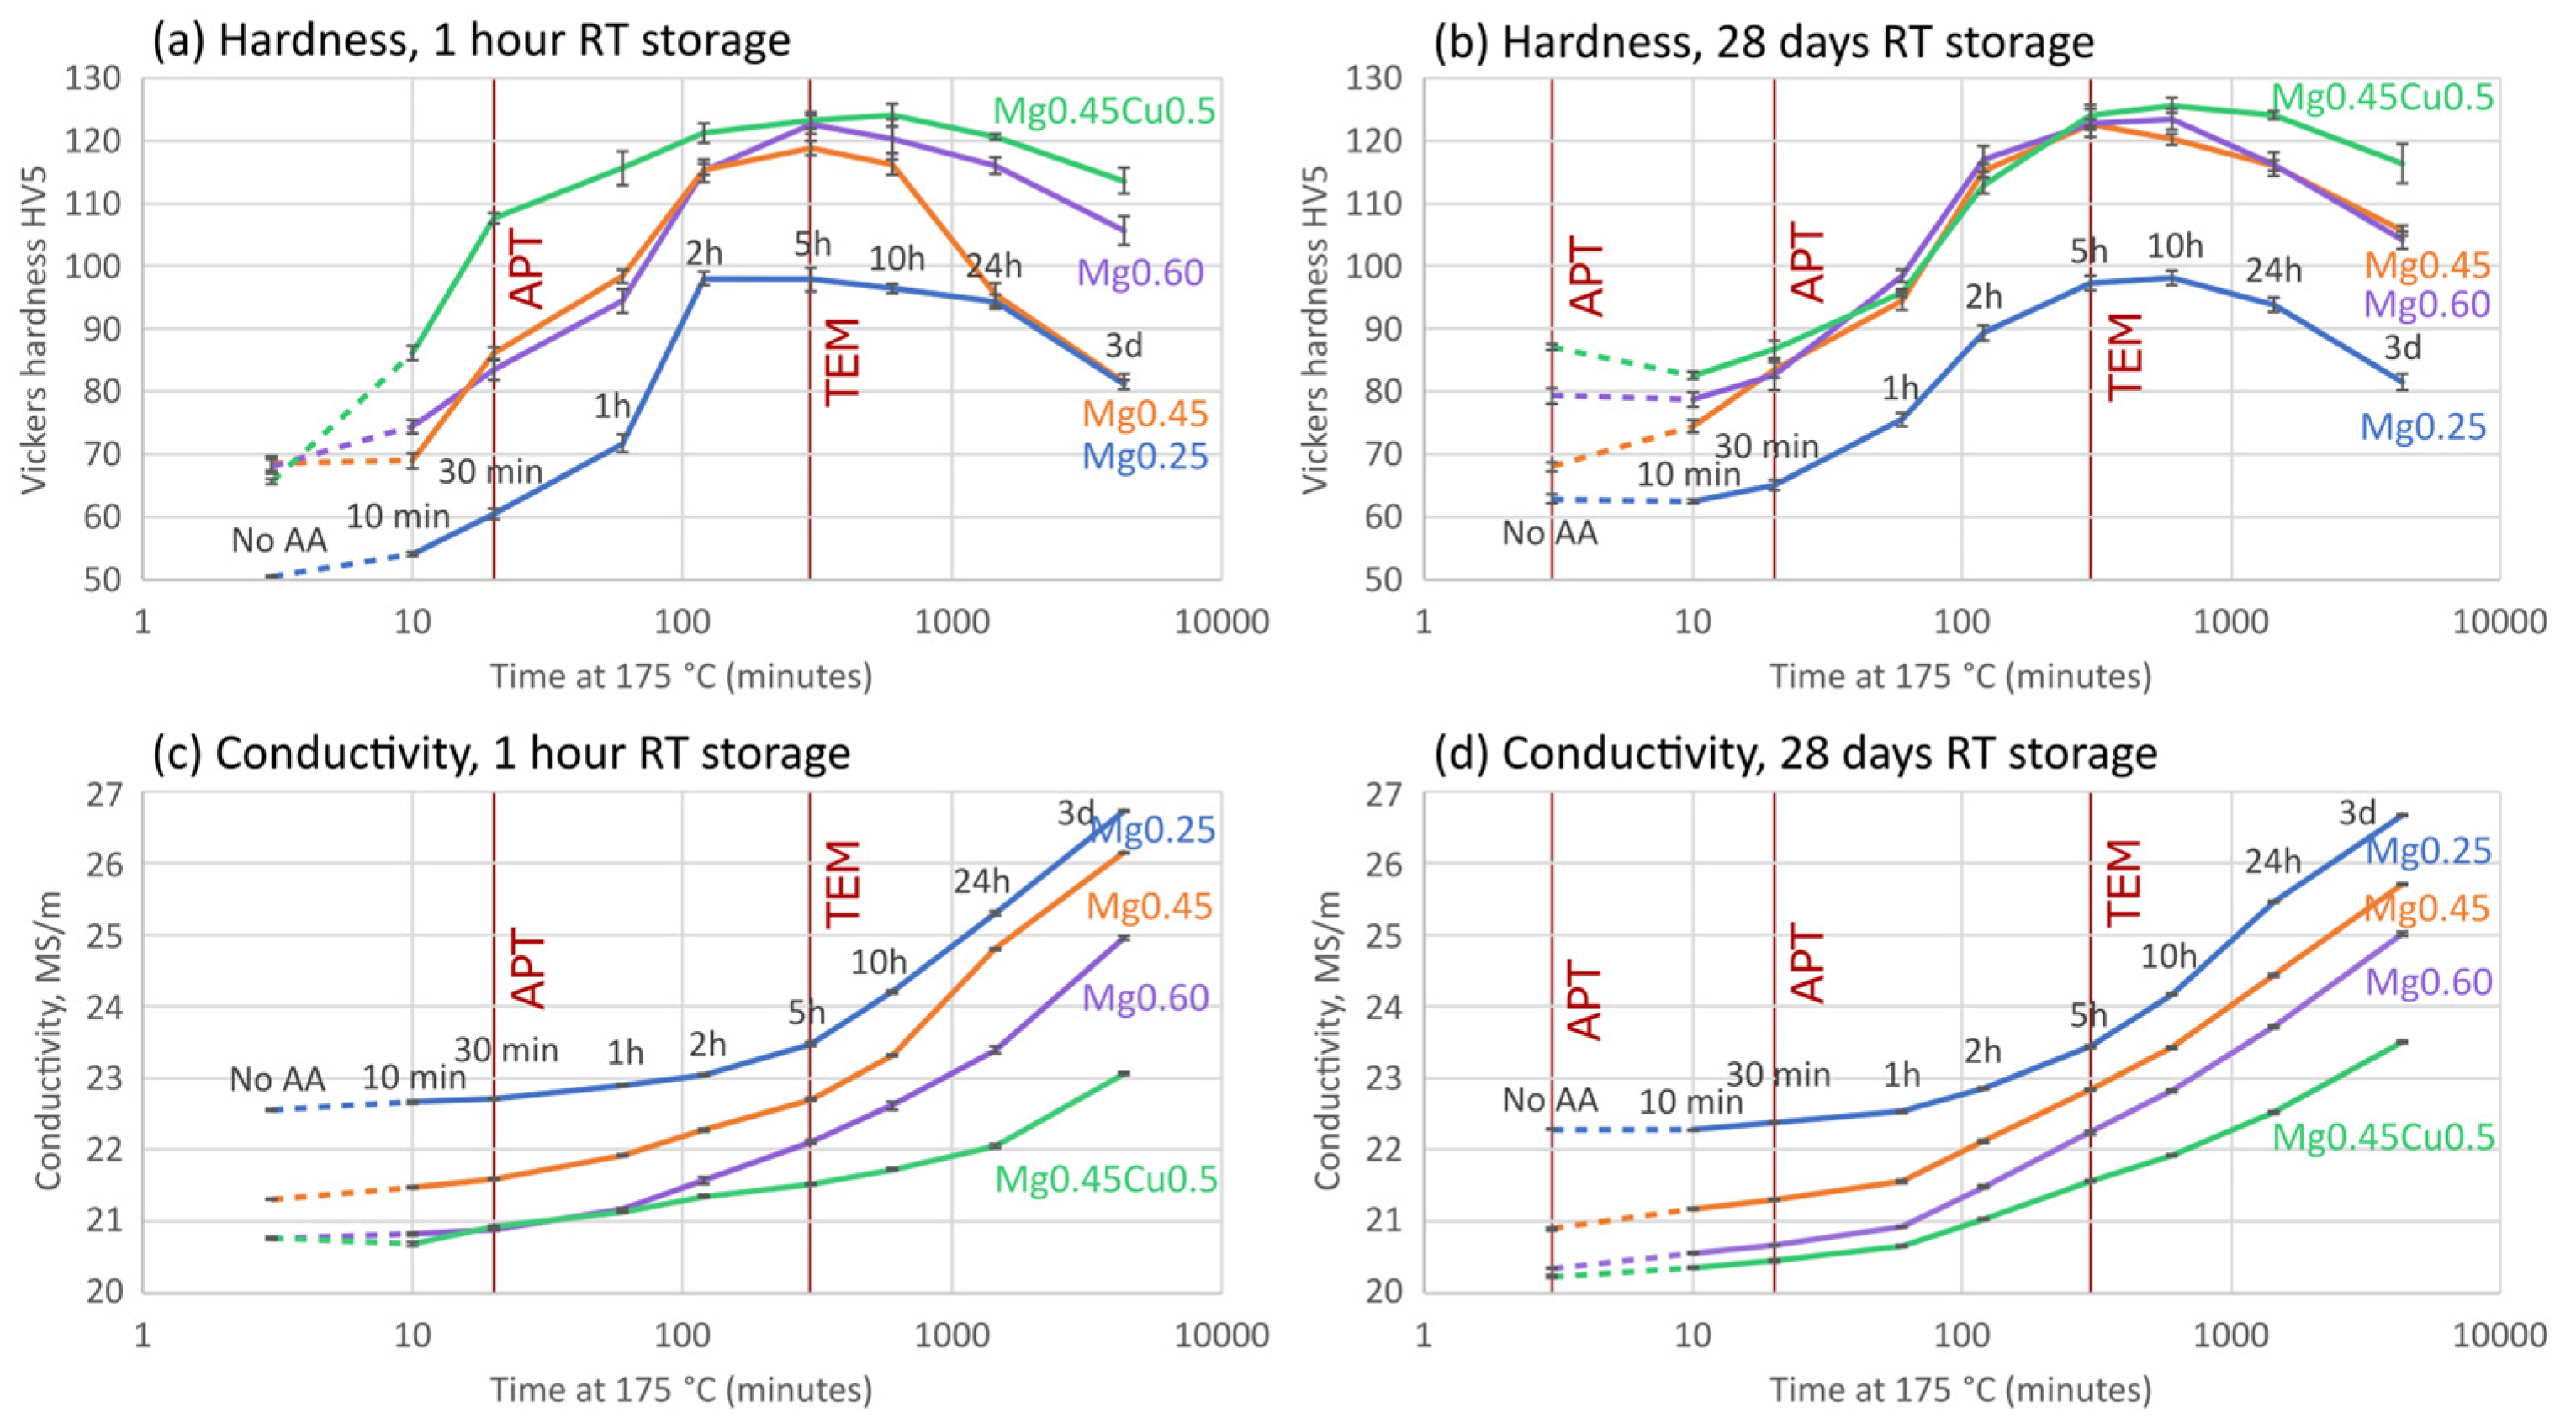
Figure 2 shows the hardness and conductivity of the four alloys, in the course of artificial aging, with 1 h (a,c) or 28 days (b,d) of RT storage between SHT and AA. When the three Cu-free alloys are compared, it can be seen that the conductivity monotonously decreases with the amount of Mg in the alloy composition. The age hardening response up to peak hardness (around 5 h AA) improves significantly from 0.25% to 0.45% Mg. Increasing the Mg level further has little effect on hardness up to peak hardness, but seems to increase thermostability during over-aging. Long RT storage delays kinetics during AA and shifts the peak hardness conditions to slightly longer AA times. Alloy Mg0.45 has an unexpected improvement in over-aging behavior from 1 h to 28 days NA. The mentioned delayed kinetics may contribute to part of the improvement, but a random error might also influence the results, such as a higher concentration of Si particles locally.
Alloy Mg0.45Cu0.5 is observed to exhibit an even lower and slower rising conductivity during AA than Mg0.60, owing to the coarsening resistance of Cu-containing alloys [48]. From the hardness curves, we see a quick initial hardness increase for Mg0.45Cu0.5 with 1 h room-temperature storage between SHT and AA. This quick increase disappears when the alloy has been stored for 28 days after SHT. Instead, the alloy starts off at a high hardness after the room-temperature storage, and the hardness dips down before increasing again. This is the overall greatest change in precipitation kinetics we observe when including long room-temperature storage in the process. The copper-added alloy also shows the best thermostability during over-aging, as found before in a similar set of alloys [49]. In the following investigations, emphasis is put on explaining the early AA behavior of the two alloys Mg0.45(Cu0.5) in terms of atomic clustering and precipitation, as well as comparing their peak hardness microstructure with Mg0.25 and Mg0.60. The filled symbols and vertical lines in Figure 2 show which conditions were selected for APT and TEM measurements of clustering/precipitation.

3.2. Microstructure Overview

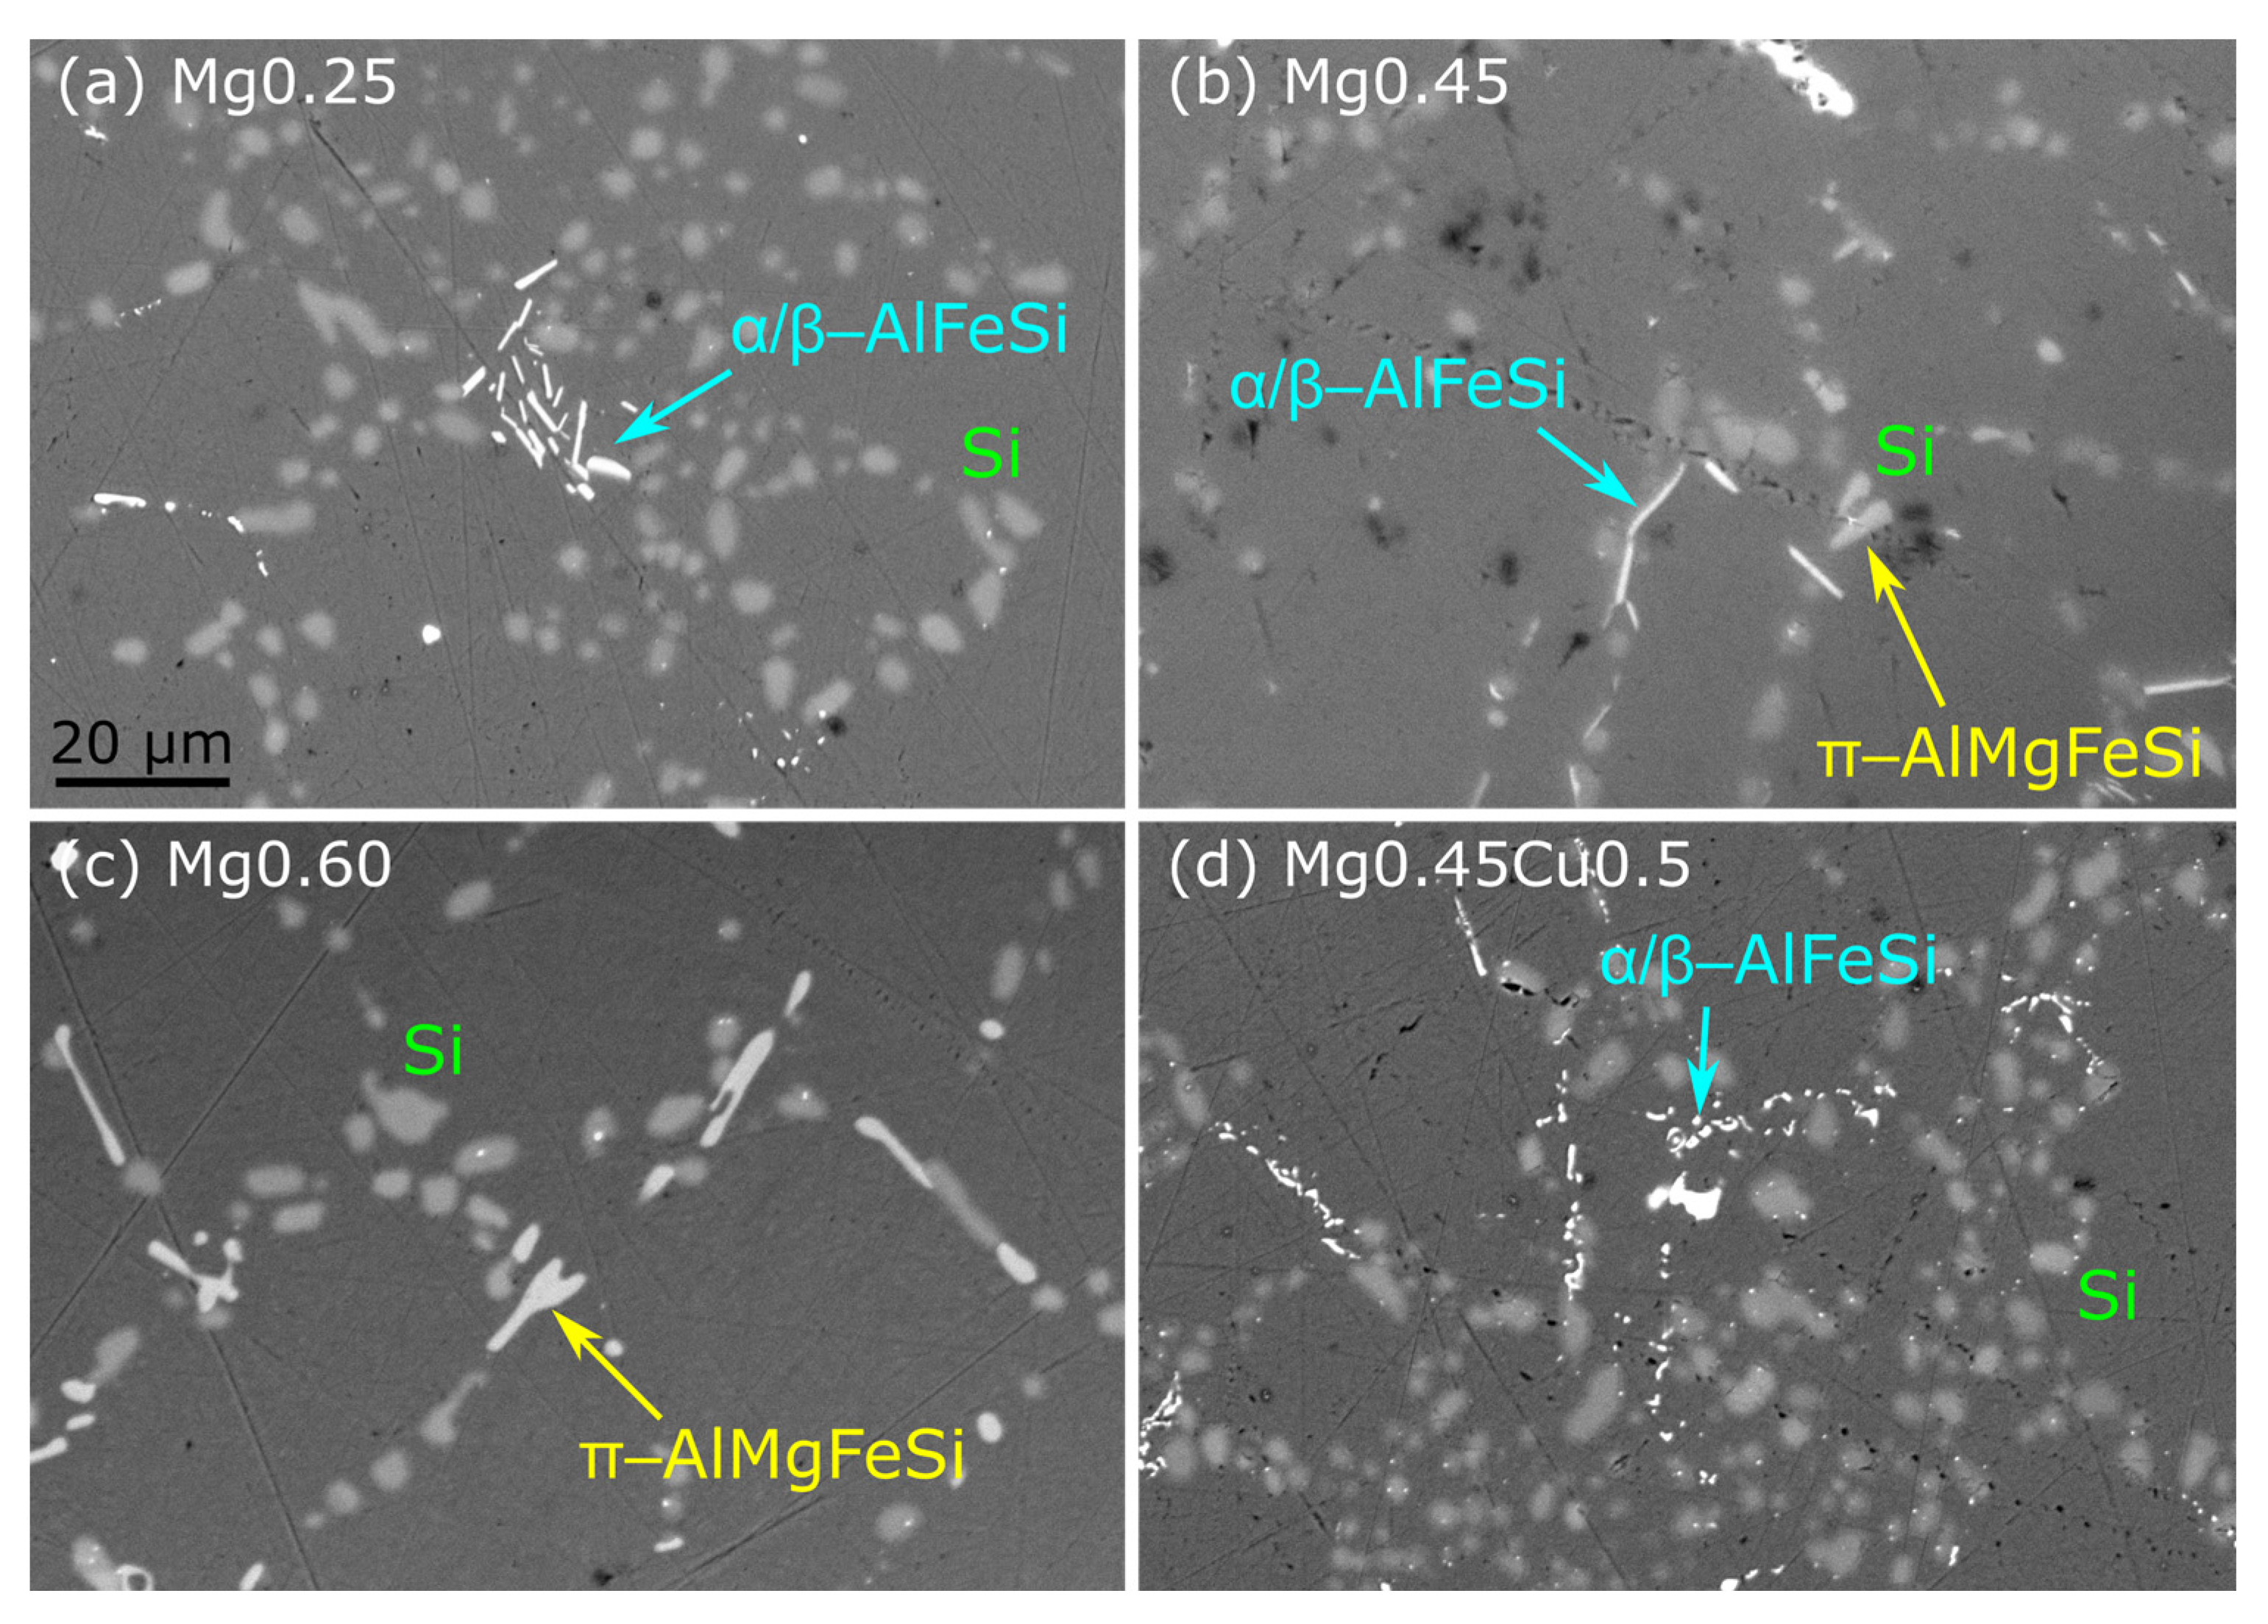
To observe how chemical elements are utilized at the micrometer scale, SEM images were acquired from the peak aged conditions, as seen in Figure 3. Phases were identified using EDS and were subsequently easy to classify due to differences in shape and atomic number contrast. As seen previously in Figure 1, the microstructure is dominated by eutectic Si particles that have been rounded in the course of homogenization/SHT. The brighter particles are Fe-containing, in most cases α or β phases. We do not distinguish these as they contain the same elements and are not relevant to the later characterization. However, as more Mg is added to the alloy, the π phase appears, which locks in some Mg, that cannot be used to form precipitates. The effect of this will be evaluated in Section 4. No Cu-containing phases were observed, and no β–Mg2Si was observed. In alloy Mg0.45Cu0.5, which is slightly enriched in Mn, a few dispersoid-sized α particles are observed.

3.3. Early-Stage Precipitation

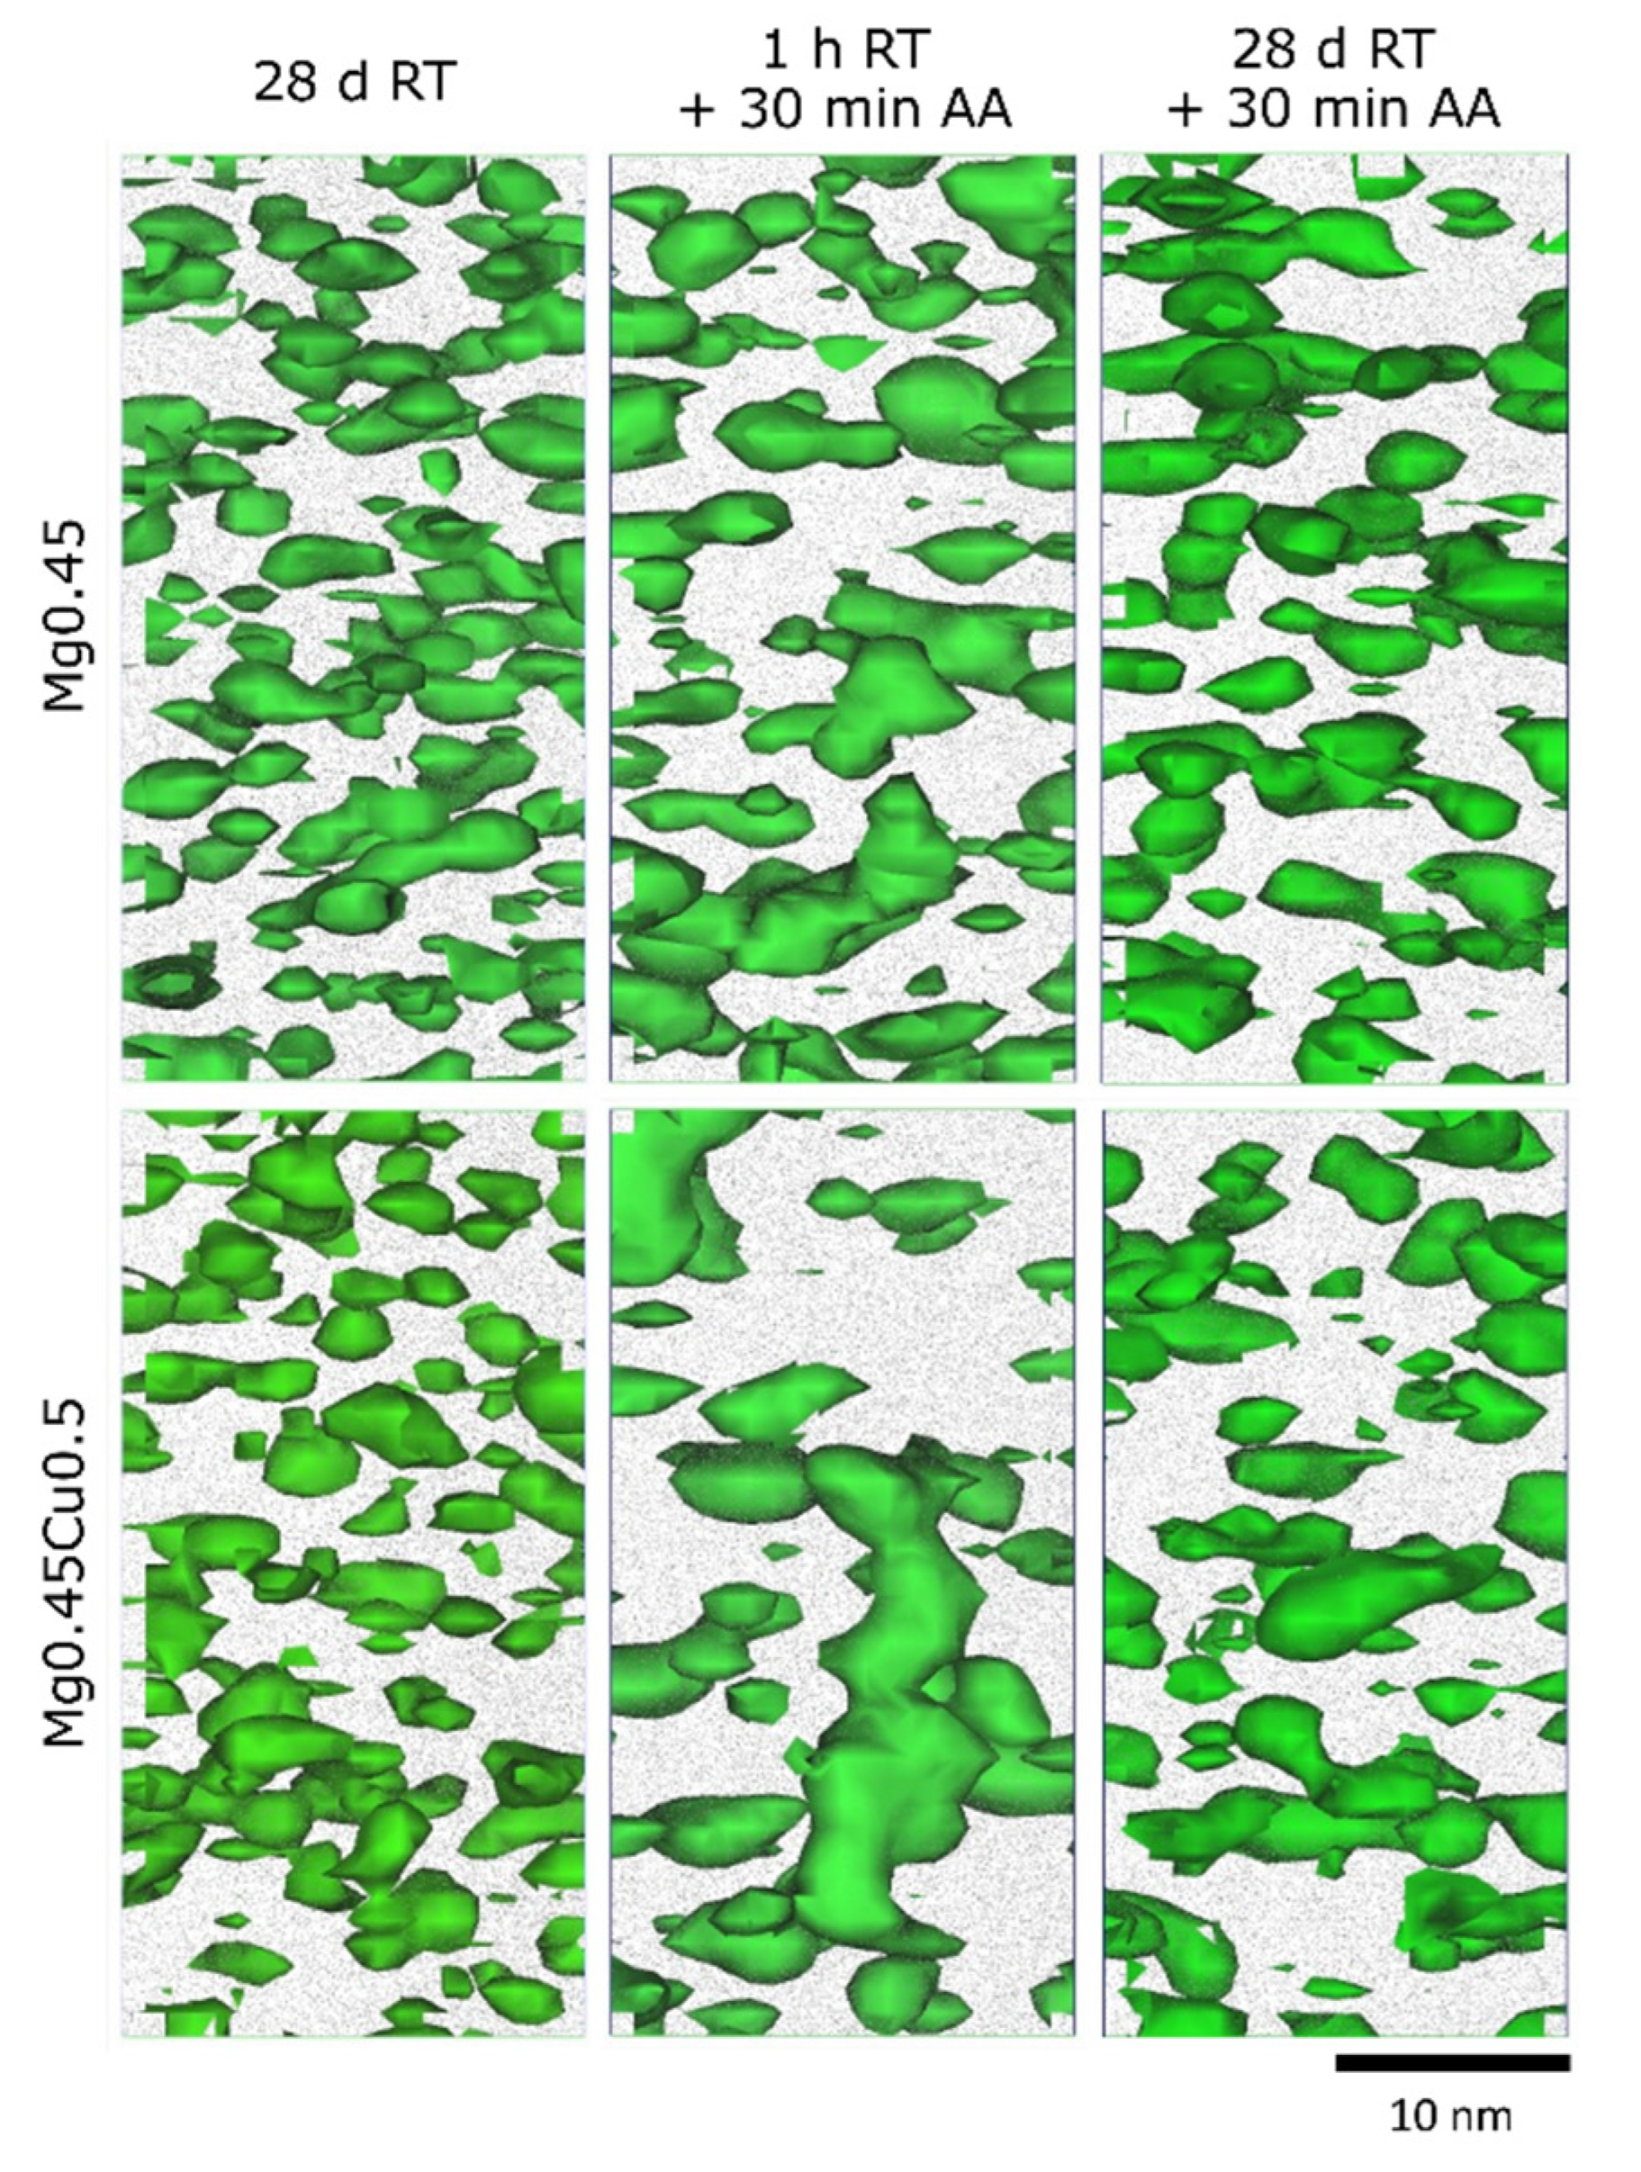
We start our characterization at the beginning of the precipitation sequence, namely the clusters formed during RT storage and early AA. Figure 4 shows equally sized subvolumes from the APT datasets acquired for alloys Mg0.45(Cu0.5) after 28 days of RT and/or 30 min of 175 °C, displaying 1.5% Mg isosurface. Clusters appear larger on average in the AA condition, and some, especially in Mg0.45Cu0.5 AA, are elongated, meaning that precipitation of coherent, needle-shaped phases has begun. Many of the clusters are small and difficult to discern from the Al matrix, particularly in the RT conditions. Isosurfaces work well for visualization, but not for quantitative measurements, which mandates the use of a cluster detection algorithm.
Table 2 gives the bulk compositions of the six APT volumes. The concentrations of Mg and Cu are consistent between volumes. The Ti content is reduced in the 28 days at RT volumes. The reason for this deviation is probably not related to aging treatment, but to an uneven distribution of Ti on scales greater than the APT volumes, caused by the segregation of Ti during solidification of the dendrites. More importantly, the concentration of Si is systematically lower (−14% on average) in Mg0.45Cu0.5 than in Mg0.45, which will certainly affect precipitation. The average Mg/Si ratio in the interdendritic zone is 0.62 for Mg0.45 and 0.71 for Mg0.45Cu0.5.
The results of MSM cluster analysis on the six volumes are presented in Table 3. Values are given as averages over all identified clusters. As seen in the standard deviations (in parentheses), the distributions of the measured values are broad. The variation in the averages between the conditions are however of sufficient magnitude that some trends can be discerned. These are best seen in Figure 5, where average cluster compositions and sizes are shown. Starting with the RT storage conditions, clusters are small, and Cu addition only has the effect of substituting clustered Mg and Si with Cu and Al. For the AA conditions, Mg0.45 has an average Mg/Si ratio of 0.8, while its Cu-containing equivalent has 1.0, concurrent with larger and more developed clusters.
When the samples are stored for 28 days before AA, the situation changes, with smaller particles in both alloys, with Mg0.45Cu0.5 showing the largest decrease. This seems to be due to the lack of elongated particles (precipitates), thus a less developed state. At the same time, the average Mg/Si ratio in clusters changes significantly to make the Mg/Si ratios of both conditions approximately 0.9. The Si content in clusters does not seem affected by RT storage time. With all conditions having an average cluster composition that is more Mg-rich than the bulk material, the Mg/Si ratio of the surrounding matrix increases slightly. The solute inside clusters only constitutes 15–30% of the total solute in the bulk, meaning most is left in the Al matrix.

3.4. Precipitation at Peak Hardness

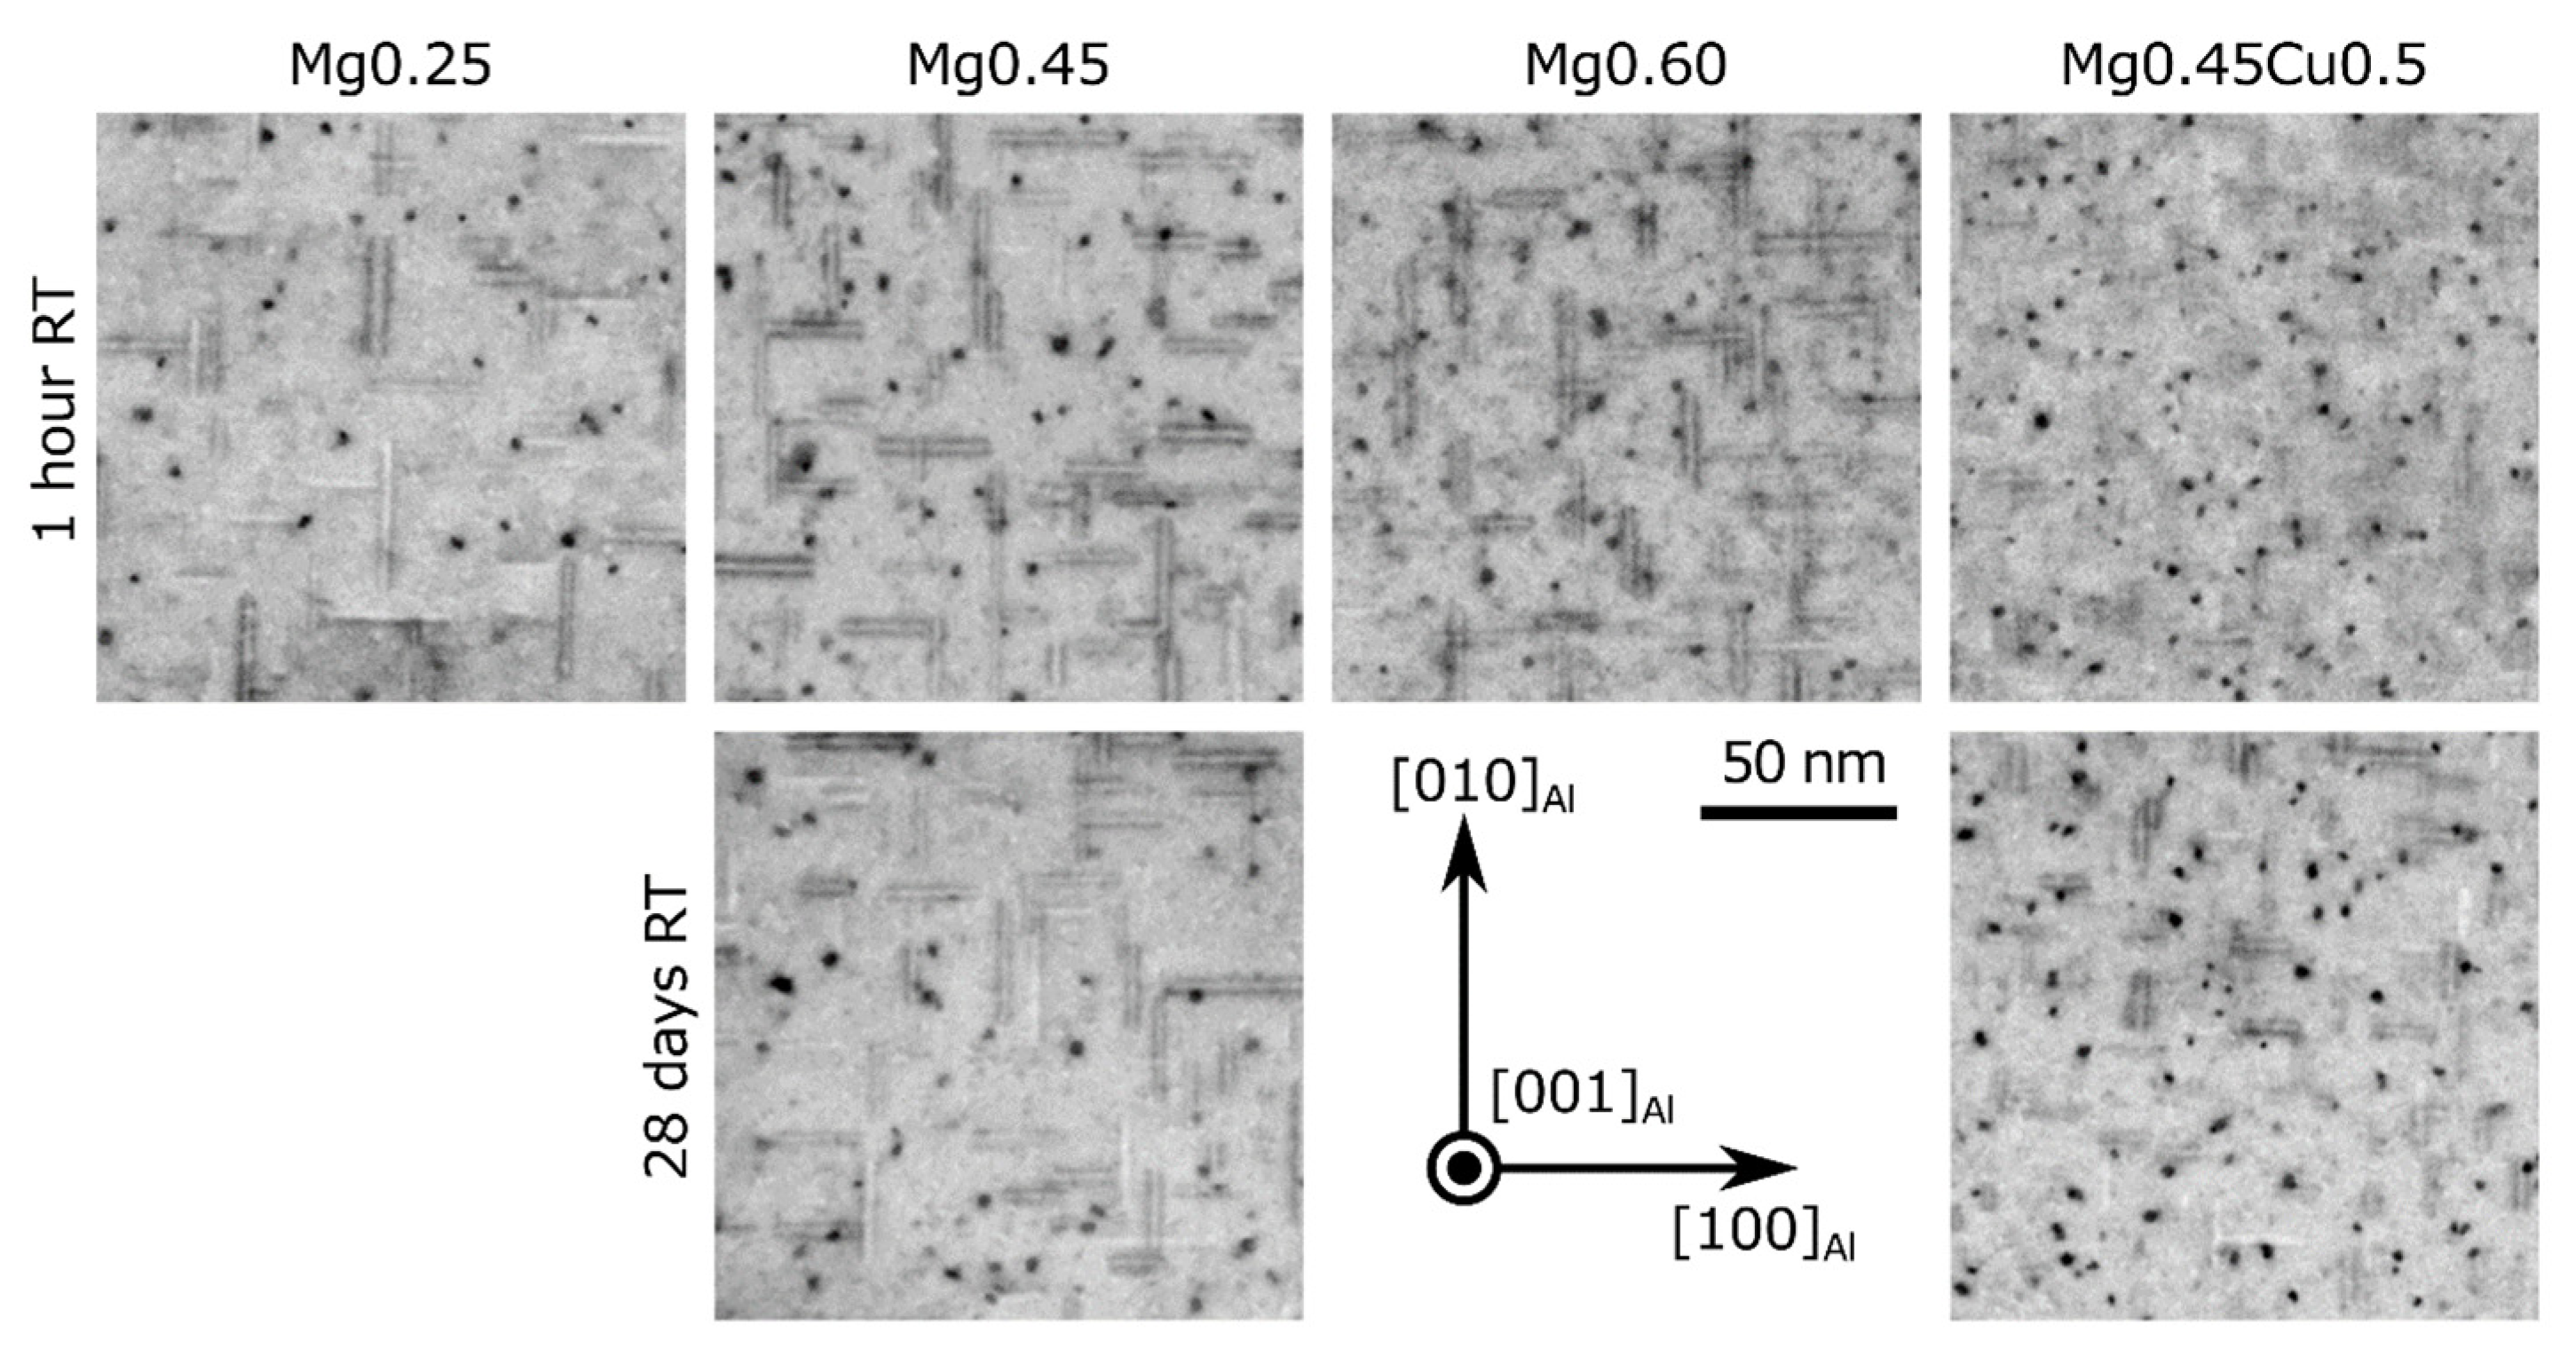
Figure 6 shows LAADF-STEM images from all four alloys at peak hardness (5 h at 175 °C), for 1 h and 28 days of RT storage before AA. The images are Gauss filtered and inverted in contrast for visibility. Needle-shaped precipitates growing along [001]Al appear as dark dots, while precipitates growing along [100]Al and [010]Al appear as lines with double interface strain contrast. The images are acquired for areas with similar specimen thicknesses. It is clear that the precipitate density at peak hardness increases when the Mg content is changed from 0.25% to 0.45%. Additions of Cu also produce more numerous and shorter precipitates, to the point where they become difficult to discern from the surrounding matrix. Small Si plates are known to sometimes precipitate in high-Si alloys [49,50] but were not observed in this study. Beyond these observations, quantitative results are required for revealing more subtle variations.
The density and average dimensions of precipitates were quantified according to the procedure outlined in Section 2. The results are shown in Table 4. The initial observations from the LAADF-STEM images are supported, and in addition, we see that there is little change from Mg0.45 to Mg0.60 apart from precipitates growing longer. Twenty-eight days of RT storage is seen to reduce the precipitate density in the alloys, and most severely for the Cu-containing alloy. This correlates with slower kinetics during AA after RT storage, as shown by the hardness curves.
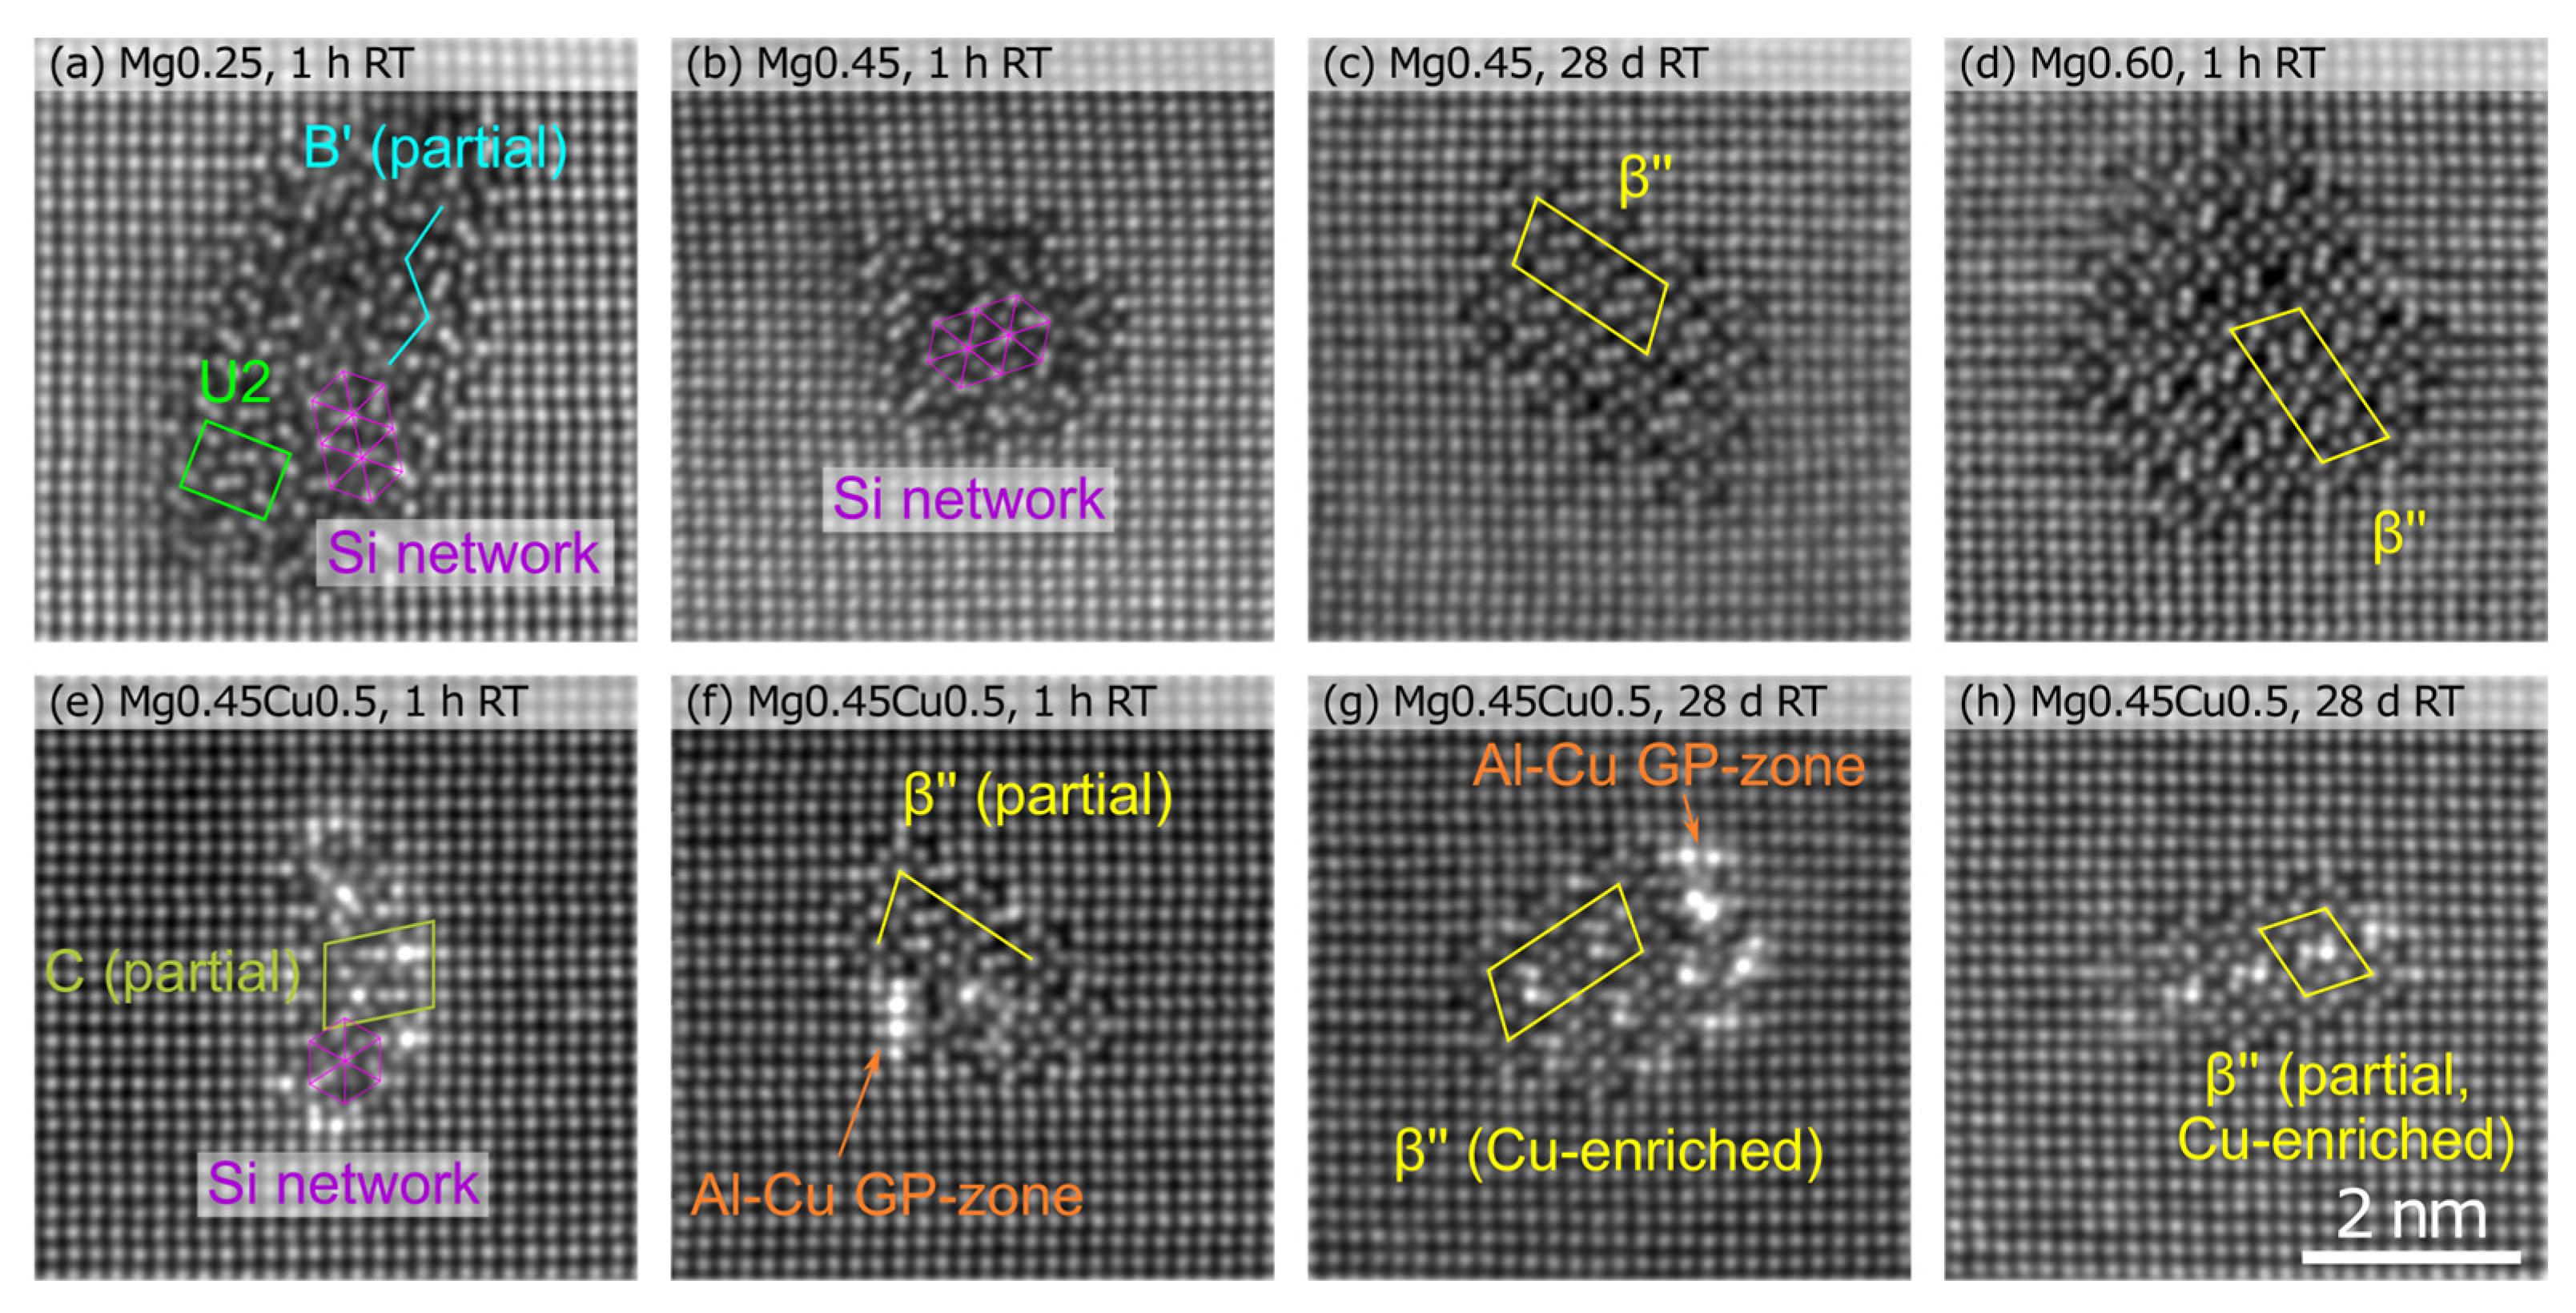
Aberration-corrected HAADF-STEM images of example precipitate cross-sections are shown in Figure 7, with unit cells of known phases overlaid. The Cu-free alloys mostly host the β′′–Al2Mg5Si4 phase [35,36], as also found in a similar alloy by Zhou et al. [5]. In addition, partially disordered phases hosting the projected hexagonal Si-network [37] are present in precipitates with more rounded cross-sections. The selected images do not reflect systematic changes in precipitate structure with Mg content. In fact, no change other than the slight effect on average precipitate dimensions was observed.
Alloy Mg0.45Cu0.5 hosts precipitates containing Cu-rich columns, which appear bright in HAADF-STEM images. The same types of precipitates are found here: β′′ and disordered variants. In addition, there are fragments of phases from the Al–Mg–Si–Cu system such as Q’ and C [38] observed in Figure 7e and Cu walls/Al-Cu GP-zones [51] observed in Figure 7f,g. The structures appear very similar to earlier images from a similar alloy and treatment [49].

3.5. Influence of Eutectic Si Particles

From Figure 1a, we see that the microstructure of the alloys is inhomogeneous on a scale of tens of micrometers (smaller than the size of Al grains). The APT and TEM results that have been presented so far were from volumes well inside Al grains, and it remains to be seen whether the clustering and precipitation behavior is affected by nearby eutectic Si particles.
To investigate the influence of Si particles, a TEM sample was made that contains parts of a Si particle and its interface with an Al grain. An EDS map was acquired across the interface and is presented in Figure 8. Precipitates in the Al matrix are visible in the Mg map in Figure 8d, except within the first 50 nm or so from the interface. The concentration profile in Figure 8e shows that Mg is depleted and Si is enriched close to the Si particle, but the concentration stabilizes to a bulk level around 80 nm from the interface. This is comparable to typical precipitate-free zones around grain boundaries in Al–Mg–Si alloys [52]. The density of precipitates was also evaluated qualitatively at various distances from Si particles (see Supplementary Material [43]), and no apparent differences were found from the areas investigated so far, which are typically 5–10 µm away from the nearest Si particles.

4. Discussion

4.1. Solute Balance

The high-Si class of Al alloys has the property of the solid material being primarily split into two phases during SHT: Si particles and the Al matrix containing dissolved Si together with the other alloying elements. Heat treatments can change the morphology of Si particles from the eutectic microstructure found in this study to more finely dispersed particles. A study using similar alloys as in this work saw Si precipitated as nanosized plates in the Al matrix [49]. The lack of such particles in our materials is most likely a consequence of our billets being significantly smaller, which leads to faster solidification, and also faster cooling from SHT. The cooling rate from high-temperature treatments, as well as cold working to introduce dislocations, greatly affects the precipitation of secondary Si [8,53,54]. With aging done for a longer time or at a higher temperature, it is likely that we would see Si precipitating from the matrix, nucleated by the hardening precipitates.
The long SHT applied for these alloys have the effect of rounding the Si particles, which increases ductility, with possible reductions in strength due to Mg diffusing to pores and other defects in the material [55]. The latter does not seem to be the case here, as the Mg level inside the Al grains in Mg0.45(Cu0.5) measured by APT was actually 10–20% higher than the bulk OES measurement. Part of the explanation for this discrepancy is that the Si particles, constituting a significant volume fraction, do not contain Mg.
During SHT, the eutectic Si particles will act as a solute reservoir, keeping the Si concentration in the Al matrix at the solubility limit. Temperature has a drastic effect on solubility. The solubility of Si is around 1.10 at.% for pure Al–Si alloys at 540 °C, and 0.95 at.% at 525 °C [56]. Slight reductions in solubility are also expected when adding ternary and quaternary elements. From Table 2, we see that Mg0.45 has more Si available inside the Al grains than its Cu-containing variant, which can be explained by the different SHT temperatures (540 °C and 525 °C, respectively). While Cu is expected to increase the hardness of Al–Si–Mg alloys, the reduction in Si concentration inside Al grains counteracts the effect, which leaves the hardness of Mg0.45Cu0.5 at the same level as Mg0.45.
The high amount of Si in the alloy also limits the amount of Mg that can be present in the solution during SHT and therefore used for precipitation. For instance, the solubility of Mg in Al containing 10 at.% Si is about 0.45 at.% Mg at 525 °C [57,58]. In Figure 3, we see that this results in a significant amount of π–Al8Mg3FeSi6 phase [59] inside alloy Mg0.60. The resulting loss of Mg from the Al grains explains the peak hardness of Mg0.60 not being higher than that of Mg0.45. The π phase has been reported to dissolve during AA treatment of foundry alloys [60,61], but this does not occur with Mg0.45 and Mg0.60, at least not completely. Considerations like these must be taken into account when designing high-strength wrought alloys that operate on the boundaries of solubility of precipitate-forming elements.

4.2. Aging Response

Cu additions are known to strengthen Al–Mg–Si alloys by producing a finer microstructure of precipitate particles. The mechanism behind this is that Cu stabilizes precipitate-nucleating clusters [30]. We indeed measure a 2-fold increase in the precipitate density from Mg0.45 to Mg0.45Cu0.5 after 5 h at 175 °C. However, the precipitates are also shorter on average, and this leads to the peak hardness being unchanged. Raising the Mg content from 0.45 to 0.60 wt.% has the opposite effect of producing fewer, longer precipitates, again ending up at the same peak hardness, since longer precipitates cover a greater number of planes which gliding dislocations can inhabit, and are thus more efficient at preventing deformation. Alloy Mg0.60 did, however, show an increased thermostability during over-aging. The longer precipitates might be more stable and easier to transform into more developed phases during over-aging rather than dissolving.
During the early stages of AA at 175 °C, Cu additions accelerate the precipitation process. This is seen both in the hardness curve (Figure 2a) and in the APT datasets, where elongated precipitates quickly form (Figure 4). These are smaller versions of the β′′ and disordered precipitates seen at peak hardness (Figure 7e,f). The clusters/precipitates also have a compositional ratio of Mg/Si = 1, which is close to the ratio of β′′ [62]. This ratio can be used as a measure of how developed the microstructure is, in accordance with results on cluster composition and hardening response [29].
Extending the RT storage time before AA from 1 h to 28 days gives clusters a good time to form and become stable. These do not necessarily develop directly into precipitates, but rather have to be dissolved before the solute can be spent to form actual precipitate nuclei. From APT, the Mg/Si ratio of clusters is seen to approach 1 slowly as clusters are dissolved and precipitates are formed. This process takes time, and it delays AA kinetics for all four alloys. This negative effect completely negates the accelerated AA achieved by adding Cu. Although Cu is a great catalyst for clustering and precipitation [27,63,64], it may also create stable clusters at RT that slow down subsequent AA, such that the negative effect of RT storage becomes stronger in Cu-added alloys. This is demonstrated by the hardness decreasing at the very start of AA, when the clusters dissolve before the solute is re-used for ordered precipitates. This effect may be unique to Si-rich Cu-containing alloys. In any case, what interests the scientific community most is the final peak hardness, and here Cu is often touted as a remedy against the negative RT storage effect [15,16].
The cluster number densities in Table 3 seemingly do not correspond to the strength of the material. Instead, the volume fraction of clusters (fraction of clustered atoms) corresponds well to measured hardness. During the analyzed stages, clusters transform into ordered precipitates that are efficient at stopping dislocations because of their elongated shape (and therefore greater size). This is analogous to the mentioned strengthening by adding Mg to the alloy and the following lengthening of precipitates. Of course, a single parameter such as total precipitate length per volume can never give the full story, as exemplified by Mg0.45Cu0.5 at peak hardness. Here, both density and length decrease significantly with RT storage time without affecting hardness, suggesting that the microstructure is saturated, i.e., the critical spacing between precipitates for optimal dislocation pinning [65] is already reached. The number densities in the peak hardness condition are indeed greater than those found in corresponding wrought alloys with the same Mg content [66]. Due to the small size of the obstacles (about 3 nm in rod thickness), precipitate shearing is the dominant mode of dislocation bypassing [65,67,68,69], which greatly influences the fracture mechanics of the material [69].
During over-aging, the precipitate structures seen in Figure 7 would change into larger, more ordered structures accompanied by strength loss. Several phases can form, such as β′, U1, and U2, depending on the Mg/Si ratio [38,70]. In the Cu-containing alloy, the microstructure will probably be dominated by the Q’ phase [71]. Coarsening happens more slowly in the Cu-added alloy, as evidenced by the very slowly increasing conductivity at long AA times.

5. Conclusions

High-Si foundry alloys with varying Mg and Cu additions were studied in a context of solute clustering during room-temperature storage and how this influences precipitate strengthening during artificial aging. Since foundry alloy products give little room for playing with factors such as deformation, strength increases must be achieved through alloying and heat treatments alone. Here, the effects of keeping the material for 1 h or 28 days at room temperature between SHT and AA were investigated.
The precipitation kinetics of the Al–Si–Mg alloys were slightly delayed with room-temperature storage. However, the greatest effect was seen in the Al–Si–Mg–Cu alloy, where rapid early-stage kinetics were suppressed. This correlates with a larger and more developed precipitate microstructure in early aging stages with short RT storage (1 h) than with long RT storage (28 days). At peak hardness, this is seen to develop into a higher number density of hardening precipitates when the RT storage is short. The negative effect of RT storage is explained by the formation of stable clusters that must be dissolved during AA, delaying the age hardening process. However, the different durations of RT storage result in similar peak hardness values.
Eutectic Si particles have little effect on the precipitation kinetics other than providing a reservoir of Si during SHT. A solute-depleted zone was present near the interface with a Si particle, but 100 nm away from the particle, the precipitate microstructure had the same characteristics as the middle of the interdendritic zone. Thus, the precipitation kinetics in a high-Si foundry alloy can be expected to be similar to that of a wrought alloy, given the same composition in the Al matrix at SHT temperature.
We have seen that Al–Si–Mg(–Cu) foundry alloys can be strongly affected by RT storage after SHT in under-aged states. For the alloys studied here, the differences even out at peak hardness, which is usually the state of a finished product. However, this may not be the case in all classes of Al foundry alloys, and other material properties may also be influenced by RT storage time, such as ductility, fatigue, and creep, which have not been characterized in this work.

Supplementary Materials

The Supplementary Materials information can be downloaded at: https://www.mdpi.com/article/10.3390/met13030557/s1, Reference [43] is cited in the supplementary materials.

Author Contributions

S.W., E.A.M. and P.Å. contributed to the study conception and design. Material preparation and data collection were performed by S.W. Analysis was performed by C.H. and S.W. The first draft of the manuscript was written by S.W. and all authors commented on previous versions of the manuscript. All authors have read and agreed to the published version of the manuscript.

Funding

This work was supported by the The Research Council of Norway (RCN), Hydro Aluminium, Benteler Automotive Raufoss, and Neuman Aluminium through the project SumAl (RCN grant 294933). The FIB work was performed within the Norwegian Micro- and Nano-Fabrication Facility, NorFab (RCN grant 245963/F50). The TEM work was carried out at the NORTEM (RCN grant 197405) infrastructure at the TEM Gemini Centre, Trondheim, Norway. RCN is acknowledged for funding the NTNU atom probe facility through the Norwegian Laboratory for Mineral and Materials Characterization (MiMaC) (RCN grant 269842).

Institutional Review Board Statement

Not applicable.

Informed Consent Statement

Not applicable.

Data Availability Statement

The data used in this study are available in repositories at Zenodo: https://doi.org/10.5281/zenodo.5769942 (accessed on 4 January 2023) and https://doi.org/10.5281/zenodo.6358592 (accessed on 4 January 2023).

Conflicts of Interest

The authors have no relevant financial or non-financial interests to disclose.

References

  1. Di Sabatino, M.; Arnberg, L. Castability of Aluminium Alloys. Trans. Indian Inst. Met. 2010, 62, 321–325. [Google Scholar] [CrossRef]
  2. Yıldırım, M.; Özyürek, D. The Effect of Mg Amount on the Microstructure and Mechanical Properties of Al-Si-Mg Alloy. Mater. Des. 2013, 51, 767–774. [Google Scholar] [CrossRef]
  3. Triyono, T.; Surojo, E.; Utomo, V.T. Analysis of the Effect of Magnesium Addition on Al-Si Alloy Using Stirr Casting Method on Physical and Mechanical Properties. AIP Conf. Proc. 2020, 2217, 030177. [Google Scholar] [CrossRef]
  4. Dong, X.; Amirkhanlou, S.; Ji, S. Formation of Strength Platform in Cast Al–Si–Mg–Cu Alloys. Sci. Rep. 2019, 9, 9582. [Google Scholar] [CrossRef] [Green Version]
  5. Zhou, P.; Wang, D.; Nagaumi, H.; Wang, R.; Zhang, X.; Li, X.; Zhang, H.; Zhang, B. Microstructural Evolution and Mechanical Properties of Al-Si-Mg-Cu Cast Alloys with Different Cu Contents. Metals 2023, 13, 98. [Google Scholar] [CrossRef]
  6. DuckerFrontier. Aluminium Content in European Passenger Cars; European Aluminium: Brussels, Belgium, 2019. [Google Scholar]
  7. Stadler, F.; Antrekowitsch, H.; Fragner, W.; Kaufmann, H.; Uggowitzer, P.J. Effect of Main Alloying Elements on Strength of Al–Si Foundry Alloys at Elevated Temperatures. Int. J. Cast Met. Res. 2012, 25, 215–224. [Google Scholar] [CrossRef]
  8. Pedersen, L.; Arnberg, L. The Effect of Solution Heat Treatment and Quenching Rates on Mechanical Properties and Microstructures in AlSiMg Foundry Alloys. Metall. Mater. Trans. A 2001, 32, 525–532. [Google Scholar] [CrossRef]
  9. Andersen, S.J.; Marioara, C.D.; Friis, J.; Wenner, S.; Holmestad, R. Precipitates in Aluminium Alloys. Adv. Phys. X 2018, 3, 1479984. [Google Scholar] [CrossRef]
  10. Dumitraschkewitz, P.; Gerstl, S.S.A.; Stephenson, L.T.; Uggowitzer, P.J.; Pogatscher, S. Clustering in Age-Hardenable Aluminum Alloys. Adv. Eng. Mater. 2018, 20, 1800255. [Google Scholar] [CrossRef] [Green Version]
  11. Banhart, J.; Lay, M.D.H.; Chang, C.S.T.; Hill, A.J. Kinetics of Natural Aging in Al-Mg-Si Alloys Studied by Positron Annihilation Lifetime Spectroscopy. Phys. Rev. B 2011, 83, 014101. [Google Scholar] [CrossRef] [Green Version]
  12. Edwards, G.A.; Stiller, K.; Dunlop, G.L.; Couper, M.J. The Precipitation Sequence in Al–Mg–Si Alloys. Acta Mater. 1998, 46, 3893–3904. [Google Scholar] [CrossRef]
  13. Murayama, M.; Hono, K. Pre-Precipitate Clusters and Precipitation Processes in Al–Mg–Si Alloys. Acta Mater. 1999, 47, 1537–1548. [Google Scholar] [CrossRef]
  14. Cao, L.; Rometsch, P.A.; Couper, M.J. Clustering Behaviour in an Al–Mg–Si–Cu Alloy during Natural Ageing and Subsequent under-Ageing. Mater. Sci. Eng. A 2013, 559, 257–261. [Google Scholar] [CrossRef]
  15. Wenner, S.; Marioara, C.D.; Andersen, S.J.; Holmestad, R. Effect of Room Temperature Storage Time on Precipitation in Al–Mg–Si(–Cu) Alloys with Different Mg/Si Ratios. Int. J. Mater. Res. 2012, 103, 948–954. [Google Scholar] [CrossRef]
  16. Kim, J.; Kobayashi, E.; Sato, T. Influence of Natural Aging Time on Two-Step Aging Behavior of Al-Mg-Si(-Cu) Alloys. Mater. Trans. 2015, 56, 1771–1780. [Google Scholar] [CrossRef] [Green Version]
  17. Martinsen, F.A.; Ehlers, F.J.H.; Torsæter, M.; Holmestad, R. Reversal of the Negative Natural Aging Effect in Al–Mg–Si Alloys. Acta Mater. 2012, 60, 6091–6101. [Google Scholar] [CrossRef] [Green Version]
  18. Banhart, J.; Chang, C.S.T.; Liang, Z.; Wanderka, N.; Lay, M.D.H.; Hill, A.J. Natural Aging in Al-Mg-Si Alloys—A Process of Unexpected Complexity. Adv. Eng. Mater. 2010, 12, 559–571. [Google Scholar] [CrossRef]
  19. Brenner, P.; Kostron, H. Über Die Vergütung Der Aluminium-Magnesium-Silizium-Legierungen (Pantal). Int. J. Mater. Res. 1939, 31, 89–97. [Google Scholar] [CrossRef]
  20. Chang, C.S.T.; Wieler, I.; Wanderka, N.; Banhart, J. Positive Effect of Natural Pre-Ageing on Precipitation Hardening in Al–0.44at% Mg–0.38at% Si Alloy. IFES 2008 2009, 109, 585–592. [Google Scholar] [CrossRef]
  21. Torsæter, M.; Hasting, H.S.; Lefebvre, W.; Marioara, C.D.; Walmsley, J.C.; Andersen, S.J.; Holmestad, R. The Influence of Composition and Natural Aging on Clustering during Preaging in Al–Mg–Si Alloys. J. Appl. Phys. 2010, 108, 073527. [Google Scholar] [CrossRef]
  22. Serizawa, A.; Hirosawa, S.; Sato, T. Three-Dimensional Atom Probe Characterization of Nanoclusters Responsible for Multistep Aging Behavior of an Al-Mg-Si Alloy. Metall. Mater. Trans. A 2008, 39, 243–251. [Google Scholar] [CrossRef]
  23. Aruga, Y.; Kozuka, M.; Takaki, Y.; Sato, T. Evaluation of Solute Clusters Associated with Bake-Hardening Response in Isothermal Aged Al-Mg-Si Alloys Using a Three-Dimensional Atom Probe. Metall. Mater. Trans. A 2014, 45, 5906–5913. [Google Scholar] [CrossRef]
  24. Engler, O.; Marioara, C.D.; Aruga, Y.; Kozuka, M.; Myhr, O.R. Effect of Natural Ageing or Pre-Ageing on the Evolution of Precipitate Structure and Strength during Age Hardening of Al–Mg–Si Alloy AA 6016. Mater. Sci. Eng. A 2019, 759, 520–529. [Google Scholar] [CrossRef]
  25. Ye, Q.; Wu, J.; Zhao, J.; Yang, G.; Yang, B. Kinetic Monte Carlo Simulation of Clustering in an Al-Mg-Si-Cu Alloy. Materials 2021, 14, 4523. [Google Scholar] [CrossRef] [PubMed]
  26. Hayoune, A. Thermal Analysis of the Impact of RT Storage Time on the Strengthening of an Al-Mg-Si Alloy. Mater. Sci. Appl. 2012, 3, 460–466. [Google Scholar] [CrossRef] [Green Version]
  27. Jia, Z.; Ding, L.; Cao, L.; Sanders, R.; Li, S.; Liu, Q. The Influence of Composition on the Clustering and Precipitation Behavior of Al-Mg-Si-Cu Alloys. Metall. Mater. Trans. A 2017, 48, 459–473. [Google Scholar] [CrossRef]
  28. Weng, Y.; Jia, Z.; Ding, L.; Liu, M.; Wu, X.; Liu, Q. Combined Effect of Pre-Aging and Ag/Cu Addition on the Natural Aging and Bake Hardening in Al-Mg-Si Alloys. Prog. Nat. Sci. Mater. Int. 2018, 28, 363–370. [Google Scholar] [CrossRef]
  29. Zhu, S.; Shih, H.-C.; Cui, X.; Yu, C.-Y.; Ringer, S.P. Design of Solute Clustering during Thermomechanical Processing of AA6016 Al–Mg–Si Alloy. Acta Mater. 2021, 203, 116455. [Google Scholar] [CrossRef]
  30. Tweddle, D.; Johnson, J.A.; Kapoor, M.; Bikmukhametov, I.; Mileski, S.; Carsley, J.E.; Thompson, G.B. Atomic-Scale Clustering in a High-Strength Al-Mg-Si-Cu Alloy. Materialia 2022, 26, 101567. [Google Scholar] [CrossRef]
  31. Hell, C.M.; Søreide, H.-S.; Bjørge, R.; Marioara, C.D.; Li, Y.; Holmestad, R. Influence of Natural Aging and Ramping before Artificial Aging on the Microstructure of Two Different 6xxx Alloys. J. Mater. Res. Technol. 2022, 21, 4224–4240. [Google Scholar] [CrossRef]
  32. Yang, Z.; Erdle, I.; Liu, C.; Banhart, J. Clustering and Precipitation in Al-Mg-Si Alloys during Linear Heating. J. Mater. Sci. Technol. 2022, 120, 78–88. [Google Scholar] [CrossRef]
  33. Pogatscher, S.; Antrekowitsch, H.; Werinos, M.; Moszner, F.; Gerstl, S.S.A.; Francis, M.F.; Curtin, W.A.; Löffler, J.F.; Uggowitzer, P.J. Diffusion on Demand to Control Precipitation Aging: Application to Al-Mg-Si Alloys. Phys. Rev. Lett. 2014, 112, 225701. [Google Scholar] [CrossRef] [PubMed]
  34. Lu, G.; Sun, B.; Wang, J.; Liu, Y.; Liu, C. High-Temperature Age-Hardening Behavior of Al–Mg–Si Alloys with Varying Sn Contents. J. Mater. Res. Technol. 2021, 14, 2165–2173. [Google Scholar] [CrossRef]
  35. Andersen, S.J.; Zandbergen, H.W.; Jansen, J.; TrÆholt, C.; Tundal, U.; Reiso, O. The Crystal Structure of the Β″ Phase in Al–Mg–Si Alloys. Acta Mater. 1998, 46, 3283–3298. [Google Scholar] [CrossRef]
  36. Wenner, S.; Jones, L.; Marioara, C.D.; Holmestad, R. Atomic-Resolution Chemical Mapping of Ordered Precipitates in Al Alloys Using Energy-Dispersive X-Ray Spectroscopy. Micron 2017, 96, 103–111. [Google Scholar] [CrossRef]
  37. Ehlers, F.J.H.; Wenner, S.; Andersen, S.J.; Marioara, C.D.; Lefebvre, W.; Boothroyd, C.B.; Holmestad, R. Phase Stabilization Principle and Precipitate-Host Lattice Influences for Al–Mg–Si–Cu Alloy Precipitates. J. Mater. Sci. 2014, 49, 6413–6426. [Google Scholar] [CrossRef] [Green Version]
  38. Marioara, C.D.; Andersen, S.J.; Stene, T.N.; Hasting, H.; Walmsley, J.; Van Helvoort, A.T.J.; Holmestad, R. The Effect of Cu on Precipitation in Al–Mg–Si Alloys. Philos. Mag. 2007, 87, 3385–3413. [Google Scholar] [CrossRef]
  39. Chakrabarti, D.J.; Laughlin, D.E. Phase Relations and Precipitation in Al–Mg–Si Alloys with Cu Additions. Festschr. Honor T B Massalski 2004, 49, 389–410. [Google Scholar] [CrossRef]
  40. Prosa, T.J.; Larson, D.J. Modern Focused-Ion-Beam-Based Site-Specific Specimen Preparation for Atom Probe Tomography. Microsc. Microanal. 2017, 23, 194–209. [Google Scholar] [CrossRef]
  41. Dumitraschkewitz, P.; Uggowitzer, P.J.; Gerstl, S.S.A.; Löffler, J.F.; Pogatscher, S. Size-Dependent Diffusion Controls Natural Aging in Aluminium Alloys. Nat. Commun. 2019, 10, 4746. [Google Scholar] [CrossRef] [Green Version]
  42. Tweddle, D.; Johnson, J.A.; Kapoor, M.; Mileski, S.; Carsley, J.E.; Thompson, G.B. Direct Observation of PFIB-Induced Clustering in Precipitation-Strengthened Al Alloys by Atom Probe Tomography. Microsc. Microanal. 2022, 28, 296–301. [Google Scholar] [CrossRef]
  43. Hatzoglou, C.; Rouland, S.; Radiguet, B.; Etienne, A.; Costa, G.; Sauvage, X.; Pareige, P.; Vurpillot, F. Preferential Evaporation in Atom Probe Tomography: An Analytical Approach. Microsc. Microanal. 2020, 26, 689–698. [Google Scholar] [CrossRef]
  44. Jägle, E.A.; Choi, P.-P.; Raabe, D. The Maximum Separation Cluster Analysis Algorithm for Atom-Probe Tomography: Parameter Determination and Accuracy. Microsc. Microanal. 2014, 20, 1662–1671. [Google Scholar] [CrossRef] [PubMed]
  45. Hyde, J.M.; DaCosta, G.; Hatzoglou, C.; Weekes, H.; Radiguet, B.; Styman, P.D.; Vurpillot, F.; Pareige, C.; Etienne, A.; Bonny, G.; et al. Analysis of Radiation Damage in Light Water Reactors: Comparison of Cluster Analysis Methods for the Analysis of Atom Probe Data. Microsc. Microanal. 2017, 23, 366–375. [Google Scholar] [CrossRef] [PubMed] [Green Version]
  46. Williams, C.A.; Haley, D.; Marquis, E.A.; Smith, G.D.W.; Moody, M.P. Defining Clusters in APT Reconstructions of ODS Steels. IFES 2012 2013, 132, 271–278. [Google Scholar] [CrossRef] [PubMed]
  47. Andersen, S.J. Quantification of the Mg2Si Β″ and Β′ Phases in AlMgSi Alloys by Transmission Electron Microscopy. Metall. Mater. Trans. A 1995, 26, 1931–1937. [Google Scholar] [CrossRef]
  48. Marioara, C.D.; Andersen, S.J.; Røyset, J.; Reiso, O.; Gulbrandsen-Dahl, S.; Nicolaisen, T.-E.; Opheim, I.-E.; Helgaker, J.F.; Holmestad, R. Improving Thermal Stability in Cu-Containing Al-Mg-Si Alloys by Precipitate Optimization. Metall. Mater. Trans. A 2014, 45, 2938–2949. [Google Scholar] [CrossRef]
  49. Mørtsell, E.A.; Qian, F.; Marioara, C.D.; Li, Y. Precipitation in an A356 Foundry Alloy with Cu Additions—A Transmission Electron Microscopy Study. J. Alloys Compd. 2019, 785, 1106–1114. [Google Scholar] [CrossRef]
  50. Marioara, C.D.; Andersen, S.J.; Birkeland, A.; Holmestad, R. Orientation of Silicon Particles in a Binary Al–Si Alloy. J. Mater. Sci. 2008, 43, 4962–4971. [Google Scholar] [CrossRef]
  51. Gazizov, M.; Marioara, C.D.; Friis, J.; Wenner, S.; Holmestad, R.; Kaibyshev, R. Precipitation Behavior in an Al–Cu–Mg–Si Alloy during Ageing. Mater. Sci. Eng. A 2019, 767, 138369. [Google Scholar] [CrossRef]
  52. Lervik, A.; Danbolt, T.; Furu, T.; Holmestad, R.; Lunder, O. Comparing Intergranular Corrosion in Al-Mg-Si-Cu Alloys with and without α-Al(Fe, Mn, Cu)Si Particles. Mater. Corros. 2021, 72, 575–584. [Google Scholar] [CrossRef]
  53. Ozawa, E.; Kimura, H. Excess Vacancies and the Nucleation of Precipitates in Aluminum-Silicon Alloys. Acta Metall. 1970, 18, 995–1004. [Google Scholar] [CrossRef]
  54. Rosenbaum, H.S.; Turnbull, D. On the Precipitation of Silicon out of a Supersaturated Aluminum-Silicon Solid Solution. Acta Metall. 1958, 6, 653–659. [Google Scholar] [CrossRef]
  55. Long, H.C.; Chen, J.H.; Liu, C.H.; Li, D.Z.; Li, Y.Y. The Negative Effect of Solution Treatment on the Age Hardening of A356 Alloy. Mater. Sci. Eng. A 2013, 566, 112–118. [Google Scholar] [CrossRef]
  56. Murray, J.L.; McAlister, A.J. The Al-Si (Aluminum-Silicon) System. Bull. Alloy Phase Diagr. 1984, 5, 74–84. [Google Scholar] [CrossRef]
  57. Feufel, H.; Gödecke, T.; Lukas, H.L.; Sommer, F. Investigation of the Al-Mg-Si System by Experiments and Thermodynamic Calculations. J. Alloys Compd. 1997, 247, 31–42. [Google Scholar] [CrossRef]
  58. Raghavan, V. Al-Mg-Si (Aluminum-Magnesium-Silicon). J. Phase Equilibria Diffus. 2007, 28, 189–191. [Google Scholar] [CrossRef]
  59. Tian, N.; Wang, G.; Zhou, Y.; Liu, C.; Liu, K.; Zhao, G.; Zuo, L. Formation of Phases and Microstructures in Al-8Si Alloys with Different Mg Content. Materials 2021, 14, 762. [Google Scholar] [CrossRef]
  60. Taylor, J.A.; StJohn, D.H.; Barresi, J.; Couper, M.J. Influence of Mg Content on the Microstructure and Solid Solution Chemistry of Al-7%Si-Mg Casting Alloys During Solution Treatment. Mater. Sci. Forum 2000, 331–337, 277–282. [Google Scholar] [CrossRef]
  61. Tang, Q.; Zhao, J.; Wang, T.; Chen, J.; He, K. The Effects of Neodymium Addition on the Intermetallic Microstructure and Mechanical Properties of Al-7Si-0.3Mg-0.3Fe Alloys. J. Alloys Compd. 2018, 741, 161–173. [Google Scholar] [CrossRef]
  62. Hasting, H.S.; Frøseth, A.G.; Andersen, S.J.; Vissers, R.; Walmsley, J.C.; Marioara, C.D.; Danoix, F.; Lefebvre, W.; Holmestad, R. Composition of Β″ Precipitates in Al–Mg–Si Alloys by Atom Probe Tomography and First Principles Calculations. J. Appl. Phys. 2009, 106, 123527. [Google Scholar] [CrossRef]
  63. Esmaeili, S.; Lloyd, D.J. Effect of Composition on Clustering Reactions in AlMgSi(Cu) Alloys. Scr. Mater. 2004, 50, 155–158. [Google Scholar] [CrossRef]
  64. Hatakeyama, D.; Nishimura, K.; Matsuda, K.; Namiki, T.; Lee, S.; Nunomura, N.; Aida, T.; Matsuzaki, T.; Holmestad, R.; Wenner, S.; et al. Effect of Copper Addition on the Cluster Formation Behavior of Al-Mg-Si, Al-Zn-Mg, and Al-Mg-Ge in the Natural Aging. Metall. Mater. Trans. A 2018, 49, 5871–5877. [Google Scholar] [CrossRef] [Green Version]
  65. Hu, Y.; Curtin, W.A. Modeling Peak-Aged Precipitate Strengthening in Al–Mg–Si Alloys. J. Mech. Phys. Solids 2021, 151, 104378. [Google Scholar] [CrossRef]
  66. Shishido, H.; Aruga, Y.; Murata, Y.; Marioara, C.D.; Engler, O. Evaluation of Precipitates and Clusters during Artificial Aging of Two Model Al–Mg–Si Alloys with Different Mg/Si Ratios. J. Alloys Compd. 2022, 927, 166978. [Google Scholar] [CrossRef]
  67. Christiansen, E.; Marioara, C.D.; Holmedal, B.; Hopperstad, O.S.; Holmestad, R. Nano-Scale Characterisation of Sheared β” Precipitates in a Deformed Al-Mg-Si Alloy. Sci. Rep. 2019, 9, 17446. [Google Scholar] [CrossRef] [PubMed] [Green Version]
  68. Yang, M.; Orekhov, A.; Hu, Z.-Y.; Feng, M.; Jin, S.; Sha, G.; Li, K.; Samaee, V.; Song, M.; Du, Y.; et al. Shearing and Rotation of Β″ and Βʹ Precipitates in an Al-Mg-Si Alloy under Tensile Deformation: In-Situ and Ex-Situ Studies. Acta Mater. 2021, 220, 117310. [Google Scholar] [CrossRef]
  69. Poole, W.J.; Wang, X.; Lloyd, D.J.; Embury, J.D. The Shearable–Non-Shearable Transition in Al–Mg–Si–Cu Precipitation Hardening Alloys: Implications on the Distribution of Slip, Work Hardening and Fracture. Philos. Mag. 2005, 85, 3113–3135. [Google Scholar] [CrossRef]
  70. Matsuda, K.; Sakaguchi, Y.; Miyata, Y.; Uetani, Y.; Sato, T.; Kamio, A.; Ikeno, S. Precipitation Sequence of Various Kinds of Metastable Phases in Al-1.0mass% Mg2Si-0.4mass% Si Alloy. J. Mater. Sci. 2000, 35, 179–189. [Google Scholar] [CrossRef]
  71. Li, Y.J.; Brusethaug, S.; Olsen, A. Influence of Cu on the Mechanical Properties and Precipitation Behavior of AlSi7Mg0.5 Alloy during Aging Treatment. Scr. Mater. 2006, 54, 99–103. [Google Scholar] [CrossRef]
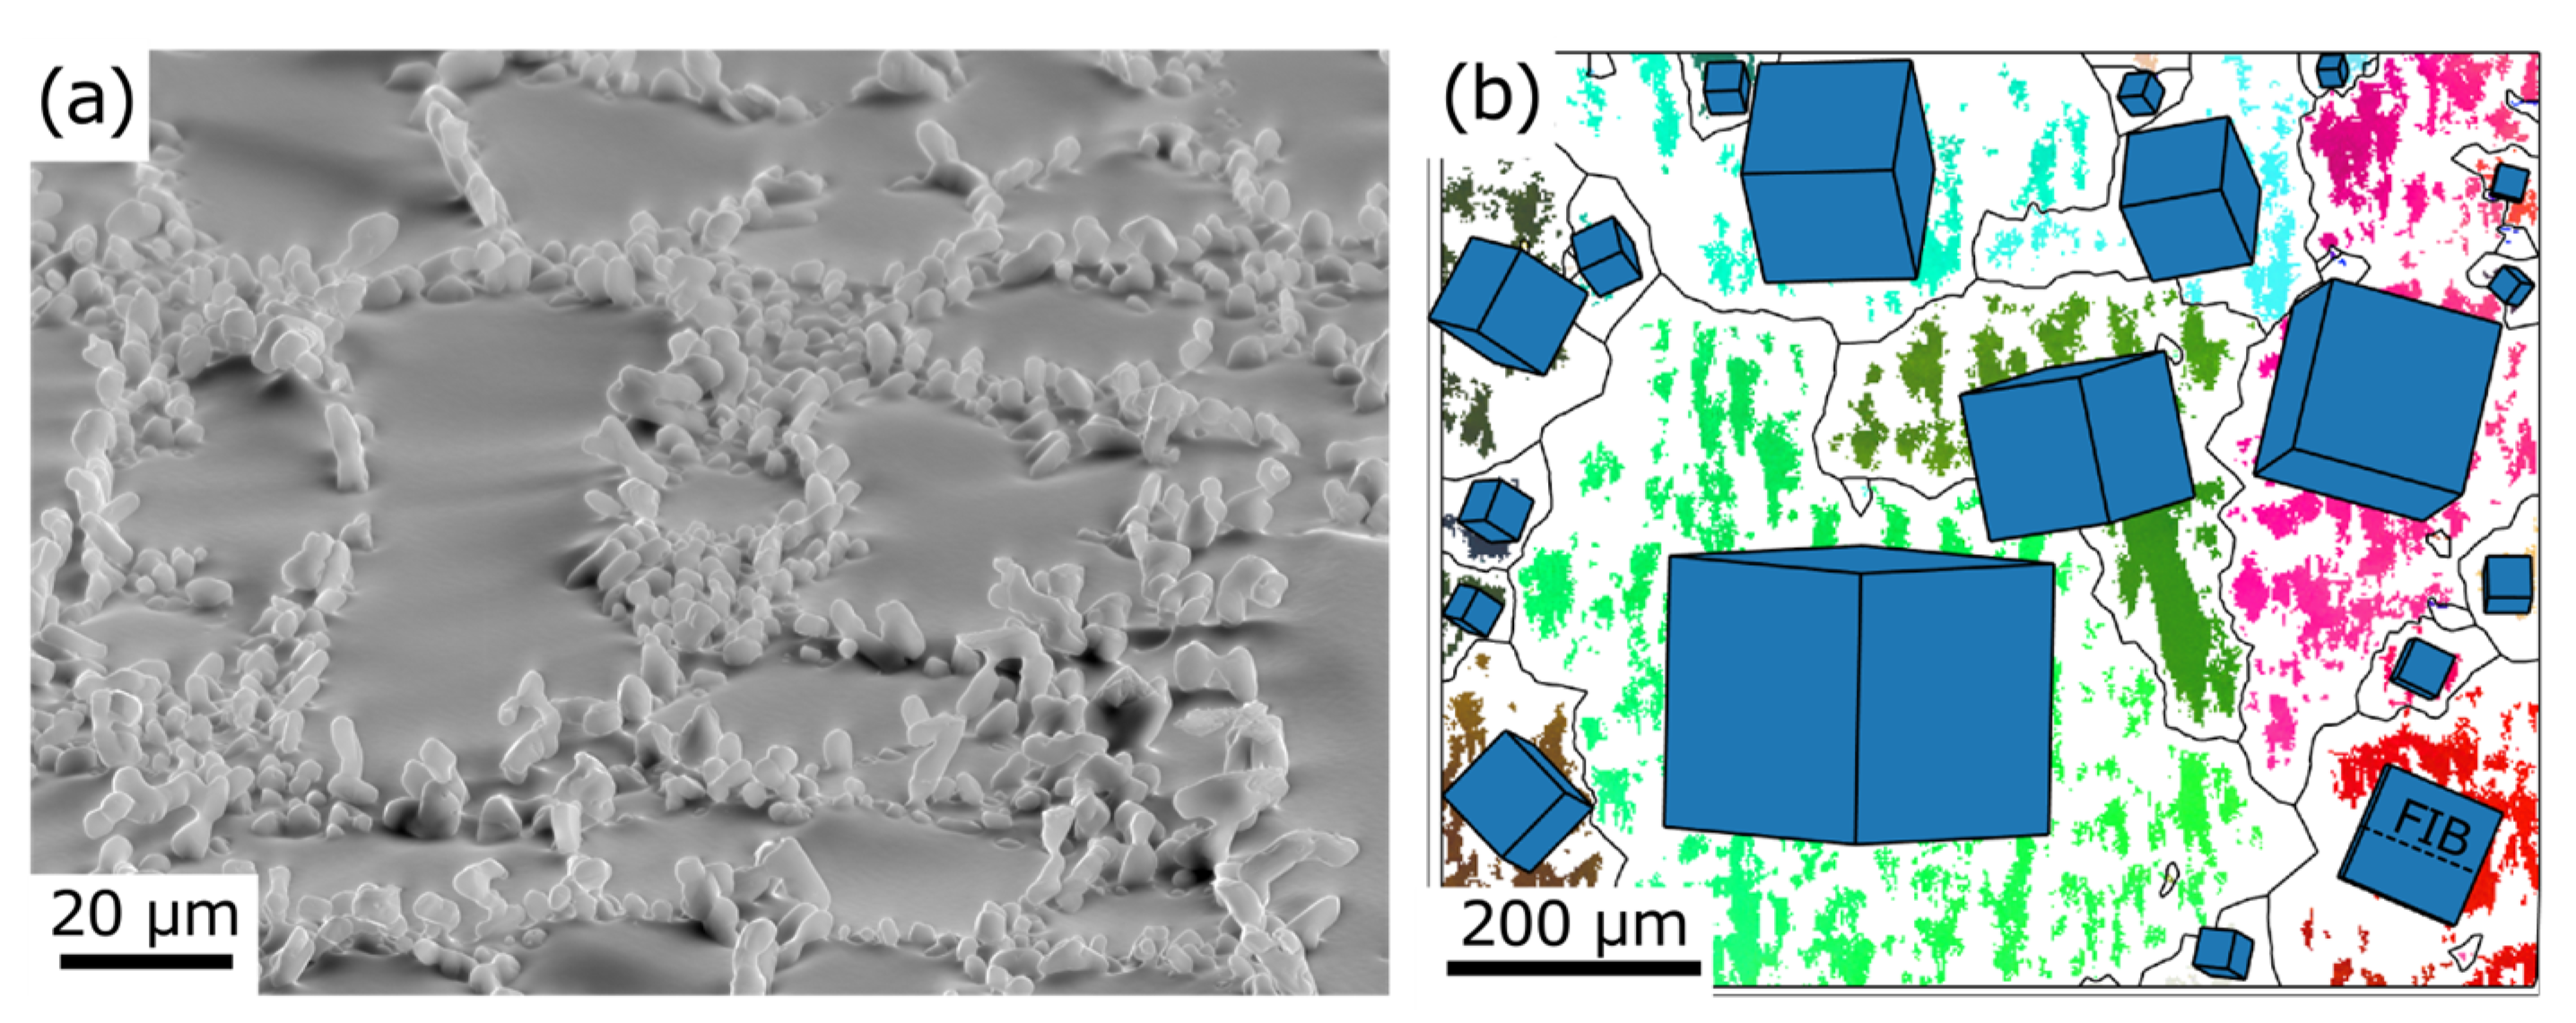
Figure 1. (a) SEM image from an electropolished sample of alloy Mg0.45Cu0.5 tilted 70°, showing eutectic Si particles. (b) EBSD map showing grain orientations by cubes with faces parallel to {001} Al planes. The dashed line marked “FIB” shows an example plane used for FIB liftout to obtain a <001> viewing direction in TEM.
Metals 13 00557 g001
Figure 2. Aging curves after 1 h/28 days RT storage and subsequent AA. (a,b) Vickers hardness, averaged over 5 measurements. Error bars show standard errors. (c,d) Electrical conductivity, averaged over 5 measurements. Errors are too small to show in this plot.
Metals 13 00557 g002
Figure 3. Backscattered electron SEM image of the microstructure of the 4 alloys in peak age condition (1 h RT, 5 h at 175 °C).
Metals 13 00557 g003
Figure 4. APT subvolumes (20 × 20 × 40 nm3) of alloys Mg0.45(Cu0.5) with 28-day RT storage and/or 30 min aging at 175 °C. The 1.5% Mg concentration isosurfaces are shown (green) with Al atoms (gray).
Metals 13 00557 g004
Figure 5. Average cluster compositions from APT as tabulated in Table 3. The circle radii are scaled with the average cluster size. Lines are shown for constant Mg/Si ratios, with the “bulk” lines being the ratio of the average composition of the three analyzed volumes for each alloy (from Table 2), corresponding to the composition of the Al grains.
Metals 13 00557 g005
Figure 6. Inverted LAADF-STEM images of all 6 investigated peak hardness conditions (5 h at 175 °C).
Metals 13 00557 g006
Figure 7. HAADF-STEM images of precipitates from the same conditions as in Figure 6. The structures are representative of the two classes of alloys (Cu-free and Cu-containing). (a,b) Disordered, (c,d) β′′, (e) L [38], (fh) Cu-containing β′′.
Metals 13 00557 g007
Figure 8. Solute concentration close to a Si particle in alloy Mg0.45Cu0.5, showing a narrow solute-depleted zone (ae).
Metals 13 00557 g008
Table 1. Chemical composition of the four alloys used in this study, by weight and atomic fractions, measured with optical emission spectroscopy (OES).
Alloy SiMgCuFeTiSrMn
Mg0.25wt.%6.900.248<0.0040.090.100.015<0.002
at.%6.650.276 0.040.060.005
Mg0.45wt.%6.970.447<0.0040.120.100.015<0.002
at.%6.720.498 0.060.060.005
Mg0.60wt.%6.920.602<0.0040.120.100.015<0.002
at.%6.670.671 0.060.060.005
Mg0.45Cu0.5wt.%6.900.3990.5350.100.120.0210.072
at.%6.670.4460.2290.060.070.0070.036
Table 2. Measured bulk composition and composition of Al grains by APT and other techniques (at.%). A discussion of error sources in APT is available in the Supplementary Material [43].
AlloyConditionSi (%)Mg (%)Cu (%)Ti (%)
Mg0.45OES (bulk)6.7180.498 0.057
APT: 28 days RT0.8990.541 0.006
APT: AA0.9280.559 0.074
APT: RT + AA0.8570.559 0.066
Mg0.45
Cu0.5
OES (bulk)6.6710.4460.2290.068
APT: 28 days RT0.7920.5600.2180.028
APT: AA0.7550.5470.1940.075
APT: RT + AA0.7600.5350.2070.067
Table 3. Cluster parameters measured with APT. Average values, with standard deviations in parentheses. Percentages are atomic fractions (Al is in balance). The cluster size is given in number of atoms to avoid making assumptions about cluster shape. The clustered atoms value is the ratio of atoms (Al, Mg, Si, Cu) in clusters to total atoms in the volume (approximately equal to the cluster volume fraction). Vickers hardness (HV) is included for reference.
AlloyConditionMg (%)Si (%)Cu (%)Density (106/µm3)Size (Atoms)Clustered Atoms (%)HV
Mg0.4528 days RT23(8)29(9) 2.90(26)75(43)0.45(4)81
AA21(8)26(11) 1.81(8)136(171)0.52(2)86
RT + AA24(7)25(9) 1.63(8)100(67)0.34(2)80
Mg0.45
Cu0.5
28 days RT19(6)23(8)4(3)2.53(18)86(47)0.46(3)87
AA23(6)22(7)4(3)1.47(8)271(375)0.83(4)108
RT + AA20(7)22(8)4(2)2.00(9)120(112)0.50(2)87
Table 4. Quantified average precipitate parameters of the 6 conditions shown in Figure 6 Parentheses give error estimations of the last digits. Vickers hardness (HV) is included for reference.
AlloyNatural AgingParticle Length (nm)Particle Diameter (nm)Particle Density (103 µm−3)Volume Fraction (%)HV
Mg0.251 h18.2(4)2.75(5)64(10)0.70(11)98
Mg0.451 h17.8(5)2.91(4)99(15)1.17(20)119
28 d20.0(7)3.15(4)78(12)1.22(29)118
Mg0.601 h23.1(5)2.68(3)87(14)1.13(24)123
Mg0.45Cu0.51 h14.6(6)2.97(3)196(30)1.97(51)123
28 d13.3(4)2.81(3)119(18)0.98(22)124
Disclaimer/Publisher’s Note: The statements, opinions and data contained in all publications are solely those of the individual author(s) and contributor(s) and not of MDPI and/or the editor(s). MDPI and/or the editor(s) disclaim responsibility for any injury to people or property resulting from any ideas, methods, instructions or products referred to in the content.