Abstract
Based on the damage evolution equation of bearing steel, a user subroutine was developed to simulate the fatigue damage behavior of the TBM main bearing under the condition of low speed and heavy load. In addition, the damage evolution law of the main bearing in the time domain and the space domain was studied. Then, a nonlinear spring element was introduced to simulate the interaction between the roller raceway, and the vibration response of the TBM after the main bearing damage was studied using the transient dynamic method. The research shows that the damage risk of the raceway is greater than that of the roller, and the damage risk of the main pushing raceway is greater than that of the other two raceways. The damage of the main bearing will not only lead to the increase in the peak vibration response of the TBM but also cause more frequency components of the response. By monitoring the time domain index of vibration signal, the damage degree to the main bearing can be mastered in real time, providing a reference for the maintenance of the main bearing.
1. Introduction
A tunnel-boring machine (TBM) is playing an increasingly important role in rail transit, railway tunnel and other fields by virtue of its environmental protection, high efficiency and safety. As a key core component of TBM, the main bearing plays the role of carrying and transferring loads [1,2,3]. Due to the difficulty of replacing the main bearing, the industry usually equates the life of the main bearing with that of the TBM [4]. Therefore, it is of great significance to study the fatigue damage of the main bearing and its effects on the system response to timely detect the early faults and predict performance degradation for ensuring the normal operation of the TBM.
In recent years, with the development of underground space, increasingly complex working conditions have emerged, such as ultra-long tunnel, ultra-deep-buried tunnel, high-altitude tunnel, etc. [2,5,6], which not only requires higher reliability of main bearings but also put forward higher requirements for condition monitoring of main bearings. With the development of machine learning and Internet of Things technology, intelligent shield tunnelling has become a trend [5,7,8,9]. For example, Huang et al. [10] developed a real-time monitoring system for the interaction between TBM and surrounding rock and found that the cutterhead vibration was correlated with the geological conditions. Lan et al. [11] monitored the cutters of a TBM through eddy current sensors. Hu et al. [12] proposed a performance degradation model and real-time remaining life prediction method of wind turbine bearings based on temperature characteristic parameters. Wu [13] analyzed the performance state for the shield by monitoring on viscosity, moisture and laser granularity of main bearing lubricating oil and hydraulic oil. At present, the condition monitoring of main bearing mainly depends on temperature monitoring, endoscope monitoring and oil monitoring. Therefore, the requirement for defect detection and performance prediction of the main bearing is urgently needed. Current approaches depend too much on operator experience and are not appropriate for complicated tunneling situations.
Several studies have shown that fatigue damage is the main form of bearing failure. The traditional research on bearing fatigue mainly focuses on the mechanism of fatigue and the prediction of fatigue life. For example, Lundberg and Palmgren presented a classical model, termed the L-P model [14], has been widely used for predicting the life of bearings. Li et al. [15] selected octahedral shear stress as the driving force for bearing contact fatigue and used an explicit dynamic method to simulate bearing damage evolution. Peter et al. [16] conducted a finite element simulation of fatigue spalling behavior of bearings based on the fracture mechanics method. Xu et al. [17] predicted the damage life of ball bearings through an improved Paris law. He et al. [18] used Fe-safe to calculate the fatigue life of a yaw bearing. Zeng et al. [19] investigated the location of wheel fatigue cracks sprouting by finite element simulation and contact fatigue test. He et al. [20] simulated the contact fatigue of gears considering the coupling effect of elastic damage and plastic damage. Gabelli et al. [21] proposed a new method for calculating rolling contact fatigue life based on raceway survival probability.
As fatigue damage continues to develop, the mechanical property of the material will gradually decrease, resulting in a change in the vibration response of the bearing. Therefore, monitoring the response changes caused by bearing damage can effectively warn and diagnose its faults, and scholars have proposed many fault diagnoses and life cycle performance prediction models accordingly. Jena et al. [22] proposed a method of continuous wavelet transform to analyze the vibration signals of bearings and identify the size of defects on the rings of bearings. Singh et al. [23] introduced a fault diagnosis method based on an overcomplete rational wavelet transform (ORDWT). Zhang et al. [24] proposed an adaptive discrete-state model to estimate system remaining lifetime based on Bayesian Belief Network (BBN) theory. Huang et al. [25] proposed a fault feature extraction method for rolling bearings based on a complex envelope spectrum. De Godói et al. [26] verified an extreme machine-learning-based fault diagnosis method for mechanical rotating components. Liu et al. [27] proposed a new adaptive stochastic resonance (SR) model to improve the efficiency of bearing fault diagnosis. Ambrożkiewicz et al. [28] proposed a recurrence-based method to analyze the vibration signals of self-aligning ball bearings and found that the indicators have different sensitivities to the changes of the internal clearance. With the continuous development of intelligent monitoring, sensor and big data technology, fault diagnosis and performance prediction models based on machine learning and data-driven have been widely used and made great progress.
However, the existing fault diagnosis models are completely data-driven and lack the support of physical models; thus, the accuracy of diagnosis and the portability of algorithm needs to be improved. In addition, the tunneling process will produce strong noise signals, and predicting the performance of the main bearing will be more difficult. Considering the current state of the art described above, first, we developed a user subroutine based on the damage evolution equation of bearing steel, to simulate the fatigue damage behavior of the TBM main bearing. Second, we studied the damage evolution law of the main bearing in the time domain and the space domain. Finally, a nonlinear spring element was introduced to simulate the interaction between the roller raceway, and the vibration response of the TBM after the main bearing damage was studied using the transient dynamic method. This paper studies the vibration response caused by bearing damage from a mechanistic perspective, which can provide a reference for intelligent shield tunnelling based on machine learning and data-driven.
2. Analysis of Main Bearing Fatigue Damage
2.1. Fatigue Damage Model of Main Bearing
The focus of this study is TBM main bearing with a diameter of 3.3 m, which is mainly composed of an outer ring, an inner ring and three rows of cylindrical rollers, as shown in Figure 1, and the 8 m diameter cutterhead is attached to its front [4].
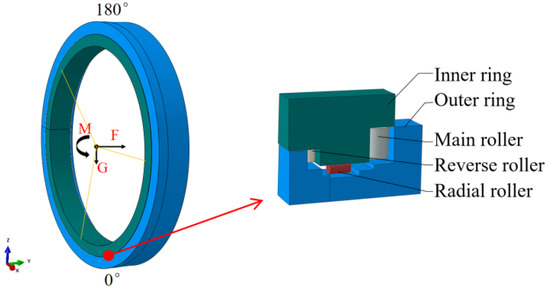
Figure 1.
Structure diagram of TBM main bearing.
Compared with the conventional bearing structure, this structure can withstand greater thrust and overturning moment, as well as a certain radial force. The radial force G mainly comes from the cutterhead gravity, which hardly changes during the tunneling process. However, the dynamic behavior of thrust F and overturning moment M is very complicated and can easily lead to fatigue damage of rollers and rings. Figure 2 shows the dynamic tunneling load and distribution characteristics of an 8m cutterhead under marble geology [29].
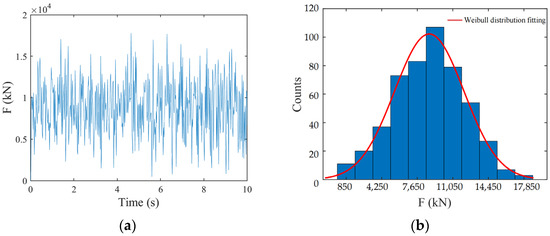
Figure 2.
Trust and distribution characteristics of the cutterhead: (a) Curve of trust with time; (b) The distribution.
Many studies have shown that the main driving force leading to bearing fatigue damage is cyclic shear stress, and the average value of shear stress has little influence on fatigue damage. The roller of TBM main bearing is usually made of GCr15 steel, and its torsional S-N equation is [30]:
Generally, the damage evolution equation for high-cycle fatigue can be set as [31]:
where N donates the number of cycles; Δσ represents the difference between maximum and minimum stresses; σr donates the material parameter related to the average stress; m is a material parameter related to temperature.
For contact fatigue of the main bearing, as its main driving force is the shear stress, Δσ is replaced by Δτ in the above formula, with the following transformation:
By comparing Formula (3) with Formula (1), we can derive that: m = 9.7874, σr = 6722 MPa. Therefore, the damage evolution equation for GCr15 steel is:
The main bearing ring is usually made of 42CrMo steel, and the similar 18CrNiMo7-6 steel is used in this paper to replace it. The damage evolution equation for18CrNiMo7-6 steel can be written as follows [20]:
Cylindrical rollers were used for all three rows of rollers in the main bearing of the TBM. In order to reduce the calculation scale, the contact problem between rollers and rings was simplified into a plane strain problem. The finite element model is shown in Figure 3, where the blue part represents the raceway of the ring, and the gray part represents the roller. The material properties of raceway and roller are shown in Table 1 [4]. Since the model was symmetric, only a quarter of it needed to be taken for the calculation. The mesh was encrypted in the contact area between the roller and the raceway with a side length of the elements of 0.05 mm. In Abaqus, CPE4R elements were assigned to the finite element model with a total number of elements of 16,000. Normal contact behavior was defined as “hard contact “ and tangential friction coefficient was defined as 0.05 [15].
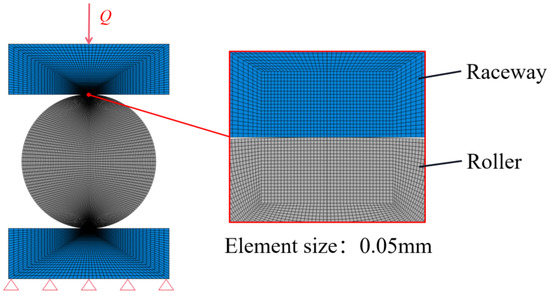
Figure 3.
Finite element model of contact between roller and raceway.

Table 1.
Material properties of bearing steel.
Next, two steps were set up in Abaqus. In the first step, a small pressure was applied to the upper part of the raceway, which enabled the model to establish a stable contact relationship. In the second step, cyclic load Q was applied to the upper part of the raceway, and its changes over time are shown in Figure 4. We assumed that the speed of the main bearing is 6 r/min, then the relationship between time and the number of cycles could be deduced according to the geometric relationship, as shown in Table 2.
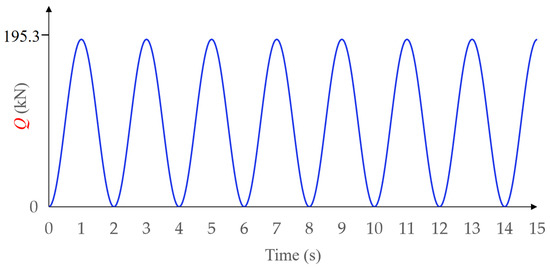
Figure 4.
Curve of cyclic load Q with time.
Table 2.
The relation between the number of load cycles of roller raceway and the working time.
Finally, a field was activated in the Property module of Abaqus, so that the elastic modulus E was linearly correlated with this field, and this field was D. Taking a roller as an example, we set the maximum value of E to 209,000 MPa and the minimum value to 0, corresponding to D = 0 and D = 1, respectively. In this way, E would be linearly dependent on D. Formulas (4) and (5) were then compiled into the USDFLD subroutine and interfaced with Abaqus. Therefore, the damage and stiffness of roller and raceway could be updated each time the shear stress reaches a peak. For plane problems, the maximum shear stress can be expressed as:
2.2. Fatigue Damage Simulation of Main Bearing
According to the operating conditions in the literature [4], the overturning moment M of the cutterhead was 8000 kN·m, the gravity G of the cutterhead was 800 kN and the thrust F of the cutterhead was 5000 kN. Under these working conditions, the maximum load of main rollers was 195.3 kN, the maximum load of the reverse rollers was 30 kN, and the maximum load of radial rollers was 20.2 kN. It should be noted that each roller is not subject to the same load. Taking the reverse rollers as an example, the maximum load of the reverse rollers was 30 kN, which was located at the upper end of the main bearing, i.e., π rad position, as shown in Figure 5. Since the load on each roller was not uniform, we assumed that the roller rolls around the ring for one circle and was only loaded in the region with the largest load, i.e., the region of 3/4π–5/4π, and the load was always 30 kN. Similar assumptions also applied to main rollers and radial rollers. Fatigue damage simulation of the main bearing was carried out according to the method in the previous section. Under different working hours, the damage D of each part of the main bearing is shown in Table 3.
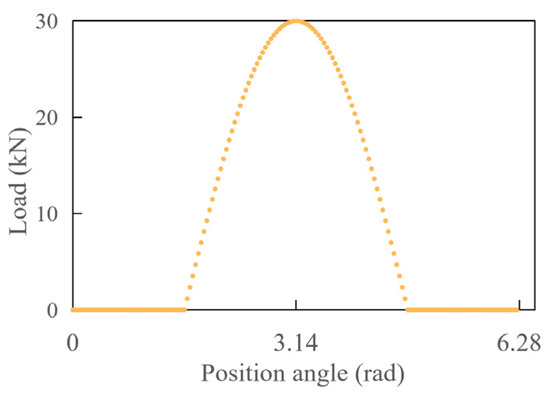
Figure 5.
Load on each reserve roller.
Table 3.
The damage D of each part of the main bearing at different times.
As can be seen from Table 3, the damage risk of raceway is greater than that of roller; Among all rows of raceway, the damage risk of the main raceway of the outer ring is the greatest. Specifically, for the main row, after 20,000 h of main bearing operation, the raceway has reached the failure state, and at this time the damage of the roller is much smaller than that of the raceway, the damage nephogram of the main roller and raceway is shown in Figure 6. For the reverse and the radial rows, the damage to the rollers and raceways is relatively small after 20,000 h of main bearing operation.
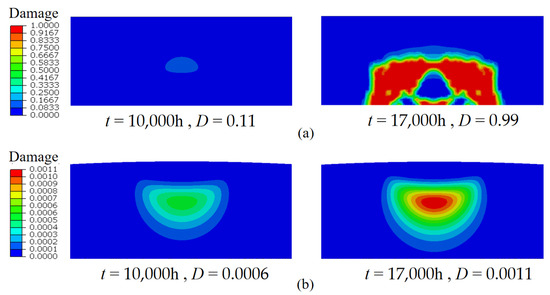
Figure 6.
Damage nephogram of the main roller and raceway: (a) Roller (b) Raceway.
Taking the simulation results of the main raceway as an example, the damage evolution over time is shown in Figure 7. From the perspective of spatial domain, the damage of the raceway starts from a subsurface position 0.6 mm from the raceway surface and extends to the surface along a horizontal angle of 45°, gradually forming fatigue spalling, which was consistent with the results in the literature [15], as shown in Figure 8. From the perspective of time domain, when the working time is less than 15,000 h, the damage evolution of the main push raceway is slow. When the working time reaches 15,000 h, the damaged area expands rapidly, and the maximum damage increases from 0.33 to 0.99 in only 1000 h. Therefore, it is recommended to set the critical damage as 0.3.
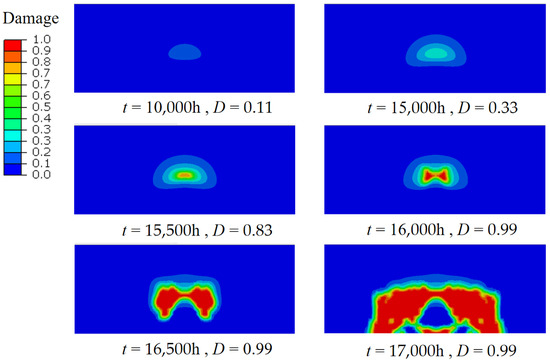
Figure 7.
Damage evolution of main raceway of main bearing outer ring.
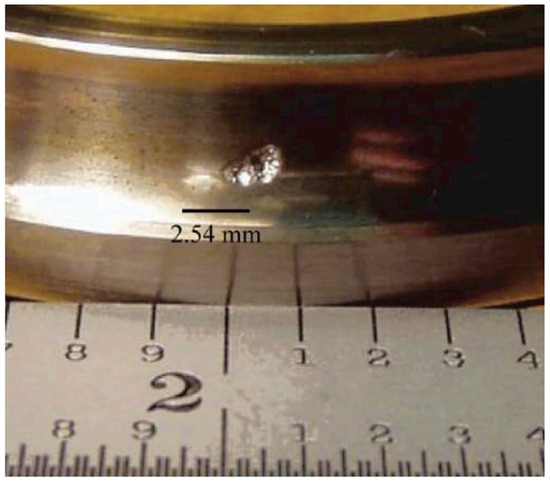
Figure 8.
Typical fatigue spall formed on AISI-52100 in endurance life experiments (adapted from Reference [15]. Copyright 2018, Elsevier).
Damage will also lead to the decline of Young’s modulus of the material, and then affect the contact stiffness between the roller and the raceway. Taking main roller and raceway as an example, force-displacement curves of the reference points of the upper raceway at different times were extracted, as shown in Figure 9.
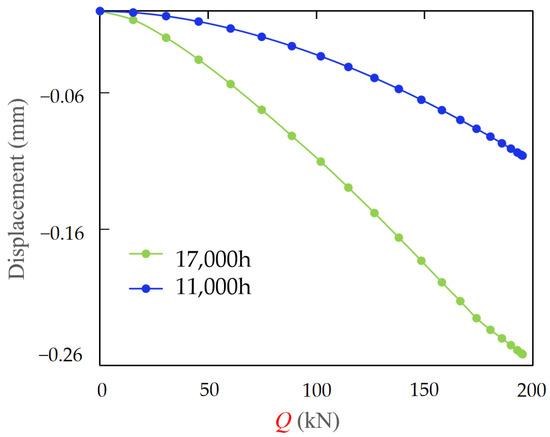
Figure 9.
Contact stiffness between main roller and outer ring at different times.
2.3. Variation of TBM Vibration Response
In the process of tunneling, the vibration response of the TBM will be greater as the damage to the main bearing develops. If the vibration response is too large, it will not only make the contact stress of the main bearing exceed the limit, but also have an adverse effect on the cutterhead system. Therefore, it is of great significance to study the vibration response of TBM after main bearing damage. Based on the previous research on the fatigue damage of the main bearing, this section introduces a nonlinear spring element to simulate the interaction between rollers and raceways, applies fluctuating cutterhead load to the TBM, and adopts the transient dynamic method to study the vibration response changes of the TBM before and after the main bearing damage.
First, a 3D model of TBM was established in Abaqus, as shown in Figure 10, where the diameter of the cutterhead is 8m and the total length of the main beam is 13 m. Fixed constraints were applied to the thrusting boots, and the stiffness of the push cylinders was set to 706,000 N/mm. The nonlinear spring elements are used to simulate the interaction between the cutters and the rocks, with the front end of the springs being fixed on the tunnel face and the back end of the springs being coupled with the cutter saddles. The stiffness of the springs under tension is set as 0, and the stiffness under compression is set by E. F. Roxborough formula [32].
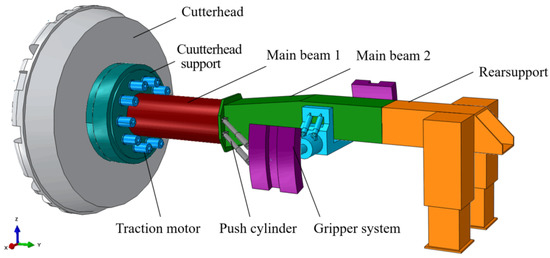
Figure 10.
Structure diagram of TBM.
Frequency is the natural characteristic of structure. The reliability of the modeling method can be verified by comparing the values of the frequencies obtained from numerical simulation and experimental tests. The vibration test device of the TBM main drive system is shown in Figure 11. According to the frequency correlation theory [29], if the error between the simulated frequency and the experimental frequency is less than 8%, they can be considered to be correlated. As can be seen from Table 4, the maximum error between the simulated values and the experimental values is only 7.1%, which proves that the numerical model can reflect the inherent characteristics of the real model well and can be used as a simulation model.
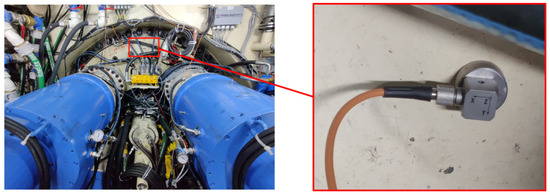
Figure 11.
The vibration test device of the TBM main drive system.
Table 4.
Comparison of experimental and simulated values of the frequencies of the TBM main drive system.
After setting the boundary conditions, the reference point is coupled to the tool flange. The cutterhead thrust load is applied to the reference point, and the vibration response of the TBM was simulated by using the transient dynamic method. After the simulation is completed, the vibration acceleration signal of the cutterhead support is output, as shown in Figure 12. FFT transformation is used to convert the time-domain signal into the frequency domain signal, as shown in Figure 13.
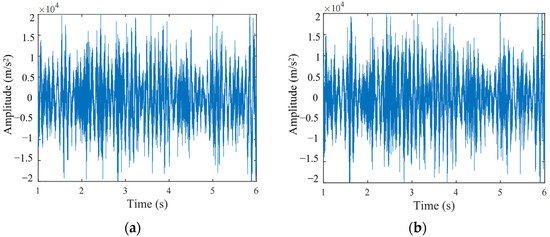
Figure 12.
Vibration signal of the cutterhead support: (a) Before main bearing damage; (b) After main bearing damage.
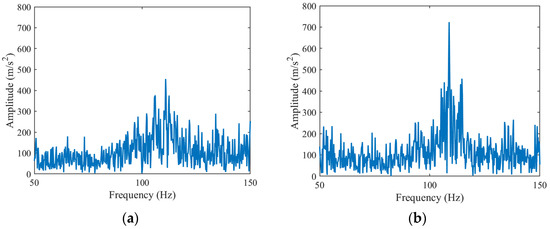
Figure 13.
FFT spectrum of the vibration signal: (a) Before main bearing damage; (b) After main bearing damage.
From Figure 9 and Figure 10, it can be seen that when the main bearing is in normal condition, the peak value of the vibration signal is small, but when the main bearing is damaged, the peak value of the vibration increases significantly, and the frequency distribution is wide. It can be seen that when the main bearing is damaged, the peak value of its vibration response will increase on the one hand, and on the other hand, it will cause more frequency components of the response. It can be seen that the damage reduced the local material properties; thus, reducing the contact stiffness of the bearing, which on the one hand increased the peak vibration response of TBM, and on the other hand caused the response of more frequency components.
Kurtosis, impulse factor and margin factor are often used as fault diagnosis indicators of bearings, as dimensionless parameters, they are sensitive to the health state of bearings and are not dependent on the operating conditions. Kurtosis reflects the deviation degree of vibration signal from normal distribution, which is more suitable for early fault diagnosis. Figure 14 shows the kurtosis curve of the vibration signal with time under three geologies.
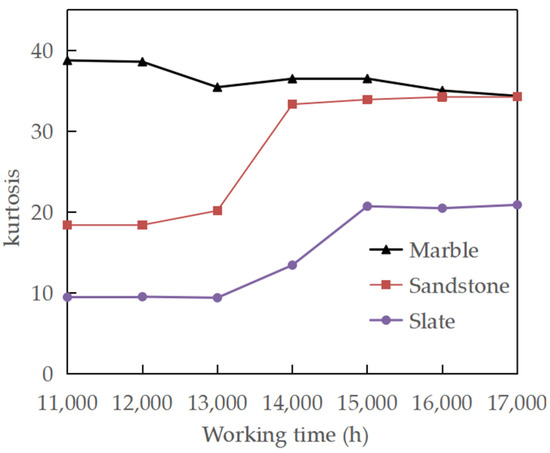
Figure 14.
Curve of kurtosis with time.
It can be seen from Figure 14 that under sandstone and slate geologies, the kurtosis of the vibration signal increases with time. Under marble geology, the kurtosis of vibration signal is stable and always at a high level. This is due to the high UCS value of marble. Under the same penetration degree, the fluctuation of cutterhead load is more intense and the strong background noise will cover the fault characteristics of the vibration signal.
Impulse factor is the ratio of peak value to arithmetic mean value, which is used to detect the presence of shock components in the signal. Figure 15 shows the impulse factor curves of vibration signal with time under three geologies.
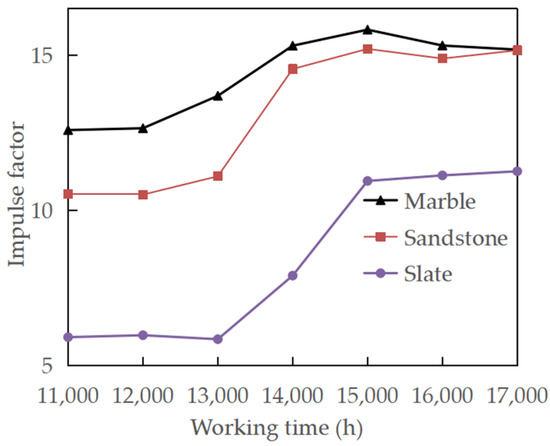
Figure 15.
Curve of impulse factor with time.
As shown in Figure 15, the impulse factor of the vibration signal increases with time and then becomes stable. Because the peak value varies greatly at different times, the impulse factor does not rise monotonically with time, but the general trend reflects that the vibration shock becomes more severe.
Margin factor is the ratio of peak value to root amplitude, which is used to detect the wear condition of the bearing. Figure 16 shows the margin factor curve of vibration signal with time under three geologies.
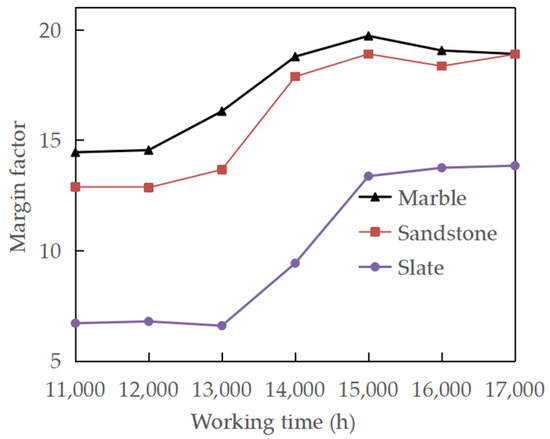
Figure 16.
Curve of margin factor with time.
As shown in Figure 16, the margin factor of the vibration signal increases with time and then becomes stable. In conclusion, after the main bearing is damaged, the kurtosis, pulse factor and margin of the vibration signal will be changed significantly, the impact component in the vibration signal increases, and the main bearing deviates from the normal operation state.
3. Discussion
The fatigue damage behavior of the TBM main bearing was simulated by the finite element method. Then, we studied the damage evolution law of the main bearing in the time domain and the space domain. In addition, a nonlinear spring element was introduced to simulate the interaction between the roller raceway, and a fluctuating cutter head load was applied to the TBM. The vibration response of the TBM after the main bearing damage was studied using the transient dynamic method. The main results were as follows. The damage risk of rings was greater than that of the rollers, and the damage risk of the outer ring main raceway was the greatest and should be paid attention to during the construction process. The damage of raceway starts from the subsurface of 0.6 mm from the surface and extends to the surface along a horizontal angle of 45°, gradually forming fatigue spalling. Damage to the main bearing will not only lead to the increase in the peak vibration response of the TBM, but also cause the response of more frequency components. The kurtosis, impulse factor and margin factor of vibration signal can characterize the damage degree of bearing. By monitoring the time-domain indexes of vibration signal, the damage degree of the main bearing can be mastered in real time, providing a reference for the maintenance of the main bearing.
In this study, the numerical simulation technology was used to study the fatigue damage of the main bearing and its impact on the system response. In the future, we will revise the model according to the measured engineering data to improve the accuracy of the model. In addition, bearing faults are various, this paper only considers fatigue damage as a typical fault. Subsequently, we will also study the impact of wear, plastic deformation and other faults on the vibration response of the system.
Author Contributions
Conceptualization, C.Q.; funding acquisition, C.Q.; resources, C.Q.; supervision, C.Q.; validation, H.Z.; writing—original draft, H.Z.; writing—review and editing, C.Q. and H.Z. All authors have read and agreed to the published version of the manuscript.
Funding
This research was funded by the National Key Research and Development Program of China (grant no. 2020YFB2007202).
Informed Consent Statement
Not applicable.
Data Availability Statement
The raw/processed data required to reproduce these findings cannot be shared at this time as the data also forms part of an ongoing study.
Conflicts of Interest
The authors declare no conflict of interest.
References
- Admiraal, H.; Cornaro, A. Why underground space should be included in urban planning policy-And how this will enhance an urban underground future. Tunn. Undergr. Space Technol. 2016, 55, 214–220. [Google Scholar] [CrossRef]
- Li, J.B.; Zhang, Z.G.; Meng, Z.C.; Huo, J.Z.; Xu, Z.H.; Chen, J. Tunnel boring machine cutterhead crack propagation life prediction with time integration method. Adv. Mech. Eng. 2019, 11, 1687814019853451. [Google Scholar] [CrossRef]
- Chen, Y.L.; Chen, Z.L.; Guo, D.J.; Zhao, Z.W.; Lin, T.; Zhang, C.H. Underground space use of urban built-up areas in the central city of Nanjing: Insight based on a dynamic population distribution. Undergr. Space 2022, 7, 748–766. [Google Scholar] [CrossRef]
- Jiang, L.J. Structure design for main bearing of full face rock tunnel boring machine oriented to reliability and vibration behavior. Master’s Thesis, Dalian University of Technology, Dalian, China, 2013. (In Chinese). [Google Scholar]
- Gong, Q.M.; Yin, L.J.; Ma, H.S.; Zhao, J. TBM tunnelling under adverse geological conditions: An overview. Tunn. Undergr. Space Technol. 2016, 57, 4–17. [Google Scholar] [CrossRef]
- Rostami, J.; Chang, S. A closer look at the design of cutterheads for Hard Rock Tunnel-Boring Machines. Engineering 2017, 3, 892–904. [Google Scholar] [CrossRef]
- Li, J.B.; Jing, L.J.; Zheng, X.F.; Li, P.Y.; Yang, C. Application and outlook of information and intelligence technology for safe and efficient TBM construction. Tunn. Undergr. Space Technol. 2019, 93, 103097. [Google Scholar] [CrossRef]
- Pan, Y.; Fu, X.L.; Zhang, L.M. Data-driven multi-output prediction for TBM performance during tunnel excavation: An attention-based graph convolutional network approach. Automat. Constr. 2022, 141, 104386. [Google Scholar] [CrossRef]
- Wang, K.Y.; Wu, X.G.; Zhang, L.M.; Song, X.Q. Data-driven multi-step robust prediction of TBM attitude using a hybrid deep learning approach. Adv. Eng. Inform. 2023, 55, 101854. [Google Scholar] [CrossRef]
- Huang, X.; Liu, Q.S.; Liu, H.; Zhang, P.L.; Pan, S.L.; Zhang, X.P.; Fang, J.N. Development and in-situ application of a real-time monitoring system for the interaction between TBM and surrounding rock. Tunn. Undergr. Space Technol. 2018, 81, 187–208. [Google Scholar] [CrossRef]
- Lan, H.; Xia, Y.M.; Zhu, Z.M.; Ji, Z.Y.; Mao, J.S. Development of on-line rotational speed monitor system of TBM disc cutter. Tunn. Undergr. Space Technol. 2016, 57, 66–75. [Google Scholar] [CrossRef]
- Hu, Y.G.; Li, H.; Liao, X.L. Performance Degradation Model and Prediction Method of Real-time Remaining Life for Wind Turbine Bearings. Proc. CSEE 2016, 36, 1644–1649. (In Chinese) [Google Scholar]
- Wu, C.L. Online Monitoring System of Shield Oil Based on Internet of Things Technology. Tunn. Constr. 2019, 39, 940–945. (In Chinese) [Google Scholar]
- Lungberg, G.; Pamgren, A. Dynamic capacity of rolling bearings. Acta Poly-Tech. Ser. Mech. Eng. 1947, 1, 1–50. [Google Scholar]
- Li, F.K.; Hu, W.P.; Meng, Q.C.; Zhan, Z.X.; Shen, F. A new damage-mechanics-based model for rolling contact fatigue analysis of cylindrical roller bearing. Tribol. Int. 2018, 120, 105–114. [Google Scholar] [CrossRef]
- Göncza, P.; Potočnik, R.; Glodež, S. Fatigue behaviour of 42CrMo4 steel under contact loading. Procedia Eng. 2010, 2, 1991–1999. [Google Scholar] [CrossRef]
- Xu, D.; Xu, Y.C.; Chen, X.; Li, X.L.; Yang, Y.M. Fatigue life prediction of ball bearings by modified Paris law based on critical curved surface. J. Mech. Eng. 2011, 47, 52–57. (In Chinese) [Google Scholar] [CrossRef]
- He, P.Y.; Hong, R.J.; Wang, H.; Ji, X.; Lu, C. Calculation analysis of yaw bearings with a hardened raceway. Int. J. Mech. Sci. 2018, 6, 540–552. [Google Scholar] [CrossRef]
- Zeng, D.F.; Xu, T.; Liu, W.D.; Lu, L.T. Investigation on rolling contact fatigue of railway wheel steel with surface defect. Wear 2020, 446, 203207. [Google Scholar] [CrossRef]
- He, H.F.; Liu, H.J.; Zhu, C.Z.; Wei, P.T.; Sun, Z.D. Study of rolling contact fatigue behavior of a wind turbine gear based on damage-coupled elastic-plastic model. Int. J. Mech. Sci. 2018, 141, 512–519. [Google Scholar] [CrossRef]
- Antonio, G.; Guillermo, E. A model for hybrid bearing life with surface and subsurface survival. Wear 2019, 422–423, 223–234. [Google Scholar]
- Jena, D.; Panigrahi, S. Bearing and gear fault diagnosis using adaptive wavelet transform of vibration signals. Procedia Eng. 2012, 50, 265–274. [Google Scholar]
- Singh, J.; Darpe, A.; Singh, S. Rolling element bearing fault diagnosis based on Over-Complete rational dilation wavelet transform and auto-correlation of analytic energy operator. Mech. Syst. Signal Process. 2018, 100, 662–693. [Google Scholar] [CrossRef]
- Zhang, X.H.; Kang, J.S.; Jin, T.D. Degradation modeling and maintenance decisions based on Bayesian belief networks. IEEE Trans. Reliab. 2014, 63, 620–633. [Google Scholar] [CrossRef]
- Huang, C.J.; Song, H.J.; Qin, N. Fault feature extraction of rolling bearings based on complex envelope spectrum. J. Vib. Shock 2021, 40, 189–195. (In Chinese) [Google Scholar]
- De Godói, L.; De Oliveira, N. Denoising convolutional autoencoder configuration for condition monitoring of rotating machines. J. Braz. Soc. Mech. Sci. 2021, 43, 1–13. [Google Scholar] [CrossRef]
- Liu, X.L.; Liu, H.G.; Yang, J.H.; Litak, G.; Cheng, G.; Han, S. Improving the bearing fault diagnosis efficiency by the adaptive stochastic resonance in a new nonlinear system. Mech. Syst. Signal Process. 2017, 96, 58–76. [Google Scholar] [CrossRef]
- Ambrożkiewicz, B.; Syta, A.; Gassner, A.; Georgiadis, A.; Litak, G.; Meier, N. The influence of the radial internal clearance on the dynamic response of self-aligning ball bearings. Mech. Syst. Signal Process. 2022, 171, 108954. [Google Scholar] [CrossRef]
- Han, M.D. Study on tunnelling loads and structural performance of cutterhead of full face rock tunnel boring machine. Ph.D. Thesis, Tianjin University, Tianjin, China, 2017. (In Chinese). [Google Scholar]
- Bomidi, J.; Weinzapfel, N.; Slack, T.; Mobasher Moghaddam, S.; Sadeghi, F.; Liebel, A.; Weber, J.; Kreis, T. Experimental and numerical investigation of torsion fatigue of bearing steel. J. Tribol. 2013, 135, 031103. [Google Scholar] [CrossRef]
- Xiao, Y.C.; Li, S.; Gao, Z. A continuum damage mechanics model for high cycle fatigue. Int. J. Fatigue 1998, 20, 503–508. [Google Scholar] [CrossRef]
- Roxborough, F.F.; Liu, Z.C. Theoretical considerations on pick shape in rock and coal cutting. In Proceedings of the 6th Underground Operator’s Conference, Kalgoorlie, WA, Australia, 13–14 November 1995. [Google Scholar]


Disclaimer/Publisher’s Note: The statements, opinions and data contained in all publications are solely those of the individual author(s) and contributor(s) and not of MDPI and/or the editor(s). MDPI and/or the editor(s) disclaim responsibility for any injury to people or property resulting from any ideas, methods, instructions or products referred to in the content. |
© 2023 by the authors. Licensee MDPI, Basel, Switzerland. This article is an open access article distributed under the terms and conditions of the Creative Commons Attribution (CC BY) license (https://creativecommons.org/licenses/by/4.0/).