Abstract
The initial solidification of the shell and the effect of the negative strip on oscillation marks were studied during the oscillation of the mold. A two-dimensional model was established concerning mold oscillation, which was coupled with fluid flow, heat transfer, and solidification, and the validity of the model was verified. The results show that oscillation marks were formed at the negative strip stage and that the quality of the slabs can be improved by reducing the duration of the negative strip stage. During the negative strip stage, the shell was affected by the strong backflow of liquid slag and the pressure on the surface sharply increased, resulting in the formation of a depression oscillation mark on the shell. The effects of the negative strip stage on the initial solidified shell during each cycle were compared. As the depth of the oscillation mark decreased, the upward shear stress on the shell’s surface increased, without the occurrence of a negative strip stage during one cycle. The results provided a new method for reducing oscillation marks and are of great significance for improving casting slabs’ quality.
1. Introduction
Continuous casting is a method that allows molten steel to be immediately poured into a given shape. The main defects of slabs are surface cracks [1], fractures, and segregation [2,3]. With the increasing development and maturity of continuous casting technology, continuous casting is developing toward high quality and a near-optimal form; hence, it is necessary to understand the formation of the shell to improve the quality of the slab.
The quality of a slab can be determined by ascertaining the parameters of the casting process according to the research findings presented in [4,5]. The negative strip stage () is generally considered to be a special stage, which affects the quality of the slabs. The negative strip stage refers to the period during which the mold speed is higher than the casting speed as the mold moves downward during a cycle, whereas the remaining time is termed the positive strip stage (). Among the main defects of the continuous casting of a slab, oscillation marks (OMs) constitute the main cause of the formation of surface cracks and segregation [6,7]. Therefore, research into the initial solidification of a shell and oscillation marks has attracted a significant amount of attention.
Badri et al. found that the sudden increase in heat flux during the led to the irregular solidification of the shell in an experimental device [8,9]. Lopez et al. demonstrated the influence of slag infiltration on shell solidification and the formation of OMs and proposed a mechanism of OM formation determined by a transient coupled model [10,11]. Yan et al. indicated that the phenomenon of liquid slag reflowing into the slag pool became more severe with an increase in the modification ratio during the [12]. Zhang and Wang et al. studied the behavior of molten slag in the gap of a shell and mold and found that during the , liquid slag was extruded and returned to the slag pool, while a large amount of liquid slag infiltrated into the slag channel [13]. Deng et al. reported that the for slag consumption was more than the , and slag consumption increased with the decrease in [14]. Zhang et al. described the initial phases of solidification and slag infiltration and carried out a parametric study to predict the influence of different casting variables on the initial solidified shell [15,16,17]. Consequently, it was determined that the depth of the OM increased with the decrease in the oscillation frequency, while the decrease in the casting speed and oscillation amplitude led to a decrease in the depth of the OM. Yang et al. proposed that OMs formed at the end of the or the beginning of the , and that the depth of the OM decreased with the increase in casting speed based on a quantitative analysis of the influence of casting speed on the formation of OMs [18,19].
Although appropriate alloys with a low melting point could be found in place of molten steel and slag to operate in laboratory experiments, the evolution of shell growth has not yet been analyzed. Some studies have used mathematical modeling to describe the coupling phenomenon in the mold and the relationship between the casting parameters and the response, but they have not provided information on the evolution of the initial solidification of shell and the effect of the on the initial solidification. Therefore, a coupled mathematical model was established according to the industrial operating conditions. It was used to describe the initial solidification process of the shell and the influence of the on initial solidification. The transient flow behavior of the slag, the evolution of the shell’s profile, and the pressure variation of the shell’s surface at different moments were studied, and the effects of a negative strip on the depth of the OMs, the thickness of the slag, the shear stress on the shell, the downward velocity of the slag at the solid–liquid slag interface, and the downward velocity of the slag on the shell’s surface were compared. Understanding the influence of negative strips is essential to ensuring ideal casting conditions and improving slabs’ quality.
2. Mathematical Model
2.1. Assumptions
- (1)
- Molten steel is an uncompressible Newtonian fluid, slag is a non-Newtonian fluid;
- (2)
- The model was isothermal at the beginning;
- (3)
- The taper and arc of the mold were neglected;
- (4)
- The fluid flow and heat transfer in the mold are symmetric; hence, only half of the mold was analyzed.
2.2. Governing Equation
The main phenomena analyzed in the model were multiphase flow, heat transfer, steel solidification, and mold oscillation. The model was solved by using the software Fluent. The Volume of Fluid (VOF) method [20] was used to calculate the phase distribution. The Continuum Surface Force (CSF) method [21] was used to trace the phase interface. The turbulent flow in the model was solved using the k-ε model [22], while the enthalpy–porosity technique [23] was used to capture the solidification of steel.
Continuity equation is as follows:
where denotes effective density (kg/m3) and denotes the velocity vector (m/s).
where denotes the volume fraction of steel; denotes the density of steel (kg/m3); denotes the density of the protection slag (kg/m3).
The momentum equation is as follows:
where P denotes the pressure (Pa); denotes the acceleration of gravity (m/s2); denotes the momentum term due to interfacial tension; denotes the momentum loss induced in the fuzzy region during solidification.
where denotes the effective viscosity (Pa∙s); denotes the viscosity of steel (Pa∙s); is the viscosity of the slag (Pa∙s).
where denotes the surface tension of the steel slag (N/m).
where denotes the liquid volume fraction; denotes the fuzzy parameter, was set to in the current study; is the casting speed (m/s).
where is the solid phase line temperature (K), denotes the liquid phase line temperature (K).
The energy equation is as follows:
where denotes the enthalpy (J/kg); denotes the effective thermal conductivity (W/m∙K); denotes the effective shear stress tensor (Pa).
2.3. Computing Domain and Mesh
The established two-dimensional model included the submerged entry nozzle (SEN) port, slab model, and copper plate. In order to understand the slag infiltration and shell growth in real practice, a 50 mm thickness of slag was added on the top of the steel surface, which supplied the liquid slag to naturally infiltrate into the slag channel with the mold oscillation to lubrication. The initial thickness of the air was 50 mm, which added to the top of the slag surface. The initial temperatures of the fluid and solid were 1805 K and 405 K, respectively. The entire computational domain was divided by a structured quadrilateral mesh, the mesh was refined near the steel–slag interface, and the spacing between adjacent mesh was gradually increased along the direction of the mold exit. The total mesh number was approximately 170,000, the ratio was 1.03, the max element seed size was 2.5 mm, and the minimum mesh was 50 . In order to better capture the behavior near the meniscus and the shell growth process, the interface between fluid and solid was refined, as shown in Figure 1. The geometry of the model is shown in Table 1. The material parameters are shown in Table 2. The break temperature of the slag is the crystallization temperature, the viscosity of the slag increases significantly when the temperature is below the break temperature. Hence, the break temperature of the slag was used to distinguish the solid and liquid slag.
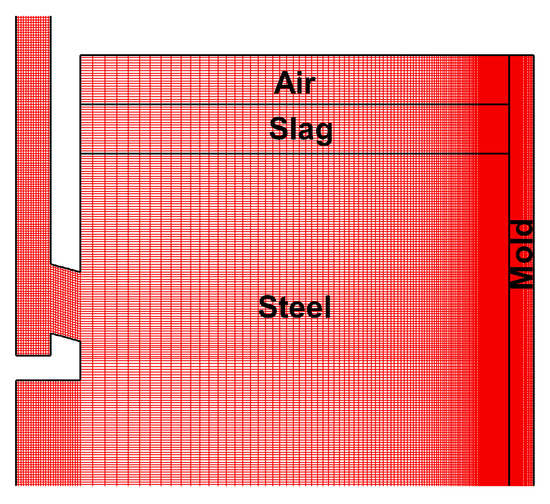
Figure 1.
Refined area of the model mesh.

Table 1.
Casting parameter.
Table 2.
Material parameter.
2.4. Boundary Conditions
The inlet was defined as velocity inlet. The inlet velocity was calculated by the conservation of mass. The calculation formula was as follows. The inlet velocity in this study was 1.1988 m/s.
where is the inlet area, m2; is the exit area, m2. The k and ε in the entrance boundary are calculated as
The top surface was defined as free surface. The temperature of the top surface was set to 303 K, and the pressure was set to standard atmospheric pressure. The outlet was defined as outflow, which assumed that the flow at the outlet was fully developed and that the gradient value of each variable along the flow direction was zero. The model was a half symmetric model, the SEN and mold centerline were set as symmetric boundaries. The upper and lower surfaces of the copper plate and the SEN had a little heat loss, the default was no heat loss. Hence, upper and lower surfaces of the copper plate were defined as the adiabatic boundary. The interface between the fluid and the solid domain was set as “interface”, and the heat flux and velocity transfer were realized by coupling. The first and second cooling zones were set as convective heat transfer boundaries. The heat transfer coefficient of the first cooling zone was determined by Equation (12) [13], and the temperature of this boundary was set as the cooling water temperature. The heat transfer coefficient of the second cooling zone was determined by Equation (13) [13], and the temperature of this boundary was set to 300 K. The heat transfer coefficient of the first cold zone and the heat transfer coefficient of the second cooling zone were 27,000 and 2000 , respectively, in the current study.
where is the hydraulic diameter (m); is the velocity of water flow (m/s); is the water density (kg/m–3); is the water viscosity (kg/m∙s); is the specific heat of water (J/kg∙K); is the thermal conductivity of water (W/m∙K); is the temperature of spray cooling water [13].
In this study, the mold oscillation mode was sinusoidal, the dynamic mesh was used to implement the mold oscillation. The equations for mold displacement and velocity are expressed as follows:
where is the mold oscillation velocity, represents an amplitude of 2.95 mm, represents a frequency of 2.9 Hz in this study. The detailed boundary setting is shown in Figure 2.
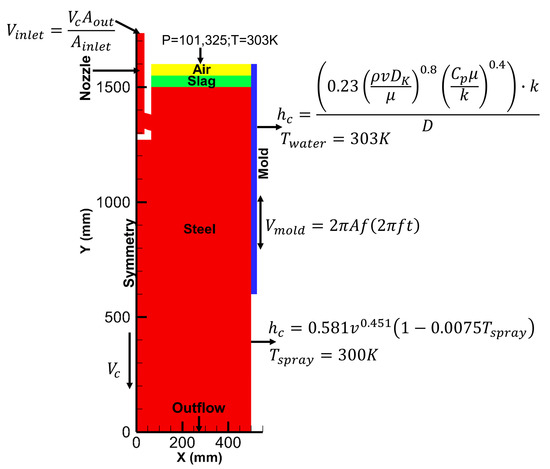
Figure 2.
Boundary conditions of model.
The current model was calculated using an Intel(R) Core (TM) i5-1035G1 CPU with the Fluent 19.2, the time step was 0.00001 s, the time step could be enhanced to 0.0001 s when the solution reached a steady state, the results were calculated for over one month.
3. Model Verification
3.1. Temperature, Phase Distribution, and Flow of Fluid in Mold
Figure 3 shows the vector figure of the flow field, temperature field, and phase distribution, the blue region is the shell (the steel liquid volume fraction was less than 0.9). The liquid steel level near the mold wall was higher than that on the side of the SEN port, and the thickness of the slag layer near the SEN port was higher than that near the mold wall. After the liquid steel was jetted from the SEN port, upper and lower backflows were generated, there was a small backflow near the shell with a speed of 0.1 m/s. The fluctuation of the liquid level was caused by upper backflow. The superheat of the molten steel gradually dissipated with the flow, the molten steel temperature near the slag layer was 1810 K. The performance of the slag layer was determined by the transport of the upper flow, and the upper flow provided heat for the melting of the slag. The flow pattern of molten liquid was in good agreement with those previous results by Ho and Yang [24,25].
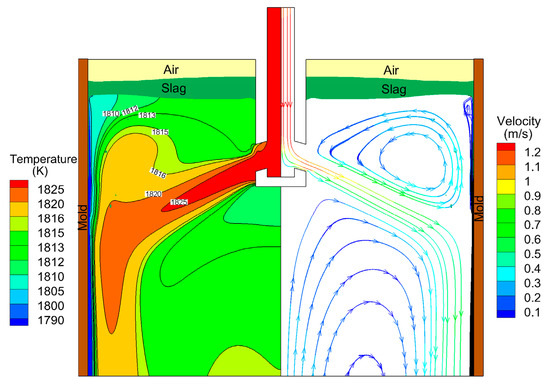
Figure 3.
Flow field, temperature field, and phase distribution in the mold.
3.2. Shell Thickness and Oscillation Marks
The predicted transient slag consumption per unit strand area (, kg/m2) [26] and slag consumption per unit length in one cycle of oscillation (, g m–1 cycle–1) [26] were shown in Figure 4a. The predicted slag consumption per unit length in one cycle of oscillation was compared with the measurement in the plant by Shin, as shown in Figure 4b. The maximum slag consumption occurred near the , the average slag consumption was 0.43 kg/m2 (3.45 g m–1 cycle–1), which was 25 percent higher than that from plant data [26]. This was due to the slag viscosity being different. The slag viscosity was 0.32 kg/(m·s) in the plant; nevertheless, the slag viscosity was 0.18 kg/(m·s) in the current study. The slag consumption increased with the decrease in slag viscosity.
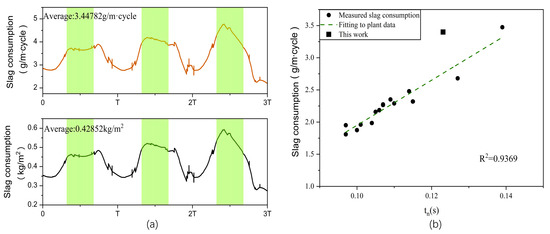
Figure 4.
Comparison of slag consumption: (a) transient slag consumption, (b) comparison of predicted slag consumption with measurements from Shin et al.’s data from [26].
The predicted initial shell was exhibited in Figure 5. Compared with the shell solidification described by Bikerman’s equation, the predicted surface of the shell was irregular, which could more veritably reflect the solidification of the shell. Because the width of the slag channel was not assumed, slag naturally infiltrated between the shell and mold to form the slag channel. The predicted OM depth was between 0.355 and 0.482 mm, average OM depth was 0.419 mm, and the error was 23 percent compared with the measured plant value of 0.34 mm [26], so there was a good consistency.
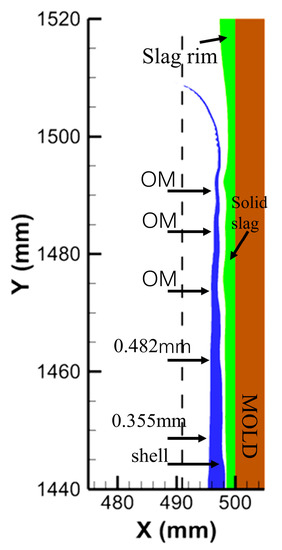
Figure 5.
Predicted initial shell.
Generally, this model showed sufficient accuracy to investigate initial shell solidification and the effect of negative strip time on oscillation marks during continuous casting, according to the comparisons of slag consumption and the depth of oscillation marks.
The above model was verified by comparisons of the flow pattern, slag consumption, and OM depth, and the current model demonstrated sufficient accuracy to study the initial solidification near the meniscus and oscillation mark formation.
4. Discussion
4.1. Slag Infiltration
In order to study the initial solidification near the meniscus and oscillation mark formation, different moments during the continuous casting process were selected for observation, as shown in Figure 6. The moment from t1 to t3 in Figure 6 was , the rest of the period was .
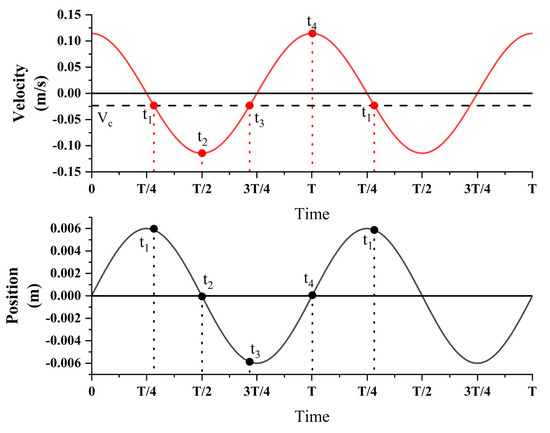
Figure 6.
Velocity and displacement of the mold.
The transient flow behavior of slag is shown in Figure 7. The blue area is the shell, the red area is the molten steel, and the initial meniscus is the initial steel–slag interface. During the (i.e., from t1 to t3) and the moment when the mold moved to its highest position (t4), a backflow of slag occurred near the meniscus. During the , a backflow of slag mainly occurred near the initial shell, while a backflow of slag occurred near the slag rim at t4. The backflow of slag during the was caused by the continuous squeezing of the slag channel by the slag rim, which moved downward with the mold. However, at t4, it was due to the slag rim moving upward with the mold, and the slag near the slag rim flowed upward with the slag rim under the action of inertia. During the whole oscillation period, most of the slag in the slag channel infiltrated downward.
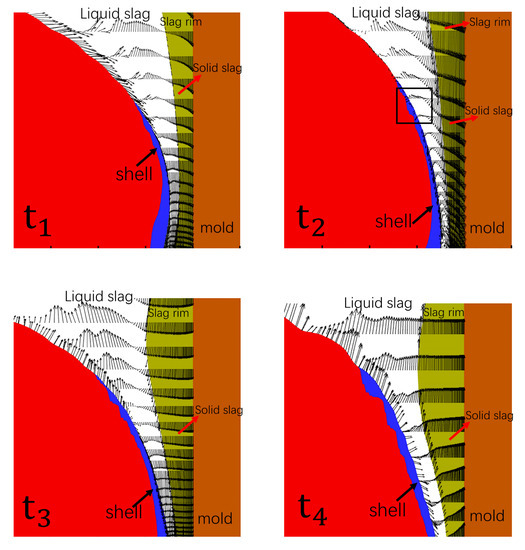
Figure 7.
Transient flow behavior of slag during one cycle.
4.2. Evolution of the Shell Surface and Pressure Variation of the Shell Surface
Figure 8 showed the evolution of the shell profile at different oscillation stages. At t2 (i.e., the middle of the ), the front of the shell showed an obvious depression, the depression was the initial oscillation mark. Combined with Figure 7, it can be seen that at this moment, the slag was squeezed out from the slag channel into the slag pool, and the backflow of slag impacted on the surface of the initial solidified shell, thus causing the formation of the oscillation mark. The shell was gradually pulled down at the casting speed. This indicated that oscillation marks were formed in ; hence, the oscillation marks can be reduced by adjusting the .
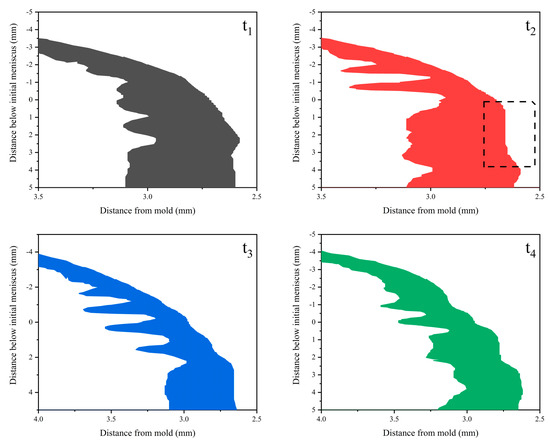
Figure 8.
Evolution of shell profile during one cycle.
Figure 9 exhibited pressure variation of the shell surface at different oscillating stages. The shell pressure gradually increased from top to bottom, and the shell gradually thickened. During the (i.e., from t3 to t4), the pressure of the shell surface decreased. During the (i.e., from t1 to t3), the pressure increased and then decreased. At t4 (i.e., the middle of the ), the pressure of the shell surface was the lowest, with 1625 Pa. At t2 (i.e., the middle of the ), the pressure of the shell surface was the highest, with 1854 Pa. Combined with Figure 7, the sudden increase in pressure at t2 was caused by the strong backflow of the slag, so the depressed oscillating marks were formed on the surface of the shell as shown in Figure 8.
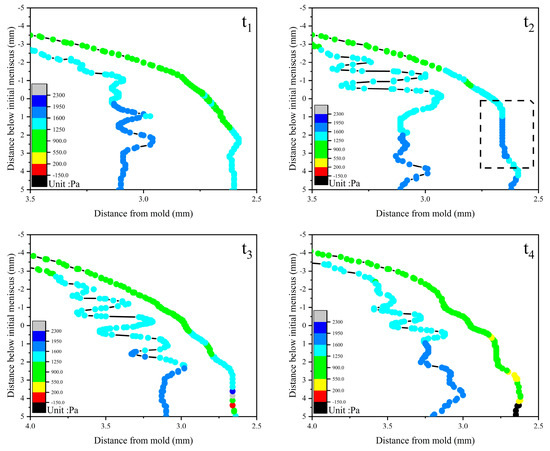
Figure 9.
Pressure variation of the shell surface during one cycle.
4.3. Formation of Oscillation Marks
Figure 10 showed the transient heat flux 10 mm below the meniscus. The variation in heat flux trended to decrease first and then increase, which was similar to the variation in mold velocity. The maximum heat flux was 3.64 MW/m2 during the , and the heat flux depended on the thickness of the slag. Heat flux increased gradually during the , and reached a peak near the middle of the , which resulted from the flow of slag in Figure 7, and the enhancement of slag flow led to the increase in heat flux generated by convective cooling near the meniscus.
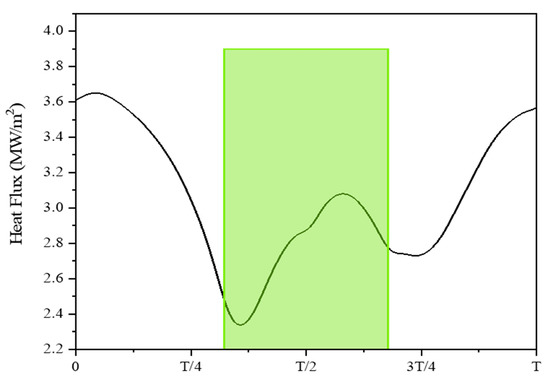
Figure 10.
Transient heat flux 10 mm below the meniscus during one cycle.
According to the results of the slag transient flow behavior, shell shape evolution, pressure variation of the shell surface, and transient heat flux, the formation of the oscillation trace was determined. The formation of oscillating marks was related to . During the , the slag rim moved down with the mold, the slag near the meniscus was squeezed out from the slag channel to the slag pool by the slag rim, and slag backflow generated near the initial shell. Affected by the slag backflow, the shell surface was subjected to pressure increase, and an obvious depression was formed on the outer surface of the shell. Meanwhile, the enhancement of the convective cooling effect made the depression freeze and form before it recovered, and finally an initial oscillation mark was formed, and the shell was gradually pulled out of the mold at casting speed. Hence, the quality of continuous casting products can be improved by adjusting the .
4.4. Comparison of Casting with and without Negative Strip Stage
To validate the effect of on the oscillation marks, the casting case without was calculated. The moment of the half cycle was chosen to compare the influence of the , as shown in Figure 11. The influence of on meniscus solidification was exhibited in Figure 12. The shell surface without was smoother than that with , and the quality of the shell surface was greatly improved.
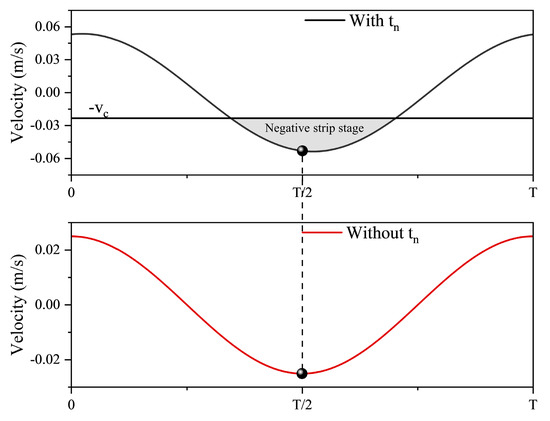
Figure 11.
Oscillation velocity with and without .
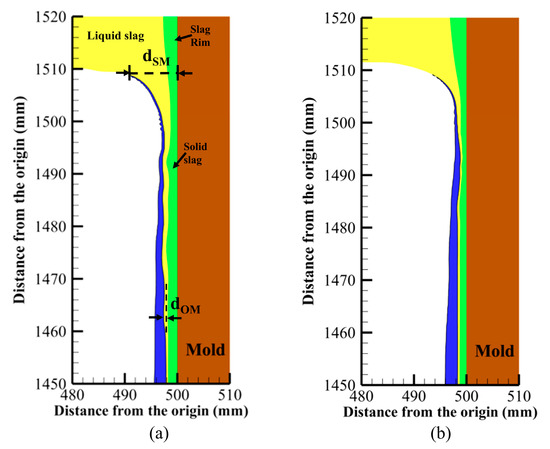
Figure 12.
Influence of negative strip stage on meniscus solidification (a) with , (b) without .
Table 3 compared the calculated results with and without at a distance of 40 mm below the meniscus and summarized the casting conditions. The calculated results of the depth of OM (), the depth of solidified meniscus measured by the distance from shell tip to the mold wall (), total slag thickness (), solid slag thickness (), and liquid slag thickness () were compared, respectively. In the case without , the depth of OM was significantly reduced to 0.016 mm, and the total slag thickness, solid slag thickness, and liquid slag thickness were also reduced. The was reduced from 2.61 to 1.7 mm, the was reduced from 1.8 to 1.27 mm, and the was reduced from 0.81 to 0.43 mm. By comparing with and without , it can be determined that the oscillation marks still occur without , but the depth oscillation marks were smaller, and the surface quality of the slab was significantly improved.
Table 3.
Summary of results with and without .
The downward velocity of the slag on the solid–liquid slag interface and the downward velocity of the slag on the shell surface are demonstrated in Figure 13. In the presence of , the downward velocity of the slag on the solid–liquid slag interface and the downward velocity of the slag on the shell surface fluctuated sharply, the velocity increased gradually with the increase in the distance from the meniscus, the downward velocity was between 0.013 and 0.019 and 0.021 and 0.024 m/s, respectively. In the case without , the downward velocity of the slag on the solid–liquid slag interface and the downward velocity of the slag on the shell surface smoothly fluctuated, the downward velocity was between 0.00063 and 0.01673 and 0.02278 and 0.02538 m/s, respectively. The downward velocity of the slag on the solid–liquid slag interface and the downward velocity of the slag on the shell surface depended on the oscillation velocity of the mold, the solid slag thickness, and the casting speed.
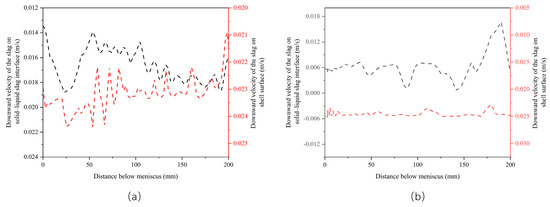
Figure 13.
The downward velocity of the slag on solid–liquid slag interface and the downward velocity of the slag on shell surface (a) with , (b) without .
Lubrication during continuous casting was related to the liquid slag, and the comparison of the thickness of the liquid slag is shown in Figure 14. The thickness of the liquid slag gradually decreased with the increase in distance from the meniscus, the thickness was between 0.2 and 1.15 and 0.16 and 0.86 mm, with and without , respectively. The thickness of the liquid slag was determined by the shell surface temperature and the properties of the slag.
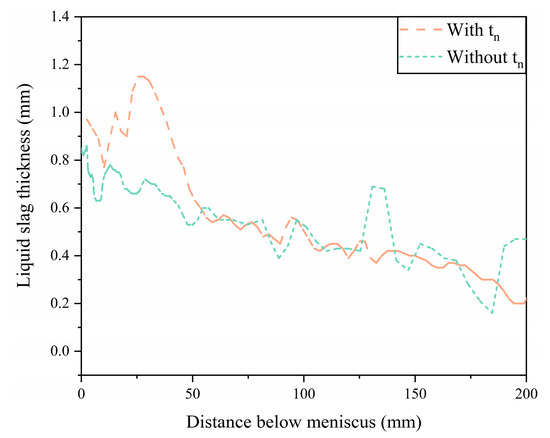
Figure 14.
Comparison of the thickness of the liquid slag with and without .
The smooth demolding of the shell was related to the shear stress (friction) of the shell surface. The shear stress acting on the shell surface could be calculated according to Equation (16) [17], and the comparison of the shear stress acting on the shell with and without is illustrated in Figure 15. The upward shear stress on the shell surface increased as the distance from the meniscus increased. The upward shear stress on the shell surface was 8.30 to 82.41 and 38.46 to 191.5 Pa with and without , respectively. The upward shear stress on the shell surface was related to the relative velocity of the mold and shell and the thickness of the liquid slag.
where is the vertical velocity of the liquid slag (m/s), is the horizontal coordinate of the liquid slag (m).
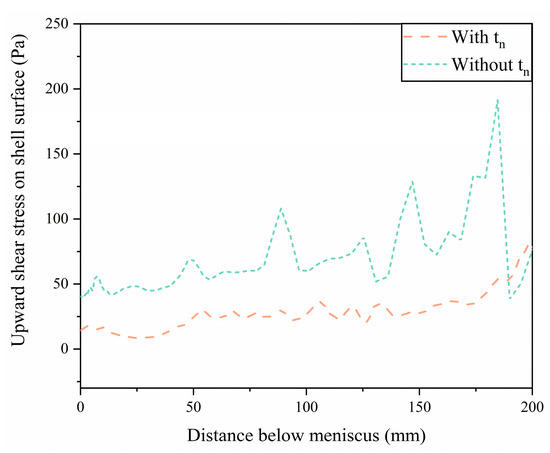
Figure 15.
Comparison of the shear stress acting on the shell with and without .
It was important to understand and pay close attention to the negative strips of the continuous casting process to ensure ideal casting conditions for operators. The depth of the oscillation marks was reduced with the decrease in as discussed above. By controlling the process parameters and combining with the pre-warning system, the stability of the continuous casting can be guaranteed, and the quality of the slabs can be improved. The ideal negative strip was determined, which was conducive to ensuring the best balance between surface quality and mold lubrication.
5. Conclusions
A two-dimensional model was established in the current study to study the initial solidification of the shell and the effect of on the oscillation mark during the continuous casting process. The specific conclusions were drawn as follows:
- 1.
- The predicted flow pattern, slag consumptions, and oscillation mark depth were compared with the measured results from plants in this study; the results showed a good agreement and the validity of the model was verified.
- 2.
- The flow behavior of the slag was related to the movement of the slag rim, and the OM was formed during the . During the , when the slag rim attached to the mold wall and moved down with it, the movement of liquid slag near the meniscus was affected by the slag rim, and strong backflow of slag occurred near the initial shell, resulting in a sudden increase in the pressure on the surface of the shell and an obvious depression OM was formed on the outer surface of the shell.
- 3.
- With decreasing to no- during one cycle, the depth of OM, total slag thickness, solid slag thickness, and liquid slag thickness decreased, the surface of the slab was smoother, and the quality of the slab was significantly improved.
- 4.
- The downward velocity of the slag on the solid–liquid slag interface and the downward velocity of the slag on the shell surface increased with the increase in the distance from the meniscus. The downward velocity increased with decreasing to no- during one cycle, which was related to the mold oscillation velocity, slag thickness, and casting speed.
- 5.
- The upward shear stress on the shell surface increased with the increase in the distance from the meniscus. With decreasing to no- during one cycle, the upward shear stress on the shell surface increased, which was related to the relative velocity of the mold and shell and the thickness of the liquid slag.
- 6.
- The depth of the oscillation mark could be reduced by shorting , and the quality of the slabs was improved. The results provide a new perspective for reducing oscillation marks and are of great significance for improving casting slabs’ quality.
Author Contributions
Writing—original draft, investigation, and resources, M.C.; funding acquisition and project administration, X.Z.; methodology and validation, M.C.; conceptualization and formal analysis, Y.L.; data curation, software, and visualization, Y.L.; writing—review and editing and formal analysis, M.C. All authors have read and agreed to the published version of the manuscript.
Funding
This research was funded by Hebei Province Natural Science Foundation of China (Granted No. E2020203128) and Hebei Education Department Higher Education Science and Technology Program (NATURAL SCIENCE) (Granted No. ZD2021106).
Data Availability Statement
Not applicable.
Conflicts of Interest
The authors declare no conflict of interest.
References
- Konishi, J.; Militzer, M.; Samarasekera, I.V.; Brimacombe, J.K. Modeling the formation of longitudinal facial cracks during continuous casting of hypoperitectic steel. Metall. Mater. Trans. B 2002, 33, 413–423. [Google Scholar] [CrossRef]
- Choudhary, S.; Ganguly, S. Morphology and Segregation in Continuously Cast High Carbon Steel Billets. ISIJ Int. 2007, 47, 1759–1766. [Google Scholar] [CrossRef]
- Choudhary, S.K.; Ganguly, S.; Sengupta, A.; Sharma, V. Solidification morphology and segregation in continuously cast steel slab. J. Mater. Process. Technol. 2017, 243, 312–321. [Google Scholar] [CrossRef]
- Kamaraj, A.; Dash, A.; Murugaiyan, P.; Misra, S. Investigation on Mold Flux Melting and Consumption During Continuous Casting of Liquid Steel. Metall. Mater. Trans. B 2020, 51, 2159–2170. [Google Scholar] [CrossRef]
- Cibulka, J.; Krzok, R.; Hermann, R.; Bocek, D.; Cupek, J.; Michalek, K. Impact of Oscillation Parameters on Surface Quality of Cast Billets. Arch. Metall. Mater. 2016, 61, 283–288. [Google Scholar] [CrossRef]
- Takeuchi, E.; Brimacombe, J.K. The formation of oscillation marks in the continuous casting of steel slabs. Metall. Mater. Trans. B 1984, 15, 493–509. [Google Scholar] [CrossRef]
- Takeuchi, E.; Brimacombe, J.K. Effect of oscillation-mark formation on the surface quality of continuously cast steel slabs. Metall. Mater. Trans. B 1985, 16, 605–625. [Google Scholar] [CrossRef]
- Badri, A.; Natarajan, T.T.; Snyder, C.C.; Powers, K.D.; Mannion, F.J.; Byrne, M.; Cramb, A.W. A mold simulator for continuous casting of steel: Part II. The formation of oscillation marks during the continuous casting of low carbon steel. Metall. Mater. Trans. B 2005, 36, 373–383. [Google Scholar] [CrossRef]
- Badri, A.; Natarajan, T.T.; Snyder, C.C.; Powers, K.D.; Mannion, F.J.; Cramb, A.W. A mold simulator for the continuous casting of steel: Part I. The development of a simulator. Metall. Mater. Trans. B 2005, 36, 355–371. [Google Scholar] [CrossRef]
- Lopez, P.E.R.; Lee, P.D.; Mills, K.C. Explicit modelling of slag infiltration and shell formation during mould oscillation in continuous casting. ISIJ Int. 2010, 50, 425–434. [Google Scholar] [CrossRef]
- Lopez, P.E.R.; Lee, P.D.; Mills, K.C.; Santillana, B. A New Approach for Modelling Slag Infiltration and Solidification in a Continuous Casting Mould. ISIJ Int. 2010, 50, 1797–1804. [Google Scholar] [CrossRef]
- Yan, X.; Jia, B.; Wang, Q.; He, S.; Wang, Q. Mold Nonsinusoidal Oscillation Mode and Its Effect on Slag Infiltration for Lubrication and Initial Shell Growth during Steel Continuous Casting. Metals 2019, 9, 418. [Google Scholar] [CrossRef]
- Zhang, S.; Wang, Q.; He, S.; Wang, Q. Study of the Mechanism of Liquid Slag Infiltration for Lubrication in Slab Continuous Casting. Metall. Mater. Trans. B 2018, 49, 2038–2049. [Google Scholar] [CrossRef]
- Deng, Y.; Zhang, Y.; Wang, Q.Q.; Wang, Q. Study of Mold Oscillation Parameters and Modes on Slag Lubrication in Slab Continuous Casting. JOM 2018, 70, 2909–2916. [Google Scholar] [CrossRef]
- Zhang, X.-b.; Chen, W.; Zhang, L.-f. A coupled model on fluid flow, heat transfer and solidification in continuous casting mold. China Foundry 2017, 14, 416–420. [Google Scholar] [CrossRef]
- Zhang, X.; Chen, W.; Scheller, P.R.; Ren, Y.; Zhang, L.F. Mathematical Modeling of Initial Solidification and Slag Infiltration at the Meniscus of Slab Continuous Casting Mold. JOM 2019, 71, 78–87. [Google Scholar] [CrossRef]
- Zhang, X.; Dan, Z.; Chen, W.; Zhang, L.; Wang, Q. Mathematical Modeling on Slag Consumption and Lubrication in a Slab Continuous Casting Mold. Metall. Mater. Trans. B 2021, 52, 322–338. [Google Scholar] [CrossRef]
- Yang, J.; Cai, Z.Z.; Zhu, M.Y. Transient Thermo-fluid and Solidification Behaviors in Continuous Casting Mold: Evolution phenomena. ISIJ Int. 2018, 58, 299–308. [Google Scholar] [CrossRef]
- Yang, J.; Meng, X.; Zhu, M. Transient Thermo-fluid and Solidification Behaviors in Continuous Casting Mold: Oscillation Behaviors. ISIJ Int. 2018, 58, 2071–2078. [Google Scholar] [CrossRef]
- Liovic, P.; Liow, J.-L.; Rudman, M. A Volume of Fluid (VOF) Method for the Simulation of Metallurgical Flows. ISIJ Int. 2001, 41, 225–233. [Google Scholar] [CrossRef]
- Brackbill, J.U.; Kothe, D.B.; Zemach, C. A continuum method for modeling surface tension. J. Comput. Phys. 1992, 100, 335–354. [Google Scholar] [CrossRef]
- Launder, B.E.; Spalding, D.B. Lectures in Mathematical Models of Turbulence; Academic Press: London, UK, 1972; 169p, Available online: https://lib.ugent.be/catalog/rug01:000004139 (accessed on 2 January 2023).
- Brent, A.D.; Voller, V.R.; Reid, K.J. Enthalpy-porosity technique for modeling convection-diffusion phase change: Application to the melting of a pure metal. Numer. Heat Transf. 1988, 13, 297–318. [Google Scholar] [CrossRef]
- Ho, Y.-H.; Hwang, W.-S. The Analysis of Molten Steel Flow in Billet Continuous Casting Mold. ISIJ Int. 1996, 36, 1030–1035. [Google Scholar] [CrossRef]
- Yu, Y.; Luo, X.C. Identification of heat transfer coefficients of steel billet in continuous casting by weight least square and improved difference evolution method. Appl. Therm. Eng. 2017, 114, 36–43. [Google Scholar] [CrossRef]
- Shin, H.J.; Kim, S.H.; Thomas, B.G.; Lee, G.G.; Park, J.M.; Sengupta, J. Measurement and prediction of lubrication, powder consumption, and oscillation mark profiles in ultra-low carbon steel slabs. ISIJ Int. 2006, 46, 1635–1644. [Google Scholar] [CrossRef]


Disclaimer/Publisher’s Note: The statements, opinions and data contained in all publications are solely those of the individual author(s) and contributor(s) and not of MDPI and/or the editor(s). MDPI and/or the editor(s) disclaim responsibility for any injury to people or property resulting from any ideas, methods, instructions or products referred to in the content. |
© 2023 by the authors. Licensee MDPI, Basel, Switzerland. This article is an open access article distributed under the terms and conditions of the Creative Commons Attribution (CC BY) license (https://creativecommons.org/licenses/by/4.0/).