Review

Meta-GGA SCAN Functional in the Prediction of Ground State Properties of Magnetic Materials: Review of the Current State

by
Vladimir Sokolovskiy
1,2,*,
Danil Baigutlin
1,
Olga Miroshkina
3 and
Vasiliy Buchelnikov
1,*
1
Department of Condensed Matter Physics, Chelyabinsk State University, 454001 Chelyabinsk, Russia
2
Department for Functional Nanosystems and High Temperature Materials, National University of Science and Technology “MISiS”, 119049 Moscow, Russia
3
Faculty of Physics and Center for Nanointegration Duisburg-Essen (CENIDE), University of Duisburg-Essen, 47057 Duisburg, Germany
*
Authors to whom correspondence should be addressed.
Metals 2023, 13(4), 728; https://doi.org/10.3390/met13040728
Submission received: 7 March 2023 / Revised: 31 March 2023 / Accepted: 3 April 2023 / Published: 7 April 2023

Abstract

:
In this review, we consider state-of-the-art density functional theory (DFT) investigations of strongly correlated systems performed with the meta-generalized gradient approximation (meta-GGA) strongly constrained and appropriately normed (SCAN) functional during the last five years. The study of such systems in the framework of the DFT is complicated because the well-known exchange–correlation functionals of the local density approximation (LDA) and generalized gradient approximation (GGA) families are not designed for strong correlations. The influence of the exchange–correlation effects beyond classical LDA and GGA are considered in view of the prediction of the ground state structural, magnetic, and electronic properties of the magnetic materials, including pure metals, binary compounds, and multicomponent Heusler alloys. The advantages of SCAN and points to be enhanced are discussed in this review with the aim of reflecting the modern state of computational materials science.

1. Introduction

First-principles (ab initio) methods are based on quantum mechanics and quantum chemistry, which characterizes the electronic states of matter at the nanoscale. Since, within the framework of ab initio methods, the system can be described by the apparatus of quantum mechanics only, first-principles calculations do not depend on any external parameters but use only the atomic numbers of the constituent atoms of the system. In the 1930s, only simple hydrogen-like atoms were studied using quantum mechanical methods. Nowadays, the number of atoms has increased to several thousands due to the development of density functional theory (DFT) [1,2], which is one of the most effective modern first-principles approaches for studying many-particle systems and predicting material properties.
The commonly used DFT is called the Kohn–Sham (KS) DFT. Here, the ground state electron density n ( r ) and the total energy E ( n ) for nonrelativistic interacting electrons in the external potential can be found exactly by solving self-consistent one-electron equations
E ( n ) = 1 2 i , σ ψ i , σ * ( r ) ψ i , σ ( r ) + V e x t ( r ) d r + 1 2 n ( r ) n ( r ) | r r | d r d r + E x c ( n ) ,
where the first three terms correspond to the kinetic energy, the energy of interaction with the external field, and the Hartree energy, respectively. The last term in this equation accounts for the innumerable exact universal exchange–correlation energy  E x c ( n ) as a function of n = i , σ o c c | ψ i , σ | 2 , where ψ i , σ are KS orbitals. Formally, the exchange–correlation energy can be expressed as half of the Coulomb interaction between each electron and its exchange–correlation hole in the double space integral [3,4], but this is impossible in practice.
Since the exact form of the exchange–correlation energy E x c is unknown, it is an pressing problem to develop effective approximations for it. Thus, the efficiency of the DFT study depends on the choice of such approximation, and over the decades, scientists have been trying to make these approximations for E x c more precise. Today, there are several generations of approximations, which are ascribed to the so-called Jacob’s ladder.
The rungs of this ladder are attributed to certain generations of the exchange–correlation approximation, which, in turn, include several variants of the exchange–correlation functionals. Roughly speaking, the approximation is a scheme, while the functional is one variant of this scheme realization. Passing from the first to fourth rungs, the accuracy of the approximation is intended to increase, consequently increasing the computational cost.
On the first rung are the Local Density Approximation (LDA) and the Local Spin-Density Approximation (LSDA) [5,6,7]. They are based on the assumption that, locally, the electron density n ( r ) represents a homogeneous electron gas. Thus, in this approximation, the electron densities n ( r ) in LDA and the spin densities n ( r ) and n ( r ) in LSDA related to the total electron and magnetization densities are independent of the coordinate r , and the exchange-correlation energy is expressed as E x c LSDA [ n , n ] = d 3 r n ε x c unif ( n , n ) , where ε x c unif ( n , n ) is the exchange–correlation energy of each electron gas particle with the same spin densities n and n that are known with high precision from the quantum Monte Carlo method and other multielectron methods [8]. LDA accurately predicts lattice parameters for a wide class of materials with a deviation of about 2% (usually less) [9,10,11]. At the same time, LSDA functionals can yield incorrect lattice types or magnetic ordering of the ground state, e.g., for the pure metals Fe, Co, Ni, etc. [12,13]. In addition, LDA significantly overestimates the cohesive energy by up to several eV [12,14] and underestimates the band gap width [15,16], predicting metallic instead of semiconducting behavior [16]. One futher step can be taken if it is assumed that the electronic gas is not homogeneous but changes in density from point to point in the space. This step brings us to the second rung of Jacob’s ladder, which is the Generalized Gradient Approximation (GGA). This is the most successful and, thus, widely used approximation today. Here, in addition to the electron density, electron density gradients and are introduced as extra arguments: E x c GGA [ n , n ] = d 3 r n ε x c GGA ( n , n , n , n ) .
In most cases, the GGA improves the LDA results by giving slightly larger lattice constants [17,18]. The probability of ground state mispredictions is also reduced [12,19]. The GGA works much better than LDA for calculations of cohesive energy: the deviation from the experimental results is about 7% [20]. One of the successes of the GGA is the prediction of the ferromagnetic (FM) bcc ground state of Fe [21,22] or the prediction of new topological half-Heusler materials [23]. Nevertheless, the GGA underestimates the band gap width [24].
The major challenge for LSDA and GGA is predicting an insulating state for strongly correlated materials, in which electronic states cannot be represented by a single determinant of one-electron orbitals. The wrong prediction of a metallic ground state for strongly correlated Mott insulators, for which transition metal oxides (TMOs) with localized d or f bands may be considered prototypical, is one of the most striking failures of the standard local/semilocal density approximations [25,26]. Spin-polarized calculations for some TMOs (NiO and MnO) yield a tiny band gap (up to 95% lower than in experiments) due to antiferromagnetic (AFM) ordering. However, all TMOs are shown to be metallic under a spin unpolarized approach. On the other hand, it has been widely established experimentally that these materials are naturally insulating, even at high temperatures (far over the Néel temperature). The next generation of approximations are called on to solve this problem.
Taking into account additional local components in the expression for the exchange–correlation energy leads us to the so-called meta-GGA approximations, which are located on the third rung of Jacob’s ladder. The meta-GGA additionally accounts for the electron density Laplacian and/or the kinetic energy density [27]:
E x c meta GGA [ n , n ] = d 3 r n ε x c meta GGA ( n n , n , n , 2 n , 2 n , τ , τ ) ,
where τ ( r ) = 1 2 i = 1 N | ψ i ( r ) | 2 is the noninteracting positive kinetic energy density. Because of the numerical derivative instability, the second-order density gradient is often not taken into account. The meta-GGA is realised in many functionals, including the TPSS, RTPSS, MS0, MS1, MS2, mBJ, and SCAN functionals. The latter is a recently developed Strongly Constrained and Appropriately Normed (SCAN) functional, which is the only one that satisfies all known constraints that the exact density functional must fulfill (see Figure 1b) [28]. This should allow SCAN to enhance the prediction of the band gap width.
The underestimation or inability to predict the bang gap is usually attributed to two reasons. The first is the error in the electron self-interaction, which is undoubtedly presented in any local (LDA, GGA) or semilocal (meta-GGA) functional. To exclude this error, one should consider more complex (and noticeably more computationally expensive) hybrid or random phase approximation (RPA) [32] functionals. Hybrid functionals are a mixture of Kohn–Sham (KS) LDA-, GGA-, and meta-GGA-type functionals combined with some exact exchange energies derived from the Hartree–Fock (HF) method
E x c = a E x KS + ( 1 a ) E c HF + b E x KS + ( 1 b ) E x HF .
Here, E x KS and E c KS are the KS orbital exchange and correlation functionals; E x HF and E c HF are the HF orbital exchange and correlation functionals; a and b are the weights of the individual functionals.
The first functional of this type is B3LYP, which was developed by Becke et al. [33]. This level of functional predicts basic physical properties, such as the lattice parameter, cohesion energy, magnetic moments, and even the band gap width, extremely accurately. For the hybrid-PBE HSE functional, for example, the average oscillation is about 6% [16]. The main problem with these functionals is that a and b are usually determined by fitting to experimental (or exactly calculated) data. In addition, these functionals require multiple integrals to be calculated over space, which is computationally demanding.
Another parametric approach to the DFT band problem is to use the Hubbard theory [34]. In particular, when using the LDA or GGA exchange–correlation functionals, the potential of the KS orbitals is independent of orbital occupancy [35]. However, in the case of strong local correlations, adding an electron to a localized orbital that already contains an electron requires additional energy U [36]. However, U is usually obtained by fitting to the experimental results, and hence, the universality and predictive power of a method is drastically reduced, which makes it dependent on experiments, although there are methods of a priori estimation [37].
The second reason for the difficulties associated with band gap estimation is that the fundamental gap ( E g ) for a system containing N electrons is defined as the difference between the ionization potential (I) and the electron affinity (A): E g = I A . On the other hand, the band width E g KS obtained from the DFT calculations is defined as the difference between the eigenvalues of the conductivity band minimum (CBM) and the valence band maximum (VBM):
E g KS = ε CBM ε VBM .
These two definitions of band gap, in general, are not equal, and differ precisely by the derivative discontinuity Δ x c [38,39]
E g E g KS = Δ x c ,
Δ x c = δ E x c δ n | N δ δ E x c δ n | N + δ .
For LDA and GGA, in the limit N , due to the normalization condition n ( r ) d r = 1, all terms of the Taylor series E x c GGA ( n 0 ) E x c GGA ( n 0 + n ψ N ) vanish, except for the leading linear term, which causes Δ x c LDA , GGA = 0 . On the other hand, SCAN contains the nonlocality part τ , and Δ x c SCAN 0 . Thus, despite the remaining self-interaction problem, SCAN predicts a band gap width closer to that shown in the experiment, while maintaining its universality and not requiring parameterization.
Exchange–correlation functionals can be classified in accordance with different features. Based on the usage of the experimental constants, functionals can be divided into parametric (using some external experimental parameters) and nonparametric (based on the mathematical notation of E x c ). On a localization basis, one can distinguish between local, semilocal, and nonlocal. Local functionals approached by a single integral over the three-dimensional electron-density distribution at each point r and semilocal functionals, which are local in the computational sense. In the latter case, E x c depends not only on n ( r ) , but also on some additional contributions those are not necessarily local on n ( r ) , such as n ( r ) and the positive-definite kinetic energy density. Nonlocal functionals are not limited to a single integral. Local and semilocal approximations are accurate, when the exchange–correlation hole is well localized around its electron, e.g., for a helium or free atom. They can also be robust in many molecules and solids near their equilibrium geometries by eliminating errors between exchange and correlation. However, if the exact exchange–correlation hole has several localization centers (it is delocalized), the semilocal approximation is not applicable. In this case, completely nonlocal functionals, such as hybrids, self-interaction-corrected functionals, etc., are needed. To simplify the classification, Jacob’s ladder is usually used. The functionals belonging to the certain class of localization are illustrated in Figure 1.
In this review, we discuss the achievements of the SCAN functional in the prediction of the ground-state properties of pure metals, binary compounds, and multicomponent ternary and quaternary Heusler alloys. Despite the latter rungs of the Jacob’s ladder aiming to be the most accurate, in reality, it does not always work as it is supposed to. Often, the functional, which works best for one class of the materials, may fail for another class. It is known that SCAN works very well for materials with intermediate-range van der Waals (vdW) interactions (right ordering of seven polymorphs of H 2 O ice), ionic bonding (energetic ordering of six polymorphs of MnO 2 ), covalent and metallic bonds (Si under different phases), lattice constants of two-dimensional materials, and highly correlated materials (La 2 CuO 4 , Sr-doped La 2 CuO 4 , and YBa 2 Cu 3 O 6 + x ). Here, we mostly focus on the magnetic materials with complex compositions. We consider the most interesting theoretical investigations conducted with SCAN during the last 10 years and discuss the cases in which this functional can significantly increase the predictive power of the research.

2. Pure Metals

We start with pure metals, and consider alkali metals, alkaline-earth metals, and 3 d -, 4 d -, and 5 d -transition metals. Under normal conditions, all of them crystallize in body-centered cubic ( b c c ), face centered cubic ( f c c ), or hexagonal close-packed ( h c p ) structures. The exceptions are Mn, La, and Hg, which have hexagonal, rhombohedral, and cubic unit cells with 58 atoms, correspondingly [20,40].
We firstly analyze the performance of SCAN in the prediction of the structural properties. The equilibrium lattice parameters of pure metals are summarized in Figure 2. For the alkali metals, taking into account the additional exchange–correlation effect in SCAN does not lead to better agreement with the experiment. Except for Li and Na, where the SCAN results deviate from the experiment only slightly, the lattice parameter is overestimated by ≈2–3, and the inaccuracy is always higher than that of GGA PBE. The reason for the noticeable difference between SCAN and the experiment might be the presence of itinerant electrons in the alkali metals. When passing to alkaline-earth metals, more localized systems are used, where SCAN demonstrates a better performance. However, further enhancement of localization in the systems has a negative effect on the SCAN results, and for the 3 d -transition metals, the performance of SCAN is even worse than GGA in terms of underestimating lattice parameters in the most cases. For the 4 d - and 5 d -transition metals, SCAN gives a comparatively large inaccuracy (up to ≈5–6 for Y and Re) with respect to the experiment. Nevertheless, it works apparently better than GGA, fulfilling the idea that more exchange–correlation interactions are being accounted for, and the inaccuracy does not exceed 2% for the rest of the 4 d - and 5 d -materials.
One can take a closer look at the 3 d -transition metals Fe, Ni, and Co, which are well-studied model systems and for which, consequently, more SCAN studies are presented in the literature [20,41,42,44,45]. Generally, SCAN predicted structural properties of b c c -Fe are in good agreement with the experimental results: SCAN only slightly underestimates [41] the equilibrium volume and decreases the bulk modulus [41,42] of Fe, improving the PBE results. The situation is worse for f c c -Ni and h c p -Co, where SCAN reduces the lattice parameters and overestimates the bulk modulus, having a worse performance than standard local and semilocal functionals [20,41,42]. Note, SCAN reproduces the equilibrium volume of b c c -Fe at the price of producing filled spin-up bands. If the spin-up bands are already filled in the LSDA, as they are for f c c -Ni and h c p -Co, the magnetic moment cannot be increased much further with the enhanced exchange splitting of SCAN. In the end, this implies that the interatomic distances do not increase as much in these systems as they do for b c c -Fe, leading to an underestimated equilibrium volume.
The performance of SCAN in the prediction of magnetization demonstrates more difficulties in comparison with its performance in the description of the structural properties. For the same model systems (Fe, Ni, and Co), greater degradation of the accuracy is found in comparison with that of the GGA. In all three cases, the magnetization is overestimated significantly by SCAN relative to LSDA and GGA [41,42,46]. Fu and Singh [42] stated that this might be due to the challenging description of the itinerant physics of systems with multiple partially occupied d-orbitals, and at the same time, accurate reproduction of the physics of atoms, including the cancellation of self-interactions. Ekholm and co-authors found that the 3 d states were shifted to lower energies, as compared to the experiments, and they suggested [41] that large SCAN spin moments arise from enhanced exchange splitting compared to in LSDA and GGA. They modeled an electronic structure of b c c -Fe and showed that the spin-up bands had become filled, going from a weak to a strong ferromagnet, meaning that the SCAN bandwidth is larger in comparison with the PBE.
If we consider the spontaneous magnetization of Fe, Co, and Ni, the SCAN enhancement is 19%, 8%, and 14% with respect to the GGA [46]. Meantime, it cannot be argued convincingly that this leads to worse agreement with the experimental results. Despite the overestimation of the magnetization of Fe by 17% by SCAN, and the underestimation by PBE by only 2%, SCAN provides better agreement for Co, where the SCAN calculated magnetization is closer to the experimental value than that of PBE [46].
Accounting for the exchange–correlation effects beyond the GGA scheme allows nontrivial magnetic configurations in pure Mn to be detected. Pulkkinen et al. investigated all of the Mn phases, i.e., α -Mn, β -Mn, fcc  γ -Mn, and bcc  δ -Mn. For γ -Mn, the nonmagnetic, FM, and two variants of AFM configurations were considered. Calculations in the framework of both GGA and SCAN confirmed that the ground state of γ -Mn is of the AFM order, where the sign of the moment alternates between the planes stacked along the [001] direction [40,47]. However, SCAN predicts a Wigner–Seitz radius of 2.732 a.u., which is closer to the experimental value ( 2.752 a.u. [48]) predicted with the GGA ( 2.635 a.u.). Both GGA and SCAN predict the tetragonal distortions for this structure, but the c / a ratios are slightly different (0.95 for GGA and 0.98 for SCAN). Generally, for all magnetic configurations, SCAN significantly overestimates the magnetic moment and the equilibrium lattice constant, making it closer to the experimental value.
Similarly, for α -Mn, the unit cell of which has 58 atoms, the SCAN prediction of the lattice parameter is closer to the experiment. The most important result obtained with SCAN is that, at the experimental volume, SCAN predicts a noncollinear magnetic configuration as favorable, unlike the GGA. Both obtained noncollinear configurations (Figure 3) have large collinear magnetic moments at the Mn-I sites, while the moments at the Mn-II sites are slightly smaller and canted away from the collinear direction. The lattice parameter of the first configuration (Figure 3a), which is energetically favorable and was obtained with the full structure relaxation, is 3.757 Å. This solution may correspond to the strained α -phase reported experimentally by Dedkov et al. [49]. For the second solution (Figure 3b), calculations were performed for a fixed cell shape. In this case, determining the equilibrium volume is a more delicate task due to the presence of several degenerate solutions with different spin structures, which can coexist. Nevertheless, the authors note that since SCAN tends to favor structures with large magnetic moments, the obtained stabilization of the strained α -phase might be because of the exaggerated corrections in SCAN.

3. Binary Intermetallics

3.1. Crystal Structure

Next, we turn to the description of the exchange–correlation interactions in binary compounds. An even more important indicator of the robustness of the exchange–correlation functional is its ability to determine accurately the equilibrium crystal structure of compounds. For most nonmagnetic compounds, the intermediate vdW interaction, which is present in SCAN but not in PBE, can play a particularly important role. The crystal structure of the ground state at zero temperature is thermodynamically defined as the phase with the lowest enthalpy. The authors of [19] evaluated the capabilities of PBE and SCAN in relation to the correct prediction of the crystal structure observed experimentally. SCAN provides a significant improvement over PBE in selecting the correct ground state structure, reducing the structure prediction error from 12% to 3% for the compounds of the main group elements and from 25% to 20% for the compounds containing transition metals (TM) at a tolerance of 0.01 eV/atom. The improvement in the structure selection accuracy is likely due to the more accurate physical model provided by SCAN compared to PBE.
In particular, for SiO 2 , SCAN is able to reproduce the correct ground state α -quartz structure at low temperatures and low pressures and, consequently, it can reproduce the pressure–temperature phase diagram, while PBE overstabilizes the high-temperature polymorph β -cristobalite [19]. SCAN correctly selects the cubic diamond polymorph Ge as the ground state and accurately predicts its phase transition pressure into the β -Sn crystal structure [50,51].
Another example is the V 3 Ga compound, which can exist in two nearly equilibrium phases, the superconducting A15 and the AFM semiconductor D0 3 [52]. For the A15 phase, SCAN leads to an AFM-III order [52,53] in contrast to PBE, where the AFM solution cannot be stabilized. Both FM and AFM-III orders in the A15 structure are practically indistinguishable from each other due to the smallest energy difference of 5 meV/atom (FM is found to be stable). In addition, SCAN predicts the stabilization of the D0 3 phase relative to the A15 structure; the energy difference between these structures ( Δ E D 0 3 A 15 ) is about −44 meV/atom, which is almost half as much as in the PBE case Δ E D 0 3 A 15 = 85 meV/atom.
Let us consider another example of the binary compound NiMn [54], which has a CsCl structure with AFM ordering and a Neel temperature above 1000 K [55]. This compound undergoes a structural phase transformation from b c c -like austenite ( β -NiMn) to L 1 0 tetragonal martensite (or f c c -like α -NiMn) at high temperatures ( T m 1000 K) during cooling. Notably, both functionals predict the possibility of a structural transition between the FM β -NiMn and AFM α -NiMn. However, for α -NiMn, PBE yields a tetragonal ratio c / a 2 close to the experimental one, whereas SCAN gives ≈ 1.3. Moreover, PBE predicts an overestimated T m of ≈ 1450 K, whereas SCAN results in an underestimated T m of ≈ 580 K, which differs from the experimental result ( T m 1000 K).
In addition to the qualitative predictions of the ground state energy, an important indicator is the ability of the functional to predict the geometric parameters. Figure 4 shows the relative error of the equilibrium lattice volumes calculated by PBE and SCAN with respect to the average experiment [19,43,46,50,53,54,56]. PBE, on average, overestimates the volume with respect to the experimental volume by 6.5%. SCAN shows a significant improvement in the volume prediction, with an error of 0.8% relative to the experimental volume for binary compounds without d metals. It should also be noted that the SCAN functional has much lower emissions ( | Δ V | / V e x p > 10 %) compared to PBE. As expected, the quality of the prediction of the equilibrium volume decreases when passing to transition metal compounds. In this case, the SCAN accuracy of 0.7% is higher than the PBE accuracy of 2.6%, but it is not so significant.

3.2. Thermodynamic Stability

One of the most important fundamental thermodynamic properties that determines the phase stability of solid compounds is the formation enthalpy H f o r m . This energy is associated with the reaction to form the compound from its component elements. As a rule, the experimental determination of H f o r m with a chemical accuracy of 1 kcal/mol (0.0434 eV/atom) for a system is associated with a significant difficulties, for example, in terms of the quality of the experimental technique, the quality of the sample, measurement errors, etc. However, the high-level wavefunction methods [59] can achieve this accuracy, but due to their expensive computing requirements, they can only be used in systems with minimal numbers of electrons per periodic unit cell. It is well known that errors in the formation enthalpy predicted by PBE are usually about 0.2 eV/atom, which leads to significant undervaluations of phase stability predictions among various chemical compounds. In this subsection, we briefly discuss the results of the H f o r m calculations within GGA PBE and SCAN for binary compounds with strong (covalent, ionic, metal) and weak (vdW) chemical bonds.
Figure 5 illustrates the comparison of H f o r m calculated using PBE and SCAN with the experimental values reported by different authors [19,43,46,50,56]. Here, we divided the compounds into three groups: main-group element compounds (first panel in Figure 5), compounds containing TMs (second panel in Figure 5), and compounds completely consisting of TMs (third, fourth, and fifth panels in Figure 5). It is well-known that all local and semilocal functionals include the self-interaction error [8]. This error is small for the main-group element compounds and it is especially significant for pure TMs and compounds containing TMs. As the subgroup number of TM increases, the error rises due to an increase in the number of strongly localized d electrons [60].
As Figure 5 suggests, the behavior of the main-group element compounds demonstrates the performance of PBE and SCAN as efficient semilocal functionals with a small self-interaction error (see the first panel in Figure 5). PBE systematically underestimates H c a l c f o r m by an average of 13.5% compared to H e x p f o r m for strongly coupled compounds ( | H e x p f o r m | > 1 ). On the other side, SCAN reveals significantly better results in relation to the experiment, although there are still slight deviations of H c a l c f o r m (both positive and negative) from the experimental zero line. The average error of H c a l c f o r m SCAN calculations is about 1.4%.
For weakly coupled main-group element compounds ( | H e x p f o r m | < 1 ), the PBE and SCAN prediction accuracies of H c a l c f o r m decrease significantly. One can note large positive and negative deviations of H c a l c f o r m with respect to the experimental data. Despite the same scatter of data occurring for PBE and SCAN, the average error of SCAN seems to be smaller. Thus, SCAN predicts formation enthalpy values closer to the experimental ones, while PBE overestimates the bonding energy more strongly. One of the reasons that SCAN improves the results for weakly bonded binary compounds compared to PBE is related to the fact that SCAN includes the vdW chemical bond [28,29], while PBE practically neglects it. PBE also underestimates the chemical stability of most solids, e.g., mistakenly considering InN to be chemically unstable, which SCAN avoids [19]. These errors arise mainly because PBE overstabilizes the reference molecules and cannot be corrected simply by adding a vdW correction to PBE.
We next consider TM compounds (see the second panel in Figure 5), where the self-interaction error represents a fundamental constraint on the performance of semilocal density functionalities. For compounds with one TM ion, the average SCAN error of the enthalpy estimation is smaller than that of PBE by about 94% and 51% for the strongly coupled ( | H e x p f o r m | > 1 ) and weakly coupled ( | H e x p f o r m | < 1 ) compounds, respectively. In general, it can be seen that the absolute performance of both functionals for the TM compounds looks somewhat worse compared to the main-group element compounds.
Finally, let us proceed with the binary alloys consisting entirely of TM ions (the last three panels in Figure 5). In accordance with Ref. [56], we divide these intermetallic alloys into three groups:
  • compounds with completely filled d-shells for both TM ions (CF-CF);
  • compounds with a completely filled d-shell for one TM ion and a partially filled d-shell for another TM ion (CF-PF);
  • compounds with partiallly filled d-shells for both TM ions (PF-PF).
As one can see from the figure, compared to PBE, SCAN improves the H f o r m prediction due to the large contribution of vdW bonds ( 0.0 <   | H e x p f o r m |   < 0.3 ) for the CF-CF alloys. On the other side, GGA PBE gives better results for H f o r m in the case of CF-PF and PF-PF alloys, whereas SCAN strongly overestimates H f o r m . At the same time, the SCAN error deviation decreases for alloys with a higher formation enthalpy.

3.3. Magnetic Properties

As in the case of pure metals, SCAN overestimates the element-resolved and total magnetic moments in binary compounds as well. In particular, the average total magnetic moment of 149 binary compounds determined by SCAN is 12% greater than that of PBE [46]. The authors also show that there are certain compounds that are predicted by PBE to be nonmagnetic, while SCAN predicts their magnetic reference state, e.g., FeTe 2 and FeCl 2 . A similar tendency towards an overestimation of the magnetic moment is observed in V 3 Ga [53]. For the AFM D0 3 and A15 phases, SCAN overestimates the magnetic moment of the V atom by 41% and 36% in comparison with PBE. For NiMn [54], SCAN also overestimates the magnetic moment by 10%.

3.4. Electronic Properties

Correct gap estimation is one of the most difficult problems for DFT. Semilocal approximations such as LDA and GGA are known to underestimate the band gap width [24,61] or even fail to predict semiconductor behavior [62,63,64]. This problem usually has two main causes, the first is the already-mentioned self-interaction, and the second is the equality to zero of the so-called derivative gap ( Δ x c ), which determines the difference between the fundamental forbidden band and the locked Kohn–Sham band [39,65,66]. As shown in the previous paragraphs, the first problem cannot be completely solved within (semi)local approximations, but since SCAN includes some nonlocality through the kinetic energy τ and depends on orbitals, Δ x c SCAN becomes non-zero.
Figure 6 shows the error in determining the band gap width for binary alloys calculated in [46]. It can be seen that SCAN, like PBE, suffers from systematic underestimation of the electronic gap; however, SCAN is usually in better agreement with the experimental results. Thus, SCAN underestimates the band gap width by 35%, and PBE underestimates it by 38%. The standard deviation for SCAN is about 16% less than that for PBE. Moreover, as the experimental bandgap width increases, the difference between the bandgaps predicted by PBE and SCAN becomes more divergent. The hybrid HSE [67] and B3PW [68] functionals predict a bandgap width that is much closer to the experimental value with mean deviations of −5% and 11%, correspondingly. However, the standard deviation for B3PW is comparable to the deviations for PBE and SCAN; for HSE, the standard deviation is 12%, which is four times smaller than that for SCAN. Note that the deviation from the mean for both hybrid functionals for materials with a small bang gap width is still large, which may be due to the small content of compounds of similar nature in the fitting dataset.

4. Cuprites and Perovskites

Over the past few years, the SCAN functionality has been extensively tested on multicomponent systems with different electronic structures and chemical bonding types, such as cuprates, spinels, and perovskites (e.g., see Refs. [70,71,72,73,74,75,76]). For most systems studied, the SCAN functional predicts the ground-state properties more successfully than the GGA.
For instance, SCAN investigation of La 2 CuO 4 cuprate in orthorhombic (LTO), tetragonal (LTT), and hexagonal (HTT) phases can be found in Refs. [71,72]. It is shown that, for the LTO phase, SCAN predicts the ground state AFM solution with a band gap of 1 eV, which is in good agreement with experimental data [70]. However, PBE yields nearly gapless behavior for the LTO phase. For the LTT and HTT phases, SCAN similarly predicts the presence of a energy gap by analogy with the LTO phase, whereas PBE yields metallic behavior.
The SCAN application has been studied for a wide class of 3d A B O 3 perovskites from titanates to nickelates in both spin-ordered and spin-disordered or paramagnetic states [73]. SCAN makes it possible to predict trends in gap formation, but not in absolute magnitude, as well as structural symmetry breaks (e.g., octahedron rotations, Jahn–Teller modes, bond disproportionation), the relative positions of the p and d orbitals of the O and B atoms, respectively, and all structural features. Similarly, Zulfiqar et al. [74] reported that both SCAN and PBE equally underestimate the experimentally observed gaps of alkaline earth titanates and zirconates. Despite this, the calculated SCAN formation energies for SrTiO 3 , BaTiO 3 , SrZrO 3 , and BaZrO 3 are in good agreement with the experimental findings previously achieved by GGA + U calculations. In addition, it is shown that SCAN is more accurate than PBE and HSE06 in predicting the mechanical and vibrational properties of these materials.
In Table 1, we summarize the calculation results for the energy gap, magnetic moment, and volume cell with the available experimental data for the La 2 CuO 4 and A B O 3 compounds mentioned above.

5. Heusler Alloys

From the 1990s to the present time, materials scientists have paid close attention to the intensive study of a new class of intelligent and functional materials, the Heusler alloys. Heusler alloys exhibit a combination of different magnetic states, such as ferro-, ferri-, and antiferromagnetic states, together with a strong coupling between the magnetic and structural subsystems. This leads to the fact that the Heusler alloys have bright thermally and magnetically induced shape memory effects, magnetoresistive, magnetocaloric, transport, and topological properties, and a variety of phase transformations (magnetic, thermoelastic martensitic, and intermartensitic transitions) caused by temperature changes, external loads, and magnetic fields [55,92,93,94,95,96,97,98,99,100,101,102,103,104]. To date, over 1500 compounds in the family of Heusler alloys have been identified, which are ternary semiconductor or metallic materials with a stoichiometric composition X Y Z (half-Heusler alloys) or X 2 Y Z (full-Heusler alloys), where X and Y are transition metals, and Z is the main subgroup element.
Heusler alloys can have both metallic properties ( X 2 Y Z -type full Heusler alloys) and half-metallic properties ( X 2 Y Z -type alloys, X Y Z half-Heusler alloys, and X X Y Z quaternary Heusler alloys) [99]. Heusler metal alloys are characterized by combinations of two or more functional effects, such as giant magnetoresistance, thermal and magnetically induced shape memory and strain effects, multicaloric effects, etc. However, the metallic state of full Heusler alloys implies the presence of low magnetic and structural transition temperatures. Therefore, the main challenge is to find new compositions of Heusler alloys that have high transition temperatures and exhibit pronounced unique properties depending on the temperature, pressure, and magnetic field.
The key features of half-metallic Heusler alloys are high Curie temperatures and spin polarization, which, in turn, makes them attractive for use in spintronic devices. At the same time, the disadvantages of these alloys include a sharp decrease in the tunneling magnetoresistance with an increasing temperature, as well as the absence of a martensitic transition, which, accordingly, leads to very small magnetically induced deformations.
This section provides an overview of modern theoretical studies of various properties of Heusler alloys in the framework of the DFT and the SCAN exchange-correlation functional.

5.1. Structural Properties

It is well known that, depending on the atomic number of elements X and Y, Heusler alloys can crystallize into regular and inverse cubic structures. If the valency of the Y element is greater than the valency of the X element, the regular structure is most likely to form; otherwise, an inverse structure may be formed. The regular structure has cubic symmetry with the space group F m 3 ¯ m (#225, structure L 2 1 , prototype Cu 2 MnAl) [99], as shown in Figure 7a. The X atoms occupy 8 c (1/4, 1/4, 1/4) and (3/4, 3/4, 3/4) Wyckoff sites, while the Y and Z atoms are located at the 4 a (0, 0, 0) and 4 b (1/2, 1/2, 1/2) sites, respectively. This structure consists of four interpenetrating fcc sublattices, two of which are formed by X atoms. The inverse Heusler structure is characterized by cubic symmetry with the space group F 4 ¯ 3 m (#216, prototype of Hg 2 TiCu) [99], which is also described by four interpenetrating fcc lattices; however, X atoms no longer form a simple cubic lattice (see Figure 7b). Instead, the X atoms are located at sites 4 a (0, 0, 0) and 4 d (3/4, 3/4, 3/4), while the Y and Z are placed in sites 4 b (1/2, 1/2, 1/2) and 4 c (1/4, 1/4, 1/4), respectively.
SCAN studies of the structural properties of the above-mentioned crystal structures for various families of Heusler alloys are presented in Refs. [54,63,105,106,107,108,109,110,111,112,113,114,115,116]. As objects of research, the following Heusler compounds are considered:
  • the metallic compounds X 2 Y Z of stoichiometric and non-stoichiometric compositions based on Ni [54,105,106,107,108,109], Mn [54,110], and Fe [54,108];
  • FM and ferrimagnetic (FiM) half-metallic X 2 Y Z compounds based on Mn [111], Fe [54,108,111,112,113,117], V [113], and Co [63];
  • X Y Z half-Heusler compounds based on Ti, Zr, and Ir [114]; Zr and Ni [115], and V, Fe and Cr, Co [118];
  • the quaternary half-metallic alloys CrVTiAl [116] and CoFeTiAl [63].
Let us first discuss the studies of metallic compounds X 2 Y Z based on Ni [54,105,106,107,108,109], Mn [54], and Fe [54,108]. A classic example of these compounds is the Ni 2 MnGa alloy, which has been the subject of many first-principles investigations for 25 years.
An analysis of the effects of the LSDA, GGA PBE and SCAN exchange–correlation functionals on the properties of the Ni 2 MnGa alloy [54,105] reveals the following features. For the austenitic phase, the LSDA functional gives a strongly underestimated lattice constant ( a 0 = 5.63 Å), while the SCAN functional less significantly underestimates the lattice constant ( a 0 = 5.726 Å) compared to the GGA approximation ( a 0 = 5.809 Å) and the experimental results ( a 0 = 5.82 Å). Studies of the possibility of tetragonal distortions for the Ni 2 MnGa alloy show that the PBE functional gives a local minimum of the energy curve at c / a = 1 and a global minimum at c / a = 1.25 , which is in good agreement with previous theoretical studies [55,94,119].
At the same time, the energy curve calculated within SCAN has a local minimum at c / a = 0.95 and a global minimum at c / a = 1.2 . The corresponding energy curve is presented in Figure 9a. Interestingly, the SCAN c / a value is in very good agreement with the experimental value c / a = 1.18 ± 0.02 [109,120]. In addition, it should be noted that SCAN gives a larger difference between the energies of the austenitic and martensitic phases compared to PBE. This means that the martensitic transformation temperature predicted from SCAN ( T m 153 K) is closer to the experimental value ( T m 202 K [121]) than that predicted from PBE ( T m 107 K). Here, the T m temperature is estimated from the equation Δ E k B T m , where k B is the Boltzmann constant, 1 meV/atom = 11.6 K).
Similar lattice constants for the austenitic and martensitic phases of Ni 2 MnGa are reported in Ref. [109]. Note that, according to the experiment, the ground state of the martensitic phase is a 10M ( 3 2 ¯ ) 2 modulated structure, which can be represented as an alternating sequence of two and three lattice planes of the nanotwins [94,109,122,123]. Zelenỳ et al. showed that the calculation in the GGA approximation gives the following sequence of crystal structures according to the change in their energy 4O→NM→14M→10M→6O→A, where A is cubic austenite, NM is non-modulated tetragonal martensite ( c / a = 1.18 ), 4O orthorhombic structure predicted as the ground state [109]. However, SCAN calculations predict a different energy sequence: NM→6O→10M→14M→4O→A, where NM martensite is the most stable structure. The authors concluded that SCAN calculations lead to positive energies of nanotwin boundaries of any kind, in contrast to the GGA. However, the GGA approximation correction based on the Hubbard model (GGA + U, 0 < U 3 eV) by an increasing the localization of Mn atoms yields the ground state 10M structure of martensite at U > 1.2 eV in agreement with the experiment. The abovementioned schemes of the phase transition sequences are illustrated in Figure 8.
It is also worth noting that the U parameter overestimates the austenite lattice constant, for example, a 0 = 5.83 Å for U Mn = 1 eV and 5.88 Å for U Mn = 3 eV [109,127]. The authors suggested that the meta-GGA SCAN + U scheme might lead to better agreement with experiment. Moreover, the SCAN + U approach would require smaller values of the U parameter, which is consistent with the metallic nature of the constituent elements.
An alternative stoichiometric alloy is the Mn 2 NiGa with an inverse XA structure, which exhibits a martensitic transformation near room temperature ( T m = 270 K) and a magnetic transformation at 588 K, which also makes this alloy promising for various kinds of practical applications [124,128]. Kundu et al. reported the possibility of the existence of 6M, 10M, and 14M modulated martensitic phases that are close in energy to the NM phase in the Mn 2 NiGa alloy [129]. To theoretically describe the energy sequence of possible martensitic phases, the authors implemented the GGA only.
Erager et al. [110] recently investigated the exchange–correlation effects on the ground state properties of modulated structures of Mn 2 NiGa. Both functionals, PBE and SCAN, predict the martensitic transition between the cubic and tetragonal phases in the ferrimagnetic (FiM) state. However, SCAN calculations showed a smaller energy difference between austenite and martensite ( Δ E 12 meV/atom) compared to PBE ( Δ E 27 meV/atom). The GGA predicts the following energy sequence of crystal structures, as shown in Figure 8: NM→14M→10M→6M→A, while the SCAN functional yields the opposite sequence: 6M→NM→10M →14M→A; the difference in energy between 6M and NM martensite is about 10 meV/atom. In addition, the difference in the modulation amplitude of the 6M, 10M, and 14M phases obtained by PBE and SCAN increases with an increasing modulation period. This finding is possibly due to the difference in the lattice constants and the monoclinic angle γ . In the case of the 10M structure, γ = 93 for both functionals, whereas for the 14M structure, γ 96 and 89° for GGA PBE and SCAN, respectively.
A detailed analysis of the total energy behavior of the crystal structure with respect to the tetragonal distortion c / a for FM Ni 2 + x Mn 1 x Ga and Fe 2 Ni 1 + x Ga 1 x , Co-doped FiM Ni 2 y Co y Mn 1 + x (Ga,Sn) 1 x , and nonmagnetic Fe 2 VAl may be found in Refs. [54,106,107,108,130]. Here, the FM configuration is characterized by the parallel orientation of the magnetic moments of all atoms; the FiM configuration is characterized by the antiparallel orientation of the magnetic moments of the Mn atoms located in different sublattices. The E ( c / a ) curves illustrating the comparison of PBE and SCAN are shown in Figure 9.
In Figure 9a,b,d, it is shown that cubic structures are only stable for stoichiometric Fe 2 VAl, Fe 2 NiGa, and Ni 2 MnSn compositions for both PBE and SCAN functionals. The martensitic phase for these alloys is not realized. In the case of a nonstoichiometric Ni 2.5 Mn 0.5 Ga (see Figure 9c), the PBE and SCAN E ( c / a ) behaviors practically coincide. Both functionals predict a martensitic phase with c / a 1.25 , while the austenitic phase is energetically unfavorable. For Fe 2 Ni 1.5 Ga 0.5 (see Figure 9b), a structural transition from FM austenite with an inverse Heusler structure to FM martensite with a regular structure is predicted only within SCAN. PBE yields an unstable martensitic phase with a regular structure. The overall behavior of the total-energy curves is similar for PBE and SCAN.
Another situation is observed for Mn-excess Heusler compounds. For Ni 2 Mn 1.5 (Ga,Sn) 0.5 (see Figure 9c,d), the PBE and SCAN results contradict each other: the SCAN functional gives the FM ordering as the most favorable, while PBE predicts the FiM order in contrast to NiMn, where both PBE and SCAN give similar results [54]. Moreover, the E ( c / a ) curves obtained with PBE and SCAN differ significantly in contrast to the corresponding stoichiometric compositions. In particular, PBE predicts a martensitic transition in the FiM state for both systems, which is consistent with previous calculations [131,132,133,134]. The PBE values of c / a for Ni 2 Mn 1.5 Ga 0.5 and Ni 2 Mn 1.5 Sn 0.5 alloys are 1.35 and 1.3, respectively. The experimental c / a values are ≈1.28 and ≈1.24 for the nonmodulated L 1 0 -tetragonal structures of Ni 2 Mn 1.52 Ga 0.48 and Ni 2 Mn 1.52 Sn 0.48 , respectively [122,135].
As for SCAN, the global minima of the E ( c / a ) curves are observed at c / a 1.25 for Ni 2 Mn 1.5 Ga 0.5 and at c / a 1.15 for Ni 2 Mn 1.5 Sn 0.5 in the FM phase, demonstrating a significantly smaller energy difference between austenite and martensite compared to PBE (see Figure 9c,d). Nevertheless, experiments [122,131,135] have revealed practically degenerate AFM and FM reference states for the L 1 0 tetragonal phase for Mn-excess Ni-Mn-(Ga, Sn). In this regard, it is difficult to conclude which of the functionals, PBE or SCAN, gives the best agreement with the experimental results. In addition, SCAN does not predict a martensitic transition for any of the compounds, Ni 1.5 Co 0.5 Mn 1.5 Sn 0.5 [106] and Ni 2 x Co x Mn 1.625 Sn 0.375 (x = 0, 0.125, 0.25 and 0.375) [107], indicating an energy benefit of the FM L 2 1 cubic structure. For Ni 1.5 Co 0.5 Mn 1.5 Sn 0.5 , PBE also predicts the favorability of the FM L 2 1 structure, whereas for Ni 2 x Co x Mn 1.625 Sn 0.375 , the martensitic transition between FM austenite and FiM martensite is only possible for a Co content of x < 0.375 .
Let us proceed further to a discussion of the unique properties of half-metallic Heusler alloys. In these compounds, the crystal structure of the austenite phase can be ordered by the L 2 1 or XA type. In this regard, the predominant part of the works is devoted to the influence of exchange–correlation effects on the ground state. Systematic studies of various families of ternary, quaternary, and half-Heusler alloys have shown the following unique properties. For Mn-based alloys such as Mn 2 ScZ (Z= Al, Ga, In, Si, Ge, Sn, P, As, Sb) [136,137], Mn 2 VGe 1 x Si x [64], Mn 2 FeSi [111], and V 2 FeSi, the GGA PBE functional predicts the L 2 1 structure as the ground state. The SCAN functional indicates energetically favorable XA structures in Mn 2 ScZ (Z = Ga, In, Ge, Sn, As) [136] and Mn 2 FeSi [111], whereas for the other Mn-based compounds, SCAN predicts the L 2 1 structure as in the case of PBE. For Fe-based compounds, such as Fe 2 MnSi and Fe 2 VSi [111], Fe 2 VAl and Fe 2 TiSn [138], Fe 2 ScZ (Z = P, As, Sb) [112,117], and Co 2 FeSi alloys [63], calculations with both SCAN and PBE show the stability of the cubic L 2 1 structure.
It is interesting to note that, in the case of the Mn 2 ScZ alloys (Z = Si, Ge, P, As) [136,137], SCAN total energy calculations give two energy minima on the E ( a ) curve at smaller and larger lattice volumes. These minima correspond to states with a low integer magnetic moment (LMS state) and a high fractional magnetic moment (HMS state). Note that the LMS state exhibits a half-metallic character at the Fermi level, whereas the HMS state is metallic. The energy barrier between the two states is rather small, ≈35 meV/atom, indicating the possibility of a transition between these two states.
A detailed analysis of the two-phase states, LMS and HMS, in Mn 2 ScSi, was performed by Buchelnikov et al. [137]. The authors showed that taking into account the exchange-correlation effects within the SCAN functional leads to the appearance of two minima, close in energy, at cubic lattice constants of 5.905 and 6.108 Å (see Figure 10a). The left local minimum characterizes the LMS state (3 μ B /f.u.), while the right global minimum is the HMS state (5.8 μ B /f.u.). The energy difference Δ E H M S L M S between the two states is 3.75 meV/atom. Thus, it can be assumed that lattice contraction will allow the transition from the HMS to the LMS state. It is interesting to note that the GGA-PBE calculations lead to only one minimum close to the LMS state, while at a larger lattice parameter, only a break in the E ( a ) curve is observed. However, taking into account the localization of d electrons of Mn atoms within the effective Hubbard correction (GGA + U) also makes it possible to obtain LMS and HMS states close in energy (see Figure 10b). Parametric analysis of the U parameter effect on the value of Δ E H M S L M S indicates that the minimum value of Δ E H M S L M S , as in the case of SCAN calculations, can be achieved for U = 1 eV.
In a recent study [64] on the Mn 2 VGe alloy showing LMS and HMS, a way to control the Δ E H M S L M S value within the framework of partial substitution of Ge atoms by Si atoms was proposed. In the parent Mn 2 VGe compound, SCAN gives a Δ E H M S L M S = 13.2 meV/atom, which is slightly larger than that of Mn 2 ScSi [137]. However, the partial replacement of Ge by Si reduces Δ E H M S L M S between the two phases, which become practically degenerate at a Si content of ≈3.125 at.% at a zero temperature. According to the phase diagram for Mn 2 VGe 1 x Si x (see Figure 11), an increase in the Si content leads to a decrease in the critical pressure required for the transition between strong and weak magnetic phases. For example, for x = 0.125 at T = 0 and 300 K, transition pressures of 1 and 2.8 GPa are required. For x 0.45 and T 300 K, the critical pressure becomes practically zero, indicating the ease of transition from the metallic to the half-metallic state. Thus, silicon-doped Mn 2 VGe can provide an ultrafast, low-energy, and cost-effective platform for the development of materials of interest in spintronics applications.
The structural properties of nonmagnetic half-Heusler compounds XIrSb (X = Ti, Zr) and ZrNiSn, which demonstrate stable hole conductivity, are studied in Refs. [114,115]. These alloys have cubic crystal structures with a space symmetry group F 4 ¯ 3 m (prototype LiAlSi). Since these are compounds with heavy elements, relativistic effects can play an important role in accurately describing both electronic and thermoelectric properties.
In this regard, taking into account the spin-orbit coupling (SOC) can lead to an increase in the kinetic energy of electrons located on the inner shells closer to the nucleus. The authors considered two aspects related to the effect of the exchange-correlation approximation within PBE, PBE + U, and the meta-GGA SCAN and the effect of the SOC of heavy metals on these compounds. According to the calculations, the SCAN functional predicts similar equilibrium lattice parameters to the experimental ones. In contrast, the PBE and PBE + U functionals overestimate these values by about 1.5%. The SOC for each of the functionals has little effect on the lattice constant and bulk modulus.
In Figure 12, we summarize the optimized PBE and SCAN volume cells of an austenite structure for Heusler alloys with respect to the available experimental data. For half-Heusler (h-H) alloys, SCAN gives a larger optimized volume cell, while PBE reveals values of V that are close to experimental ones. In the case of full-Heusler (f-H) and quaternary Heusler (q-H) alloys with half-metallic band structures, the PBE and SCAN volumes differ slightly from each other and are also in good agreement with the available experimental data. However, SCAN yields a more underestimated cell volume than PBE in relation to the experiment for f-H alloys with metallic band structures. It can be assumed that the SCAN functional works better for half-metallic systems than for metallic ones due to the lower self-interaction error and smaller number of localized electrons near the Fermi level.

5.2. Thermodynamic Stability

Let us now consider the thermodynamic stability of Heusler alloys as part of the study of exchange–correlation effects on the formation ( E f o r m ) and decomposition ( E d e c ) energies and phonon spectra. E f o r m is defined as the difference between the total energy of a compound and the sum of the energies of constituent elements. The negative sign of E f o r m indicates the thermodynamic stability of a compound. To estimate E d e c , it is necessary consider all possible stable decay products (combinations of binary and ternary compounds and pure elements).
The E f o r m calculations within the SCAN functional were performed for various families of Heusler alloys Ni 2 + x Mn 1 x Ga [54], Ni 2 Mn 1 + x Sn 1 x [54], Fe 2 Ni 1 + x Ga 1 x [54], Fe 2 VAl [54], Fe 2 MnSi, Mn 2 FeSi [111], Fe 2 VSi and V 2 FeSi [113], and Fe 2 ScZ (Z = P, As, Sb) [112,117]. However, a comparative analysis of E f o r m between the PBE and SCAN functionals is given only in Ref. [54], whereas the works [111,113] only include the SCAN calculations of E f o r m for the XA and L 2 1 structures, indicating the stability of the Fe 2 MnSi, Mn 2 FeSi, Fe 2 ScZ, Fe 2 VSi and V 2 FeSi alloys due to the negative value of E f o r m . The results of PBE and SCAN E f o r m calculations for Ni-Mn-(Ga, Sn), Fe-Ni-Ga, and Fe-V-Al systems in the austenitic and martensite phases are summarized in Table 2 [54]. According to the calculations of the stability of the austenitic and martensitic phases, SCAN gives negative E f o r m values for all compounds considered. In contrast, PBE shows positive E f o r m values for two compounds Ni 2 Mn 1.5 Sn 0.5 in the austenitic phase and Fe 2 Ni 1.5 Ga 0.5 in both the austenite and martensite phases. On average, the E f o r m values obtained by the SCAN are several times greater in absolute values compared to those obtained with PBE, except for Ni 2 Mn 1.5 Sn 0.5 in the FiM martensitic phase and Fe 2 VAl in nonmagnetic austenitic phase.
A systematic analysis of the thermodynamic stability of Mn 2 ScSi and Mn 2 VGe alloys possessing the LMS and HMS states in the cubic phase is presented in Refs. [64,137] using the SCAN functional. The authors have applied the method of constructing a three-dimensional convex hull of the set of E d e c points, which corresponds to different compositions of the phase space. The convex hull connects the stable phases that have the lowest E d e c or E f o r m values. Thus, the phases located above the convex hull are metastable or unstable, whereas the phases located on the hull itself are stable. The cross-sections of the convex hull allow us to estimate the energy difference (energy distance) between the phases considered. If this distance is zero or negative, it indicates the stability of the compound. In Figure 13, we present the calculated convex hull diagrams for the Mn 2 ScSi and Mn 2 VGe alloys.
Twelve stable phases (pure elements, binary and ternary compounds) and 23 possible decomposition reactions were considered as the pivot points for the construction of the convex hull of Mn 2 ScSi [137]. The E f o r m calculations (−0.312 eV/atom for LMS and −0.319 eV/atom for HMS) indicate the stability of Mn 2 ScSi with respect to decomposition into the pure Mn, Sc, and Si. However, an analysis of the possible decomposition into stable two- and three-component compounds showed that only 9 reactions out of 23 possible lead to a negative E d e c value, which indicates the metastable state of the alloy under study. An estimate of the energy distance of Mn 2 ScSi to the convex hull surface gave a value of 0.238 eV/atom. Interestingly, this distance was found to be about 0.188 eV/atom for GGA PBE [141]. Thus, the result obtained indicates the metastable state of Mn 2 ScSi. For Mn 2 VGe, 11 stable phases (pure elements and binary compounds) that form a convex hull [64] were considered. It was shown that Mn 2 VGe has the lowest energy E f o r m among the stable phases. This indicating the the high resistance of the alloy to segregation and suggests a simple experimental synthesis of this alloy.
The issues of crystal lattice stability are directly related to the calculation of the phonon spectrum of the crystal. The imaginary frequency values indicate unstable modes, whose frequency square is negative. Thus, the stability of the crystal lattice is ensured by positive values of phonon frequencies. It is well known that, for Ni 2 MnGa, the martensitic transition at T m = 202 K is preceded by a premartensitic phase transition [142,143]. According to inelastic neutron scattering measurements [144,145], a softening of the transverse acoustic mode [ ζ ζ 0 ] -TA 2 at the wave vector ζ = 0.33 and the premartensitic transition temperature T p = 260 K is observed for the L 2 1 structure. Experimental studies do not demonstrate a complete softening of the TA 2 mode, while ab initio calculations, on the contrary, predict it. Although the reasons of phonon mode softening and L 2 1 structure instability in Ni 2 MnGa have received considerable attention for a long period of time, their nature remains explored incompletely. One of the reasons for this is the electron–phonon interaction, which can be described in terms of Fermi surface nesting [94,146,147,148].
A recent study [105] presented the results of phonon spectra the stoichiometric Ni 2 MnGa in the L 2 1 cubic and L 1 0 tetragonal phases using the PBE and SCAN functionals (see Figure 14). Figure 14a,b show that the minimum value of the soft TA 2 mode of the austenite phase is observed at the wave vectors ζ = 0.38 and ζ = 0.40 for PBE and SCAN, respectively. This difference may be due to the fact that SCAN predicts a smaller lattice constant than PBE.
However, it can be seen that SCAN predicts a softening not only of TA 2 , but also of the TA 1 mode, which also indicates the instability of the cubic phase. Moreover, the SCAN calculations lead to an additional set of imaginary frequencies observed at several wave vector values, which makes this phase even more unstable. As noted above in Section 5.1, the PBE and SCAN functionals predict different tetragonality ratios, c / a = 1.256 and c / a = 1.185 , respectively. Nevertheless, both functionals show real frequencies for all wave vectors and do not predict a softening of the TA 2 mode, indicating the stability of the martensitic structure. The SCAN calculations reveal an unstable region only near the Γ point, which could be caused by the difficulty of relaxation to the ground state structure due to the presence of almost degenerate solutions in the energy landscape of the SCAN functional. In general, it can be noted that, in this case, the SCAN does not improve the results of the GGA, and it is appropriate to use any of them to calculate the phonon spectra.
Let us turn to the results for Fe 2 ScZ ( Z = As, P, and Sb) [112,117] and ZrNiSn [115] alloys, which are of interest for use in promising thermoelectric technologies. SCAN calculations of phonon dispersion curves for both Heusler alloy families demonstrate the stability of cubic structures for L 2 1 -Fe 2 ScZ and C 1 b -ZrNiSn in terms of the absence of negative frequencies. In general, the phonon spectra show a similar picture, despite the fact that the acoustic and optical modes for ZrNiSn are separated by a gap in the smaller energy range from 18 to 22 meV, as compared to Fe 2 ScZ [112,117]. For the latter, this gap is found near 35 meV. Moreover, the intersection of acoustic and optical modes is observed at the energy level of 25 meV for Fe 2 ScZ. In addition, the optical modes of Fe 2 ScZ are observed at higher energy levels compared to ZrNiSn. The authors reported that the maximum phonon energy decreases from Fe 2 ScP (≈55 meV) to Fe 2 ScSb (≈43 meV) due to the increasing radius of the Z atoms, lattice constant, and atomic weight passing from P to Sb.
The analysis of the element-resolved vibrational densities of states (VDOS) shows the following: In the case of Fe 2 ScAs [112,117] (see Figure 15), the Sc atom, as a light element, is responsible for the optical modes with the highest energy value about 45 meV, while the heavy As atom makes a predominant contribution to the spectrum in the energy range of 20 to 30 meV. The Fe atom, which has an intermediate mass, plays a role in the formation of the spectrum in the energy range of 25 to 35 meV. An estimate of the Debye temperature from the maximum frequency value gives 579 K. The vibrational spectrum for ZrNiSn includes three main peaks at 13, 22, and 30 meV (see Figure 15) [115]. Acoustic modes are formed predominantly by the heavier Sn atom, while the Ni atom, being lighter in mass, contributes significantly to the optical phonons with greater energy at 30 meV. The calculated Debye temperature is 382 K. This value agrees very well with the experimental value of 398 K [149].

5.3. Magnetic Properties

In this subsection, we consider the effect of the exchange–correlation effects on the magnetic properties of the Heusler alloys. In order to clarify the reference magnetic state, the energies of the austenite and martensite crystal structures with FM, FiM, and AFM ordering were calculated in the most of the research considered here. A detailed analysis allowed us to draw the following main conclusion. For Heusler alloys with a metallic band structure (Ni-(Co)-Mn-(Ga, Sn), (Mn, Fe)-Ni-Ga, etc.), the SCAN functional gives overestimated values for the total and element-resolved magnetic moments compared to the PBE functional, as in the case of transition magnetic metals and binary compounds. On the contrary, in the case of Heusler alloys with a half-metallic band structure (Mn-Sc-Z, Mn-V-Ge, Co-Fe-Si, Fe-V(Mn)-Si, etc.), the SCAN functional predicts the integer magnetic moment quite precisely, which agrees well with the Slater–Pauling rule. This rule relates the number of valence electrons N v e to the magnetic moment μ t o t as μ t o t = N v e 24 . In contrast, the PBE functional usually predicts slightly smaller and noninteger values of μ t o t .
Let us first consider a series of interesting results for the magnetic properties of Heusler alloys with a metallic band structure. The analysis of how the LSDA, PBE, and SCAN functionals describe the Ni 2 MnGa magnetic properties identified the following characteristics [54,105]: For both the austenite and martensite, the LSDA functional gives significantly smaller total magnetic moments ( μ t o t 3.72 and 3.82 μ B /f.u.), while the SCAN functional overestimates the magnetic moment ( μ t o t 4.726 and 4.667 μ B /f.u.) compared to PBE ( μ t o t 4.105 and 4.137 μ B /f.u.). It can be seen that PBE gives a larger μ t o t for martensite in comparison with austenite, whereas SCAN yields a slightly lower value of μ t o t for martensite compared to austenite. According to the experimental thermomagnetization curve above 0.8 T [121], a magnetization jump-like decreases at the martensitic transformation from FM martensite to FM austenite upon exposure to the heating protocol. This finding suggests that the low-temperature tetragonal phase has a higher magnetic moment compared to the cubic one, as predicted by PBE.
For the nonstoichiometric compounds Ni 2 Mn 1.5 (Ga,Sn) 0.5 [54], the PBE functional predicts the cubic L 2 1 structure with FiM ordering as the magnetic reference state, which is consistent with the results of previous studies [132,133,134], while SCAN predicts the FM ordering in the L 2 1 structure as the most favorable. This discrepancy can be explained as follows. Since SCAN gives a smaller lattice constant, the distance between Mn atoms also decreases, which leads to a change in the RKKY interaction [55,150,151,152]. However, it should be noted that the RKKY interaction is only important in the asymptotic limit; for the magnetic ground state, the interaction between the nearest atoms is more important. Thus, in this case, a more rational explanation for the magnetism of Mn-containing compounds can be given by the Bethe–Slater curve [153]. Since Mn is placed at the point of the Bethe–Slater curve at which the FM and AFM orders are close in energy, the critical parameter responsible for the type of magnetic ordering is determined by the distance between neighboring Mn atoms. Greater distances lead to FM coupling, and smaller ones lead to AFM coupling.
Systematic studies of the μ t o t behavior depending on the tetragonal distortion of the cubic structure of Ni 2 + x Mn 1 x (Ga, Sn), Ni 2 Mn 1 + x (Ga, Sn) 1 x , Fe 2 Ni 1 + x Ga 1 x , and Fe 2 VAl [54,130] show that the Mn and Fe atoms make the largest contributions to the magnetization of compounds. The maximum values of magnetization are observed in the vicinity of an undistorted cubic structure. Most of the μ t o t ( c / a ) curves demonstrate smooth behavior, except for the FM metastable martensite phase ( c / a > 1.15 ) of Fe 2 VAl [54]. Notably, this alloy is nonmagnetic in the range of 0.8 c / a < 1.15 but has FM ordering ( μ t o t 2 μ B /f.u.) at c / a > 1.15 for both the PBE and SCAN functionals. However, it is worth noting that the Fe 2 VAl martensitic phase is unstable according to the E ( c / a ) calculations. Overall, the difference in the values of magnetic moments calculated with PBE and SCAN is approximately 10% in the considered tetragonal ratio range c / a . Taking into account the additional exchange–correlation effects within the SCAN functional leads to an increase in magnetism for both stoichiometric and nonstoichiometric compounds.
We now turn to a discussion of some interesting results regarding the magnetic properties of Heusler alloys with a half-metallic character in the band structure. As noted in Section 5.1, in a series of Mn-based alloys, such as Mn 2 ScZ (Z = Si, Ge, P, As) [136,137] and Mn 2 VGe 1 x Si x [64], the SCAN functional predicts two magnetic phases close in energy with low and high magnetic moments at smaller and larger unit cell volumes. For all compounds considered in the LMS, the μ t o t takes an integer value in accordance with the Slater–Pauling rule, which is a necessary condition for the presence of half-metallic properties in the alloy. On the contrary, the compounds in the HMS have a fractional and high value for μ t o t , indicating the metallic nature of the band structure near E F .
As an example, Figure 16 shows the dependencies of the total energy as well as the total and element-resolved magnetic moments on the lattice parameter of Mn 2 VGe calculated by GGA PBE and SCAN [64]. Despite the fact that GGA does not lead to two clear energy minima on the E ( a ) curve, both PBE and SCAN show a jump-like change in μ t o t at critical lattice constants. For both functionals, Δ μ t o t is calculated to be 3.78 μ B /f.u. Similar behaviors of μ t o t ( a ) and Δ μ t o t are also observed for Mn 2 ScZ (Z = Si, Ge, P, As) [136,137]: Δ μ t o t = 2.79   μ B /f.u. for Z = Si; Δ μ t o t = 3.34   μ B /f.u. for Z = Ge; Δ μ t o t = 2.93   μ B /f.u. for Z = P; Δ μ t o t = 3.03   μ B /f.u. for Z = As.
Miroshkina et al. [63] investigated the effect of external pressure on the magnetic and electronic properties of the Co 2 FeSi and CoFeTiAl alloys within the GGA PBE and SCAN calculations. According to the Slater–Pauling rule, Co 2 FeSi must have an integer magnetic moment μ t o t = 6 μ B /f.u., since N v e = 30 . It is shown that, in contrast to PBE ( μ t o t = 5.53 μ B /f.u.) and the GW approximation ( μ t o t = 5.89 μ B /f.u.) [154], SCAN gives an integer value of the magnetic moment μ t o t = 6.0 μ B /f.u., which agrees with the Slater–Pauling rule and experiment [155]. In addition, it is shown that the magnetic moment of Co 2 FeSi decreases linearly with pressure (p) in both the PBE and SCAN cases. However, the slope of the μ t o t ( p ) curve for SCAN is 0.009 μ B /GPa, which is almost half as large as in the case of PBE (0.017 μ B /GPa). For CoFeTiAl, both functionals predict a nonmagnetic ground state.
In [111,113], the role of the atomic local environments in the first and second coordination spheres on the magnetic moments of Fe 2 VSi and V 2 FeSi [113], Fe 2 MnSi and Mn 2 FeSi [111], which have L 2 1 and XA-types Heusler structures, is studied within the SCAN functional. It is logical to assume that the magnetic moment of a d-element atom will decrease with an increase in the content of Z atoms located at the nearest sites due to the dilution of its magnetic environment. However, it was shown that this statement is not entirely true [111,113]. The change in the magnetic moment of an atom was shown to be sensitive to the nearest neighbors located in the second coordination shell due to the formation of strong σ -bonds between the d-electrons of these atoms.
Regardless of the choice of the initial magnetic configuration, the relaxation of the crystal structures of the XA-Fe 2 VSi, L 2 1 -Fe 2 VSi, and XA-V 2 FeSi compounds leads to FiM ordering, and the relaxation of the L 2 1 -V 2 FeSi gives the FM ordering [113]. However, the available experimental data indicate the AFM state of Fe 2 VSi. This discrepancy between theory and experiment can be explained by the strong dependency of the AFM order on the degree of atomic disorder. A similar discrepancy is true for Mn 2 FeSi [111,156]. In the case of XA-V 2 FeSi, the SCAN value of μ t o t = 2.0 μ B /f.u. completely obeys the Slater–Pauling rule with accurate orientation of the magnetic moments. The structure L 2 1 -V 2 FeSi ( μ t o t = 4.02 μ B /f.u.) does not satisfy this rule due to the FM coupling of the V and Fe atoms. For L 2 1 -Fe 2 VSi, SCAN calculations yield μ t o t = 0.92 μ B /f.u., close to the Slater–Pauling rule ( μ t o t = 1.0 μ B /f.u.). In the case of XA structure, μ t o t is about 2.48 μ B /f.u.
The SCAN calculations of the magnetic moments for both the L 2 1 and XA structures of Fe 2 MnSi and Mn 2 FeSi give almost integer values of μ t o t , consistent with the Slater–Pauling rule compared to GGA [111]. Additionally, the authors confirm that d-element atoms located in the second coordination sphere should have a smaller magnetic moment, while the atoms from the nearby surroundings should have large magnetic moments [111]. In addition, Fe 2 MnSi and Mn 2 FeSi in the L 2 1 structure are predicted to be ferromagnets, whereas in the case of the XA structure, they are ferrimagnets.
Finally, in Figure 17, we summarize the results of total magnetic moment calculations for various families of Heusler alloys using GGA and SCAN exchange–correlation functionals. It can be clearly seen that SCAN overestimates the magnetization for alloys with metallic band structures and predicts μ t o t close to PBE for alloys with half-metallic band structures.

5.4. Electronic Properties

Let us discuss the electronic properties obtained from the calculations of the band structure and DOS further, including the correlation parameters defined by the GGA, GGA + U, and SCAN functionals. Systematic studies of Heusler alloys with a metallic band structure (Ni-Mn-(Ga,Sn), Fe-Ni-Ga [54,108,109] and Ni(Co)-Mn-Sn [106]) revealed the following features: The total and element-resolved DOSs obtained using the SCAN basically reproduce the results of the PBE calculations: e.g., hybridization of the d states of Mn (Fe) and Ni in the spin-up channel of the valence band. Beside, they have the predominant contribution to the total DOS from 3d electrons of Mn (Fe) atoms in the spin-down channel of the conduction band.
Nevertheless, the SCAN functional gives a different exchange splitting from PBE between the spin-up and spin-down channels of DOS for the austenitic and martensitic phases. In most cases, the spin-up state peaks shift to lower valence band energies, while the spin-down state peaks shift to higher conduction band energies. In addition, the SCAN functional yields higher values of DOS compared to PBE, which consequently leads to higher magnetic moment values. Tetragonal distortions ( c / a > 1 ) change the electronic structure slightly, but also, as in the case of PBE, they lead to the splitting of the spin-down peak e g of the Ni into two parts. This observation confirms the instability of the cubic structure of austenite and the formation of martensite in Heusler alloys due to the Jahn–Teller effect. Figure 18 presents the PBE and SCAN total DOS profiles for the austenite and martensite phases of Ni 2 MnGa as an example [54].
Using the Ni-Co-Mn-Sn alloy as an example, it is shown in [106] that the difference between the DOS profiles calculated by SCAN and PBE can be minimized if Coulomb correlations are taken into account in the GGA (PBE + U) by varying the U parameter to 2 eV. The U parameter suppresses the RKKY–magnetic interactions and reduces the energy gain associated with the deformation of the cubic austenite phase into the tetragonal martensite phase. For the Fe 2 VAl alloy [54], the absence of a magnetic moment (for both PBE and SCAN) is consistent with the Slater–Pauling rule, and DOS has no exchange splitting, indicating that the material is a nonmagnetic semimetal with a very small DOS at E F .
As noted above, the correlation effects in Ni 2 MnGa seem to play a decisive role in determining the ground state energies, DOS and magnetic moments, and phonon instabilities. Thus, we should also expect a significant contribution from correlations in the description of the band structure and the electronic instability associated with Fermi surface nesting. According to the research presented in [105], the most significant difference between the LSDA, GGA, and SCAN functionals was observed for the band structure of austenite with a spin-down projection along the L U W and L K X paths. In this case, zone 64, calculated using SCAN, did not cross the Fermi level along the K Γ path. This is in contrast to LSDA and GGA and leads to the disappearance of some Fermi surface regions. In particular, a narrowing of band 64 and an expansion of band 63 are observed on the Fermi surface for the spin-down states. The minority spin Fermi surface for the austenitic phase in the GGA and SCAN is depicted in Figure 19a. It consists of two sheets that correspond to bands 63 and 64. The results for LSDA and GGA are in good agreement with those of previous studies [95,148]. The SCAN Fermi surface is noticeably modified as a result of the increased magnetic moment. Specifically, the Fermi surface sheet corresponding to band 64 shrinks, while the sheet associated with band 63 expands.
Based on the results of calculations of the total generalized electron susceptibility χ ( ζ ) , cross-sections of χ ( ζ ) in the [110] direction for the spin-down channel are plotted in Figure 19b. The χ ( ζ ) peaks in these cross-sections are indicative of electronic instabilities associated with the nesting of the Fermi surface. As a result, SCAN results are in a larger difference between the two nesting vectors in the [110] direction (| ζ 1 | = 0.263 and | ζ 2 | = 0.784) compared to LSDA (| ζ 1 | = 0.435 and | ζ 2 | = 0.55) and GGA (| ζ 1 | = 0.394 and | ζ 2 | = 0.596). Since SCAN contains a high self-interaction correction, the SCAN-U scheme was proposed for its correction, where the Coulomb repulsion U is a measure of self-interaction. As a result of the application of this scheme with a U 1 eV correction for Mn, the shape of the Fermi surface and the nesting vectors approach the GGA results.
It is important to note that, for Heusler alloys with a half-metallic character in the band structure, the GGA approximation inaccurately estimates the width of the energy gap ( E g ) in one of the spin channels, significantly underestimating its value. The SCAN approximation, in most cases, increases the gap width E g . Usually, the E g values obtained within SCAN are in good agreement with the results of calculations obtained in the GGA   +   U approximation for certain values of U. The absence of conduction electrons near the Fermi level or the formation of a band gap for one spin channel or another indicates that these electrons are localized and participate in the formation of covalent bonds. In contrast, the presence of an electron density near E F indicates the metallic character of the bond in the compound. In the case of half-metallic properties, covalent bonding appears to be more important than metallic bonding. The SCAN functional thereby provides greater localization of the electrons near the Fermi level, playing a role in the formation of E g . As a result, the SCAN functional allows us to successfully describe electronic properties such as the band structure and DOS, especially for systems with strong electronic correlations.
For example, in the case of Co 2 FeSi [63], both the PBE and SCAN functionals predict an almost half-metallic state at E F , despite some differences in the band structure and DOS profiles. PBE and SCAN give a direct energy gap at Γ points of E g = 0.773 and 2.139 eV (see Figure 20a). Along the Γ X direction, there is an intersection of the Fermi level on the conduction band side of the spin-down channel for both functionals, although in the case of SCAN, this intersection is significantly smaller. It is worth noting that the G W [154] method of expanding the eigenenergies in terms of the single particle Green’s function G and the screened Coulomb interaction W reproduces the half-metallic energy gap and gives a magnetic moment value that is consistent with the experimental results.
However, the picture changes significantly for CoFeTiAl [63] (see Figure 20b). In the case of PBE, the energy gap E g is practically absent, and a spingapless semiconductor behavior with a pseudogap of 0.03 eV is observed. According to SCAN, E g = 0.55 eV, which indicates a pronounced semiconductor character for CoFeTiAl. For both Co 2 FeSi and CoFeTiAl, E g increases linearly along the Γ Γ and Γ X directions and decreases along the X X direction with an increasing external pressure. The widening of the energy gap at the Γ point contributes to the appearance of insulating characteristics. Interestingly, for CoFeTiAl, the G W method predicts smaller band gap corrections [160]. Since calculations using G W are computationally demanding and time consuming, it can be assumed that SCAN is a good alternative to the G W method for half-metallic systems, since SCAN is less computationally demanding and reproduces the G W corrections for DOS well.
Stephen et al. [116] considered the compound CrVTiAl, which is a promising candidate for the design of highly polarized current spin filters at room temperature in a nonmagnetic architecture. Within the GGA and SCAN, the DOSs and the electronic band structures are calculated for atom permutations of four sublattices of the Heusler structure, arranged differently along the main diagonal of the cube [111], giving metallic (Cr-V-Al-Ti), spin-gapless semiconductor SGS (Cr-V-Ti -Al), and spin-filtering material SFM (Cr-Ti-V-Al) phases.
Figure 21 shows the crystal and magnetic structure of the CrVTiAl alloy, together with the corresponding partial DOSs for the three phases considered. It can be seen that the DOS profiles for the SFM phase demonstrate a large gap of 0.551 eV formed by the band structure of transition metals. In the valence band, the predominant contribution is from the 3 d orbitals of the V and Ti atoms, while the conduction band is dominated by the states of the Cr and Ti atoms. The formation of the band gap is due to the presence of covalent magnetism and the stabilization of a fully compensated FiM order on a three-component lattice formed by Cr, V, and Ti with an almost zero value of μ t o t .
For the SGS phase with Cr-V-Ti-Al arranged along [111], the positions of Ti and V are reversed with respect to the previous SFM case, resulting in a weak AFM interaction between neighboring Cr and Ti atoms and a zero value of μ t o t . As a consequence, the spin-up channel is metallic, while the spin-down channel contains a band gap of 0.584 eV. For the metallic phase with Cr-V-Al-Ti atoms arranged along [111], AFM correlations are further weakened due to the interchange of Cr and Ti. As a result, the μ t o t of the cell is 0.3148 μ B /f.u., and the corresponding DOS profiles show the absence of a band gap at E F .
SCAN calculations of spin-polarized band structures and DOS for the LMS phase of Mn 2 ScZ (Z = Si, Ge, P, As) [54,136] and Mn 2 VGe [64] show a clear band gap at the Fermi level for the spin-up state, while the energy spectrum for the spin-down state is characterized by an overlap of the valence and conduction bands. These observations indicate the half-metallic nature of the LMS phase with 100% spin polarization. In contrast, the band structure of the HMS phase clearly exhibits metallic behavior with overlapping of the valence and conduction bands for both the majority and minority channels. In the case of PBE, pseudo half-metallic behavior at E F is realized for all compounds in the LMS phase due to a slight overlap in the Fermi level by the valence bands. The band structures for Mn 2 VGe in the LMS and HMS states calculated within GGA-PBE and SCAN are shown in Figure 22 as an example [64].
For Heusler alloys, Mn 2 VGe 1 x Si x [64], it is shown that the half-metallic behavior of the LMS phase with 100% spin polarization is preserved under external pressure and Si-doping. The direct and indirect band gaps for the spin-up states were found to be E Γ Γ = 1.104 eV, E X X = 1.201 eV and E Γ X = 0.580 eV. The predominant contribution to the energy gap is made by the t 2 g orbitals of the Mn atoms due to the hybridization of the t 2 g and e g orbitals with the formation of two bonding and antibonding orbitals and their subsequent hybridization with the V d orbitals.
In [111,113], the effect of the nearest environment of 3 d metallic atoms on the DOS of V 2 FeSi and Fe 2 VSi [113], Mn 2 FeSi and Fe 2 MnSi [111] was investigated within GGA-PBE and SCAN. The positions of Fe and V, as well as Mn and Fe, in the crystallographic site (0.25, 0.25, 0.25) of the L 2 1 and XA structures were shown to play significant roles in the appearance of the half-metallic properties. Since the nearest metal–metal neighbors are located in the structures under study along the [111] direction, the formation of chemical bonds between atoms, which is responsible for the appearance of a half-metallic pseudogap, is mainly associated with the hybridization of the t 2 g orbitals of Fe and V [113], as well as Mn and Fe [111]. It should also be noted that for two families of alloys, V-Fe-Si [113] and Mn-Fe-Si [111], the half-metallic pseudogap only appears when the site (0.25, 0.25, 0.25) is occupied by V or Mn. If this position is occupied by Fe, the energy gap decreases significantly or disappears and the alloy becomes metallic.
Thus, compounds XA-V 2 FeSi and L 2 1 -Fe 2 VSi in their energetically favorable structures exhibit close to half-metallic properties [113], whereas XA-Mn 2 FeSi and L 2 1 -Fe 2 MnSi reveal half-metallicity [111]. In Figure 23, the DOSs for L 2 1 -Fe 2 MnSi and XA-Mn 2 FeSi are illustrated as an example. It is seen that SCAN increases the bandgap from 0.8 eV (within GGA) to 1.1 eV for L 2 1 -Fe 2 MnSi and from 0.5 eV (within GGA) to 1.0 eV for XA-Mn 2 FeSi. On the other side, all metastable structures, such as L 2 1 -V 2 FeSi and XA-Fe 2 VSi, L 2 1 -Mn 2 FeSi and XA-Fe 2 MnSi, are predicted to be metallic. Nevertheless, it was shown by Draganyuk et al. [111] that the SCAN functional makes the metastable structures L 2 1 -Mn 2 FeSi and XA-Fe 2 MnSi almost half-metallic due to the appearance of a small gap at the Fermi level (0.2–0.4 eV) as opposed to PBE calculations. Uniform expansion of cubic crystals Mn 2 FeSi and Fe 2 MnSi leads to a redistribution of the electron density between the spin-down channel and the spin-up channel of metal atoms and a sharp increase in the magnetic moment [111]. As a result, the band gap disappears in the spin-down state at the Fermi level and, as a consequence, half-metallicity is observed under tensile pressure.
Let us consider the results of studies on the band structure of thermoelectric full Heusler alloys based on Fe, such as Fe 2 ScAs [112], Fe 2 VAl, Fe 2 TiSn [138] and the half-Heusler alloys XIrSb (X = Ti, Zr) [114], ZrNiSn [115], and VYTe (Y = Cr, Mn, Fe, and Co) [118].
Shastri et al. [138] carried out a detailed analysis of the electronic structure to explain the nonmagnetic properties of the ground state of Fe 2 VAl, Fe 2 TiSn alloys within the application of five exchange–correlation functionals, such as LDA, PBE, PBEsol, mBJ, and SCAN. The authors showed that the LDA, PBE, and PBEsol functionals give a similar picture of the band structure. A slight improvement in the behavior of the spectrum obtained with PBEsol near E F compared to LDA and PBE was found. It is known that LDA, PBE, and PBEsol usually underestimate the band gap, while the SCAN functional leads to the opposite behavior. However, in the present case, SCAN leads to similar dispersion curve behavior for both alloys. Thus, for the Fe 2 VAl alloy, the LDA, PBE, PBEsol, and SCAN functionals predict a pseudo semimetallic nature due to minor overlaps in the dispersion curves of the valence and conduction bands at the Γ and X points near E F . The widths of the direct and indirect pseudogap predicted by SCAN at the Γ and X points are 0.41 eV and −0.16 eV, respectively. Similar research results were also obtained for Fe 2 VAl in [161].
For the Fe 2 TiSn alloy, the PBEsol and LDA functionals give similar results, indicating that the dispersion curves of the conduction and valence zones slightly overlap at the Γ point, thereby suggesting a pseudo semimetallic behavior. For the SCAN and PBE functionals, the dispersion curves behave similarly, showing the minimum value of the conduction band at the X point and the maximum value of the valence band at the Γ point, as well as a flat conduction band in the Γ X direction. This finding indicates that Fe 2 TiSn is an indirect band gap semiconductor. The direct band gap obtained within PBE and SCAN at the Γ point is about 0.056 and 0.052 eV, respectively. The indirect PBE and SCAN band gaps at the X point are equal to 0.033 and 0.028 eV, respectively. Similar results were reported for Fe 2 ScZ (Z = P, As, Sb) [112,117]. It is important to note that the mBJ functional, constructed to determine the exact values of the band gap of semiconductors and dielectrics, radically changes the pattern of the dispersion curves for Fe 2 VAl and Fe 2 TiSn. The mBJ functional predicts a semiconductor character for these compounds [112,138,161]. The calculations show an increase in the band gap in the mBJ calculations compared to other functional calculations. It should also be noted that mBJ results in an indirect gap ≈ 0.22 eV for Fe 2 VAl, which agrees well with the experimentally observed value [162].
The electronic structure of half-Heusler alloys XIrSb (X = Ti, Zr) [114] and ZrNiSn [115] demonstrates semiconductor behavior with an indirect band gap in the PBE, PBE   +   U , mBJ and SCAN calculations. The smallest band gap is predicted for ZrNiSn. The SCAN and mBJ calculations give similar E g values of 0.54 and 0.55 eV, respectively. These are also in good agreement with the previously obtained values from LDA and PBE [163,164]. In the case of TiIrSb and ZrIrSb, the average E g values obtained by PBE, PBE   +   U , and SCAN are in the order of 1 and 1.5 eV, respectively. It is shown that for ZrIrSb, SCAN demonstrates a good value for E g compared to PBE and PBE   +   U , while the PBE   +   U scheme plays a better role in describing the band gap for TiIrSb in comparison with SCAN. The presence of SOC leads to a decrease in the band gap for both compounds. The largest decrease in the value of δ E g between the cases with and without SOC is observed for SCAN calculations in comparison with PBE and PBE + U calculations. This difference is about 0.476 and 0.542 eV for TiIrSb and ZrIrSb, respectively.
The band structure investigations of half-Heusler alloys VYTe (Y = Cr, Mn, Fe and Co) [118] using the GGA, mBJ and SCAN functionals showed the following features: VCrTe, VFeTe, and VCoTe compounds have half-metallic characteristics, but they have different locations for the energy gap at E F . For VCrTe, E g is observed in the spin-up channel, whereas the spin-down channel shows metallicity due to the Fermi level crossings by electronic states from the valence and conduction bands. For VFeTe and VCoTe, the opposite situation is found. The spin-polarized band structure calculations of VMnTe revealed that it is a nonmagnetic semiconductor due to the absence of orbital splitting in both the valence and conduction bands, which indicates an equal number of electrons with spin-up and -down and a zero magnetic moment.
According to the band structure analysis, the nonmagnetic VMnTe and the FM VCoTe are characterized by an indirect band gap ( Γ L and Γ X directions, respectively). On the contrary, FiM alloys VCrTe and VFeTe to have a direct band gap in the corresponding semiconductor state ( Γ Γ ). For all alloys, except non-magnetic VMnTe, mBJ gives the largest value of E g , and SCAN gives the smallest value. In the case of VMnTe, SCAN predicts the largest band gap.
Finally, in Figure 24 we summarize all results of the band gap calculations for various families of Heusler alloys using different exchange–correlation functionals.

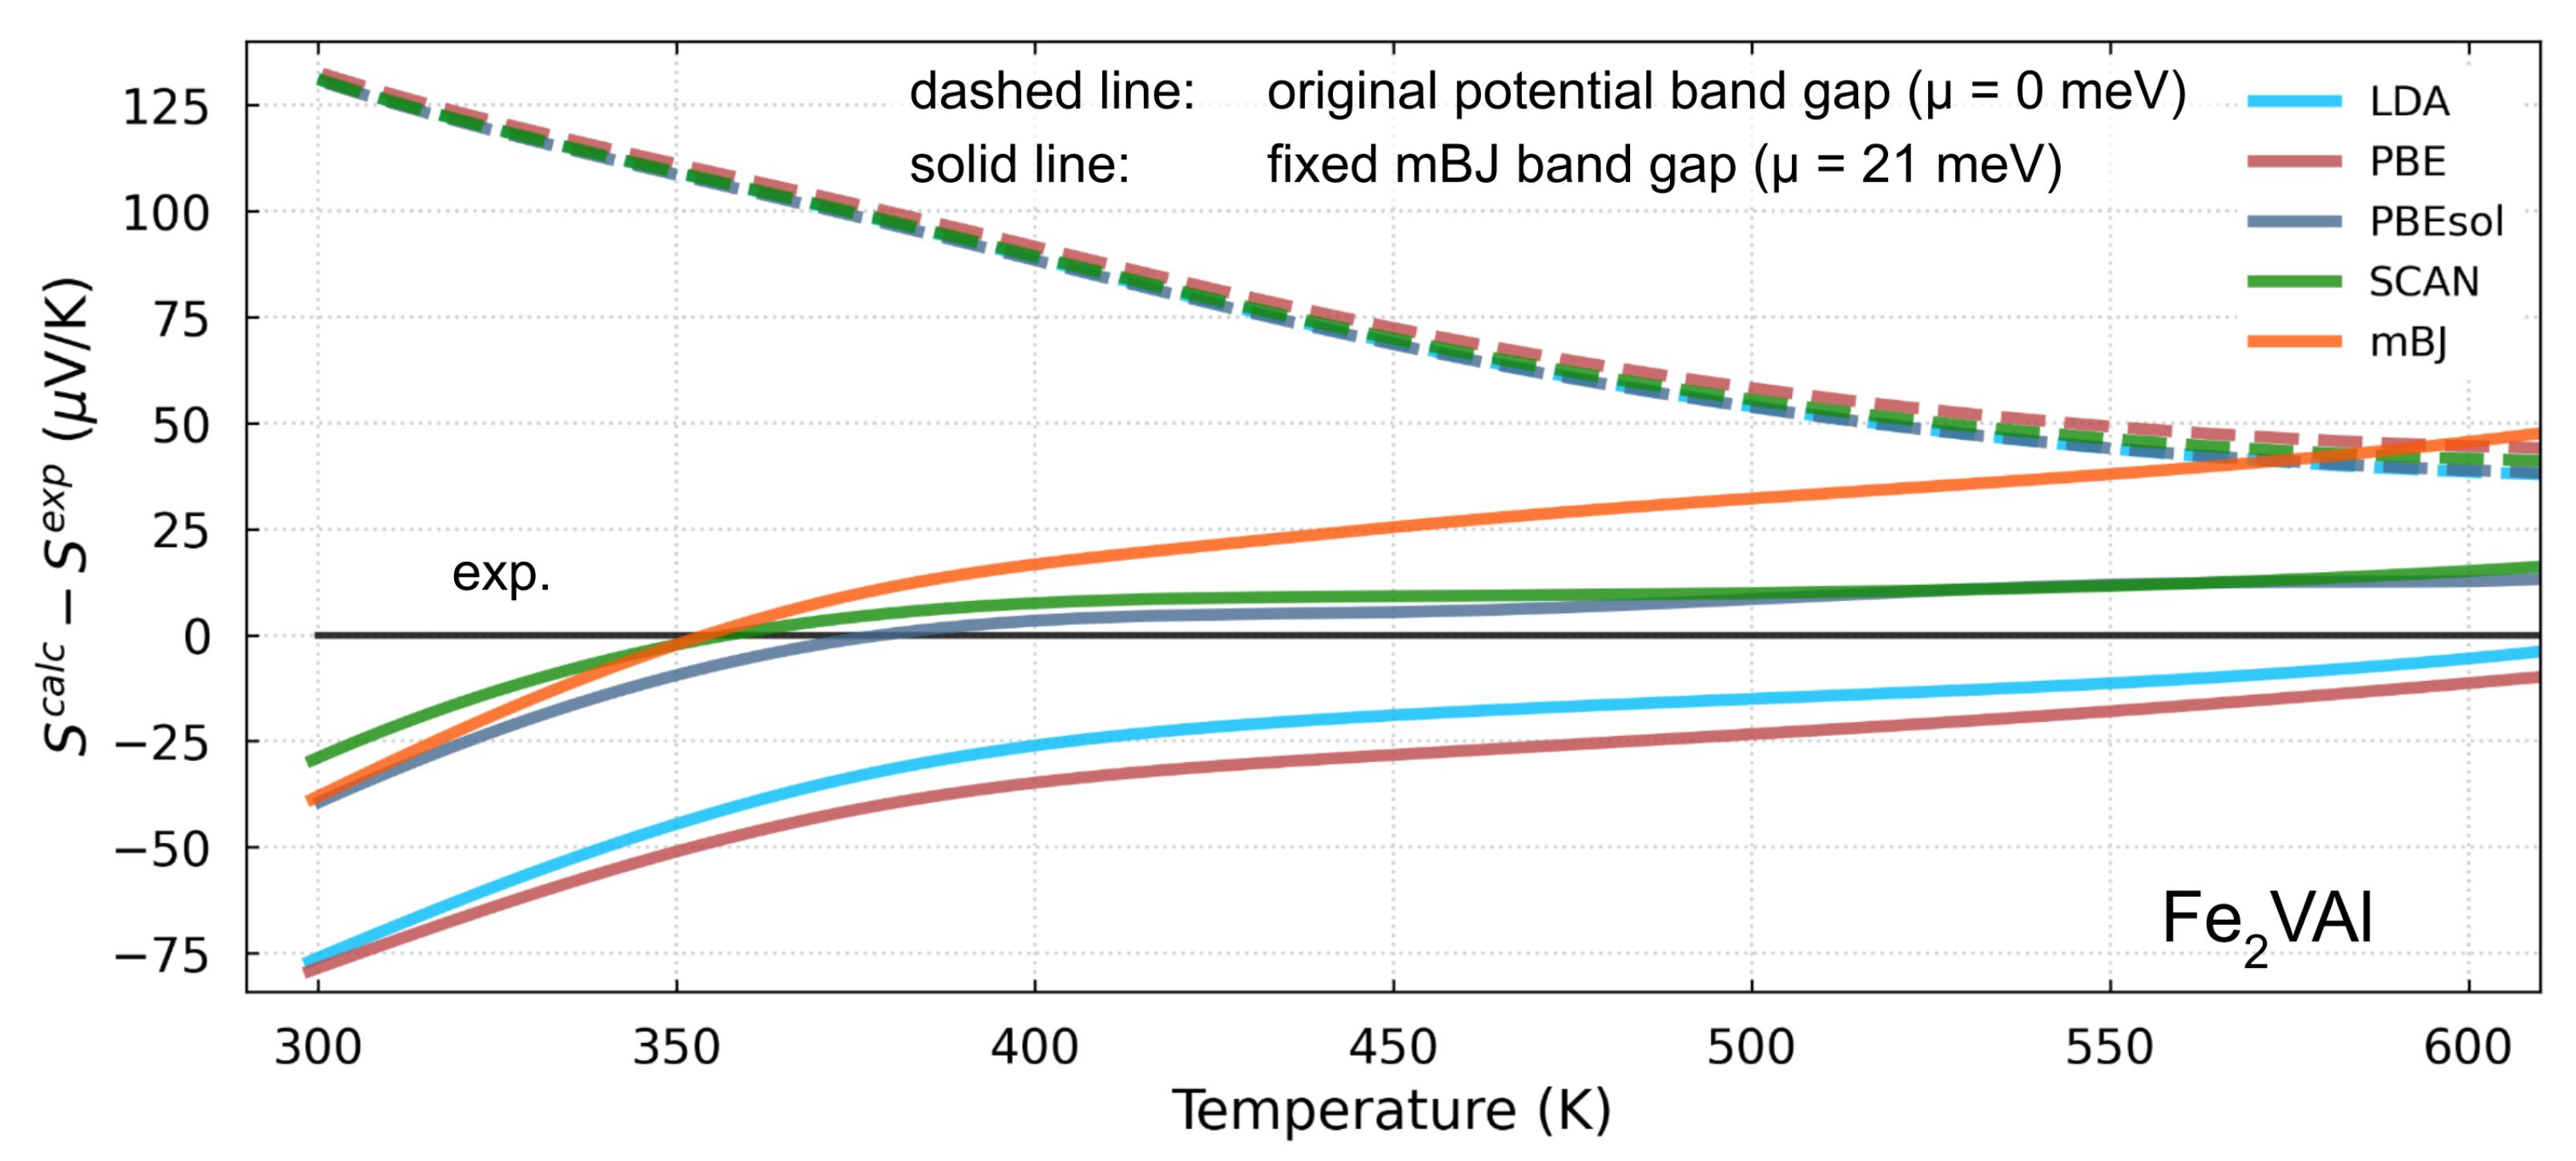
5.5. Transport Properties

Several studies have investigated the thermoelectric properties of Heusler alloys using the SCAN functional [115,138,161].
Shastri et al. [138] performed a compressive study of the electronic and transport properties of full Heusler alloys Fe 2 VAl and Fe 2 TiSn using five exchange–correlation functionals: LDA, PBE, PBEsol, mBJ and SCAN. Both compounds are known to be good thermoelectric materials. To explain the thermoelectric properties, the authors proposed the use of the formula for the Seebeck coefficient (S) obtained in the approximation of the theory of free electrons. This equation relates S to the effective mass ( m * ) and carrier density (n) as follows:
S = ( 8 π 2 k B 2 / 3 e h 2 ) m * T ( π / 3 n ) ( 2 / 3 ) ,
where k B is the Botltzmann constant, e is the electron charge, and h is Planck’s constant, respectively.
Following on from the above equation, the Seebeck coefficient is directly related to the magnitude of the effective mass. Thus, the calculation of the effective mass of charge carriers in the bands determining the transport properties is very important. This may explain which bands contribute more to the Seebeck coefficient. Shastri et al. [138] calculated the effective mass of the charge carriers of Fe 2 VAl and Fe 2 TiSn alloys at Γ and X points for different bands in the parabolic law approximation for energy bands. It turns out that by using this concept and the calculated values of the effective mass, it is possible to determine which functional best explains the thermoelectric properties. As a result, based on the fact that the mBJ functional gives a band gap close to the experimental one, two assumptions were formulated:
  • the mBJ functional should explain the thermoelectric properties of these alloys better than SCAN and PBE;
  • if E g mBJ is artificially created in band structures derived from other functionalities, then the effective mass calculated from other functionalities can also be used to explain the transport properties.
The study noted above was continued in [161], containing experimental and theoretical results for nonmagnetic Fe 2 VAl. Measurements of the Seebeck coefficient S in the temperature range from 300 to 620 K showed the following features: At 300 K, the experimental value of S was ≈−130 μ V/K. After that, the value of S gradually decreased with an increasing temperature. At 620 K, S was equal to ≈−26 μ V/K. To understand the experimentally observed S ( T ) behavior, the authors carried out ab initio calculations of the band structure, density of states, and transport properties using five functionals: LDA, PBE, PBEsol, mBJ and SCAN. As noted earlier, all of the above exchange–correlation functionals (except mBJ) predict the semimetallic behavior of the alloy, while the mBJ functional shows a semiconductor state with an indirect gap ≈ 0.22 eV, which is in good agreement with the experimentally observed value [162].
Figure 25 shows the temperature dependency of S, calculated within all the indicated functionals separately at zero chemical potential ( μ ), which represent the stoichiometry of the compound (see dashed lines). It turns out that all of the obtained values of S do not agree with the experimental values for any of the functionals. To explain the discrepancy between the theoretical and experiment results, the authors assumed that the experimental sample was not stoichiometric. For this purpose, the dependencies of the Seebeck coefficient on were calculated for all functionals. An analysis of these dependencies showed that the theoretical values of S −150 μ V/K for PBEsol, SCAN, and mBJ were similar to the experimental S −130 μ V/K at 300 K for the value of μ = 21 meV. For LDA and PBE, the theoretical values of S were calculated to be somewhat larger.
The calculated temperature dependencies of the Seebeck coefficient at μ = 21 meV are shown in Figure 25. Since the LDA, PBE, PBEsol, and SCAN functionals generally describe the characteristics of the band structure well, but do not give the correct gap, the authors calculated the Seebeck coefficient for each functional, taking into account the gap width given by mBJ, as suggested by Shastri et al. [138]. Figure 25 shows that, at higher temperatures, LDA and PBE give a fairly good agreement with the experimental results, while at lower temperatures, the calculated values of S are very far from the experimental results. This difference is about 80 μ V/K at 300 K. The results of PBEsol and SCAN are in good agreement with the experimental results in the studied temperature range, taking into account the mBJ gap. In this case, both the experimental and calculated curves intersect at ≈370 K and then deviate by a small amount in either direction from the intersection point.
The deviation between the experimental and calculated data may be due to various factors, such as the temperature dependency of the band structure, gap, and relaxation time. The calculations were carried out using band structures with a constant gap ( E g 0.22 eV) and a constant relaxation time approximation. However, all of these factors change with temperature. The authors concluded that a better agreement between the theoretical and experimental results can be achieved for calculations with temperature-dependent parameters. Moreover, the best agreement between theoretical and experimental results is achieved when the mBJ gap is used together with the PBEsol or SCAN band structure to calculate S as a function of temperature. Thus, these two functionals with a gap for mBJ can be used to search for new thermoelectric materials.
The similar study was performed recently by the same group of authors for Fe 2 ScZ (Z = P, As, Sb) [117]. They found large negative values for S at T = 300 K, such as ≈−1421 μ V/K for Fe 2 ScP, ≈−1230 μ V/K for Fe 2 ScAs, and ≈−1080 μ V/K for Fe 2 ScSb, considering the temperature-dependent chemical potential μ . Large values of S are mainly due to the presence of a flat conduction band calculated by SCAN. The analysis of electron and hole doping on the transport properties with temperature allowed us to predict the optimal doping cases given the highest power factor. These were calculated to be 10 21 cm 3 (n-type) and 5 × 10 21 cm 3 (p-type) for these compounds. From the obtained temperature-dependent figure of merit Z T , the authors suggested that the electron-doped Fe 2 ScSb and hole-doped Fe 2 ScP possess the highest Z T values. In a case of Fe 2 ScSb, Z T varies from 0.11 to 0.52 in the temperature range of 300–1200 K, whereas Fe 2 ScP has Z T in the range of 0.03–0.34 for the same temperature range.
Using DFT and Boltzmann’s semiclassical theory of transport computations with the SCAN functional, Shastri et al. [115] attempted to explain the experimental thermoelectric properties of the ZrNiSn alloy. The calculations showed that SCAN and mBJ predict the same gap E g 0.54 eV. This value of E g turned out to be insufficient to explain the experimental data, because the calculated value of S is about 574 μ V/K at 300 K, while the experimental one is −125 μ V/K. To explain this difference, the authors assumed that the alloy is not stoichiometric or that the sample contains structural disorder.
From an analysis of the S ( μ ) dependency, the authors concluded that the experimental value of S can be obtained with a gap of E g 0.54 and a deviation of the chemical potential by 337 meV towards the conduction band. Figure 26a shows the theoretical and experimental dependencies S ( T ) . It can be seen that the calculated values of S E g 0.54 are similar to the experimental ones at temperatures of up to 500 K. At T > 500 K, these curves behave in the opposite way. Since the experimental value of the gap is E g 0.18 , in order to clarify the subsequent difference between the theoretical and experimental behaviors of S, the authors also performed calculations of S and other thermoelectric characteristics at a fixed values of E g 0.18 and a chemical potential deviation of 156 meV toward the conduction band (see Figure 26b). The results of these calculations, taking into account the temperature dependency of the chemical potential and its constant value, are shown in Figure 26a. In this case, one can see the agreement between the theoretical and experimental results.
To find the possible improved thermoelectric properties achievable for ZrNiSn with E g 0.54 eV, the power factor Z T and the optimal carrier concentration were also calculated. The authors declared that the optimal concentrations of electrons and holes required to achieve the highest power factor are ≈ 7.6 × 10 19 cm 3 and ≈ 1.5 × 10 21 cm 3 , respectively. The maximum Z T values calculated at 1200 K for n-type and p-type ZrNiSn were ≈0.5 and 0.6, respectively. The efficiency obtained for the n-type was ≈4.2%, and for the p-type it was ≈5.1%. The authors suggested that a further increase in Z T to ≈1.1 (n-type) and ≈1.2 (p-type) is possible at 1200 K by doping with heavy elements to reduce the thermal conductivity.

6. Conclusions

Theoretical modeling has always been of great importance in science, since it is a comparatively fast and cheap way to conceptualize physical phenomena, especially if they are unavailable for experimental techniques. With the development of computers, whose power has been growing steadily over the past decades, modeling is gaining increasing importance. In particular, it has allowed for significant development and an increasing role of the DFT including the first-principles methods. Based on quantum mechanics, DFT allows the description of the electronic, structural, and magnetic properties of many-body systems using the functional (i.e., function of another function) of the electron density. This functional is necessary to evaluate the exchange–correlation energy, the exact form of which is unknown. Thus, the accuracy of the DFT study is provided by the choice of the exchange–correlation functionals.
There are several generations of approximations for the exchange–correlation energy. Being the first developed and working well for the description of the full lattice dynamics and electron–phonon-related properties of a variety of simple metals, transition metals, perovskites, and semiconductors, over time LSDA was replaced by the next-generation GGA scheme, which is at its peak of popularity nowadays. During the previous decade, GGA has proved its effectiveness for the accurate prediction of the ground-state properties of pure metals and multicomponent solids [181], which has led to a significant number of important fundamental discoveries, e.g., the successful prediction of the FM bcc ground state of iron [21,22] or the prediction of new topological half-Heusler materials [23].
Today, the next generation of the exchange–correlation energy approximation, the meta-GGA, is coming into play. It is represented by several functionals; however, only one of them fulfills all 17 known constraints. This is the SCAN functional that was recently developed by Sun et. al [28]. SCAN has already proved its workability for materials with intermediate-range van der Waals interactions, ionic, covalent, and metallic bonds, and 2D and highly correlated materials. Despite still facing difficulties in the description of the magnetic properties due to usually overestimating the magnetization of the system, it allows us to predict more accurately some properties of multicomponent alloys like the ratio of tetragonality for the martensitic phase of Ni 2 MnGa or the band gap of half-metals.
As an alternative strategy for developing and improving density functional approximations, in particular, SCAN, there are machine learning methods that have recently attracted a lot of attention [30]. These integrated approaches allow the use of precise constraints and the corresponding philosophy of norms for SCAN deorbitalization by means of developing deep neural networks. We believe that, regardless of some remaining issues to be improved in the future, SCAN is already on track to strengthen the predictive power of DFT and to provide deeper insight into the fundamental understanding of the materials’ nature.

Author Contributions

V.S.: Conceptualization, methodology, writing—review and editing, visualization, supervision; D.B.: Methodology, writing—original draft preparation, visualization; O.M.: Methodology, writing—original draft preparation; V.B.: Conceptualization, methodology, writing – review and editing, project administration. All authors have read and agreed to the published version of the manuscript.

Funding

This research was funded by the Russian Science Foundation under grant number 22-12-20032 (review of binary compounds and Heusler alloys). V.S. acknowledges the financial support from the Priority-2030 Program of NUST “MISiS” (grant No. K2-2022-022) (review of pure metals, cuprites, and perovskites).

Data Availability Statement

The data that supports the findings of this study are available within the article.

Acknowledgments

We acknowledge Bernardo Barbiellini for his fruitful collaboration, discussions, and guidance comments.

Conflicts of Interest

The authors declare no conflict of interest.

References

  1. Kohn, W. Nobel Lecture: Electronic structure of matter—wave functions and density functionals. Rev. Mod. Phys. 1999, 71, 1253. [Google Scholar] [CrossRef] [Green Version]
  2. Martin, R.M. Electronic Structure: Basic Theory and Practical Methods; Cambridge University Press: Cambridge, UK, 2004. [Google Scholar]
  3. Langreth, D.C.; Perdew, J.P. The exchange-correlation energy of a metallic surface. Solid State Commun. 1975, 17, 1425–1429. [Google Scholar] [CrossRef]
  4. Gunnarsson, O.; Lundqvist, B.I. Exchange and correlation in atoms, molecules, and solids by the spin-density-functional formalism. Phys. Rev. B 1976, 13, 4274. [Google Scholar] [CrossRef]
  5. Vosko, S.H.; Wilk, L.; Nusair, M. Accurate spin-dependent electron liquid correlation energies for local spin density calculations: A critical analysis. Can. J. Phys. 1980, 58, 1200–1211. [Google Scholar] [CrossRef] [Green Version]
  6. Perdew, J.P.; Zunger, A. Self-interaction correction to density-functional approximations for many-electron systems. Phys. Rev. B 1981, 23, 5048. [Google Scholar] [CrossRef] [Green Version]
  7. Perdew, J.P.; Yue, W. Accurate and simple density functional for the electronic exchange energy: Generalized gradient approximation. Phys. Rev. B 1986, 33, 8800. [Google Scholar] [CrossRef] [PubMed]
  8. Perdew, J.; Tao, J.; Kümmel, S. Recent Advances in Electron Correlation Methodology; ACS Books: Washington, DC, USA, 2004. [Google Scholar]
  9. Srivastava, G.; Weaire, D. The theory of the cohesive energies of solids. Adv. Phys. 1987, 36, 463–517. [Google Scholar] [CrossRef]
  10. Zhang, G.X.; Reilly, A.M.; Tkatchenko, A.; Scheffler, M. Performance of various density-functional approximations for cohesive properties of 64 bulk solids. New J. Phys. 2018, 20, 063020. [Google Scholar] [CrossRef]
  11. Fuchs, M.; Bockstedte, M.; Pehlke, E.; Scheffler, M. Pseudopotential study of binding properties of solids within generalized gradient approximations: The role of core-valence exchange correlation. Phys. Rev. B 1998, 57, 2134. [Google Scholar] [CrossRef] [Green Version]
  12. Leung, T.C.; Chan, C.T.; Harmon, B.N. Ground-state properties of Fe, Co, Ni, and their monoxides: Results of the generalized gradient approximation. Phys. Rev. B 1991, 44, 2923. [Google Scholar] [CrossRef] [Green Version]
  13. Körling, M.; Häglund, J. Cohesive and electronic properties of transition metals: The generalized gradient approximation. Phys. Rev. B 1992, 45, 13293. [Google Scholar] [CrossRef] [PubMed]
  14. Philipsen, P.; Baerends, E. Cohesive energy of 3d transition metals: Density functional theory atomic and bulk calculations. Phys. Rev. B 1996, 54, 5326. [Google Scholar] [CrossRef] [PubMed] [Green Version]
  15. Godby, R.; Schlüter, M.; Sham, L. Trends in self-energy operators and their corresponding exchange-correlation potentials. Phys. Rev. B 1987, 36, 6497. [Google Scholar] [CrossRef] [PubMed]
  16. Tran, F.; Blaha, P. Accurate band gaps of semiconductors and insulators with a semilocal exchange-correlation potential. Phys. Rev. Lett. 2009, 102, 226401. [Google Scholar] [CrossRef] [Green Version]
  17. Stampfl, C.; Mannstadt, W.; Asahi, R.; Freeman, A.J. Electronic structure and physical properties of early transition metal mononitrides: Density-functional theory LDA, GGA, and screened-exchange LDA FLAPW calculations. Phys. Rev. B 2001, 63, 155106. [Google Scholar] [CrossRef] [Green Version]
  18. Haas, P.; Tran, F.; Blaha, P. Calculation of the lattice constant of solids with semilocal functionals. Phys. Rev. B 2009, 79, 085104. [Google Scholar] [CrossRef] [Green Version]
  19. Zhang, Y.; Kitchaev, D.A.; Yang, J.; Chen, T.; Dacek, S.T.; Sarmiento-Pérez, R.A.; Marques, M.A.; Peng, H.; Ceder, G.; Perdew, J.P.; et al. Efficient first-principles prediction of solid stability: Towards chemical accuracy. NPJ Comput. Mater. 2018, 4, 1–6. [Google Scholar] [CrossRef] [Green Version]
  20. Jana, S.; Sharma, K.; Samal, P. Assessing the performance of the recent meta-GGA density functionals for describing the lattice constants, bulk moduli, and cohesive energies of alkali, alkaline-earth, and transition metals. Chem. Phys. 2018, 149, 164703. [Google Scholar] [CrossRef]
  21. Bagno, P.; Jepsen, O.; Gunnarsson, O. Ground-state properties of third-row elements with nonlocal density functionals. Phys. Rev. B 1989, 40, 1997. [Google Scholar] [CrossRef]
  22. Barbiellini, B.; Moroni, E.; Jarlborg, T. Effects of gradient corrections on electronic structure in metals. J. Phys. Condens. Matter. 1990, 2, 7597. [Google Scholar] [CrossRef]
  23. Lin, H.; Wray, L.A.; Xia, Y.; Xu, S.; Jia, S.; Cava, R.J.; Bansil, A.; Hasan, M.Z. Half-Heusler ternary compounds as new multifunctional experimental platforms for topological quantum phenomena. Nat. Mater. 2010, 9, 546–549. [Google Scholar] [CrossRef] [PubMed] [Green Version]
  24. Patra, B.; Jana, S.; Constantin, L.A.; Samal, P. Efficient band gap prediction of semiconductors and insulators from a semilocal exchange-correlation functional. Phys. Rev. B 2019, 100, 045147. [Google Scholar] [CrossRef]
  25. Wen, X.D.; Martin, R.L.; Henderson, T.M.; Scuseria, G.E. Density functional theory studies of the electronic structure of solid state actinide oxides. Chem. Rev. 2013, 113, 1063–1096. [Google Scholar] [CrossRef] [PubMed]
  26. Sheykhi, S.; Payami, M. Electronic structure properties of UO2 as a Mott insulator. Phys. C Supercond. Appl. 2018, 549, 93–94. [Google Scholar] [CrossRef] [Green Version]
  27. Perdew, J.P.; Kurth, S.; Zupan, A.; Blaha, P. Accurate density functional with correct formal properties: A step beyond the generalized gradient approximation. Phys. Rev. Lett. 1999, 82, 2544. [Google Scholar] [CrossRef] [Green Version]
  28. Sun, J.; Ruzsinszky, A.; Perdew, J.P. Strongly constrained and appropriately normed semilocal density functional. Phys. Rev. Lett. 2015, 115, 036402. [Google Scholar] [CrossRef] [Green Version]
  29. Sun, J.; Remsing, R.C.; Zhang, Y.; Sun, Z.; Ruzsinszky, A.; Peng, H.; Yang, Z.; Paul, A.; Waghmare, U.; Wu, X.; et al. Accurate first-principles structures and energies of diversely bonded systems from an efficient density functional. Nat. Chem. 2016, 8, 831–836. [Google Scholar] [CrossRef]
  30. Pokharel, K.; Furness, J.W.; Yao, Y.; Blum, V.; Irons, T.J.; Teale, A.M.; Sun, J. Exact constraints and appropriate norms in machine-learned exchange-correlation functionals. J. Chem. Phys. 2022, 157, 174106. [Google Scholar] [CrossRef]
  31. Kaplan, A. Construction of First-Principles Density Functional Approximations and Their Applications to Materials. Ph.D. Thesis, Temple University, Philadelphia, PA, USA, 2022. [Google Scholar]
  32. Bohm, D.; Pines, D. A collective description of electron interactions. I. Magnetic interactions. Phys. Rev. 1951, 82, 625. [Google Scholar] [CrossRef]
  33. Becke, A.D. A new mixing of Hartree—Fock and local density-functional theories. J. Chem. Phys. 1993, 98, 1372–1377. [Google Scholar] [CrossRef]
  34. Albers, R.; Christensen, N.E.; Svane, A. Hubbard-U band-structure methods. J. Phys. Condens. Matter 2009, 21, 343201. [Google Scholar] [CrossRef] [PubMed] [Green Version]
  35. Aryasetiawan, F.; Biermann, S.; Georges, A. 1 A First-Principles Scheme for Calculating the Electronic Structure of Strongly Correlated Materials: GW+DMFT. In Correlation Spectroscopy of Surfaces, Thin Films, and Nanostructures; Wiley Online Library: Hoboken, NJ, USA, 2004; p. 1. [Google Scholar]
  36. Kohanoff, J. Electronic Structure Calculations for Solids and Molecules: Theory and Computational Methods; Cambridge University Press: Cambridge, UK, 2006. [Google Scholar]
  37. Cococcioni, M.; De Gironcoli, S. Linear response approach to the calculation of the effective interaction parameters in the LDA+U method. Phys. Rev. B 2005, 71, 035105. [Google Scholar] [CrossRef] [Green Version]
  38. Perdew, J.P.; Levy, M. Physical content of the exact Kohn-Sham orbital energies: Band gaps and derivative discontinuities. Phys. Rev. Lett. 1983, 51, 1884. [Google Scholar] [CrossRef]
  39. Sham, L.J.; Schlüter, M. Density-functional theory of the energy gap. Phys. Rev. Lett. 1983, 51, 1888. [Google Scholar] [CrossRef]
  40. Pulkkinen, A.; Barbiellini, B.; Nokelainen, J.; Sokolovskiy, V.; Baigutlin, D.; Miroshkina, O.; Zagrebin, M.; Buchelnikov, V.; Lane, C.; Markiewicz, R.S.; et al. Coulomb correlation in noncollinear antiferromagnetic α-Mn. Phys. Rev. B 2020, 101, 075115. [Google Scholar] [CrossRef] [Green Version]
  41. Ekholm, M.; Gambino, D.; Jönsson, H.J.M.; Tasnádi, F.; Alling, B.; Abrikosov, I.A. Assessing the SCAN functional for itinerant electron ferromagnets. Phys. Rev. B 2018, 98, 094413. [Google Scholar] [CrossRef] [Green Version]
  42. Fu, Y.; Singh, D.J. Applicability of the strongly constrained and appropriately normed density functional to transition-metal magnetism. Phys. Rev. Lett. 2018, 121, 207201. [Google Scholar] [CrossRef] [Green Version]
  43. Bai, X.; Li, Y.; Xiao, B.; Rao, Y.; Liang, H.; He, L.; Feng, J. Structural, mechanical, electronic properties of refractory Hf-Al intermetallics from SCAN meta-GGA density functional calculations. Mater. Chem. Phys. 2020, 254, 123423. [Google Scholar] [CrossRef]
  44. Mahyuddin, M.H.; Staykov, A.; Saputro, A.G.; Agusta, M.K.; Dipojono, H.K.; Yoshizawa, K. Novel mechanistic insights into methane activation over Fe and Cu active sites in zeolites: A comparative DFT study using meta-GGA functionals. J. Phys. Chem. C 2020, 124, 18112–18125. [Google Scholar] [CrossRef]
  45. Mejía-Rodríguez, D.; Trickey, S. Analysis of over-magnetization of elemental transition metal solids from the SCAN density functional. Phys. Rev. B 2019, 100, 041113. [Google Scholar] [CrossRef] [Green Version]
  46. Isaacs, E.B.; Wolverton, C. Performance of the strongly constrained and appropriately normed density functional for solid-state materials. Phys. Rev. Mater. 2018, 2, 063801. [Google Scholar] [CrossRef]
  47. Kübler, J. Theory of Itinerant Electron Magnetism; Oxford University Press: Oxford, UK, 2017; Volume 106. [Google Scholar]
  48. Endoh, Y.; Ishikawa, Y. Antiferromagnetism of γ iron manganes alloys. J. Phys. Soc. Japan 1971, 30, 1614–1627. [Google Scholar] [CrossRef]
  49. Dedkov, Y.S.; Voloshina, E.; Richter, M. Preparation and photoemission investigation of bulklike α-Mn films on W (110). Phys. Rev. B 2010, 81, 085404. [Google Scholar] [CrossRef] [Green Version]
  50. Wexler, R.B.; Gautam, G.S.; Carter, E.A. Exchange-correlation functional challenges in modeling quaternary chalcogenides. Phys. Rev. B 2020, 102, 054101. [Google Scholar] [CrossRef]
  51. Hennig, R.; Wadehra, A.; Driver, K.; Parker, W.; Umrigar, C.; Wilkins, J. Phase transformation in Si from semiconducting diamond to metallic β-Sn phase in QMC and DFT under hydrostatic and anisotropic stress. Phys. Rev. B 2010, 82, 014101. [Google Scholar] [CrossRef] [Green Version]
  52. He, B.; Bao, Z.; Zhu, K.; Feng, W.; Sun, H.; Pang, N.; Tsogbadrakh, N.; Odkhuu, D. Itinerant semiconducting antiferromagnetism in metastable V3Ga. Phys. Status Solidi Rapid Res. Lett. 2019, 13, 1900483. [Google Scholar] [CrossRef]
  53. Jamer, M.E.; Wilfong, B.; Buchelnikov, V.D.; Sokolovskiy, V.V.; Miroshkina, O.N.; Zagrebin, M.A.; Baigutlin, D.R.; Naphy, J.; Assaf, B.A.; Lewis, L.H.; et al. Superconducting and antiferromagnetic properties of dual-phase V3Ga. Appl. Phys. Lett. 2020, 117, 062401. [Google Scholar] [CrossRef]
  54. Buchelnikov, V.; Sokolovskiy, V.; Miroshkina, O.; Zagrebin, M.; Nokelainen, J.; Pulkkinen, A.; Barbiellini, B.; Lähderanta, E. Correlation effects on ground-state properties of ternary Heusler alloys: First-principles study. Phys. Rev. B 2019, 99, 014426. [Google Scholar] [CrossRef] [Green Version]
  55. Entel, P.; Dannenberg, A.; Siewert, M.; Herper, H.C.; Gruner, M.E.; Buchelnikov, V.D.; Chernenko, V.A. Composition-Dependent Basics of Smart Heusler Materials from First- Principles Calculations. Mater. Sci. Forum 2011, 684, 1–29. [Google Scholar] [CrossRef]
  56. Nepal, N.K.; Adhikari, S.; Neupane, B.; Ruzsinszky, A. Formation energy puzzle in intermetallic alloys: Random phase approximation fails to predict accurate formation energies. Phys. Rev. B 2020, 102, 205121. [Google Scholar] [CrossRef]
  57. Zhang, R.; Singh, B.; Lane, C.; Kidd, J.; Zhang, Y.; Barbiellini, B.; Markiewicz, R.S.; Bansil, A.; Sun, J. Critical role of magnetic moments in heavy-fermion materials: Revisiting SmB6. Phys. Rev. B 2022, 105, 195134. [Google Scholar]
  58. Devi, A.A.S.; Nokelainen, J.; Barbiellini, B.; Devaraj, M.; Alatalo, M.; Bansil, A. Re-examining the giant magnetization density in α-Fe16N2 with the SCAN+U method. Phys. Chem. Chem. Phys. 2022, 24, 17879–17884. [Google Scholar] [CrossRef] [PubMed]
  59. Booth, G.H.; Grüneis, A.; Kresse, G.; Alavi, A. Towards an exact description of electronic wavefunctions in real solids. Nature 2013, 493, 365–370. [Google Scholar] [CrossRef] [Green Version]
  60. Chevrier, V.L.; Ong, S.P.; Armiento, R.; Chan, M.K.; Ceder, G. Hybrid density functional calculations of redox potentials and formation energies of transition metal compounds. Phys. Rev. B 2010, 82, 075122. [Google Scholar] [CrossRef]
  61. Yang, Z.h.; Peng, H.; Sun, J.; Perdew, J.P. More realistic band gaps from meta-generalized gradient approximations: Only in a generalized Kohn-Sham scheme. Phys. Rev. B 2016, 93, 205205. [Google Scholar] [CrossRef] [Green Version]
  62. Xiao, H.; Tahir-Kheli, J.; Goddard, W.A., III. Accurate band gaps for semiconductors from density functional theory. J. Phys. Chem. Lett. 2011, 2, 212–217. [Google Scholar] [CrossRef] [Green Version]
  63. Miroshkina, O.N.; Baigutlin, D.R.; Sokolovskiy, V.V.; Zagrebin, M.A.; Pulkkinen, A.; Barbiellini, B.; Lähderanta, E.; Buchelnikov, V.D. Exchange-correlation corrections for electronic properties of half-metallic Co2FeSi and nonmagnetic semiconductor CoFeTiAl. J. Appl. Phys. 2020, 127, 175108. [Google Scholar] [CrossRef]
  64. Buchelnikov, V.D.; Sokolovskiy, V.V.; Miroshkina, O.N.; Baigutlin, D.R.; Zagrebin, M.A.; Barbiellini, B.; Singh, B.; Bansil, A.; Lähderanta, E. Design of a stable Heusler alloy with switchable metal-to-half-metal transition at finite temperature. Adv. Theory Simul. 2021, 4, 2100311. [Google Scholar] [CrossRef]
  65. Godby, R.; Schlüter, M.; Sham, L. Accurate exchange-correlation potential for silicon and its discontinuity on addition of an electron. Phys. Rev. Lett. 1986, 56, 2415. [Google Scholar] [CrossRef]
  66. Sham, L.; Schlüter, M. Density-functional theory of the band gap. Phys. Rev. B 1985, 32, 3883. [Google Scholar] [CrossRef]
  67. Heyd, J.; Peralta, J.E.; Scuseria, G.E.; Martin, R.L. Energy band gaps and lattice parameters evaluated with the Heyd-Scuseria-Ernzerhof screened hybrid functional. J. Chem. Phys. 2005, 123, 174101. [Google Scholar] [CrossRef] [PubMed]
  68. Beeke, A.D. Density-functional thermochemistry. III. The role of exact exchange. J. Chem. Phys. 1993, 98, 5648. [Google Scholar] [CrossRef] [Green Version]
  69. Crowley, J.M.; Tahir-Kheli, J.; Goddard III, W.A. Resolution of the band gap prediction problem for materials design. J. Phys. Chem. Lett. 2016, 7, 1198–1203. [Google Scholar] [CrossRef] [PubMed]
  70. Ono, S.; Komiya, S.; Ando, Y. Strong charge fluctuations manifested in the high-temperature Hall coefficient of high-Tc cuprates. Phys. Rev. B 2007, 75, 024515. [Google Scholar] [CrossRef] [Green Version]
  71. Lane, C.; Furness, J.W.; Buda, I.G.; Zhang, Y.; Markiewicz, R.S.; Barbiellini, B.; Sun, J.; Bansil, A. Antiferromagnetic ground state of La2CuO4: A parameter-free ab initio description. Phys. Rev. B 2018, 98, 125140. [Google Scholar] [CrossRef] [Green Version]
  72. Furness, J.W.; Zhang, Y.; Lane, C.; Buda, I.G.; Barbiellini, B.; Markiewicz, R.S.; Bansil, A.; Sun, J. An accurate first-principles treatment of doping-dependent electronic structure of high-temperature cuprate superconductors. Commun. Phys. 2018, 1, 1–6. [Google Scholar]
  73. Varignon, J.; Bibes, M.; Zunger, A. Mott gapping in 3d ABO3 perovskites without Mott-Hubbard interelectronic repulsion energy. U. Phys. Rev. B 2019, 100, 035119. [Google Scholar] [CrossRef] [Green Version]
  74. Zulfiqar, W.; Alay-e Abbas, S.M.; Abbas, G.; Laref, A.; Larsson, J.A.; Shaukat, A. Revisiting the structural, electronic and photocatalytic properties of Ti and Zr based perovskites with meta-GGA functionals of DFT. J. Mater. Chem. C 2021, 9, 4862–4876. [Google Scholar] [CrossRef]
  75. Zhang, R.; Lane, C.; Singh, B.; Nokelainen, J.; Barbiellini, B.; Markiewicz, R.S.; Bansil, A.; Sun, J. Magnetic and f-electron effects in LaNiO2 and NdNiO2 nickelates with cuprate-like 3dx2y2 band. Commun. Phys. 2021, 4, 118. [Google Scholar] [CrossRef]
  76. Pokharel, K.; Lane, C.; Furness, J.W.; Zhang, R.; Ning, J.; Barbiellini, B.; Markiewicz, R.S.; Zhang, Y.; Bansil, A.; Sun, J. Sensitivity of the electronic and magnetic structures of cuprate superconductors to density functional approximations. NPJ Comput. Mater. 2022, 8, 31. [Google Scholar] [CrossRef]
  77. Wagner, L.K.; Abbamonte, P. Effect of electron correlation on the electronic structure and spin-lattice coupling of high-Tc cuprates: Quantum Monte Carlo calculations. Phys. Rev. B 2014, 90, 125129. [Google Scholar] [CrossRef] [Green Version]
  78. Jorgensen, J.; Dabrowski, B.; Pei, S.; Hinks, D.; Soderholm, L.; Morosin, B.; Schirber, J.; Venturini, E.; Ginley, D. Superconducting phase of La2CuO4+δ: A superconducting composition resulting from phase separation. Phys. Rev. B 1988, 38, 11337. [Google Scholar] [CrossRef] [PubMed]
  79. Uchida, S.; Ido, T.; Takagi, H.; Arima, T.; Tokura, Y.; Tajima, S. Optical spectra of La2−xSrxCuO4: Effect of carrier doping on the electronic structure of the CuO2 plane. Phys. Rev. B 1991, 43, 7942. [Google Scholar] [CrossRef] [PubMed]
  80. Cox, D.; Zolliker, P.; Axe, J.; Moudden, A.; Moodenbaugh, A.; Xu, Y. Structural studies of La2−xBaxCuO4 between 11–293 K. Mater. Res. Soc. Symp. Proc. 1989, 156, 141. [Google Scholar] [CrossRef]
  81. Onoda, M.; Shamoto, S.I.; Sato, M.; Hosoya, S. Single Crystal X-Ray Diffraction Study of (La1−xMx)2CuO4−δ (M=Sr and Ba), La2CuO4−δ and LnBa2Cu3O7−δ (Ln=Y, Dy and Ho) Systems. Nov. Superconduct. 1987, 1, 919–920. [Google Scholar]
  82. Schlipf, M. Heyd-Scuseria-Ernzerhof Screened ExchangeHybrid Functional for Complex Materials: All-Electron Implementation and Application. Ph.D. Thesis, Forschungszentrum Julich, Julich, Germany, 2012. [Google Scholar]
  83. Dittrich, H.; Karl, N.; Schock, H.; Kuck, S. Ternary Compounds, Organic Semiconductors: Supplement to Vol. III/7h; Springer: Berlin/Heidelberg, Germany, 2000. [Google Scholar]
  84. Wahl, R.; Vogtenhuber, D.; Kresse, G. SrTiO3 and BaTiO3 revisited using the projector augmented wave method: Performance of hybrid and semilocal functionals. Phys. Rev. B 2008, 78, 104116. [Google Scholar] [CrossRef]
  85. Verbraeken, M.C.; Suard, E.; Irvine, J.T. Structural and electrical properties of calcium and strontium hydrides. J. Mater. Chem. 2009, 19, 2766–2770. [Google Scholar] [CrossRef]
  86. Wemple, S. Polarization Fluctuations and the Optical-Absorption Edge in BaTiO3. Phys. Rev. B 1970, 2, 2679. [Google Scholar] [CrossRef]
  87. Lee, Y.; Lee, J.; Noh, T.; Byun, D.Y.; Yoo, K.S.; Yamaura, K.; Takayama-Muromachi, E. Systematic trends in the electronic structure parameters of the 4d transition-metal oxides SrMO3 (M = Zr, Mo, Ru, and Rh). Phys. Rev. B 2003, 67, 113101. [Google Scholar] [CrossRef] [Green Version]
  88. Jain, A.; Ong, S.P.; Hautier, G.; Chen, W.; Richards, W.D.; Dacek, S.; Cholia, S.; Gunter, D.; Skinner, D.; Ceder, G.; et al. Commentary: The Materials Project: A materials genome approach to accelerating materials innovation. APL Mater. 2013, 1, 011002. [Google Scholar] [CrossRef] [Green Version]
  89. Kennedy, B.J.; Howard, C.J.; Chakoumakos, B.C. High-temperature phase transitions in SrHfO3. Phys. Rev. B 1999, 60, 2972. [Google Scholar] [CrossRef]
  90. Zhang, H.; Qiao, J.; Li, G.; Li, S.; Wang, G.; Wang, J.; Song, Y. Preparation of Ce4+-doped BaZrO3 by hydrothermal method and application in dual-frequent sonocatalytic degradation of norfloxacin in aqueous solution. Ultrason. Sonochem. 2018, 42, 356–367. [Google Scholar] [CrossRef] [PubMed]
  91. Pies, W.; Weiss, A. Simple Oxocompounds of Zirconium (Oxozirconates). 1976. Available online: https://materials.springer.com/lb/docs/sm_lbs_978-3-540-37567-8_35 (accessed on 2 April 2023).
  92. Vasilev, A.N.; Buchelnikov, V.D.; Takagi, T.; Khovailo, V.V.; Estrin, E.I. Shape memory ferromagnets. Phys. Usp. 2003, 46, 559–588. [Google Scholar] [CrossRef] [Green Version]
  93. Buchelnikov, V.D.; Vasiliev, A.N.; Koledov, V.; Taskaev, S.; Khovaylo, V.V.; Shavrov, V.G. Magnetic shape-memory alloys: Phase transitions and functional properties. Phys. Usp. 2006, 49, 871. [Google Scholar] [CrossRef]
  94. Entel, P.; Buchelnikov, V.D.; Khovailo, V.V.; Zayak, A.T.; Adeagbo, W.A.; Gruner, M.E.; Herper, H.C.; Wassermann, E.F. Modelling the phase diagram of magnetic shape memory Heusler alloys. J. Phys. D Appl. Phys. 2006, 39, 865–889. [Google Scholar] [CrossRef]
  95. Entel, P.; Buchelnikov, V.D.; Gruner, M.E.; Hucht, A.; Khovailo, V.V.; Nayak, S.K.; Zayak, A.T. Shape memory alloys: A summary of recent achievements. Mater. Sci. Forum 2008, 583, 21–41. [Google Scholar] [CrossRef]
  96. Planes, A.; Mañosa, L.; Acet, M. Magnetocaloric effect and its relation to shape-memory properties in ferromagnetic Heusler alloys. J. Condens. Matter Phys. 2009, 21, 233201. [Google Scholar] [CrossRef] [Green Version]
  97. Entel, P.; Gruner, M.E.; Dannenberg, A.; Siewert, M.; Nayak, S.K.; Herper, H.C.; Buchelnikov, V.D. Fundamental aspects of magnetic shape memory alloys: Insights from ab initio and Monte Carlo studies. Mater. Sci. Forum 2010, 635, 3–12. [Google Scholar] [CrossRef] [Green Version]
  98. Hickel, T.; Uijttewaal, M.; Al-Zubi, A.; Dutta, B.; Grabowski, B.; Neugebauer, J. Ab Initio-Based Prediction of Phase Diagrams: Application to Magnetic Shape Memory Alloys. Adv. Eng. Mater. 2012, 14, 547–561. [Google Scholar] [CrossRef]
  99. Graf, T.; Felser, C.; Parkin, S.S. Simple rules for the understanding of Heusler compounds. Prog. Solid. State Ch. 2011, 39, 1–50. [Google Scholar] [CrossRef]
  100. Yu, G.H.; Xu, Y.L.; Liu, Z.H.; Qiu, H.M.; Zhu, Z.Y.; Huang, X.P.; Pan, L.Q. Recent progress in Heusler-type magnetic shape memory alloys. Rare Met. 2015, 34, 527–539. [Google Scholar] [CrossRef]
  101. Felser, C.; Wollmann, L.; Chadov, S.; Fecher, G.H.; Parkin, S.S. Basics and prospective of magnetic Heusler compounds. APL Mater. 2015, 3, 041518. [Google Scholar] [CrossRef] [Green Version]
  102. de Paula, V.G.; Reis, M.S. All-d-metal full Heusler alloys: A novel class of functional materials. Chem. Mater. 2021, 33, 5483–5495. [Google Scholar] [CrossRef]
  103. Tavares, S.; Yang, K.; Meyers, M.A. Heusler alloys: Past, properties, new alloys, and prospects. Prog. Mater. Sci. 2022, 132, 101017. [Google Scholar] [CrossRef]
  104. He, J.; Rabe, K.M.; Wolverton, C. Computationally accelerated discovery of functional and structural Heusler materials. MRS Bull. 2022, 47, 559–572. [Google Scholar] [CrossRef]
  105. Baigutlin, D.; Sokolovskiy, V.; Miroshkina, O.; Zagrebin, M.; Nokelainen, J.; Pulkkinen, A.; Barbiellini, B.; Pussi, K.; Lähderanta, E.; Buchelnikov, V.; et al. Electronic structure beyond the generalized gradient approximation for Ni2MnGa. Phys. Rev. B 2020, 102, 045127. [Google Scholar] [CrossRef]
  106. Barbiellini, B.; Pulkkinen, A.; Nokelainen, J.; Buchelnikov, V.; Sokolovskiy, V.; Miroshkina, O.N.; Zagrebin, M.; Pussi, K.; Lähderanta, E.; Granovsky, A. Correlation effects in the ground state of Ni-(Co)-Mn-Sn Heusler compounds. MRS Adv. 2019, 4, 441–446. [Google Scholar] [CrossRef]
  107. Buchelnikov, V.; Sokolovskiy, V.; Miroshkina, O.; Baigutlin, D.; Zagrebin, M. Phase transformations in Ni (Co)-Mn (Cr, C)-(In, Sn) Alloys: An ab initio study. Phys. Met. Metallogr. 2020, 121, 202–209. [Google Scholar] [CrossRef]
  108. Miroshkina, O.N.; Zagrebin, M.A.; Pavlukhina, O.O.; Sokolovskiy, V.V.; Buchelnikov, V.D. The influence of exchange-correlation functionals on the ground state properties of Ni2Mn(Ga, Sn) and Fe2(Ni, V)(Ga, Al) Heusler alloys. Mater. Res. Proc. 2018, 9, 104. [Google Scholar]
  109. Zelenỳ, M.; Sedlák, P.; Heczko, O.; Seiner, H.; Veřtát, P.; Obata, M.; Kotani, T.; Oda, T.; Straka, L. Effect of electron localization in theoretical design of Ni-Mn-Ga based magnetic shape memory alloys. Mater. Des. 2021, 209, 109917. [Google Scholar] [CrossRef]
  110. Erager, K.R.; Baigutlin, D.R.; Sokolovskiy, V.V.; Buchelnikov, V.D. Exchange correlation effects in modulated martensitic structures of the Mn2NiGa Alloy. Phys. Met. Metallogr. 2022, 123, 375–380. [Google Scholar] [CrossRef]
  111. Draganyuk, O.N.; Zhandun, V.S.; Zamkova, N.G. Half-metallicity in Fe2MnSi and Mn2FeSi Heusler compounds: A comparative ab initio study. Mater. Chem. Phys. 2021, 271, 124897. [Google Scholar] [CrossRef]
  112. Shastri, S.S.; Pandey, S.K. Electronic structure and phonon properties of Fe2ScAs full-Heusler alloy. AIP Conf. Proc. 2019, 2115, 030384. [Google Scholar]
  113. Abuova, A.; Merali, N.; Abuova, F.; Khovaylo, V.; Sagatov, N.; Inerbaev, T. Electronic properties and chemical bonding in V2FeSi and Fe2VSi Heusler alloys. Crystals 2022, 12, 1546. [Google Scholar] [CrossRef]
  114. Mellah, D.E.; Demmouche, K. Exchange-correlation and spin-orbit coupling effects in 18-electrons transparent conductors half-Heusler: Ab-initio study. Comput. Condens. Matter 2022, 32, e00690. [Google Scholar] [CrossRef]
  115. Shastri, S.S.; Pandey, S.K. Thermoelectric properties, efficiency and thermal expansion of ZrNiSn half-Heusler by first-principles calculations. J. Phys. Condens. Matter 2020, 32, 355705. [Google Scholar] [CrossRef]
  116. Stephen, G.M.; Lane, C.; Buda, G.; Graf, D.; Kaprzyk, S.; Barbiellini, B.; Bansil, A.; Heiman, D. Electrical and magnetic properties of thin films of the spin-filter material CrVTiAl. Phys. Rev. B 2019, 99, 224207. [Google Scholar] [CrossRef] [Green Version]
  117. Shastri, S.S.; Pandey, S.K. Two functionals approach in DFT for the prediction of thermoelectric properties of Fe2ScX (X= P, As, Sb) full-Heusler compounds. J. Phys. Condens. Matter 2019, 31, 435701. [Google Scholar] [CrossRef] [Green Version]
  118. Sattar, M.A.; Javed, M.; Al Bouzieh, N.; Benkraouda, M.; Amrane, N. First-principles investigation on the novel half-Heusler VXTe (X = Cr, Mn, Fe, and Co) alloys for spintronic and thermoelectric applications. Mater. Sci. Semicond. Process. 2023, 155, 107233. [Google Scholar] [CrossRef]
  119. Özdemir Kart, S.; Uludoğan, M.; Karaman, I.; Çağın, T. DFT studies on structure, mechanics and phase behavior of magnetic shape memory alloys: Ni2MnGa. Phys. Status Solidi A 2008, 205, 1026–1035. [Google Scholar] [CrossRef]
  120. Sozinov, A.; Likhachev, A.; Lanska, N.; Ullakko, K. Giant magnetic-field-induced strain in NiMnGa seven-layered martensitic phase. Appl. Phys. Lett. 2002, 80, 1746–1748. [Google Scholar] [CrossRef]
  121. Webster, P.; Ziebeck, K.; Town, S.; Peak, M. Magnetic order and phase transformation in Ni2MnGa. Philos. Mag. B 1984, 49, 295–310. [Google Scholar] [CrossRef]
  122. Çakır, A.; Righi, L.; Albertini, F.; Acet, M.; Farle, M.; Aktürk, S. Extended investigation of intermartensitic transitions in Ni-Mn-Ga magnetic shape memory alloys: A detailed phase diagram determination. J. Appl. Phys. 2013, 114, 183912. [Google Scholar] [CrossRef]
  123. Straka, L.; Drahokoupil, J.; Pacherová, O.; Fabiánová, K.; Kopeckỳ, V.; Seiner, H.; Hänninen, H.; Heczko, O. The relation between lattice parameters and very low twinning stress in Ni50Mn25+xGa25−x magnetic shape memory alloys. Smart Mater Struct. 2015, 25, 025001. [Google Scholar] [CrossRef] [Green Version]
  124. Liu, G.; Chen, J.; Liu, Z.; Dai, X.; Wu, G.; Zhang, B.; Zhang, X. Martensitic transformation and shape memory effect in a ferromagnetic shape memory alloy: Mn2NiGa. Appl. Phys. Lett. 2005, 87, 262504. [Google Scholar] [CrossRef]
  125. Singh, S.; Maniraj, M.; D’Souza, S.; Ranjan, R.; Barman, S. Structural transformations in Mn2NiGa due to residual stress. Appl. Phys. Lett. 2010, 96, 081904. [Google Scholar] [CrossRef]
  126. Brown, P.; Kanomata, T.; Neumann, K.; Neumann, K.; Ouladdiaf, B.; Sheikh, A.; Ziebeck, K. Atomic and magnetic order in the shape memory alloy Mn2NiGa. J. Phys. Condens. Matter. 2010, 22, 506001. [Google Scholar] [CrossRef]
  127. Janovec, J.; Zelenỳ, M.; Heczko, O.; Ayuela, A. Localization versus delocalization of d-states within the Ni2MnGa Heusler alloy. Sci. Rep. 2022, 12, 20577. [Google Scholar] [CrossRef]
  128. Liu, G.; Dai, X.; Yu, S.; Zhu, Z.; Chen, J.; Wu, G.; Zhu, H.; Xiao, J.Q. Physical and electronic structure and magnetism of Mn2NiGa: Experiment and density-functional theory calculations. Phys. Rev. B 2006, 74, 054435. [Google Scholar] [CrossRef] [Green Version]
  129. Kundu, A.; Gruner, M.E.; Siewert, M.; Hucht, A.; Entel, P.; Ghosh, S. Interplay of phase sequence and electronic structure in the modulated martensites of Mn2NiGa from first-principles calculations. Phys. Rev. B 2017, 96, 064107. [Google Scholar] [CrossRef] [Green Version]
  130. Miroshkina, O.N.; Eggert, B.; Lill, J.; Beckmann, B.; Koch, D.; Hu, M.Y.; Lojewski, T.; Rauls, S.; Scheibel, F.; Taubel, A.; et al. Impact of magnetic and antisite disorder on the vibrational densities of states in Ni2MnSn Heusler alloys. Phys. Rev. B 2022, 106, 214302. [Google Scholar] [CrossRef]
  131. Ye, M.; Kimura, A.; Miura, Y.; Shirai, M.; Cui, Y.T.; Shimada, K.; Namatame, H.; Taniguchi, M.; Ueda, S.; Kobayashi, K.; et al. Role of electronic structure in the martensitic phase transition of Ni2Mn1+xSn1−x studied by hard-x-ray photoelectron spectroscopy and ab initio calculation. Phys. Rev. Lett. 2010, 104, 176401. [Google Scholar] [CrossRef] [PubMed] [Green Version]
  132. Entel, P.; Gruner, M.E.; Comtesse, D.; Sokolovskiy, V.V.; Buchelnikov, V.D. Interacting magnetic cluster-spin glasses and strain glasses in Ni-Mn based Heusler structured intermetallics. Phys. Status Solidi B 2014, 251, 2135–2148. [Google Scholar] [CrossRef]
  133. Xiao, H.B.; Yang, C.P.; Wang, R.L.; Marchenkov, V.V.; Bärner, K. Effect of alloying element Al substitution on Ni-Mn-Sn shape memory alloy by first-principle calculations. J. Appl. Phys. 2012, 112, 123723. [Google Scholar] [CrossRef]
  134. Xiao, H.B.; Yang, C.P.; Wang, R.L.; Marchenkov, V.V.; Luo, X. Martensitic transformation and phase stability of In-doped Ni-Mn-Sn shape memory alloys from first-principles calculations. J. Appl. Phys. 2014, 115, 203703. [Google Scholar] [CrossRef]
  135. Çakır, A.; Righi, L.; Albertini, F.; Acet, M.; Farle, M. Intermartensitic transitions and phase stability in Ni50Mn50−xSnx Heusler alloys. Acta Mater. 2015, 99, 140–149. [Google Scholar] [CrossRef]
  136. Baygutlin, D.R.; Sokolovskiy, V.V.; Miroshkina, O.N.; Buchel’nikov, V.D. The half-metallic properties of Heusler alloys Mn2ScZ (Z = Al, Si, P, Ga, Ge, As, In, Sn, Sb): Ab initio study. Fiz. Tverd. Tela. 2021, 63, 1751–1757. [Google Scholar]
  137. Buchelnikov, V.D.; Sokolovskiy, V.V.; Miroshkina, O.N.; Baigutlin, D.R.; Zagrebin, M.A.; Barbiellini, B.; Lähderanta, E. Prediction of a Heusler alloy with switchable metal-to-half-metal behavior. Phys. Rev. B 2021, 103, 054414. [Google Scholar] [CrossRef]
  138. Shastri, S.S.; Pandey, S.K. A comparative study of different exchange-correlation functionals in understanding structural, electronic and thermoelectric properties of Fe2VAl and Fe2TiSn compounds. Comput. Mater. Sci. 2018, 143, 316–324. [Google Scholar] [CrossRef] [Green Version]
  139. Chieda, Y.; Kanomata, T.; Fukushima, K.; Matsubayashi, K.; Uwatoko, Y.; Kainuma, R.; Oikawa, K.; Ishida, K.; Obara, K.; Shishido, T. Magnetic properties of Mn-rich Ni2MnSn Heusler alloys under pressure. J. Alloys Compd. 2009, 486, 51–54. [Google Scholar] [CrossRef]
  140. Kumar, N.; Saini, H.S.; Singh, M.; Kashyap, M.K. Enhanced thermoelectric properties of Ta-doped Half-Heusler ZrNiSn. Mater. Today Proc. 2020, 26, 3478–3481. [Google Scholar] [CrossRef]
  141. Oses, C.; Gossett, E.; Hicks, D.; Rose, F.; Mehl, M.J.; Perim, E.; Takeuchi, I.; Sanvito, S.; Scheffler, M.; Lederer, Y.; et al. AFLOW-CHULL: Cloud-oriented platform for autonomous phase stability analysis. J. Chem. Inf. Model. 2018, 58, 2477–2490. [Google Scholar] [CrossRef] [PubMed]
  142. Planes, A.; Obradó, E.; Gonzalez-Comas, A.; Mañosa, L. Premartensitic transition driven by magnetoelastic interaction in bcc ferromagnetic Ni2MnGa. Phys. Rev. Lett. 1997, 79, 3926. [Google Scholar] [CrossRef] [Green Version]
  143. Khovailo, V.; Takagi, T.; Bozhko, A.; Matsumoto, M.; Tani, J.; Shavrov, V. Premartensitic transition in Ni2+xMn1−xGa Heusler alloys. J. Phys. Condens. Matter 2001, 13, 9655. [Google Scholar] [CrossRef] [Green Version]
  144. Zheludev, A.; Shapiro, S.; Wochner, P.; Schwartz, A.; Wall, M.; Tanner, L. Phonon anomaly, central peak, and microstructures in Ni2MnGa. Phys. Rev. B 1995, 51, 11310. [Google Scholar] [CrossRef] [PubMed]
  145. Zheludev, A.; Shapiro, S.; Wochner, P.; Tanner, L. Precursor effects and premartensitic transformation in Ni2MnGa. Phys. Rev. B 1996, 54, 15045. [Google Scholar] [CrossRef]
  146. Godlevsky, V.V.; Rabe, K.M. Soft tetragonal distortions in ferromagnetic Ni2MnGa and related materials from first principles. Phys. Rev. B 2001, 63, 134407. [Google Scholar] [CrossRef] [Green Version]
  147. Zayak, A.; Entel, P.; Enkovaara, J.; Ayuela, A.; Nieminen, R.M. First-principles investigation of phonon softenings and lattice instabilities in the shape-memory system Ni2MnGa. Phys. Rev. B 2003, 68, 132402. [Google Scholar] [CrossRef] [Green Version]
  148. Haynes, T.; Watts, R.; Laverock, J.; Major, Z.; Alam, M.; Taylor, J.; Duffy, J.; Dugdale, S. Positron annihilation study of the Fermi surface of Ni2MnGa. New J. Phys. 2012, 14, 035020. [Google Scholar] [CrossRef]
  149. Rogl, G.; Grytsiv, A.; Gürth, M.; Tavassoli, A.; Ebner, C.; Wünschek, A.; Puchegger, S.; Soprunyuk, V.; Schranz, W.; Bauer, E.; et al. Mechanical properties of half-Heusler alloys. Acta Mater. 2016, 107, 178–195. [Google Scholar] [CrossRef]
  150. Kasuya, T. Exchange mechanisms in Heusler alloys: Virtual double exchange. Solid State Commun. 1974, 15, 1119–1122. [Google Scholar] [CrossRef]
  151. da Silva, C.E.T.G.; Falicov, L.M. Theory of magnetic properties of rare earth compounds (Localized moments and hybridization effects). J. Phys. C Solid. State Phys. 1972, 5, 63–76. [Google Scholar] [CrossRef]
  152. Şaşıoğlu, E.; Sandratskii, L.M.; Bruno, P. First-principles calculation of the intersublattice exchange interactions and Curie temperatures of the full Heusler alloys Ni2MnX (X = Ga,In,Sn,Sb). Phys. Rev. B 2004, 70, 024427. [Google Scholar] [CrossRef] [Green Version]
  153. Cardias, R.; Szilva, A.; Bergman, A.; Di Marco, I.; Katsnelson, M.; Lichtenstein, A.; Nordström, L.; Klautau, A.; Eriksson, O.; Kvashnin, Y.O. The Bethe-Slater curve revisited; new insights from electronic structure theory. Sci. Rep. 2017, 7, 1–11. [Google Scholar] [CrossRef] [Green Version]
  154. Meinert, M.; Friedrich, C.; Reiss, G.; Blügel, S. GW study of the half-metallic Heusler compounds Co2MnSi and Co2FeSi. Phys. Rev. B 2012, 86, 245115. [Google Scholar] [CrossRef] [Green Version]
  155. Balke, B.; Fecher, G.H.; Kandpal, H.C.; Felser, C.; Kobayashi, K.; Ikenaga, E.; Kim, J.J.; Ueda, S. Properties of the quaternary half-metal-type Heusler alloy Co2Mn1−xFexSi. Phys. Rev. B 2006, 74, 104405. [Google Scholar] [CrossRef] [Green Version]
  156. Aryal, A.; Bakkar, S.; Samassekou, H.; Pandey, S.; Dubenko, I.; Stadler, S.; Ali, N.; Mazumdar, D. Mn2FeSi: An antiferromagnetic inverse-Heusler alloy. J. Alloys Compd. 2020, 823, 153770. [Google Scholar] [CrossRef]
  157. Helmholdt, R.; Buschow, K. Crystallographic and magnetic structure of Ni2MnSn and NiMn2Sn. J. Less-Common Met. 1987, 128, 167–171. [Google Scholar] [CrossRef]
  158. Nejadsattari, F.; Stadnik, Z.M.; Przewoźnik, J.; Buschow, K.H. Mössbauer spectroscopy, magnetic, and ab initio study of the Heusler compound Fe2NiGa. Phys. B Condens. Matter 2015, 477, 113–122. [Google Scholar] [CrossRef]
  159. Luo, H.; Zhang, H.; Zhu, Z.; Ma, L.; Xu, S.; Wu, G.; Zhu, X.; Jiang, C.; Xu, H. Half-metallic properties for the Mn2FeZ (Z = Al, Ga, Si, Ge, Sb) Heusler alloys: A first-principles study. J. Appl. Phys. 2008, 103, 083908. [Google Scholar] [CrossRef]
  160. Tas, M.; Şaşıoğlu, E.; Galanakis, I.; Friedrich, C.; Blügel, S. Quasiparticle band structure of the almost-gapless transition-metal-based Heusler semiconductors. Phys. Rev. B 2016, 93, 195155. [Google Scholar] [CrossRef] [Green Version]
  161. Sk, S.; Devi, P.; Singh, S.; Pandey, S.K. Exploring the best scenario for understanding the high temperature thermoelectric behaviour of Fe2VAl. Mater. Res. Express 2018, 6, 026302. [Google Scholar] [CrossRef] [Green Version]
  162. Okamura, H.; Kawahara, J.; Nanba, T.; Kimura, S.; Soda, K.; Mizutani, U.; Nishino, Y.; Kato, M.; Shimoyama, I.; Miura, H.; et al. Pseudogap formation in the intermetallic compounds (Fe1−xVx)3Al. Phys. Rev. Lett. 2000, 84, 3674. [Google Scholar] [CrossRef] [PubMed] [Green Version]
  163. Öğüt, S.; Rabe, K.M. Band gap and stability in the ternary intermetallic compounds NiSnM (M = Ti, Zr, Hf): A first-principles study. Phys. Rev. B 1995, 51, 10443. [Google Scholar] [CrossRef] [Green Version]
  164. Zou, D.; Xie, S.; Liu, Y.; Lin, J.; Li, J. Electronic structure and thermoelectric properties of half-Heusler Zr0.5Hf0.5NiSn by first-principles calculations. J. Appl. Phys. 2013, 113, 193705. [Google Scholar] [CrossRef]
  165. Berche, A.; Noutack, M.T.; Doublet, M.L.; Jund, P. Unexpected band gap increase in the Fe2VAl Heusler compound. Mater. Today Phys. 2020, 13, 100203. [Google Scholar] [CrossRef] [Green Version]
  166. Zhang, Q.; Xie, P.; Liu, C.; Li, S.; Lei, X.; Huang, L.; Yuan, G.; Cai, F. Enhanced thermoelectric performance of Hafnium free n-type ZrNiSn half-Heusler alloys by isoelectronic Si substitution. Mater. Today Phys. 2022, 24, 100648. [Google Scholar] [CrossRef]
  167. Luo, H.; Zhu, Z.; Ma, L.; Xu, S.; Liu, H.; Qu, J.; Li, Y.; Wu, G. Electronic structure and magnetic properties of Fe2YSi (Y = Cr, Mn, Fe, Co, Ni) Heusler alloys: A theoretical and experimental study. J. Phys. D 2007, 40, 7121. [Google Scholar] [CrossRef]
  168. Galanakis, I.; Özdoğan, K.; Şaşıoglu, E. High-T C fully compensated ferrimagnetic semiconductors as spin-filter materials: The case of CrVXAl (X = Ti, Zr, Hf) Heusler compounds. J. Phys. Condens. Matter 2014, 26, 086003. [Google Scholar] [CrossRef]
  169. Stephen, G.M.; Buda, G.; Jamer, M.E.; Lane, C.; Kaprzyk, S.; Barbiellini, B.; Graf, D.; Lewis, L.H.; Bansil, A.; Heiman, D. Structural and electronic properties of the spin-filter material CrVTiAl with disorder. J. Appl. Phys. 2019, 125, 123903. [Google Scholar] [CrossRef]
  170. Do, D.; Lee, M.S.; Mahanti, S.D. Effect of onsite Coulomb repulsion on thermoelectric properties of full-Heusler compounds with pseudogaps. Phys. Rev. B 2011, 84, 125104. [Google Scholar] [CrossRef] [Green Version]
  171. Sharma, S.; Pandey, S.K. Effect of on-site Coulomb interaction (U) on the electronic and magnetic properties of Fe2MnSi, Fe2MnAl and Co2MnGe. J. Magn. Magn. Mater. 2016, 403, 1–7. [Google Scholar] [CrossRef]
  172. Hinterleitner, B.; Garmroudi, F.; Reumann, N.; Mori, T.; Bauer, E.; Podloucky, R. The electronic pseudo band gap states and electronic transport of the full-Heusler compound Fe2VAl. J. Mater. Chem. C 2021, 9, 2073–2085. [Google Scholar] [CrossRef]
  173. Ram, M.; Saxena, A.; Aly, A.E.; Shankar, A. Half-metallicity in new Heusler alloys Mn2ScZ (Z = Si, Ge, Sn). RSC Adv. 2020, 10, 7661–7670. [Google Scholar] [CrossRef] [PubMed] [Green Version]
  174. Kandpal, H.C.; Fecher, G.H.; Felser, C. Calculated electronic and magnetic properties of the half-metallic, transition metal based Heusler compounds. J. Phys. D 2007, 40, 1507. [Google Scholar] [CrossRef] [Green Version]
  175. Gautier, R.; Zhang, X.; Hu, L.; Yu, L.; Lin, Y.; Sunde, T.O.; Chon, D.; Poeppelmeier, K.R.; Zunger, A. Prediction and accelerated laboratory discovery of previously unknown 18-electron ABX compounds. Nat. Chem. 2015, 7, 308–316. [Google Scholar] [CrossRef] [Green Version]
  176. Aliev, F.; Brandt, N.; Moshchalkov, V.; Kozyrkov, V.; Skolozdra, R.; Belogorokhov, A. Gap at the Fermi level in the intermetallic vacancy system RBiSn (R= Ti, Zr, Hf). Z. Phys. Condens. Matter 1989, 75, 167–171. [Google Scholar] [CrossRef]
  177. Cui, Y.; Kimura, A.; Miyamoto, K.; Sakamoto, K.; Xie, T.; Qiao, S.; Nakatake, M.; Shimada, K.; Taniguchi, M.; Fujimori, S.I.; et al. Electronic structures of Fe3-x Vx Si probed by photoemission spectroscopy. Phys. Status Solidi (A) 2006, 203, 2765–2768. [Google Scholar] [CrossRef] [Green Version]
  178. Lue, C.S.; Ross, J.H. Semimetallic behavior in Fe 2 VAl: NMR evidence. Phys. Rev. B 1998, 58, 9763. [Google Scholar] [CrossRef]
  179. Venkateswara, Y.; Gupta, S.; Samatham, S.S.; Varma, M.R.; Suresh, K.; Alam, A. Competing magnetic and spin-gapless semiconducting behavior in fully compensated ferrimagnetic CrVTiAl: Theory and experiment. Phys. Rev. B 2018, 97, 054407. [Google Scholar] [CrossRef] [Green Version]
  180. Shen, Q.; Chen, L.; Goto, T.; Hirai, T.; Yang, J.; Meisner, G.; Uher, C. Effects of partial substitution of Ni by Pd on the thermoelectric properties of ZrNiSn-based half-Heusler compounds. Appl. Phys. Lett. 2001, 79, 4165–4167. [Google Scholar] [CrossRef] [Green Version]
  181. Lejaeghere, K.; Bihlmayer, G.; Björkman, T.; Blaha, P.; Blügel, S.; Blum, V.; Caliste, D.; Castelli, I.E.; Clark, S.J.; Dal Corso, A.; et al. Reproducibility in density functional theory calculations of solids. Science 2016, 351, aad3000. [Google Scholar] [CrossRef] [PubMed] [Green Version]
Figure 1. (a) Jacob’s ladder classifying the approximations for the exchange–correlation energy on the way to obtaining the absolute chemical accuracy. (b) Seventeen known exact constraints that a meta-GGA can fulfill [28,29,30,31]. Note, the SCAN functional obeys all of these constraints.
Metals 13 00728 g001
Figure 2. Comparison of the SCAN and GGA calculated equilibrium cell volumes ( V c a l c ) of alkali metals, alkaline-earth metals, and 3 d -, 4 d -, and 5 d -transition metals. All values are plotted with respect to the corresponding averaged experimental values of V e x p . The zero dash line denotes the experimental data. The values of m and σ denote the mean and standard deviations from V e x p for each group of metals. The data were collected from Refs. [20,28,40,41,42,43].
Metals 13 00728 g002
Figure 3. SCAN-generated noncollinear magnetic structure of various α -Mn sublattices: I (red), II (yellow), IIIa (blue), IIIb (light blue), IVa (green), and IVb (light green). (a) Only the atomic positions are relaxed. (b) Both the atomic positions and the cell shape are relaxed. The figure is adapted from Ref. [40].
Metals 13 00728 g003
Figure 4. Deviations of the cell volume calculated within SCAN and PBE from experimental results for binary intermetallics with and without TM ions. The figure contains data for 191 alloys without TM ions [19] and for 116 alloys with TM ions [19,43,53,54,57,58]. The experimental values referenced in [19,43,53,54] are taken as the zero dash line.
Metals 13 00728 g004
Figure 5. Deviations of the formation enthalpy calculated within SCAN and PBE as a function of the experimental results for binary intermetallics with and without TM ions. The first panel contains 266 compounds without TM ions [19,46], the second panel contains 513 compounds with one TM ion [19,46], and the last panels include 322 TM compounds [43,46,50,56]. The experimental values referenced in [19,43,46,50,56] are shown as the zero dash line. Filled and open symbols indicate strongly ( | H e x p f o r m | > 1 ) and weakly ( | H e x p f o r m | < 1 ) bonded compounds, correspondingly. CF-CF is the completely filled d-shell for both TMs in a compound; CF-PF is the completely filled and partially filled d-shells for TMs in a compound; and PF-PF is the partially filled d-shell for both TMs in a compound. The values of m and σ denote the mean and standard deviation from H e x p f o r m for each group of compounds.
Metals 13 00728 g005
Figure 6. Comparison of the calculated and experimental band gaps for the binary compounds calculated with SCAN and PBE [46], HSE and PBE [16,67], and B3PW and PBE [69], containing the main group elements and TM ions. The experimental values are shown as the zero black line.
Metals 13 00728 g006
Figure 7. Crystal structure of the full-Heusler X 2 Y Z alloys with (a) the regular Cu 2 MnAl-type and (b) the inverse Hg 2 TiCu-type.
Metals 13 00728 g007
Figure 8. The predicted sequences of phase transitions in Ni 2 MnGa [109] and Mn 2 NiGa [110] by the GGA PBE, SCAN, and GGA + U schemes with the corresponding crystal structures. Here, blue circles are Ni atoms, red circles are Mn atoms, and orange circles are Ga atoms. The experimental ground state for Ni 2 MnGa is the 10M structure, while the sequence of 10M→14M→NM transformations is observed only for off-stoichiometric alloys with Mn excess above 3 at.% or under tensile stress [109]. The martensitic structure of Mn 2 NiGa is reported to be NM [124], 7M [125], and 14M [126].
Metals 13 00728 g008
Figure 9. The calculated total-energy differences relative to the FM state as a function of the tetragonal ratio c / a for (a) Ni 2 MnGa and Fe 2 VAl, (b) Ni 2.5 Mn 0.5 Ga and Ni 2 Mn 1.5 Ga 0.5 , (c) Ni 2 Mn 1 + x Sn 1 x (x = 0 and 0.5), (d) Fe 2 Ni 1 + x Ga 1 x (x = 0 and 0.5). Results are presented for different magnetic configurations. For Fe-Ni-Ga, the energy difference is plotted relative to the FM XA structure [54].
Metals 13 00728 g009
Figure 10. (a) The total energy difference Δ E as a function of the lattice parameter of Mn 2 ScSi for the PBE, SCAN, and GGA   +   U (U = 1 eV) solutions. (b) The Δ E for Mn 2 ScSi calculated by GGA   +   U for a set of U values and mapped into the diagram “Coulomb repulsion term (U) − lattice parameter (a)”. The optimized lattice parameters for both LMS and HMS are marked by the red symbols. The stars denote the degeneracy of the ground state, for which the LMS and HMS have similar energy values at U = 1 eV. For each case, the Δ E is plotted with respect to the left energy minimum [137].
Metals 13 00728 g010
Figure 11. (a) Energy difference between the LMS and HMS as a function of the Si content for Mn 2 VGe 1 x Si x alloys. Various compositions are simulated by generating SQS supercells with different numbers of atoms. The orange line gives the linear approximation. (b) Transition pressure for switching between the LMS and HMS as a function of the Si content. Figure adapted from Ref. [64].
Metals 13 00728 g011
Figure 12. (Left panel) Optimized volume cell for half-, full-, and quaternary Heusler alloys denoted as h-H, f-H, and q-H, correspondingly, calculated by SCAN and PBE. (Right panel) The deviation of the calculated cell volume from the experimental one. The theoretical and experimental values of V were collected from Refs. [54,63,64,105,106,108,110,111,112,113,114,118,127,136,137,139,140].
Metals 13 00728 g012
Figure 13. Energy convex-hull diagram for the ternary (a) Mn-Sc-Si [137] and (b) Mn-V-Ge [64] systems calculated within SCAN. The figures are adapted from Refs. [64,137].
Metals 13 00728 g013
Figure 14. The PBE and SCAN calculated phonon spectra of Ni 2 MnGa in (a) the cubic and (b) tetragonal phases [105].
Metals 13 00728 g014
Figure 15. The phonon total DOS per unit cell and the partial DOS per atom for Fe 2 ScAs [112,117] and ZrNiSn [115].
Metals 13 00728 g015
Figure 16. The total energy E and total and partial magnetic moments of Mn 2 VGe as a function of the lattice parameter for the (a) GGA and (b) SCAN solutions [137]. The E zero is fixed to the LMS energy minimum in all cases.
Metals 13 00728 g016
Figure 17. (left panel) The total magnetic moments for half- and full-Heusler alloys calculated by SCAN and PBE. The deviation of the calculated μ t o t from experimental one is plotted in the (right panel). The theoretical and experimental values were collected from Refs. [54,63,64,105,106,108,110,111,113,114,127,136,137,157,158,159].
Metals 13 00728 g017
Figure 18. The total DOS calculated with PBE and SCAN for the (a) austenite and (b) martensite phases of Ni 2 MnGa [54].
Metals 13 00728 g018
Figure 19. (a) Fermi surfaces of minority spin band of Ni 2 MnGa in the austenite phase. Blue (orange) corresponds to band 63 (64). (b) Cross-sections of the total generalized electron susceptibility along the [110] direction [105].
Metals 13 00728 g019
Figure 20. Transition energies between high-symmetry points based on the external pressure for (a) Co 2 FeSi and (b) CoFeTiAl calculated with the GGA and SCAN [63].
Metals 13 00728 g020
Figure 21. (ac) The element-resolved DOSs and (df) crystal structures for various arrangements of Cr, V, Ti, and Al with a schematic representation of the AFM order [116].
Metals 13 00728 g021
Figure 22. Minority and majority band structures and total and partial DOSs for Mn 2 VGe. (a) GGA results for LMS. SCAN results for (b) LMS and (c) HMS at their equilibrium volumes. Figure adapted from Ref. [64].
Metals 13 00728 g022
Figure 23. The total DOSs for (a) L 2 1 -Fe 2 MnSi and (b) XA-Mn 2 FeSi in their ground state structures [111].
Metals 13 00728 g023
Figure 24. The band gap width for a set of Heusler alloys calculated by PBE, SCAN and mBJ [63,64,108,111,112,113,114,115,116,118,137,165,166,167,168,169]. The band gap widths calculated by PBE + U were taken from Refs. [155,170,171,172,173,174]. The available experimental values were taken from the mentioned papers. In addition, the following Refs. were used to collect experimental data: TiIrSb and ZrIrSb [175], ZrNiSn [176], Fe 2 VSi [177], Fe 2 VAl [178], CrTiVAl [179]. A negative gap value indicates metallic behavior due to the greater energy of VBM compared to that of CBM (see Equation (5)).
Metals 13 00728 g024
Figure 25. Calculated values of S for Fe 2 VAl as a function of temperature obtained using LDA, PBE, PBEsol, SCAN [161].
Metals 13 00728 g025
Figure 26. (a) The experimental and calculated Seebeck coefficients S with temperature for ZrNiSn. The experimental S is taken from Ref. [180]. (b) Seebeck coefficient (S) showing the change in the chemical potential for a band gap of 0.18 meV [180].
Metals 13 00728 g026
Table 1. The energy gap E g , total magnetic moment μ t o t , and equlibrium volume cell calculated within PBE and SCAN for the La 2 CuO 4 and A B O 3 compounds. The experimental data are also presented.
E g (eV) μ tot ( μ B /f.u.)V 3 )
PBESCANexp.PBESCANexp.PBESCANexp.
LTO0.026 [72]1.0 [71]0.9–1.3 [70]0.273 [72]0.49 [71]0.3–0.6 [77]391 [72]379.1 [71]380.3 [78]
0.979 [72]1 [79] 0.491 [72]0.495 [72] 380.3 [72]379.1 [78]
LTT0 [72]1.006 [72]-0.107 [72]0.492 [72]-391.4 [72]379.8 [72]380.3 [80]
HTT0 [72]0.918 [72]-0.262 [72]0.479 [72]-384 [72]375.4 [72]384.2 [81]
SrTiO 3 2.24 [82]2.23 [74]3.43 [83]---61.3 [84]59.7 [74]58.9 [85]
BaTiO 3 1.93 [82]1.92 [74]3.2 [86]---65.7 [84]63.8 [74]64.0 [85]
SrZrO 3 3.68 [82]3.65 [74]5.6 [87]---74.0 [88]71.4 [74]71.7 [89]
BaZrO 3 3.46 [82]3.42 [74]5.05 [90]---77.1 [88]74.5 [74]73.6 [91]
Table 2. Calculated E f o r m (in eV/f.u.) within PBE and SCAN for the cubic austenitic (A) and tetragonal martensitic (M) phases of Ni-Mn-(Ga, Sn), Fe-Ni-Ga, and Fe-V-Al [54]. Missing values indicate the unfavorability of the martensitic structure with respect to the cubic one.
Struc.XCNi 2 MnGaNi 2.5 Mn 0.5 GaNi 2 Mn 1.5 Ga 0.5 Ni 2 MnSnNi 2 Mn 1.5 Sn 0.5
ASCAN−1.583−1.100−1.158−0.832−0.686
APBE−0.645−0.500−0.142−0.1490.113
MSCAN−1.636−1.394−0.708
MPBE−0.632−0.491−0.234−0.710
Fe 2 NiGaFe 2 Ni 1 . 5 Ga 0 . 5 Fe 2 VAl
ASCAN−1.136−0.600−1.699
APBE−0.4260.124−1.691
MSCAN−0.742
MPBE0.001
Disclaimer/Publisher’s Note: The statements, opinions and data contained in all publications are solely those of the individual author(s) and contributor(s) and not of MDPI and/or the editor(s). MDPI and/or the editor(s) disclaim responsibility for any injury to people or property resulting from any ideas, methods, instructions or products referred to in the content.

