
Computational Model Verification and Validation of Elastoplastic Buckling Due to Combined Loads of Thin Plates

 , , and
Abstract
:1. Introduction
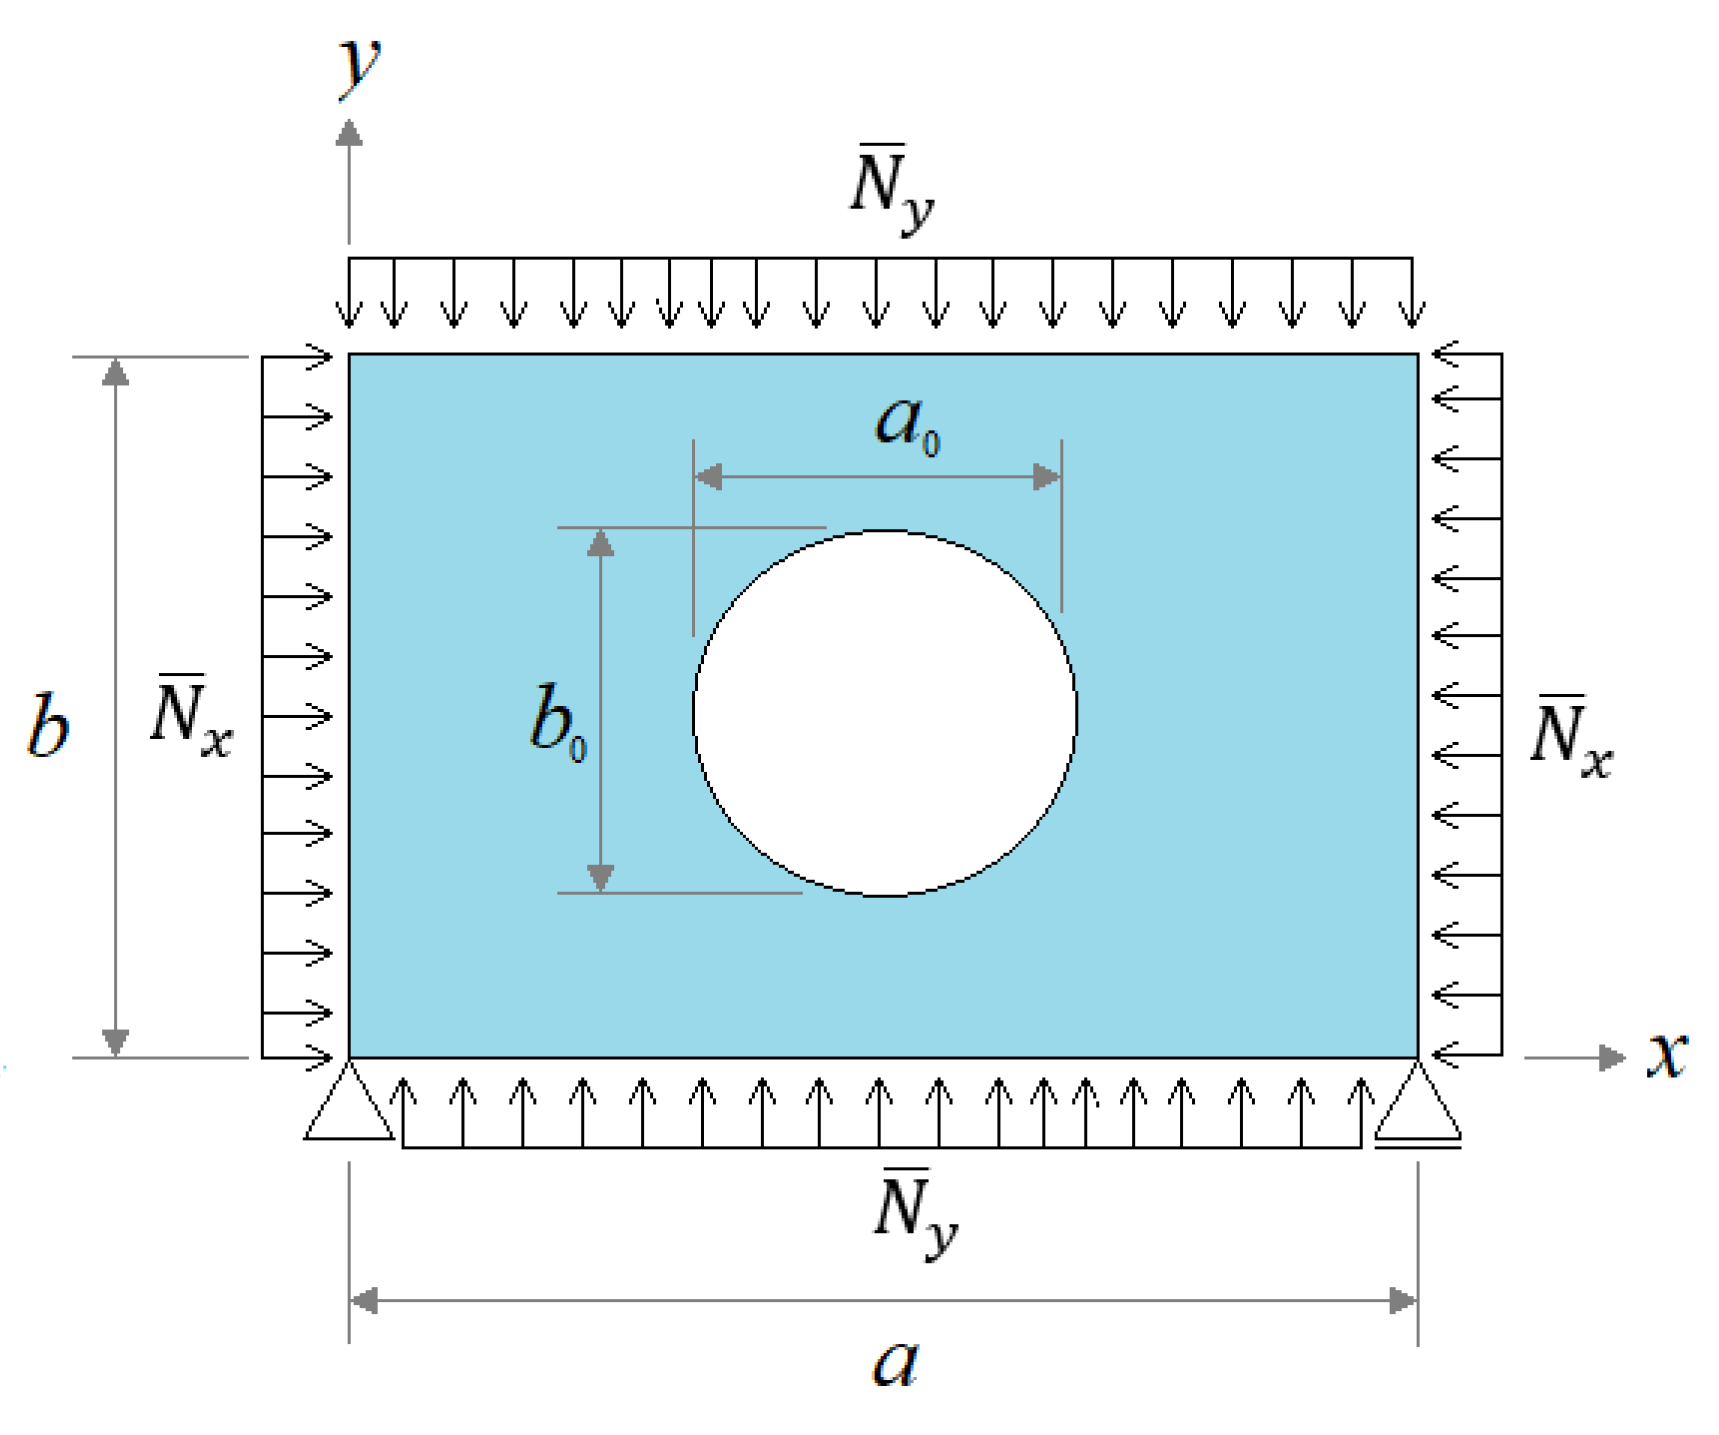
2. Computational Model
3. Results and Discussions
3.1. Computational Model Verification
3.2. Computational Model Validation
3.3. Case Study
- 9.39% higher than AH-36 steel (28.76 MPa)
- 42.28% higher than Al 7075-T651 (18.32 MPa)
- 22.87% higher than SGI (24.48 MPa)
- 34.91% higher than CGI (20.66 MPa).
- 34.02% less than AISI 4130 steel (63.51 mm)
- 203.90% less than Al 7075-T651 (144.02 mm)
- 25.49% less than SGI (59.47 mm)
- 16.37% less than CGI (55.15 mm).
4. Conclusions
Author Contributions
Funding
Data Availability Statement
Conflicts of Interest
References
- Ndubuaku, O.; Liu, X.; Martens, M.; Cheng, J.J.R.; Adeeb, S. The effect of material stress-strain characteristics on the ultimate stress and critical buckling strain of flat plates subjected to uniform axial compression. Constr. Build. Mater. 2018, 182, 346–359. [Google Scholar] [CrossRef]
- El-Sawy, K.M.; Nazmy, A.S.; Martini, M.I. Elasto-plastic buckling of perforated plates under uniaxial compression. Thin-Walled Struct. 2004, 42, 1083–1101. [Google Scholar] [CrossRef]
- Soares, C.G.; Gordo, J.M. Compressive Strength of Rectangular Plates Under Biaxial Load and Lateral Pressure. Thin-Walled Struct. 1996, 24, 231–259. [Google Scholar] [CrossRef]
- Mateus, A.F.; Witz, J.A. Parametric study of the post-buckling behaviour of steel plates. Eng. Struct. 2001, 23, 172–185. [Google Scholar] [CrossRef]
- Maarefdoust, M.; Kadkhodayan, M. Elastoplastic buckling analysis of rectangular thick plates by incremental and deformation theories of plasticity. Proc. Inst. Mech. Eng. Part G J. Aerosp. Eng. 2015, 229, 1280–1299. [Google Scholar]
- Voyiadjis, G.Z.; Woelke, P. Elasto-Plastic and Damage Analysis of Plates and Shells; Springer Science & Business Media: Berlin/Heidelberg, Germany, 2008. [Google Scholar]
- Birman, V. Plates Structures; Springer: New York, NY, USA, 2011. [Google Scholar]
- Rasmussen, K.J.R.; Burns, T.; Bezkorovainy, P.; Bambach, M.R. Numerical modelling of stainless steel plates in compression. J. Constr. Steel Res. 2003, 59, 1345–1362. [Google Scholar] [CrossRef]
- Bezkorovainy, P.; Burns, T.; Rasmussen, K.J.R. Strength curves for metal plates in compression. J. Struct. Eng. 2003, 129, 1433–1440. [Google Scholar] [CrossRef]
- Paik, J.K.; Lee, J.M.; Lee, D.H. Ultimate strength of dented steel plates under axial compressive loads. Int. J. Mech. Sci. 2003, 45, 433–448. [Google Scholar] [CrossRef]
- Pavlovic, A.; Fragassa, C.; Minak, G. Buckling analysis of telescopic boom: Theoretical and numerical verification of sliding pads. Tehnicki Vjesnik. 2017, 24, 729–735. [Google Scholar] [CrossRef] [Green Version]
- Fragassa, C.; Minak, G.; Pavlovic, A. Measuring Deformations in the Telescopic Boom under Static and Dynamic Load Conditions. Facta Univ. Mech. Eng. 2020, 18, 315–328. [Google Scholar] [CrossRef]
- Pinto, V.T.; Rocha, L.A.O.; Fragassa, C.; dos Santos, E.D.; Isoldi, L.A. Multiobjective Geometric Analysis of Stiffened Plates Under Bending Through Constructal Design Method. J. Appl. Comput. Mech. 2020, 6, 1438–1449. [Google Scholar]
- Troina, G.; Cunha, M.; Pinto, V.; Rocha, L.; dos Santos, E.; Fragassa, C.; Isoldi, L. Computational Modeling and Constructal Design Theory Applied to the Geometric Optimization of Thin Steel Plates with Stiffeners Subjected to Uniform Transverse Load. Metals 2020, 10, 220. [Google Scholar] [CrossRef] [Green Version]
- Amaral, R.; Troina, G.S.; Fragassa, C.; Pavlovic, A.; Cunha, M.L.; Rocha, L.A.O.; dos Santos, E.D.; Isoldi, L.A. Constructal Design Method Dealing with Stiffened Plates and Symmetry Boundaries. Theor. Appl. Mech. Lett. 2020, 10, 366–376. [Google Scholar] [CrossRef]
- Ansys Mechanical APDL. Version 15.0–User’s Guide; ANSYS Inc.: Canonsburg, PA, USA, 2017. [Google Scholar]
- Wang, C.M.; Wang, C.Y.; Reddy, J.N. Exact Solutions for Buckling of Structural Members; CRC Press: Boca Raton, FL, USA, 2004. [Google Scholar]
- Madenci, E.; Guven, I. The Finite Element Method and Applications in Engineering Using ANSYS; Springer: New York, NY, USA, 2015. [Google Scholar]
- Ansys. Theory Reference for the Mechanical APDL and Mechanical Applications; ANSYS Inc.: Canonsburg, PA, USA, 2009. [Google Scholar]
- Przemieniecki, J.S. Theory of Matrix Structural Analysis; Courier Corporation: North Chelmsford, MA, USA, 1985. [Google Scholar]
- Helbig, D.; Silva, C.C.C.; Real, M.V.; dos Santos, E.D.; Isoldi, L.A.; Rocha, L.A.O. Study About Buckling Phenomenon in Perforated Thin Steel Plates Employing Computational Modeling and Constructal Design Method. Lat. Am. J. Solids Struct. 2016, 13, 1912–1936. [Google Scholar] [CrossRef]
- Lima, J.P.S.; Cunha, M.L.; dos Santos, E.D.; Rocha, L.A.O.; Real, M.V.; Isoldi, L.A. Constructal Design for the ultimate buckling stress improvement of stiffened plates submitted to uniaxial compressive load. Eng. Struct. 2020, 203, 109883. [Google Scholar] [CrossRef]
- Piscopo, V. Refined Buckling Analysis of Rectangular Plates Under Uniaxial and Biaxial Compression. World Acad. Sci. Eng. Technol. Int. J. Mech. Mechatron. Eng. 2010, 4, 1018–1025. [Google Scholar]
- Jayashankarbabu, B.S. Stability of Square Plate with Concentric Cutout. World Acad. Sci. Eng. Technol. Int. J. Civ. Environ. Eng. 2014, 8, 259–267. [Google Scholar]
- Shanmugan, N.E.; Narayanan, R. Ultimate Strength of Biaxially Loaded Plates. In Stability and Ductility of Steel Structures; Pergamon: Oxford, UK, 1998. [Google Scholar]
- Shanmugan, N.E.; Thevendran, V.; Tan, Y.H. Design formula for axially compressed perforated plates. Thin-Walled Struct. 1999, 34, 1–20. [Google Scholar] [CrossRef]
- Kumar, M.S.; Alagusundaramoorthy, P.; Sundaravadivelu, R. Interaction curves for stiffened panel with circular opening under axial and lateral loads. Ships Offshore Struct. 2009, 4, 133–143. [Google Scholar] [CrossRef]
- Yu, C.L.; Feng, J.C.; Chen, K. Ultimate uniaxial compressive strength of stiffened panel with opening under lateral pressure. Int. J. Nav. Archit. Ocean Eng. 2015, 7, 399–408. [Google Scholar] [CrossRef] [Green Version]
- Narayanan, R.; Chow, F. Strength of Biaxially Compressed Perforated Plates. In Proceedings of the International Specialty Conference on Cold-Formed Steel Structures, St. Louis, MO, USA, 13–14 November 1984; Missouri S&T: Rolla, MO, USA, 1984; pp. 55–73. [Google Scholar]
- Chavan, N.; Salunkhe, A.; Dhawde, C.; Dhanawade, A.; Lad, S. Review on Design, Static and Dynamic Analysis of FSAE Chassis. Int. Res. J. Eng. Technol. 2020, 7, 1995–1997. [Google Scholar]
- Adak, M.; Soares, C.G. Effects of different restraints on the weld-induced residual deformations and stresses in a steel plate. Int. J. Adv. Manuf. Technol. 2014, 71, 699–710. [Google Scholar] [CrossRef]
- Fragassa, C. Material selection in machine design: The change of cast iron for improving the high-quality in woodworking. Proc. Inst. Mech. Eng. Part C J. Mech. Eng. Sci. 2017, 231, 18–30. [Google Scholar] [CrossRef]
- Fragassa, C.; Babic, M.; Bergmann, C.P.; Minak, G. Predicting the tensile behaviour of cast alloys by a pattern recognition analysis on experimental data. Metals 2019, 9, 557. [Google Scholar] [CrossRef] [Green Version]
- Fragassa, C. Investigating the Material Properties of Nodular Cast Iron from a Data Mining Perspective. Metals 2022, 12, 1493. [Google Scholar] [CrossRef]
- Orun, A.E.; Guler, M.A. Effect of hole reinforcement on the buckling behaviour of thin-walled beams subjected to combined loading. Thin-Walled Struct. 2017, 118, 12–22. [Google Scholar] [CrossRef]
- Maruschak, P.O.; Panin, S.V.; Stachowicz, F.; Danyliuk, I.M.; Vlasov, I.V.; Bishchak, R.T. Structural levels of fatigue failure and damage estimation in 17Mn1Si steel on the basis of a multilevel approach of physical mesomechanics. Acta Mech. 2016, 227, 151–157. [Google Scholar] [CrossRef]


| Element Size (mm) | Number of Elements | |
|---|---|---|
| 100 | 100 | 368.75 |
| 75 | 196 | 368.89 |
| 50 | 400 | 368.89 |
| 40 | 625 | 368.89 |
| 30 | 1156 | 368.89 |
| 25 | 1600 | 368.89 |
| Square Hole Dimensions | ||||
|---|---|---|---|---|
| Element Size (mm) | Number of Elements | Number of Elements | ||
| 100 | 101 | 315.46 | 92 | 299.93 |
| 75 | 180 | 314.52 | 162 | 297.89 |
| 50 | 411 | 314.40 | 300 | 297.49 |
| 40 | 633 | 314.34 | 524 | 297.49 |
| 30 | 1116 | 314.34 | 920 | 297.49 |
| 25 | 1500 | 314.34 | 1200 | 297.49 |
| Element Size (mm) | Number of Elements | |
|---|---|---|
| 100 | 24 | 55.13 |
| 75 | 40 | 55.13 |
| 50 | 75 | 55.13 |
| 40 | 108 | 55.13 |
| 30 | 192 | 55.13 |
| 25 | 290 | 55.13 |
| Element Size (mm) | Number of Elements | |
|---|---|---|
| 50 | 8 | 278.06 |
| 20 | 54 | 269.95 |
| 10 | 158 | 266.72 |
| 5 | 600 | 265.10 |
| 4 | 1010 | 263.49 |
| 3 | 1732 | 263.49 |
| 2.5 | 2400 | 263.49 |
| Element Size (mm) | Number of Elements | |
|---|---|---|
| 50.0 | 390 | 0.896 |
| 40.0 | 646 | 0.851 |
| 30.0 | 1050 | 0.806 |
| 20.0 | 2280 | 0.776 |
| 17.5 | 2924 | 0.776 |
| 15.0 | 3800 | 0.776 |
| Plate Width (mm) | (Kumar et al. [24]) | (Present Study) | Difference (%) |
|---|---|---|---|
| 170 | 0.750 | 0.776 | 3.66 |
| 340 | 0.766 | 0.803 | 4.83 |
| 510 | 0.766 | 0.796 | 3.92 |
| Element Size (mm) | Number of Elements | |
|---|---|---|
| 100 | 222 | 0.390 |
| 80 | 320 | 0.370 |
| 60 | 468 | 0.365 |
| 50 | 604 | 0.360 |
| 40 | 1080 | 0.335 |
| 30 | 1564 | 0.335 |
| 25 | 2416 | 0.335 |
| t (mm) | (Yu et al. [28]) | (Present Study) | Difference (%) | |
|---|---|---|---|---|
| 5 | 0.323 | 0.335 | 3.72 | |
| 56 | 0.244 | 0.255 | 4.51 | |
| 12 | 0.591 | 0.575 | 2.71 | |
| 56 | 0.546 | 0.565 | 3.48 |
| Element Size (mm) | Number of Elements | |
|---|---|---|
| 20.0 | 9 | 185.76 |
| 10.0 | 36 | 192.45 |
| 7.5 | 64 | 192.45 |
| 5.0 | 144 | 192.45 |
| 4.0 | 196 | 192.45 |
| 3.0 | 361 | 192.45 |
| 2.5 | 529 | 192.45 |
| Element Size (mm) | Number of Elements | |
|---|---|---|
| 20.0 | 54 | 63.34 |
| 10.0 | 158 | 77.59 |
| 7.5 | 301 | 77.59 |
| 5.0 | 600 | 77.59 |
| 4.0 | 1010 | 77.59 |
| 3.0 | 1732 | 77.59 |
| 2.5 | 2400 | 77.59 |
| Material | E (GPa) | ||
|---|---|---|---|
| AISI 4130 | 210.0 | 0.30 | 460 |
| AH-36 | 210.0 | 0.30 | 355 |
| SGI | 170 | 0.24 | 340 |
| CGI | 150 | 0.22 | 270 |
| Al 7075-T651 | 71.7 | 0.33 | 502 |
| Material | ||
|---|---|---|
| AISI 4130 | 31.74 | 63.51 |
| AH-36 | 28.76 | 47.39 |
| SGI | 24.48 | 59.47 |
| CGI | 20.66 | 55.15 |
| Al 7075-T651 | 18.32 | 144.02 |
Disclaimer/Publisher’s Note: The statements, opinions and data contained in all publications are solely those of the individual author(s) and contributor(s) and not of MDPI and/or the editor(s). MDPI and/or the editor(s) disclaim responsibility for any injury to people or property resulting from any ideas, methods, instructions or products referred to in the content. |
© 2023 by the authors. Licensee MDPI, Basel, Switzerland. This article is an open access article distributed under the terms and conditions of the Creative Commons Attribution (CC BY) license (https://creativecommons.org/licenses/by/4.0/).
Share and Cite
Baumgardt, G.R.; Fragassa, C.; Rocha, L.A.O.; dos Santos, E.D.; da Silveira, T.; Isoldi, L.A. Computational Model Verification and Validation of Elastoplastic Buckling Due to Combined Loads of Thin Plates. Metals 2023, 13, 731. https://doi.org/10.3390/met13040731
Baumgardt GR, Fragassa C, Rocha LAO, dos Santos ED, da Silveira T, Isoldi LA. Computational Model Verification and Validation of Elastoplastic Buckling Due to Combined Loads of Thin Plates. Metals. 2023; 13(4):731. https://doi.org/10.3390/met13040731
Chicago/Turabian StyleBaumgardt, Guilherme Ribeiro, Cristiano Fragassa, Luiz Alberto Oliveira Rocha, Elizaldo Domingues dos Santos, Thiago da Silveira, and Liércio André Isoldi. 2023. "Computational Model Verification and Validation of Elastoplastic Buckling Due to Combined Loads of Thin Plates" Metals 13, no. 4: 731. https://doi.org/10.3390/met13040731