Article

Effect of the Deposition Process on High-Temperature Microstructure and Properties of the Direct Energy Deposition Al-Cu Alloy

1
Welding and Additive Manufacturing Centre, Cranfield University, Bedfordshire MK43 0AL, UK
2
North East Industrial Materials & Metallurgy Co., Ltd., Fushun 113000, China
3
Inner Mongolia Metal Material Research Institute, Baotou 014000, China
4
School of Materials and Metallurgy, Northeastern University, Shenyang 110167, China
*
Author to whom correspondence should be addressed.
Metals 2023, 13(4), 765; https://doi.org/10.3390/met13040765
Submission received: 16 March 2023 / Revised: 10 April 2023 / Accepted: 12 April 2023 / Published: 14 April 2023
(This article belongs to the Section Additive Manufacturing)

Abstract

:
The excellent microstructure and mechanical properties of Al-Cu alloy deposited using the Direct Energy Deposition (DED) process has been shown in previous studies, which is the most likely aluminum alloy material to meet the load-bearing requirements of hypersonic aircraft. However, its high-temperature performance and the law of microstructure transformation during the high-temperature process still need to be determined. In this paper, DED Al-Cu alloy samples were prepared using the Cold Metal Transfer (CMT) process, CMT Pulse process, and CMT Pulse Advanced process. The effect of different deposition processes on the microstructure and mechanical properties of the deposits was investigated at 200 °C for 30 min. The results show that the Al-Cu alloy’s main strengthening phase θ′ is excessively transformed into the equilibrium θ phase after the high-temperature process, which is the main reason for the degradation in the DED Al-Cu alloy’s properties at high temperatures. Different deposition processes have almost no effect on the high-temperature performance of the DED Al-Cu alloy, and the deposition process can be selected according to the product’s structure.

1. Introduction

With the rapid development of aircraft in the direction of lightweight, special-shaped, and hypersonic, the demand for high strength, toughness, and heat resistance of the aircraft shell structural parts is gradually increasing [1,2,3]. After comparing the room temperature and high-temperature properties of common aluminum alloys, Al-Cu alloy is currently the most likely aluminum alloy material to meet the load-bearing requirements of hypersonic aircraft. However, due to the wide crystallization temperature range of the alloy and the slow solidification rate of the casting process, defects such as hot cracks, segregation, and shrinkage cavities are prone to occur in Al-Cu alloy castings. In addition, the weldability of the cast Al-Cu alloy structure is poor, and it is difficult to repair once a defect occurs. This has led to the fact that in practical applications, the proportion of Al-Cu alloy is tiny.
Due to the friction of the air, the temperature of the structural parts of the shell will still rise under the protection of the heat-resistant coating during hypersonic flight. Therefore, it is essential to examine the high-temperature performance of materials when selecting materials for hypersonic vehicle structural parts. According to the actual application requirements of hypersonic vehicles, under the protection of heat insulation materials, the temperature of the structural components during flight is lower than 200 degrees Celsius. The flight time of hypersonic vehicles is generally 10–20 min, so this study mainly investigates the microstructure and mechanical properties at 200 degrees Celsius held for 30 min.
Whether in the product development or mass production stage, producing shell-like structural parts using the Direct Energy Deposition process has significant advantages. The Direct Energy Deposition process is characterized by fast melting and fast cooling [4,5,6]. Manufacturing Al-Cu alloy with this process overcomes the deficiency related to the wide crystallization temperature range of the alloy. It avoids defects in the deposit, such as thermal cracking [7], segregation [8], shrinkage porosity, and shrinkage cavity [9]. In addition, the Direct Energy Deposition process also has the advantages of fast response to design [10], low overall manufacturing cost [11], and intelligent manufacturing.
Gu et al. studied the effects of different heat sources on the room temperature microstructure and properties of Al-Cu alloys manufactured using the wire and arc additive manufacturing process. They found that the Al-Cu alloys deposited with the Cold Metal Transfer (CMT) process achieved the best microstructure and properties [12]. Wang et al. investigated the effect of heat input on the room temperature structure and properties of Al-Cu alloy manufactured using wire and arc additive manufacturing. They found that with the increase in heat input, the grain size of the deposit increased, and the size of the precipitated phase increased. There is a segregation phenomenon, and the number of strengthening phases is significantly reduced [13]. Previous studies have found that the deposition process substantially impacts the room-temperature microstructure and properties of the Direct Energy Deposition Al-Cu alloys. Still, the impact on high-temperature properties has yet to be reported.
In this paper, ZCL205A alloy is used as the raw material, and the samples are prepared using the CMT, CMT Pulse, and CMT Pulse Advanced processes. CMT is a cold metal transfer welding technique with a short arc under digital control. The CMT Pulse process involves the insertion of pulse transitions in the gaps of short arc transitions. The CMT Pulse Advances process involves the addition of positive and negative changes on the basis of the CMT Pulse process. These three processes are common processes for the DED additive manufacturing of aluminum alloy. The geometry of the specimens deposited with these three processes is different and suitable for different product structures. The microstructure and properties of the deposits were investigated at 200 °C for 30 min, and the influence of the deposition process on the high-temperature microstructure and properties of Al-Cu alloy manufactured using the Direct Energy Deposition process was explored.

2. Materials and Methods

North East Industrial Materials & Metallurgy Co., Ltd. (Fushun, China) provided the Al-Cu alloy wire utilized in this study. The diameter of the ZCL205A alloy wire was 1.2 mm. Table 1 lists the chemical composition (weight percentage) of the Al-Cu alloy wire measured using Inductive Coupled Plasma (ICP). Macro chemical composition analyses of the Al-Cu alloy wire raw material and deposits prepared by different deposition processes were carried out using ICP. To determine the chemical composition of the raw material, 5 points at non-adjacent positions were measured and used to calculate the average value.
Figure 1 shows the testing position of the chemical composition of the deposit. Nine points are evenly distributed on the side of the deposit to investigate the macroscopic composition distribution in the Direct Energy Deposition ZCL 205A sample. 1–9 points are uniformly distributed on the deposits to maximize the representation of the chemical composition of the entire deposits.
The Direct Energy Deposition system setup is shown in Figure 2a, which mainly includes the Fronius TPS4000 power supply (Fronius, Zhuhai, China) and ABB 1410 robot (ABB, Shanghai, China). The shielding gas was 99.99% pure argon. The robot arm made a linear reciprocating motion between the pre-set starting and ending points to deposit a single path wall layer by layer. After each layer deposition and cooling, the welding torch movement direction changed to the opposite direction. The deposition was stopped once enough material for sampling was deposited. The geometric dimensions of the wall were 200 mm long and 100 mm high. The CMT, CMT Pulse, and CMT Pulse Advanced modes were selected for this study, and the deposition parameters are provided in Table 2. The sampling position is shown in Figure 2b. The X-axis corresponds to the front of the wall. The Y-axis is the moving direction of the power source, which corresponds to the horizontal direction of the deposit. The Z-axis is the growth direction, corresponding to the vertical direction of the deposit. The horizontal and vertical tensile samples were taken at positions 1 and 2, respectively. The metallographic and transmission electron microscopy samples were taken at position 3.
After T6 treatment, the WDW-300 micro-controlled electronic universal testing machine (Changchunkexin, Changchun, China) was used to test the high-temperature mechanical properties. The test temperature was 200 °C, and the holding time was 30 min. The sample after T6 treatment was kept at 200 °C for 30 min and then quickly transferred to liquid nitrogen for rapid cooling to keep the microstructure at a high temperature. A LEICA MEF4M metallographic microscope (LEICA, Wetzlar, Hamburg, Germany) and a QUANTA FEG 250 scanning electron microscope (FEI Quanta, New York, NY, USA) were used to observe the microstructure and morphology, an energy dispersive spectrometer (EDS, FEI Quanta, New York, NY, USA) was used to analyze elements and phases, and a spherical aberration transmission electron microscope (Thermo Scientific, Waltham, MA, USA) was used to observe the morphology of the precipitated phase. The tensile sample was processed into a circular shape with a gauge length of 30 mm and a cross-sectional area of 2.52 × π mm2.

3. Results and Discussion

3.1. Chemical Composition

According to the test position of the chemical composition specified in Figure 1, ICP is used for measurement, and the macroscopic distribution of the chemical composition in the Direct Energy Deposition ZL205A alloy manufactured with different deposition processes is shown in Figure 3. It can be seen from Figure 3 that the distribution of each alloy element in the deposit is uniform, and there is no macro-segregation phenomenon. The process characteristics of Direct Energy Deposition determine this result. In the Direct Energy Deposition process, the material is deposited layer by layer. The volume of solidified alloy liquid is the size of a molten pool each time. During the deposition process, the molten pool is oval in shape with a size of 8 mm × 10 mm. The amount of solidified molten metal in a molten pool is small, and the molten pool has the characteristics of rapid solidification. Therefore, there is no macro-segregation in the chemical composition of Direct Energy Deposition ZCL205A alloys with different deposition processes.
The burning loss of elements is the main reason for the slight difference in the chemical composition of the deposit at high temperatures under different deposition processes.
The burning loss of elements under the three deposition processes can be calculated using Equation (1) [13].
η   =   A w A d A W × 100 % ,
In this equation, η represents the burning loss rate of each element, Aw represents the element content in the alloy wire, and Ad represents the element content in the deposition sample.
Table 3 shows the burning loss rate of each element in the deposits deposited with different depositing processes. It can be seen from Table 3 that elements B and Cd have the largest burning losses, reaching 60% and 50%, respectively, and the burning loss rates of other elements are within 10%. The affinity of B and Cd to oxygen is higher than that of other elements. Oxygen will inevitably be brought into the deposition process, although the DED process is protected by argon, resulting in the oxidation and burning of B and Cd. Only the content of the Cd element in the deposit is lower than the standard requirement, so a large amount of brown–yellow powder appears on the wall’s surface. The burning loss rate of each element should be considered when designing the chemical composition of wire for the wire and arc additive manufacturing process, and the content of each element should be adjusted appropriately so that the additively manufactured products meet the standard requirements of “GB/T 1173-2013”. Since the element Cd burns seriously and produces toxic CdO, which cannot meet the requirements of safe production, alternative alloying elements should be sought.
The element burnout rate of different deposition processes is slightly different, among which the element burnout rate produced with the CMT Pulse process is the largest, the element burnout rate produced with the CMT Pulse Advanced process is the smallest, and the element burnout rate produced with the CMT process is in the middle. This is due to the energy difference between the three different processes. The energy of the arc in the CMT Pulse process is the largest, resulting in the largest burning loss of elements. The arc energy of the CMT Pulse Advanced process is the smallest, so the element burning loss is the smallest. Overall, there is little difference in element burning losses caused by the different deposition processes.

3.2. Grain Size

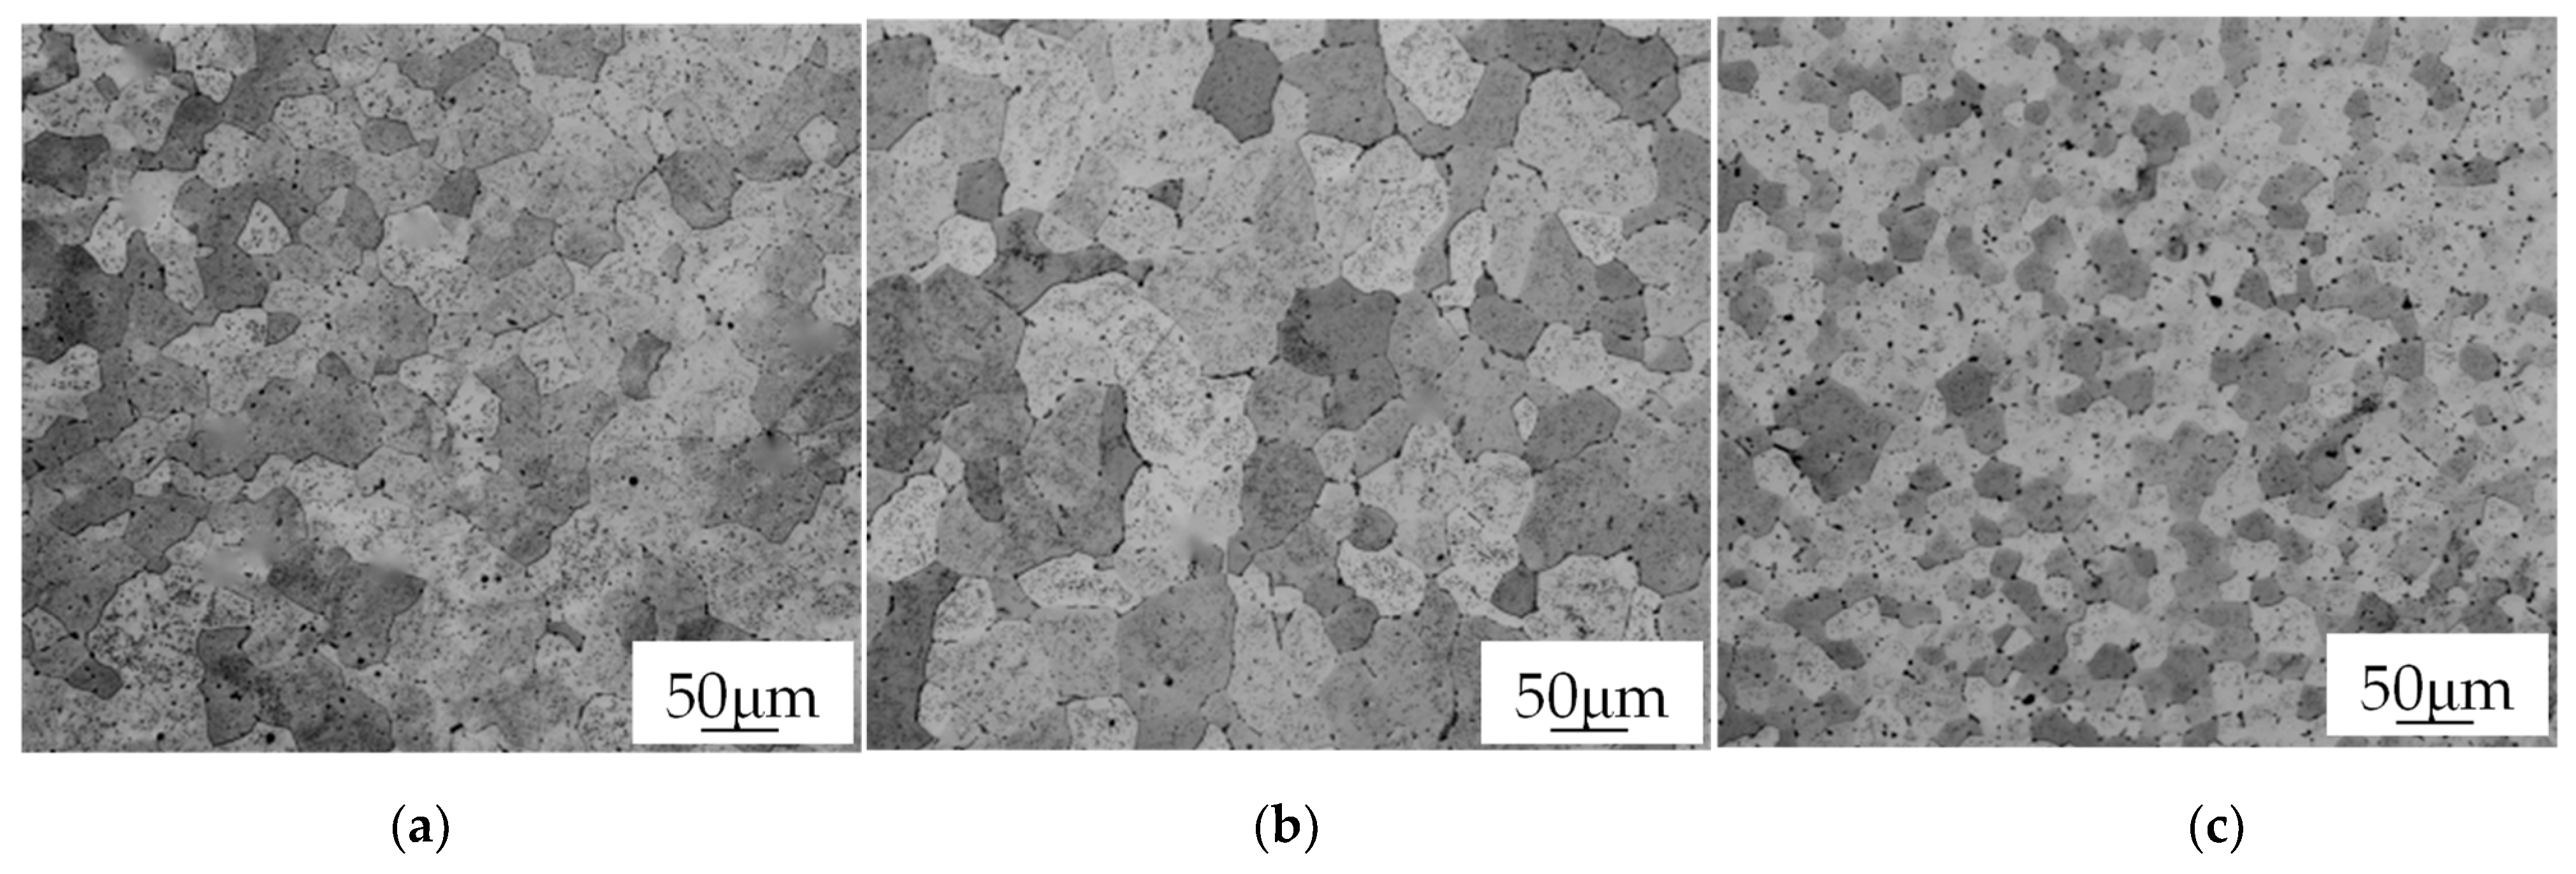
The grain changes in the Direct Energy Deposition ZCL205A alloy deposited with the three processes are mainly due to the different heat inputs, which lead to the difference in the thermal history of the deposition process. Figure 4 shows the grain morphology of the deposit with different deposition processes at 200 °C for 30 min. Figure 4a indicates that the ZCL205A alloy deposit manufactured using the CMT process has uniform grains at high temperatures. The grain size of the ZCL205A alloy deposit manufactured using the CMT Pulse process increases significantly at high temperatures, and the uniformity in the grain size becomes worse, as shown in Figure 4b. The deposit manufactured using the CMT Pulse Advanced process has the smallest grain size (approximately 20 μm) and the worst uniformity at high temperatures, as shown in Figure 4c.
The heat Input of the three processes can be calculated using Equation (2) [14]:
HI = ηUI/VTS,
The energy utilization rate η is set to 0.8 for the CMT processes [15]. U represents the average voltage and I represents the average current. The average voltage and average current are calculated by monitoring the current and voltage waveforms during the deposition process. VTS represents the traveling speed. According to Equation (1), the heat input of the CMT, CMT Pulse, and CMT Pulse Advanced processes are 236.1 J/mm, 245.7 J/mm, and 109.7 J/mm, respectively. The difference in the grain size of these three processes at high temperatures is due to the difference in the heat input of the deposition process. When the heat input is larger, the superheat of the molten pool and grain size would be large, at the same time, the solidification rate of the alloy would be slower.
After electron back-scattered diffraction (EBSD) scanning and data analysis, the grain size distribution of DED ZL205A alloys with different deposition processes at 200 °C for 30 min is shown in Figure 5.
The average grain size is counted using the software contained in the EBSD. The average grain size of the ZL205A alloy deposited with the CMT process at high temperature is 43.45 μm. The average grain size of the ZL205A alloy stack deposited with the CMT Pulse process at high temperature is 50.15 μm. The average grain size of the ZL205A alloy stack deposited with the CMT Pulse Advanced process at high temperature is 26.43 μm. The EBSD analysis shows that the grain uniformity in the CMT Pulse Advanced process is the best, and the grain uniformity in the CMT + P process is the worst. This indicates that the heat input of the three processes is different, resulting in different superheating degrees of the molten pool and different solidification speeds of the alloy. Despite the subsequent heat treatment, there are still significant differences in the size and uniformity of the grains at high temperatures.

3.3. Precipitated Phases

The precipitated phases of the Direct Energy Deposition ZCL205A alloy manufactured using different processes at 200 °C for 30 min are shown in Figure 6. The ZCL205A alloy deposit manufactured using the CMT process has a bulk phase. The θ phase contains two elements of Al and Cu, as shown in Figure 6a in the A1 area. Another long strip of precipitated phases at high temperatures is shown in Figure 6a in the A1 area. EDS analysis of this phase contains Al, Cu, Mn, and Fe. It also includes a small amount of Fe-remelted T phase of impurities. This θ phase is not entirely dissolved into the matrix after solid solution treatment, which is called the undissolved θ phase. It can be seen from Figure 6b that the deposit manufactured using the CMT Pulse process also has a remelted T phase at high temperatures, as shown in Figure 6b in the B2 area, and undissolved θ phases, as shown in Figure 6b in the B1 area. The number and size of the undissolved θ phase increase. The deposits manufactured using the CMT Pulse Advanced process can only detect the remelted T phase at high temperatures, as shown in Figure 6c in the C2 area. No undissolved θ phase was found.
The differences among the precipitated phases at high temperatures in the Direct Energy Deposition ZCL205A alloy deposited with different processes are mainly reflected in the number and size of undissolved θ phases. This is due to the different heat inputs of the three deposition processes, resulting in the different sizes in the primary θ phase of the main precipitated phase of the ZCL205A alloy. In the ZCL205A alloy, the quantity of the eutectic structure is combined with Sheil’s, which can be calculated using Equation (3) [16]:
fs = (CeC1 −1) k01 − 1
where Ce is the content of Cu in the eutectic structure, and its value is 0.33. C1 is the mass fraction of Cu in the alloy, and its value is 0.05. k0 is the equilibrium distribution coefficient of the Cu element, which is 0.17 [16]. The heat input has little effect on the content of the eutectic structure in the alloy. However, different heat inputs result in different solidification speeds of the molten pool. The growth time of the primary θ phase is different, so the sizes of the precipitated phases are different. The heat input of the CMT Pulse Advanced process is the smallest, so the solidification speed of the molten pool is the fastest, the growth time of the primary θ phase is the shortest, and the size of the primary θ phase is the smallest. During solution treatment, the smaller the size of the primary θ phase, the larger the relative diffusion interface area in the rest of the Al matrix, and the smaller the potential energy barrier for Cu to dissolve into the Al matrix. Therefore, the primary θ phase of the alloy deposited with the CMT Pulse Advanced process is almost completely dissolved into the Al matrix, and no undissolved θ phase is found at high temperatures. The heat input of the CMT process and the CMT Pulse process increases sequentially, and the number and size of the undissolved θ phase increase at high heat input.

3.4. Strengthening Phases

The θ′ phase is the main strengthening phase of Al-Cu alloy, and its size and density directly affect the mechanical properties of the alloy. Figure 7 shows the morphologies of strengthening phases in the deposits manufactured using different processes at room temperature under the peak aging state. The deposits manufactured using the varying deposition processes have the same morphology along the 001-zone axis in the peak aging state, all of which are θ′ phase [17]. The ZCL205A alloy deposited using the CMT process has a uniform θ′ phase size and a diffuse and dense distribution, as shown in Figure 7a. For the sample deposited using the CMT Pulse process, the density of the θ′ phase decreases, and the phase spacing increases, as shown in Figure 7b. The deposit manufactured using the CMT Pulse Advanced process has the highest density of θ′ phase and the smallest phase spacing. The aging precipitation process of ZCL205A alloy is [18]: supersaturated solid solution (αss) → Guinier Preston (GP) zone (GP I zone) → θ″ (GP II zone) → θ′ → θ. Copper atoms segregate to form GP regions and then form the θ′ phase, so the number of copper atoms dissolved in the Al matrix determines the number of precipitated θ′ phases. Since the CMT Pulse process has the largest heat input, the size of the primary θ phase increases, and the number of undissolved θ phases is the largest after solution treatment, as shown in Figure 7c. The number of Cu atoms that dissolved into the aluminum matrix decreases, resulting in a decrease in the number of θ′ phases precipitated during the aging process.
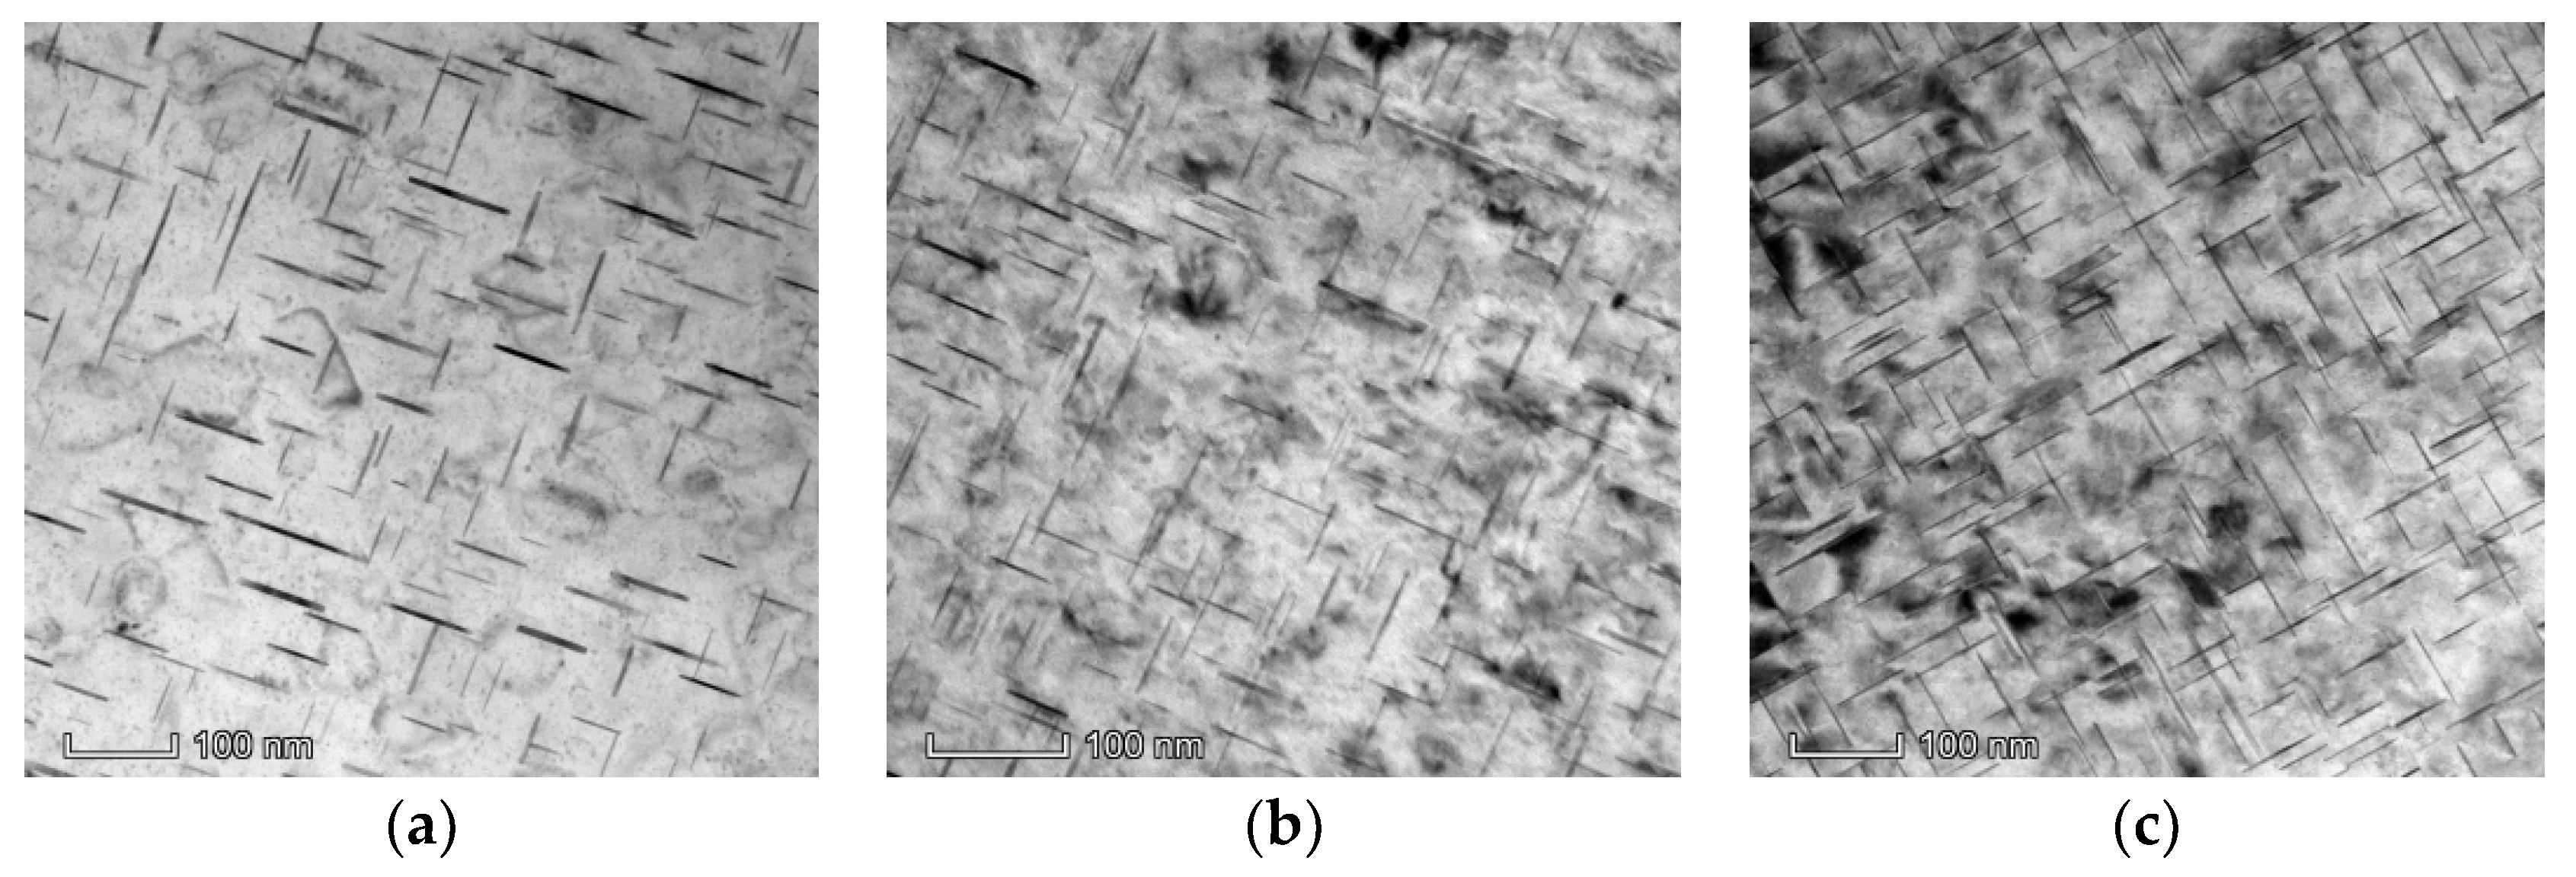
The strengthening phase in the Direct Energy Deposition ZCL205A alloy manufactured using the different processes and held at 200 °C for 30 min is shown in Figure 8. The EDS energy spectrum analysis shows that this phase contains two elements, Al and Cu, as shown in Figure 9, which is the θ phase. The θ phase is believed to be formed by the aggregation and growth of θ′ phase at high temperatures. After a high-temperature process of 200 °C for 30 min, the uniformly distributed nanoscale θ′ phase in the T6 state disappeared, and a large number of precipitated phases with a length of about 0.5 μm appeared. According to the aging precipitation process of the ZCL205A alloy, the main strengthening phase in the peak aging state is the θ′ phase, which is an unstable transition phase. After a high-temperature process, the transition phase aggregates and grows to form a stable phase. The number of stable phases formed after depositing using the different deposition processes undergoing high-temperature processes is different, mainly because the heat input of the varying deposition processes is different, resulting in various sizes of primary θ phases. The heat input of the CMT Pulse Advanced process is the smallest, and the size of the primary θ phase is the smallest. After solution treatment, the number of undissolved θ phases is the smallest, and the density of the θ′ phase is the largest. Therefore, after the high-temperature process, the number of equilibrium θ phases is the largest.

3.5. Mechanical Properties

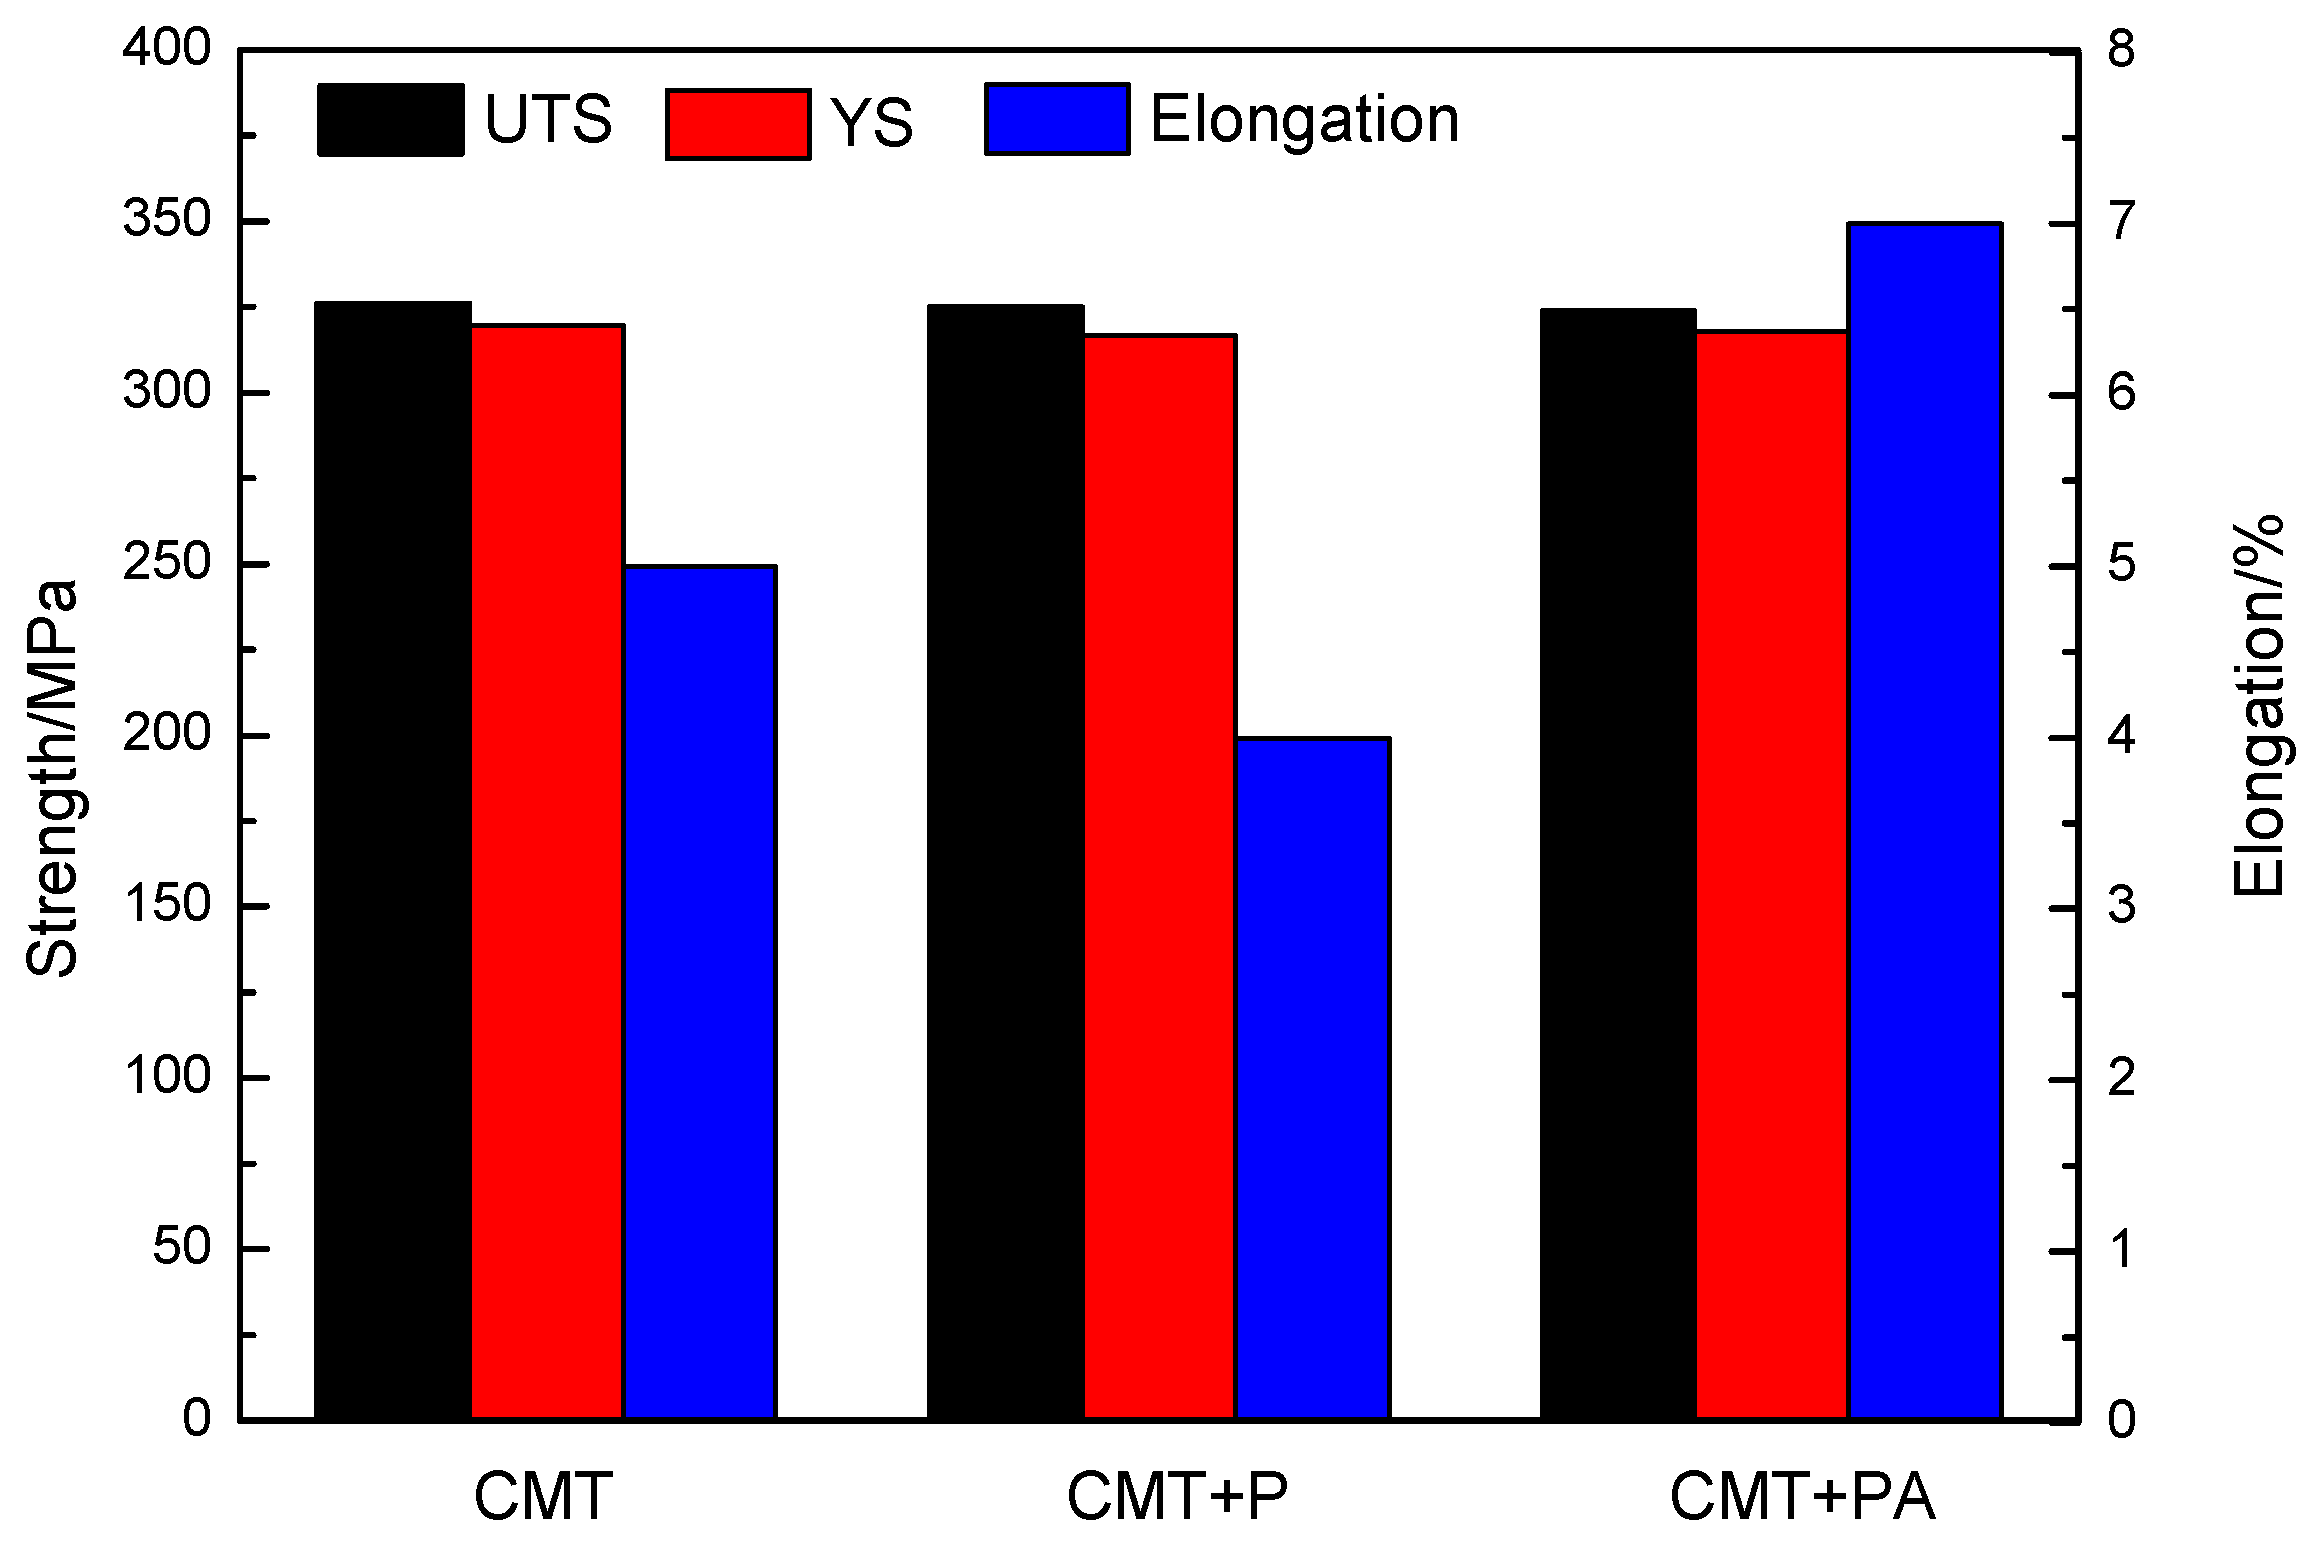
The high-temperature mechanical properties of the Direct Energy Deposition ZCL205A alloy deposited using the different processes are shown in Figure 10. The ultimate tensile strength (UTS) and yield strength (YS) of the different deposition processes at high temperatures are the same: the UTS is 325 MPa, and the yield strength is 320 MPa. The amount of strengthening phase precipitated in the peak state is slightly different due to the different heat inputs of the three deposition processes. However, after the high-temperature process, the strengthening phase in the transition state transforms into a stable phase. The strengthening effect drops rapidly, so the difference in the strengthening phase does not cause significant issues in mechanical properties. The elongations are fairly different: the elongation in the CMT Pulse Advanced process is 7%, and in the CMT Pulse process, it is only 4%. This is caused by the difference in heat inputs in the different processes leading to different sizes of primary θ phases, so the number and size of undissolved θ phases after solution treatment vary greatly, as shown in Figure 6. When the sample is stressed, cracks are first initiated at the position of the θ phases and propagate to the matrix, which reduces the elongation.

3.6. Fracture Morphology

The high-temperature (200 °C for 30 min) fracture morphology images of the Direct Energy Deposition ZCL205A alloy manufactured using different deposition processes are shown in Figure 11. The fracture surface on the ZCL205A alloy deposited using the CMT process contains dimples and dissociation surfaces. The two structures each account for 50% of the area, indicating that the fracture mode of the alloy is a mixed fracture. The proportion of dimples in the fracture on the Direct Energy Deposition ZCL205A alloy deposited using the CMT Pulse process is further reduced, indicating that the fracture mode is mainly brittle fracture, and the low elongation is evidence of this phenomenon. The proportion of dimples in the fracture on the Direct Energy Deposition ZCL205A alloy deposited using the CMT Pulse Advanced process increases, indicating that ductile fracture is the main one.

4. Conclusions

In this study, the Direct Energy Deposition ZCL205A alloy samples were prepared using three processes (the CMT process, CMT Pulse process, and CMT Pulse and Advanced process), and the microstructure and mechanical properties were compared using several methods. The following conclusions were drawn:
  • The grain size of ZCL205A alloy deposits manufactured using different processes at high temperatures is quite different, and the order for grain size is CMT Pulse and Advanced process < CMT process < CMT Pulse process.
  • The order for the number and size of the undissolved θ phases in the ZCL205A alloy deposits manufactured using different Direct Energy Deposition processes at high temperatures is CMT Pulse and Advanced process < CMT process < CMT Pulse process.
  • After the high-temperature process, the transition θ′ phase transforms into the equilibrium θ phase, and the order for the number of equilibrium θ phase is CMT Pulse process < CMT process < CMT Pulse and Advanced process.
  • The tensile strength and yield strength of the ZCL205A alloy deposits prepared using different processes are consistent at the high temperature, and the elongation varies with the deposition processes (CMT Pulse process < CMT process < CMT Pulse and Advanced process), and the deposition process can be selected according to the part’s structure.

Author Contributions

Conceptualization, Z.W. and S.W.; methodology, Z.W.; software, Z.W.; validation, S.W. and L.R.; formal analysis, Z.W.; investigation, Z.W. and S.W.; resources, C.L.; data curation, Z.W.; writing—original draft preparation, Z.W.; writing—review and editing, L.R. and C.L.; visualization, L.R.; supervision, Y.Z. and W.W.; project administration, Z.M.; funding acquisition, W.W. All authors have read and agreed to the published version of the manuscript.

Funding

This research received no external funding.

Data Availability Statement

No new data were created.

Conflicts of Interest

The authors declare no conflict of interest.

References

  1. Wojciechowski, S. New trends in the development of mechanical engineering materials. J. Mater. Process. Technol. 2000, 106, 230–235. [Google Scholar] [CrossRef]
  2. Warner, T. Recently-developed aluminum solutions for aerospace applications. Mater. Sci. 2006, 519, 1271–1278. [Google Scholar]
  3. Heinz, A.; Haszler, A.; Keidel, C.; Moldenhauer, S.; Benedictus, R.; Miller, W.S. Recent development in aluminum alloys for aerospace applications. Mater. Sci. Eng. 2000, 280, 102–107. [Google Scholar] [CrossRef]
  4. Williams, S.W.; Martina, F.; Addison, A.C.; Ding, J.; Pardal, G.; Colegrove, P. Wire + Arc Additive Manufacturing. Mater. Sci. Technol. 2016, 32, 641–647. [Google Scholar] [CrossRef] [Green Version]
  5. Zhang, X.; Zhou, Q.; Wang, K.; Peng, Y.; Ding, J.; Kong, J.; Williams, S. Study on microstructure and tensile properties of high nitrogen Cr-Mn steel processed by CMT wire and arc additive manufacturing. Mater. Des. 2019, 166, 107611. [Google Scholar] [CrossRef]
  6. Lin, J.J.; Lv, Y.H.; Liu, Y.X.; Xu, B.S.; Sun, Z.; Li, Z.G.; Wu, Y.X. Microstructural evolution and mechanical properties of Ti-6Al-4V wall deposited by pulsed plasma arc additive manufacturing. Mater. Des. 2016, 102, 30–40. [Google Scholar] [CrossRef]
  7. Meza, E.S.; Bertelli, F.; Goulart, P.R.; Cheung, N.; Garcia, A. The effect of the growth rate on microsegregation: Experimental investigation in hypoeutectic Al–Fe and Al–Cu alloys directionally solidified. Alloy Compd. 2013, 561, 193–200. [Google Scholar] [CrossRef]
  8. Suyitno, D.G.; Eskin, L.K. Structure observations related to hot tearing of Al-Cu billets produced by direct-chill casting. Mater. Sci. Eng. A 2006, 420, 1–7. [Google Scholar] [CrossRef]
  9. Li, B.; Shen, Y.; Hu, W. Casting defects induced fatigue damage in aircraft frames of ZL205A aluminum alloy—A failure analysis. Mater. Des. 2011, 32, 2570. [Google Scholar] [CrossRef]
  10. Rao, S.R.K.; Reddy, G.M.; Rao, K.S.; Kamaraj, M.; Rao, K.P. Reasons for superior mechanical and corrosion properties of 2219 aluminum alloy electron beam welds. Mater. Charact. 2005, 55, 345. [Google Scholar]
  11. Zhou, Y.; Qi, G. Microstructure and mechanical properties of Ti-6Al-4V deposited by wire and arc additive manufacturing with different deposition paths. Mater. Sci. Eng. A. 2019, 9, 138654. [Google Scholar] [CrossRef]
  12. Gu, J.L. Study on Microstructure and Mechanical Properties of Additively Manufactured Al-Cu-(Mg) Alloys with the CMT Process; Northeastern University: Shenyang, China, 2016. [Google Scholar]
  13. Wang, S. Mechanical Property and Microstructure of WAAM High Strength Al-Cu Alloy; Northeastern University: Shenyang, China, 2019. [Google Scholar]
  14. Cook, G.E.; Eassa, E.H. The Effect of High-Frequency Pulsing of a Welding Arc. IEEE Trans. Ind. Appl. 1985, 1, 1294–1299. [Google Scholar] [CrossRef]
  15. Cong, B.; Ouyang, R.; Qi, B.; Ding, J. Influence of Cold Metal Transfer Process and Its Heat Input on Weld Bead Geometry and Porosity of Aluminum-Copper Alloy Welds. Rare Met. Mater. Eng. 2016, 45, 606–611. [Google Scholar] [CrossRef]
  16. Lin, R.Y.; Fan, J. Solubility of hydrogen in aluminum alloy melt. Light Alloy Fabr. Technol. 1991, 4, 17–20. [Google Scholar]
  17. Song, W. Metallurgy; University of Science and Technology Beijing, Metallurgical Industry Press: Beijing, China, 2008; pp. 85–87. [Google Scholar]
  18. Wang, F.X.; Luo, L.S.; Wang, L.; Zhang, D.H.; Li, X.Z.; Su, Y.Q.; Guo, J.J.; Fu, Z.J. Effect of alloy composition and cooling rate on the growth morphology of primary Al2Cu phase in Al-Cu alloy during solidification. Acta Metall. Sincia 2016, 3, 361–368. [Google Scholar]
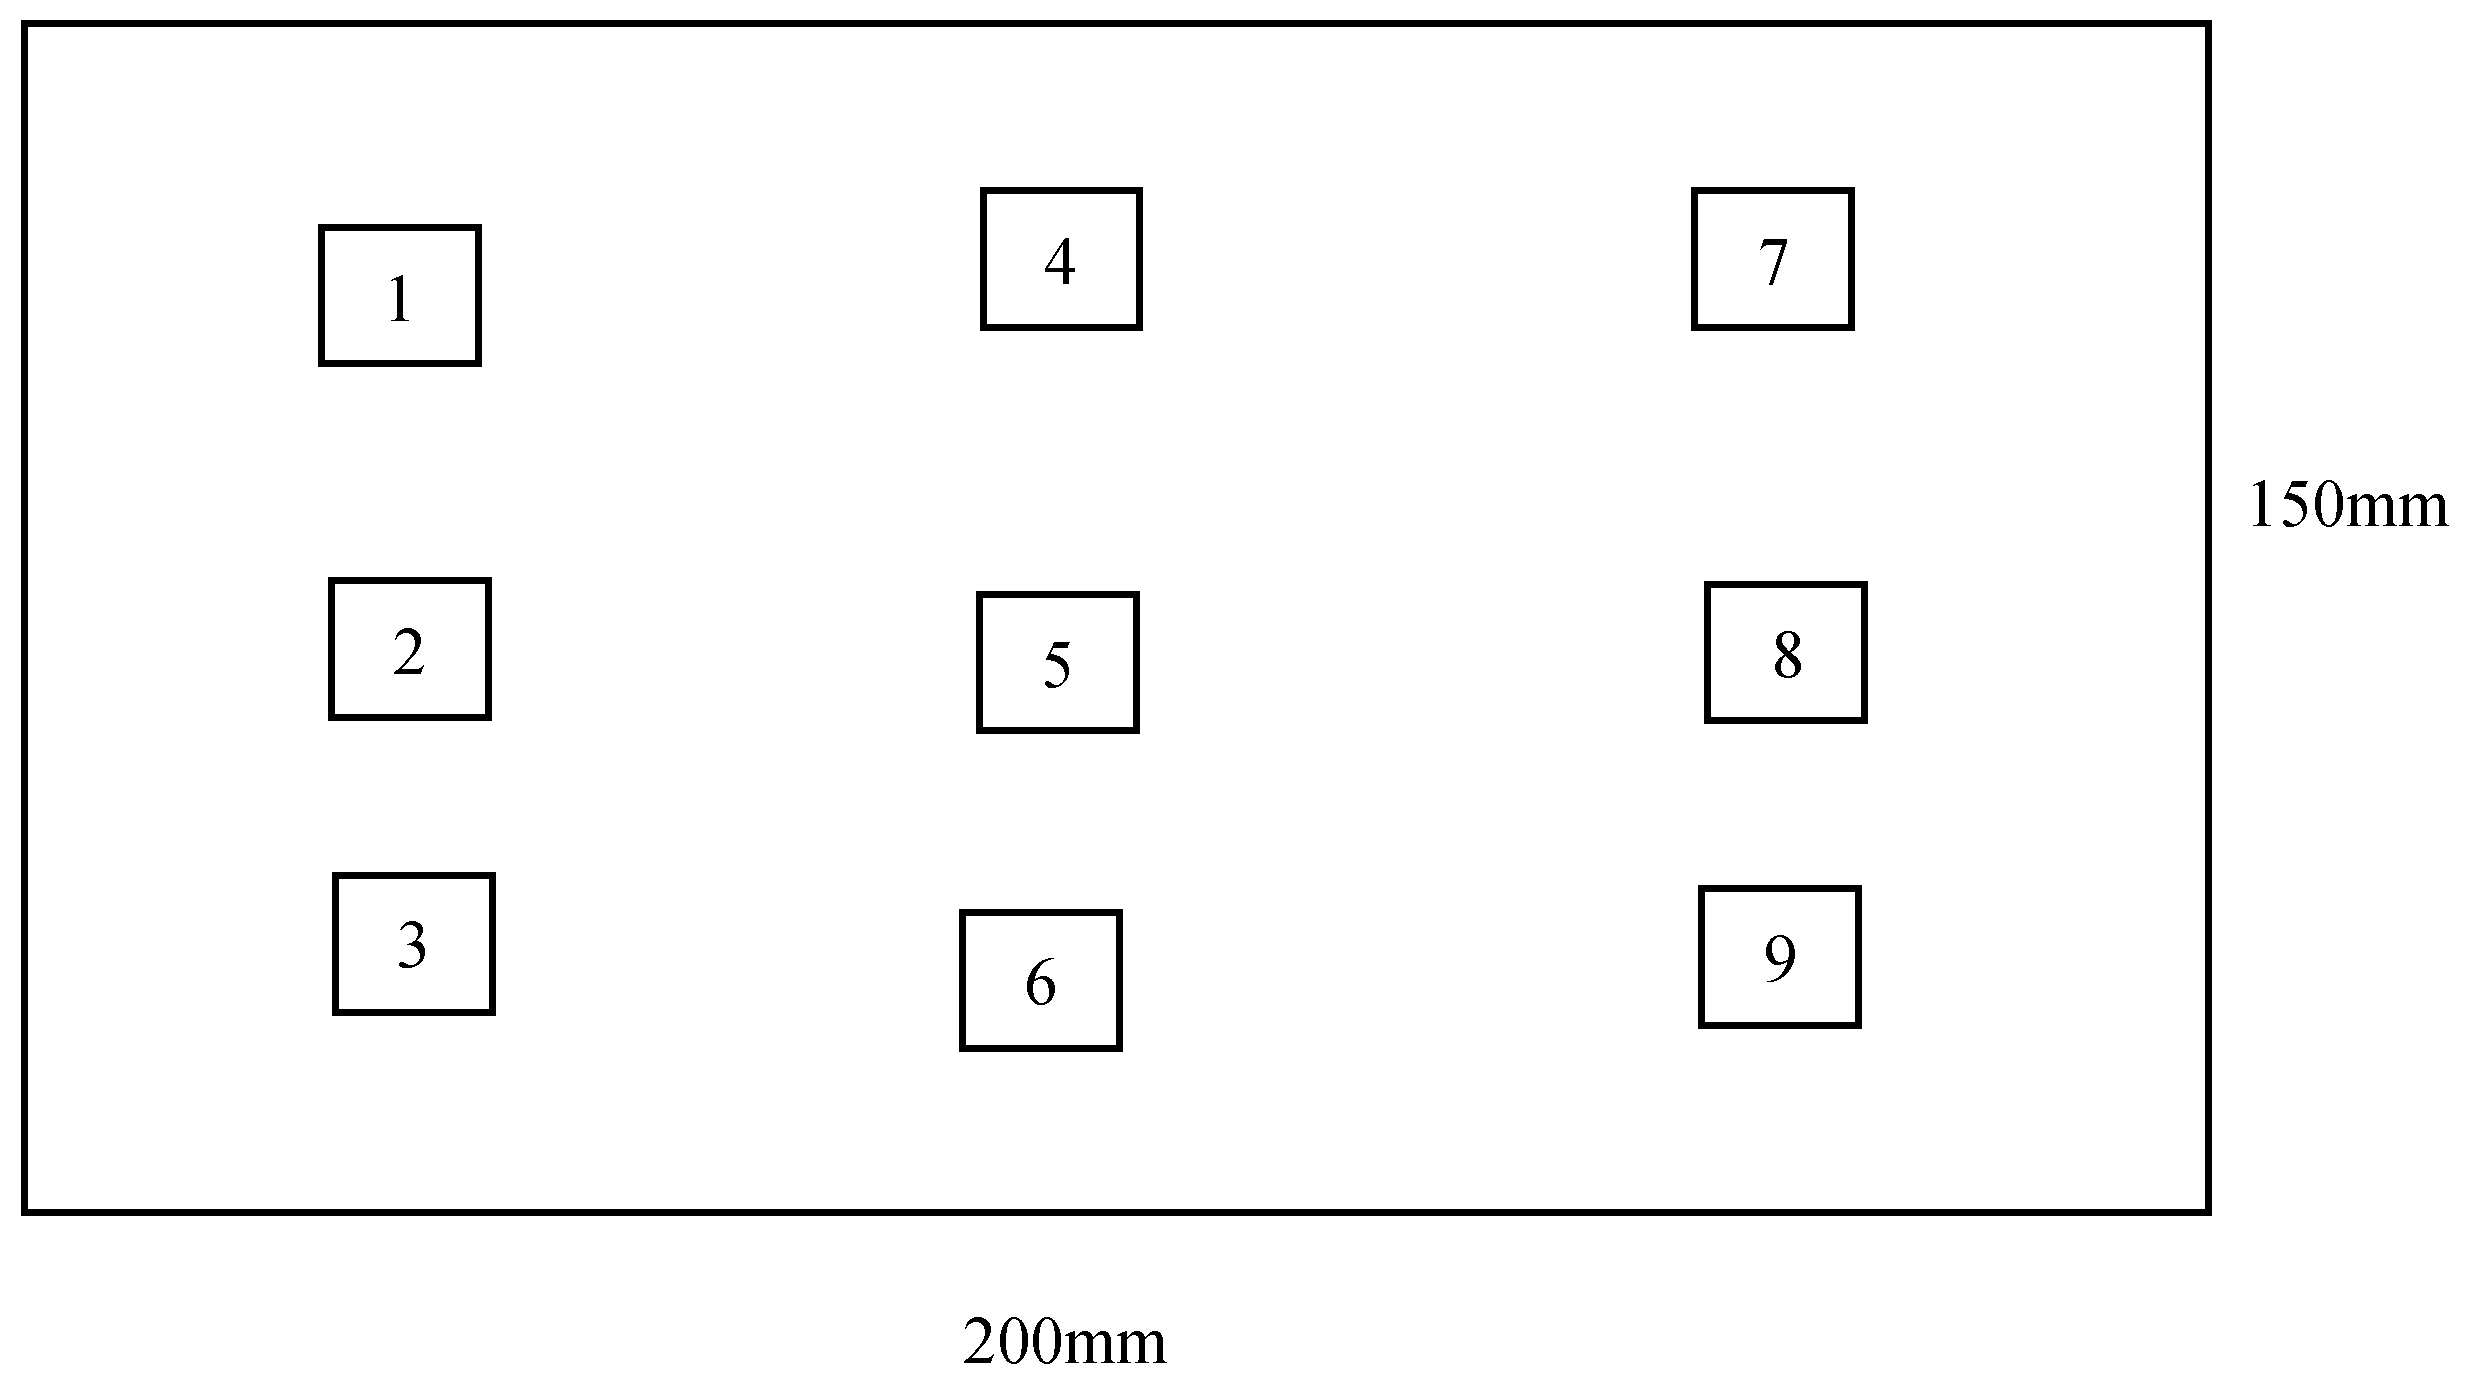
Figure 1. Schematic diagram showing the test location of the chemical composition sample.
Metals 13 00765 g001
Figure 2. (a) Deposition system setup and (b) schematic diagram showing the sampling position.
Metals 13 00765 g002
Figure 3. Chemical composition of ZCL205A alloy deposits manufactured with different deposition processes. (a) Macro-distribution of elements in the deposit prepared using the CMT process; (b) macro-distribution of elements in the deposit prepared using the CMT and Pulse process; (c) macro-distribution of elements in the deposit prepared using the CMT Pulse and Advanced process.
Metals 13 00765 g003
Figure 4. Microstructures of ZCL205A alloy deposits manufactured with different deposition processes held at 200 °C for 30 min. (a) Metallographic photo showing a specimen prepared using the CMT process; (b) metallographic photo showing a specimen prepared using the CMT and Pulse process; and (c) metallographic photo showing a specimen prepared using the CMT Pulse and Advanced process.
Metals 13 00765 g004
Figure 5. The grain size of ZCL205A alloy deposits manufactured with different deposition processes held at 200 °C for 30 min. (a) The distribution of grain size in a sample manufactured using the CMT process; (b) the distribution of grain size in a sample manufactured using the CMT and Pulse process; (c) the distribution of grain size in a sample manufactured using the CMT Pulse and Advanced process.
Metals 13 00765 g005
Figure 6. SEM and EDS of ZCL205A alloy deposits manufactured with different deposition processes held at 200 °C for 30 min. (a) The SEM image and EDS analysis of a sample prepared using the CMT process, where A1 is the θ phase, and A2 is the T phase. (b) The SEM image and EDS analysis of a sample prepared using CMT and Pulse process, where B1 is the θ phase and B2 is the T phase. (c) The SEM image and EDS analysis of a sample prepared using the CMT Pulse and Advanced process, where C2 is the T phase.
Metals 13 00765 g006
Figure 7. TEM of ZCL205A alloy deposits manufactured with different deposition processes at room temperature after peak aging. (a) The TEM image of a sample prepared using CMT process; (b) the TEM image of a sample prepared using CMT and Pulse process; and (c) the TEM image of a sample prepared using the CMT Pulse and Advanced process.
Metals 13 00765 g007
Figure 8. TEM of ZCL205A alloy deposits manufactured with different deposition processes held at 200 °C for 30 min. (a) The TEM image of a sample prepared using CMT process; (b) the TEM image of a sample prepared using CMT and Pulse process; and (c) the TEM image of a sample prepared using the CMT Pulse and Advanced process.
Metals 13 00765 g008
Figure 9. EDS energy spectrum analysis.
Metals 13 00765 g009
Figure 10. High-temperature mechanical properties of ZCL205A alloy deposited using different deposition processes.
Metals 13 00765 g010
Figure 11. High-temperature fracture properties of T6 ZCL205A alloy deposit manufactured with the different deposition processes. (a) A fracture morphology image showing a sample prepared using the CMT process; (b) a fracture morphology image showing a sample prepared using CMT and Pulse process; and (c) a fracture morphology image showing a sample prepared using the CMT Pulse and Advanced process.
Metals 13 00765 g011
Table 1. Chemical composition of the raw material (wt.%).
AlloyCuMnTiCdZrBVAl
Content/%5.150.420.280.220.160.030.12Rem
Table 2. Deposition Parameters.
ProcessI [A]U [V]Vwfs [m·min−1]Vts [m·min−1]Cooling Time [s]Gas Flow [mL·min−1]
CMT14416.46.586025
CMT Pules13518.26.586025
CMT Pules Advanced9811.26.586025
Table 3. Burning loss of the elements under the three deposition processes (wt.%).
ProcessesElementsCuMnTiCdZrBVAl
CMTBurn out rate/%5.24.910.754.63.861.80Rem
CMT + P5.34.911.255.33.863.20Rem
CMT + P + A5.24.79.350.23.659.80Rem
Disclaimer/Publisher’s Note: The statements, opinions and data contained in all publications are solely those of the individual author(s) and contributor(s) and not of MDPI and/or the editor(s). MDPI and/or the editor(s) disclaim responsibility for any injury to people or property resulting from any ideas, methods, instructions or products referred to in the content.