Article

Analysis of Recrystallization Kinetics Concerning the Experimental, Computational, and Empirical Evaluation of Critical Temperatures for Static Recrystallization in Nb, Ti, and V Microalloyed Steels

by
Evelyn Sobotka
1,*,
Johannes Kreyca
2,
Robert Kahlenberg
3,4,
Aurélie Jacob
1,
Ernst Kozeschnik
4 and
Erwin Povoden-Karadeniz
1,4
1
Christian Doppler Laboratory of Interfaces and Precipitation Engineering, Institute of Materials Science and Technology, TU Wien, 1060 Vienna, Austria
2
Voestalpine Forschungsservicegesellschaft Donawitz GmbH, 8700 Leoben, Austria
3
Materials Center Leoben Forschung GmbH, 8700 Leoben, Austria
4
Institute of Materials Science and Technology, TU Wien, 1060 Vienna, Austria
*
Author to whom correspondence should be addressed.
Metals 2023, 13(5), 884; https://doi.org/10.3390/met13050884
Submission received: 11 April 2023 / Revised: 26 April 2023 / Accepted: 2 May 2023 / Published: 3 May 2023
(This article belongs to the Special Issue Physical Metallurgy of Microalloyed Steels)

Abstract

:
Recrystallization kinetics and two critical temperatures—the non-recrystallization temperature TNR and the static recrystallization critical temperature TSRCT—of five Nb, Ti, and V microalloyed steel grades are evaluated. The experimental examination is realized by employing isothermal double-hit compression tests and continuous hot torsion tests, both performed on a Gleeble® 3800 thermo-mechanical simulator. The experimental results are used for the critical assessment of predicted TNR using four empirical equations from the literature, and for the validation of simulated TNR and TSRCT. The thermokinetic computer simulations are realized using the mean-field microstructure modeling software MatCalc. Analysis shows that higher microalloying contents increase both critical temperatures, TNR and TSRCT, whereby the effect of recrystallization retardation of Nb is more pronounced than that of Ti or V. The most accurate reproduction of the experimental recrystallization behavior of the five examined steel grades is realized by the employed physics-based simulation approach.

1. Introduction

Hot rolling processes at elevated temperatures can induce coarse and non-uniform austenite grain structures, which impair the mechanical properties of the final steel product [1,2]. Additions of microalloying elements, e.g., titanium, niobium, and vanadium, to low-carbon steel help to prevent austenite grain coarsening due to pinning of grain boundaries by precipitates and solute drag [3,4,5]. During thermo-mechanical treatments, the deformation-affected nucleation of (Nb/Ti/V)(C,N) MX (M standing for metallic elements, and X for C,N) carbonitride precipitates retards static recrystallization of the austenite phase and helps to control the austenite grain size [6,7]. Therefore, the formation of these complex MX particles can suppress austenite grain recrystallization in microalloyed steels. For precise planning of industrial rolling schedules at reduced costs, predictive knowledge of the temperature at which the impediment of recrystallization takes place in different microalloyed steels is crucial. The literature on the recrystallization behavior of microalloyed steel is generally based on examinations by performing isothermal double-hit compression tests (DHT) and continuous hot torsion tests (TT) [8,9]. To date, it is in question whether one is superior to the other.
Within this work, the recrystallization kinetics of five microalloyed steel grades are examined experimentally and computationally. First, the differences and complexity of the two experimental methods, DHT and TT, for the assessment of the critical temperatures of the static recrystallization of microalloyed steel, are evaluated and discussed. These are the non-recrystallization temperature TNR, Section 1.1, and the static recrystallization critical temperature TSRCT, Section 1.2, respectively. Secondly, TNR and TSRCT values are simulated by employing the semi-physical recrystallization modeling by Buken et al. [10], which has been implemented into the mean-field microstructure modeling software MatCalc [11], http://matcalc.at (accessed on 10 April 2023). Aside from the dislocation density evolution, the thermokinetic simulation takes into account Calphad-modeled MX stabilities [12]. Thirdly, the predictive power of semi-physical simulation results on the recrystallization retardation of five experimentally studied microalloyed steel grades is compared to the purely phenomenological approach, by application of Equations (1)–(4), Section 1.1.3. The inaccuracies of these empirical equations from literature are identified and discussed.

1.1. Non-Recrystallization Temperature

The softening behavior of microalloyed steels at deformation up to ~0.5 critical strain is regulated by pure static recrystallization, whereas above it can be affected by metadynamic recrystallization. The value of the critical strain depends on microalloying, the strain rate, and temperature [13,14]. In the majority of microalloyed steels, dynamic recrystallization of the austenite matrix does not occur below an equivalent strain of 0.35, even at elevated temperatures [15].
The non-recrystallization temperature (TNR) is the temperature, below which complete static recrystallisation between consecutive rolling passes does no longer occur. TNR is determined for continuous cooling [16]. It is notable that TNR thus also depends on the inter-rolling pass time.

1.1.1. The Role of Process Parameters for TNR

The value of TNR is strongly dependent on process parameters during thermo-mechanical treatments. Significantly prolonged intermediate holding times between passes, increasing strain rates, higher strains, and lower cooling rates lead to a decrease in TNR [17,18,19]. The condition of the austenite matrix before the deformation also plays a vital role in the TNR, since increasing reheating temperatures elevate the non-recrystallization temperature due to higher austenite supersaturation concerning microalloying elements [20]. Deformation below TNR results in elongated austenite grains, where so-called ‘pancaking’ occurs due to accumulated strain, and more nucleation sites for grain boundary ferrite are provided [16,17]. At conventional controlled rolling, roughing passes are performed above TNR to ensure complete recrystallization of the austenite grains during the interpass time [21].

1.1.2. The Impact of Microalloying Elements on TNR

Extensive literature is available on the role of the alloying elements Nb, Ti, and V on the TNR [16,19,22,23]. Higher amounts of microalloying elements lead to an increase in the non-recrystallization temperature. Figure 1 shows the comparison of different microalloying and associated TNR. Additions of Nb increase the TNR more effectively than those of V and Ti [24,25]. Akben et al. [26] reported that both Nb carbonitrides and dissolved Nb in the steel matrix have a higher impact on recrystallization retardation than solute V. Abad et al. [20] differentiate between deformation at low and high pass-strains (φ) within their experiments using Nb-microalloyed steel. They show that at φ = 0.1, recrystallization is impeded by solute drag due to dissolved Nb, while strain-induced precipitation is the controlling factor at φ > 0.2.
(Nb/Ti/V)(C,N) precipitates possess the ability to elevate TNR, but increasing the interpass time causes coarsening of the carbonitrides [27]. At first, prolonged holding elevates the TNR, since pinning by deformation-induced carbonitrides increases. A prolongation of the interpass time above 50 s, on the other hand, reduces their power for recrystallization impediment [27] due to coarsening of the precipitates, which leads to a decrease in TNR. Besides the substantial effect of grain boundary pinning by deformation-induced particles, further physical mechanisms, such as solute drag of microalloying elements, affect TNR [17,20]. According to Bai et al. [17], solute drag dominates at short interpass times below 12 s within their research on microalloyed steel.

1.1.3. Empirical Equations for TNR

An empirical relation between the increase in TNR, induced by the microalloying elements Nb, Ti, and V, was given for low-carbon steels by Boratto et al. [28] with
T NR = 887 + 464 C + 890 Ti + ( 6445 Nb 644 Nb ) + ( 732 V 230 V ) + 363 A l 357 S i ,
where the chemical composition is to be entered in wt.% [29].
Unfortunately, the content of nitrogen, which is essential for the formation of (Nb/Ti/V)(C,N) precipitates, is not taken into account.
Homsher [25,27] presented an equation for TNR developed by Bai et al. [30]:
T NR = 174 log [ Nb · ( C + 12 14 N ) ] + 1444 .
The variables Nb and C represent the element content of the steel grade in wt.%. N describes the amount of remaining free nitrogen after the precipitation of TiN. Therefore, the equation directly takes the effect of Nb into account and indirectly includes the impact of Ti on recrystallization via the N content.
Fletcher [31] investigated the TNR values of several different steel grades, which delivered the following equation [25,27]:
T N R = 849 349 C + 676 Nb + 337 V .  
Here, the microalloying elements Nb and V are accounted for in wt.%. Titanium is not mentioned.
Another equation discussed by Homsher [25,27] for the prediction of TNR by Fletcher [31] is given as:
T NR = 203 310 C 149 V + 657 Nb + 683 e 0.36 · φ .  
The content of Nb and V is given in wt.%, while φ describes the applied pass strain.

1.2. Static Recrystallization Critical Temperature

In microalloyed steel, the maximum temperature, at which the static austenite recrystallization starts to be impeded solely by the strain-induced precipitation of MX carbonitride precipitates, is defined as the static recrystallisation critical temperature (TSRCT). It is always determined by isothermal conditions and does not involve a dependence of inter-rolling pass time. Below TSRCT, no complete recrystallization of the austenite phase can thus be realized, independently of intermediate holding times during processing [18].
Figure 2 depicts the correlation between the amount of microalloying and the TSRCT, as well as the applied strain, found in the literature by Medina et al. [19,23,32,33,34,35]. Higher microalloying contents of the elements Nb, Ti, and V and lower true strain values increase the TSRCT. Nb has the biggest effect on recrystallization retardation, followed by V and Ti.

1.3. Comparison of TNR and TSRCT

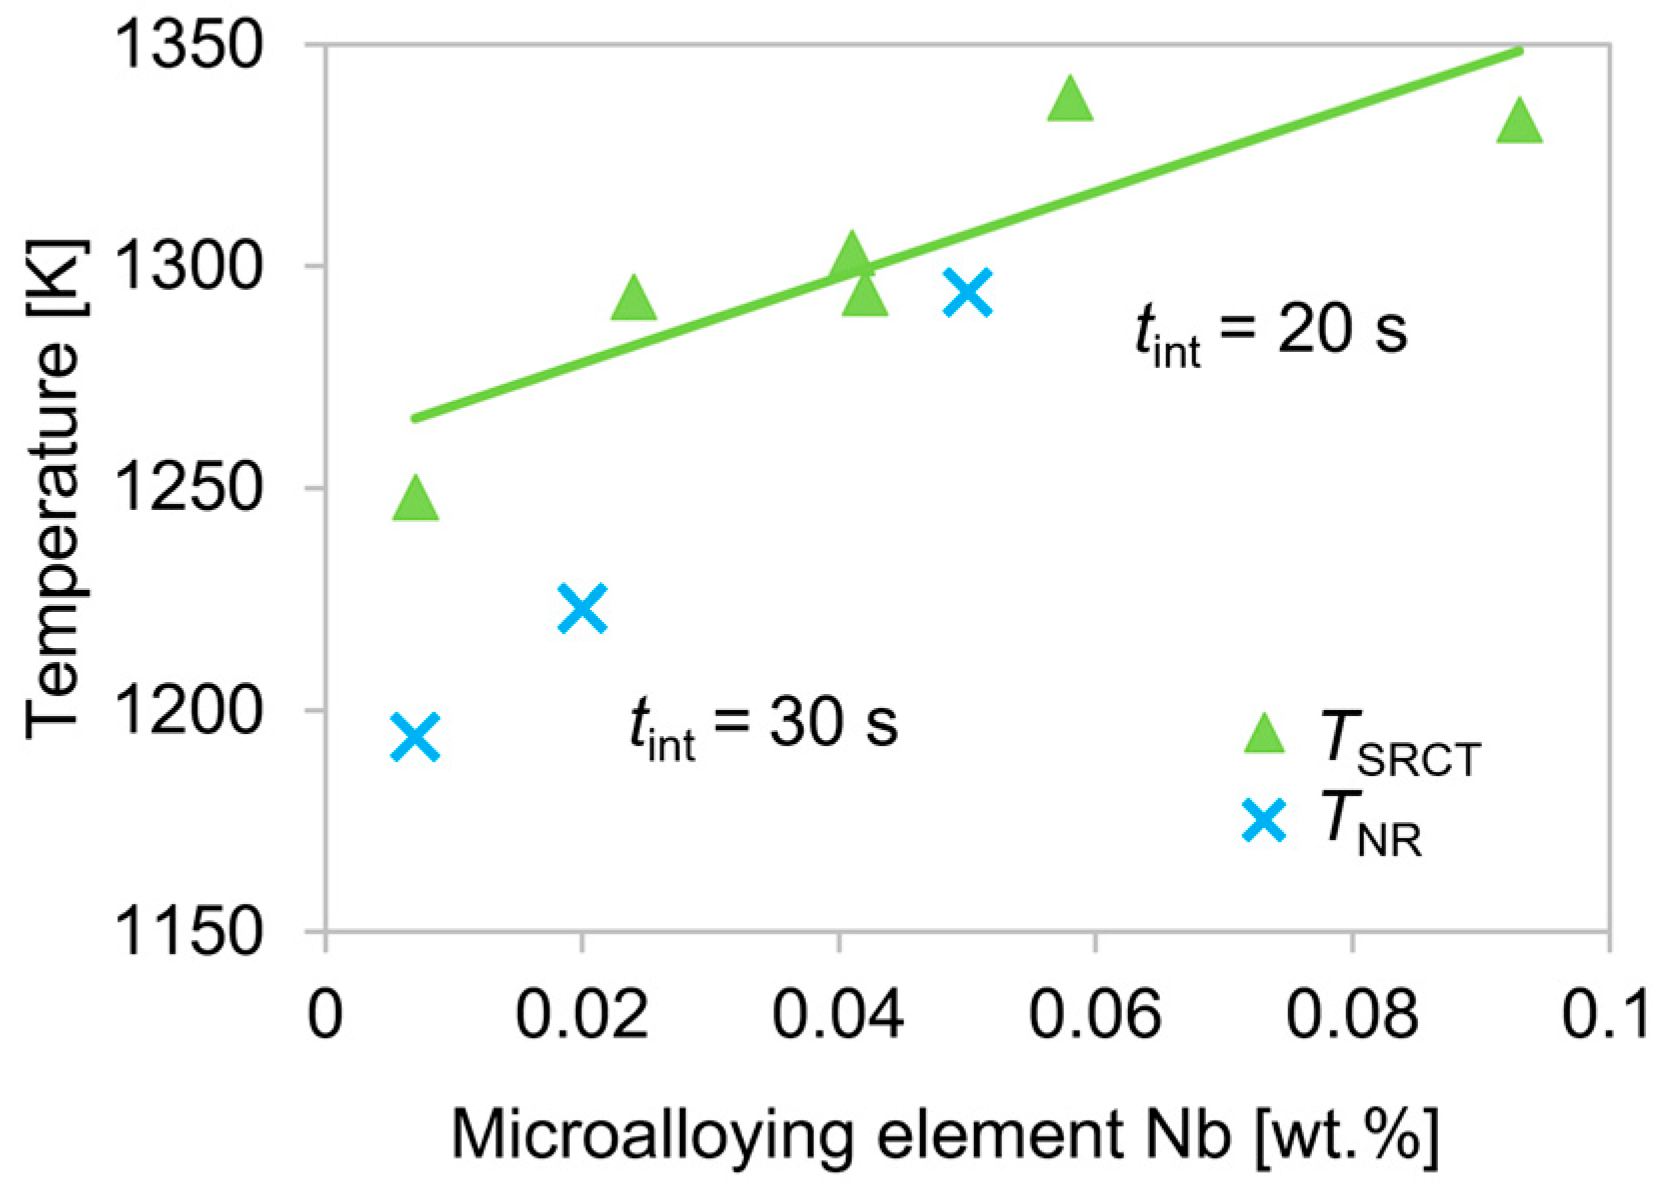
Figure 3 displays experimental TNR and TSRCT values of Nb microalloyed steels from the literature [16,19,22,33,34,35]. It shows that the non-recrystallization temperature reaches lower values compared to the TSRCT at longer interpass times, independently of microalloying.
Both critical temperatures indicate the start of recrystallization impediment but may deviate from each other as the TSRCT only considers the recrystallization-retarding effect of precipitated carbonitrides, while the TNR marks the temperature at which total static recrystallization does not occur.

2. Materials and Methods

Five different microalloyed steel grades are examined within the framework of this study. The chemical composition of the investigated alloys is given in Table 1.
The microalloyed steel grade S1 contains considerable amounts of Nb, Ti, and V, but much more Cr than all other alloys. The steel grade S2 serves as reference material since it only contains low additions of Ti, Nb, and V. S3–S5 are typical microalloyed steel grades with varying contents of Nb, Ti, and V. S5 combines the effects of all three microalloying elements, while S3 and S4 just contain higher amounts of V or Nb, respectively.

2.1. Experiments

2.1.1. Double-Hit Compression Tests (DHT)

DHT are a very successful method for the determination of recrystallization kinetics in the austenite region of steels [19,23,32,33,34,35]. In fact, the softening fraction due to recrystallization is measured by this kind of experiment. By the examination of the softening fraction (all phase fractions in the present study are given in mol.%) of austenite at different temperatures and varying holding times before the second deformation, the TNR and TSRCT can be determined.
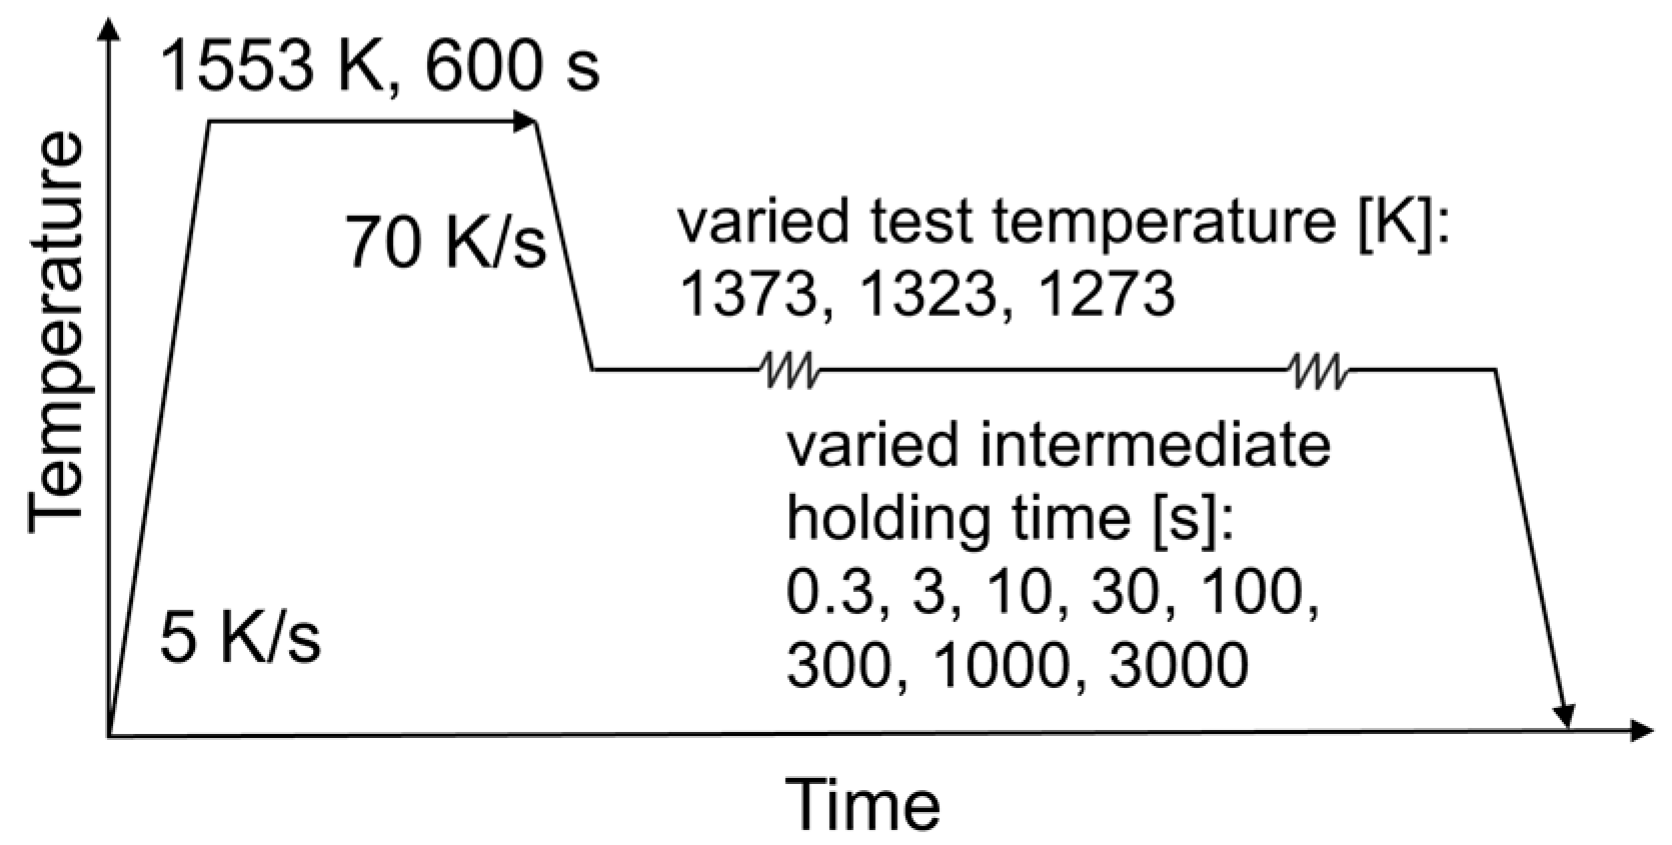
Double-hit tests are performed on a Gleeble® 3800 thermo-mechanical simulator. To ensure the comparability between the experimental test results from DHT and torsion tests, the same steel grade, S5, is investigated with both methods. On the cylindrical samples with 10 mm diameter and 15 mm length, an R-type thermocouple is welded onto the surface for temperature control during resistive heating. A layer of Mo, nickel paste, and graphite is placed between specimen and anvil to decrease the temperature gradient to < 10 K. Figure 4 depicts the schematic rolling pattern of the performed tests. The individual specimens are solution annealed at 1553 K for 600 s. Previous MatCalc equilibrium calculations by the authors [36] showed that the annealing temperature of 1553 K is above the solubility limit of MX carbonitride solid solutions, while the test temperatures (1373–1273 K) are low enough for their precipitation. After cooling down to the respective test temperature, the samples are held for 20 s and subsequently deformed to φ = 0.2 with 0.5 s−1. The low strain of 0.2 is chosen to exclude dynamic recrystallization during the treatment. The first compression is followed by an intermediate holding time of 0.3–3000 s before the start of the second deformation with a strain rate of again 0.5 s−1 to φ = 0.4 in total.
For the evaluation of the softening fraction, the 5% true strain method [37] is applied. Using this technique, the fraction of the recrystallized material can be identified when no significant recovery contributions are expected [38], and the softening fraction of the material is here calculated by the following equation: [37]
X a = σ m ( 5 % ) σ 2 ( 5 % ) σ m ( 5 % ) σ 1 ( 5 % ) ,  
where σm(5%) is the true stress in the zero-softening curve at 5% strain. The zero softening curve describes the deformation and, therefore, the evolution of the true stress up to the maximum true strain of 0.4, without an intermediate holding time or an interruption for a second hit, while the parameters σ1(5%) and σ2(5%) describe the flow stresses at 5% strain for the first and the second deformation, respectively. Since the holding between the deformation hits initiates recrystallization of the material, the second flow curve would be identical to the first one after a sufficiently long intermediate holding due to complete recrystallization [21]. In the work of Homsher [25], the accurate identification of the different stress values is illustrated and discussed in detail.
For the evaluation of the TNR from DHT, the fractional softening of the material is plotted as a function of the different deformation temperatures [39]. The corresponding value of TNR is determined at 20% fractional softening, since earlier studies showed that below 20 percent, softening is caused by static recovery, whereas, above this limit, it is evoked by static recrystallization [25,27,39].
By plotting the fractional softening as a function of time, the TSRCT can be evaluated. At the TSRCT, as well as below this temperature, the slope of Xa against time decreases [19]. A plateau is formed at lower temperatures, which indicates the deformation-induced precipitation of MX particles [25] and the retardation of recrystallization. Above the TSRCT, no impediment of recrystallization due to precipitation of (Nb/Ti/V)(C,N) takes place.

2.1.2. Hot Torsion Tests (TT)

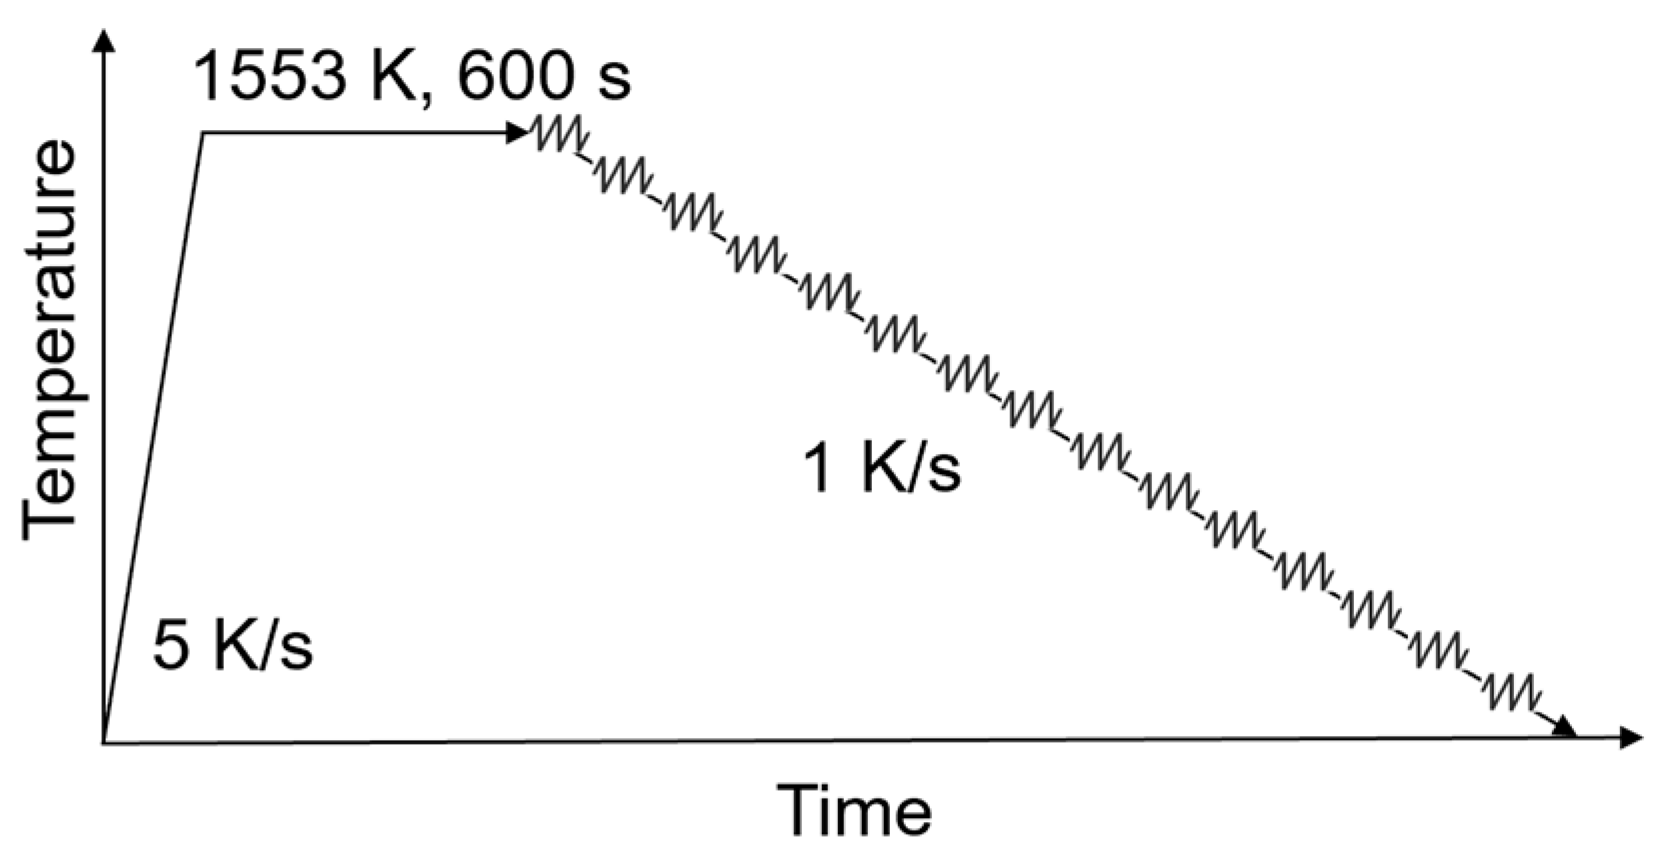
Hot torsion tests with continuous cooling are performed on all five steel grades using the hot torsion mobile conversion unit of the Gleeble® 3800 thermo-mechanical simulator. The experimental setup is similar to the one of the DHT but torsion tests demand for a more complex sample shape with 165 mm length, a diameter of 10 mm at the center, and a diameter of 14 mm at the borders. The specimens for the experiments are solution annealed at 1553 K for 600 s, followed by constant cooling from 1553 K with 1 K/s. During cooling, the samples undergo deformation consisting of 15 passes with 0.3 equivalent strain and a strain rate of 2 s−1. The strain of 0.3 is not sufficient to produce dynamic recrystallization; therefore, the examination of static recrystallization can be focused on. The interpass time between the individual torsional loads is 30 s. The schematic rolling pattern for the torsion tests is illustrated in Figure 5.
The experimentally obtained values of torque Τ and twist θ provide the basis for the calculation of the effective stress σeff and strain φeff according to the von Mises criterion, adapted from Maccagno and Medina et al. [15,29]:
σ eff = Τ · 3.3 3 2 π R ³ ,
φ eff = θ R 3 L ,
where the value of 3.3 accounts for strain rate sensitivity as well as strain hardening of the examined microalloyed steels [40], R is the radius, and L represents the length of the individual sample. The mean flow stress (MFS) corresponds to the area under each stress–strain (σφ) curve of the separate passes, normalized by the applied strain, and can be calculated by the following equation: [17,29]
M F S = 1 φ b φ a φ a φ b σ eq d φ eq .  
By use of the MFS plotted against the inverse absolute temperature during the deformation, TNR is identified by a change in the slope of the curve [17,41].
For the examination of the TSRCT from torsion tests, isothermal torsion experiments at varied temperatures with the same strain and strain rate are necessary. The TSRCT can then be evaluated from the plot of fractional softening against time and it is, therefore, independent of the interpass time [18,19].

3. Modeling

3.1. Substructure and Recrystallization Model

The MatCalc simulations in the present work utilize the modeling framework for static recrystallization implemented by Buken et al. [10], which incorporates the combined influence of nucleation, growth and coarsening of recrystallized grains based on the dislocation density evolution and precipitation kinetics [42]. The relevant equations, as implemented in MatCalc (version 6.04.0087), are summarized in the subsequent sections.

3.1.1. Dislocation Density Evolution

The substructure is described with an extended one-parameter dislocation density evolution model based on the work of Kocks and Mecking [43]. The three terms control the generation of dislocations (A), dynamic recovery (B), and static recovery (C) [36]:
ρ φ = M b A ρ 2 B M d crit b ρ 2 C D eff G b 3 φ ˙ k T ( ρ 2 ρ eq 2 ) ,  
where ρ describes the total dislocation density, ρeq the dislocation density of a well-annealed microstructure, φ the true strain, M the Taylor factor, b the Burgers vector, dcrit the critical annihilation distance between two dislocations [10], Deff the effective diffusion coefficient, G the shear modulus, φ ˙ the strain rate, k the Boltzmann constant, and T the temperature. The effective diffusion coefficient used in this work accounts for pipe diffusion due to dislocations DDis, according to the work by Stechauner and Kozeschnik [44].
The parameter ρeq is obtained from the sum of the equilibrium value for internal dislocations ρeq,int and the Read–Shockley dislocation density required to uphold the given subgrain structure ρRS [10,45]:
ρ eq = ρ eq , int + ρ RS .  
The effect of precipitates on dislocation generation is not taken into account.

3.1.2. Grain Boundary Pinning and Solute Drag

Carbonitride precipitates as well as alloying elements in solid solution both hinder grain boundary movement via Zener pinning [46] and solute drag [47], respectively. The implementation in MatCalc treats both effects within the mobility calculations. The effective mobility Meff for simultaneous precipitation and solute drag is combined in the same way for high angle grain boundaries (HAGBs) and low angle grain boundaries (LAGBs): [48]
1 M eff = 1 M prec + 1 M sol .  
In a system with precipitates, the intrinsic grain boundary mobility is reduced to Mprec, depending on the driving pressure for grain boundary movement and the Zener pressure [48]. The mobility term Msol accounts for the solute drag of elements according to Cahn’s model [47].

3.1.3. Nucleation of Recrystallized Grains

According to the theory developed by Bailey and Hirsch [49], subgrains that are in contact with high angle grain boundaries may evolve into recrystallized grains, provided that the subgrain diameter δ exceeds a critical value δcrit, which is calculated as [10]:
δ crit = 4   ·   γ HAGB P D , RX = 4   ·   γ HAGB 0.5 G b ² ( ρ tot ρ eq , int ) ,  
where γHAGB is the high angle grain boundary energy and PD,RX is the driving pressure for recrystallization. The nucleation rate of new grains N ˙   depends on the number density of potential nucleation sites Npot, the flow of subgrains reaching the critical size F ˙ (as determined by the time evolution of the subgrain distribution) and the saturation function B, which accounts for the fraction of HAGBs occupied by recrystallized nuclei. Thus, the consumption of nucleation sites is
N ˙ = N pot · F ˙ · B .
A more detailed summary of the calculation procedure for the nucleation rate can be found in [10].

3.2. Simulation Setup

Both the TNR and the TSRCT are affected by the intricate interplay between the deformation impact, MX carbonitride precipitation, and recrystallization behavior of the austenite matrix. MatCalc simulations of the thermo-mechanical treatments are performed to describe the deformation-dependent dislocation density evolution, the precipitation kinetics, and the progress of recrystallization. The models (see Section 3.1) are finally calibrated with the experimentally determined softening fractions, the TSRCT, and the TNR of the examined steel grades.
In Table 2, the input variables used for the dislocation density evolution as well as the recrystallization and coarsening of the five microalloyed steel grades are summarized.
Note that, in the precipitation and recrystallization simulation setup, instead of considering the full mixing/demixing of solute atoms Ti, Nb, and V with C and N, the mixing between the substitutional microalloying atoms is assumed to be negligible. This goes along with microanalysis of MX particles, which shows clear separation between Ti-rich, Nb-rich, and V-rich types in comparable steel grades [52,53,54]. Three separate MX compounds, Nb(C,N), Ti(C,N), and V(C,N), are used, accordingly, which was for the benefit of the numerical stability during the thermokinetic simulations.
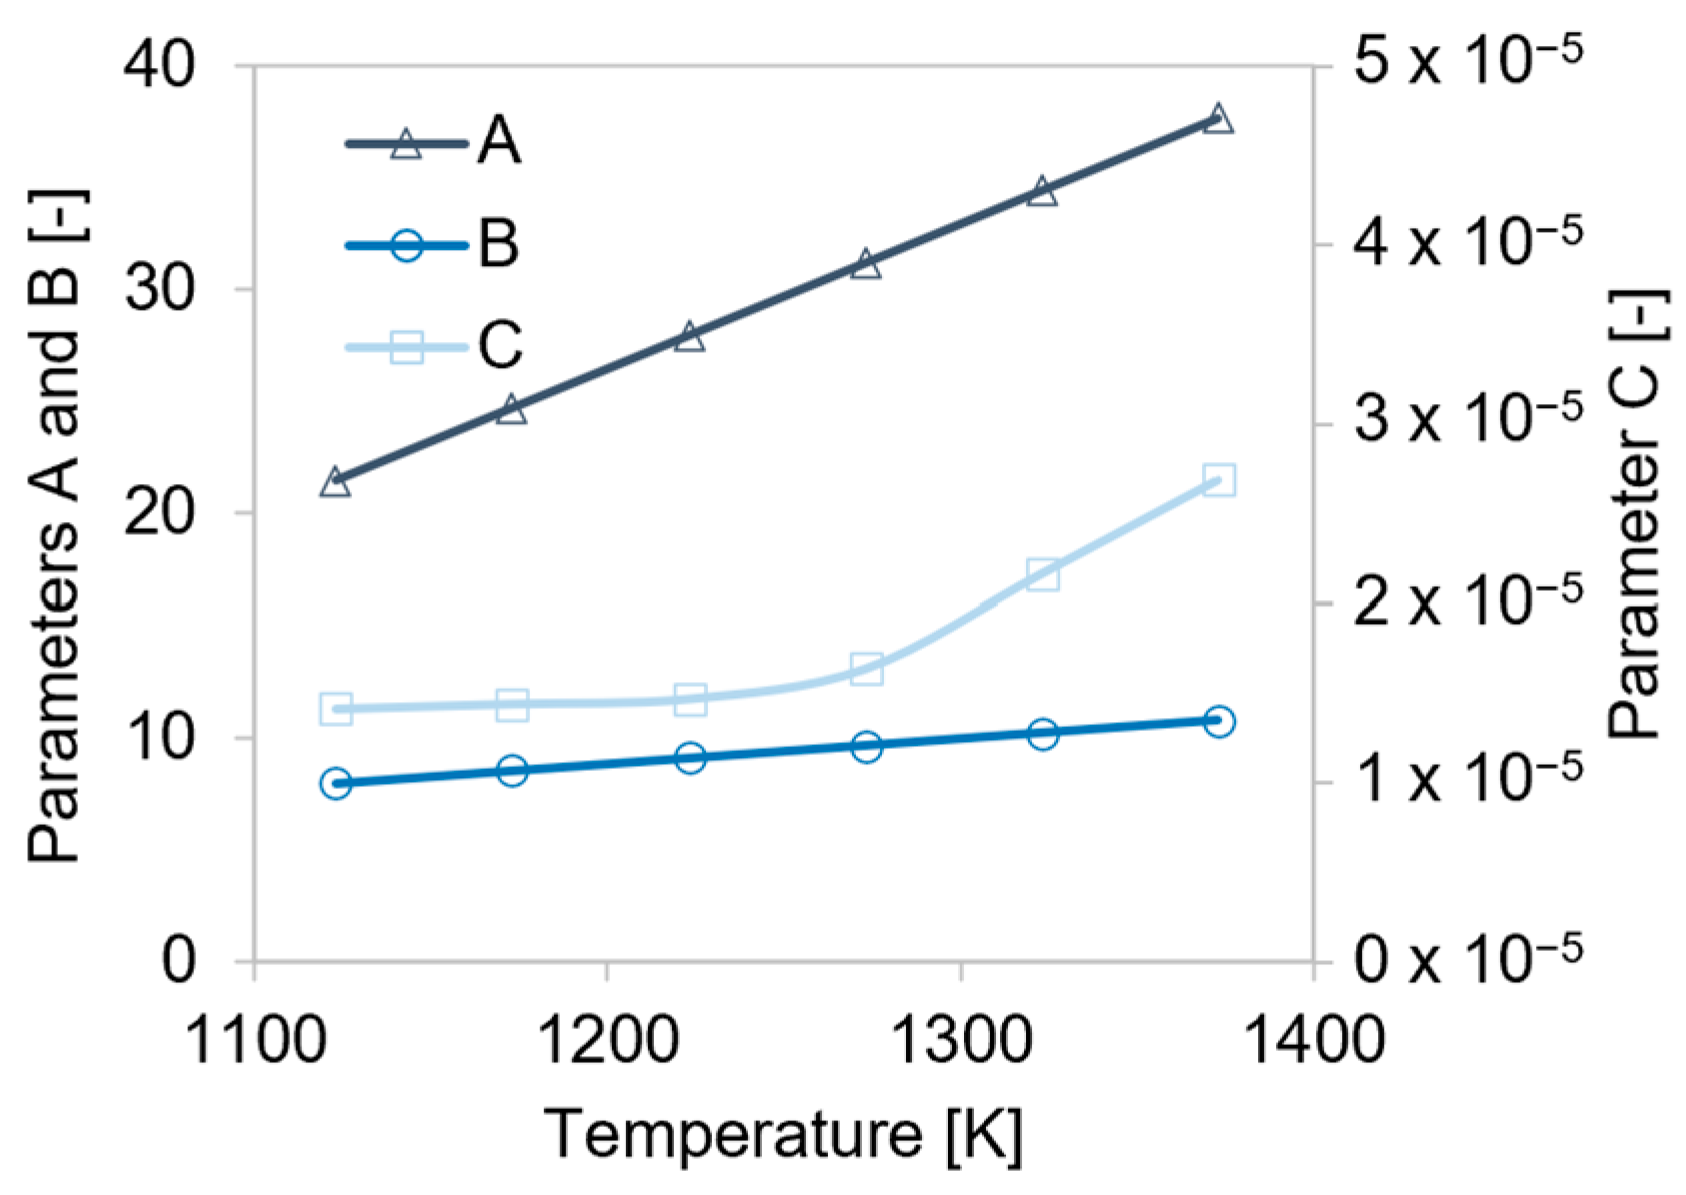
Previous research by the authors [36] revealed that the dislocation density evolution (Equation (9)) for microalloyed steel can be reasonably well approximated by using the temperature- and strain rate-dependent parameters A, B, and C, depicted in Figure 6.

4. Results and Discussion

4.1. Experiments

Our research has shown that torsion tests are less time-consuming, given that only one specimen and a single thermo-mechanical treatment is needed for the evaluation of the TNR for a specific material. At double-hit tests, a high number of experiments and extensive data analysis are necessary to examine the recrystallization behavior at different temperatures and varying holding times for the assessment of a corresponding TNR and TSRCT. When comparing the information about the recrystallization behavior received by the two different experimental methods, DHT are somewhat superior as the entire recrystallization evolution between two deformations is represented and both critical temperatures can be evaluated.

4.1.1. Double-Hit Compression Tests

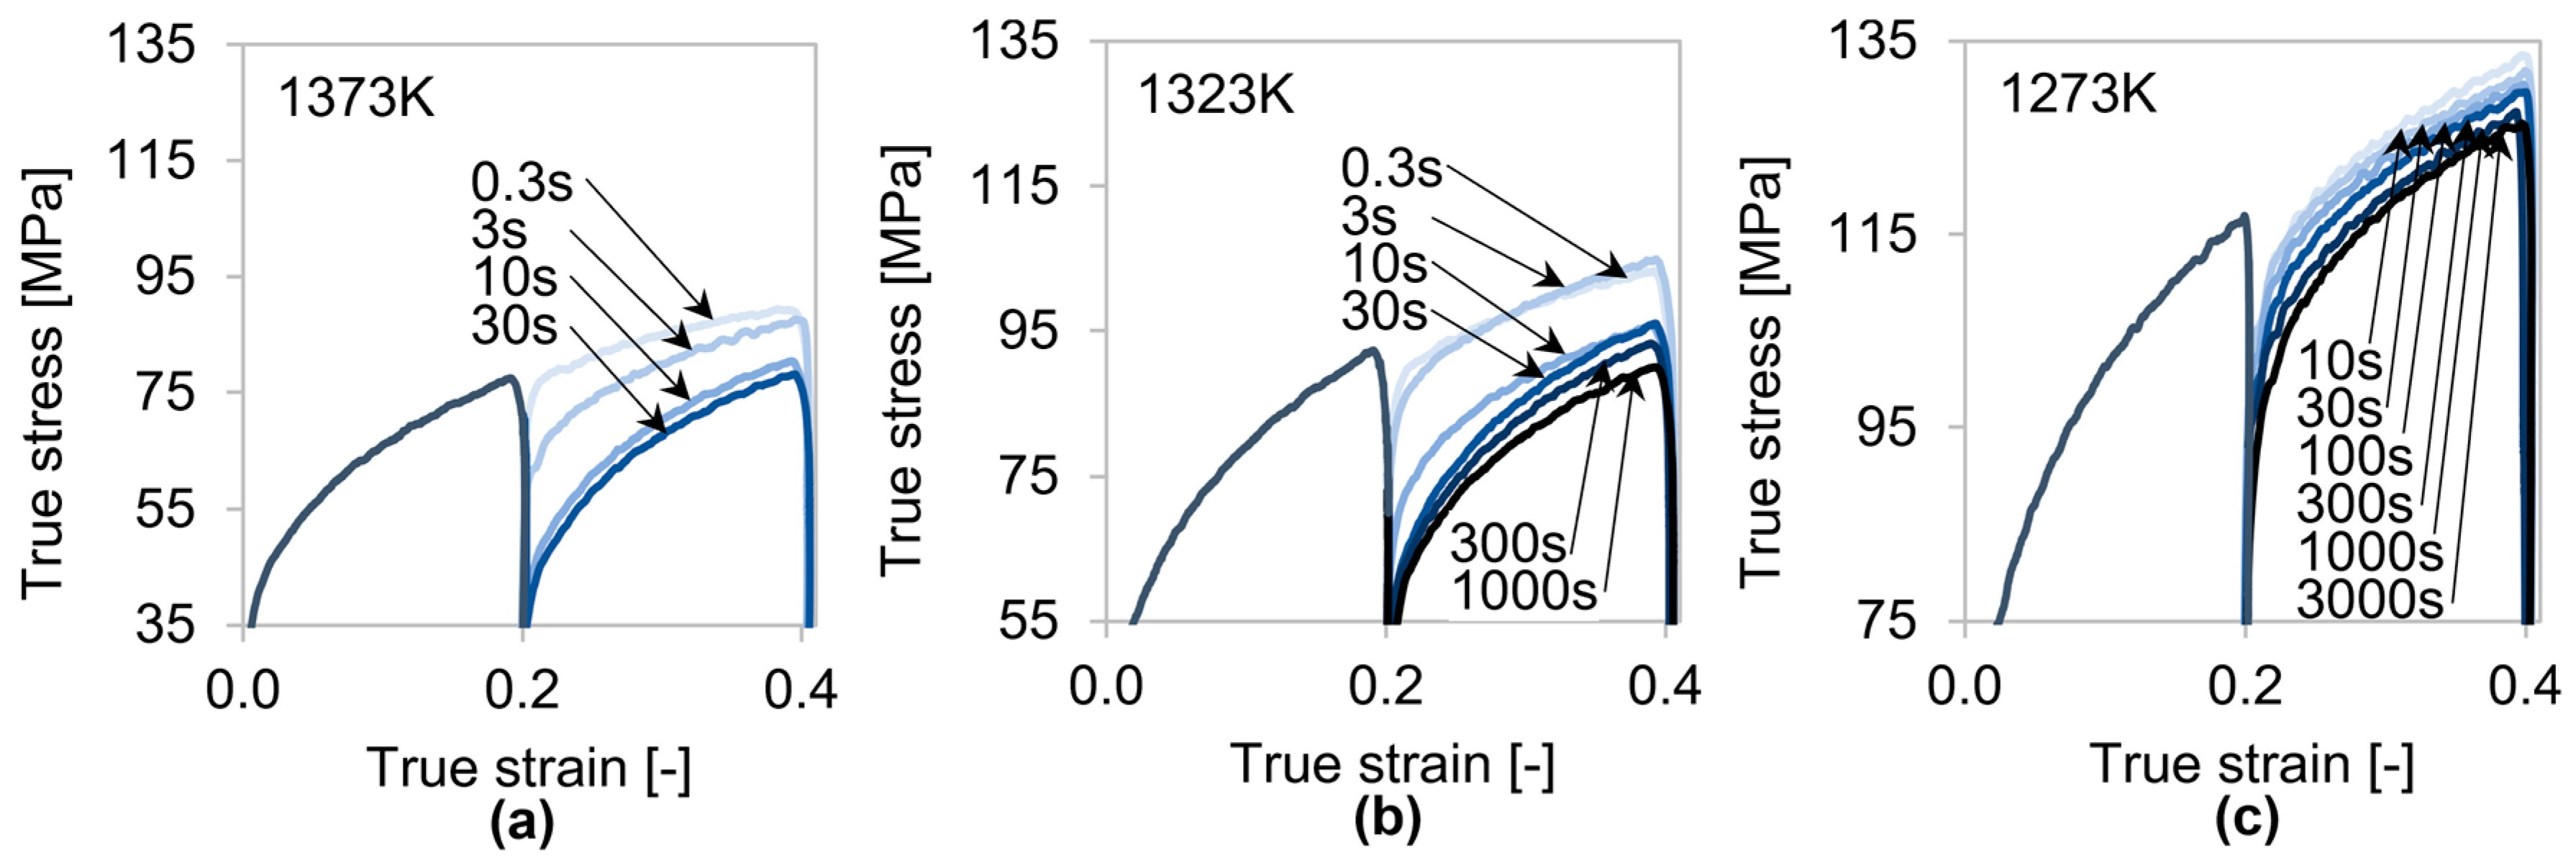
Figure 7 depicts the flow curves of alloy S5 from DHT at three different test temperatures and varying holding times before the second deformation. The critical strain, which divides stress–strain curves in static and metadynamic recrystallization is not reached yet, as it is strongly related to the unattained maximum stress of the curve [14]. Therefore, pure static recrystallization is observed.
At higher temperatures, lower true stress values are generally attained. A reduction in the intermediate holding time between the two hits increases the yield stress of the second hit. Since shorter holding times after the first hit induce static recrystallization, work hardening becomes more pronounced at the second deformation. Additionally, the grain refinement due to the recrystallization is concomitant with the formation of new grain boundaries, which impede the deformation of the material and result in higher stress peaks at the second hit.
The softening fraction is derived by applying the 5% true strain method on the experimentally determined flow curves, Figure 8a. The non-recrystallization temperature for DHT with a 30 s interpass time is determined at 1274 K. An increase in the intermediate holding time shifts the TNR to lower temperatures.
In Figure 8b, the influence of the test temperature on the softening of alloy S5 is illustrated. As a result of higher grain boundary mobilities at elevated temperatures, the softening fraction increases. At 1373 K, the material is fully recrystallized after approximately 100 s and the sigmoidal graph equals those of steels without microalloying. Retardation of recrystallization due to the strain-induced formation of MX can be observed at temperatures ≤ 1323 K. As a consequence, the TSRCT of alloy S5 is defined as 1323 K, the temperature, where the formation of (Nb/Ti/V)(C,N) precipitates starts. Thus, recrystallization is impeded, and the slope of the softening fraction against time is decreased. This effect becomes stronger at the lower deformation temperature of 1273 K, indicative from Figure 8b.

4.1.2. Hot Torsion Tests

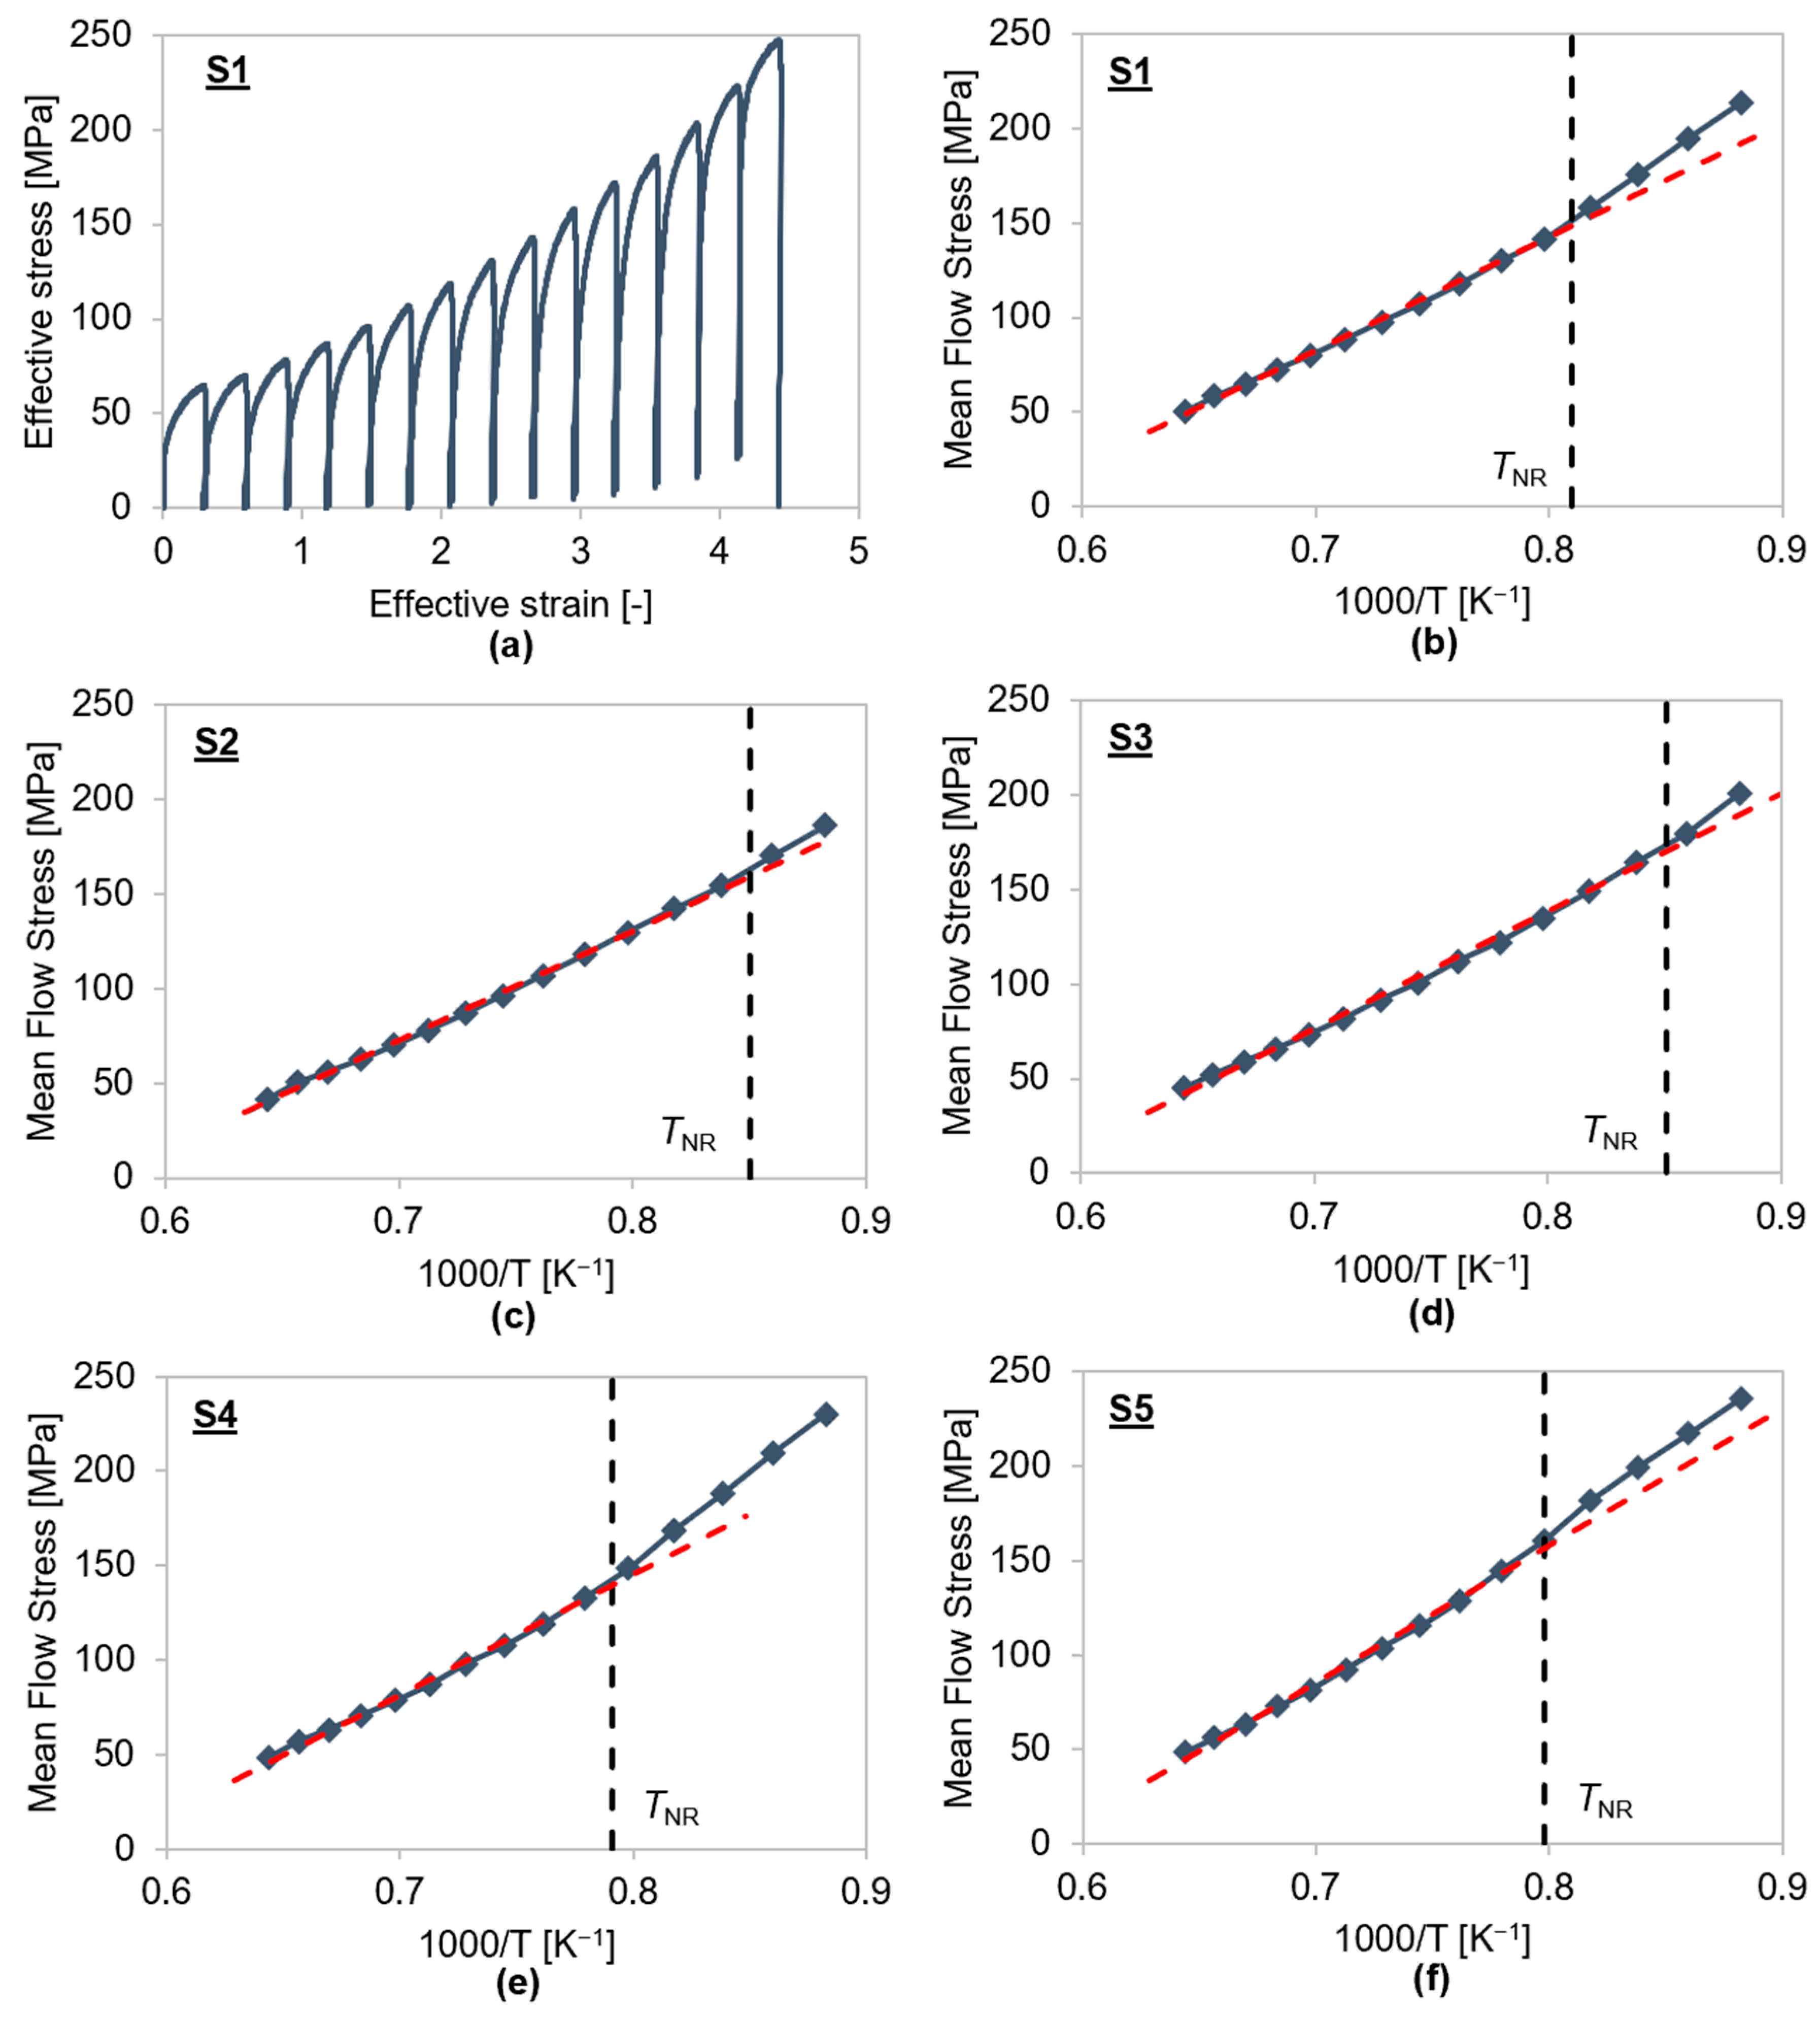
The resulting stress–strain curve of alloy S1 during the continuous torsion experiment clearly shows that the effective stress rises at a higher effective strain and decreasing temperature (Figure 9a). Figure 9b–f display the derived mean flow stresses as a function of the inverse temperatures for all materials. The TNR values are identified by the intersection point of a vertical auxiliary line—which indicates the onset of the slope change in the flow curve—with the x-axis [41]. The experimental TNR of alloy S2 is determined at 1156 K, representing the lowest value of all studied materials. This is in line with the fact that S2 contains the lowest amount of microalloying elements. The higher non-recrystallization temperatures of the other alloys can be explained by the deformation-induced precipitation of Ti-, Nb-, and V-carbonitrides, which impede the recrystallization. When comparing S3 and S4, it is evident that the high Nb content in S4 leads to strongly retarded recrystallization, whereas alloy S3, with high V contents and smaller amounts of Nb, exhibits lower TNR values. The recrystallization impediment due to V(C,N) is less pronounced compared to Ti- or Nb-carbonitrides.
The slope change in the mean flow stress curves in Figure 9 allows the graph to be divided into two zones. The first region refers to the deformation at elevated temperatures and the MFS increases as the temperature drops. In this zone, complete recrystallization of the austenite phase takes place between each pass and recrystallization-controlled rolling is achieved. Since the microstructure fully recrystallizes, no work hardening caused by dislocations remains in the final microstructure. The stress increase is solely induced by the increasing yield strength at lower temperatures. The second region is defined as deformation below TNR, where hardly any recrystallization occurs between the passes and the stress increases due to the accumulation of dislocations in the austenite phase from pass to pass. Figure 9 also shows that, with increasing MFS, the tendency for strain hardening also increases.

4.2. Simulation

Isothermal single-hit compression tests on the basis of the temperature profiles given in the schematic schedule of Figure 4 with a strain rate of 0.5 s−1 up to a total strain of 0.2 are simulated for all five investigated steel grades. Subsequently, prolonged holding at the respective test temperature is added to examine the time-dependent evolution of austenite recrystallization after the single-hit deformation.
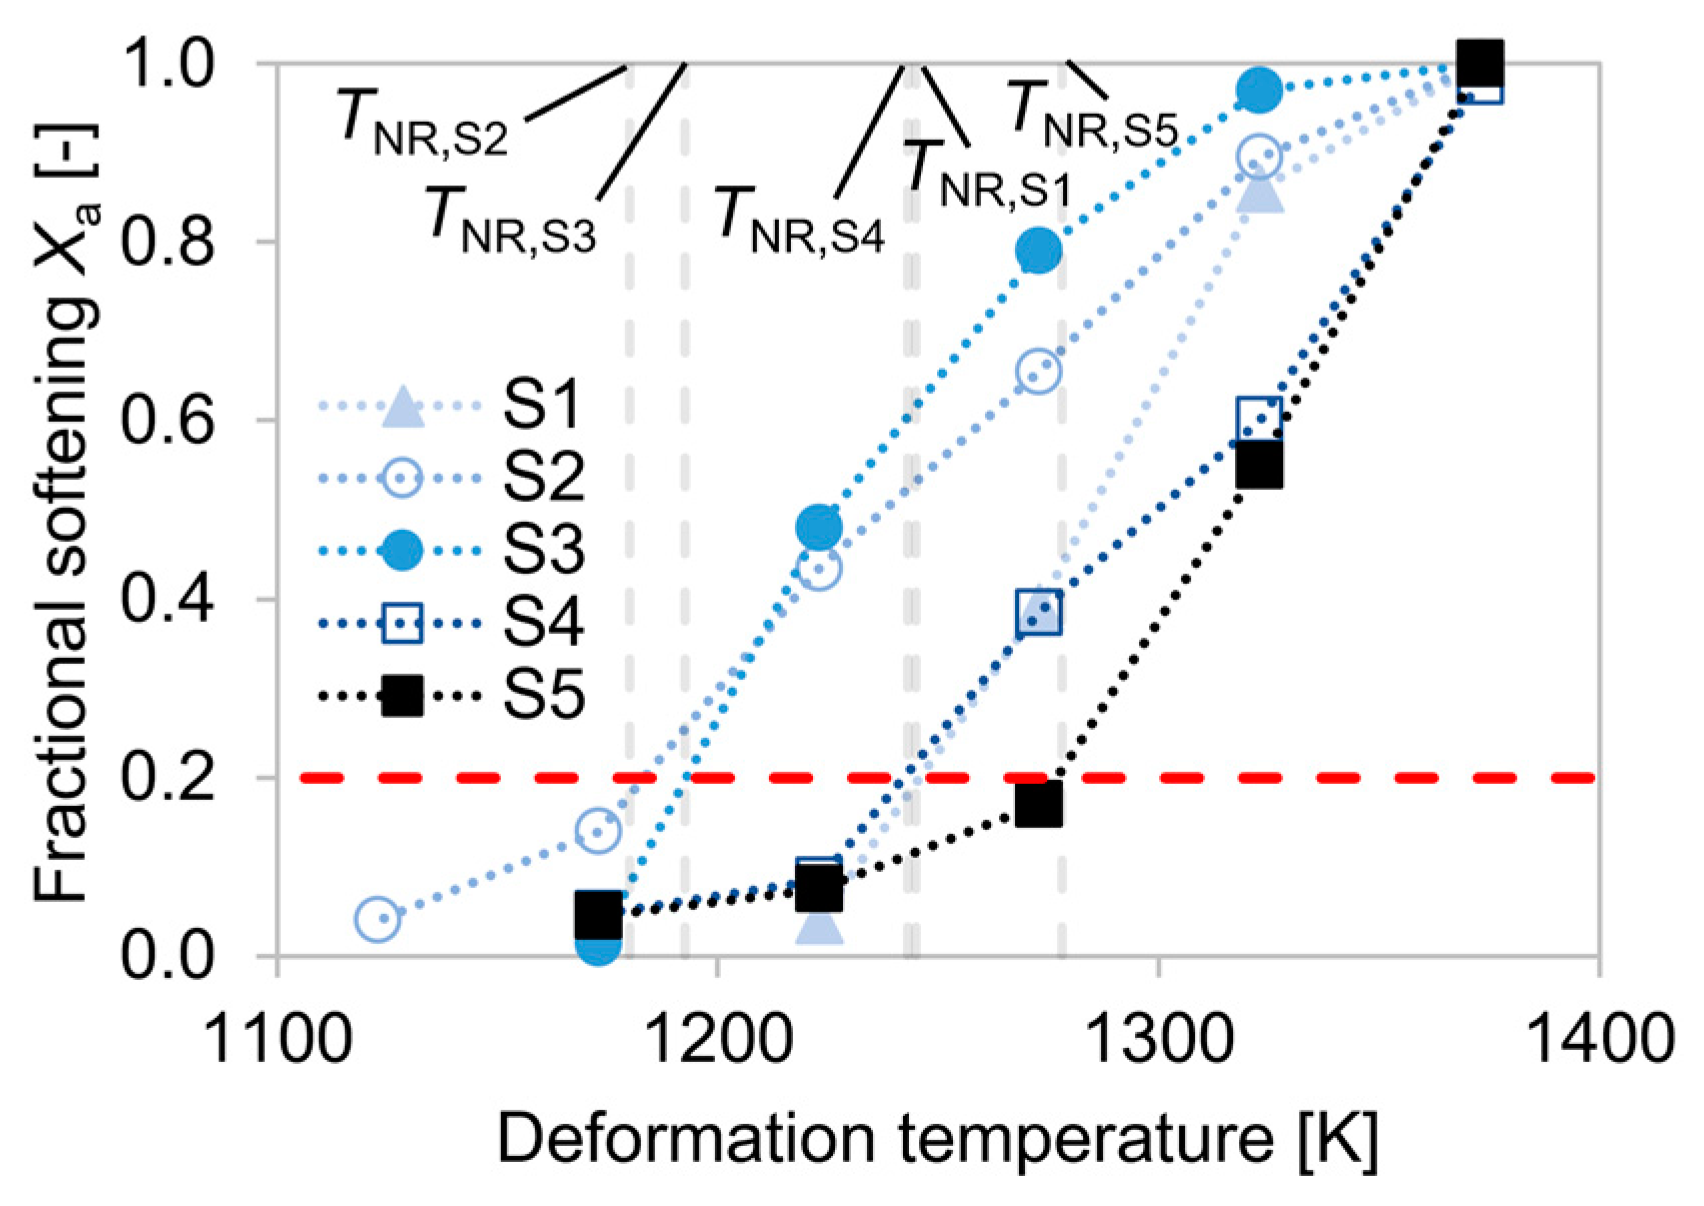
Figure 10 illustrates the simulated softening fraction of the five alloys plotted against the deformation temperatures. TNR of the examined materials is determined by the intersection point of the corresponding curve and the auxiliary line for 20% fractional softening.
The lowest value of TNR is determined for the reference alloy S2, which contains negligible amounts of microalloying elements. The non-recrystallization temperatures of the other steel grades rise in the sequence S3 (highest V and high Ti), S4 (high Ti and Nb), S1 (highest Ti and Cr; high Nb, V), and S5 (highest Nb, V; high Ti).
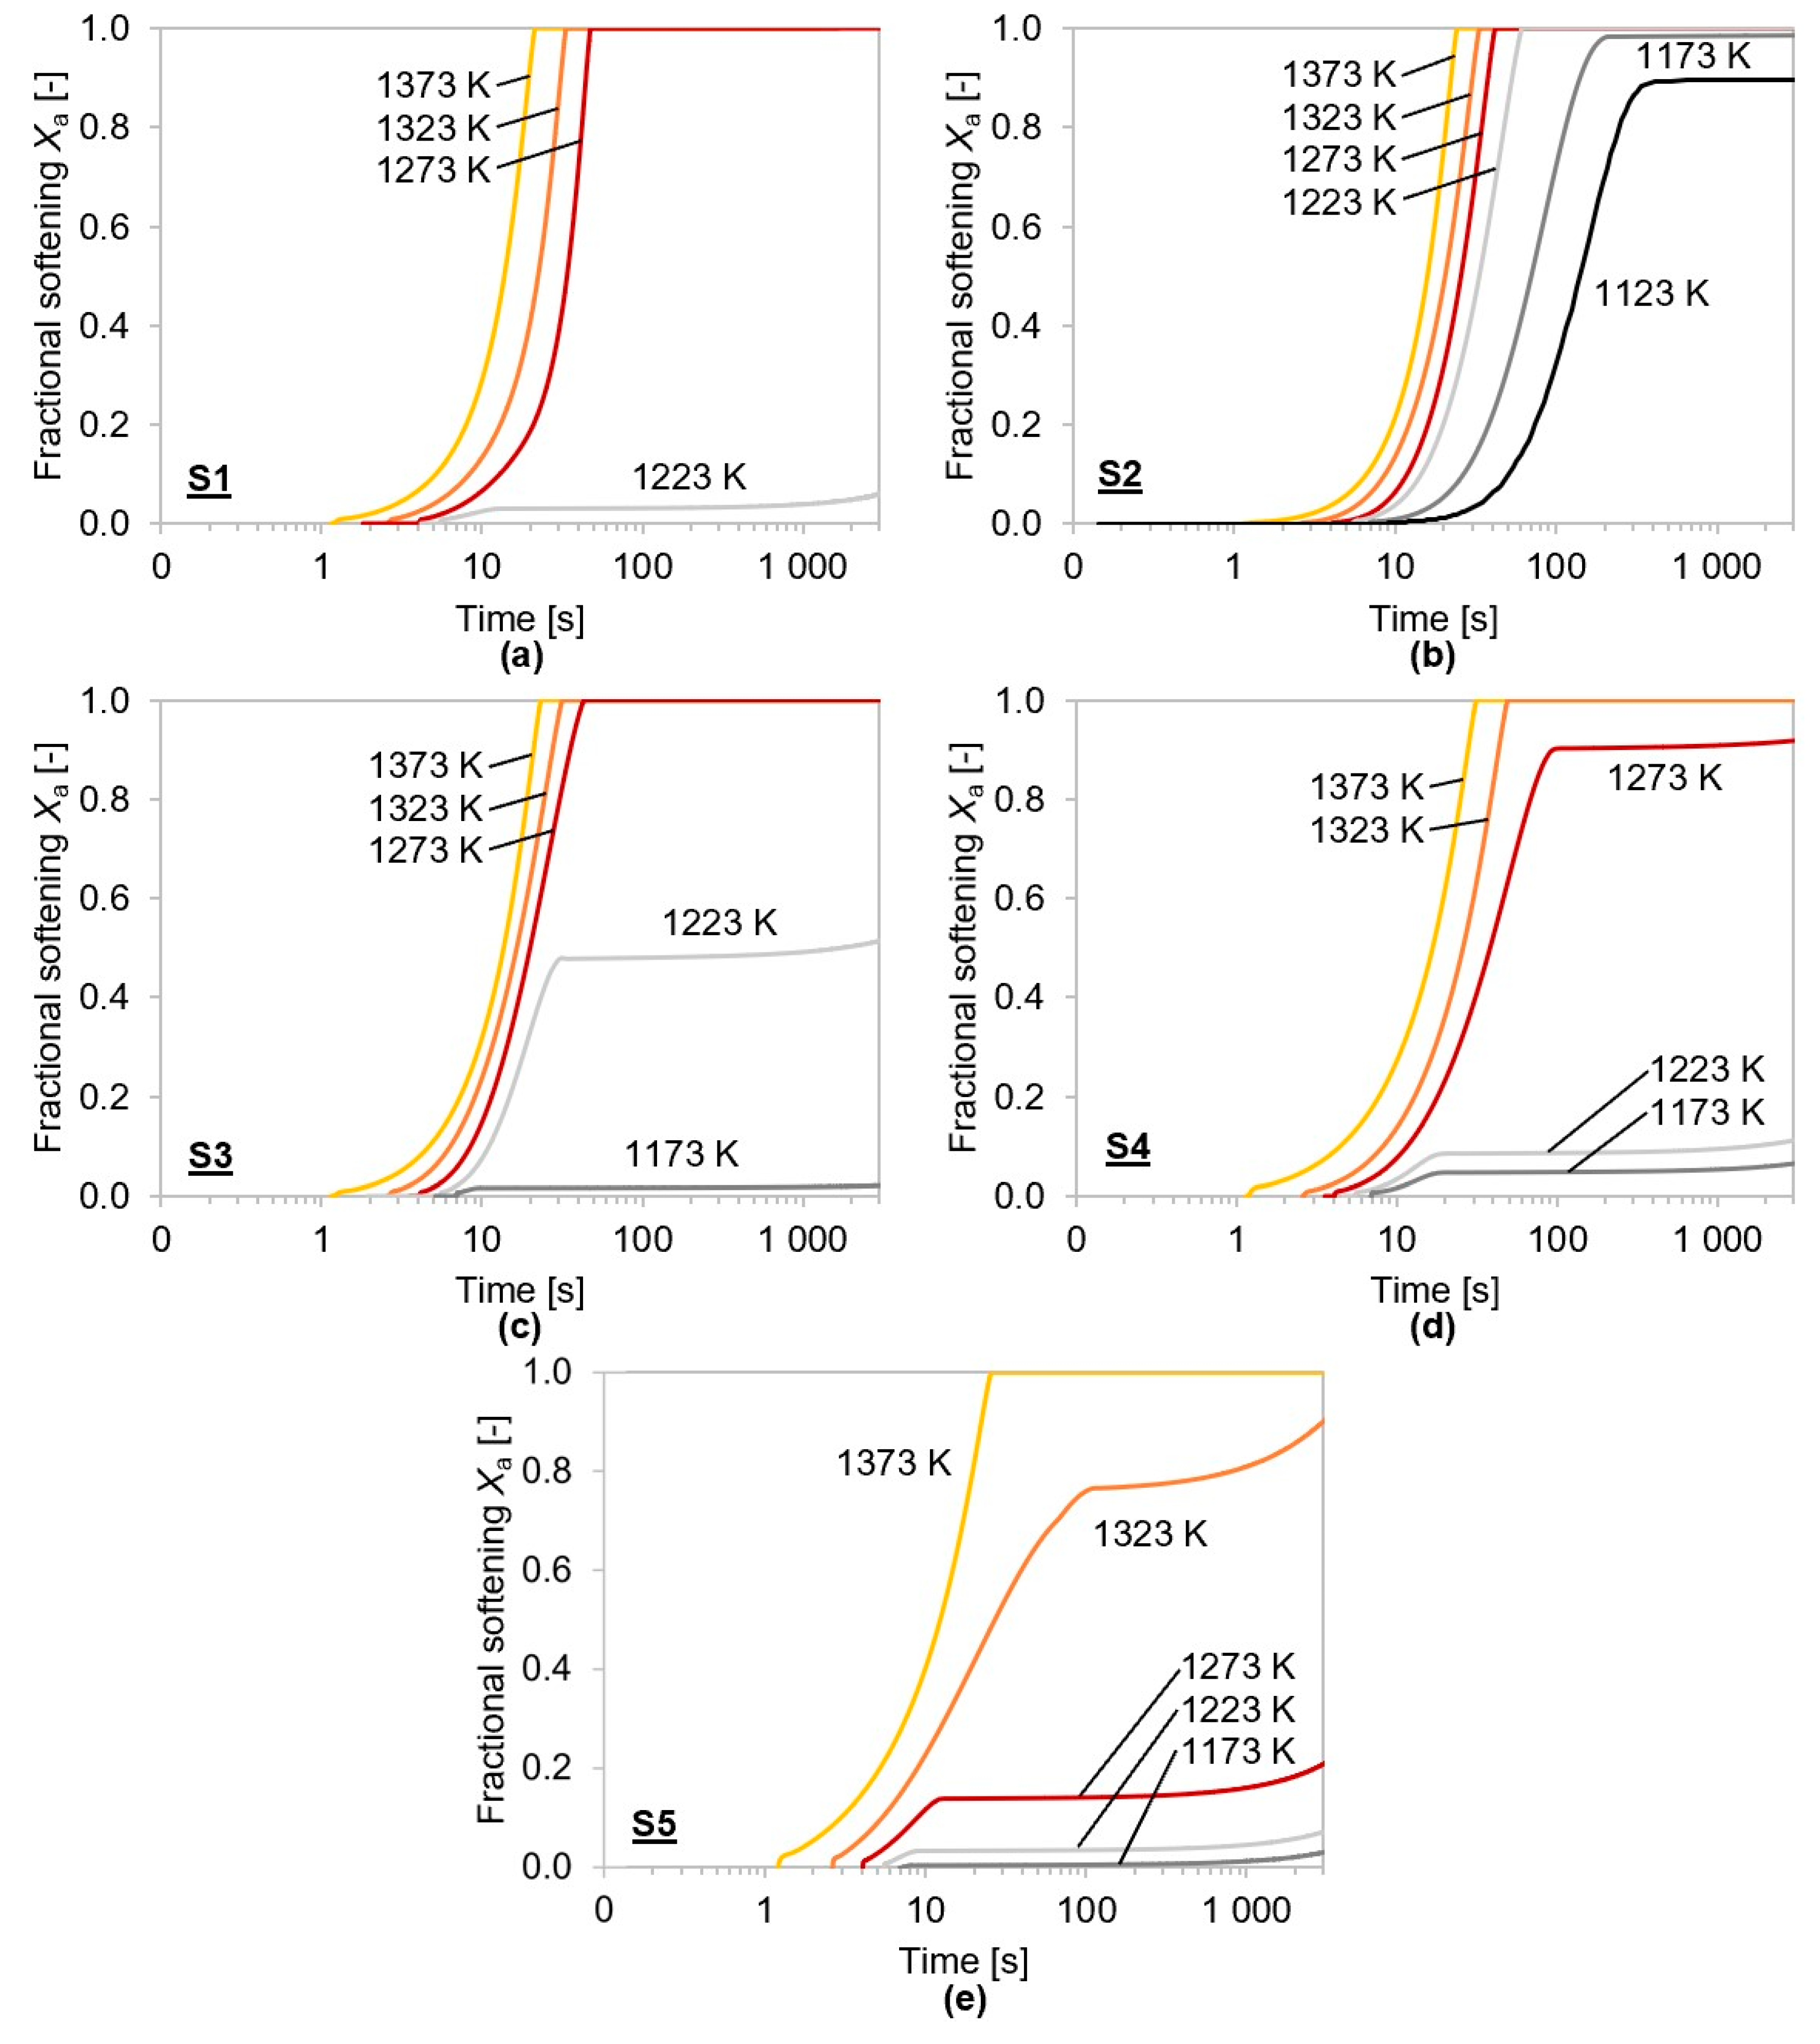
Figure 11 depicts the temperature-dependent softening fractions of the materials S1–S5 as a function of holding times after deformation. The slopes of the graphs clearly change at the respective static recrystallization critical temperatures and a plateau is formed due to deformation-induced precipitation of MX particles. As the retarding pressure decreases at prolonged holding times due to precipitate coarsening, the curves continue afterwards with a sigmoidal shape.
The simulation results show that larger amounts of microalloying result in higher values of the TSRCT. In the alloy S2, which does not contain significant amounts of Ti, Nb, and V, the inhibition of recrystallization is triggered only below 1173 K. S1 and S3 reach the TSRCT at 1223 K, as both alloys contain a sufficient amount of V to impede recrystallization at a higher temperature. Contrary to the Ti-, Nb-, and V-microalloyed S5, the material S4 only contains Nb, which explains why the TSRCT of the material is located at a lower temperature of 1273 K. The simulated static recrystallization temperature of S5 is in close agreement with the experiments, as both methods result in a high TSRCT of 1323 K.
Figure 12 depicts the simulated time–temperature–precipitation (TTP) curves without deformation for 5% precipitated relative phase fraction of (Nb/Ti/V)(C,N) MX compounds for the investigated steel grades. During simulation of the single-hit compression tests, MX phases form right at the minimum start temperature for precipitation, TPS, of the corresponding TTP curve. A decrease in temperature accelerates the nucleation of new carbonitride phases until TN, which describes the temperature at the “nose” of the TTP curve, is reached. Above TN, precipitation is strongly impeded by low driving forces, even though diffusion would be high. The opposite is true at temperatures below TN. Thus, at a temperature of ~973 K, significant precipitation does not occur within a technologically relevant holding time (expectedly below 10 h).
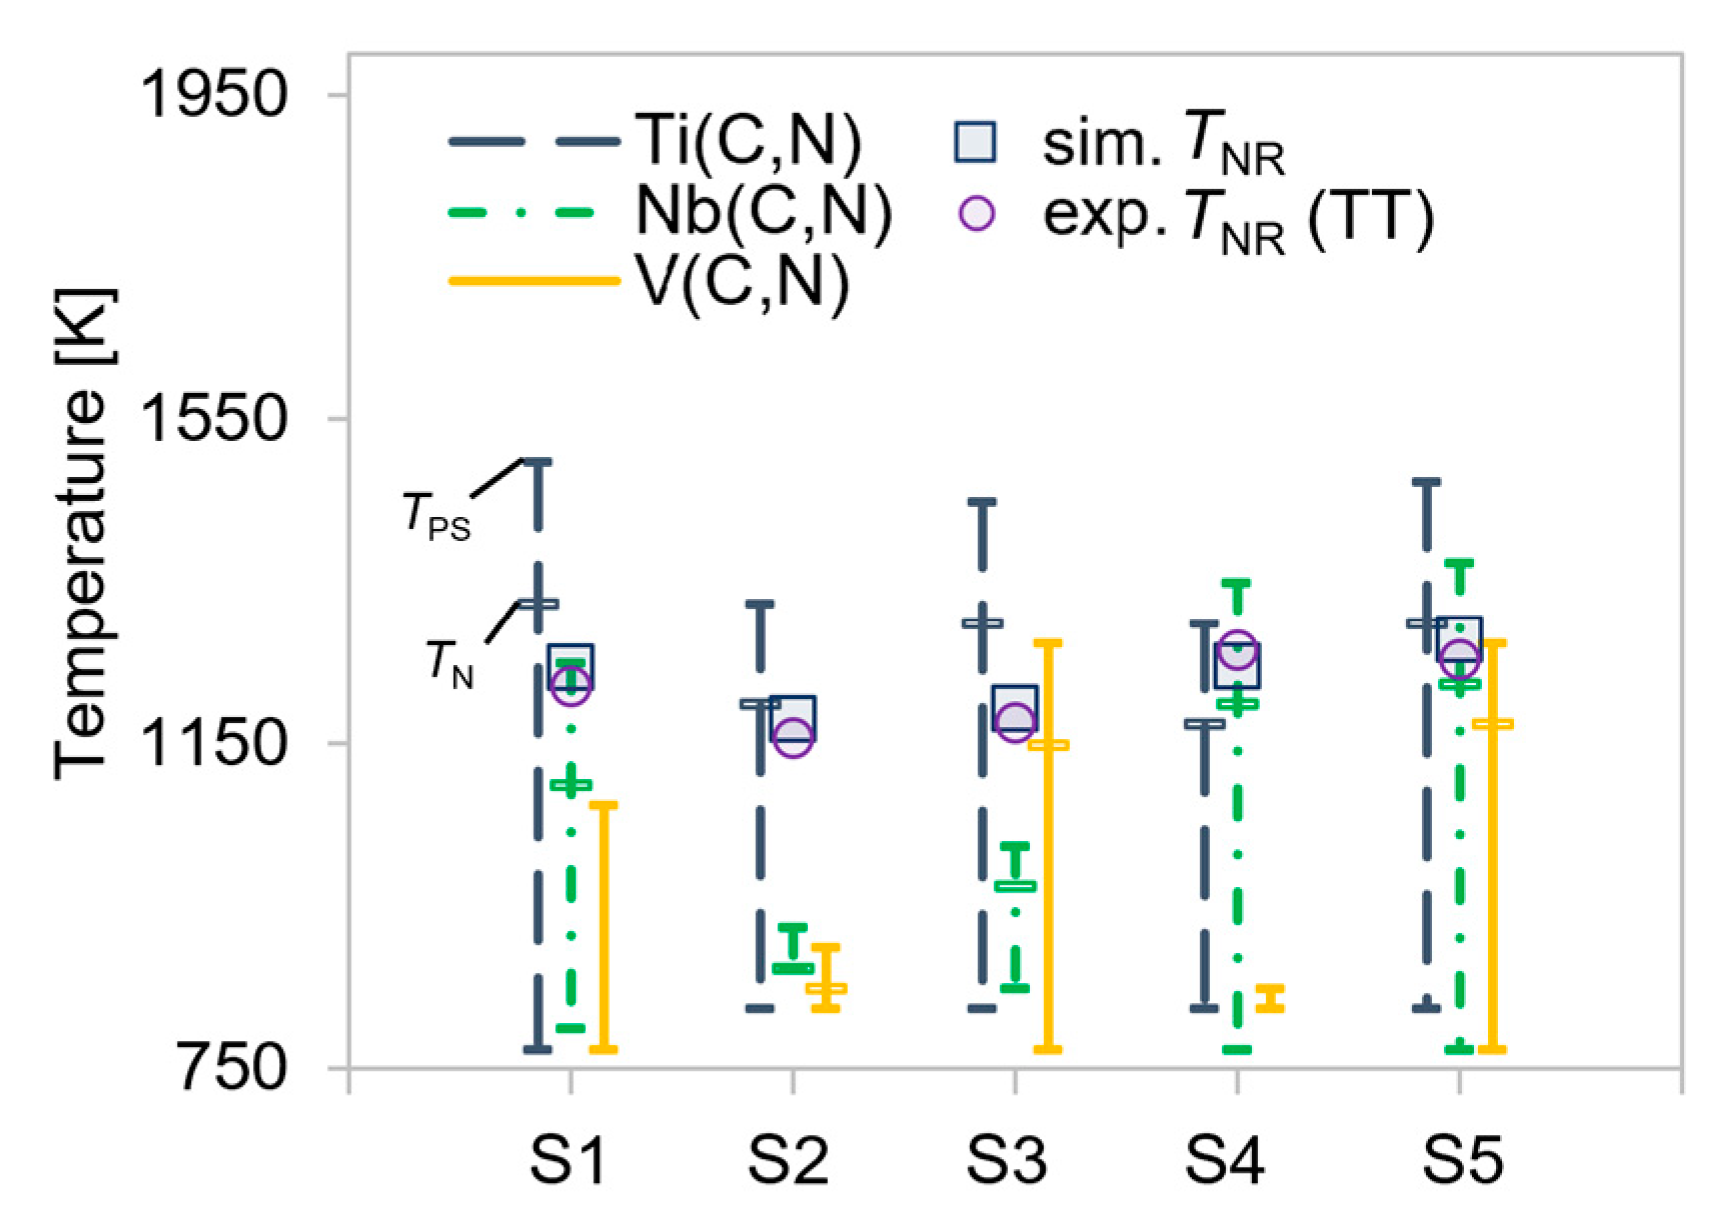
In Figure 13, the TPS and TN of the individual MX phases from simulated TTP curves and the TNR from simulated compression tests are compared to the experimental TNR from hot torsion tests. The evaluated non-recrystallization temperatures are in the range of TN, where the peak of microalloy carbonitride precipitation is located. This indicates sound simulative thermokinetics of MX precipitation, since it is expected that the impediment of recrystallization is governed by grain boundary pinning by MX phases [5]. Due to the low solubility of Ti(C,N) in austenite, this phase is observed at higher temperatures than Nb(C,N) and V(C,N) [36]. Thus, microalloying of titanium is highly effective for grain boundary pinning by individual MX phases at elevated temperatures. Only in alloy S4 does the formation of Nb(C,N) start at a higher temperature than Ti(C,N) due to the much lower content of Ti in comparison to Nb.
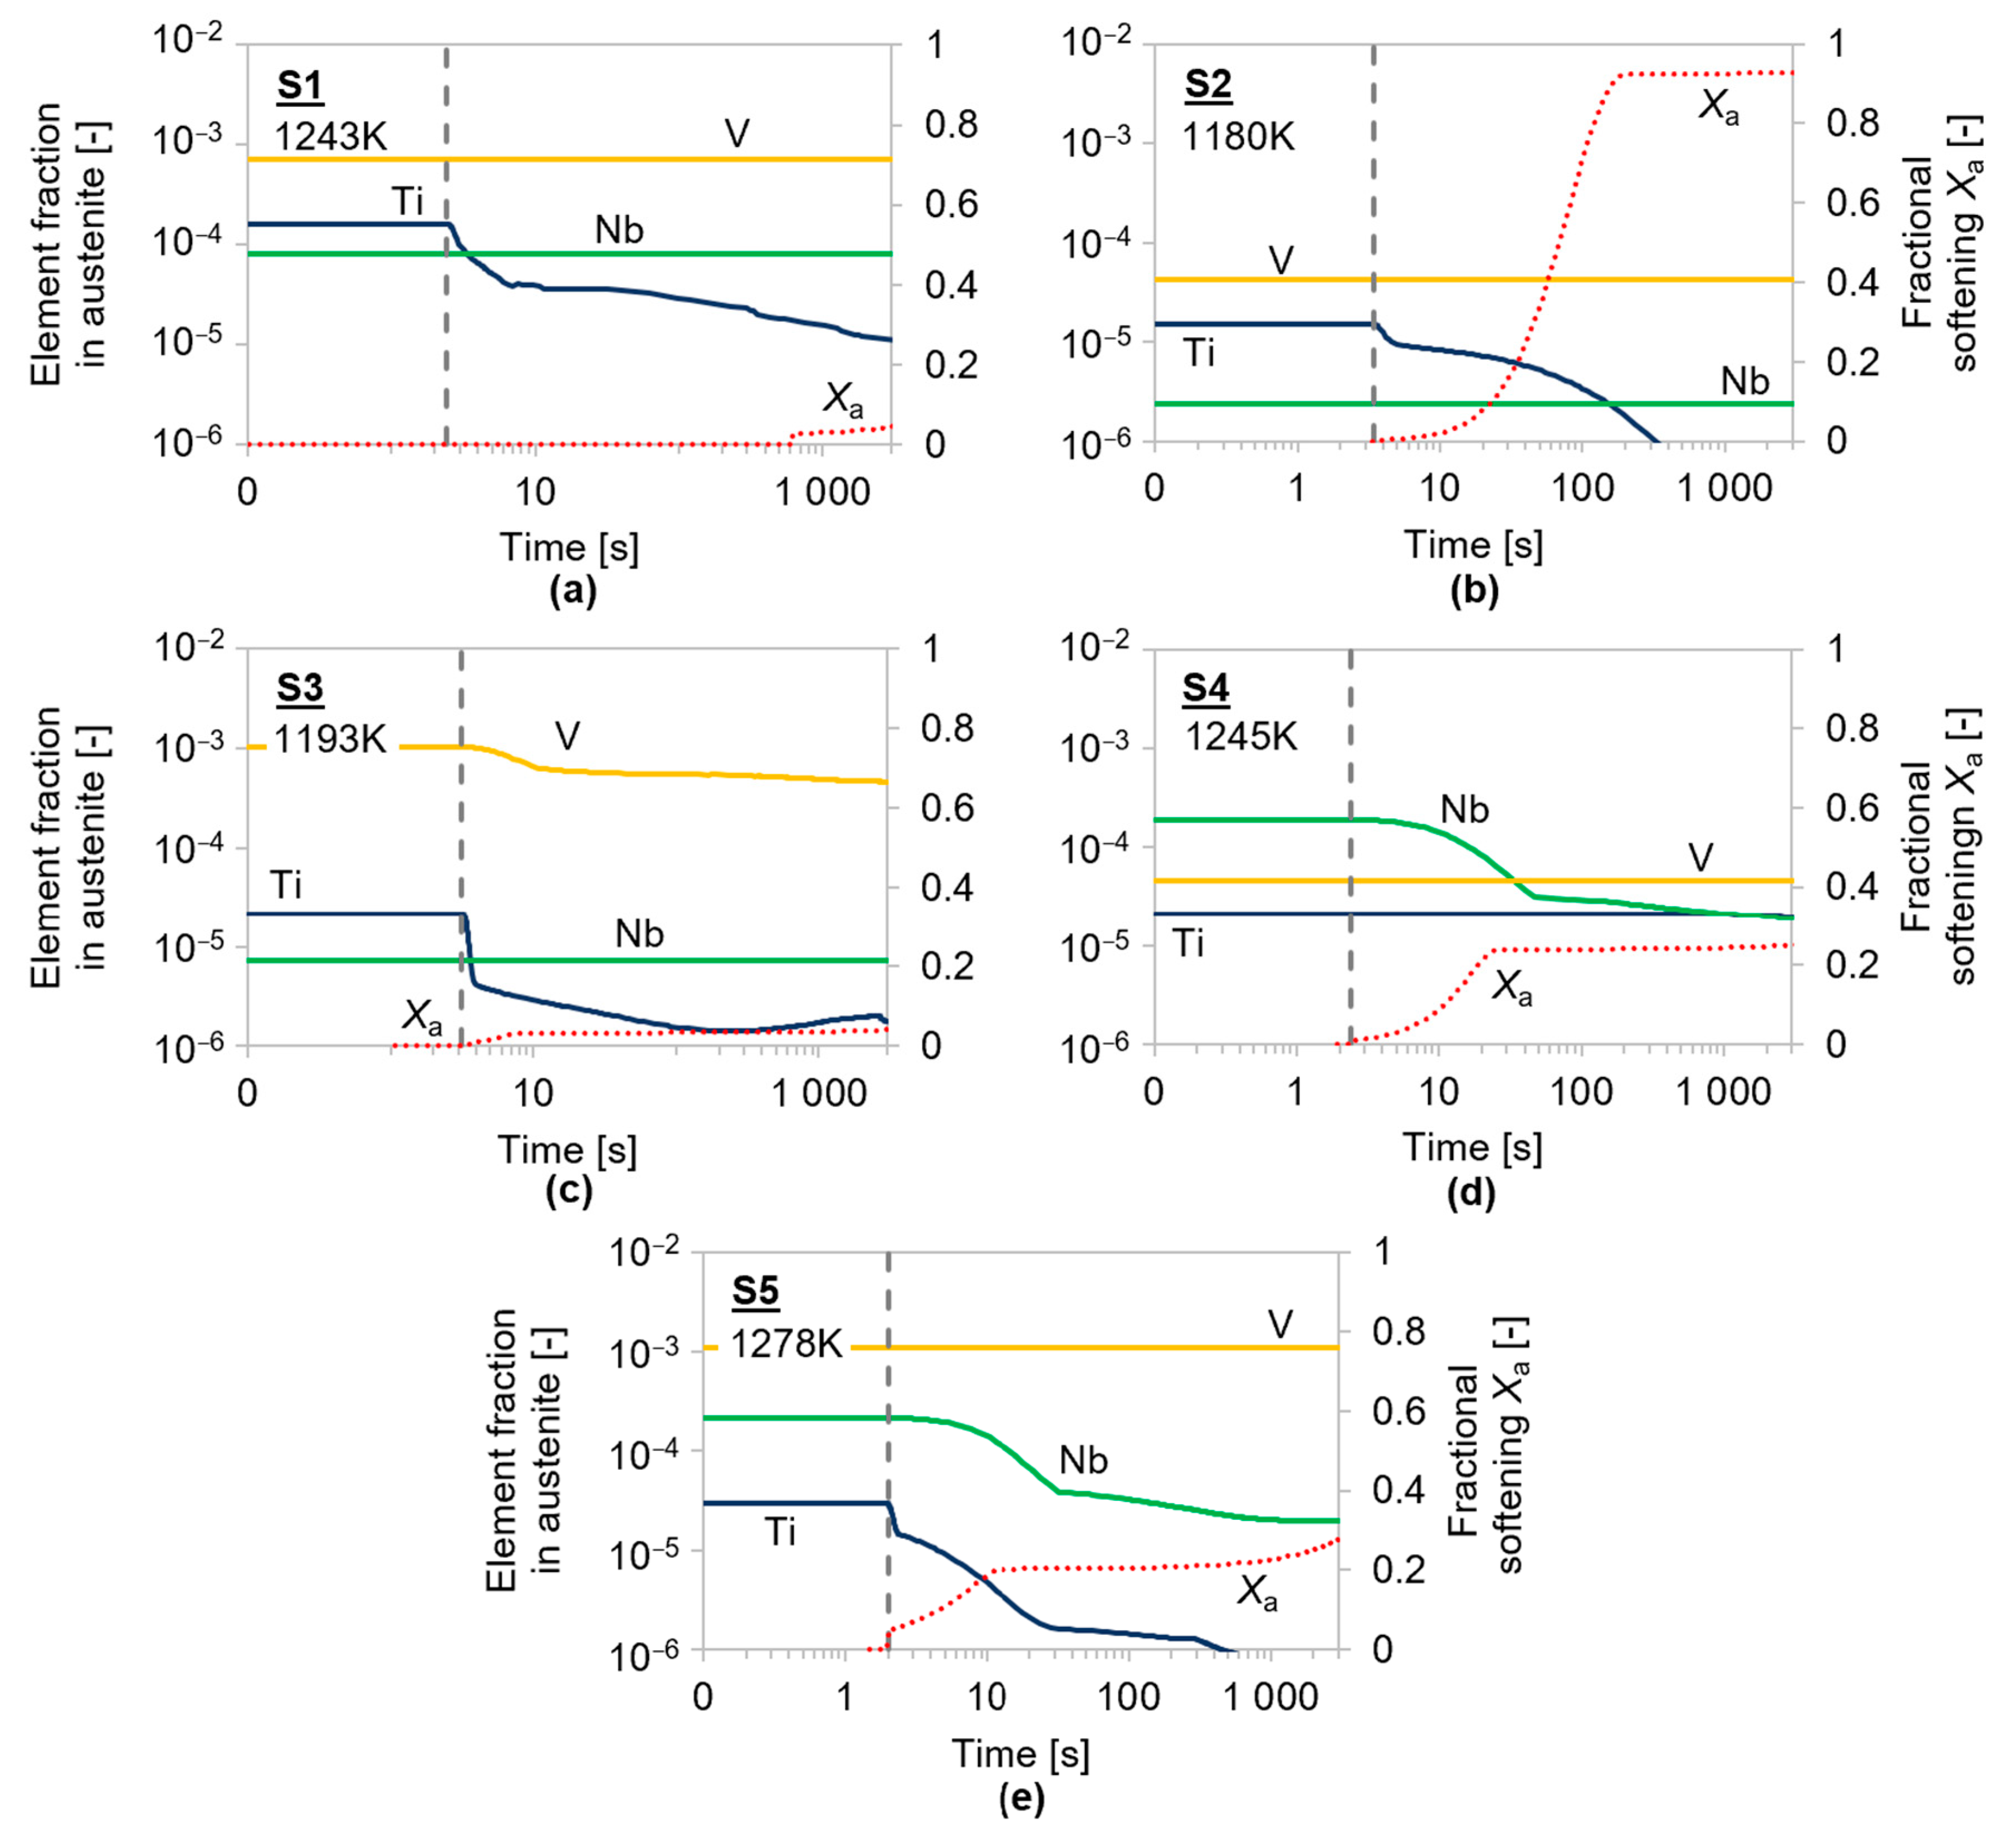
The impeding influence on the static recrystallization is explained by the combination of austenite grain boundary pinning of precipitates and solute drag of the substitutional elements Nb, Ti, and V. To examine which of these two mechanisms predominates during the recrystallization retardation, the formation of (Nb/Ti/V)(C,N) phases and the remaining dissolved elements, causing solute drag in the matrix during deformation, are examined in detail. Figure 14 presents the atomic fractions of the microalloying elements Nb, Ti, and V in the austenite matrix and the softening fraction of austenite during the simulation of the compression tests at the determined non-recrystallization temperature of each steel grade.
The softening fraction clearly increases at the beginning of the deformation. The simultaneous strain-induced precipitation of carbonitrides, as seen by the drop of the respective dissolved element fraction, hinders the grain boundary movement subsequently. After compression start, significant amounts of dissolved microalloying elements in austenite are observed in the alloys S1, S3, S4 and S5. Here, a combination of precipitate pinning and solute drag is likely relevant for the retarded static recrystallization. In S2, due to the low microalloying content, no significant effect of either precipitation and solute drag is observed, and recrystallization is, thus, fastest.
Nevertheless, the effect of solute drag is expected to be presumably small, since the amount of precipitated carbonitrides is assumed to be sufficient for the present retardation of recrystallization. The results correlate well with the literature; Abad et al. [20] reported that solute drag only has a high impact on recrystallization at a small strain φ = 0.1.

4.3. Comparison of Experimental and Predicted TNR and TSRCT

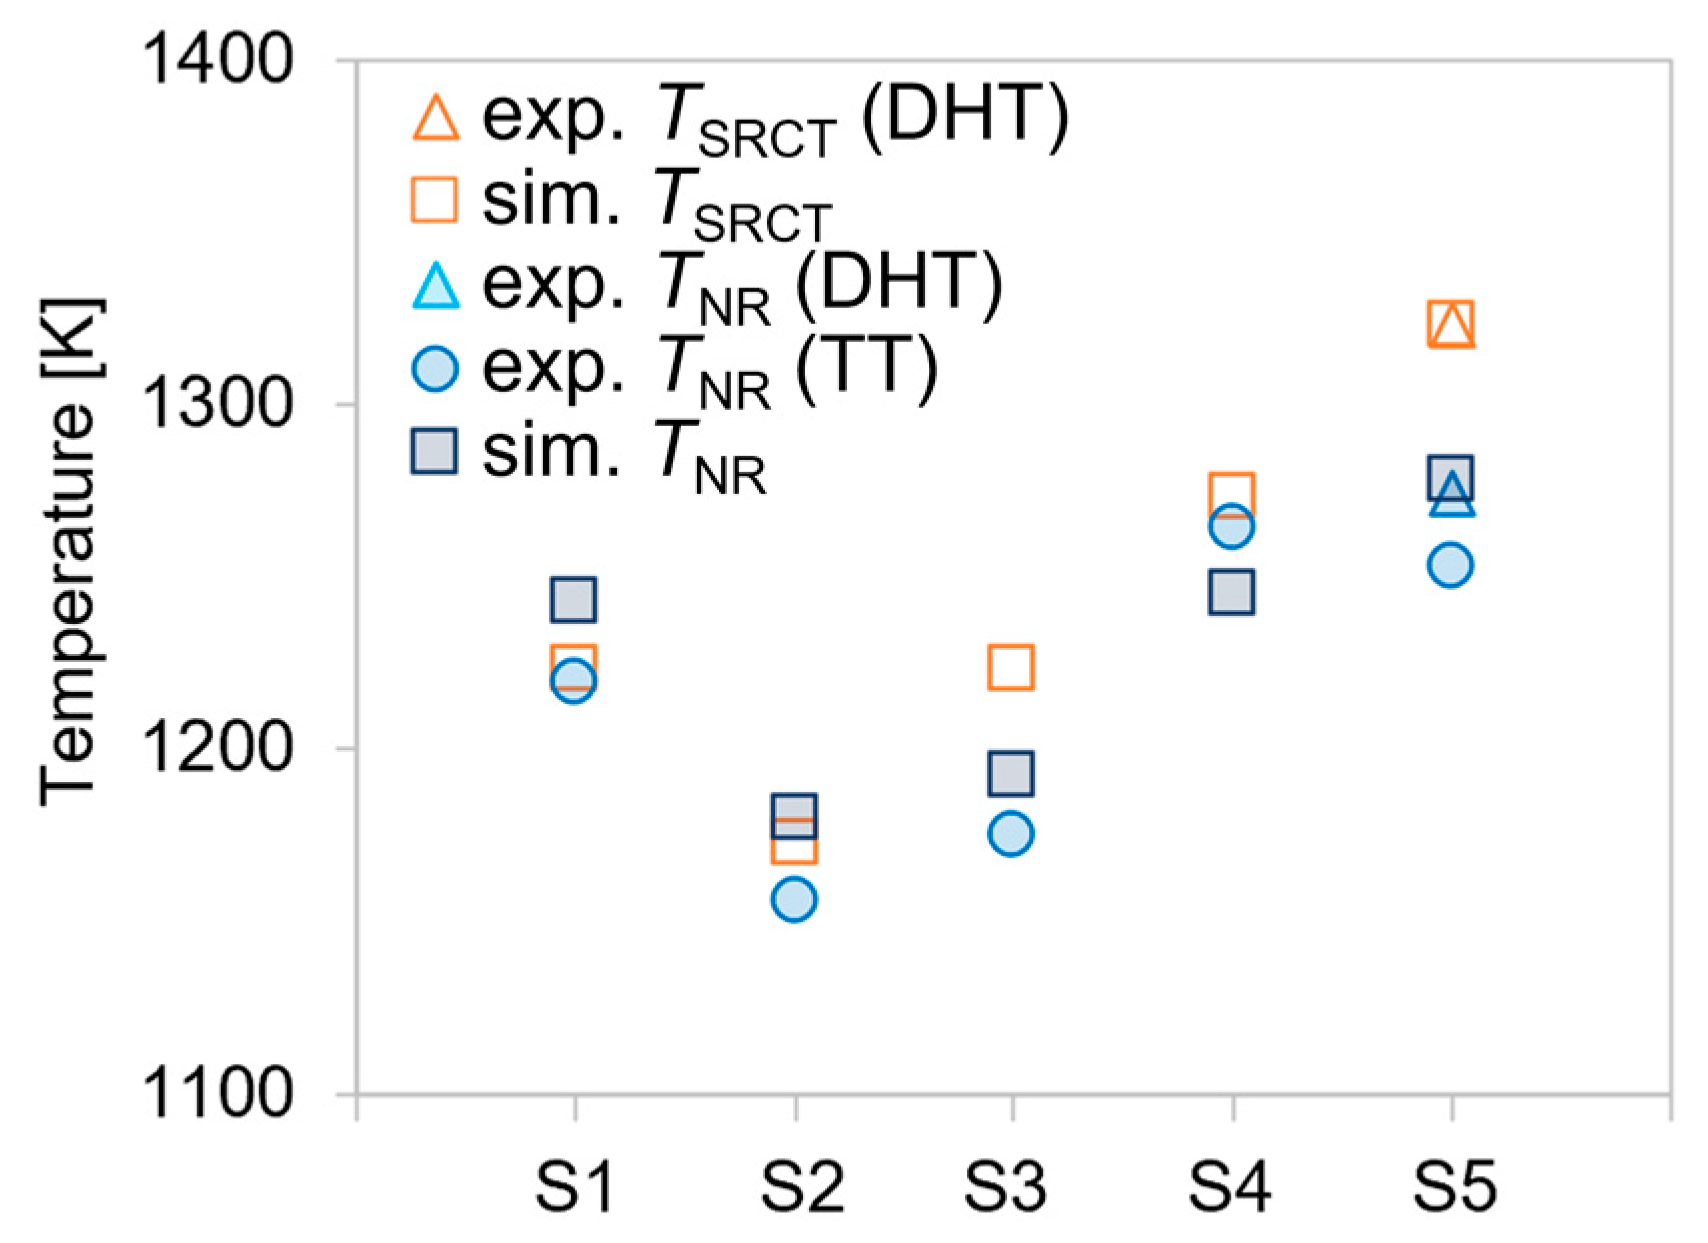
Figure 15 summarizes the results of the experimentally derived critical temperatures for static recrystallization from double-hit tests (exp. TSRCT (DHT), exp. TNR (DHT)) and torsion tests (exp. TNR (TT)) as well as the corresponding temperatures resulting from recrystallization simulation (sim. TSRCT, sim. TNR). The TSRCT from compression tests of S5 matches exactly with the simulated value and the experimental TNR also correlates well with the simulated one. Medina et al. [23] stated that TNR and TSRCT overlap in experiments with the same experimental setup. Our obtained results confirm this, since the experimental and simulation-based TSRCT show only minor deviations from the determined TNR values. For the alloys S3, S4, and S5, the value of the simulated TNR is ≤ 45 K lower than that of the simulated TSRCT, while the TNR of S1 and S2 slightly exceed the TSRCT (≤20 K). This difference in the trend may be explained by the quite large temperature step of 50 K for the test temperatures, used within the simulations for the determination of TSRCT. A smaller temperature step within the simulation increases the TSRCT of S1 and S2 above the computational TNR. Furthermore, the simulation results confirm that higher microalloying contents increase both critical temperatures. The alloy S2, with the lowest TSRCT and TNR, contains hardly any microalloying additions, while the alloy S5, with the highest contents of Nb, Ti, and V, reaches the highest values of TSRCT and TNR.
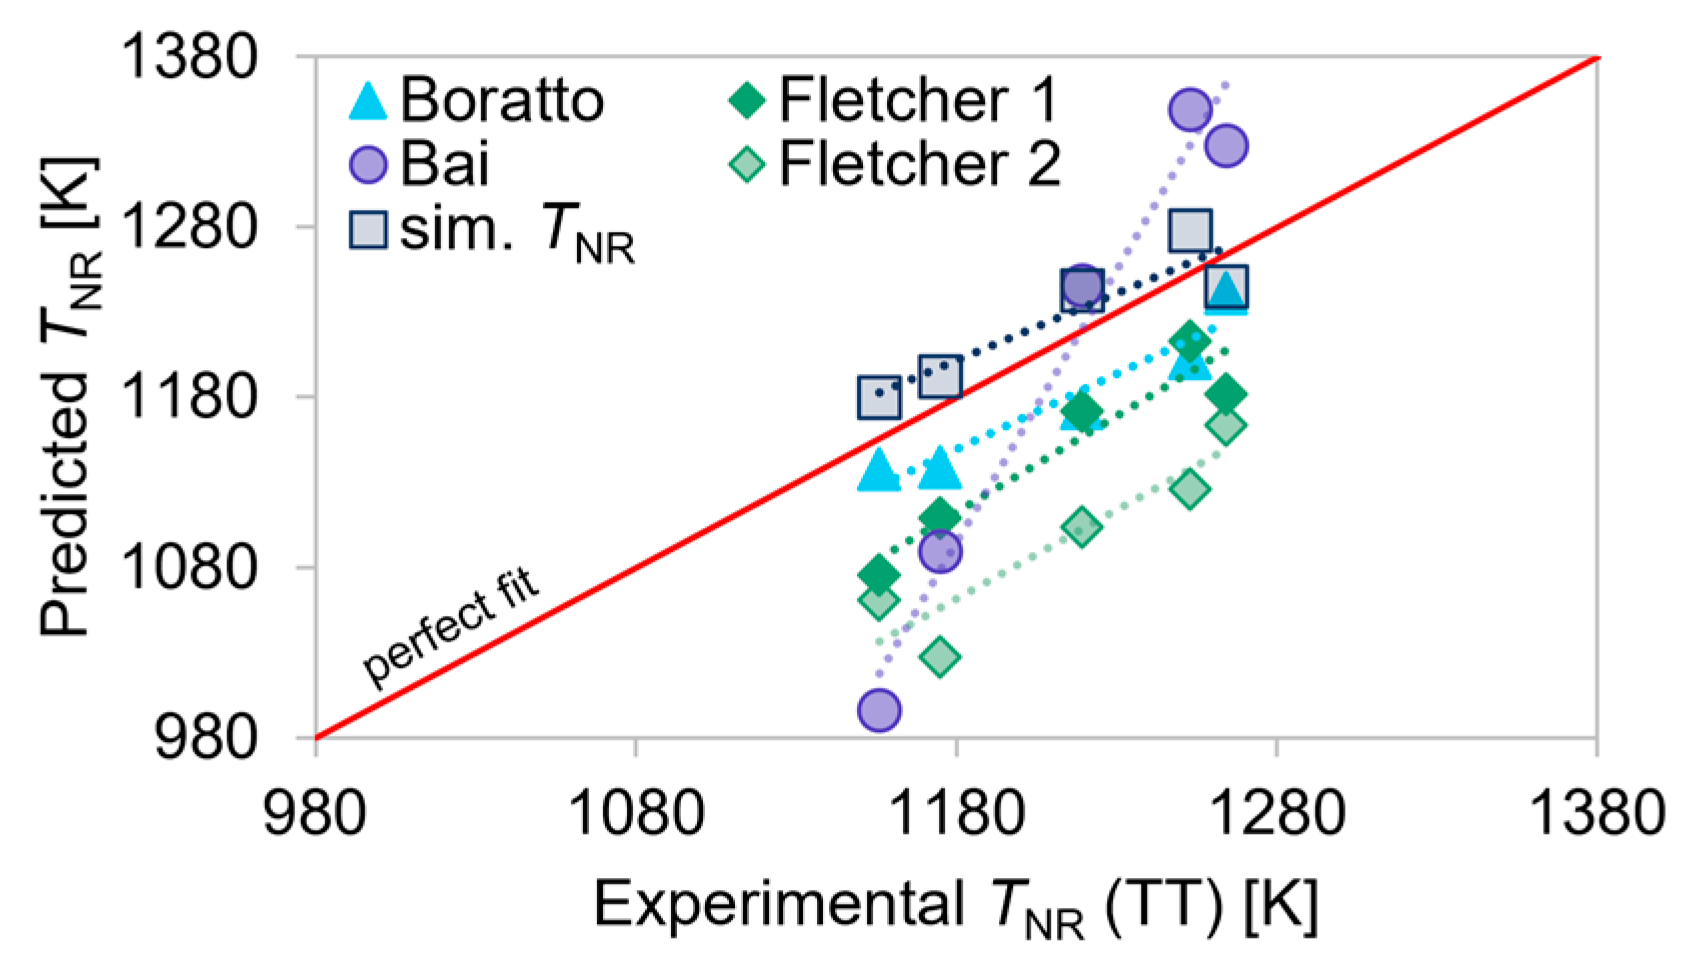
Figure 16 compares the TNR values calculated with Equations (1)–(4) and the simulation results to the experimental values from torsion tests. The physics-based simulation of the present study matches the experimental data best, followed by the empiric relation of Boratto et al. [28], which shows a systematic relatively small underestimation of about 50 K.
This is in contrast to the findings by Homsher [25,27], who claimed that the obtained values from the Boratto equation would exceed their experimental ones. It is notable that Homsher’s alloys contain twice as much Nb (~0.06 wt.%) as the steel grades of the present study. Since Equation (1) attributes a large impact on the TNR to Nb, it may only be applied for alloys with lower Nb content. Equation (2) by Bai et al. [30], on the other hand, coincides with the experimental data of Homsher (max. C content of 0.062 wt.%) but shows the highest deviation for our experiments. Only alloy S1, which contains the lowest amount of C (0.15 wt.%), shows a negligible difference between the experimental TNR and the value derived from Equation (2). This indicates that the equation by Bai should only be applied to steels with very low C levels. Equations (3) and (4) by Fletcher [25,27] match the trend in our experimental data, but the TNR values are roughly 60 K and 120 K too low, respectively. Both equations exclude the impact of N and Ti, which are known to elevate TNR during recrystallization. The consideration of the applied strain in Equation (4) does not raise the values to the predicted temperatures. These comparisons clearly show the problem of empiric relations. Whereas each of the empiric equations may precisely match experimental data in a narrow composition range without any relation to processing parameters, their predictive power is limited.

5. Conclusions

Good consistency between the two experimental methods, isothermal double-hit compression tests (TNR and TSRCT) and continuous hot torsion tests (TNR), for the determination of the critical temperatures for static recrystallization of five microalloyed steel grades is achieved in our work. Concerning the information about recrystallization kinetics, investigations using double-hit experiments should be preferred as they allow us to study the interpass time, and both critical temperatures can be determined from the same experimental setup. The main disadvantage of double-hit compression tests is the large number of tests needed for the determination of TNR and TSRCT. Torsion testing is less time-consuming as it only demands one sample to obtain TNR, but the applied experimental procedure does not cover the investigation of TSRCT.
The moderate interpass time of 30 s in DHT initiates deformation-supported precipitation of MX phases, which leads to grain boundary pinning and retardation of recrystallization. The effect of solute drag is negligible in our experiments with a strain of 0.2 per hit.
The experimental data for the TNR and the TSRCT are compared to a semi-physical parameter-based simulation model for static recrystallization in combination with a mean-field dislocation density evolution model. Our investigations lead to a maximum deviation of the simulation results for TNR by less than 50 K from the experimental data throughout the investigated microalloying contents. A benefit of our simulation approach, aside from its high predictive power, is that we additionally obtain predictions on the TSRCT. The according simulation results are consistent with experimental data, exemplarily determined for S5 with the highest microalloying contents of the studied steel grades.
The comparative computations with TNR values are calculated by using four empirical equations from the literature, showing that most of the proposed empirical formulae deviate from the experimental data, indicated by a difference between evaluated and experimental TNR of more than 100 K. The equations do not take processing parameters into account and can only be employed for a narrow composition range. Only the formula by Boratto et al. yields a more appropriate trend for TNR with varying microalloying, with a systematic deviation around 50 K.
To conclude, the critical temperatures for static recrystallization TNR and TSRCT are significantly raised by the microalloying element Nb, rather than Ti and V. The best match of all experimental data of the studied steel grades is obtained by the simulation with combined thermodynamic and microstructural semi-physical modeling. The physical-based predictions additionally help to understand the interplay of steel compositions and precipitation kinetics with recrystallization. Nevertheless, there are limitations concerning the applied parameters and models as metadynamic or dynamic recrystallization are not taken into account. The ABC parameters for the dislocation density evolution are evaluated for the current process parameters and have to be adapted to the temperature and strain rate. It can be stated that the recrystallization behavior of the examined microalloyed steel grades during the performed treatments can be thoroughly simulated by computational mean-field microstructure modeling, and it therefore helps to reduce the extent of preliminary experimental investigations for future industrial process optimizations. The developed and validated semi-physical modeling approach has high predictive power for TNR and TSRCT for wide composition variations within microalloyed steel.

Author Contributions

Conceptualization, E.S., J.K. and E.P.-K.; methodology, E.S.; software, E.S.; investigation, E.S.; writing—original draft preparation, E.S. and R.K.; writing—review and editing, E.S., J.K., A.J., E.K. and E.P.-K.; visualization, E.S.; supervision, E.P.-K. All authors have read and agreed to the published version of the manuscript.

Funding

This research was funded by Christian Doppler Forschungsgesellschaft in the framework of the CD-Laboratory of Interfaces and Precipitation Engineering (CDL-IPE).

Institutional Review Board Statement

Not applicable.

Informed Consent Statement

Not applicable.

Data Availability Statement

Not applicable.

Acknowledgments

The financial support from the Austrian Federal Ministry for Digital and Economic Affairs and the National Foundation for Research, Technology, and Development is gratefully acknowledged. The authors acknowledge Open Access Funding by TU Wien. The financial support, as well as the provision of sample material by voestalpine Tubulars GmbH & Co. KG, is gratefully acknowledged by the authors.

Conflicts of Interest

The authors declare no conflict of interest. The funders had no role in the design of the study; in the collection, analyses, or interpretation of data; in the writing of the manuscript; or in the decision to publish the results.

References

  1. Liu, Z.G.; Gao, X.H.; Xiong, M.; Li, P.; Misra, R.; Rao, D.Y.; Wang, Y.C. Role of hot rolling procedure and solution treatment process on microstructure, strength and cryogenic toughness of high manganese austenitic steel. Mater. Sci. Eng. A 2021, 807, 140881. [Google Scholar] [CrossRef]
  2. Sauer, M.; Fabík, R.; Schindler, I.; Kawulok, P.; Opěla, P.; Kawulok, R.; Vodárek, V.; Rusz, S. Analysis of the microstructure development of Nb-microalloyed steel during rolling on a heavy-section mill. Materials 2022, 16, 288. [Google Scholar] [CrossRef]
  3. Varanasi, R.S.; Gault, B.; Ponge, D. Effect of Nb micro-alloying on austenite nucleation and growth in a medium manganese steel during intercritical annealing. Acta Mater. 2022, 229, 117786. [Google Scholar] [CrossRef]
  4. Stornelli, G.; Tselikova, A.; Mirabile Gattia, D.; Mortello, M.; Schmidt, R.; Sgambetterra, M.; Testani, C.; Zucca, G.; Di Schino, A. Influence of vanadium micro-alloying on the microstructure of structural high strength steels welded joints. Materials 2023, 16, 2897. [Google Scholar] [CrossRef]
  5. Yuan, J.; Xiao, Y.; Min, N.; Li, W.; Zhao, S. The influence of precipitate morphology on the growth of austenite grain in Nb-Ti-Al microalloyed steels. Materials 2022, 15, 3176. [Google Scholar] [CrossRef]
  6. Zhao, Y.; Zheng, J.; Chen, L.; Liu, X. Static recrystallization behavior of low-carbon Nb-V-microalloyed forging steel. Metals 2022, 12, 1745. [Google Scholar] [CrossRef]
  7. Zhang, Q.; Huo, X.; Li, L.; Chen, S.; Lu, C. Correlation between precipitation and recrystallisation during stress relaxation in titanium microalloyed steel. Metals 2022, 12, 1920. [Google Scholar] [CrossRef]
  8. Kaikkonen, P.M.; Somani, M.C.; Karjalainen, L.P.; Kömi, J.I. Flow stress behaviour and static recrystallization characteristics of hot deformed austenite in microalloyed medium-carbon bainitic steels. Metals 2021, 11, 138. [Google Scholar] [CrossRef]
  9. Felker, C.A.; Speer, J.G.; de Moor, E.; Findley, K.O. Hot strip mill processing simulations on a Ti-Mo microalloyed steel using hot torsion testing. Metals 2020, 10, 334. [Google Scholar] [CrossRef]
  10. Buken, H.; Kozeschnik, E. Modeling static recrystallization in Al-Mg alloys. Metall. Mater. Trans. A 2021, 52, 544–552. [Google Scholar] [CrossRef]
  11. Kozeschnik, E. Mean-field microstructure kinetics modeling. Encycl. Mater. Met. Alloy. 2022, 4, 521–526. [Google Scholar] [CrossRef]
  12. CDL-IPE, Inst. of Mat. Sci. and Technol., TU Wien. Thermodynamic Database with Modified Carbo-Nitride Descriptions Based on the Open-License Multi-Component MatCalc Database mc_fe, Version 2.060. Available online: https://www.matcalc.at/images/stories/Download/Database/mc_fe_v2.060.tdb (accessed on 4 April 2023).
  13. Varela-Castro, G.; Cabrera, J.-M.; Prado, J.-M. Critical Strain for Dynamic Recrystallisation. The Particular Case of Steels. Metals 2020, 10, 135. [Google Scholar] [CrossRef]
  14. Uranga, P.; Fernández, A.; López, B.; Rodriguez-Ibabe, J. Transition between static and metadynamic recrystallization kinetics in coarse Nb microalloyed austenite. Mater. Sci. Eng., A 2003, 345, 319–327. [Google Scholar] [CrossRef]
  15. Medina, S.F.; Gómez, M.; Rodríguez, E.; Rancel, L. Influence of accumulated stress in austenite on transformed ferrite grain size by hot rolling for a V-microalloyed steel. ISIJ Int. 2008, 48, 1263–1269. [Google Scholar] [CrossRef]
  16. Vervynckt, S.; Verbeken, K.; Lopez, B.; Jonas, J.J. Modern HSLA steels and role of non-recrystallisation temperature. Int. Mater. Rev. 2012, 57, 187–207. [Google Scholar] [CrossRef]
  17. Bai, D.Q.; Yue, S.; Sun, W.P.; Jonas, J.J. Effect of deformation parameters on the. Met. Trans. A 1993, 24, 2151–2159. [Google Scholar] [CrossRef]
  18. Medina, S.F. Determination of no-recrystallisation temperature in Nb-V-Ti microalloyed steel and discussion of its definition. Mater. Sci. Technol. 1998, 14, 217–221. [Google Scholar] [CrossRef]
  19. Gómez, M.; Medina, S.F.; Quispe, A.; Valles, P. Static recrystallization and induced precipitation in a low Nb microalloyed steel. ISIJ Int. 2002, 42, 423–431. [Google Scholar] [CrossRef]
  20. Abad, R.; AI, F.; Lopez, B.; JM, R.-I. Interaction between recrystallization and precipitation during multipass rolling in a low carbon niobium microalloyed steel. ISIJ Int. 2001, 41, 1373–1382. [Google Scholar] [CrossRef]
  21. Vervynckt, S.; Verbeken, K.; Thibaux, P.; Liebeherr, M.; Houbaert, Y. Austenite recrystallization–precipitation interaction in niobium microalloyed steels. ISIJ Int. 2009, 49, 911–920. [Google Scholar] [CrossRef]
  22. Gómez, M.; Medina, S.F. Role of microalloying elements in the microstructure of hot rolled steels. Int. J. Mater. Res. 2011, 102, 1197–1207. [Google Scholar] [CrossRef]
  23. Medina, S.F.; Mancilla, J.E.; Hernandez, C.A. Static recrystallization of hot deformed austenite and induced precipitation kinetics in vanadium microalloyed steels. ISIJ Int. 1994, 34, 689–696. [Google Scholar] [CrossRef]
  24. Bhargava, G. Grain boundary effects on mechanical properties: Design approaches in steel. In Welding—Modern Topics; Crisóstomo Absi Alfaro, S., Borek, W., Tomiczek, B., Eds.; IntechOpen: London, UK, 2021; pp. 221–234. ISBN 978-1-83881-895-1. [Google Scholar]
  25. Homsher, C.N. Determination of the Non-Recrystallization Temperature (Tnr) in Multiple Microalloyed Steels. Master’s Thesis, Colorado School of Mines, Golden, CO, USA, 2013. [Google Scholar]
  26. Akben, M.G.; Weiss, I.; Jonas, J.J. Dynamic precipitation and solute hardening in a V microalloyed steel and two Nb steels containing high levels of Mn. Acta Metall. 1981, 29, 111–121. [Google Scholar] [CrossRef]
  27. Homsher-Ritosa, C.N. Influence of Processing Parameters and Alloying Additions on the mechanically Determined No-Recrystallization Temperature in Niobium Microalloyed Steels. Ph.D. Thesis, Colorado School of Mines, Golden, CO, USA, 2016. [Google Scholar]
  28. Boratto, F.; Barbosa, R.; Yue, S.; Jonas, J.J. In Proceedings of the International Conference on Physical Metallurgy of Thermomechanical Processing of Steels and Other Metals, THERMEC-88, Tokyo, Japan, 6–10 June 1988. p. 383. Available online: https://www.worldcat.org/title/thermec-88-international-conference-on-physical-metallurgy-of-thermomechanical-processing-of-steels-and-other-metals-proceedings-june-6-10-1988-keidanren-kaikan-tokyo-japan/oclc/35486134 (accessed on 10 April 2023).
  29. Maccagno, T.M.; Jonas, J.J.; Yue, S.; McCrady, J.; Slobodian, R.; Deeks, D. Determination of recrystallization stop temperature from rolling mill logs and comparison with laboratory simulation results. ISIJ Int. 1994, 34, 917–922. [Google Scholar] [CrossRef]
  30. Bai, D.Q.; Bodnar, R.L.; Ward, J.; Dorricott, J.; Sanders, S. Development of discrete X80 line pipe plate at SSAB Americas. Int. Symp. Recent Dev. Plate Steels 2011, 1, 13–22. [Google Scholar]
  31. Fletcher, F. Meta-analysis of Tnr measurements: Determining new empirical models based on composition and strain. In Proceedings of the Austenite Processing Symposium (Internal Company Presentation), Padua, Italy, 12 September 2008; pp. 1–14. [Google Scholar]
  32. Medina, S.F.; Mancilla, J.E. Static recrystallization of austenite and strain induced precipitation kinetics in titanium microalloyed steels. Acta Metall. Mater. 1994, 42, 3945–3951. [Google Scholar] [CrossRef]
  33. Medina, S.F.; Quispe, A. Influence of strain on induced precipitation kinetics in microalloyed steels. ISIJ Int. 1996, 36, 1295–1300. [Google Scholar] [CrossRef]
  34. Medina, S.F.; Mancilla, J.E. Determination of static recrystallization critical temperature of austenite in microalloyed steels. ISIJ Int. 1993, 33, 1257–1264. [Google Scholar] [CrossRef]
  35. Medina, S.F.; Quispe, A.; Valles, P.; JL, B. Recrystallization-precipitation interaction study of two medium carbon niobium microalloyed steels. ISIJ Int. 1999, 39, 913–922. [Google Scholar] [CrossRef]
  36. Sobotka, E.; Kreyca, J.; Poletti, M.C.; Povoden-Karadeniz, E. Analysis and Modeling of Stress-strain Curves in Microalloyed Steels Based on a Dislocation Density Evolution Model. Materials 2022, 15, 6824. [Google Scholar] [CrossRef]
  37. Facusseh, C.; Salinas, A.; Flores, A.; Altamirano, G. Study of static recrystallization kinetics and the evolution of austenite grain size by dynamic recrystallization refinement of an eutectoid steel. Metals 2019, 9, 1289. [Google Scholar] [CrossRef]
  38. Perttula, J.S.; Karjalainen, L.P. Recrystallisation rates in austenite measured by double compression and stress relaxation methods. Mater. Sci. Technol. 1998, 14, 626–630. [Google Scholar] [CrossRef]
  39. Palmiere, E.J.; Garcia, C.I.; DeArdo, A.J. The influence of niobium supersaturation in austenite on the static recrystallization behavior of low carbon microalloyed steels. Metall. Mater. Trans. A 1996, 27, 951–960. [Google Scholar] [CrossRef]
  40. Khoddam, S.; Hodgson, P.D. Conversion of the hot torsion test results into flow curve with multiple regimes of hardening. J. Mater. Process. Technol. 2004, 153–154, 839–845. [Google Scholar] [CrossRef]
  41. Ballard, T.J.; Speer, J.G.; Findley, K.O.; de Moor, E. Double twist torsion testing to determine the non recrystallization temperature. Sci. Rep. 2021, 11, 1–19. [Google Scholar] [CrossRef]
  42. Rešković, S.; Slokar Benić, L.; Lovrenić-Jugović, M. The interdependence of the degree of precipitation and dislocation density during the thermomechanical treatment of microalloyed niobium steel. Metals 2020, 10, 294. [Google Scholar] [CrossRef]
  43. Kocks, U.F.; Mecking, H. Physics and phenomenology of strain hardening: The FCC case. Prog. Mater. Sci. 2003, 48, 171–273. [Google Scholar] [CrossRef]
  44. Stechauner, G.; Kozeschnik, E. Assessment of substitutional self-diffusion along short-circuit paths in Al, Fe and Ni. Calphad 2014, 47, 92–99. [Google Scholar] [CrossRef]
  45. Sherstnev, P.; Lang, P.; Kozeschnik, E. Treatment of simultaneous deformation and solid-state precipitation in thermo-kinetic calculations: (ECCOMAS 2012). In Proceedings of the 6th European Congress on Computational Methods in Applied Sciences and Engineering (ECCOMAS 2012), Vienna, Austria, 10–14 September 2012; pp. 5331–5338. [Google Scholar]
  46. Manohar, P.A.; Ferry, M.; Chandra, T. Five Decades of the Zener Equation. ISIJ Int. 1998, 38, 913–924. [Google Scholar] [CrossRef]
  47. Cahn, J.W. The impurity-drag effect in grain boundary motion. Acta Metall. 1962, 10, 789–798. [Google Scholar] [CrossRef]
  48. Buken, H.; Zamberger, S.; Kozeschnik, E. A model for the influence of micro-alloying elements on static recrystallization of austenite. In Proceedings of the 6th International Conference on Recrystallization and Grain Growth (ReX&GG 2016); Wiley-VCH: Weinheim, Germany, 2016; pp. 113–118. [Google Scholar]
  49. Bailey, J.E.; Hirsch, P.B. The recrystallization process in some polycrystalline metals. Proc. R. Soc. A 1962, 267, 11–30. [Google Scholar] [CrossRef]
  50. Rehman, M.K.; Zurob, H.S. A novel approach to model static recrystallization of austenite during hot rolling of Nb microalloyed steel. Part I: Precipitate-free case. Metall. Mater. Trans. A 2013, 44, 1862–1871. [Google Scholar] [CrossRef]
  51. Zurob, H.S.; Hutchinson, C.R.; Bréchet, Y.; Purdy, G.R. Modeling recrystallization of microalloyed austenite: Effect of coupling recovery, precipitation and recrystallization. Acta Mater. 2002, 50, 3077–3094. [Google Scholar] [CrossRef]
  52. Xing, J.; Zhu, G.; Wu, B.; Ding, H.; Pan, H. Effect of Ti Addition on the Precipitation Mechanism and Precipitate Size in Nb-Microalloyed Steels. Metals 2022, 12, 245. [Google Scholar] [CrossRef]
  53. Tang, S.; Li, X.; Li, J.; Liu, Z.; Wang, G. Role of microalloying elements on recrystallization kinetics of cold-rolled high strength low alloy steels. Metals 2022, 12, 1741. [Google Scholar] [CrossRef]
  54. Leguen, C. Prior Austenite Grain Size Controlled by Precipitates. Ph.D. Thesis, Université de Lyon, Lyon, France.
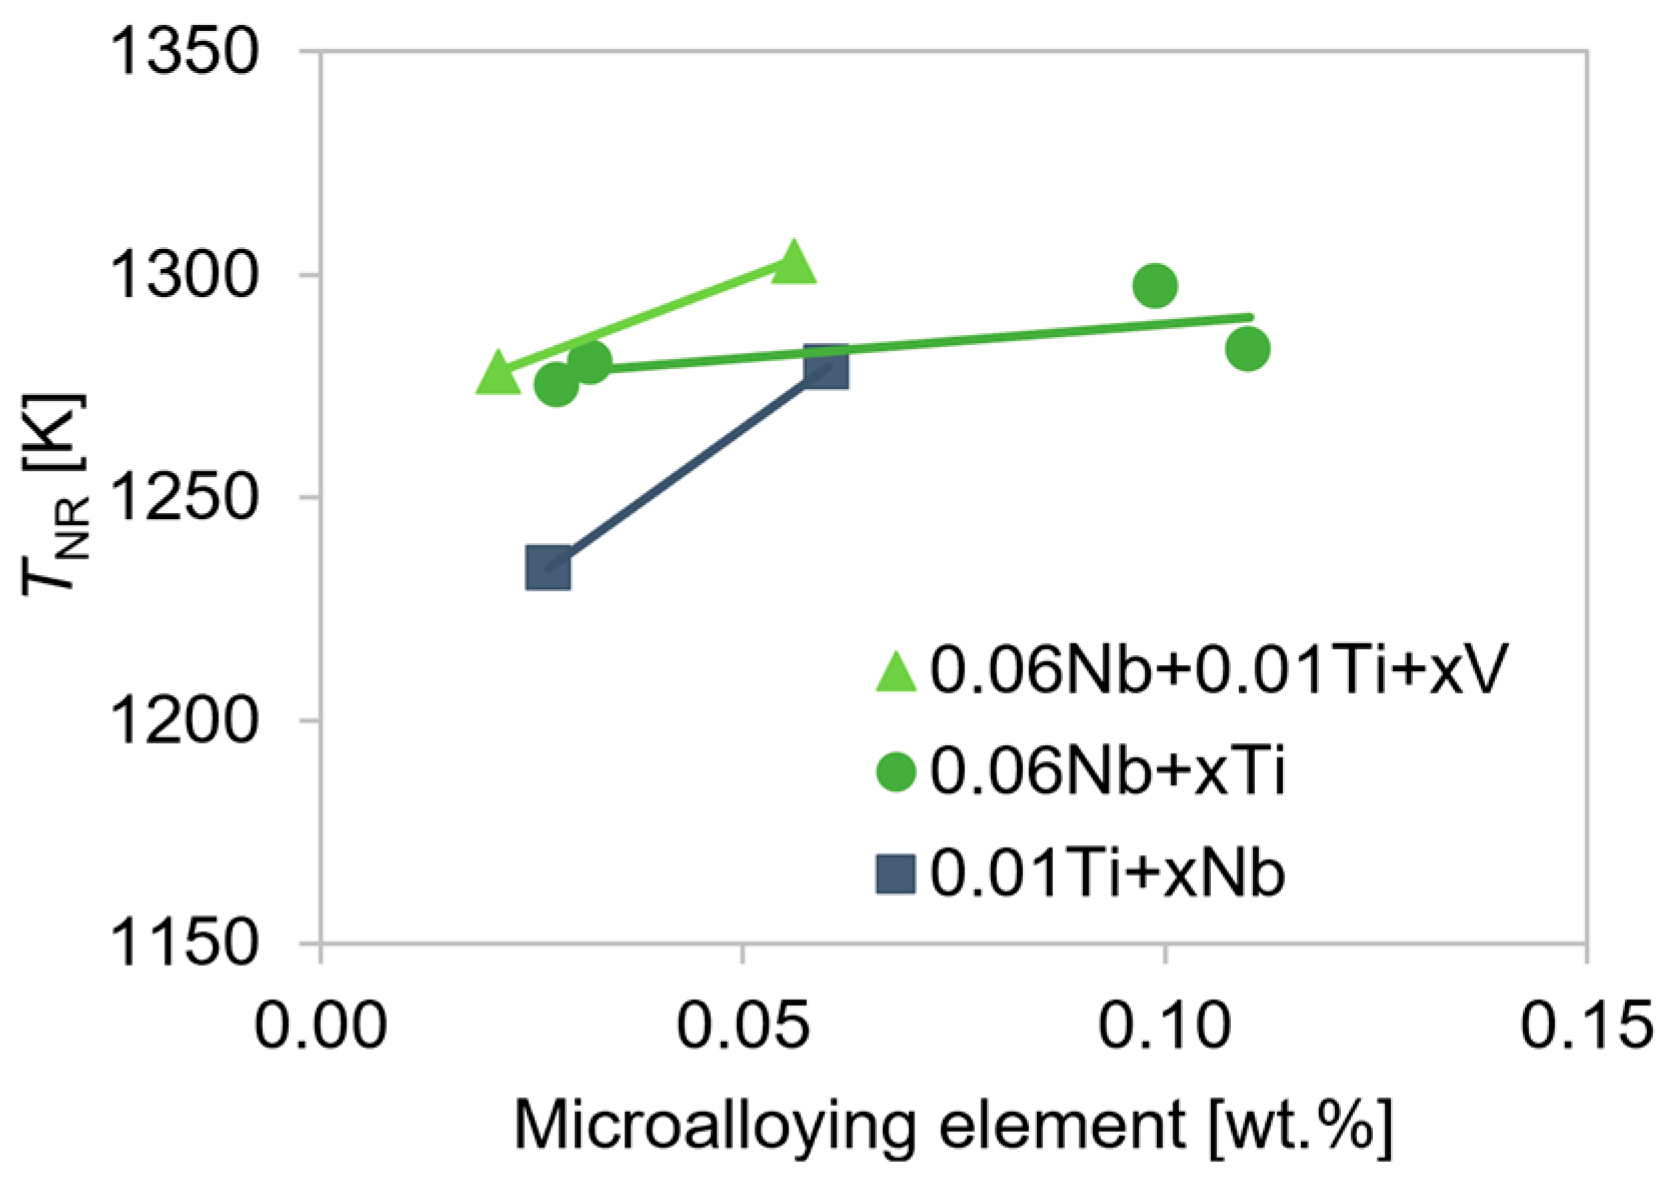
Figure 1. Impact of varying contents (x) of microalloying elements on TNR of microalloyed steels for deformation to φ = 0.2 and intermediate holding time of 5 s [25,27]. Lines are guides to the eye.
Metals 13 00884 g001
Figure 2. TSRCT of microalloyed steels for deformation to φ = 0.2 (continuous line) and φ = 0.35 (dashed line) [19,23,32,33,34,35]. Lines are guides to the eye.
Metals 13 00884 g002
Figure 3. TSRCT and TNR of Nb microalloyed steels for deformation to φ = 0.2 and varying intermediate holding times [16,19,22,33,34,35]. The line is a guide to the eye.
Metals 13 00884 g003
Figure 4. Thermo-mechanical rolling pattern for DHT.
Metals 13 00884 g004
Figure 5. Thermo-mechanical rolling pattern for continuous hot torsion tests.
Metals 13 00884 g005
Figure 6. ABC parameters used for isothermal compression tests with strain rate of 0.5 s−1. Lines are guides to the eye.
Metals 13 00884 g006
Figure 7. Flow curves of steel grade S5 during isothermal DHT with varying deformation temperatures and intermediate holding times. (a) 1373 K, 0.5 s−1, 0.3–30 s; (b) 1323 K, 0.5 s−1, 0.3–1000 s; (c) 1273 K, 0.5 s−1, 10–3000 s.
Metals 13 00884 g007
Figure 8. Evaluated TNR of steel grade S5 from isothermal DHT with 0.5 s−1 strain rate and 30 s interpass time (a); effect of deformation temperatures 1373–1273 K on softening fractions of steel grade S5 derived from isothermal double-hit compression tests with 0.5 s−1 strain rate (b). Dotted lines are guides to the eye.
Metals 13 00884 g008
Figure 9. Stress–strain curves of steel grade S1 (a) and dependence of MFS on inverse absolute temperature for steel grades S1–S5 corresponding to a 15-pass torsion sequence (bf). Lines are guides to the eye.
Metals 13 00884 g009
Figure 10. Determination of TNR from simulated isothermal compression tests with 0.5 s−1 strain rate to 0.2 strain for alloys S1–S5. Dotted lines are guides to the eye.
Metals 13 00884 g010
Figure 11. Effect of deformation temperatures on softening fractions of steel grades S1–S5, (ae), derived from simulated isothermal compression tests with 0.5 s−1 strain rate up to 0.2 strain.
Metals 13 00884 g011
Figure 12. Computed TTP curves for 5% precipitated fraction of individual MX phases for alloys S1–S5, (ae).
Metals 13 00884 g012
Figure 13. Comparison of TPS and TN from simulated TTP curves and TNR from simulated compression tests with 0.5 s−1 strain rate up to 0.2 strain to experimental TNR from hot torsion tests for alloys S1–S5.
Metals 13 00884 g013
Figure 14. Atomic fraction of microalloying elements in austenite (continuous lines) and softening fraction of austenite (dotted lines) during compression tests at respective simulated TNR of the alloy S1–S5, (ae). The vertical dashed lines indicate the start of deformation with 0.5 s−1 strain rate to 0.2 strain.
Metals 13 00884 g014
Figure 15. Comparison of experimentally determined recrystallization critical temperatures to values from semi-physical recrystallization simulation for alloys S1–S5.
Metals 13 00884 g015
Figure 16. Comparison of experimentally determined TNR from torsion tests and simulation to values calculated from empirical equations for alloys S1–S5. The red line indicates zero deviation between predicted and experimental TNR. Dotted lines are guides to the eye.
Metals 13 00884 g016
Table 1. Chemical composition of examined materials in wt.%.
Steel GradeCMnTiNbVCrAlSi
S10.151.270.010.010.070.200.030.22
S20.180.88<0.01<0.01<0.010.020.030.26
S30.201.40<0.01<0.010.100.020.020.30
S40.180.93<0.010.03<0.010.030.030.26
S50.211.45<0.010.040.100.030.030.50
Table 2. Parameter symbols and values for thermokinetic MatCalc simulations.
SymbolNameValueUnitSource
αStrengthening coefficient0.12-[36]
νPoisson’s ratio0.30-MatCalc default value
GShear modulus 193 , 000 73.33 · T [ ° C ] 2 ( 1 + ν ) MPaMatCalc default value
bBurgers vector2.50 × 10−10mMatCalc default value
MTaylor factor3.06-MatCalc default value
kBoltzmann constant1.381 × 10−23JK−1MatCalc default value
DeffEffective diffusion coefficient 6.4 x   10 2 exp ( 119 , 000 R T ) m2s−1MatCalc default value
DGBGrain boundary diffusion coeff. 7.9 x   10 1 exp ( 141 , 000 R T ) m2s−1MatCalc default value
DCBCross-boundary diffusion coeff.2∙DBm2s−1[50]
ρeq,intInternal equilibrium dislocation density1011m−2MatCalc default value
γHAGBHAGB-energy0.5Jm−3[51]
γLAGBLAGB-energy0.3Jm−3MatCalc default value
ωGrain boundary width1 × 10−9m[50]
ηHAGB,intFree HAGB-prefactor0.015-[48]
ηLAGB,intFree LAGB-prefactor10-MatCalc default value
ηHAGB,pinPinned HAGB-prefactor0.001-This work
ηLAGB,pinPinned LAGB-prefactor0.001-This work
kdPre-factor for coarsening2-This work
EB,TiBinding energy of Ti10,000Jmol−1[48]
EB,NbBinding energy of Nb11,000Jmol−1This work
EB,VBinding energy of V3000Jmol−1This work
Tcrit,MXHighest possible solution temperature of (Nb/Ti/V)(C,N) *3073/4073/2543KThis work
λMixing coefficient(1 − Xav)2-MatCalc default value
* Determined from equilibrium peak temperature of the miscibility gap of respective Fe-MX systems.
Disclaimer/Publisher’s Note: The statements, opinions and data contained in all publications are solely those of the individual author(s) and contributor(s) and not of MDPI and/or the editor(s). MDPI and/or the editor(s) disclaim responsibility for any injury to people or property resulting from any ideas, methods, instructions or products referred to in the content.