Article

Effects of Beam Shape on the Microstructures and Mechanical Properties during Thin-Foil Laser Welding

Department of Industrial Laser Technology, Korea Institute of Machinery & Materials, Busan 46744, Republic of Korea
*
Author to whom correspondence should be addressed.
Metals 2023, 13(5), 916; https://doi.org/10.3390/met13050916
Submission received: 14 March 2023 / Revised: 26 April 2023 / Accepted: 5 May 2023 / Published: 8 May 2023

Abstract

:
In this study, a fiber laser at a wavelength of 1070 nm with different beam shapes (spot, dough-nut, and spot-wobble) was used to weld thin 316 L stainless steel foils. The welding speed was varied from 400 to 1000 mm/s in the absence of shielding gas. The weld geometry, microstructure, lap shear strength, and crystallographic grain structure of the micro-joints were analyzed and correlated with the beam shape and welding speed. The results indicate that the laser beam shape significantly affected the weld width and penetration depth, and the best welding speed was 500 mm/s. This study proved for the first time that a spot-wobble laser beam could achieve better mechanical properties and microstructural characteristics than a doughnut beam during the high-power laser welding of thin-foil stainless steel plates.

1. Introduction

With the increasing emission of greenhouse gases, research on eco-friendly vehicles powered by hydrogen and electricity is being actively conducted to reduce the use of fossil fuels [1,2,3,4]. In particular, energy storage devices are the core technology of eco-friendly vehicles. Bipolar plates (BPPs) are an important component of fuel cells, and 316 L stainless steel is prominently used as a BPP material owing to its high mechanical strength, excellent corrosion properties, and reasonable price [5,6,7,8,9,10]. Laser welding is one of the most powerful methods to weld thin-foil stainless steel as it involves low heat input, a narrow welded area, high welding speed, and low distortion.
Various laser welding methods have been reported for thin films. For example, Jaehun Kim et al. studied the weldability of joining a 50 μm AM350 stainless steel onto a 1 mm 304 stainless steel using a 2 kW fiber laser and found that tensile strength and hardness were inversely proportional to the penetration depth [11]. Danny P’ng et al. [12] welded 60 μm thin 304 stainless steel foils by using two different welding methods. Compared with resistance seam welding, laser welding using a Nd:YAG laser required less than one-third of the heat input and produced welds with 50% narrower seams, 15% lower porosity, 25% higher bonding strength, and improved surface aesthetics. Pakmanesh et al. investigated the lap joints of 316 L stainless steel welded by using a Nd:YAG laser with a spot size of 0.2 mm. They reported that the underfill increased with increasing power and decreased with increasing pulse duration [10]. Das et al. welded multilayered thin foil 316 L stainless steel using a blue laser and revealed that blue laser welding could reduce discontinuities in the welded areas and improve the mechanical properties [1]. Ventrella et al. examined the influence of pulse energy of Nd:YAG laser on the characteristics of the weld fillet. The results showed that pulse energy control was important for weld quality because it could reduce discontinuities in thin-foil 316 L stainless steel weld joints and enhance the mechanical properties [13]. Tan et al. used a continuous wave (CW) fiber laser to study the laser keyhole welding of a thin-plate stainless steel stack and demonstrated that the welding speed and laser power were decisive factors for the penetration depth and welding productivity [14].
The above reports are typically based on two-layer lap welding using a spot laser beam. However, few studies have explored the correlation between the shape of the laser beam and the weldability of the laser. Therefore, this study changed the beam shape from spot, doughnut, to spot-wobble to weld thin plates of 316 L stainless steel (thickness of 0.08 mm) in a CW mode using a high-power laser in a lap configuration. The weld shape, microstructural characteristics and tensile strength were determined and correlated with the beam shape.

2. Materials and Methods

The materials used in this experiment were thin-foil 316 L stainless steel (0.08 mm thick, 60 mm wide, and 90 mm long). Their chemical compositions are listed in Table 1. Thin-foil welding could cause defects such as thermal distortion, fixturing the materials is one of the major important factors [13]. Therefore, in this study, a lap joint welding method was employed by fixing thin plates on a self-designed jig to minimize thermal deformation. Figure 1 shows the fiber setup and weld joint configuration of the STS 316 L thin foil.
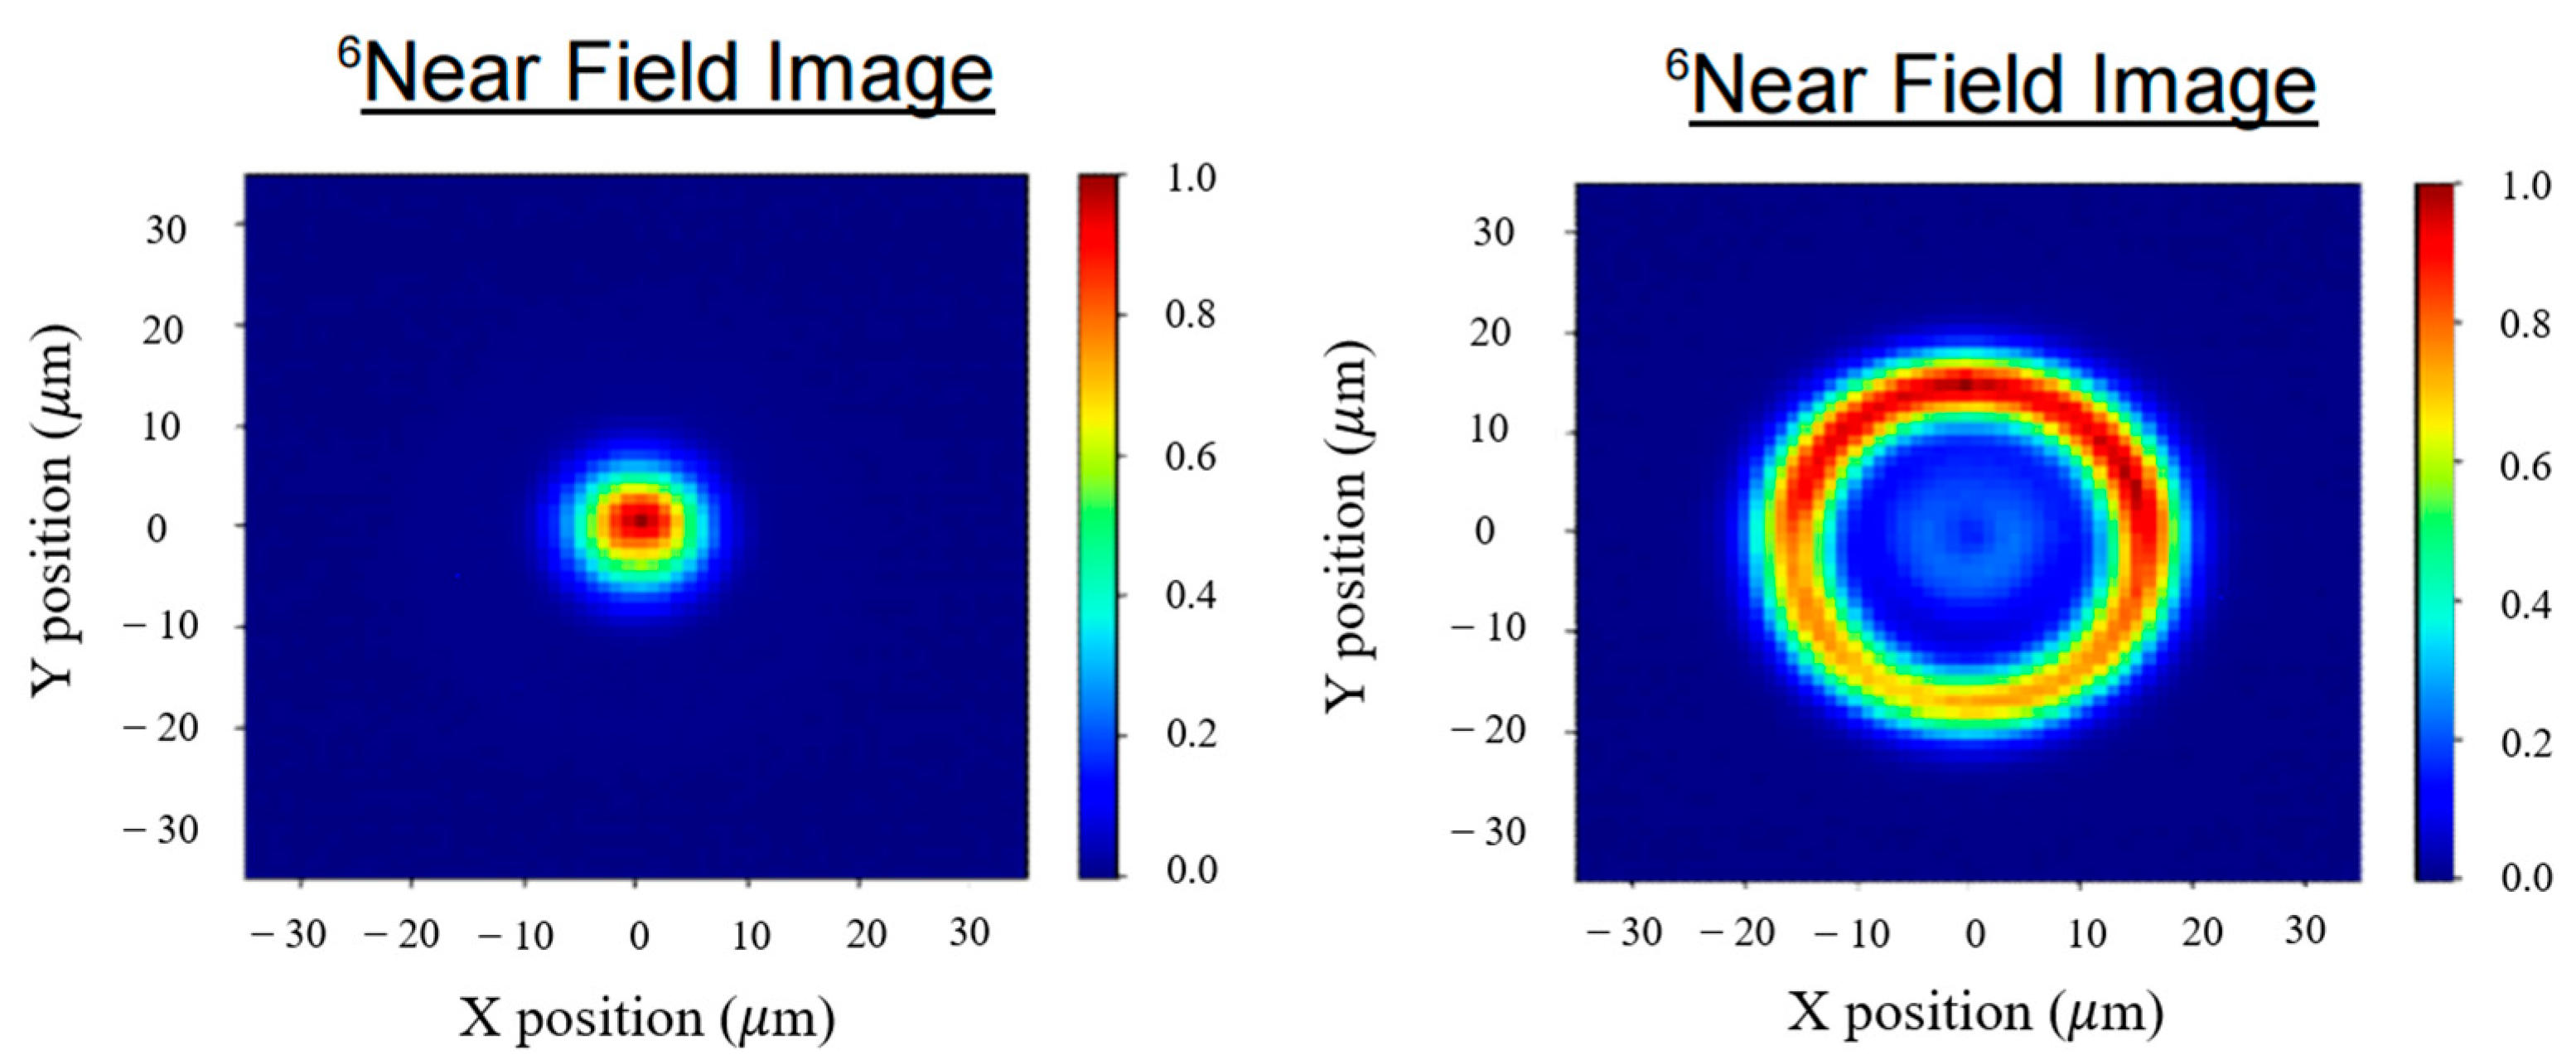
This study was performed in CW laser mode using a fiber laser source with a maxi-mum average output power of 1.2 kW (spot beam: 600 W, doughnut beam: 1.2 kW), and a scanner-type laser head was utilized to achieve the designated welding speed. The fiber laser used has a wavelength range of 1070 nm. Welding experiments were conducted with laser beams of various shapes, such as spot beam, doughnut beam, and spot wobble beam. Output power, energy density, spot size, and welding speed, according to each laser beam shape, are summarized in Table 2. As shown in Figure 2, the energy field images indicated the spot diameter was 16.6 μm in the spot laser beam, and the outer diameter was 40 μm and the core diameter was approximately 14 μm in the doughnut laser beam. In this study, due to the characteristics of the used laser, the donut beam could not be controlled perfectly, and about 14% of the center beam was weakly lost inside, as shown in the Figure 2. Therefore, in order to match the output power used in the doughnut to about 600 W as much as possible, a slightly higher output was inevitably used. For the spot wobble beam, the diameter was set to 26 μm to ensure it had a similar surface area as the doughnut beam. When the heat input per unit area was calculated, the energy density was 2.77 for the spot, 0.79 for the doughnut, and 1.99 for the spot-wobble beam. Five different welding speeds (400, 500, 600, 800, and 1000 mm/s) were used in the absence of shielding gas. For reliability, welding processes were carried out more than 10 times for each experimental condition.
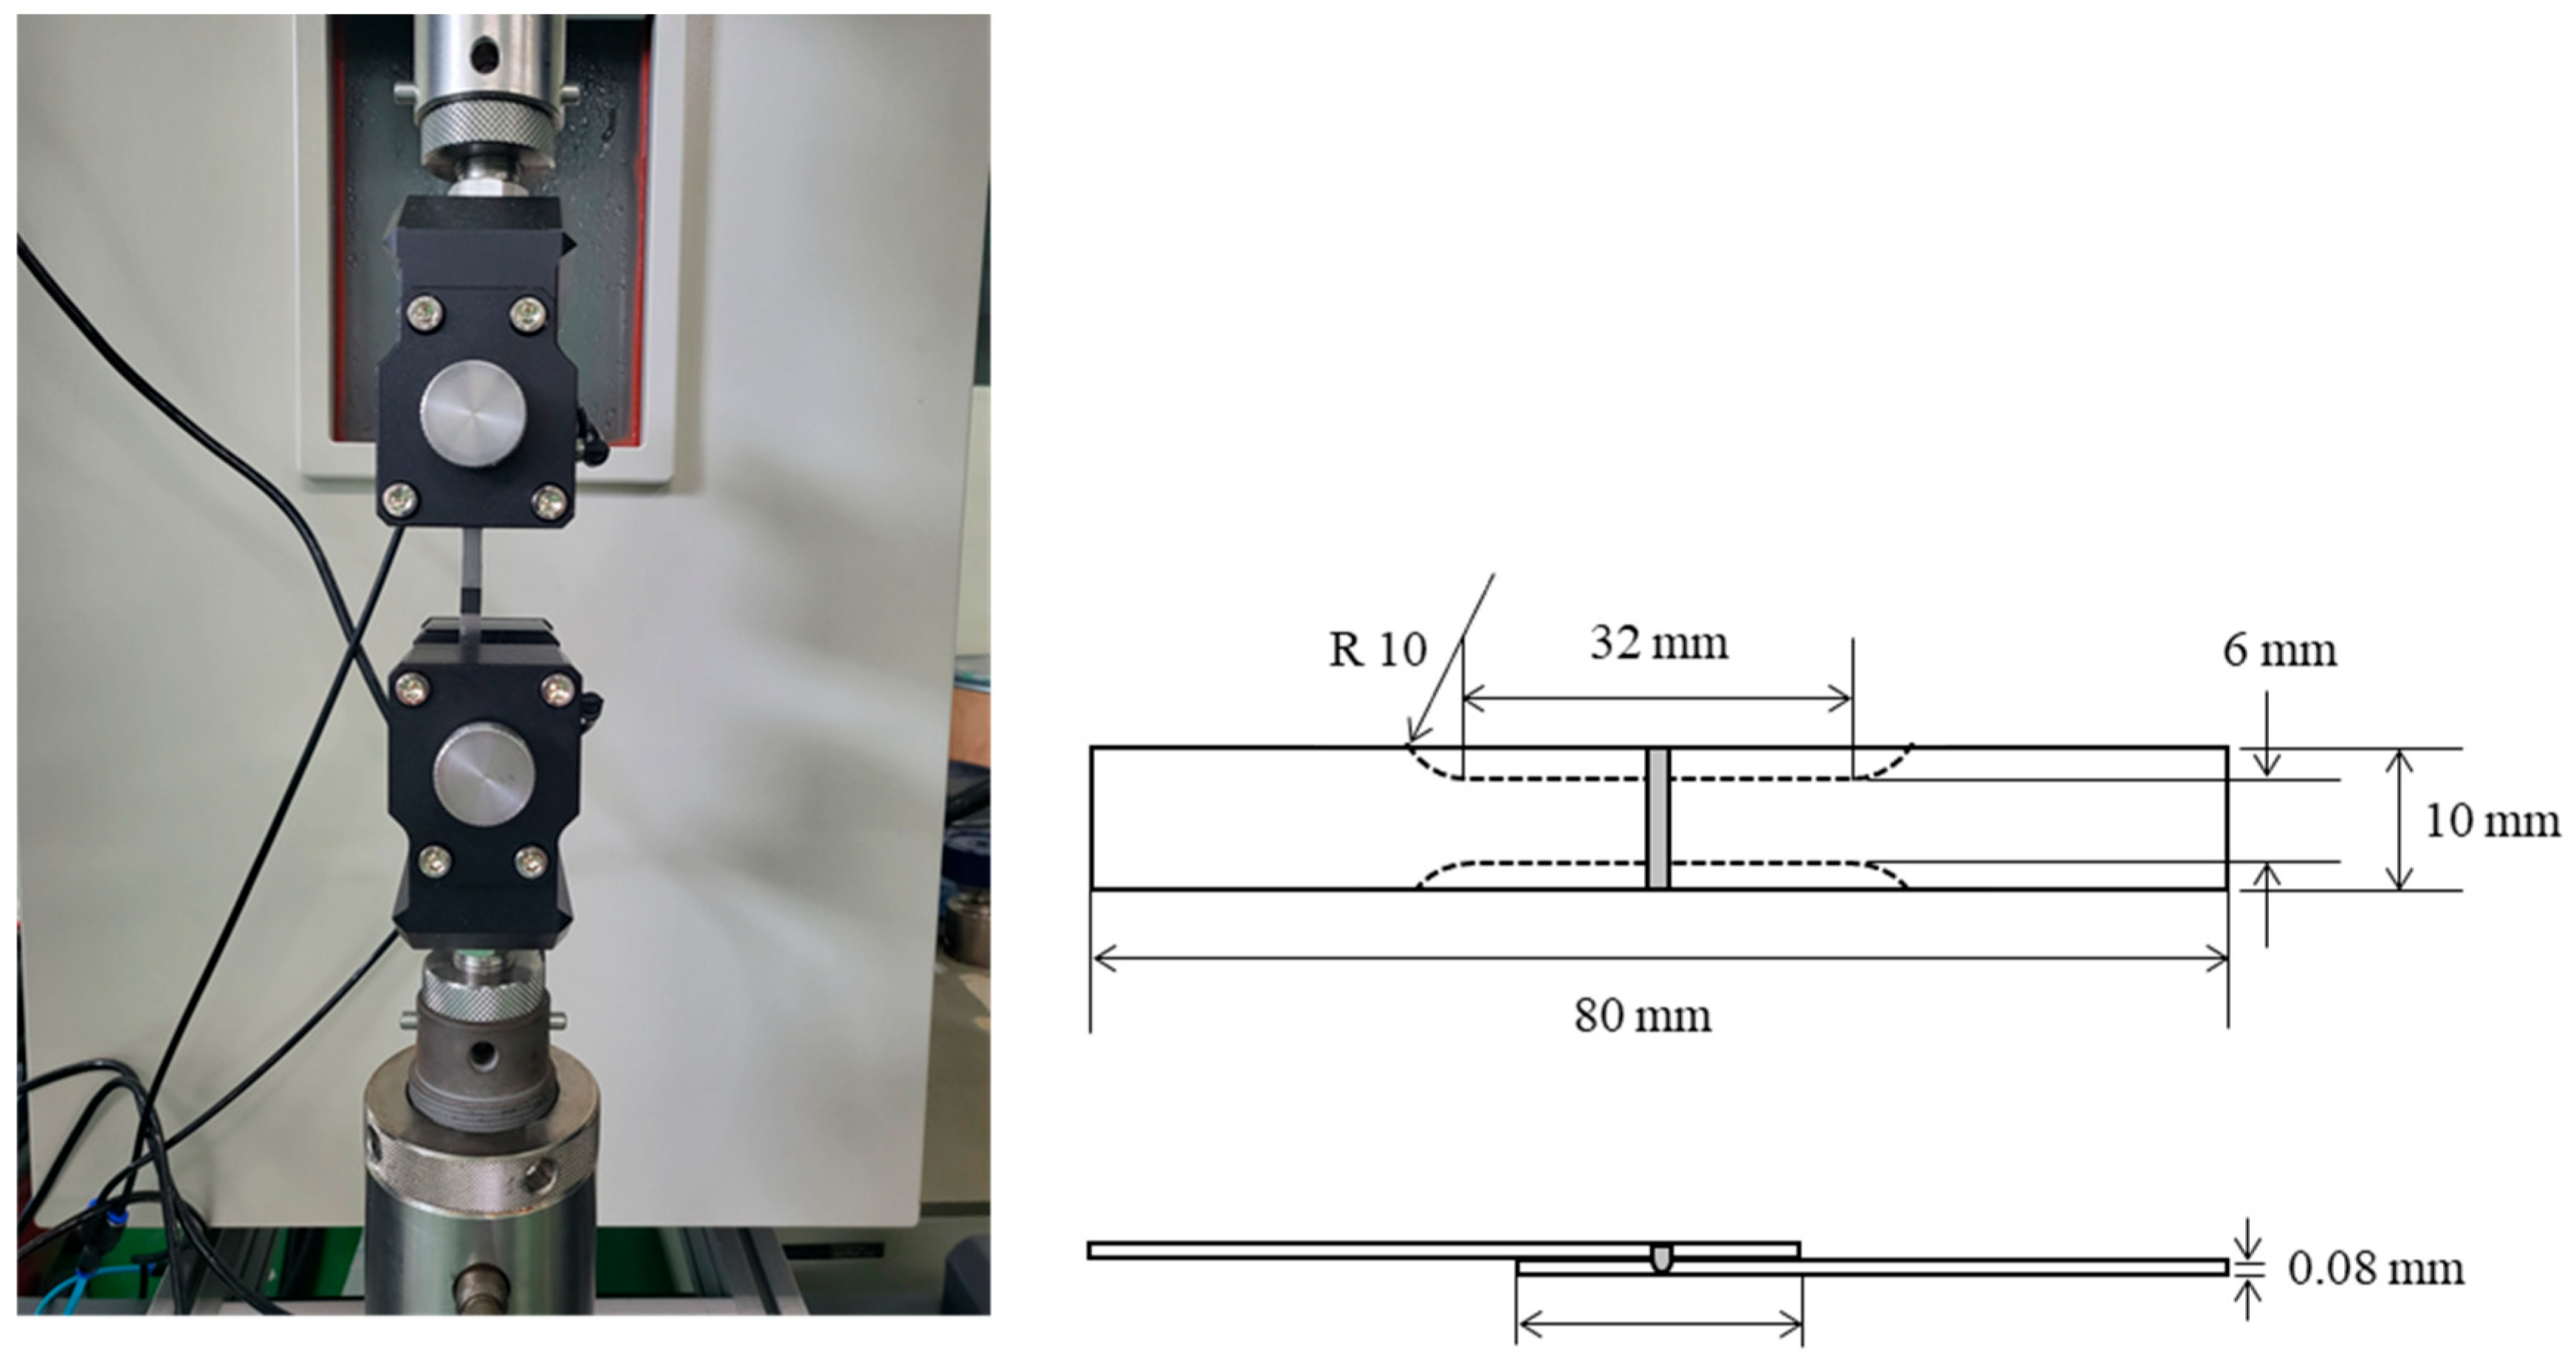
To examine the features of the welds obtained using different beam shapes, the weld bead geometry, weldability, microstructure, and mechanical properties were characterized. The surface and cross-section of the welds were observed under an optical microscope (OM) (Keyence, Osaka, Japan). The specimen was prepared by polishing and etching, then the cross-sectional welded image was observed at 1.5 mm from the welding start area. A laser microscope was used to measure the surface roughness. The microstructures were investigated by using electron backscatter diffraction (EBSD) (EDAX/TSL, Pleasanton, CA, USA) imaging, and the data were post-processed using the OIM software (ver.8.0, EDAX, Pleasanton, CA, USA). The EBSD specimens were prepared by mirror polishing and subsequent vibration polishing. To evaluate the mechanical properties of the thin-plate welds, the tensile strength was measured three times per condition. The tensile shear test specimen shape of the 316 L stainless steel welded joint was referenced with the ASTM E-8 standard [15]. After welding, the materials were cut into small specimens for the tensile shear tests. The schematic of the thin-foil-welded joint is shown in detail in Figure 3. In this study, the welded joints interface was considered for calculating the tensile shear strength.

3. Results and Discussion

3.1. Surface and Cross-Sectional Morphology of the Welded Area

Figure 4 shows the laser microscope images of the welded surfaces obtained by spot or doughnut laser beam. In both conditions, some defects, such as humping beads, were observed as the welding speed increased, and the molten pool was unstable at low welding speeds. In terms of surface morphology, welding at a speed of 400 mm/s had poor penetration. Increasing the speed to 600 mm/s created some humping beads. Figure 5 shows the enlarged surface of the welded part when the welding speed was 500 mm/s. No significant defects were observed in Figure 5, suggesting 500 mm/s was the best welding speed. The surface roughness was 3.19 for the spot beam and 4.59 for the doughnut beam. Figure 6 shows the surface of the laser-welded area at various welding speeds observed by an optical microscope. For three types of laser beam, the best surface condition was achieved when the welding speed was 500 mm/s. In spot and doughnut beam welding, defects, such as humping beads, were observed as the welding speed increased, whereas the spot-wobble beam welds had relatively minor surface defects. For the doughnut beam, poor penetration was observed at a welding speed of 1000 mm/s, as excessive heat input decreased energy density and the energy density was concentrated on the welding edge rather than on the central area. For spot-wobble welding at a speed of 1000 mm/s, the two foils could not be joined because of low energy density.
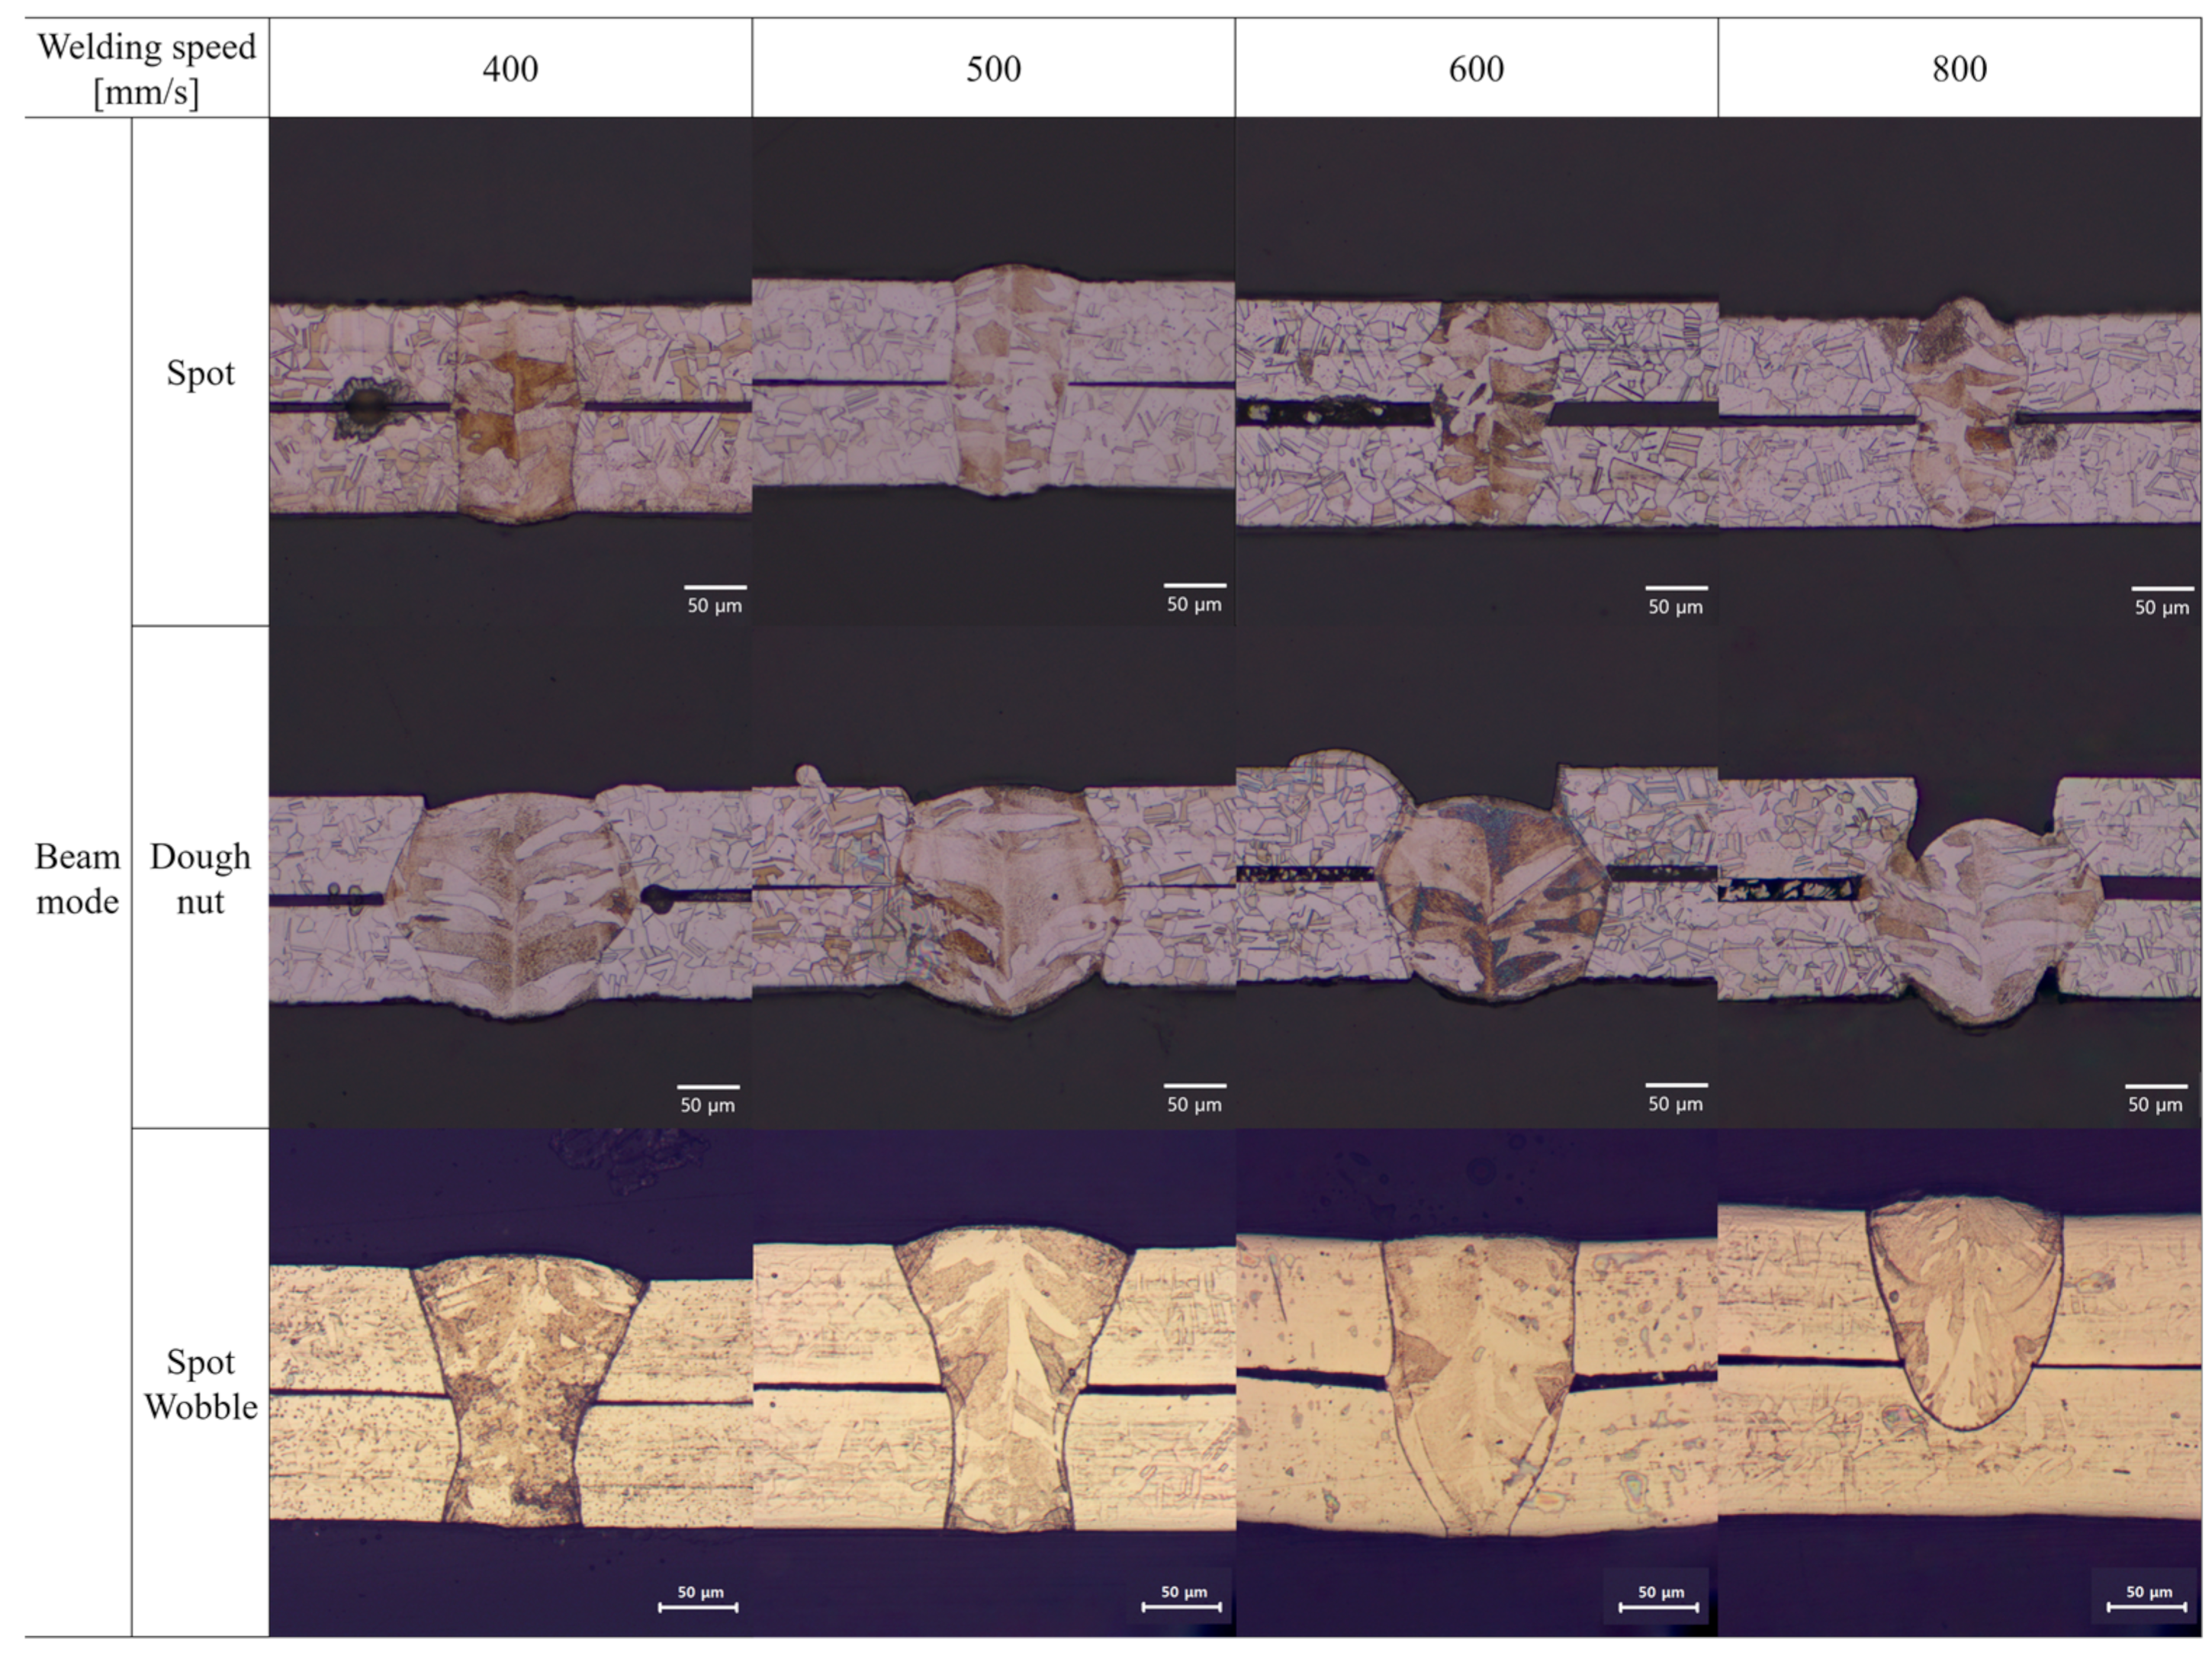
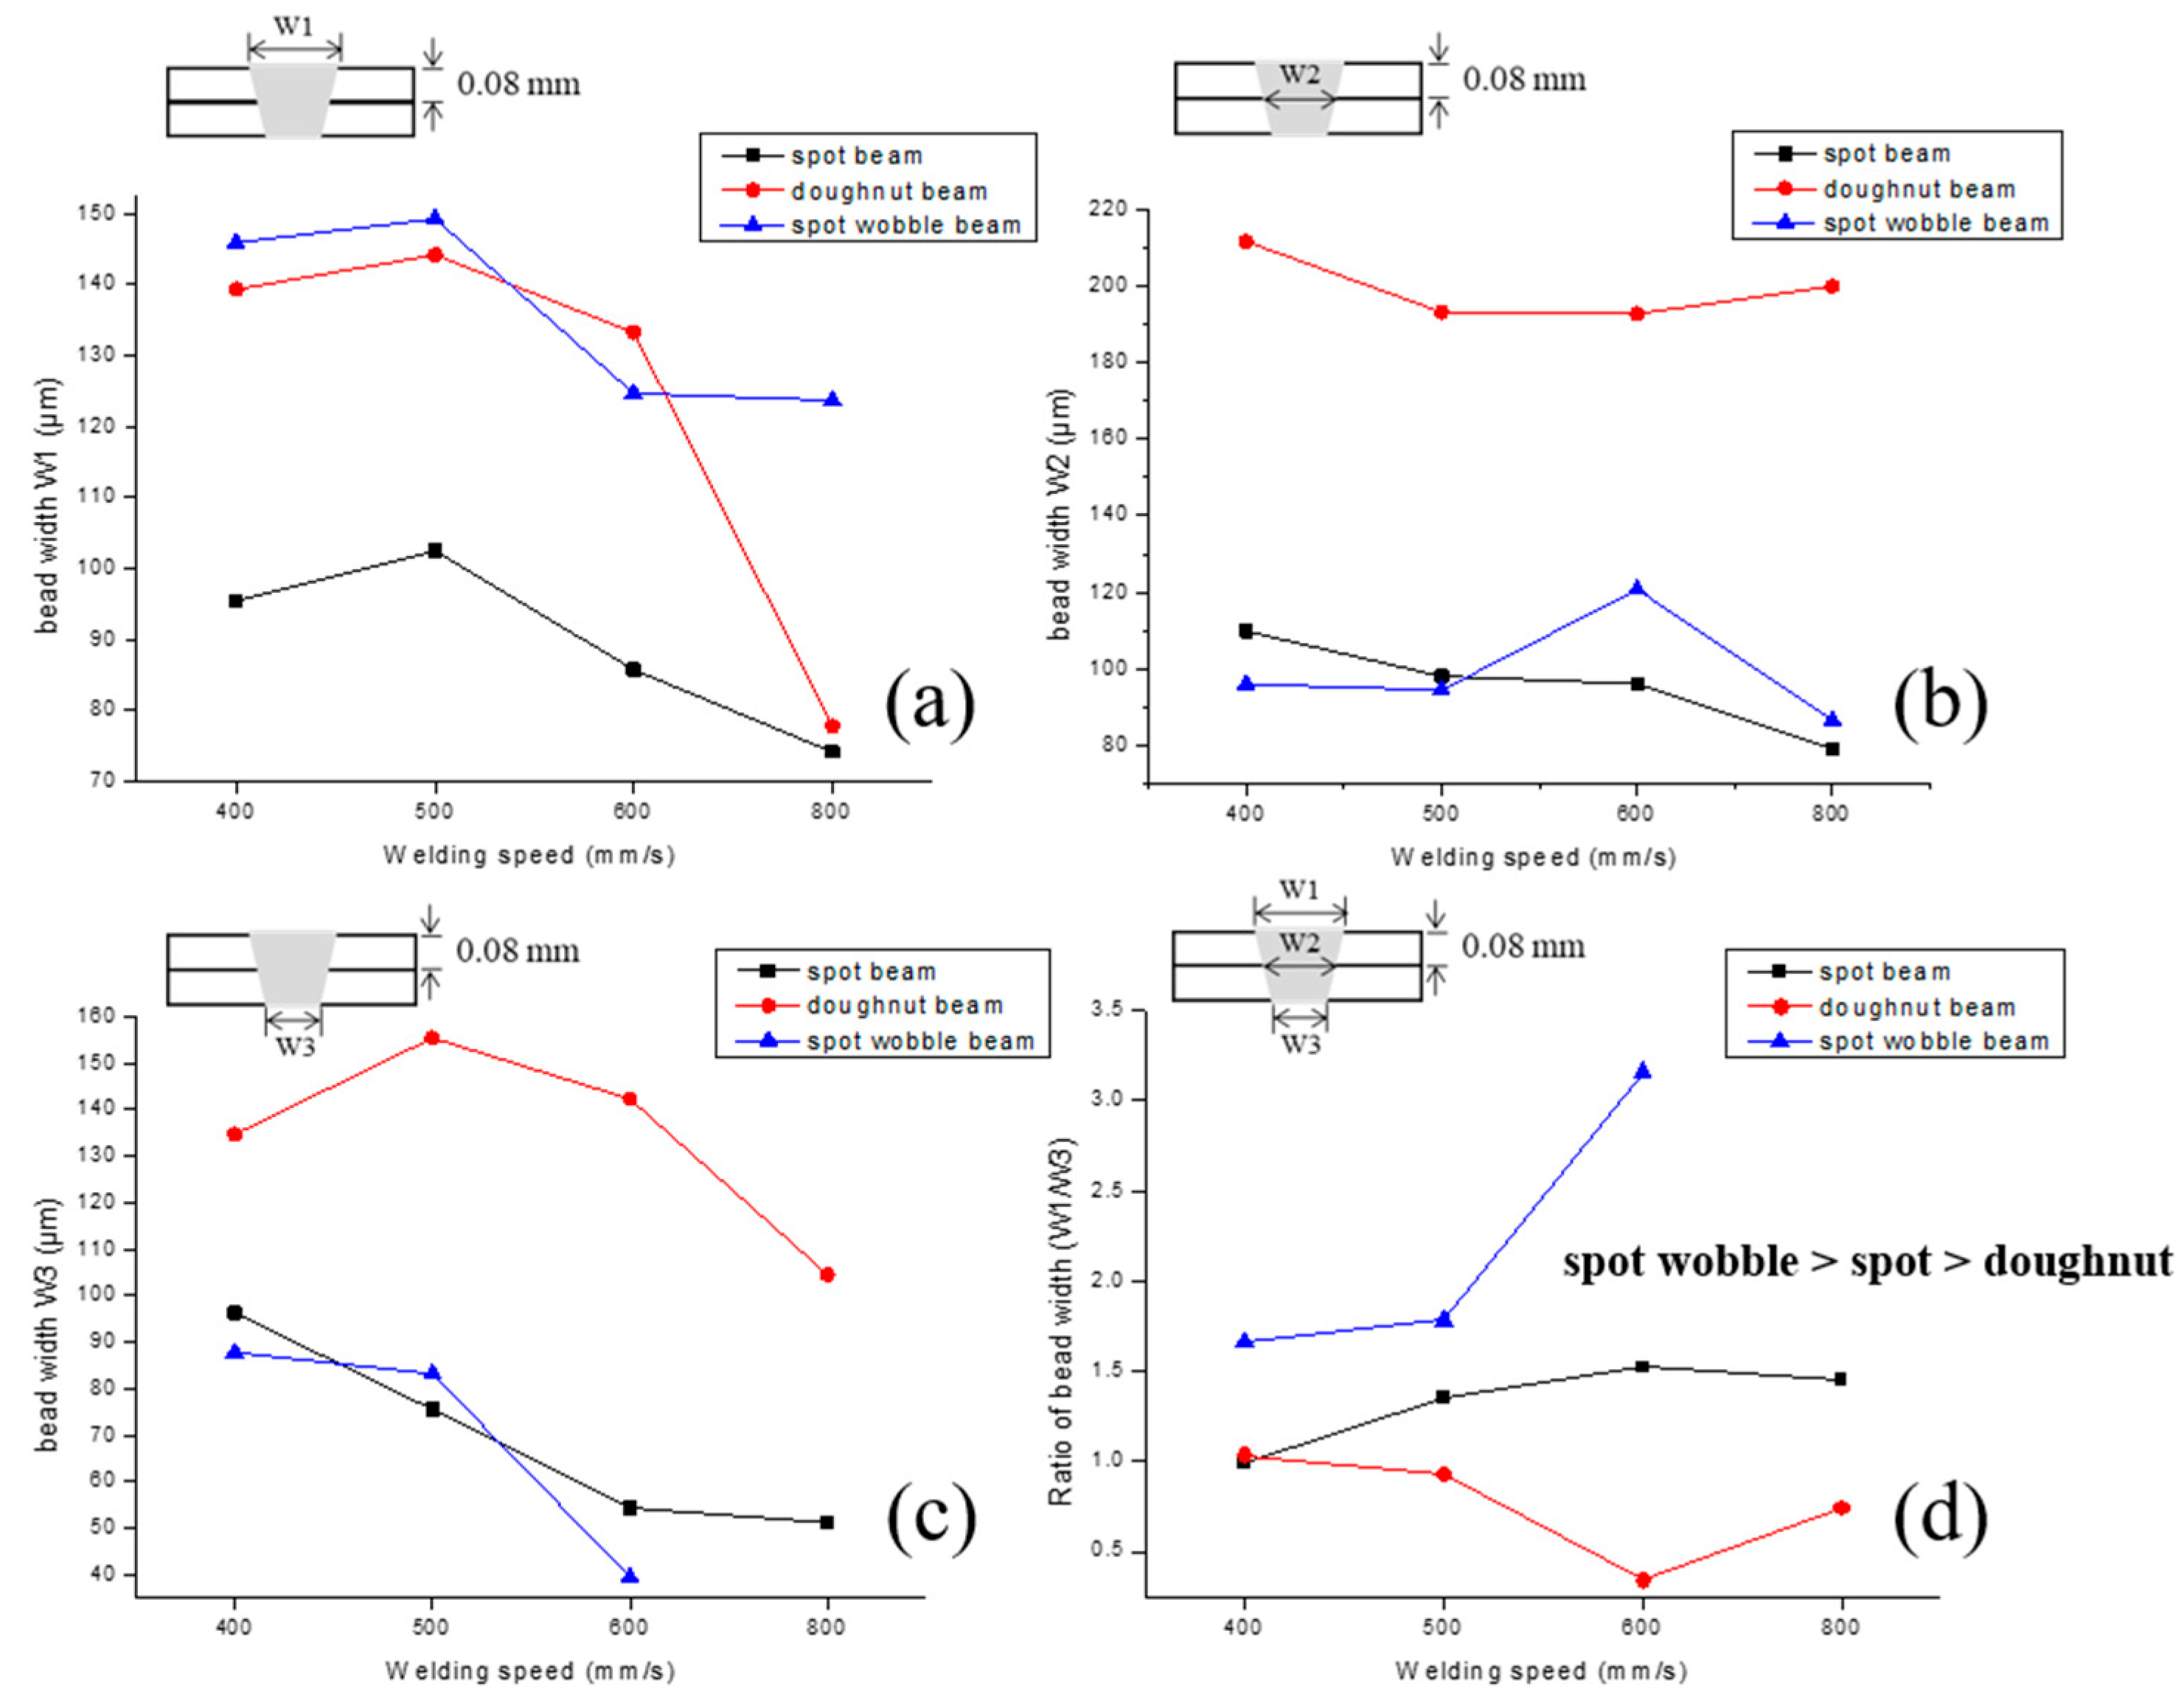
The cross-section of the welded area was observed to study the dependence of penetration depth and width on the shape of the laser beam. When the welding speed was 1000 mm/s, the penetration was poor; therefore, Figure 7 only shows the cross-sections obtained at lower welding speeds. The spot and spot-wobble beams exhibited superior welding qualities up to a welding speed of 600 mm/s, whereas the doughnut beam had poor welding quality at 600 mm/s. For all three conditions, the best cross-sectional state was found at a speed of 500 mm/s. As the welding speed increased, humping beads were prominently observed in spot-beam welds at 800 mm/s. In the case of the doughnut beam, a severe undercut was formed owing to excessive local heat input at the welding edge, implying that the molten metal could not spread before solidification at the high welding speed. For the spot beam, despite the energy density being approximately 2.5 times higher than that of the doughnut beam, the penetration was not deep at a speed of 800 mm/s. Thus, compared to the spot and spot-wobble beams, the doughnut beam could transmit energy to the bottom of the thin plate more effectively. Figure 8 shows the bead width in the cross-sectional image, and w1, w2, and w3 indicate the top, middle, and bottom widths of the bead. The doughnut beam generated the widest bead, and its top width decreased rapidly at 800 mm/s. For the spot-wobble beam, the top width was similar to that of the doughnut beam; however, as the speed increased, the penetration did not reach the bottom. In addition, the bottom width was narrower than the top width. The spot beam welding had the smallest bead widths. When the ratio of the top width to the bottom width was compared, the spot beam had a ratio close to 1, suggesting the penetration of the overall weld cross-section was straight. The spot-wobble beam had the sharpest penetration shape and the doughnut beam had a circular weld cross-section.

3.2. Mechanical Charateristics of the Welded Area

The tensile strengths of the welds obtained at various welding speeds using different laser beam shapes are shown in Figure 9. The determined tensile shear forces are calculated as the energy input per unit welded area. The tensile strength test was only conducted for welding speeds of 400, 500, and 600 mm/s because these welds exhibited excellent bonding conditions from the optical microscope observations. For reliability, the average value of the three measurements was reported. For welds obtained at welding speeds over 800 mm/s, the joint interface was separated when preparing tensile specimens.
If the welding speed was too high, some defects, such as undercuts, were generated because the molten pool did not have enough time to spread and incomplete penetration occurred at a rapid cooling rate. Consequently, the tensile strength decreased due to the formation of a partial molten pool as the welding speed increased. The highest tensile strength was achieved for the spot-wobble laser beam with a sharp penetration shape, whereas the doughnut laser beam, which had a circular weld shape, generated welds with the lowest tensile strength. In the case of the doughnut laser beam, the heating energy could be effectively transferred to the bottom of the thin plate despite the lowest energy density, owing to the special characteristics of the beam shape. However, in thin-plate welding, the tensile strength decreased with the penetration of deep energy into the overweld. Therefore, overheating had an adverse impact on thin-foil laser welding.
Figure 10 shows the enlarged image of the fracture surface after the tensile shear test of the welded specimen at 500 mm/s welding speed using different beam modes. Specimens using spot and spot-wobble beams had failures usually in the heat-affected zone, whereas the specimen using a doughnut beam had partial fractures in welded areas. This is because when the welding was performed with a doughnut laser beam, the quality of the welded part deteriorated relative to that of the other laser beam due to excessive heat input.
From the tensile shear test, it can be seen that the welding speeds from 400 mm/s to 500 mm/s using a spot-wobble laser beam had higher strength values. In addition, compared to Figure 7, this shows that the tensile shear strength has a higher value when the ratio of the top width to the bottom width is between 1.5 and 2.0. Then, when the ratio of the bead width is too high or too low, poor welding quality is obtained. Through this, it was found that the most ideal welding shape was obtained when the ratio of the upper width to the lower width of the welding cross section was 1.5 to 2.0, and the more circular the welding cross-section, the more undesirable the welding shape.

3.3. Microstructrue Characteristics of the Welded Area

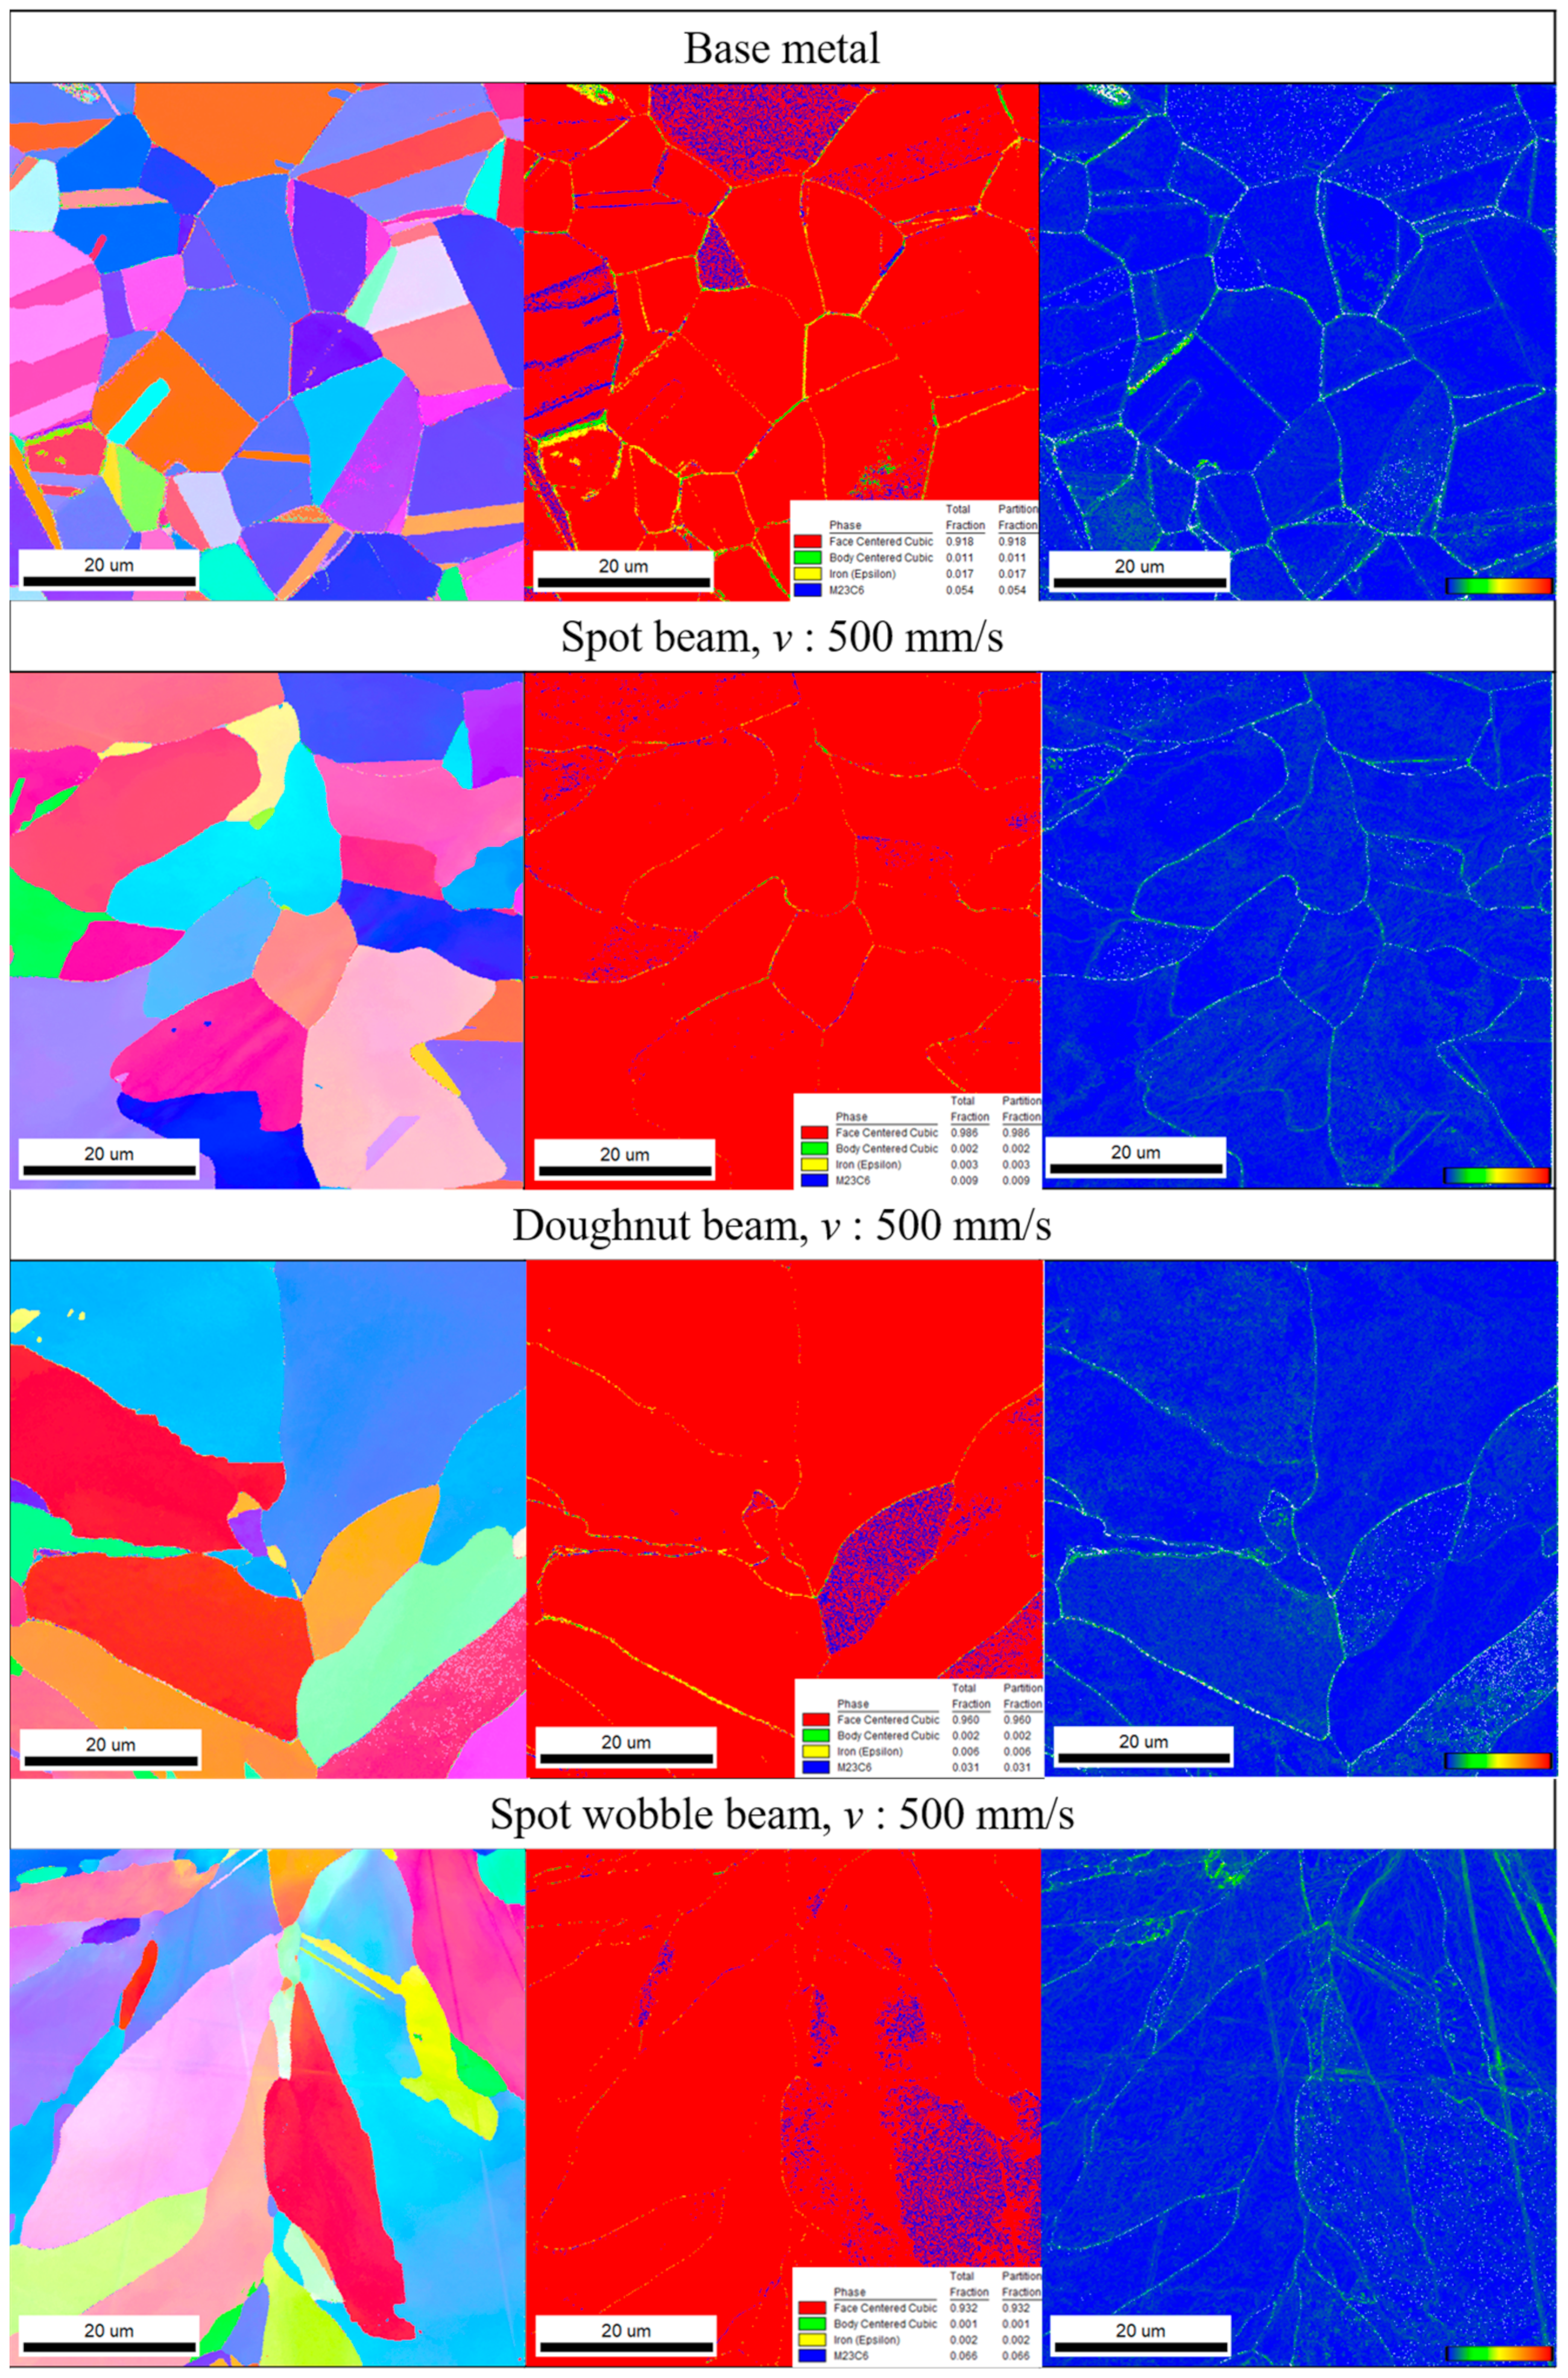
Considering the surface morphology, cross-sectional welding area, and tensile strength, the optimal welding speed was 500 mm/s. Therefore, in this section, the welding speed was fixed at 500 mm/s for comparing the welded microstructure in different laser beam shapes by carrying out EBSD. Figure 11 shows the inverse pole figure (IPF), image quality (IQ) map with grain boundaries (GBs) characterization, and kernel average misorientation map of the welding parts measured by EBSD.
As shown in Figure 11, for the weld performed with the spot laser beam, the average grain size was 14.93 μm under the spot-wobble laser beam, and the average grain size increased to 15.19 μm and further increased to 20.65 μm with the doughnut laser beam. It is indicated that the average grain size becomes coarser as the heat input increases. Although the energy density per unit area of the doughnut beam was the lowest among the laser beam modes in this study, the cooling rate was the lowest. This is considered to be due to the fact that the laser spot size is relatively large compared to the spot beam, and the energy tends to concentrate on the edge of the laser beam due to the characteristics of the donut beam. Figure 11b,e,h) display GB character maps illustrating the low-angle grain boundaries (LAGBs), random high-angle grain boundaries (HAGBs), and CSL boundary content. The blue lines indicate HAGBs (θ > 15°), the red and green lines indicate LAGBs (2° < θ < 15°), and the yellow lines indicate coincidence site lattice (CSL) boundaries. GBs were classified into three types of boundaries that are the most common geometric modes: CSL, LAGB, and HAGB [16,17,18,19]. LAGB and CSL boundaries (3 ≤ ∑ ≤ 29), have been noted to have some beneficial properties, such as corrosion resistance, because they have lower grain boundary energy than HAGB [20,21,22,23]. Therefore, since the crystallographic texture control greatly influences the mechanical properties and corrosion behavior of engineering alloys, it is necessary to investigate the grain boundary characteristics. The LAGB fraction of the spot-beam-welded specimen, as shown in Figure 11b, was found to be 0.038; the HAGB fraction was 0.701; and the CSL fraction was 0.178. The LAGB fraction of the donut-beam-welded specimen was 0.154; the HAGB fraction was 0.542; and the CSL fraction was 0.077. The LAGB fraction of the spot-wobble beam was 0.111; the HAGB fraction was 0.452; and the CSL fraction was 0.079. It was shown that the fractions of HAGB and CSL decrease as the heat input increases during welding, similar to previous studies [24]. Instead, the fraction of LAGB increased with the longer cooling time. This is attributed to the fact that the columnar grains could be coarsened in weld beads, but dislocations can climb, and dynamic recovery is more likely to occur, creating a large number of substructure grains [23,25]. Therefore, since the fractions of CSL and HAGB decreased and the fraction of LAGB increased, it is considered that there is no significant difference in the corrosion characteristics of the welded part, according to the cooling rate of each beam mode. Figure 11c,f,i show KAM value maps obtained from EBSD measurements. In the figure, blue areas represent populations of recrystallized or relatively unstrained grains, whereas green areas represent relatively deformed or substructure grains. The spot-wobble laser beam generated the highest residual stress, which can be attributed to the promotion of nucleation due to the slow cooling rate of multi-pass welding. In particular, it can be seen that the spot-wobble beam has a larger residual stress due to thermal deformation on the surface of the weld bead because welding is repeated several times due to the characteristics of the wobble beam. On the other hand, in the case of the donut beam, residual stress and LAGB tend to be concentrated in the center of the weld bead, which is considered to be because the cooling rate in the central weld bead is relatively slow and nucleation is promoted in that area. In addition, the grains of the weld zone in each beam started from the end of the weld area and grew to its center. Grain development occurred during the cooling process of the weld along the temperature gradient [26,27,28], implying that the cooling rate in the center was lower than that at the edge of the weld part. Figure 12 shows an enlarged area of the center of the weld part. The average grain size was 9.2 μm for the base material, 16.51 μm for the spot-beam material, 16.38 μm for the spot-wobble beam material, and 21.40 μm for the doughnut beam material, indicating that the average grain size in the center was larger than the whole average grain size. Therefore, the cooling rate in the central weld area of the doughnut beam was the slowest compared to the other beam modes. The phase map showed that carbides were formed at the center of the doughnut-beam-welded specimen, indicating that the doughnut beam had a slower cooling rate and higher heat input at the center of the weld than the spot-beam laser.
Figure 13 indicates the boundary, which is the heat-affected zone and weld zone of the spot-beam specimen, spot-wobble beam, and doughnut beam specimen, respectively, in detail. The spot-beam specimen had a smaller average grain size (11.24 μm) than the doughnut-beam specimen (12.66 μm) and spot-wobble beam (15.69 μm), owing to its rapid cooling rate. Moreover, the heat-affected zone had a smaller average grain boundary size than the central part because the cooling rate was relatively fast owing to easy heat diffusion. However, in the case of the spot-wobble beam, it can be seen that the cooling rate in the HAZ is relatively slow. This is because, as mentioned above, welding is performed multiple passes due to the characteristics of the wobble beam. In particular, using a spot-wobble beam specimen, as seen in the IQ and KAM maps, strain due to thermal deformation can be observed at the top of the bead.
From the EBSD observations, the energy per unit area of the doughnut beam was lower than that of the spot beam; however, its overall cooling rate was slower than that of spot beam. Thus, the doughnut beam was superior to the spot beam in terms of energy transfer efficiency. However, the 316 L stainless steel foil was too thin, and the heat input was excessive, so an unstable molten pool was generated in the central welded zone, suggesting that the doughnut-shaped laser beam might not be suitable for thin plates. In addition, in the case of the spot-wobble beam, the cooling rate is similarly slow to that of the donut beam, but thermal deformation and substructure grains are concentrated on the upper part of the weld bead. Therefore, excessive energy transfer does not occur relative to the bottom of the weld bead.

4. Conclusions

This study demonstrated the suitability of various laser beam shapes (spot, doughnut, and spot-wobble beam) to weld thin foils used in fuel cells, and the welding speed was varied to control the heat input. The following conclusions were drawn from the results.
  • The thin 316 L stainless steel plate is very difficult to weld because of its welding deformation and loss of molten metal. For ultra-high-speed laser welding of thin plates, a high-power laser could be used to reduce the heat-affected zone and the molten pool. From this, a superior laser welding condition for thin plate was deduced in this study. The optimal welding speed was 500 mm/s.
  • If the welding speed was too high, some defects, such as undercuts, were generated because the molten pool did not have enough time to spread and incomplete penetration occurred at a rapid cooling rate. In spot and doughnut beam welding, defects, such as humping beads, were observed as the welding speed increased, whereas the spot-wobble beam had relatively minor surface defects.
  • As a result of the microstructure investigation, the doughnut-beam-welded joint had the largest average grain size among the experimental conditions. This is due to the slow cooling rate, which causes high heat input despite its low energy density.
  • When the ratio of the bead top width to the bead bottom width was compared, the spot beam had a ratio close to 1, suggesting the penetration of the overall weld cross-section was straight. The spot-wobble beam had the sharpest penetration shape, and the doughnut beam had a circular weld cross-section. The spot-wobble beam could achieve the highest tensile strength and was the optimal beam shape for stainless steel sheet welding.
  • As the heat input increased during welding, the fractions of HAGB and CSL decreased. Moreover, the proportion of LAGB increased with a longer cooling time.
It should be noted that this research only provides an explanation of the morphology of the welding joint and correlation of the laser beam shape, and there is still a lack of in-depth investigation of their relationship. Therefore, a detailed microstructural evaluation while using different beam shapes will be proposed in future work.

Author Contributions

Conceptualization, D.S. (Danbi Song) and R.K.; methodology, D.S. (Danbi Song) and S.L.; software, D.S. (Danbi Song); validation, D.S. (Danbi Song), R.K. and K.C.; formal analysis, D.S. (Danbi Song); investigation, D.S. (Danbi Song); resources, D.S. (Danbi Song) and S.L.; data curation, D.S. (Danbi Song) and D.S. (Dongsig Shin); writing—original draft preparation, D.S. (Danbi Song); writing—review and editing, D.S. (Danbi Song) and S.L.; visualization, D.S. (Danbi Song) and K.C.; supervision, D.S. (Dongsig Shin); project administration, S.L. and D.S. (Dongsig Shin); funding acquisition, S.L. and D.S. (Dongsig Shin). All authors have read and agreed to the published version of the manuscript.

Funding

This work was supported by “Technology platform for advanced laser beam process of metallic fuel cell plates” (code: P0012884, Eurostars2) of KIAT (Korea Institute for Advancement of Technology).

Data Availability Statement

The raw/processed data required to reproduce these findings cannot be shared at this time as the data also form part of an ongoing study.

Acknowledgments

This work was supported by “Welding technology development using coaxial dual beam and visible laser” (code: 20012887) of KEIT (Korea Evaluation Institute of Industrial Technology) and National Research Council of Science and Technology, Republic of Korea (grant numbers NK244A, 2023).

Conflicts of Interest

The authors declare no conflict of interest.

References

  1. Das, A.; Fritz, R.; Finuf, M.; Masters, I. Blue laser welding of multi-layered AISI 316L stainless steel micro-foils. Opt. Laser Technol. 2020, 132, 106498. [Google Scholar] [CrossRef]
  2. Wang, Y.; Chen, K.S.; Mishler, J.; Cho, S.C.; Adroher, X.C. A review of polymer electrolyte membrane fuel cells: Technology, applications, and needs on fundamental research. Appl. Energy 2011, 88, 981–1007. [Google Scholar] [CrossRef]
  3. Tu, Z.; Zhang, H.; Luo, Z.; Liu, J.; Wan, Z.; Pan, M. Evaluation of 5 kW proton exchange membrane fuel cell stack operated at 95 °C under ambient pressure. J. Power Sources 2013, 222, 277–281. [Google Scholar] [CrossRef]
  4. Dubal, D.P.; Ayyad, O.; Ruiz, V.; Gómez-Romero, P. Hybrid energy storage: The merging of battery and supercapacitor chemistries. Chem. Soc. Rev. 2015, 44, 1777–1790. [Google Scholar] [CrossRef] [PubMed]
  5. Wang, Y.; Northwood, D.O. An investigation into TiN-coated 316L stainless steel as a bipolar plate material for PEM fuel cells. J. Power Sources 2007, 165, 293–298. [Google Scholar] [CrossRef]
  6. Cho, K.; Lee, W.; Lee, S.; Jang, H. Corrosion resistance of chromized 316L stainless steel for PEMFC bipolar plates. J. Power Sources 2008, 178, 671–676. [Google Scholar] [CrossRef]
  7. Zhao, Y.; Wei, L.; Yi, P.; Peng, L. Influence of Cr-C film composition on electrical and corrosion properties of 316L stainless steel as bipolar plates for PEMFCs. Int. J. Hydrogen Energy 2016, 41, 1142–1150. [Google Scholar] [CrossRef]
  8. Larijani, M.; Yari, M.; Afshar, A.; Jafarian, M.; Eshghabadi, M. A comparison of carbon coated and uncoated 316L stainless steel for using as bipolar plates in PEMFCs. J. Alloys Compd. 2011, 509, 7400–7404. [Google Scholar] [CrossRef]
  9. Jin, J.; Zhang, J.; Hu, M.; Li, X. Investigation of high potential corrosion protection with titanium carbonitride coating on 316L stainless steel bipolar plates. Corros. Sci. 2021, 191, 109757. [Google Scholar] [CrossRef]
  10. Pakmanesh, M.; Shamanian, M. Optimization of pulsed laser welding process parameters in order to attain minimum underfill and undercut defects in thin 316L stainless steel foils. Opt. Laser Technol. 2018, 99, 30–38. [Google Scholar] [CrossRef]
  11. Kim, J.; Kim, S.; Kim, K.; Jung, W.; Youn, D.; Lee, J.; Ki, H. Effect of beam size in laser welding of ultra-thin stainless steel foils. J. Mater. Process. Technol. 2016, 233, 125–134. [Google Scholar] [CrossRef]
  12. P’ng, D.; Molian, P. Q-switch Nd:YAG laser welding of AISI 304 stainless steel foils. Mater. Sci. Eng. A 2008, 486, 680–685. [Google Scholar] [CrossRef]
  13. Ventrella, V.A.; Berretta, J.R.; de Rossi, W. Pulsed Nd:YAG laser seam welding of AISI 316L stainless steel thin foils. J. Mater. Process. Technol. 2010, 210, 1838–1843. [Google Scholar] [CrossRef]
  14. Tan, W.; Shin, Y.C. Laser keyhole welding of stainless steel thin plate stack for applications in fuel cell manufacturing. Sci. Technol. Weld. Join. 2015, 20, 313–318. [Google Scholar] [CrossRef]
  15. ASTM E8M-04; Standard Test Methods for Tension Testing of Metallic Materials (Metric) 1. ASTM International: West Conshohocken, PA, USA, 2004.
  16. Hou, J.; Peng, Q.; Lu, Z.; Shoji, T.; Wang, J.; Han, E.-H.; Ke, W. Effects of cold working degrees on grain boundary characters and strain concentration at grain boundaries in Alloy 600. Corros. Sci. 2011, 53, 1137–1142. [Google Scholar] [CrossRef]
  17. Lu, Z.; Shoji, T.; Yamazaki, S.; Ogawa, K. Characterization of microstructure, local deformation and microchemistry in Alloy 600 heat-affected zone and stress corrosion cracking in high temperature water. Corros. Sci. 2012, 58, 211–228. [Google Scholar] [CrossRef]
  18. Brandon, D.G. The structure of high-angle grain boundaries Structure de joints de grains a grands angles Die struktur von groβwinkelkorngrenzen. Acta Metall. 1966, 14, 1479–1484. [Google Scholar] [CrossRef]
  19. Gertsman, V.; Bruemmer, S. Study of grain boundary character along intergranular stress corrosion crack paths in austenitic alloys. Acta Mater. 2001, 49, 1589–1598. [Google Scholar] [CrossRef]
  20. Tikhonova, M.; Kuzminova, Y.; Fang, X.; Wang, W.; Kaibyshev, R.; Belyakov, A. Σ3 CSL boundary distributions in an austenitic stainless steel subjected to multidirectional forging followed by annealing. Philos. Mag. 2014, 94, 4181–4196. [Google Scholar] [CrossRef]
  21. Randle, V. Twinning-related grain boundary engineering. Acta Mater. 2004, 52, 4067–4081. [Google Scholar] [CrossRef]
  22. Michiuchi, M.; Kokawa, H.; Wang, Z.; Sato, Y.; Sakai, K. Twin-induced grain boundary engineering for 316 austenitic stainless steel. Acta Mater. 2006, 54, 5179–5184. [Google Scholar] [CrossRef]
  23. Zhang, J.; Xu, L.; Han, Y.; Zhao, L.; Xiao, B. New perspectives on the grain boundary misorientation angle dependent intergranular corrosion of polycrystalline nickel-based 625 alloy. Corros. Sci. 2020, 172, 108718. [Google Scholar] [CrossRef]
  24. Han, L.; Han, T.; Chen, G.; Wang, B.; Sun, J.; Wang, Y. Influence of heat input on microstructure, hardness and pitting corrosion of weld metal in duplex stainless steel welded by keyhole-TIG. Mater. Charact. 2021, 175, 111052. [Google Scholar] [CrossRef]
  25. Zhang, J.; Hu, K.; Zhao, J.; Duan, S.; Zhan, X. Effect of heat input on microstructure and corrosion resistance in heat affected zone of 304 stainless steel joint by laser welding. Mater. Today Commun. 2022, 30, 103054. [Google Scholar] [CrossRef]
  26. Xiong, J.; Yang, X.; Lin, W.; Liu, K. Microstructural characteristics and mechanical heterogeneity of underwater wet friction taper plug welded joints for low-alloy pipeline steel. Mater. Sci. Eng. A 2017, 695, 279–290. [Google Scholar] [CrossRef]
  27. Raja, V.S.; Shoji, T. Stress Corrosion Cracking: Theory and Practice; Woodhead Publishing: Cambridge, UK, 2011; pp. 427–484. [Google Scholar]
  28. Song, D.; Choi, J.; Shin, D.; Lee, S.-J. Relationship between Microstructure and Corrodibility of Local Dry Underwater Laser Welded 304 Stainless Steel. Metals 2022, 12, 1904. [Google Scholar] [CrossRef]
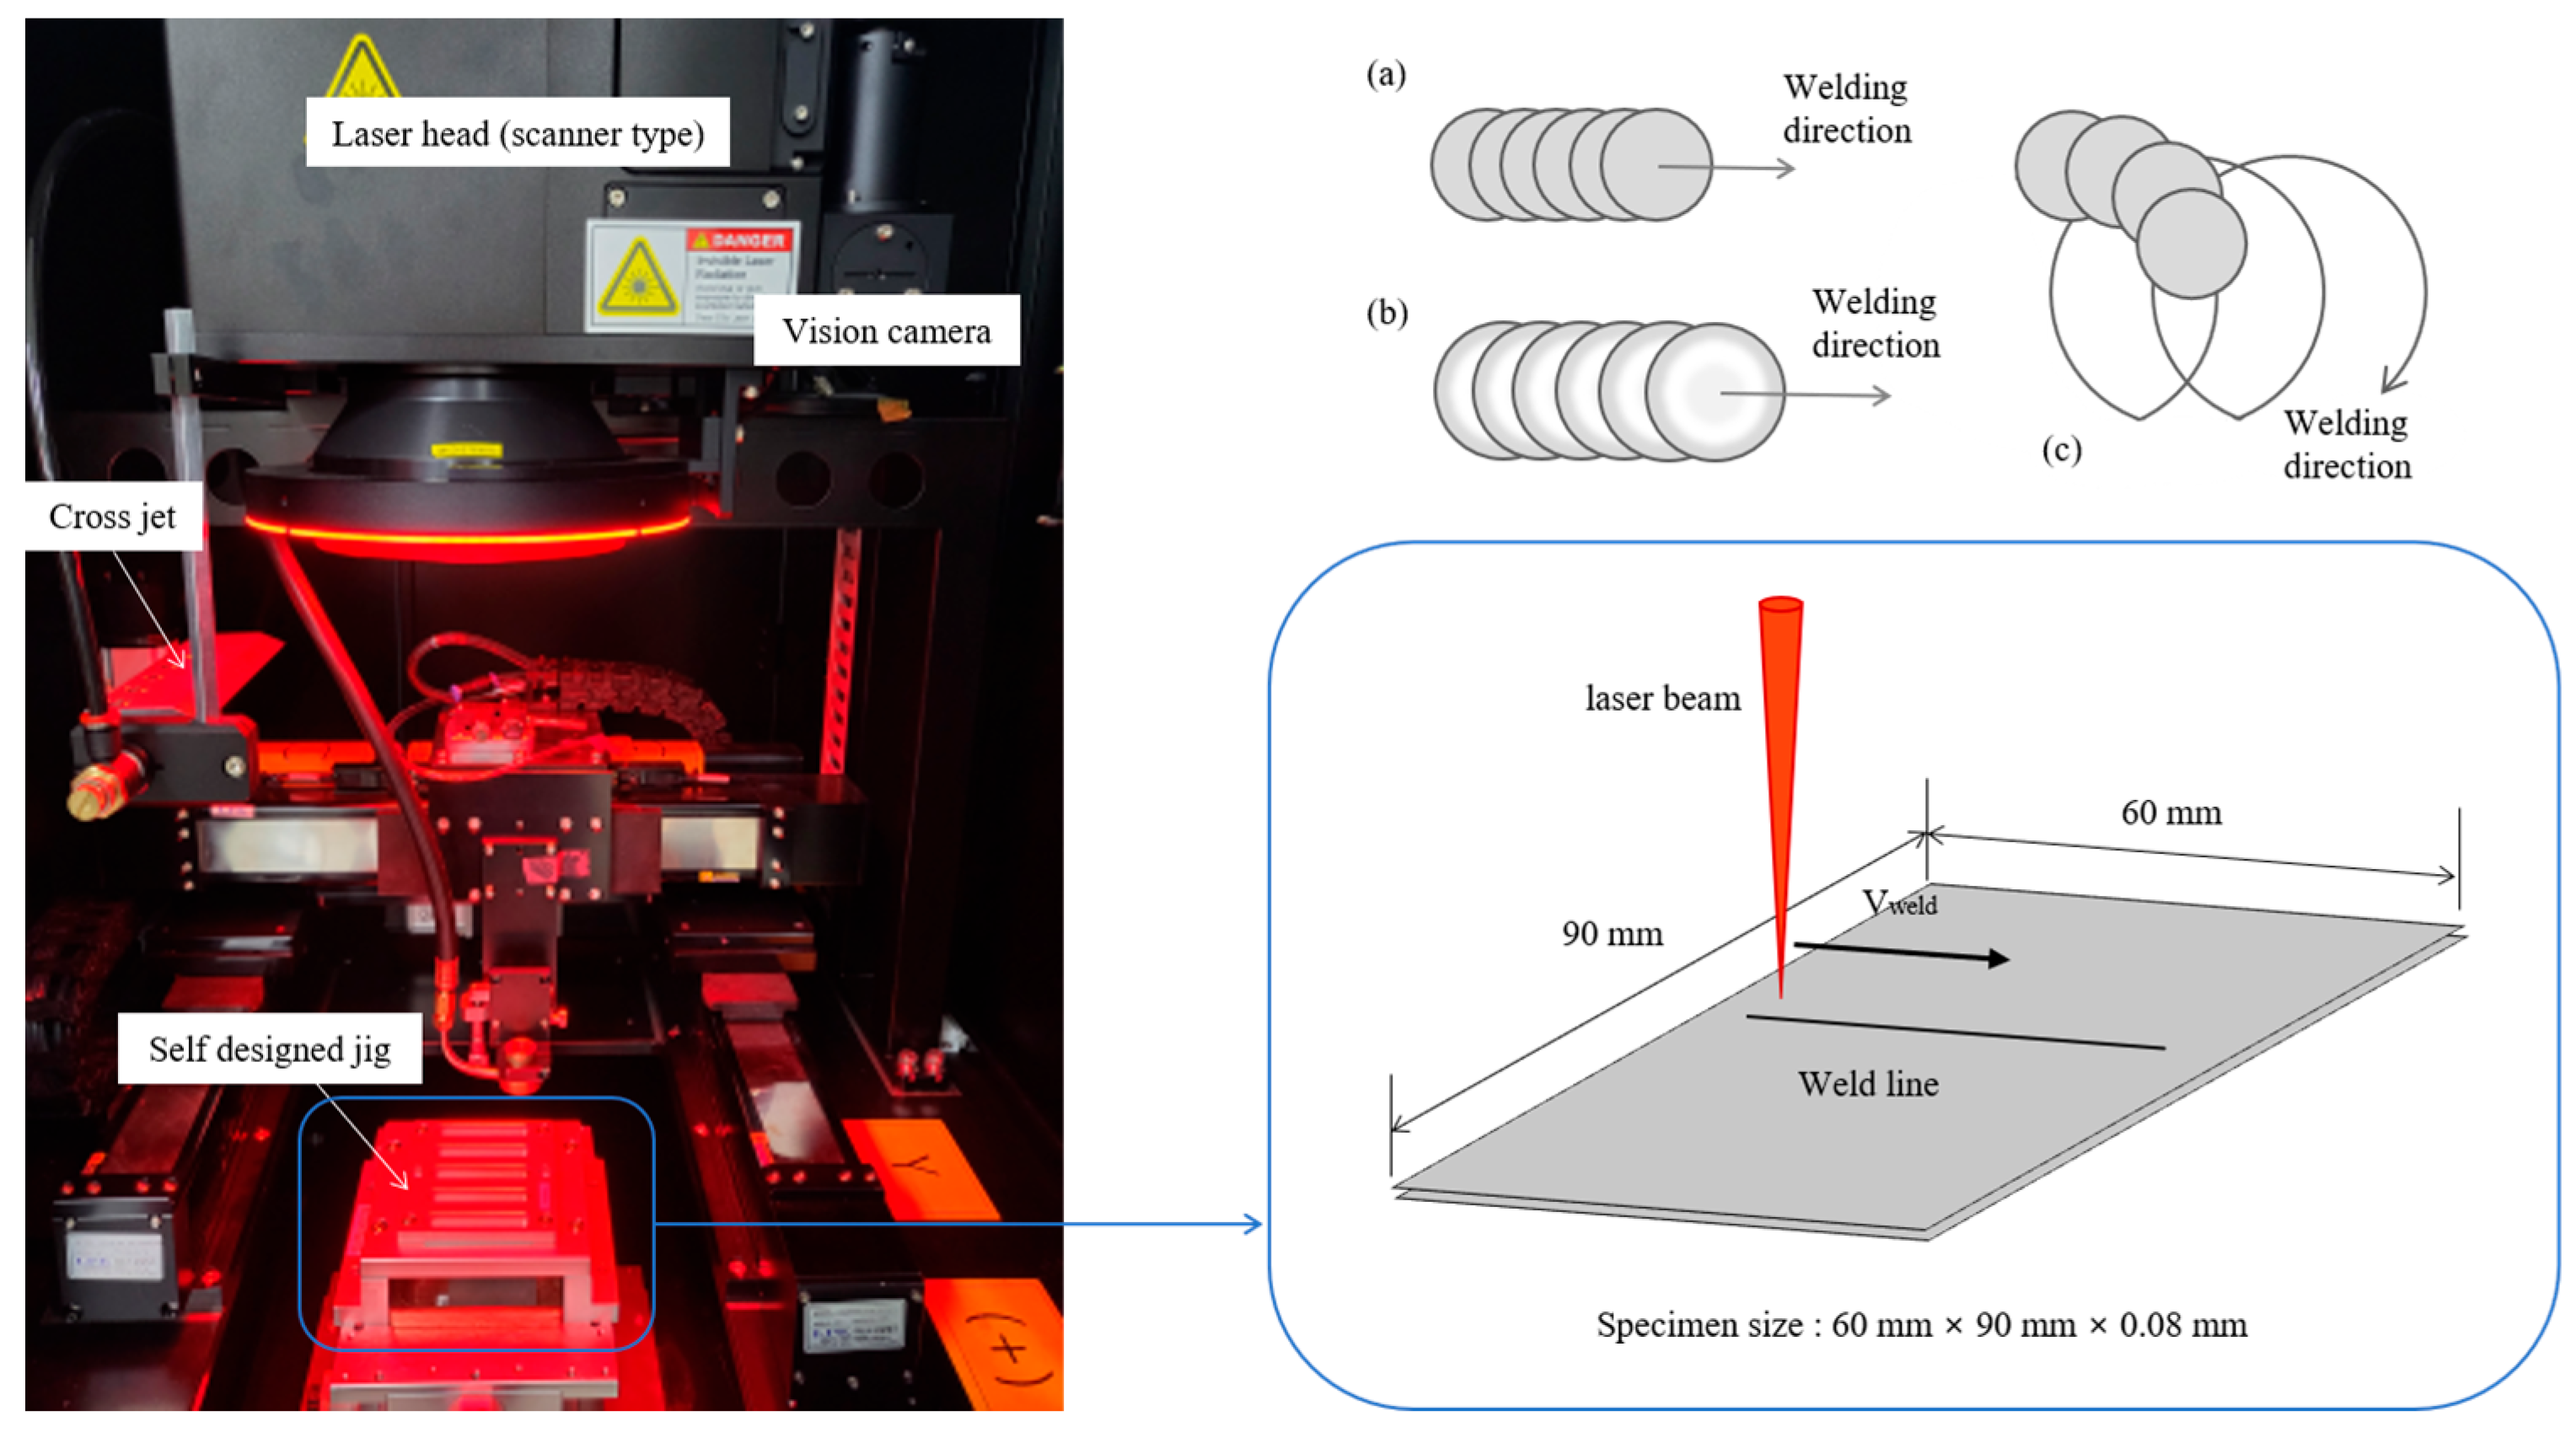
Figure 1. Set-up of fiber laser welding and joint configuration of STS 316 L thin foil and welding direction (a) spot laser welding, (b) doughnut laser welding, and (c) wobble laser welding.
Metals 13 00916 g001
Figure 2. Programed intensity profiles of a spot laser beam (left) and a doughnut laser beam (right).
Metals 13 00916 g002
Figure 3. Schematic diagram of STS 316 L thin-foil-welded specimen for tensile shear test.
Metals 13 00916 g003
Figure 4. Microscopic topography of the laser-welded surfaces obtained by spot and doughnut beams at different welding speeds.
Metals 13 00916 g004
Figure 5. Enlarged microscopic topography image of the laser-welded surface at 500 mm/s welding speed using spot and doughnut beams.
Metals 13 00916 g005
Figure 6. Microscopic photographs of the welded 316 L stainless steel surfaces at various welding speeds using different laser beam shapes.
Metals 13 00916 g006
Figure 7. Cross-sectional images of the welding beads at various welding speeds and beam shapes.
Metals 13 00916 g007
Figure 8. Cross sectional weld bead width as a function of welding speed (a) top, (b) middle, (c) bottom, and (d) ratio of the bead width.
Metals 13 00916 g008
Figure 9. Tensile strength of the welded joints obtained at various laser beam shapes and welding speeds.
Metals 13 00916 g009
Figure 10. Photographs before and after representative tensile shear tests of specimens welded at a speed of 500 mm using different beam modes and enlarged figures of fracture surface.
Metals 13 00916 g010
Figure 11. EBSD maps of the cross-sectional weld bead (a) inverse pole figure (IPF), (b) image quality (IQ) map with grain boundaries (GBs) characterization, (c) kernel average misorientation map (KAM) in spot-beam laser welding, (d) IPF, (e) IQ map with GB characterization, (f) KAM map in doughnut beam laser welding, (g) IPF, (h) IQ map with GB characterization, and (i) KAM map in spot-wobble beam laser welding.
Metals 13 00916 g011
Figure 12. Enlarged EBSD maps of the center of the weld bead for various laser beam shapes.
Metals 13 00916 g012
Figure 13. Enlarged EBSD maps of the heat-affected zone of the welds at speed of 500 mm/s using various laser beam shapes.
Metals 13 00916 g013
Table 1. Chemical compositions (wt.%) of 316 L stainless steel.
MetalFeCrNiMoMnSiOthers
STS 316 L67.316.76122.061.130.69C:0.02, P:0.032,
S:0.001
Table 2. Welding Conditions.
Beam ModeSpotDoughnutSpot-Wobble
Out power [W]600742600
Energy density [W/µm2]2.770.791.99
Spot   size   [ μ m ]16.6Ring 40
Core 23
16.6
Welding speed [mm/s]400, 500, 600, 800, and 1000
Disclaimer/Publisher’s Note: The statements, opinions and data contained in all publications are solely those of the individual author(s) and contributor(s) and not of MDPI and/or the editor(s). MDPI and/or the editor(s) disclaim responsibility for any injury to people or property resulting from any ideas, methods, instructions or products referred to in the content.