Abstract
The effect of the distribution of the primary phase Si and TiB2 particles in the hypereutectic Al-Si alloy was studied and found to be influenced by the cooling rate. Therefore, this article studies the effect of the cooling rate on the multi-phase structure of TiB2 particles in Al-20Si using a wedge-shaped mold. The sizes, shapes, and distribution of primary phase Si and TiB2 particles inside primary phase Si were observed through SEM. The effect of TiB2 particles on cracks in primary phase Si was studied using nanoindentation technology, and the interface relationship between primary Si and TiB2 was studied using TEM. Finally, based on the experimental results, the trapping mechanism of primary Si for TiB2 particles is discussed. The results indicate that the faster the cooling rate, the finer and more uniform the size distribution of the primary Si phase in the structure. TiB2 mostly exists as individual particles. Moreover, the pushing rate of the solid–liquid interface during solidification is faster, resulting in more TiB2 particles being engulfed by the primary Si phase.
1. Introduction
There are many benefits to hypereutectic Al-Si alloys, namely excellent wear resistance, thermal stability, and a low coefficient of thermal expansion [1]. Practically, it can replace cast iron and steel, as well as other materials used in automotive engine parts, achieving a lighter weight [2,3]. In a typical cast state, the eutectic Al-Si alloys and eutectic silicon are distributed in a coarse needle-like shape within the matrix, while in hypereutectic Al-Si alloys, in addition to eutectic silicon, there is also a primary silicon phase. The primary phase of Si in a hypereutectic Al-Si alloy is coarse and can come in a variety of shapes: slat, five-petal star, and octahedron. The sharp edges cause deep cuts in the matrix, introducing internal cracks and propagation to the metal. This reduces its mechanical properties, lowers the quality of machinability, and affects practical application [4,5].
The addition of P, Na, Sr, B, Re, and other denaturing agents can provide a significant change in the growth of the Si phase in the alloy, refining the microstructure and improving the mechanical properties [6,7,8,9,10]. Phosphorus has a significant metamorphic effect on the primary silicon. After it is added, the AlP compound is generated and becomes the nucleation core of the primary phase of the silicon alloy, as well as acting as a non-spontaneous nucleator. This increases the amount of silicon in the primary phase and decreases the average size as well [11,12]. However, studies found that adding to the second phase of reinforced particles to form metal matrix composites is also an effective way to strengthen materials [13,14]. The addition of ceramic particles such as Al2O3, SiC, and TiB2 can not only change the growth pattern of primary phase silicon and refine the structure, but also lessen the likelihood of crack generation and expansion, thus increasing the strength of the alloy matrix and improving the toughness of hypereutectic Al-Si alloys [15,16,17]. Hongseok et al. [18] added γ-Al2O3 nanoparticles to a hypereutectic Al-Si alloy and scattered them using ultrasound. It was demonstrated that γ-Al2O3 can refine the primary phase of Si and visual changes occurred in eutectic Si, which improved the material’s strength and ductility. Ma et al. [19] investigated the effect of TiB2 on the rheological Al-17Si alloy. The results suggested that the primary Si phase, and its eutectic structure, were refined after adding TiB2P in situ, and the refined primary Si was distributed more uniformly in the casting, alleviating the local stress concentration. The lower stress concentration, crack deflection, and crack branching inhibited the formation of microcracks, slowed down the merging of microcracks, and improved the strength and plasticity of Al-17Si composites.
The addition of ceramic particles can refine the grain, but because they are nanoparticles, a larger surface energy forms and easily leads to agglomeration in the alloy melt. The non-uniform distribution of particles significantly weakens the strengthening effect of the composites. Guo et al. [20] prepared TiB2/Cu composites from Cu-B and Cu-Ti alloys and studied the impact of the cooling rate and element concentration on the arrangement of TiB2 particles in the Cu matrix. It was found that, as the TiB2 particles were thickened and distributed unevenly, the cooling rate decreased. The size of TiB2 particles became coarser and the uniformity of particle size distribution became more erratic with the increase in B or Ti elements. Sun et al. [21] investigated the effect of the cooling rate on the distribution of TiB2 particles in an industrially pure aluminum matrix formed by wedge-shaped copper mold casting. It was shown that the TiB2 particles in the aluminum matrix were heavily clustered in the wedge-cast specimens, and the cluster size of particles increased as the cooling rate decreased.
Cooling rates have a significant impact on ceramic particle-reinforced Al-Si alloys. Therefore, in this work, TiB2/Al-20Si composites were prepared using the mixed salt reaction method. The effect of the cooling rate on the multi-phase structure of TiB2 particles in Al-20Si was investigated using a wedge-shaped mold. The microstructure, especially the interface between TiB2 and the Si matrix, was determined using optical microscopy, scanning electron microscopy, and high-resolution transmission electron microscopy. The effect of the cooling rate on the primary Si phase and TiB2 particles was analyzed based on experimental results, and the effect of TiB2 particles on the cracks in the primary Si phase was studied using a nanoindentation technique. Finally, the capture mechanism of primary Si relative to TiB2 particles was discussed.
2. Materials and Methods
2.1. Preparation of 6 wt.% TiB2/Al-20Si Feedstock
Melted industrial pure Al (99.7 wt.%) and metal Si (98 wt.%) were combined in a resistance furnace at 850 °C. The dehydrated K2TiF6 and KBF4 powders were mixed uniformly in a 1:1 mass ratio and then added to the inside of the melt through inert gas (N2). A high-purity graphite stirrer was used for 30 min. After the reaction, the refining agent (C2Cl6) was added for purification. The product, 11 wt.% TiB2/Al-6Si composite, was obtained after the melt cooled to 730 °C and was cast into graphite molds. The reaction process is as follows [22]:
The composite was then heated to about 860 °C in a resistance furnace and held for a while in a ratio of 6 wt.% TiB2/Al-20Si. After finishing the heat preservation, the floating slag on the surface of the metal liquid was stripped off and C2Cl6 (0.5% of the molten metal mass) wrapped with aluminum foil was added for de-slagging and de-gassing. Then, the metal was cast into the wedge mold when the melt temperature dropped to 730 °C. The chemical compositions of the composites were measured using Inductively Coupled Plasma–Atomic Emission Spectroscopy (ICP-AES) and are listed in Table 1. After casting, the mold cooled to room temperature to obtain a wedge-shaped casting. Figure 1 shows the wedge mold, with a height of 80 mm, length of 100 mm, width of 20 mm, and angle of 8°, made of 45# steel.

Table 1.
Chemical compositions (wt.%) of the prepared 6TiB2/Al-20Si composites.
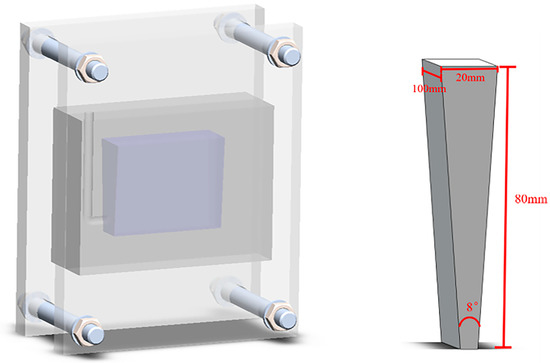
Figure 1.
Schematic diagram of wedge mold and cast.
2.2. Material Characterisation
The samples were prepared using standard metallographic techniques fixed by an aqueous HF solution with a concentration of 0.5% for 3–5 s. The metallographic structure was observed and obtained using a Nikon ECLIPSE MA200 optical metallographic microscope. The metallographic images were processed by Photoshop and Image-Pro Plus to analyze the distribution and morphology of the TiB2 phase and primary Si phase microstructure. Firstly, use Photoshop to remove other phases and then import the processed image into the Image-Pro Plus software. Utilize the calculation function in the software to obtain the volume fraction of primary Si phase (Ssolid), assuming that the shape of each Si grain is equivalent to a circle. The volume fraction of the primary Si phase (Ssolid), effective diameter (D), and shape factor (R) were calculated based on Equations (4)–(6), respectively [23]:
where S1, S2, S3, … Sn are the areas of the 1st, 2nd, 3rd, etc. primary Si grains i, respectively, and Si was calculated using the Image-Pro Plus software. A is the total area of the primary Si phase, N is the total number of particles, Si is the area of particle i, and Pi is the perimeter of particle i.
The microstructure morphology was analyzed using scanning electron microscopy (SEM; Nova Nano SEM450, FEI, Hillsboro, OR, USA). The composite material samples were prepared according to the metallographic sample standards, and the observation surface was ensured to be parallel to the back surface. A standard Berkovich indenter was loaded onto a nanoindentation instrument (DSI; Hysitron TI980, Bruker, Billerica, MA, USA) to press the primary silicon region. The nanoindentation test was conducted in a load–hold–unload process with a time of 5 s-2 s-5 s, and a maximum pressure of 400 mN was applied during the experiment. Finally, the crack extension at the primary silicon indentation was observed. The interface between TiB2 and Si was studied using transmission electron microscopy (TEM; Tecnai G2 TF30, FEI, Hillsboro, OR, USA).
3. Results and Discussion
3.1. Temperature Variations in Different Areas of the Wedge Mold
The molten metal (at 730 °C) was poured into the wedge-shaped mold at 80 °C. The molten metal was cooled when contacting the metal mold, and the temperature changes in different regions of the wedge-shaped mold were measured with a thermocouple. The cooling rates of 6% TiB2/Al-20Si composites in different regions of the wedge mold are shown in Figure 2. The temperature change at the bottom of the wedge specimen was the largest and the slope at the top was the smallest by comparing the temperature change from A1 to A3, and from B1 to B3. The thickness at the bottom of the wedge specimen was the thinnest and the effect of transferring heat was the best. Therefore, the effect of cooling is the most significant at the bottom and decreases with the increased thickness of the cast.
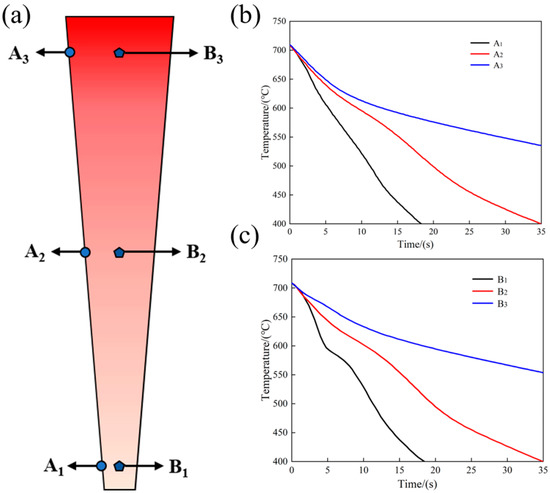
Figure 2.
Cooling rate at different positions of the specimen: (a) wedge specimen; (b) edge area; (c) central area.
The average cooling rate of each location from casting into the mold to eutectic transition temperature (570 °C) was obtained by calculating the cooling curve at A1, A2, A3, and B1, B2, B3. The cooling rates of A1, A2, and A3 were 23 °C/s, 10.6 °C/s, and 5.3 °C/s, respectively, and those of B1, B2, and B3 were 20 °C/s, 9.4 °C/s, and 4.85 °C/s, respectively. It can be seen that the cooling rate at the edge of the wedge specimen was slightly greater than that of the center, according to the calculated results.
The cooling rate at the bottom of the sample was faster than that at the middle and top, regardless of the edge or the middle position. The thickness of the sample at the bottom was the thinnest compared to other parts, and the stored heat was the least. Additionally, the thickness of the bottom area of both the upper and lower molds of the wedge-shaped mold was the thickest. When the 730 °C molten metal was poured into the mold, the bottom of the mold cooled down rapidly, resulting in a higher cooling rate. Conversely, the top of the sample was thicker and stored more heat, and the top of the mold was thinner, resulting in slow heat dissipation and a lower cooling rate.
3.2. Microstructure Evolution in Wedge Specimens
The microstructures of 6% TiB2/Al-20Si composites at different locations in the wedge mold are shown in Figure 3. From the picture, the size of the primary Si phase increased with the decrease in cooling rate from bottom to the top of the wedge specimen. The microstructure mainly consisted of the primary Si phase, eutectic structure, and α-Al. By analyzing Figure 3a,b, the primary phase of Si was mostly fine and distributed in a granular form. In Figure 3e,f, it can be observed that the majority of the primary Si phase was irregular. Agglomeration occurred, and the size of grains was large.
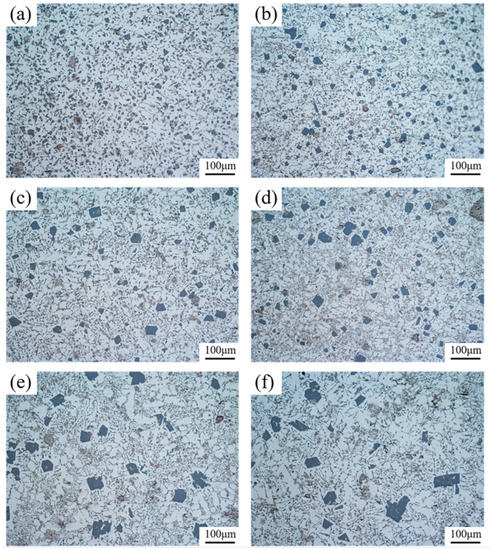
Figure 3.
Microstructure of 6% TiB2/Al-20Si composites at different locations in the wedge mold: (a) A1; (b) B1; (c) A2; (d) B2; (e) A3; (f) B3.
Figure 4 shows the grain size and shape factor of the primary Si phase in different regions of the wedge. A1, A2, and A3 were located at the edge of the specimen and the average size was around 24 μm, 51 μm, and 79 μm, respectively. The size of B1, B2, and B3 in the center increased gradually to 38 μm, 53 μm, and 96 μm. The cavity at the bottom of the wedge mold was smaller and so contained less molten alloy liquid, and less total heat. However, it was thickest at the bottom and the speed of transferring heat was fast, making the cooling rate of the alloy at the bottom cavity faster. The faster cooling rate provided a greater degree of subcooling during the solidification of the melt, significantly increasing the nucleation rate of the primary Si phase. At the same time, the melt temperature was rapidly reduced to the eutectic transition temperature at a large cold zone rate, and primary Si grains grew rapidly, resulting in a fine primary Si phase.
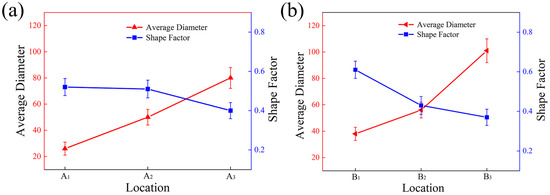
Figure 4.
Statistics of grain size and shape factor of primary Si phase: (a) the edge of the specimen; (b) the center of the specimen.
Figure 5 shows the SEM images of the central region of the wedge specimen, the columnar distribution of TiB2 particles, and their agglomerate sizes. There was an obvious increase in the degree of agglomeration of TiB2 particles, from the bottom to the top, as the cooling rate decreased (as shown in Figure 5a–c). At the bottom of the specimen, TiB2 particles were almost evenly distributed in the matrix in the form of fine particles, of which more than 70% were less than 1 μm (all particles were around 0.1~1.5 μm), and less agglomeration occurred. A slight lump existed in the middle of the specimen as the cooling rate decreased, with an agglomerate size of 4~6 μm. The top of the specimen witnessed significant agglomeration, with a large size of about 4~10 μm.
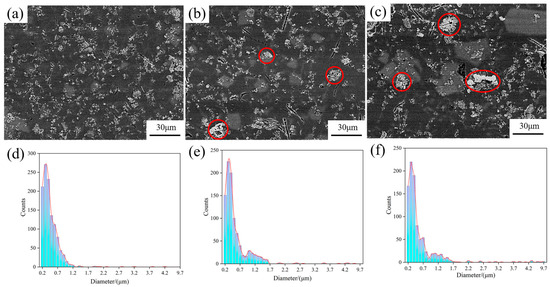
Figure 5.
SEM images of the central region of the wedge mold and the size distribution of TiB2 particles and agglomerates: (a) bottom; (b) middle; (c) top; (d) size distribution of the bottom; (e) size distribution of the middle; (f) size distribution of the top.
Figure 6 shows the SEM images of the central region of TiB2 particles in the primary Si phase. The distribution of TiB2 particles in separate regions was observed. The volume fractions of TiB2 particles in the microstructure of the bottom (Figure 6a), the middle (Figure 6b), and the top (Figure 6c) of the wedge specimen were about 7.41%, 6.92%, and 6.75%, respectively. The size of the primary Si phase extracted in Figure 6d was around 7.3 μm, the volume fraction of TiB2 particles was around 10.1%, that of Figure 6e was about 34 μm and 6.51%, and Figure 6f was about 86 μm and 1.24%.
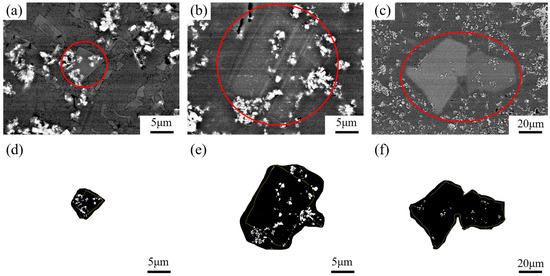
Figure 6.
SEM images of TiB2 particles in primary Si phase in the central region: (a) bottom; (b) middle; (c) top; (d) primary Si phase at the bottom; (e) primary Si phase in the middle; (f) primary Si phase at the top.
In Figure 6a–c, the TiB2 particle content in different regions are compared and it can be observed that the TiB2 particle content decreased with the cooling rate, but this is not obvious. However, this can clearly be seen in Figure 6d–f, where there is a direct comparison of the distribution of TiB2 particles in the primary Si phase.
The size distribution of TiB2 particles in the primary Si phase in the central region is displayed in Figure 7, most of which was from 0.1 to 1.2 μm (90% of which is below 0.8 μm), and there were almost no agglomerates. In the middle, the size was mostly in the range of 0.2–1.8 μm. The size at the top was large; the average size was above 1.6 μm.
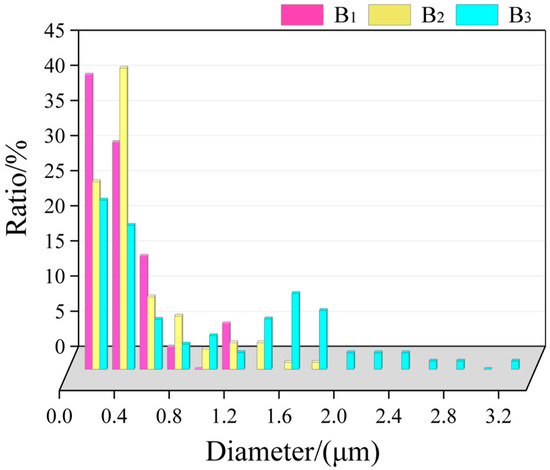
Figure 7.
Statistics of the size distribution of TiB2 particles in the primary Si phase in the central region.
According to the statistical results, it can be observed that, with the increase in cooling rate, the primary Si phase can engulf TiB2 particles with smaller sizes. With the decrease in cooling rate, the size of TiB2 particles distributed in the primary Si phase gradually increased.
Figure 8 shows the transmission electron micrograph of the distribution and interface condition of TiB2 particles in the primary Si phase of the 6% TiB2/Al-20Si composite. TiB2 particles were widely dispersed in the primary Si phase (Figure 8a,b), and agglomeration occurred in some areas (in line with Figure 6). The high-resolution image in Figure 8c indicates the interface between primary Si and TiB2 is well bonded, as it is clear, flat, and continuous. Figure 8d is the fast Fourier transform (FFT) image, where the orientation relationship between primary Si and TiB2 can be determined as:
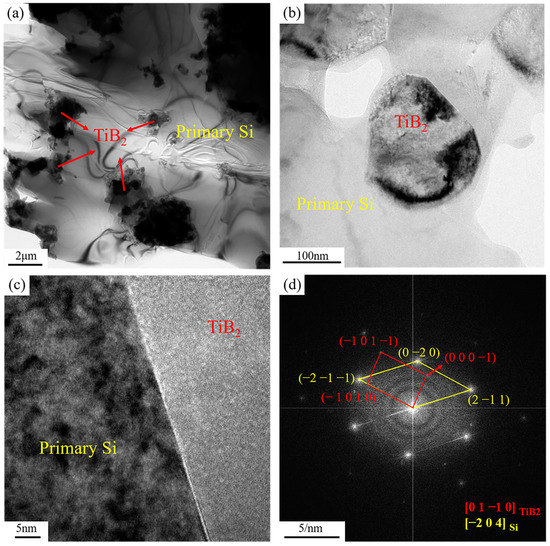
Figure 8.
TEM micrographs showing (a) the distribution of TiB2 in the primary Si; (b) the morphology of TiB2 in the primary Si; (c) the Si/TiB2 interface; (d) the corresponding FFT patterns of the Si/TiB2 interface.
The crystal plane spacing was 0.211 nm for the primary phase Si on and 0.248 nm for TiB2 on . The degree of mismatch between the two crystalline planes was 14.91% (<25%), and there was a semi-coherent lattice relationship between them. TiB2 particles could be used as an effective nucleation base for primary phase Si.
The number of particles that could serve as heterogeneous nucleation cores of primary Si gradually increased as the proportion of TiB2 particles increased. The nucleation rate gradually increased and the size of the primary Si phase gradually became smaller, which was consistent with the results observed in Figure 3 and Figure 6.
Figure 9 displays the indentation scanning images and load–displacement curves on the primary Si phase. Radial cracks were produced in the indentations of all primary Si phases. The cracks on the bottom of the primary phase Si had multiple directions in addition to the radial direction, and the cracks showed a web-like pattern (Figure 9a). The cooling rate was high, and a large number of TiB2 particles were engulfed by the newly formed Si phase molecules. When the material was damaged and cracks occurred in the newly formed Si phase, the crack propagation was hindered when it reached the non-deformable TiB2 particles, causing a change in the crack propagation path, such as branching or deviation, which enhanced and toughened the material. The load–displacement curves in Figure 9d show the indentation depth on the newly formed Si at the bottom of the sample to be the smallest, and as the proportion of TiB2 particles decreased, the indentation depth increased, and the TiB2 particles strengthened the alloy.
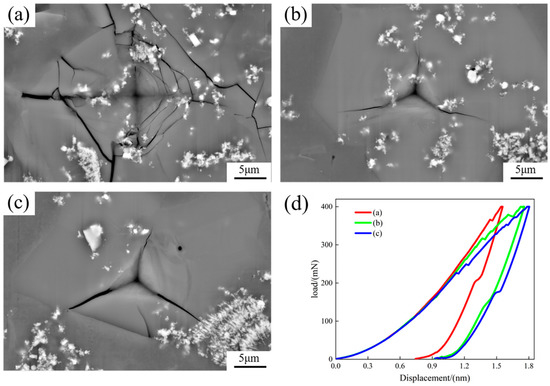
Figure 9.
Scanned images of indentation on the primary Si phase and load–displacement curves: (a) primary Si phase at the bottom; (b) middle primary Si phase in the middle; (c) primary Si phase at the top; (d) load–displacement curves.
Many factors affected the particle distribution at the front end of the solid–liquid interface, including the difference in density and thermal conductivity between the particles and the matrix, the cooling rate of the melt during solidification, the shape and size of the particles, etc. [21,24,25].
During the solidification of the base melt, when the solid–liquid interface push rate of the base metal melt (VS/L) was greater than the particle movement rate (VP), the particles were engulfed by the grains. Conversely, the particles were pushed by the melt to the areas that solidified later. When both were equal, the rate at which the solidification front moved was called the critical rate (Vcr) and was used to characterize the engulfment of particles by looking at the particle distribution at the front of the solid–liquid interface.
To further explore the factors affecting the push rate (VS/L) of the solid–liquid interface during solidification, the Stefanescu model [26] summarizes the main factors affecting particle distribution—the size and shape of the particles, the viscosity of the melt, the interfacial energy between the particles and the liquid and solid, the particle agglomeration phenomena, the heat-transferring behavior in the melt, and the temperature field gradient at the front of the solid–liquid interface. Based on the above factors, Stefanescu proposed the expression for the critical rate as [26]:
where Vcr is the critical rate, is the interfacial energy difference between the particle and the matrix phase, is the lattice constant of the particle, n is a constant, taking values from 2 to 7, is the viscosity coefficient of the melt, R is the radius of the particle, and KP and KL are the thermal conductivity of the particles and the substrate, respectively.
In Equation (7), the radius R of the particle is inversely proportional to the critical rate Vcr. That is, the larger the R, the smaller the critical rate, and the more easily large particles are engulfed. The cooling rate at the bottom of the wedge specimen was the largest. When the pushing rate (VS/L) is larger at the solid–liquid interface, it can engulf a large number of TiB2 particles of a smaller size. This also confirms that the TiB2 particles at the bottom of the specimen were almost diffusely distributed in the form of fine particles, while agglomeration of TiB2 particles occurred at the top of the specimen (Figure 5).
Inside the primary Si phase in Figure 6, TiB2 particles exist mainly as individual particles or small clusters, and the profiles are all close to spherical shape. However, large clusters of agglomerated TiB2 can be observed at the edge of the grain boundary of the primary Si phase, and the clusters are large in size and irregular in shape. This is because the thermal conductivity of TiB2 particles was greater than that of the Si matrix, and there was a force between the front of the solid–liquid interface and the particles or clusters [27]. When the solid–liquid interface was in contact with TiB2 particles, the forces were symmetrical and uniform for individual (almost spherical) particles, and there was only contact between the particles and the solid–liquid interface. For the particle clusters with irregular shapes and larger sizes, the force was not uniform and there were multiple contact points. This lead to a reduction in the distortion at the front of the solid–liquid interface, each point bore part of the force, and the final force was smaller than the single point of contact. Some researchers have concluded [28] that clusters in irregular shapes lead to a reduction in effective diameter, which causes an increase in the critical rate of phagocytosis of agglomerates, making it more difficult for phagocytosis to occur.
The factors affecting the engulfment of TiB2 particles by the primary Si phase were mainly the cooling rate and the size of the particles, as seen in Figure 10. When the cooling rate was low, the degree of subcooling was small and the movement rate (VS/L) of the solidified solid–liquid interface was smaller than the critical rate (Vcr). The particles and clusters at the front of the interface were pushed to the latter solidification region, and TiB2 particles were largely absent inside the primary Si phase. When the cooling rate was high, the degree of subcooling was great and the movement rate (VS/L) of the solidified solid–liquid interface was greater than the critical rate (Vcr). The TiB2 particles were captured and engulfed by the primary Si phase.
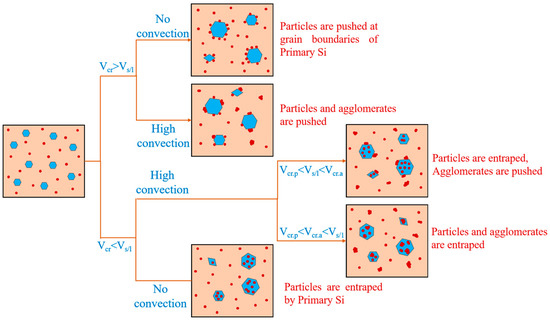
Figure 10.
Schematic diagram of the relationship between primary Si phase and TiB2 particle distribution.
4. Conclusions
In this work, dual-phase structure distribution and the interfacial relationship of TiB2 particles in Al-20Si were regulated. The capturing mechanism of primary Si relative to TiB2 particles was also discussed. Five experiments were conducted to ensure the accuracy of the results. The main findings were as follows:
- (1)
- Different cooling rates had a large effect on the matrix structure. The size of the primary Si phase at the bottom of the specimen was small and uniformly distributed at a larger cooling rate, and the size of the primary Si phase increased significantly as the cooling rate decreased.
- (2)
- TiB2 particles agglomerated in the wedge mold and increased as the cooling rate decreased.
- (3)
- The cooling rate had a significant impact on the engulfment of TiB2 particles in the primary Si phase in the matrix. The greater the cooling rate, the greater the pushing rate of the solidified solid–liquid interface, the faster the growth rate of the primary Si phase, and the more TiB2 particles engulfed. When the cooling rate decreased, the degree of subcooling was not sufficient to engulf smaller TiB2 particles, making only the larger TiB2 particles present.
- (4)
- The interface between TiB2 particles and primary Si was well bonded. There was a semi-coherent lattice interface between TiB2 particles and primary phase Si: , .
- (5)
- TiB2 particles could inhibit the expansion of internal cracks on primary phase Si, and thereby enhance, toughen, and strengthen the material.
Author Contributions
Writing—original draft preparation and investigation, C.L.; writing—review and editing, methodology, L.L.; investigation and formal analysis, X.Z.; validation and visualization, Z.G. and Q.S.; resource and project administration, Z.L. All authors have read and agreed to the published version of the manuscript.
Funding
This research was funded by National Natural Science Foundation of China, grant number (52065032), the Applied Basic Research Project of Yunnan Province, grant number (202101AT070123), the Science and Technology Major Project of Yunnan Province, grant number (202202AG050011), the Science and Technology Innovation Base Construction Project Fund, grant number (202207AB110003), and the Key Research and Development Project of Yunnan Province and the International Science and Technology Cooperation Project, grant number (202103AF140004).
Data Availability Statement
Not applicable.
Conflicts of Interest
The authors declare no conflict of interest.
References
- Fukui, Y.; Nara, D.; Kumazawa, N. Evaluation of the Deformation Behavior of a Semi-solid Hypereutectic Al-Si Alloy Compressed in a Drop-Forge Viscometer. Metall. Mater. Trans. A 2015, 46, 1908–1916. [Google Scholar] [CrossRef]
- Kapranos, P.; Kirkwood, D.H.; Atkinson, H.V.; Rheinlander, J.T.; Bentzen, J.J.; Toft, P.T.; Debel, C.P.; Laslaz, G.; Maenner, L.; Blais, S. Thixoforming of an automotive part in A390 hypereutectic Al–Si alloy. J. Mater. Process. Technol. 2003, 135, 271–277. [Google Scholar] [CrossRef]
- Cui, C.; Schulz, A.; Schimanski, K.; Zoch, H.W. Spray forming of hypereutectic Al–Si alloys. J. Mater. Process. Technol. 2009, 209, 5220–5228. [Google Scholar] [CrossRef]
- Jw, A.; Zga, B.; Jls, C.; Wxh, C.; Jcl, C.; Smxa, B. On the growth mechanism of the primary silicon particle in a hypereutectic Al-20wt%Si alloy using synchrotron X-ray tomography-ScienceDirect. Mater. Des. 2018, 137, 176–183. [Google Scholar]
- Yu, W.; Zhao, H.; Wang, L.; Guo, Z.; Xiong, S. The influence of T6 treatment on fracture behavior of hypereutectic Al-Si HPDC casting alloy. J. Alloys Compd. 2018, 731, 445–451. [Google Scholar] [CrossRef]
- Wang, A.; Zhang, L.; Xie, J. Effects of cerium and phosphorus on microstructures and properties of hypereutectic Al-21%Si alloy. J. Rare Earths 2013, 31, 522–525. [Google Scholar] [CrossRef]
- Szabracki, P.; Lipiński, T. Mechanical Properties of AISi9Mg Alloy with a Sodium Modifier. Diffus. Defect Data B Solid State Phenom. 2015, 223, 78–86. [Google Scholar]
- Lin, J.; Zhang, J.; Niu, L.; Sun, D.; Shi, Z. Effect of Strontium and T6 Heat Treatment on Structure and Performance of Al-11.6Si-0.5Mg Alloy. Mater. Sci. Forum 2013, 749, 1–6. [Google Scholar] [CrossRef]
- Mazahery, A.; Shabani, M.O. Modification Mechanism and Microstructural Characteristics of Eutectic Si in Casting Al-Si Alloys: A Review on Experimental and Numerical Studies. JOM 2014, 66, 726–738. [Google Scholar] [CrossRef]
- Nogita, K.; Mcdonald, S.D.; Dahle, A.K. Eutectic modification of Al-Si alloys with rare earth metals. Mater. Trans. 2004, 45, 323–326. [Google Scholar] [CrossRef]
- Wu, Y.; Wang, S.; Hui, L.; Liu, X. A new technique to modify hypereutectic Al–24%Si alloys by a Si–P master alloy. J. Alloys Compd. 2009, 477, 139–144. [Google Scholar] [CrossRef]
- Liu, X.; Qiao, J.; Liu, Y.; Li, S.; Bian, X. Modification Performance of the Al-P master alloy for eutectic and hypereutectic Al-Si alloys. Acta Met. Sin. 2004, 40, 471–476. [Google Scholar]
- Dong, X.; Youssef, H.; Zhang, Y.; Wang, S.; Ji, S. High performance Al/TiB_2 composites fabricated by nanoparticle reinforcement and cutting-edge super vacuum assisted die casting process. Composites 2019, 177, 107453. [Google Scholar] [CrossRef]
- Li, J.; Zhao, G.; Wu, S.; Huang, Z.; Lu, S.; Chen, Q.; Li, F. Preparation of hybrid particulates SiCnp and Mg2Si reinforced Al-Cu matrix composites. Mater. Sci. Eng. A 2019, 751, 107–114. [Google Scholar] [CrossRef]
- Majhi, J.; Sahoo, S.K.; Patnaik, S.C.; Sarangi, B.; Sachan, N.K. Effect of alumina on grain refinement of Al-Si hypereutectic alloys. IOP Conf. Ser. Mater. Sci. Eng. 2018, 338, 012048. [Google Scholar] [CrossRef]
- Wu, B.; Reddy, R.G. In-situ formation of SiC-reinforced Al-Si alloy composites using methane gas mixtures. Metall. Mater. Trans. B 2002, 33, 543–550. [Google Scholar] [CrossRef]
- Gan, G.S.; Lei, Z.; Bei, S.Y.; Yi, L.U.; Yang, B. Effect of TiB2 addition on microstructure of spray-formed Si-30Al composite. Trans. Nonferrous Met. Soc. China 2011, 21, 2242–2247. [Google Scholar] [CrossRef]
- Choi, H.; Konishi, H.; Li, X. Al2O3 nanoparticles induced simultaneous refinement and modification of primary and eutectic Si particles in hypereutectic Al–20Si alloy. Mater. Sci. Eng. A 2012, 541, 159–165. [Google Scholar] [CrossRef]
- Ma, G.; Li, L.; Xi, S.; Xiao, Y.; Li, Y.; Yuan, Z.; He, Y.; Zhou, R.; Jiang, Y. Enhanced combination of strength and ductility in the semi-solid rheocast hypereutectic Al Si alloy with the effect of in-situ TiB2 particles. Mater. Charact. 2021, 176, 111143. [Google Scholar] [CrossRef]
- Guo, M.X.; Shen, K.; Wang, M.P. Effect of in situ reaction conditions on the microstructure changes of Cu–TiB 2 alloys by combining in situ reaction and rapid solidification. Mater. Chem. Phys. 2012, 131, 589–599. [Google Scholar] [CrossRef]
- Sun, J.; Zhang, X.B.; Cai, Q.; Zhang, Y.J.; Ma, N.H.; Wang, H.W. Distribution and engulfment behavior of TiB2 particles or clusters in wedge-shaped copper casting ingot. Trans. Nonferrous Met. Soc. China 2015, 25, 54–60. [Google Scholar] [CrossRef]
- Bartels, C.; Raabe, D.; Gottstein, G.; Huber, U. Investigation of the precipitation kinetics in an A16061/TiB2 metal matrix composite. Mater. Sci. Eng. A 1997, 237, 12–23. [Google Scholar] [CrossRef]
- Seo, P.K.; Kang, C.G. The effect of raw material fabrication process on microstructural characteristics in reheating process for semi-solid forming. J. Mater. Process. Technol. 2005, 162, 402–409. [Google Scholar] [CrossRef]
- Agaliotis, E.M.; Schvezov, C.E.; Rosenberger, M.R.; Ares, A.E. A numerical model study of the effect of interface shape on particle pushing. J. Cryst. Growth 2012, 354, 49–56. [Google Scholar] [CrossRef]
- Li, P.; Li, Y.; Wu, Y.; Ma, G.; Liu, X. Distribution of TiB2 particles and its effect on the mechanical properties of A390 alloy. Mater. Sci. Eng. A 2012, 546, 146–152. [Google Scholar] [CrossRef]
- Stefanescu, D.M.; Dhindaw, B.K.; Kacar, S.A.; Moitra, A. Behavior of ceramic particles at the solid- liquid metal interface in metal matrix composites. Metall. Trans. A 1988, 19, 2847–2855. [Google Scholar] [CrossRef]
- KöRber, C.; Rau, G.; Cosman, M.D.; Cravalho, E.G. Interaction of particles and a moving ice-liquid interface. J. Cryst. Growth 1985, 72, 649–662. [Google Scholar] [CrossRef]
- Agaliotis, E.; Rosenberger, M.R.; Schvezov, C.E.; Ares, A.E. Numerical calculation of the drag force applied to particle pushing. J. Cryst. Growth 2008, 310, 1366–1370. [Google Scholar] [CrossRef]


Disclaimer/Publisher’s Note: The statements, opinions and data contained in all publications are solely those of the individual author(s) and contributor(s) and not of MDPI and/or the editor(s). MDPI and/or the editor(s) disclaim responsibility for any injury to people or property resulting from any ideas, methods, instructions or products referred to in the content. |
© 2023 by the authors. Licensee MDPI, Basel, Switzerland. This article is an open access article distributed under the terms and conditions of the Creative Commons Attribution (CC BY) license (https://creativecommons.org/licenses/by/4.0/).