Article

On Structural Sensitivity of Young’s Modulus of Ni-Rich Ti-Ni Alloy

1
Metal Forming Department, National University of Science and Technology MISIS, 119049 Moscow, Russia
2
Laboratory of Plastic Deformation of Metal Materials, A. A. Baikov Institute of Metallurgy and Materials Science, Russian Academy of Sciences, 119334 Moscow, Russia
3
Department of General Mathematics & Informatics, Saint-Petersburg State University, 199034 Saint-Petersburg, Russia
*
Author to whom correspondence should be addressed.
Metals 2023, 13(8), 1428; https://doi.org/10.3390/met13081428
Submission received: 16 July 2023 / Revised: 2 August 2023 / Accepted: 6 August 2023 / Published: 9 August 2023
(This article belongs to the Special Issue Progress in and Prospects of Shape Memory Alloys)

Abstract

:
When developing bone implants, Young’s modulus is one of the primary characteristics of the material that should be considered. This study focuses on regulating the modulus of Ti-50.8 at.% Ni alloy by varying the grain/subgrain size as well as the initial structure using subsequent aging at 430 °C for 10 h. After post-deformation annealing (PDA), the temperature dependence of Young’s modulus exhibits a pronounced V-shaped character with a minimum at the onset temperature of the forward martensitic transformation, Ms, regardless of the structure. The grain/subgrain size of B2-austenite strongly affects the modulus magnitude. This effect is ambiguous for a material with a grain size range of 0.13–3 µm and depends on the test temperature. The effect of aging on the modulus reduction depends on the initial structure; it is most pronounced in an alloy with a relatively coarse grain size of 9 µm and brings a decrease of 3.8 times at a temperature of 37 °C. Aging of the initially recrystallized Ni-rich NiTi alloy makes it possible to obtain a вone-like elastic modulus of E = 12–13 GPa at an operating temperature of 37 °C. An ultrafine-grained substructure exhibits the same Young’s modulus values in the low temperature range from −100 to 25 °C.

1. Introduction

Among shape memory alloys (SMAs) applied for medical intelligent devices, Ni-rich NiTi alloys remain extremely attractive for designing intelligent devices for medical applications due to their unique set of functional properties. The scope of their clinical use in surgery is extremely wide, including various manipulators, cava filters, septal occlusion devices, vascular stents and stents for tubular structures, prostheses (osseous, ligamental, dental), compressive devices, and implants [1,2,3]. The traditional processing of NiTi alloys includes a thermomechanical treatment as well as subsequent post-deformation annealing (PDA) [3,4,5]; varying the aging modes makes it possible to precisely control aging-induced microstructure, transformation, and functional response over a wide temperature range [6,7,8,9].
When developing bone implants, the elastic modulus (or Young’s modulus) is one of the primary characteristics of the material that should be considered. The low bone-like Young’s modulus of an implant prevents a stress shielding effect in bone fixation and minimizes bone resorption [10]. According to the data from various sources, its values for bone tissue ranges 0.04–30 GPa [11,12,13]. Such impressive data scattering is due to the fact that the density and porosity of bone tissue differ in various kinds of bones [11,12], as well as differing in various age groups; for example in athletes, regular training leads to bone hypertrophy [14].
Ni-rich NiTi alloys are characterized by the elastic modulus having a magnitude somewhat higher than the upper limit of the above indicated range; in coarse-grained materials it amounts 33–73 GPa [15,16,17] and it is 52–77 GPa in extruded rods [18]. The NiTi SMAs exhibit an expressed V-shaped temperature dependence of Young’s modulus with a minimum at the Ms temperature (the onset temperature of martensitic transformation (MT) [15,16,17,18], which correlates with the similar V-shaped temperature behavior of the plateau stress (or transformation yield stress) [4,19,20].
It is important to note here that in the above cited references, the minimum values of E = 30–35 GPa are achieved at temperatures below zero in a coarse-grained NiTi alloy [15,16], and at the temperature of the human body of 37 °C (which should be considered the operating temperature of the implant), the values of E are much higher than that of bone tissue. This is a serious obstacle that limits the use of NiTi SMAs for the development and manufacture of bone implants. Therefore, when developing implants, scholars turn to nickel-free SMAs [21,22,23].
To reduce Young’s modulus, the authors of [16] used deformation with an accumulated strain of 20%. As a result, they reduced Young’s modulus in Ti49.2Ni50.8 alloy from 68 to 30 GPa at a temperature of 0 °C. This result, however, exhibits a low value for practical use because at human body temperatures the magnitude of E amounts 40 GPa after deformation. Moreover, it is basic knowledge that deformation brings about the suppression of martensitic transformations (MTs) and degradation of shape memory effects [4,5].
To regulate the Young’s modulus values of TiNi alloy at human body temperatures, knowledge about its responses to its structural evolution is required. The corresponding information remains limited because traditionally the comparative studies of the elastic modulus in materials with different structures are carried out at room temperature.
The cited publications, however, do not provide an exhaustive knowledge of the structural responses of Young’s modulus, since the comparative tests in the above cited studies are restricted by one or two kinds of structures (mainly recrystallized [15,17] or as-deformed [16,18]). Meanwhile, post-deformation annealing (PDA) is an obligatory procedure to provide a necessary temperature range for the shape recovery as well as other functional characteristics [3,4,5,6,7,8,9,19].
It was proven in [19] that the efficiency of aging in terms of the control of the functional and mechanical responses (tensile behavior) is determined by the specific features of the initial (unaged) substructure. The possibilities of aging with a variety of initial structures as factors affecting the elastic modulus of Ni-rich titanium nickelide remains obscure. The lack of corresponding data indicates the existence of serious gaps that limit the scope of Ni-rich SMAs.
In this work, we report the possibility of regulating the modulus of elasticity of Ti49.2Ni50.8 alloy when varying the initial structural state as well as aging-induced microstructure in a test temperature range of −196 ≤ T ≤ +100 °C. The specific features of the temperature dependence of Young’s modulus vs. the grain/subgrain size as well as its response to aging using various initial structural states are revealed. We suggest a mode of thermomechanical processing that produces a 2.7–3.6 reduction in Young’s modulus to achieve its bone-like value at human body temperatures.
Obviously, such studies are of undoubted value, since it is known that varying the initial (before aging) structure permits precise control of the functional behavior [8,19,24]. This research fills the indicated gap and makes it possible to reveal the effect of the initial structure under aging in the variation of the elastic modulus over a wide temperature range.

2. Materials and Methods

A Ti-50.8 at.% Ni alloy ingot with a total impurity content of 0.1 at.% was manufactured by “MATEK-SMA” (Russia, Moscow) using a vacuum induction melting furnace UPPF-ZM (Public Joint Stock Company Electromechanika, Rzhev, Russia). The subsequent processing included pressing, rotary forging, radial shear rolling, and warm drawing to obtain 0.8 mm wires. Subsequent annealing was performed at 700 °C (20 min). A 0.8 mm wire was then finished by multipass cold drawing to obtain a 0.6 mm wire with an accumulated true (logarithmic) strain of e = 0.6. Post-deformation annealing (PDA) was performed using the following modes: (i) 550 °C, 0.5 h; (ii) 600 °C, 1 h; (iii) 800 °C, 1 h. Each annealing procedure was finished by water quenching.
At the next stage, the as-deformed samples as well as samples (ii) and (iii) were subjected to aging at 430 °C for 10 h (the temperature range of 420–440 °C was determined in [25] as optimal in terms of the maximum intensity of aging).
Microstructure observations were performed using a JEM-2100 transmission electron microscope (TEM, JEOL, Tokyo, Japan) operated at 200 kV. The foils were cut off the middle of the wire along the drawing direction by local precision ion etching using a “Strata FIB 205” scanning ion microscope (FEI Company, Hillsboro, OR, USA), with the accelerating voltage of a focused ion beam of 30 kV.
An electron backscatter diffraction (EBSD) method was applied for structural studies of the solution-treated samples using a TESCAN VEGA 3LMH scanning electron microscope (Tescan Brno s.r.o., Kohoutovice, Czech Republic). The samples for EBSD studies were prepared using electropolishing in a solution of 30 vol% nitric acid and 70 vol% methanol at 20 °C. The grain size of the solution-treated samples was measured using a TSL-EDAX system as well as the random linear intercept method by sampling more than 250 grains.
Calorimetric studies of the martensitic transformations (MTs) were carried out using a “Mettler Toledo 822e” calorimeter (Mettler Toledo, Schwerzenbach, Switzerland) at a rate of 10 °C/min in the range of −100 °C ≤ T ≤ +100 °C. The start and finish temperatures of the MTs were determined using the ASTM F2004-05 (2010) standard.
Tensile tests were carried out in a temperature range of −196 °C ≤ T ≤ +100 °C with a speed of 20 mm/min using an INSTRON 5966 instrument (Instron, Norwood, MA, USA) using 5–6 samples for the test temperature. In all cases, one of the test temperatures corresponded to the temperature Ms (the onset temperature of the forward MTs R → M or A → M). The elastic modulus was evaluated by conventional means of the macroscopic mechanical response by the slope of the stress–strain curve at zero strain.

3. Results

Drawing at room temperature with the accumulated logarithmic strain of e = 0.6 causes the formation of a highly developed dislocation substructure of B2-austenite with partial amorphization. The selected area diffraction pattern (SAED) reveals the diffraction arcs (110) and (200), which belong to B2-austenite, and the reflections (113) and (003) of B19′martensite [8].
PDA at a temperature of 550 °C for 30 min forms a mixed ultrafine-grained (UFG) structure, which contains the recrystallized grains as well as the polygonized subgrains of B2-austenite with an average size of 130 nm; their fractions are comparable (Figure 1a,b). The elements with a size range of 80–120 nm occupy 43% of the volume; the elements with a size range of 160–200 nm occupy 43% of the volume. The maximum size of the grains and subgrains is 340 nm (Figure 1d). The reflections of Ti3Ni4 precipitates are not revealed. The diffraction arcs (110) and (211) belong to B2-austenite; the reflections of ( 32 1 ¯ ) belong to R-martensite (Figure 1c). The subgrains form conglomerates measuring 480 × 730 nm, which can be observed in dark-field images. The histograms shown in Figure 1 were plotted using the measured average cross-section of the grains/subgrains.
PDAs at 600 °C for 1 h and at 800 °C for 1 h of the as-deformed samples forms the recrystallized microstructures, with average grain sizes of 3 µm and 9 µm, respectively (Figure 1d–f,h, respectively). After PDA at 600 °C, the maximum grain size reaches 8 µm; the grains with a diameter range of 2–4 µm occupy 60% of the volume (Figure 1f). After PDA at 800 °C, the maximum grain size reaches 24 µm; the grains with a diameter range of 6–9 µm occupy 50% of the volume (Figure 1h).
In the SAED image, the superposition of arc reflections from the nano-subgrains and point reflections from nano-sized grains distributed over a ring can be observed, and the reflections of the (110)B2, (221)R, and ( 13 1 ¯ )B19′ are detected. It is believed that aging is suppressed at this temperature; nevertheless, the reflections (003) of Ti3Ni4 precipitates are also detected; their interpretation was performed using data from [26].
Additional aging was carried out at a temperature of 430 °C for 10 h using the as-deformed and recrystallized samples (ii) and (iii). The aging of an as-deformed material forms a mixed microstructure of B2-austenite, which consists of recrystallized nanograins and nano-subgrains of the polygonized substructure with an average size of 37 ± 3 nm. Conglomerates measuring 100–150 nm formed by subgrains can be observed in the dark-field images. The microstructure elements with a size range of 30–40 nm occupy ~40% of the volume. The maximum size of the grains/subgrains is 130 nm.
The Ti3Ni4 precipitates in the bright-field and dark-field images are not visually detected, although the corresponding reflections (133) and ( 0 2 ¯ 4 ) are present in the SAED image (Figure 2a,b). The reflections of B2-austenite, R martensite, and B19′ martensite are detected as well.
The size of the Ti3Ni4 precipitates as well as their distribution in the recrystallized structure depend on the grain size. In both structures, the distribution of the precipitates is heterogeneous; it is weakly expressed in a fine-grain structure (Figure 2b) and becomes pronounced as the grain coarsens (Figure 2c).
The precipitate size is minimal in the grain boundary zones and grow towards the grain center, the distance between the particles increases, and the linear frequency of their distribution as well as the volume fraction decrease.
Figure 3 traces the evolution of specific features of martensitic transformations (MTs) vs the grain/subgrain size as well as after additional aging.
In an as-deformed material, the exothermic and endothermic peaks of the forward and reverse martensitic transformation are absent, which is typical for a strongly work-hardened material [5,8].
After PDA at 550 °C for 0.5 h (an UFG mixed substructure), the calorimetric curves show two distinct exothermic peaks upon cooling: A → R at 4 °C and R → M at −51 °C. Upon heating, one peak of MT M → (R) → A is recorded at a temperature of 9 °C (see Table 1 for more details concerning the onset and endset temperatures of MTs).
After the solution treatment at 600 °C (a recrystallized structure with an average grain size of 3 μm), similar forward transformations with very close peaks are detected at 9 °C and 1 °C, respectively, and a single reverse MT M → (R) → A with a peak at 34 °C are registered. After PDA at 800 °C (for a recrystallized structure with an average grain size of 9 μm), one forward A → M transformation with a peak at −37 °C and the corresponding reverse one at −13 °C are detected.
Subsequent aging of the (ii) samples brings causes the separation of the calorimetric peaks of the forward MTs.
After subsequent aging of the (iii) samples, the triple-stage MT proceeds under cooling as A → R, R → M, and A → M, with peaks at 43 °C, 6 °C, and −10 °C, respectively. Upon heating, two overlapping MTs M → A(2) and M(1) → A are determined with peaks at 45 and 50 °C, respectively.
Table 2 shows the average values of Young’s modulus (E) for the NiTi alloy, determined from the stress–strain diagrams. Figure 4 illustrates the temperature-dependent Young’s modulus of the material with different grain/subgrain sizes, where temperatures Ms and Af are indicated. For the PDA in the temperature range of 550–800 °C, the diagrams exhibit a pronounced V-shaped character with a minimum at the Ms temperature.
The lowest magnitude of Young’s modulus (11–22 GPa) is determined in a material with a mixed UFG structure (PDA 550 °C) at test temperatures below −20 °C. The completion of recrystallization (PDA 600 °C) is accompanied by an increase in the modulus to 14–26 GPa in this temperature range; in the temperature range of −20–100 °C, the E values of the UFG material exceed that of the fine-grained material and reach 47 GPa. The grain growth up to 9 µm (PDA 800 °C) is accompanied by a significant increase in the modulus range to 27–54 GPa; this structure provides the highest level of E over the entire test temperature range.
Figure 5 traces the temperature dependence of Young’s modulus in various initial structural states before and after aging.
In the as-deformed material, the material exhibits atypical behavior; in the temperature range from −196–25 °C, the values of E are determined in the range of 30–42 GPa (Figure 5a). With a further increase in the test temperature to 100 °C, Young’s modulus reduces to 20–30 GPa; such a temperature dependence is characteristic of materials without phase transformations [27] and is caused by the relaxation of internal stresses upon heating. The observed scattering of the data over a wide range is caused by the technical features of the experiment (the curved shape of the as-deformed specimens), which is reflected in the quality of the recorded stress–strain diagrams.
After PDA, in all cases the temperature dependence of Young’s modulus exhibits a V-shaped character, both in the recrystallized material (blue curves) as well as after aging (red curves).
Aging brings about a reduction in the modulus magnitudes over the entire temperature range if compared to the initial unaged state. The exception is the temperature region above 25 °C in Figure 5a, in which the values of E after aging are comparable to the initial state and somewhat higher.
It should be noted that despite the significant difference in Young’s modulus values in a material with a different initial structure, the values and the nature of evolution after aging become very close and exhibit an identical symmetry about the Ms point. In Figure 5c after aging, the area of the minimum values of E is somewhat stretched along the temperature axis, since two direct MTs, R → M and A → M, are determined in the material with this structure with the Ms temperatures at 5 and −6 °C, respectively.
After aging, there is a slight increase in the minimum values of E in the region of the Ms point at 8 GPa (Figure 4 to 13 GPa (Figure 4), with a coarsening of the initial structure. At test temperatures higher than Af, the maximum values of E = 42–44 GPa are realized after aging the material with a dislocation substructure. After aging the alloy with a recrystallized structure, the values of E over the entire temperature range are very close.
The values of Young’s modulus in the region of existence of metastable B2-austenite exceeds those in the state of B19’ martensite, regardless of the initial structure, which is in good agreement with the data [28]. The maximum values of Young’s modulus in the aged material reach their maximum E = 40–45 after aging of the as-deformed material.
Figure 6 shows the stress–strain curves obtained at 37 °C at a test temperature of 37 °C before and after aging (“BA” and “AA”, respectively). As a result of aging, the fine-grained material exhibits a 2.7 times reduction from 34 GPa to 14 GPa and the coarse-grained material exhibits a 3.6 times reduction from 55 GPa to 15 GPa at a temperature of clinical use of 37 °C. Thus, aging the initially recrystallized material makes it possible to obtain values of E = 12–13 GPa at an operating temperature of 37 °C, which is essential in clinical use.
The stress plateau, which characterizes the magnitude of the transformation yield stress (σtr), remains unchanged at a level of 200 MPa after aging a fine-grained material (Figure 6a). Aging a material with a coarser grain size results in an expressed reduction in the stress plateau from 600 MPa to 350 MPa.

4. Discussion

The observed difference in the aging-induced microstructures is determined by the defect density and specific features of their distribution in the initial (unaged) microstructure; the higher the defect density, the greater the number of nucleation centers of Ti3Ni4 precipitates [4]. Among the three types of initial (before aging) structures, the cold-drawn material exhibits the highest defect density (ρ ≅ 1012−13−2 [29]), with a relatively uniform distribution. The Ti3Ni4 precipitates that nucleate in this structure remain within the limit of 3−5 nm due to competing growth under similar conditions [8,26].
In the fine-grained initial structure (PDA 600 °C), the defect density drops to the magnitude of ρ ≅ 108−2; further grain growth (PDA 800 °C) results in a decrease in the defect density (ρ ≅ 106−7−2) [29]. According to [30], the defect concentration is higher near the grain boundaries than in the grain center; this difference is most pronounced in the coarse grains if compared with the fine ones. A similar difference in nickel concentration in the grain cross-section was reported in [8] using energy-dispersive spectroscopy; the segregation of Ni near the grain boundary reaches 54 at.% in coarser grains. These factors explain the observed differences in the precipitate distributions; the concentration of nucleation centers is higher in the fine grains with the uniform nickel concentration over the grain cross-section, while the Ti3Ni4 precipitates nucleate and grow in competing conditions [31,32]. In the coarse-grained structure that exhibits the lower defect density, the concentration of the nucleation centers is lower and the precipitates reach much larger sizes in the volumes with higher nickel concentrations in the grain boundary zones. The same factors explain the observed differences in the size and distribution of Ti3Ni4 precipitates in the grain boundary zone and the grain center.
The histogram of the nanocrystalline structure also exhibits a bimodal distribution of the grains and subgrains, which testifies to the differing natures of recrystallized grains and nano-subgrains; under PDA, polygonization starts in the areas with the well-developed dislocation substructure and the crystallization of the grains starts in the amorphized areas [3,5].
The nature of the evolution of MTs is quite logical and well-studied in Ni-rich Ti-Ni alloy; its interrelation with specific features of the microstructure is analyzed in [8,31]. The observed features of MTs in material with various initial structures generally correspond to known regularities.
A decrease in the concentration of structural defects with an increase in the PDA temperature results in “degeneration” of the B2 → R transformation, the transition to a single-stage MT, the convergence of the onset and endset temperatures of MTs due to the structural homogenization of austenite, and their shift to higher temperatures [4,8,29].
After aging at 430 °C for the initially cold-drawn material, the defect density remains high enough (ρ ≅ 1010−2) [29] that it creates serious obstacles for the movement of interphase boundaries and suppresses the formation of martensite. Following the Gaussian function, the fine-grained material contains 25% of grains with a diameter of less than 2 μm (see Figure 1f), in which the formation of martensite is also suppressed due to the precipitation of dispersed Ti3Ni4 particles, with a high density of their distribution [32]. Following in situ observations [31], the formation of cooling-induced martensite is also suppressed in the grain boundary zones where the finest precipitates and a high density of their distribution is observed. Such inhomogeneity of the structures causes the expansion of the range of the direct MTs.
In an alloy with a grain size of 9 μm, according to in situ observations [31], MTs in grains with a heterogeneous distribution of precipitates proceed sequentially in different grain zones that differ in their size, morphology, and distribution density of precipitates. A relatively coarse-grained material exhibits all types of single-stage MTs inherent in aging Ti–Ni alloys [4]. The forward MTs develop through an intermediate R-phase in the near-grain boundary zone. The single-stage B2 → B19′ transformation proceeds in the grains’ central zone at lower temperatures [31]. This is caused by the violation of the coherency in the area with the coarse precipitates with an average diameter of ~350 nm and the Ni depletion of B2-austenite [33]. The sequence of MT is determined by dividing the grains into zones; the larger the grain size, the more zones.
Based on the results of calorimetric studies, the test temperatures corresponding to different phase states were selected for tensile tests; the onset temperature Ms, also known as the temperature of slight deformation [3,4], was chosen for all structural states.
Following the theory of internal friction, which describes the interaction of dislocations with point defects, a decrease in Young’s modulus after plastic deformation is a natural consequence of an increase in the dislocation density [6,27,34,35]. It is also known that any discontinuities, such as nanopores that appear in the process of significant plastic deformation, lead to a decrease in the E magnitudes [36,37,38]. In this regard, in the material with the highest defect density (immediately after cold deformation (ρ ≅ 1012−13−2), one could expect the minimum values of E.
It is known, however, that the highly inhomogeneous stress–strain state that arises under cold plastic deformation causes the appearance of non-equilibrium structures of various scales and affects the elastic properties of the material [39].
Under the cold drawing processing, the material is subjected to tensile stresses, which accumulate internal stresses of the opposite sign (i.e., compressive), directed inwards to the ingot [39]. During subsequent stretching under experimental conditions, internal compressive stresses contribute to the resistance to deformation, increasing Young’s modulus. The absence of a minimum at the Ms point (see Figure 5a) is explained by the suppression of all MTs in the deformed state, and the decrease in E values in the temperature range of 25–100 °C is due to the relaxation of internal stresses during heating that is typical for materials without phase transformations [27].
The observed V-shaped elastic modulus curve after PDA (see Figure 4 and Figure 5) as a function of the temperature is in good agreement [16,40,41].
Under annealing in the temperature range of 550–800 °C, the dominant mechanism in Young’s modulus evolution is the process of irreversible relaxation, which is accompanied by a decrease in the internal stresses, a decrease in the defect density of the crystal lattice, polygonization, recrystallization, and the transition from non-equilibrium grain boundaries to equilibrium ones. For a material with a recrystallized structure with different grain sizes, the obtained values of E are in good agreement with the theory over the entire temperature range. The E values obtained in the material with UFG structure are generally lower than in the recrystallized material (see Figure 4). At test temperatures above −20 °C, however, they exceed the E level obtained in the fine-grained material. The obvious reason is the shift of the Ms point of the UFG material concerning the Ms point of the fine-grained one. However, in the temperature range above Af, Young’s modulus of the UFG material is higher than that of the fine-grained material. Note that the same values of E are realized in a nanostructured material obtained as a result of 10 h aging (see Figure 5a).
It can be assumed that the observed behavior of the UFG NiTi alloy is caused by the long-range residual stresses of the deformed B2-austenite, which contribute to an increase in the values of E [42] (in our case, to a change in the ratio of the values of E in the B2-austenite of the UFG material and fine-grained one, see Figure 4. High internal stresses can arise both due to different crystallographic orientation of grains/subgrains, as well as non-equilibrium state of grain boundaries [43,44,45]. In addition, it is necessary to take into account the effect of the specific features of texture, which also affects Young’s modulus [46]. The differences observed in the textures of nanocrystalline and recrystallized titanium nickelides are analyzed in detail in [24]; this problem, however, requires additional clarification.
The former phenomenon, like the B2–B19′ transition in TiNi alloys, is a symmetry-lowering transition (also referred to as thermoelastic martensitic transformation), which presents a “V”-shaped elastic modulus curve as a function of the temperature and can be described by the classical Landau theory [16].
The appearance of a minimum at the Ms point is associated with the implementation of a symmetry-lowering MT (see Figure 4 and Figure 5), which explains the lowest values of Young’s modulus.
The described regularities exhibit a good agreement with the data in [15,16,46], obtained after high-temperature solution treatment. The higher values of Young’s modulus in the cited works confirm the revealed nature of the synchronous growth of the E values with the grain size in an alloy with finer structures (see Figure 3).
Thus, varying the grain/subgrain size makes it possible to adjust the values of Young’s modulus; its magnitude decreases with the structural refinement. Nevertheless, the obtained results prove that it is impossible to obtain an E magnitude in the range of 10–30 GPa at an implant operating temperature of 37 °C only due to microstructural refinement. The E values in this range are realized in an alloy with UFG and a fine-grained structure at temperatures below −50 °C (see Figure 4).
The revealed regularities allow us to conclude that the reduction in Young’s modulus to the desired values can be obtained through aging. According to [27], the precipitation of new phases from a supersaturated solid solution is accompanied by a change in the elastic modulus. In this case, the value of E is affected not only by the change in the chemical composition and the lattice period of the matrix but also by the magnitude of the distortion of the crystal lattice of the precipitated particles and the magnitude of the elastic modulus [27]. The corresponding data on the E magnitude of the Ti3Ni4 precipitates would be useful in explaining the observed decrease in Young’s modulus under aging, although they were not discovered in the published articles. Nevertheless, it is known that the Ti3Ni4 phase has a rhombohedral crystal lattice, the symmetry of which is lower than that of B2-austenite and higher than that of B19’martensite [4].
Based on the revealed patterns, we can conclude that the effect of aging on the elastic modulus of Ni-rich NiTi alloy is determined by the peculiarities of the initial structure, mainly the defect density and distribution in the crystal lattice, as well as the grain size. The shift in the minimum of the V-shaped curves in the diagrams presented in Figure 4 and Figure 5 exactly matches with the shift in the position of the Ms points on the calorimetric curves that permits us to judge the efficiency of aging as well.
In a cold-worked material, the competing processes of aging and softening proceed simultaneously at a temperature of 430 °C. The observed decrease in E magnitude after aging (Figure 5 and Figure 6) suggests that the elastic modulus is more sensitive to aging compared to softening.
The observed identity of the values of E after aging of alloys with different initial structures allows us to conclude that Young’s modulus is insensitive to the size of the Ti3Ni4 precipitates and the nature of their distribution, although these structural differences are quite pronounced (the effect of the initial structure on aging-induced microstructure was described in detail in [8].
According to [12], the femoral cortical bone exhibits a value of T = 18 GPa and a tensile yield stress of 130 MPa in the longitudinal direction. Aged fine-grained titanium nickelide exhibits the same magnitude E at 37 °C (see Figure 5) and the closest magnitude of the stress plateau (200 MPa) to the cortical bone tissue.
It is important to note that the transformation yield stress in a fine-grained material exhibits an excellent agreement with that of human bone; therefore, we can evaluate the corresponding structure as the most preferred for bone implants.
The regularities obtained can be used to predict the functional and mechanical properties of titanium nickelide with different initial structures subjected to subsequent aging.

5. Conclusions

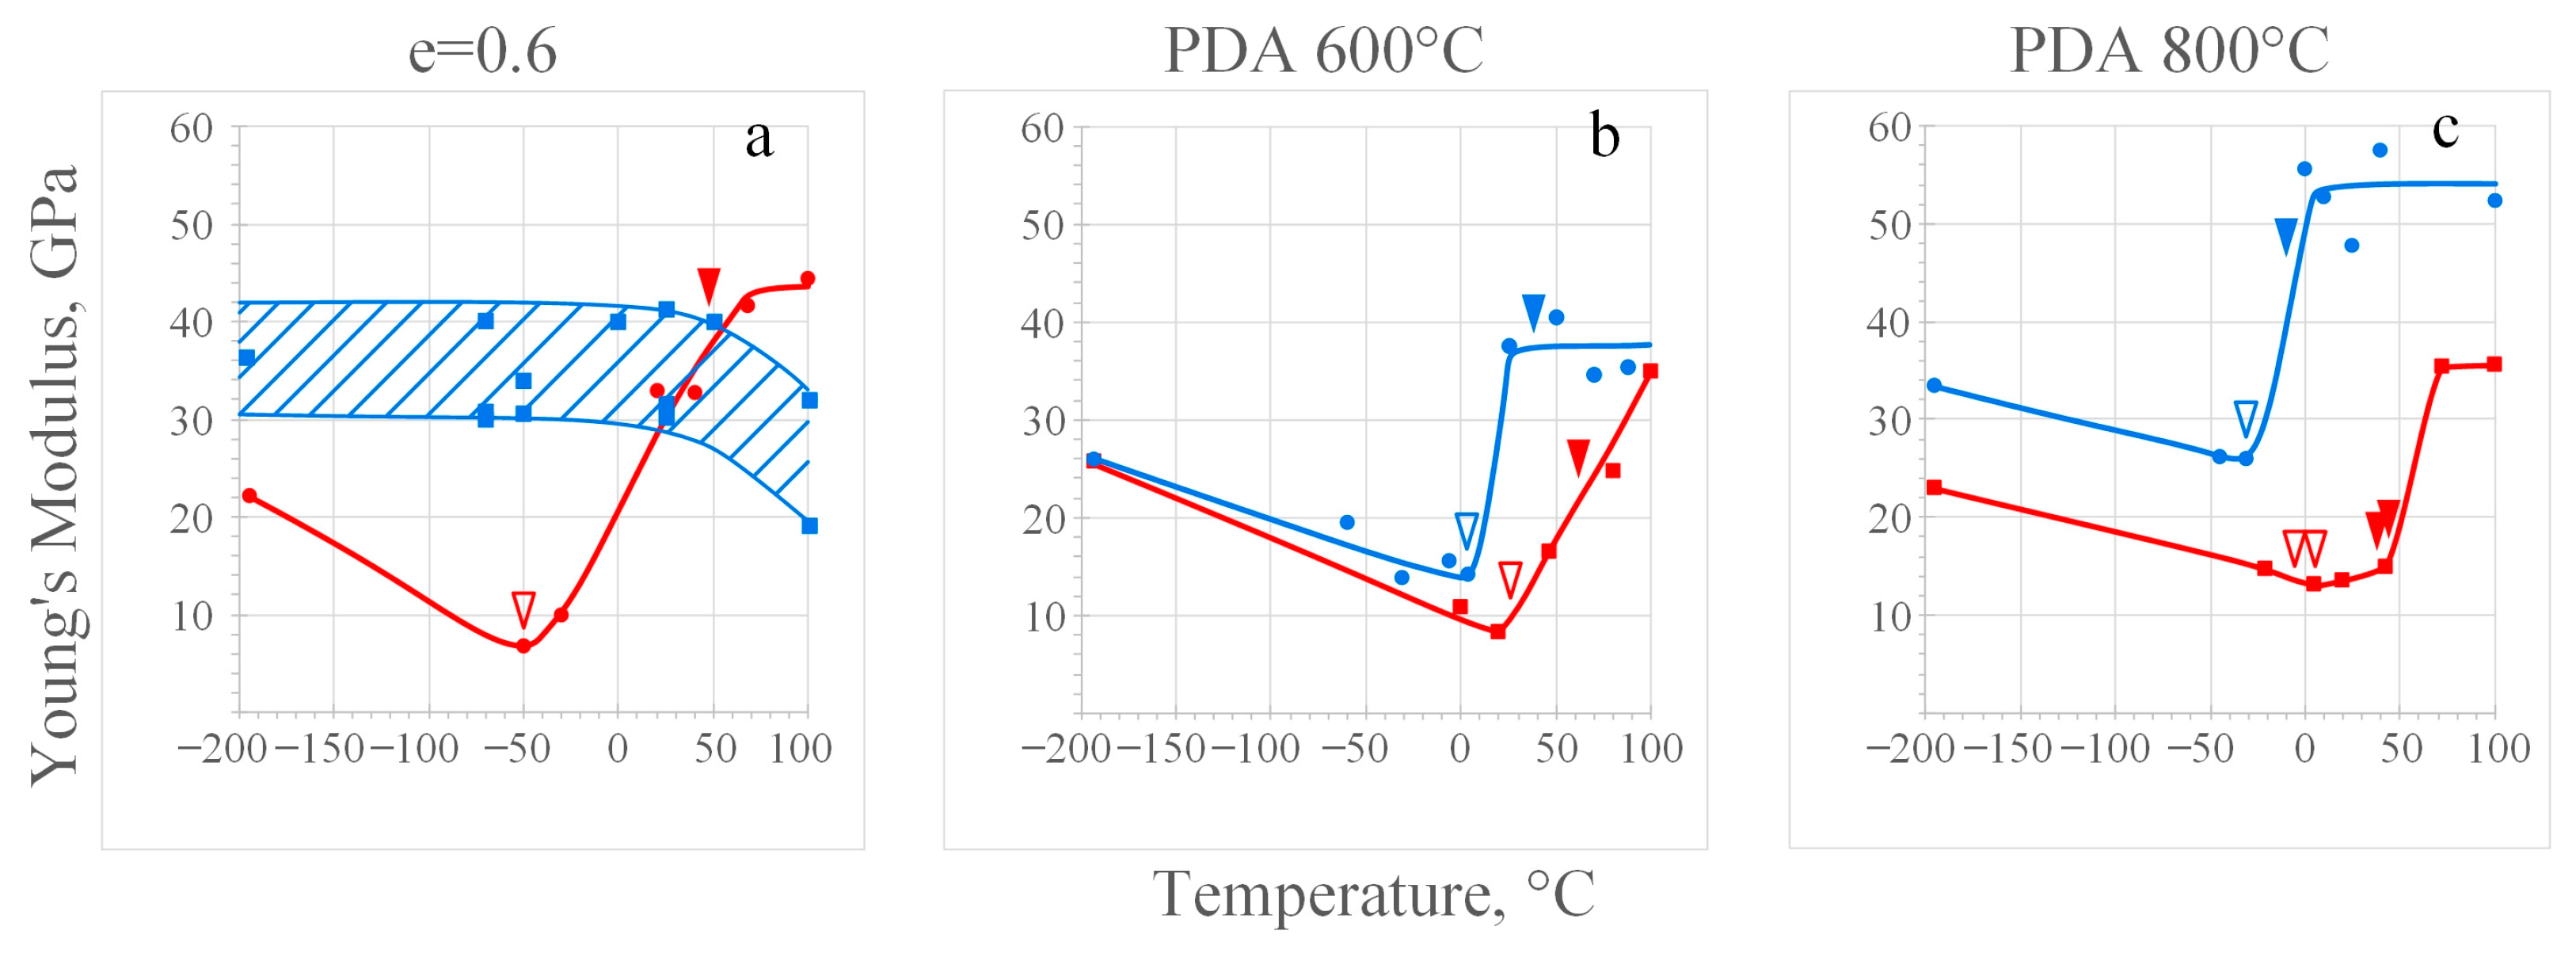
  • After PDA, the temperature dependence of Young’s modulus exhibits a pronounced V-shaped character with a minimum at the onset temperature of the forward martensitic transformation, Ms, regardless of the structure. The modulus magnitude is always higher in the region of existence of metastable B2-austenite compared to B19’-martensite due to the higher symmetry of the austenite’s crystal lattice. The exception is in as-deformed materials due to the suppression of martensitic transformations and significant residual stresses.
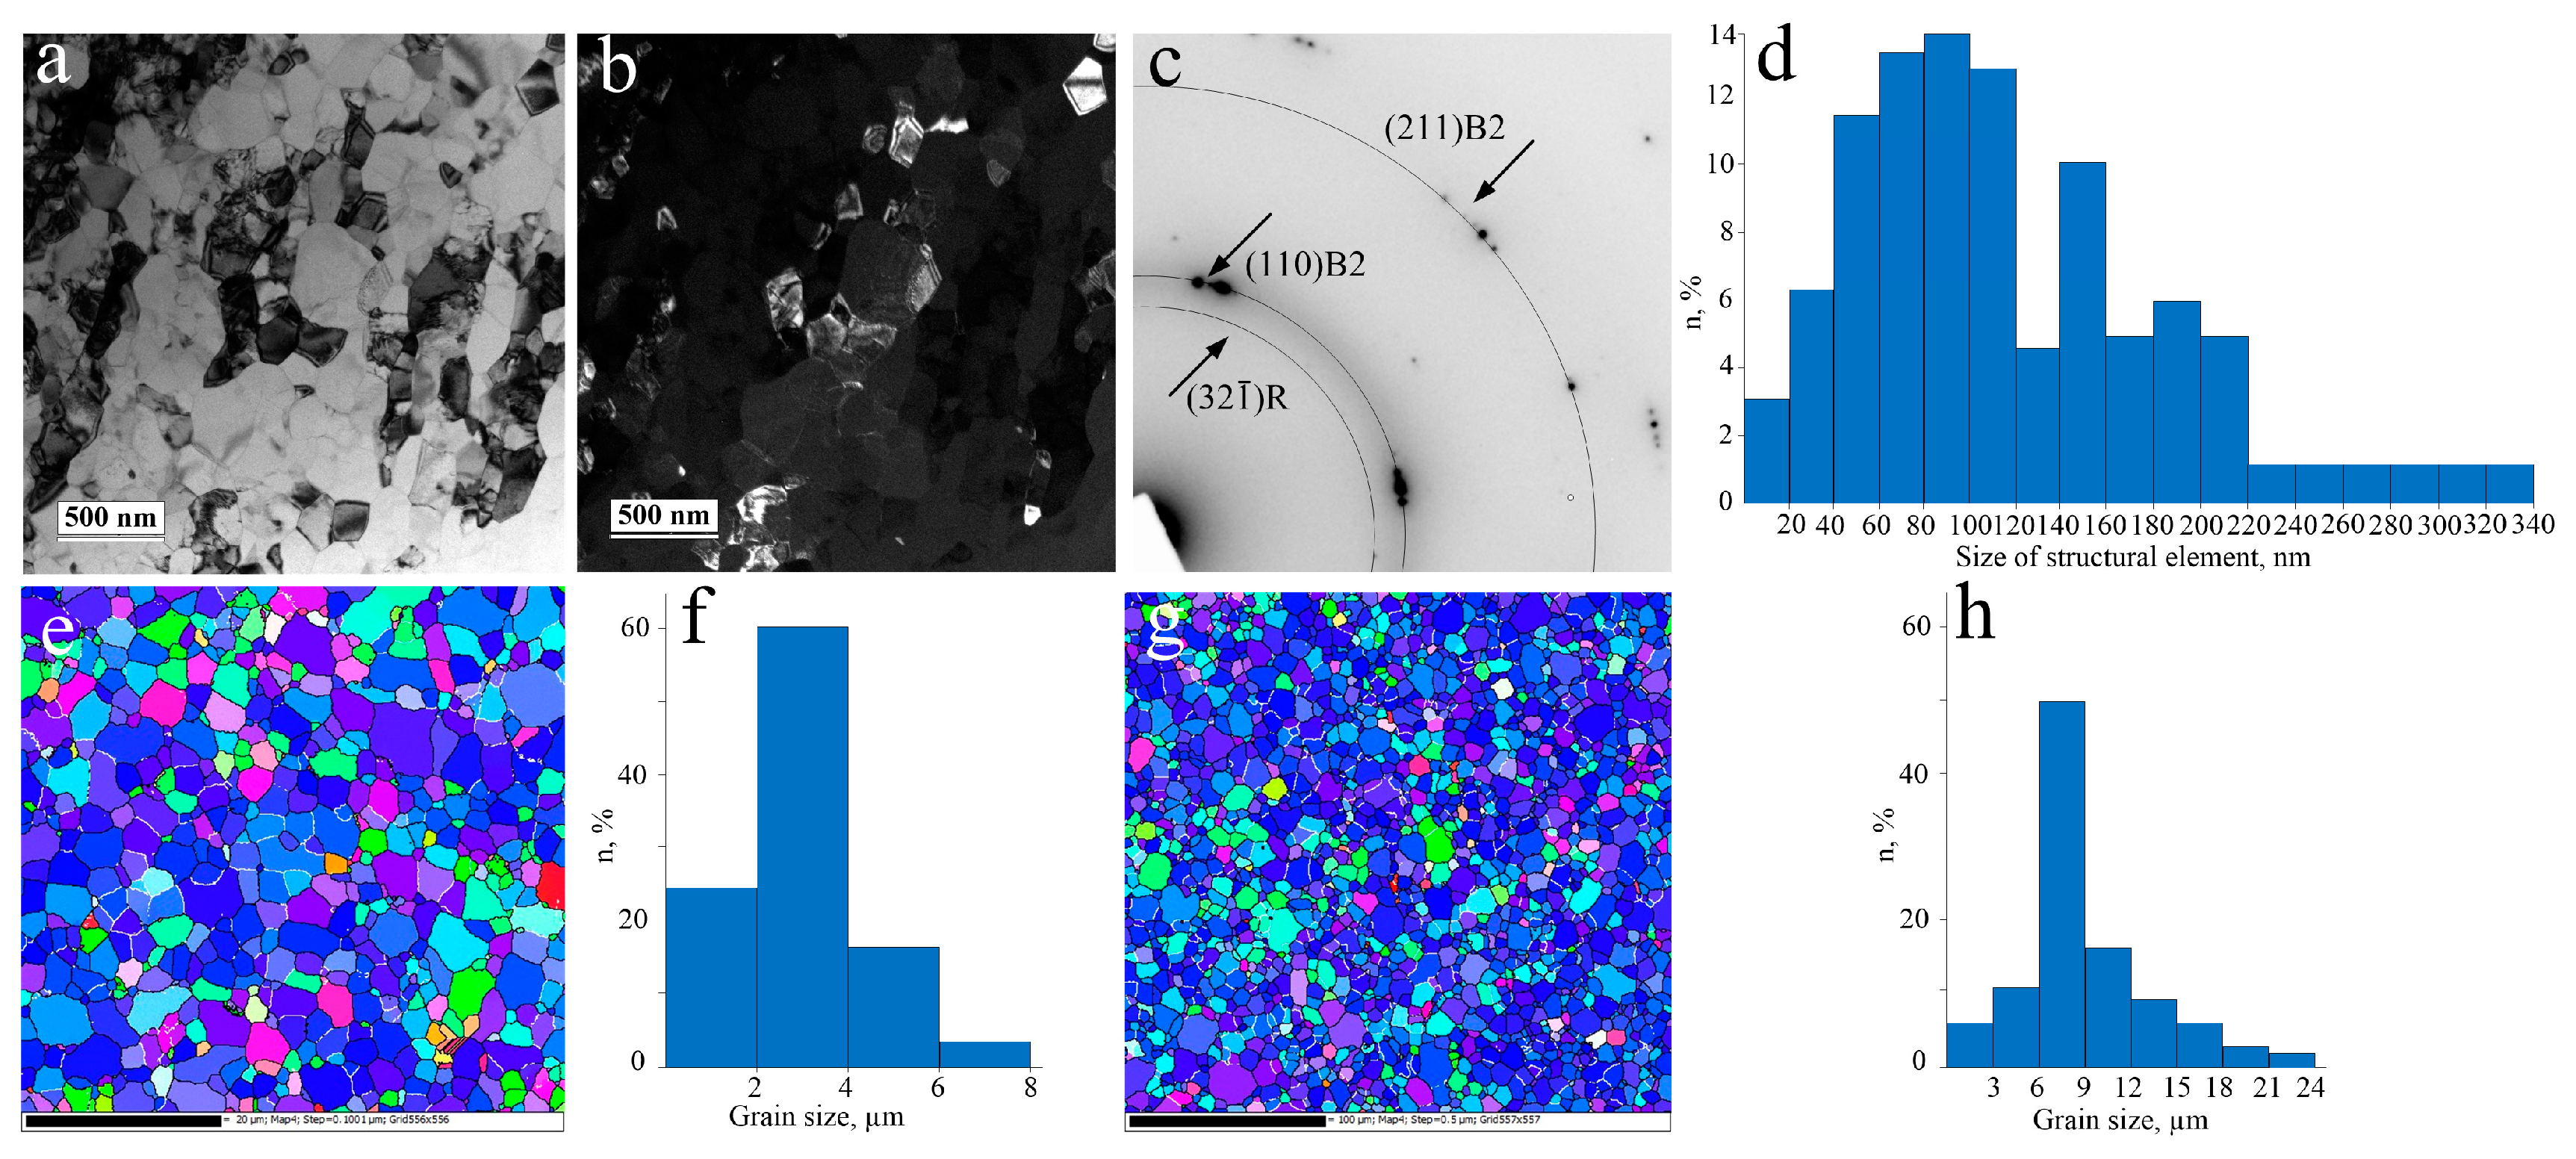
  • The grain/subgrain size of the B2-austenite Ni-rich NiTi alloy exhibits a pronounced effect on Young’s modulus magnitude. This effect is ambiguous for materials with grain sizes of 0.13–3 µm and depends on the test temperature. The recrystallized alloy with a grain size of 9 μm exhibits the highest values of E = 32–55 GPa over the entire temperature range.
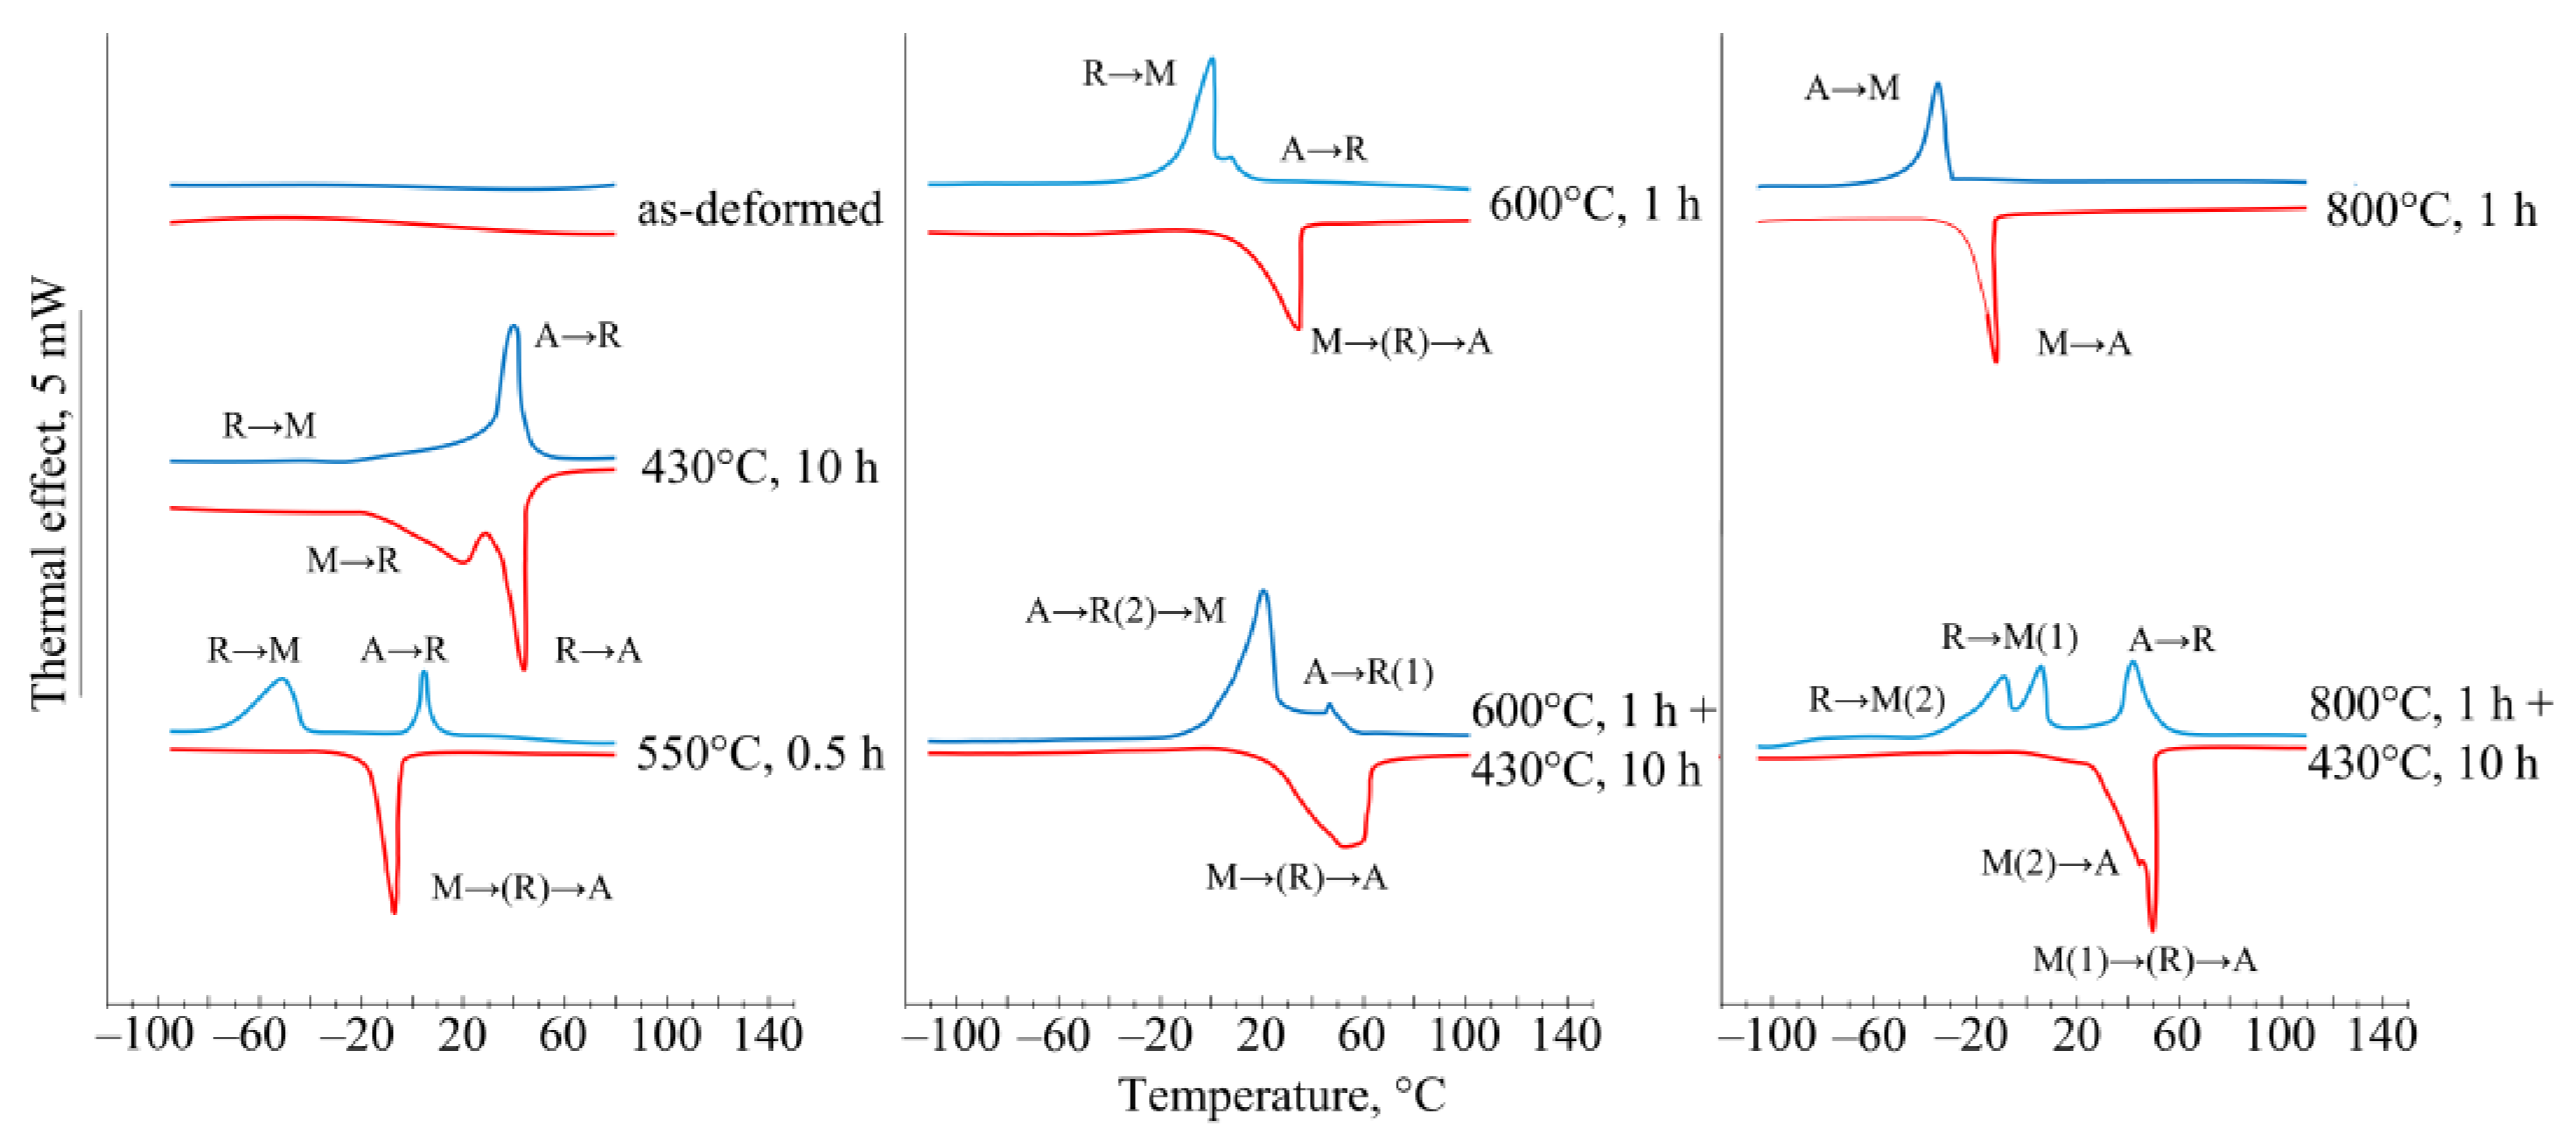
  • Varying the initial structure of Ni-rich NiTi alloy when using the same aging mode (430 °C, 10 h) makes it possible to precisely control the kinetics, sequence, and stages of the martensitic transformations and Young’s modulus.
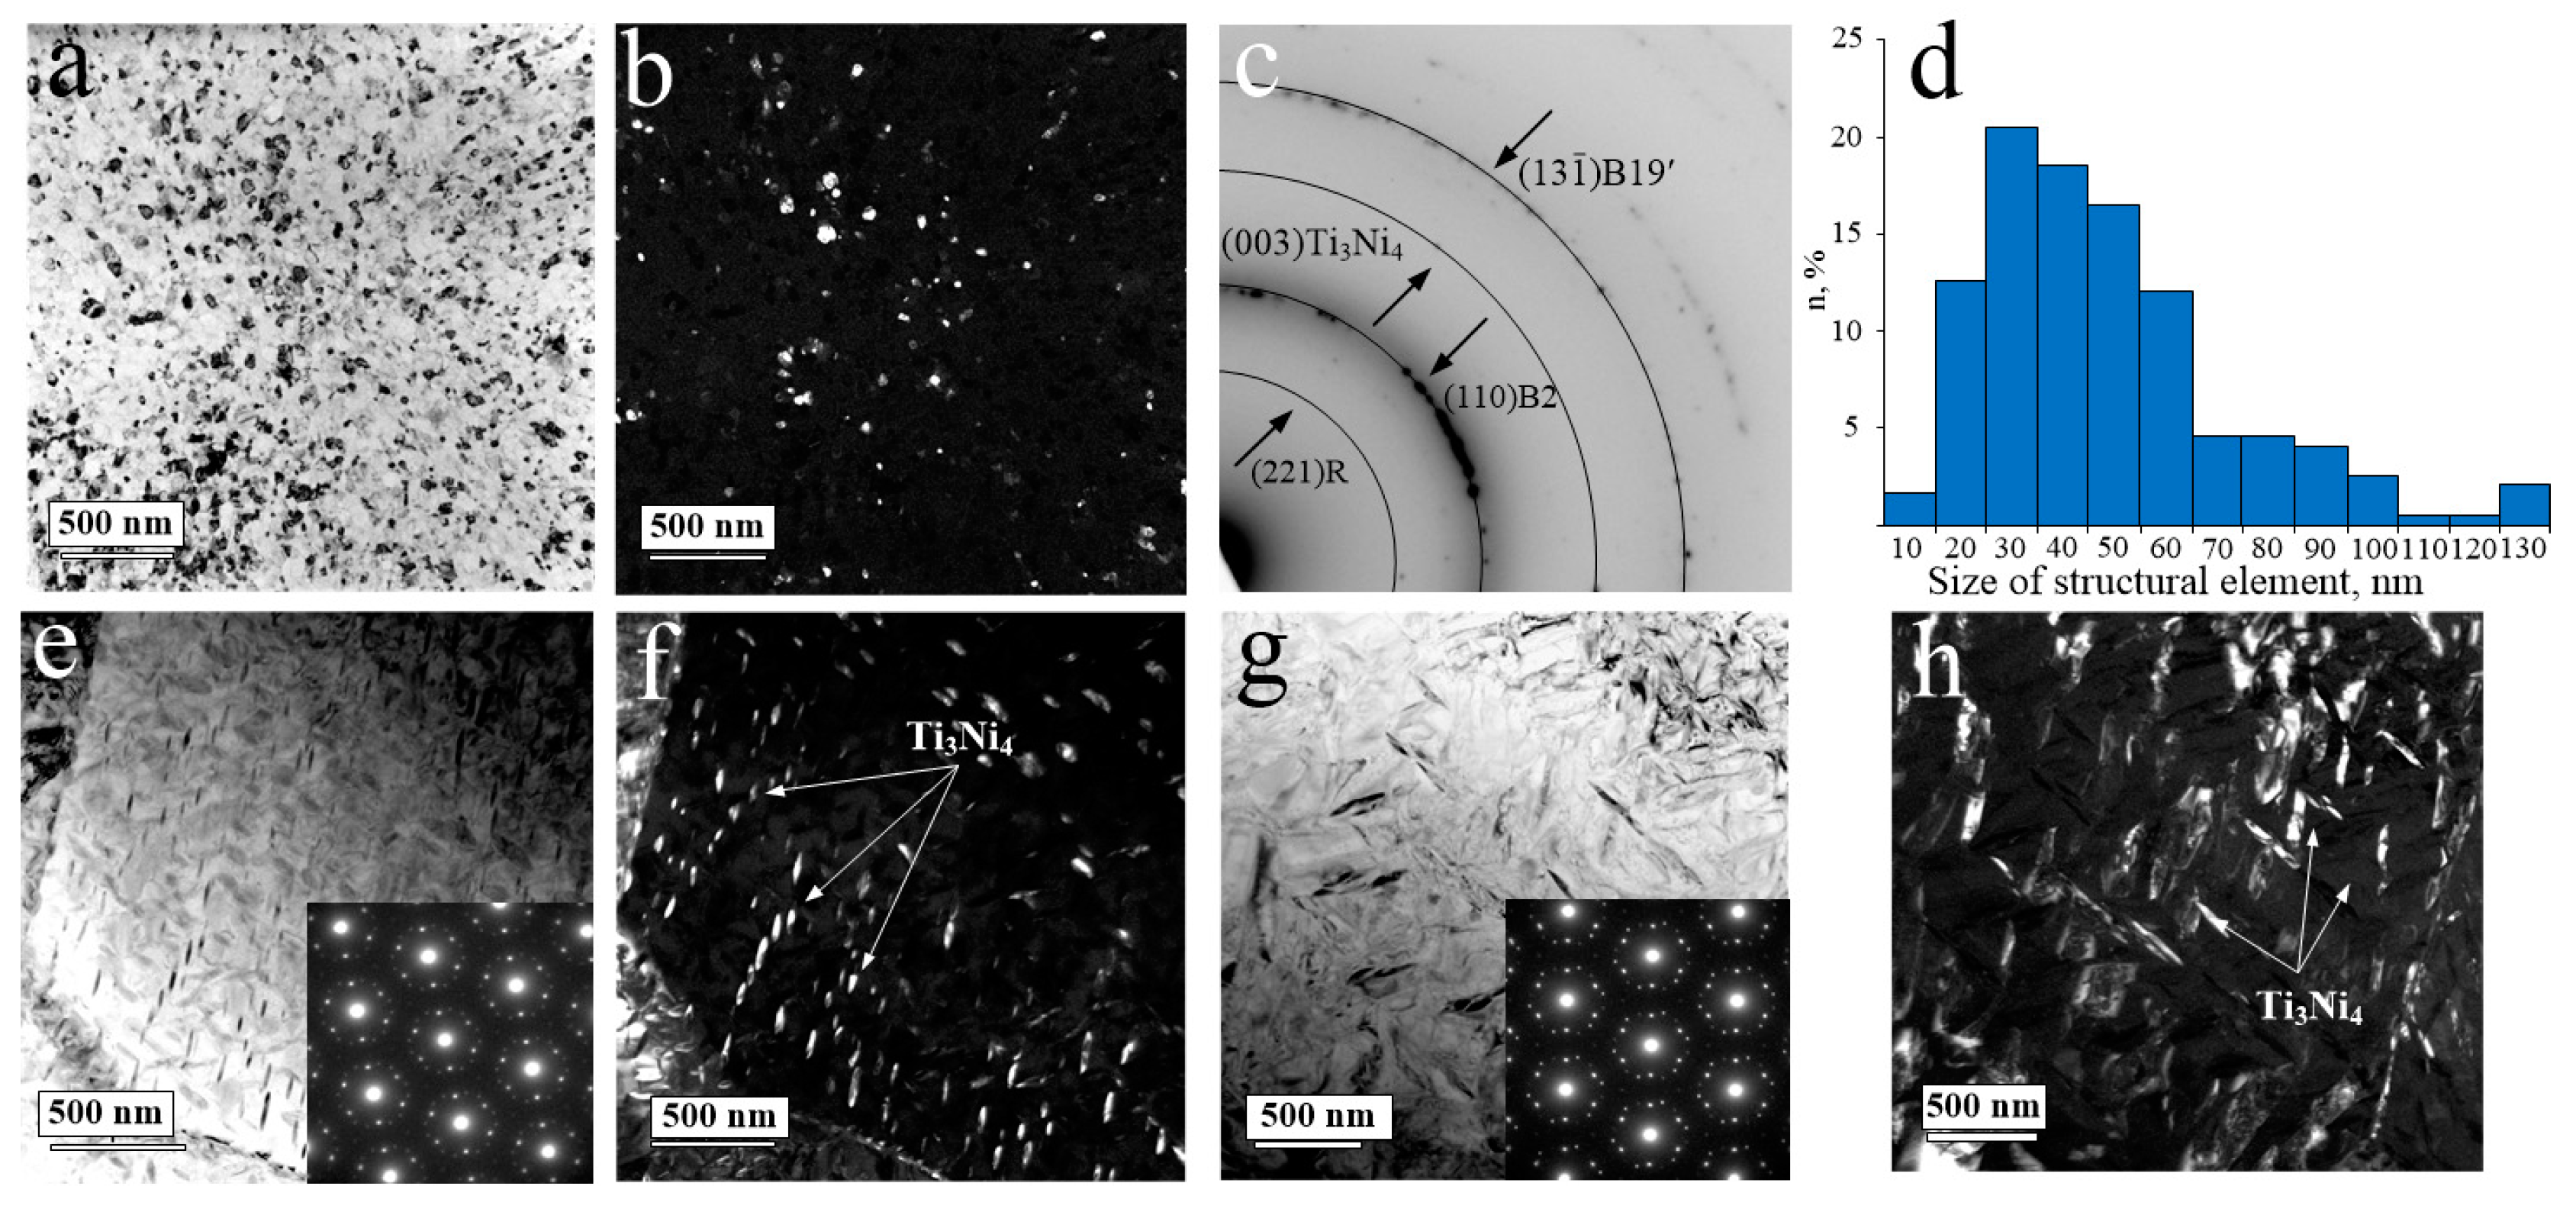
  • Aging of the recrystallized material results in Young’s modulus reduction and provides an equivalent magnitude of Young’s modulus over the entire test temperature range of −196 °C ≤ T ≤ +100 °C; this proves the insensitivity of E to the size and distribution of the Ti3Ni4 precipitates.
  • The initial structure strongly affects the effect of aging on Young’s modulus reduction; it is most pronounced in alloys with a relatively coarse grain size of 9 µm and brings a decrease of 3.8 times at a temperature of 37 °C. The observed reduction in E due to the aging of the as-deformed material proves that its magnitude is more sensitive to aging than to softening.
  • Aging of the initially recrystallized Ni-rich NiTi alloy makes it possible to obtain a bone-like elastic modulus range of E = 12–13 GPa at an operating temperature of 37 °C. The ultrafine-grained substructure exhibits the same values of Young’s modulus in the low temperature range of −196 °C ≤ T ≤ +25 °C. The fine-grained material exhibits a good agreement of the transformation yield stress with the yield stress of human bone; therefore, this structure is the most preferred for bone implants.

Author Contributions

Conceptualization, E.R.; methodology, E.R., V.K. and K.P., software, K.P. and S.M.; validation, E.R. and K.P., formal analysis, E.R. and K.P.; investigation, K.P., V.K., E.R. and N.R.; resources, V.A.; data curation E.R., writing—original draft preparation, E.R.; writing—review and editing, E.R. and K.P.; visualization, K.P. and S.M.; supervision, E.R. and K.P. All authors have read and agreed to the published version of the manuscript.

Funding

The reported study was performed with financial support from NUST MISIS (project code FSME-2023-0006).

Data Availability Statement

Not applicable.

Conflicts of Interest

The authors declare no conflict of interest.

References

  1. Auricchio, F.; Boatti, E.; Conti, M.; Marconi, S. SMA Biomedical Applications. Shape Memory Alloy Engineering: For Aerospace, Structural, and Biomedical Applications; Butterworth-Heinemann: Oxford, UK, 2021; pp. 627–658. [Google Scholar]
  2. Mohd Jani, J.; Leary, M.; Subic, A.; Gibson, M.A. A review of shape memory alloy research, applications and opportunities. Mater. Des. 2014, 56, 1078–1113. [Google Scholar] [CrossRef]
  3. Haga, Y.; Mineta, T.; Matsunaga, T.; Tsuruoka, N. Micro-Robotic Medical Tools Employing SMA Actuators for Use in the Human Body. J. Robot. Mechatron. 2022, 34, 1233–1244. [Google Scholar] [CrossRef]
  4. Otsuka, K.; Ren, X. Physical metallurgy of Ti-Ni-based shape memory alloys. Prog. Mater. Sci. 2005, 50, 511–678. [Google Scholar]
  5. Kuranova, N.N.; Makarov, V.V.; Pushin, V.G.; Ustyugov, Y.M. Influence of Heat Treatment and Deformation on the Structure, Phase Transformation, and Mechanical Behavior of Bulk TiNi-Based Alloys. Metals 2022, 12, 2188. [Google Scholar] [CrossRef]
  6. Lee, T.-J.; Kim, W.-J. Effect of Severe Plastic Deformation and Post-Deformation Heat Treatment on the Microstructure and Superelastic Properties of Ti-50.8 at.% Ni Alloy. Materials 2022, 15, 7822. [Google Scholar]
  7. Kaya, I.; Karaca, H.E.; Nagasako, M.; Kainuma, R. Effects of aging temperature and aging time on the mechanism of martensitic transformation in nickel-rich NiTi shape memory alloys. Mat. Char. 2020, 159, 110034. [Google Scholar] [CrossRef]
  8. Ryklina, E.P.; Polyakova, K.A.; Resnina, N.N. Role of Structural Heredity in Aging-Induced Microstructure and Transformation Behavior in Ni-rich Titanium Nickelide. Shape Mem. Superelast. 2022, 8, 200–214. [Google Scholar] [CrossRef]
  9. Polyakova, K.A.; Ryklina, E.P.; Prokoshkin, S.D. Effect of Grain Size and Ageing-Induced Microstructure on Functional Characteristics of a Ti-50.7 at.% Ni Alloy. Shape Mem. Superelast. 2020, 6, 139–147. [Google Scholar] [CrossRef]
  10. Wilson, J. Metallic biomaterials: State of the art and new challenges. In Fundamental Biomaterials: Metals; Woodhead Publishing Series in Biomaterials: Cambridge, UK, 2018; pp. 1–33. [Google Scholar]
  11. Nicholson, P.; Cheng, X.; Lowet, G.; Boonen, S.; Davie, M.; Dequeker, J.; Van der Perre, G. Structural and material mechanical properties of human vertebral cancellous bone. Med. Eng. Phys. 1997, 19, 729–737. [Google Scholar] [CrossRef]
  12. Morgan, E.F.; Unnikrisnan, G.U.; Hussein, A.I. Hussein Bone Mechanical Properties in Healthy and Diseased States. Annu. Rev. Biomed. Eng. 2018, 20, 119–143. [Google Scholar] [CrossRef]
  13. Davis, J.R. Handbook of Materials for Medical Devices; ASM International: Materials Park, OH, USA, 2003; 341p. [Google Scholar]
  14. Kohrt, W.; Bloomfield, S.; Little, K.; Nelson, M.; Yingling, V. American College of Sports Medicine Position Stand: Physical activity and bone health. Med. Sci. Sports Exerc. 2004, 36, 1985–1996. [Google Scholar] [CrossRef] [PubMed] [Green Version]
  15. Pushin, V.G.; Prokoshkin, S.D.; Valiev, R.Z.; Brailovskii, V.; Valiev, E.Z.; Volkov, A.E.; Glezer, A.M.; Dobatrin, S.V.; Dudarev, E.F.; Zhu, V.T.; et al. Titanium Nickelide Alloys with Shape memory Effect. In Part 1. Structure, Phase Transformations and Properties; lzd-vo UrO RAN: Ekaterinburg, Russia, 2006. (In Russian) [Google Scholar]
  16. Xu, Z.; Hao, Y.; Ji, Y.; Xiao, A.; Qian, Y.; Wang, W.; Ren, X. Simultaneously Increasing the Strength and Decreasing the Modulus in TiNi Alloys via Plastic Deformation. Scr. Mater. 2022, 209, 114374. [Google Scholar]
  17. Šittner, P.; Heller, L.; Pilch, J.; Curfs, C.; Alonso, T.; Favier, D. Young’s Modulus of Austenite and Martensite Phases in Superelastic NiTi Wires. J. Mater. Eng. Perform. 2014, 23, 2303–2314. [Google Scholar] [CrossRef]
  18. Deng, Z.; Huang, K.; Yin, H.; Sun, Q. Temperature-dependent mechanical properties and elastocaloric effects of multiphase nanocrystalline NiTi alloys. J. Alloys Compd. 2023, 938, 168547. [Google Scholar] [CrossRef]
  19. Ryklina, E.P.; Polyakova, K.A.; Murygin, S.R.; Komarov, V.S.; Resnina, N.N.; Andreev, V.A. Role of structural heredity in control of functional and mechanical characteristics of Ni-rich titanium nickelide. Phys. Met. Metallogr. 2022, 123, 1226–1233. [Google Scholar] [CrossRef]
  20. Gunderov, D.V.; Maksutova, G.; Churakova, A.; Lukyanov, A.; Kreitcberg, A.; Raab, G.I.; Sabirov, I.; Prokoshkin, S. Strain rate sensitivity and deformation activation volume of coarse-grained and ultrafine-grained TiNi alloys. Scr. Mater. 2015, 102, 99–102. [Google Scholar]
  21. Kudryashova, A.; Lukashevich, K.; Derkach, M.; Strakhov, O.; Dubinskiy, S.; Andreev, V.; Prokoshkin, S.; Sheremetyev, V. Effect of Cold Drawing and Annealing in Thermomechanical Treatment Route on the Microstructure and Functional Properties of Superelastic Ti-Zr-Nb Alloy. Materials 2023, 16, 5017. [Google Scholar] [CrossRef]
  22. Konopatsky, A.; Sheremetyev, V.; Dubinskiy, S.; Zhukova, Y.; Firestein, K.; Golberg, D.; Filonov, M.; Prokoshkin, S.; Brailovski, V. Structure and Superelasticity of Novel Zr-Rich Ti-Zr-Nb Shape Memory Alloys. Shape Mem. Superelast. 2021, 7, 304–313. [Google Scholar] [CrossRef]
  23. Betekhtin, V.I.; Kolobov, Y.; Golosova, O.; Dvorak, J.; Sklenička, V.; Kardashev, B.K.; Kadomtsev, A.G.; Narykova, M.; Ivanov, M. Elastic modulus, microplastic properties and durability of titanium alloys for biomedical applications. Rev. Adv. Mater. Sci. 2016, 45, 42–51. [Google Scholar]
  24. Ryklina, E.P.; Polyakova, K.A.; Murygin, S.R.; Isaenkova, M.G.; Zaripova, M.M.; Fesenko, V.A.; Komarov, V.S.; Andreev, N.V.; Resnina, N.N.; Andreev, V.A. On Textural Heredity of Ni-rich Ti–Ni alloy: Specific Features of Transformation and Tensile Behavior. Shape Mem. Superelast. 2023. [CrossRef]
  25. Kolobova, A.Y.; Ryklina, E.P.; Prokoshkin, S.D.; Inaekyan, K.E.; Brailovskii, V. Study of the Evolution of the Structure and Kinetics of Martensitic Transformations in a Titanium Nickelide upon Isothermal Annealing after Hot Helical Rolling. Phys. Met. Metall. 2018, 119, 134–145. [Google Scholar] [CrossRef]
  26. Poletika, T.M.; Girsova, S.L.; Lotkov, A.I. Ti3Ni4 precipitation features in heat-treated grain/subgrain nanostructure in Ni-rich TiNi alloy. Intermetallics 2020, 127, 106966. [Google Scholar] [CrossRef]
  27. Lifshits, B.G.; Kraposhin, V.S.; Linetsky, Y.L. Physical Properties of Metals and Alloys; Metallurgiya: Moscow, Russia, 1980; 320p. (In Russian) [Google Scholar]
  28. Sun, Z.; Hao, S.; Kang, G.; Ren, Y.; Liu, J.; Yang, Y.; Kong, X.; Feng, B.; Wang, C.; Zhao, K.; et al. Exploiting ultra-large linear elasticity over a wide temperature range in nanocrystalline NiTi alloy. J. Mater. Sci. Technol. 2020, 57, 197–203. [Google Scholar]
  29. Prokoshkin, S.; Brailovski, V.; Inaekyan, K.; Korotitskiy, A.; Kreitsberg, A. Thermomechanical Treatment of TiNi Intermetallicc-Based Shape Memory Alloys. In Book Shape Memory Alloys: Properties, Technologies, Opportunities; Resnina, N., Rubanik, V., Eds.; Trans Tech Publications Ltd: Zurich, Switzerland, 2015; pp. 260–341. [Google Scholar]
  30. Gorelik, S.S.; Dobatkin, S.V.; Kaputkina, L.M. Rekrystallizatsiya metallov i splavov. [Recrystallization of Metals and Alloys]; MISiS Publications: Moscow, Russia, 2005; 432p. (In Russian) [Google Scholar]
  31. Karbakhsh Ravari, B.; Farjami, S.; Nishida, M. Effects of Ni concentration and aging conditions on multistage martensitic transformation in aged Ni-rich Ti–Ni alloys. Acta Mater. 2014, 69, 17–29. [Google Scholar] [CrossRef]
  32. Wang, X.; Li, C.; Verlinden, B.; Humbeeck, J.V. Effect of grain size on aging microstructure as reflected in the transformation behavior of a low-temperature aged Ti–50.8 at.% Ni alloy. Scr. Mater. 2013, 69, 545–548. [Google Scholar] [CrossRef]
  33. Zel’dovich, V.I.; Khomskaya, I.V.; Frolova NYu Sbitneva, G.A. Nucleation of the R martensite in titanium nickelide. Phys. Met. Metall. 2001, 92, 490–495. [Google Scholar]
  34. Nikanorov, S.P.; Kardashev, B.K. Elasticity and Dislocation Inelasticity of Crystals; Nauka: Moscow, Russia, 1985; 256p. [Google Scholar]
  35. Gremaud, G. Dislocation–Point Defect Interactions. Mater. Sci. Forum 2001, 366–368, 178–246. [Google Scholar] [CrossRef]
  36. Chaim, R.; Hefetz, M. Effect of Grain Size on Elastic Modulus and Hardness of Nanocrystalline ZrO2–3 wt % Y2O3 Ceramic. J. Mater. Sci. 2004, 39, 3057–3061. [Google Scholar] [CrossRef]
  37. Cabanillas-Casas, C.J.; Cuba-Supanta, G.; Rojas-Tapia, J.; Rojas-Ayala, C. Shape and size effects of the pore on the mechanical properties of nanoporous graphene membranes. Momento 2021, 62, 63–78. [Google Scholar]
  38. Zhu, K.; Li, C.; Zhu, Z.; Liu, C.S. Measurement of the Dynamic Young’s Modulus of Porous Titanium and Ti6Al4V. J. Mater. Sci. 2007, 42, 7348–7353. [Google Scholar] [CrossRef]
  39. Lin, J.; Balint, D.; Pietrzyk, M. Microstructure Evolution in Metal Forming Processes; Woodhead Publishing: Sawston, UK, 2012; 416p. [Google Scholar]
  40. Zhang, Z.; Wang, Y.; Wang, D.; Zhou, Y.; Otsuka, K.; Ren, X. Phase diagram of Ti50−xNi50+x: Crossover from martensite to strain glass. Phys. Rev. B 2010, 81, 224102. [Google Scholar] [CrossRef] [Green Version]
  41. Deng, Z.; Chu, K.; Li, Q.; Onuki, Y.; Sun, Q. Elinvar property of cold-rolled NiTi alloy. Scr. Mater. 2020, 187, 197–201. [Google Scholar] [CrossRef]
  42. Chernov, V.M.; Kardashev, B.K.; Krjukova, L.M.; Mamaev, L.I.; Plaksin, O.A.; Rusanov, A.E.; Solonina, M.I.; Stepanov, V.A.; Votinova, S.N.; Zavialski, L.P. Internal Friction and Anelastic Properties of Vanadium and V-Ti-Cr Alloys. J. Nucl. Mater. 1998, 257, 263–273. [Google Scholar] [CrossRef]
  43. Dudarev, E.F.; Pochivalova, G.P.; Kolobov, Y.R.; Kashin, O.A.; Galkina, I.G.; Girsova, N.V.; Valiev, R.Z. True Grain-Boundary Slipping in Coarse- and Ultrafine-Grained Titanium. Russ. Phys. J. 2004, 47, 617–625. [Google Scholar] [CrossRef]
  44. Liu, Y.G.; Zhou, J.Q.; Ling, X. Impact of Grain Size Distribution on the Multiscale Mechanical Behavior of Nanocrystalline Materials, Mater. Sci. Eng. A 2010, 527, 1719–1729. [Google Scholar] [CrossRef]
  45. Alhajeri, S.N.; Fox, A.G.; Langdon, T.G. A Convergent-Beam Electron Diffraction Study of Strain Homogeneity in Severely Strained Aluminum Processed by Equal-Channel Angular Pressing. Acta Mater. 2011, 59, 7388–7395. [Google Scholar] [CrossRef]
  46. Kardashev, B.K.; Narykova, M.V.; Betekhtin, V.I.; Kadomtsev, A.G. Evolution of Elastic Properties of Ti and Its Alloys due to Severe Plastic Deformation. Phys. Mesomech. 2020, 23, 193–198. [Google Scholar] [CrossRef]
Figure 1. Microstructure after PDA and corresponding histograms: (ad) 550 °C, 0.5 h; TEM, BF (a) and DF (b) images, the SAED negatives (c), and a histogram (d); (e,f) 600 °C, 1 h, EBSD picture (e) and histogram (f); (g,h) 800 °C, 1 h, EBSD picture (g) and histogram (h).
Metals 13 01428 g001
Figure 2. TEM microstructure after aging at 430 °C for 10 h using various initial states (ad). The initial as-deformed structure, with BF (a) and DF (b) images, the SAED negative (c), and a histogram (d); (e,f) the initial fine-grained structure with an average grain size of 3 µm (preliminary PDA at 600 °C, 1 h); (g,h) the initial coarse-grained structure with an average grain size of 9 µm (preliminary PDA at 800 °C, 1 h).
Metals 13 01428 g002
Figure 3. DSC curves under cooling (upper, blue) and subsequent heating (lower, red); A, R, M denote B2-austenite, R-martensite, and B19′martensite, respectively.
Metals 13 01428 g003
Figure 4. Test temperature dependence of Young’s modulus of titanium nickelide with different grain/subgrain sizes: violet line, 130 nm (550 °C, 30 min); red line, 3 µm (600 °C, 1 h); green line, 9 µm (800 °C, 1 h). Note: symbols ∇ and ▼ denote the Ms and Af points, respectively. Note: symbols ● and ■ refer to unaged and aged samples respectively.
Metals 13 01428 g004
Figure 5. Evolution of Young’s modulus before aging: (a) as-deformed; (b) 600 °C, 1 h; (c) 800 °C, 1 h (blue curves) and after aging at 430 °C, 10 h (red curves). Note: the symbols ∇ and ▼ denote the points Ms and Af, respectively. Note: symbols ● and ■ refer to unaged and aged samples respectively.
Metals 13 01428 g005
Figure 6. Comparative stress–strain diagrams before aging (EBA, blue curves) and after aging at 430 °C for 10 h (EBA, red curves): (a) 600 °C, 1 h; (b) 800 °C, 1 h.
Metals 13 01428 g006
Table 1. Characteristic temperatures of martensitic transformations; indexes. Note: “p, s, f” mean the peak, start and finish temperatures of the corresponding MTs.
PDA ModeCooling, °C
A → RR → MA → M
Tp R s A R f A Tp M s R M f R TpMsMf
as-deformed + aging404534−48
550 °C, 0.5 h481−51−42−61
600 °C, 1 h91714−7
600 °C, 1 h + aging464820260
800 °C, 1 h−37−31−44
800 °C, 1 h + aging43513765−10−9−6−21
PDA modeHeating, °C
M → RR → AM → A (M → R → A)
Tp R s M R f M TpAsAfTp AsAf
as-deformed + aging208443848
550 °C, 0.5 h9212
600 °C, 1 h341937
600 °C, 1 h + aging512561
800 °C, 1 h−13−19−10
800 °C, 1 h + aging45 (2)
50 (1)
38
44
*
52
Note: R s A , Tp, and R f A are the onset, peak, and endset temperatures of the forward B2 → R MT, respectively; M s R , Tp, and M f R are those of the forward R → B19’ MT; Ms, Tp, and Mf are those of the forward B2 → (R) → B19’ MT; As, Tp, and Af are those of the reverse B19’ → (R) → B2 MT; R s M , Tp, and R f M are those of the reverse B19’ → R MT; As, Tp, and Af are those of the reverse R → B2 MT. * The magnitude cannot be determined reliably.
Table 2. The average magnitudes of Young’s modulus in the temperature range of −196 °C ≤ T ≤ 100 °C (E values determined at Ms temperature are highlighted in bold).
PDA ModesYoung’s Modulus, GPa/Test Temperature, °C
−196−70−50−40−30−21−704925304350607080100
CD *
(e = 0.6)
u.b.4242424132
l.b.30302919
CD + aging22710334244
550 °C, 0.5 h28101326454647363447
600 °C, 1 h2614151438403536
600 °C, 1 h + aging26109172535
800 °C, 1 h332727555454525852
800 °C, 1 h + aging23151313153535
Note: * the upper (u.b.) and lower (l.b.) boundaries of the area in which the values of E are determined.
Disclaimer/Publisher’s Note: The statements, opinions and data contained in all publications are solely those of the individual author(s) and contributor(s) and not of MDPI and/or the editor(s). MDPI and/or the editor(s) disclaim responsibility for any injury to people or property resulting from any ideas, methods, instructions or products referred to in the content.

