Article

Dislocation Strengthening and Texture Evolution of Non-Oriented Fe-3.3 wt% Si Steel in Double Cold Rolling

1
The State Key Laboratory of Rolling and Automation, Northeastern University, Shenyang 110819, China
2
Silicon Steel Division of Angang Steel Co., Ltd., North of Angang Factory, Anshan 114009, China
3
Section of Environmental Protection Key Laboratory of Eco-Industry, School of Metallurgy, Northeastern University, Shenyang 110819, China
*
Authors to whom correspondence should be addressed.
Metals 2024, 14(10), 1127; https://doi.org/10.3390/met14101127
Submission received: 30 August 2024 / Revised: 21 September 2024 / Accepted: 2 October 2024 / Published: 3 October 2024
(This article belongs to the Special Issue Novel Insights and Advances in Steels and Cast Irons)

Abstract

:
An excellent Fe-3.3 wt% Si steel was fabricated by double cold rolling and final annealing. The evolution of the microstructure and texture was studied by optical microscope (OM), X-ray diffraction (XRD), ex situ, and quasi-in situ electron backscattered diffraction (EBSD) to investigate the recrystallization behavior. Double cold rolling significantly reduced the adverse γ texture in the final annealed sheets, and a stronger η texture was observed. With a reduction ratio of 50% and 65% during double cold rolling, the γ texture almost disappeared, whereas the η texture was obviously improved. Consequently, the texture factor reached its peak, leading to a reduction in iron loss and an enhancement of magnetic induction. By combining texture regulation with dislocation strengthening, the magnetic properties of Fe-3.3 wt% Si steel were improved, and the yield strength also increased. The final sheet exhibiting exceptional magnetic characteristics and enhanced strength attained a reduction in iron loss (P10/400 = 21.84 W/kg) of 6.43 W/kg, along with an enhancement of magnetic induction (B50 = 1.698 T) of 0.038 T and yield strength (Rp0.2 = 578 MPa) of 37 MPa compared to a single-stage cold rolling process.

1. Introduction

Non-oriented silicon steel is a type of electrical steel containing 2–3% silicon [1,2]. Non-oriented silicon steel exhibits good permeability in all directions and uniform electromagnetic properties, making it superior to alternating current electromagnetic field performance [3]. Owing to its exceptional magnetic characteristics, non-oriented silicon steel is extensively utilized for manufacturing core materials for generators, transformers, and motors [4,5]. In contrast to conventional products, advanced non-oriented silicon steel not only maintains exceptional electromagnetic performance but also provides increased yield strength, enhancing durability and reliability [6]. Dislocation strengthening to enhance strength represents a form of resource-efficient high-strength electrical steel [7]. Zhong et al. [8] and Yu et al. [9] demonstrated that recrystallization annealing significantly improved magnetic properties but negatively impacted mechanical properties. Lin et al. [10] and Zhang et al. [11] indicated that the decline in iron loss and yield strength with increased recrystallization rate was ascribed to the substantial reduction in dislocation density during the recrystallization process. Thus, the challenge of using dislocation strengthening methods lies in enhancing the mechanical properties without compromising the magnetic performance, which remains a key research focus.
When using the traditional single-stage rolling method to produce silicon steel, a substantial reduction ratio in cold rolling can result in the development of strong γ and α textures in the final annealed sheets [12]. Therefore, double cold rolling has been proposed to improve the recrystallization textures and optimize the magnetic properties of annealed sheets [13]. Qin et al. [14] and Yao et al. [15] demonstrated that the double cold rolling route introduced a strong η texture to the annealed sheets. Li et al. [16] indicated that a two-step rolling method remarkably weakened the detrimental γ texture while enhancing the λ fiber texture, thereby improving magnetic characteristics. Lu et al. [17] examined the impact of a two-stage rolling route on 4.5 wt% Si non-oriented electrical steel, finding that a moderate reduction can achieve excellent mechanical and magnetic properties. To enhance the regulation of the microstructure and texture and to improve the magnetic and mechanical properties, it is crucial to deepen our understanding of the mechanisms that affect the texture evolution and recrystallization behavior of high-strength silicon steel subjected to the double cold rolling process.
In recent years, characterization techniques using quasi-in situ electron backscattered diffraction (EBSD) have provided new insights into the study of material recrystallization behavior [18,19,20]. Quasi-in situ EBSD technology offers direct visualization of microstructure changes during the recrystallization process, making it an effective tool for in-depth analysis of texture evolution mechanisms in silicon steel [21]. In this study, Fe-3.3 wt% Si non-oriented silicon steel was produced through double cold rolling processes and dislocation strengthening. This study investigated the microstructure evolution in double cold rolling processes and the impact of dislocation strengthening on magnetic and mechanical properties. Using quasi-in situ EBSD techniques, this study elucidated the texture evolution and strengthening mechanisms of Fe-3.3 wt% Si steel during rolling and annealing, providing theoretical support for industrial production processes.

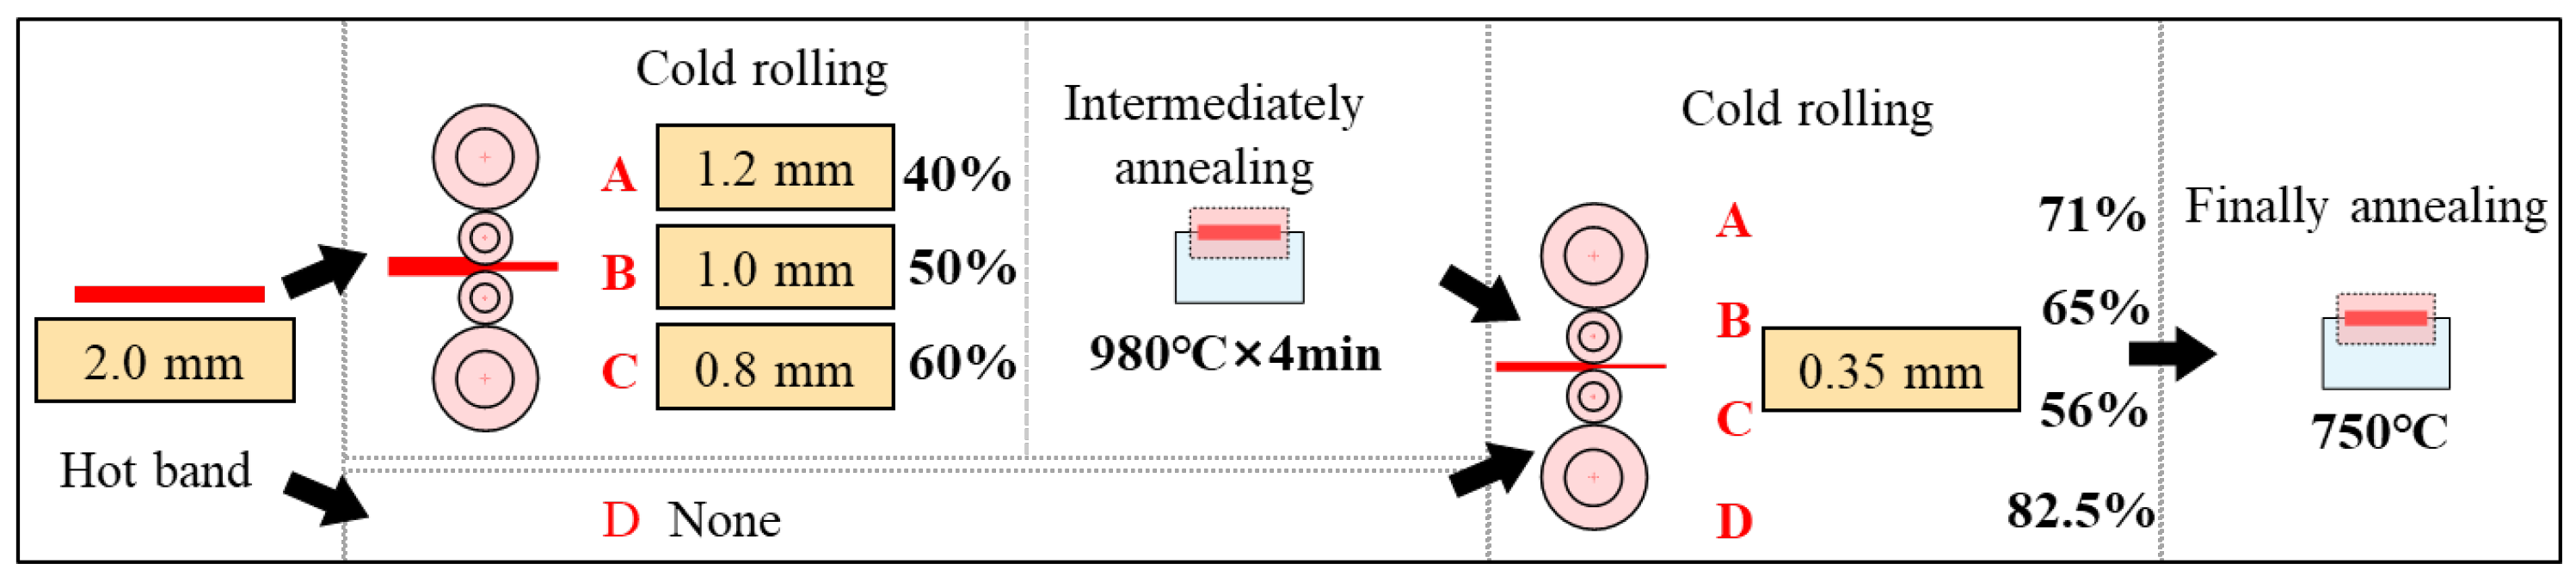
2. Materials and Methods

The experimental material was a Fe-3.3 wt% Si steel hot-rolled sheet with a thickness of 2 mm; its specific composition is listed in Table 1. Figure 1 illustrates the process flow. Four samples measuring 120 mm (RD, rolling direction) × 100 mm (TD) were cut from a hot-rolled sheet via wire cutting. Three of the samples were rolled to intermediate thicknesses of 1.2, 1.0, and 0.8 mm with multiple passes along the rolling direction (processes A, B, and C, respectively). Subsequently, the three samples were placed in a box furnace at 980 °C for 4 min, followed by air cooling to room temperature, which was further rolled to 0.35 mm. The last sample underwent direct single-stage cold rolling to 0.35 mm (process D). Finally, all specimens were annealed at 750 °C in a 100% N2 atmosphere. Samples with different annealing processes and annealing times were named according to “process-annealing time”, for example, “B-15m” indicates the sample of process B and annealing for 15 min.
The metallographic and EBSD samples were ground using sandpapers from 400# to 2000#, followed by mechanical polishing until the surface was bright. Metallographic samples were corroded using a 4% nitric acid alcohol solution. Microstructures were observed using an optical microscope (OM). The EBSD samples used for grain orientation data collection were electrolytically polished using 10% HClO4 and 90% C2H5OH at a polishing voltage of 25–27 V and for a polishing time of 10–15 s. For the quasi-in situ experiments, the polishing time was shortened to 3–5 s. An EBSD system was applied for grain orientation data collection. The grain sizes were calculated using at least five 100× metallographic photographs or EBSD maps and averaged. X-ray diffraction (XRD) with Co Kα diffraction was used to detect three incomplete polar patterns {100}, {110}, and {211} and calculate the Orientation Distribution Functions (ODFs). The macrotexture specimen size was 20 mm (RD) × 18 mm (TD). Standard tensile tests were adopted to measure the mechanical properties with a stretching speed of 2 mm·min−1. A single-sheet magnetic detector was adopted for the measurement of magnetic properties, including magnetic flux density B50, iron loss P10/400 and P15/50. Each group of samples was measured at least five times and averaged.

3. Results and Discussion

3.1. Microstructure and Textures of Hot-Rolled Sheet

Figure 2 shows the microstructure and textures of the initial hot-rolled sheet. As shown in Figure 2a, the microstructure was divided into a surface layer (region A), subsurface layer (region B), and central layer (region C) along the thickness direction. The surface layer (region A) exhibited a uniform and fine equiaxed microstructure. The texture was weak and dispersed, primarily consisting of {110}<001> (intensity 2.72), {881}<126> (intensity 2.76), and {661}<233> (intensity 2.66) components, as illustrated in Figure 2b. Subsurface region B was characterized by a mixed microstructure consisting of elongated deformed bands and several recrystallized grains. The texture was primarily composed of a strong Goss component and a Cube component, with the texture intensity significantly increasing compared to the surface layer, reaching a maximum of 18.06, as shown in Figure 2c. The central layer (region C) was composed of elongated deformed bands, with the texture characterized by strong α- and λ-fiber textures, as shown in Figure 2d. Both α and λ fiber textures were continuously distributed, with the λ fiber texture extending from {001}<110> to {001}<100>, exhibiting a maximum intensity of 24.59 at the Cube component. The α fiber texture extends from {001}<110> to {111}<110>, with a peak intensity of 14.46 observed at the {118} texture.

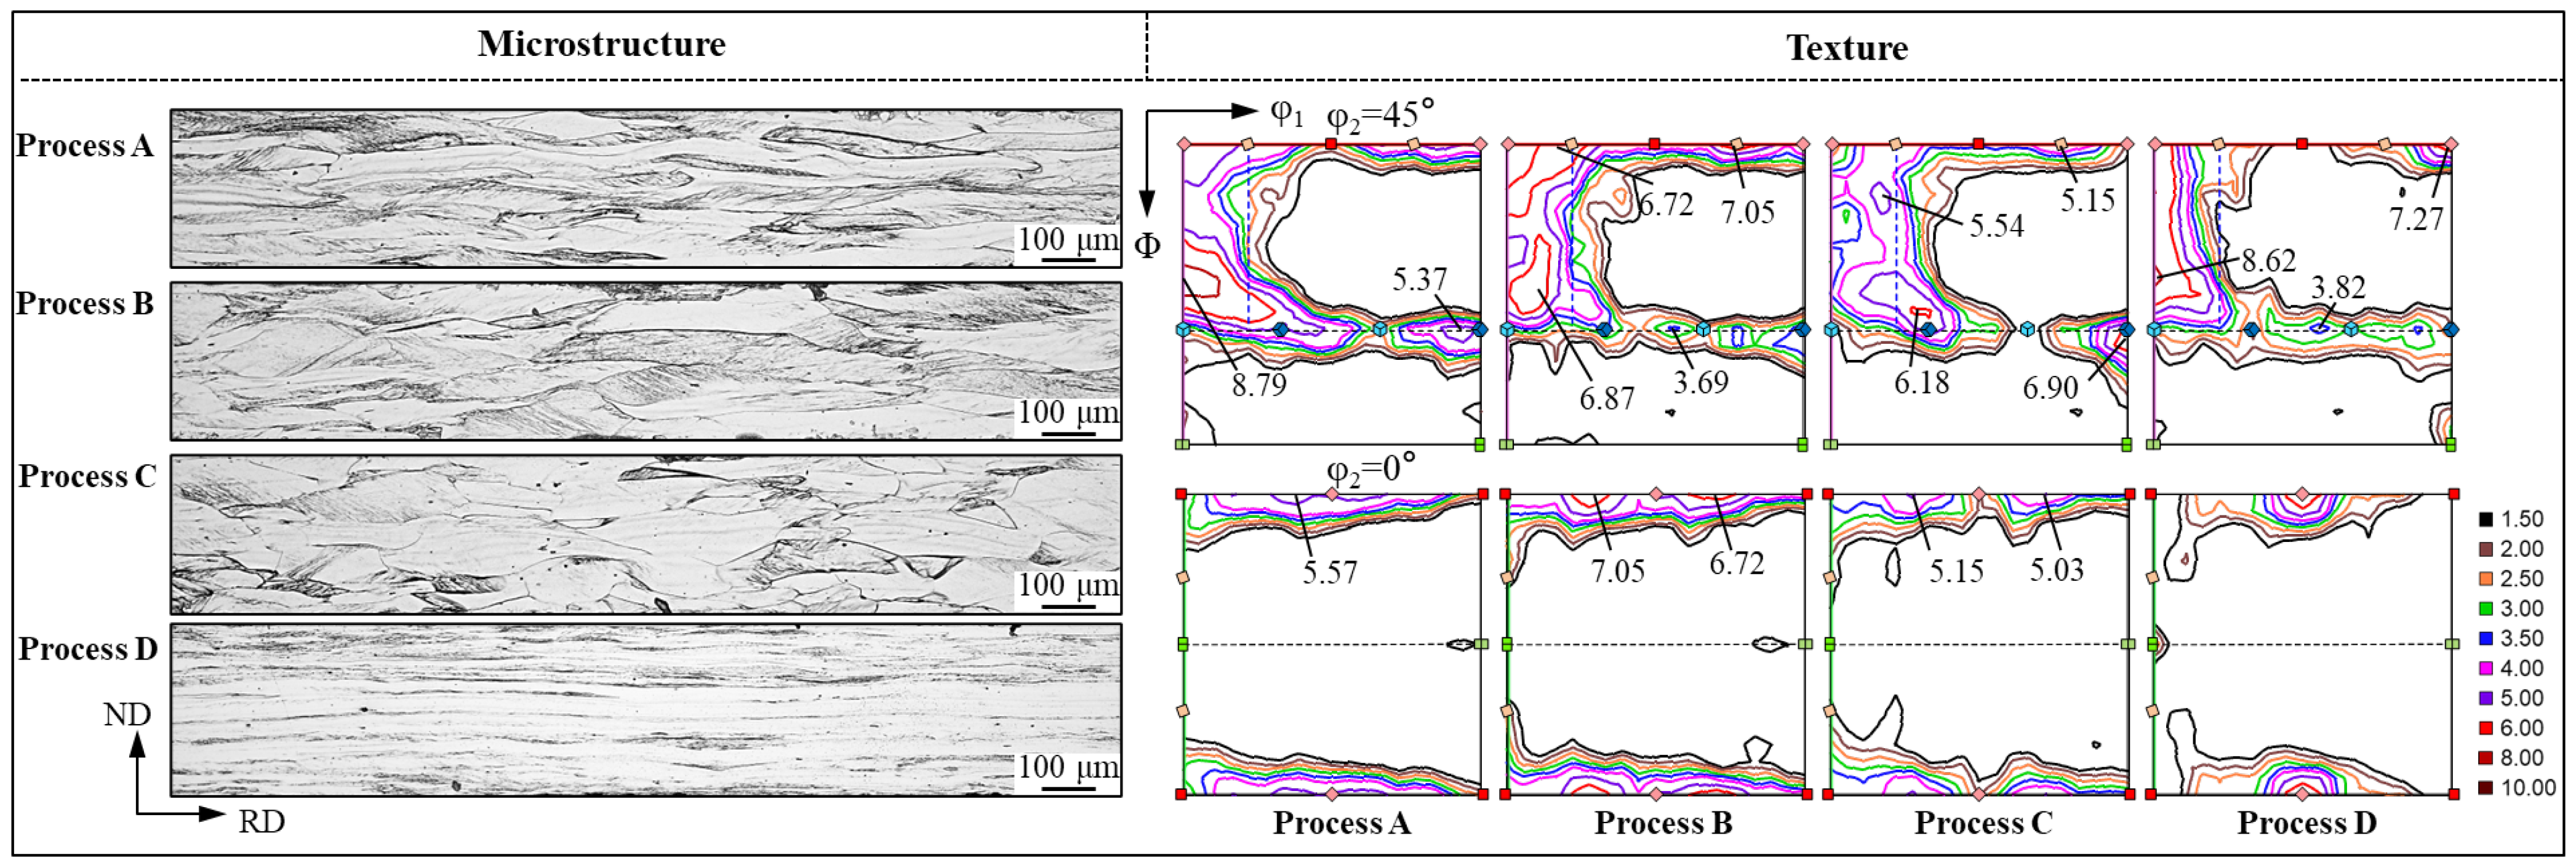
3.2. Microstructures and Textures of Cold-Rolled and Intermediate Annealed Sheets

Figure 3 shows the microstructures and textures of the first cold-rolled and intermediate annealed sheets in double cold rolling processes. The cold-rolled microstructures were similar to that of the hot-rolled sheet, exhibiting different microstructural characteristics in the direction of thickness. After the first cold rolling, the recrystallized grains on the surface were flattened and fragmented, and as the rolling reduction rate increased, the fracture degree of the equiaxed crystals also rose. In process C, where the reduction rate was maximum, the surface equiaxed grains were entirely transformed into fibrous microstructures. The deformed grains in the central layer were further flattened and elongated. The textures of the first-stage cold-rolled sheets were similar, including strong α, λ, and γ textures; however, the strong points and texture intensities were different. The reduction rate in process A was 40%, with the texture strength point located at {113}<230> (with an intensity of 4.26), and the deviation from {113}<361> was only 10°. The texture strength point changed with an increase in the reduction rate. In process B, the reduction rate was 50%, and the texture strength point was located at {113}<110> with an intensity of 4.79. When increased to 60% in process C, the texture strength point was located at {223}<110> and the intensity was 5.00. After annealing at 980 °C for 4 min, all deformed microstructures were completely recrystallized. With an increase in the reduction rate from 40% to 60%, the average grain size of the intermediate annealed sheets decreased gradually to approximately 85.6, 79.8 and 75.3 μm, respectively. When the reduction rate rose, the dislocation density in the cold-rolled sheet increased, which improved the driving force for recrystallization [22], and thus increased the nucleation ratio and decreased grain size of intermediate sheets. In process A, the texture was dominated by a strong γ texture and a small amount of α* texture, with a strong point near {111}<352> and an intensity of 4.08. In process B, the texture type changed slightly, whereas the strong point shifted to {332}<113>. In process C, the γ texture was weakened, the overall texture became dispersed, and the strong point was still located near {332}<113>.
Figure 4 shows the microstructures and textures of the final cold-rolled sheets obtained by different processes. After single-stage cold rolling at a reduction ratio of 82.5%, the grains were severely compressed along the rolling direction, forming a fibrous microstructure. Compared with the microstructure formed during single cold rolling, the microstructure of the double cold rolling process exhibited a significant change. Two kinds of deformed grains can be observed in the double cold-rolled samples, which are usually divided into dark regions (high energy storage and dislocation density) and bright regions (low energy storage and dislocation density) [23]. With a decrease in the secondary rolling reduction, the number of shear bands in the dark zone gradually decreased. When the secondary reduction ratio was reduced to 60%, the extent of cold deformation was the lowest, and most of the grains could adapt to the plane deformation process [24]; thus, the high fault density and high energy storage areas were reduced. The texture of single cold rolling was mainly composed of strong α- and γ-fiber textures, with the strong point located at the {223}<110> component, with the intensity of 8.62. The λ fiber texture was discontinuous and mainly concentrated in {001}<110>, and the orientation intensity was 7.27. The secondary cold-rolled sheets exhibited a heavy α-fiber texture and relatively slight γ-fiber and λ fiber textures. As for process A, the strong point was near the {223}<110> component with an intensity of 8.79. With the decrease in the double cold rolling reduction rate (processes B and C), the α-fiber texture gradually weakened and transformed into an α* texture, whereas the γ texture first became weaker and then stronger with the peak point converted from the {111}<110> to {111}<112> component. In terms of the λ texture, the strong points were all located at the {001}<120> component, and the orientation intensities first increased and then decreased, which were 5.57, 6.72, and 5.15, respectively.

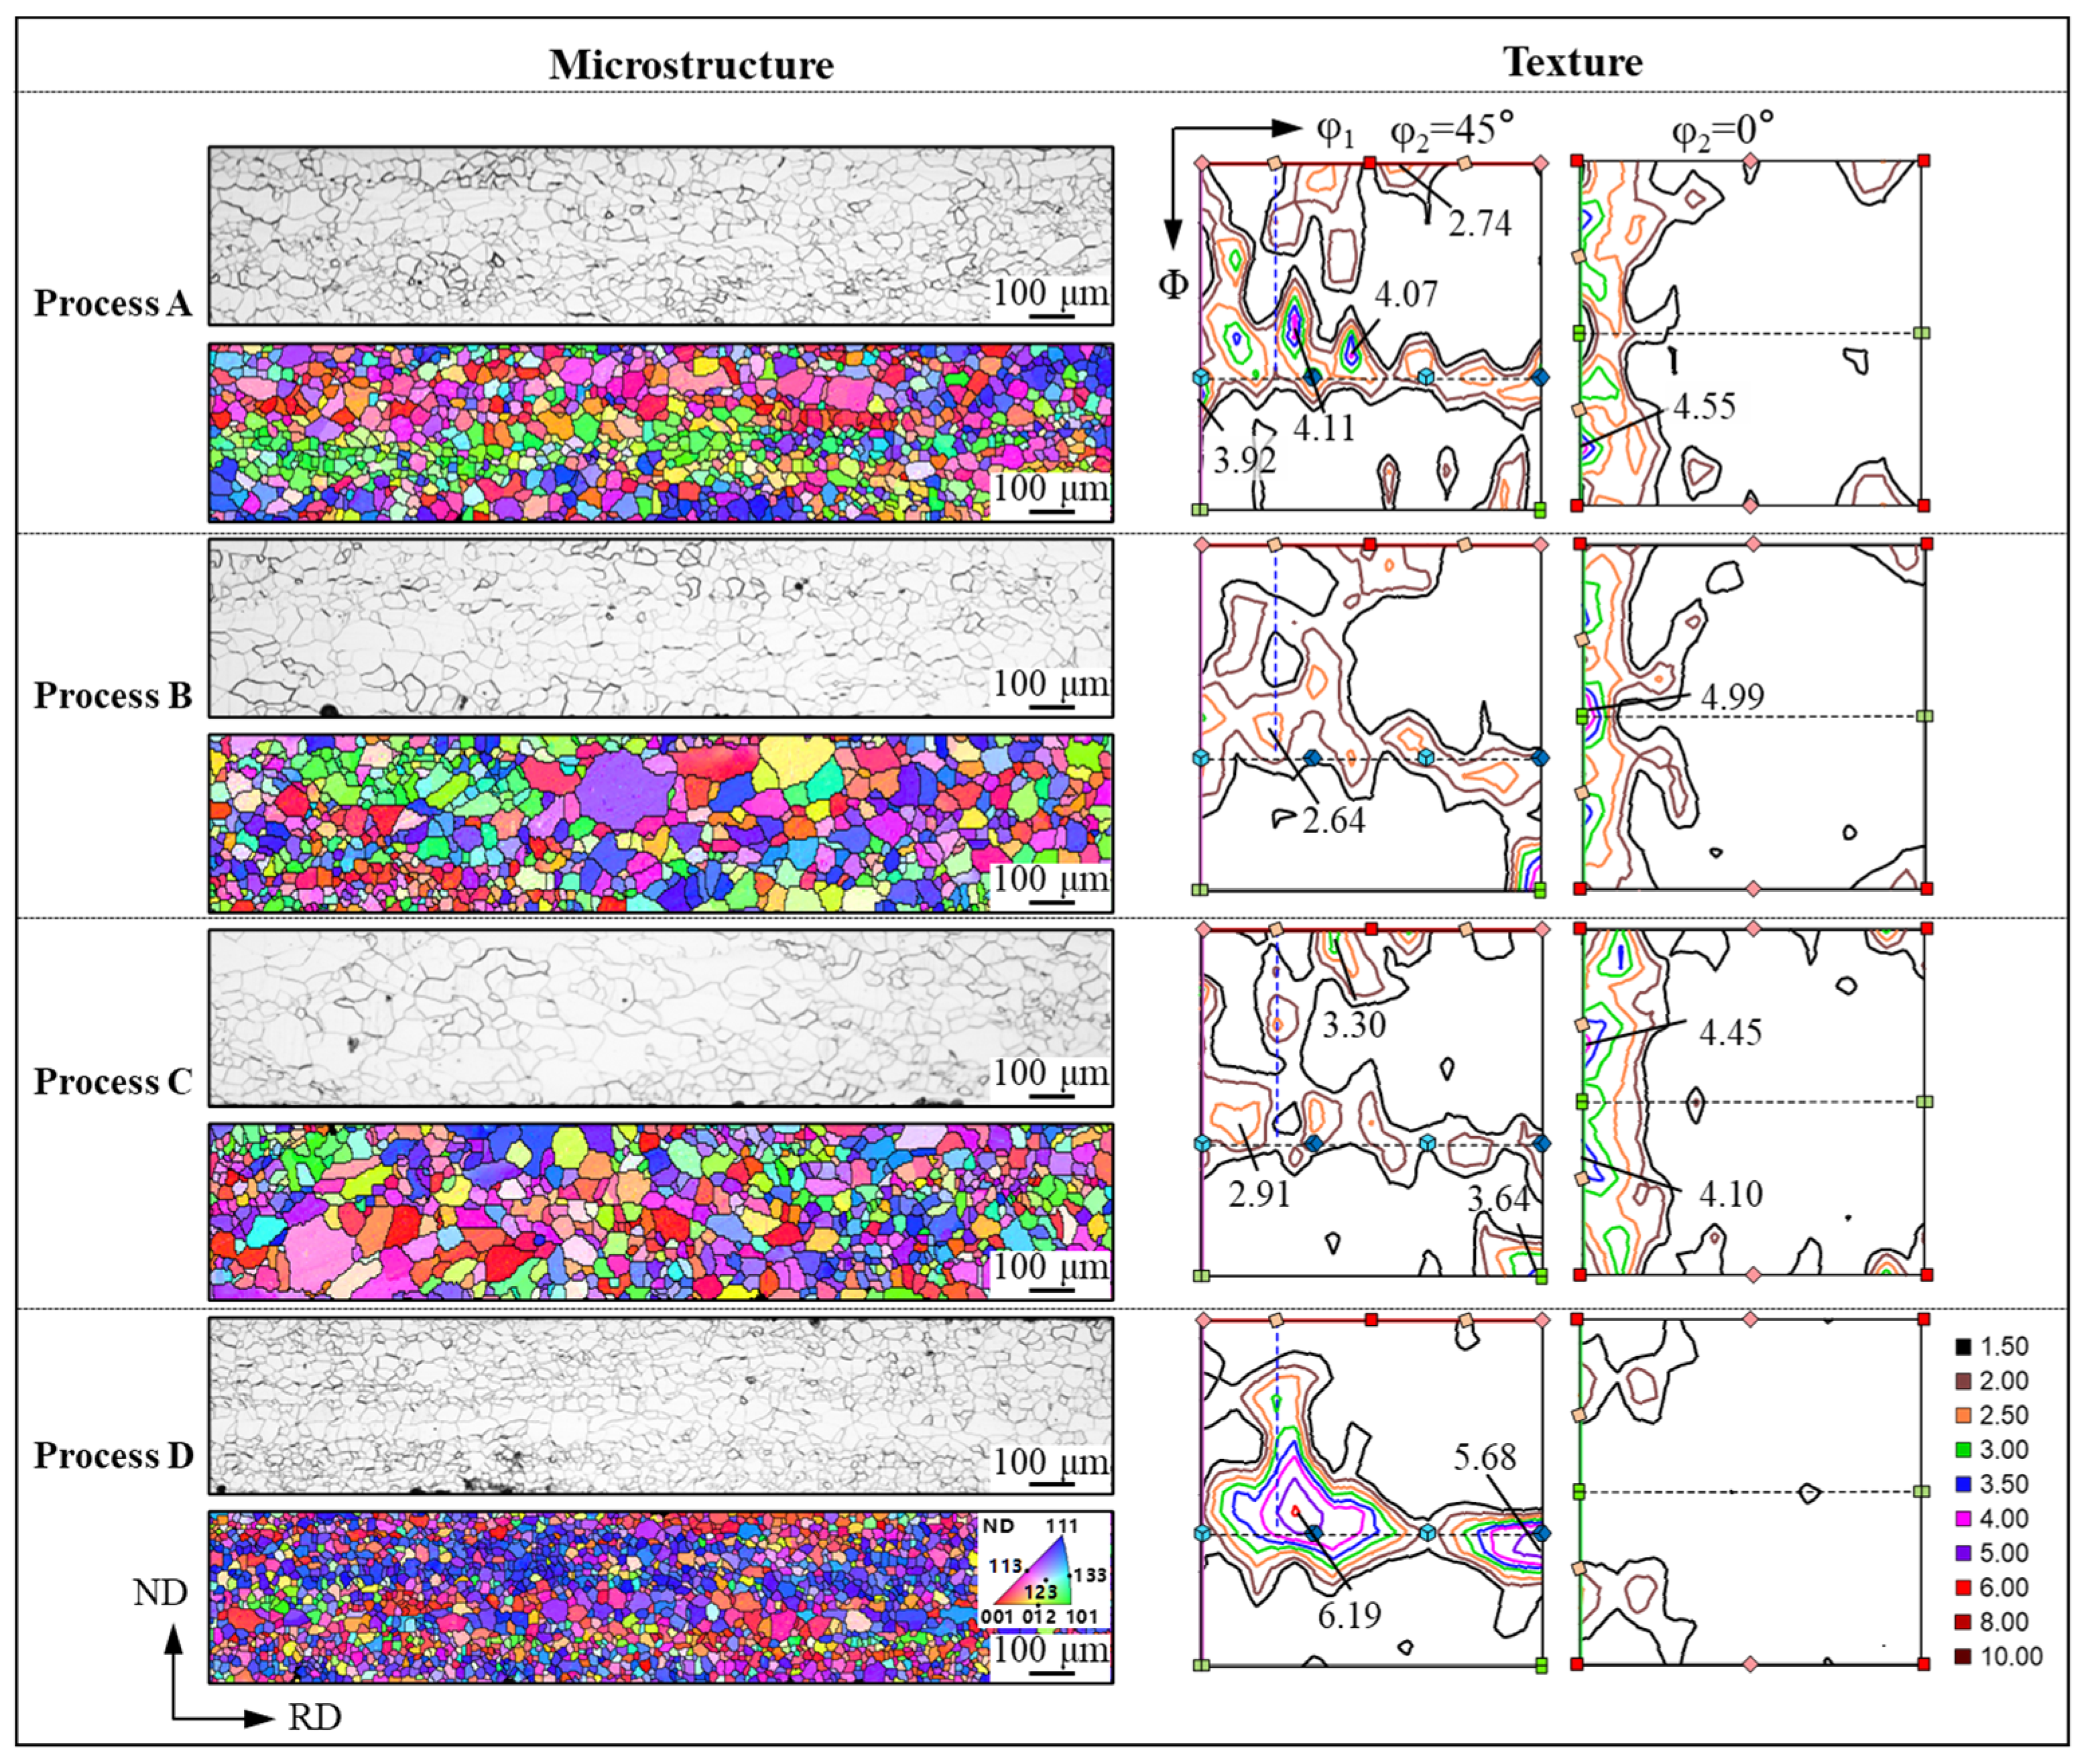
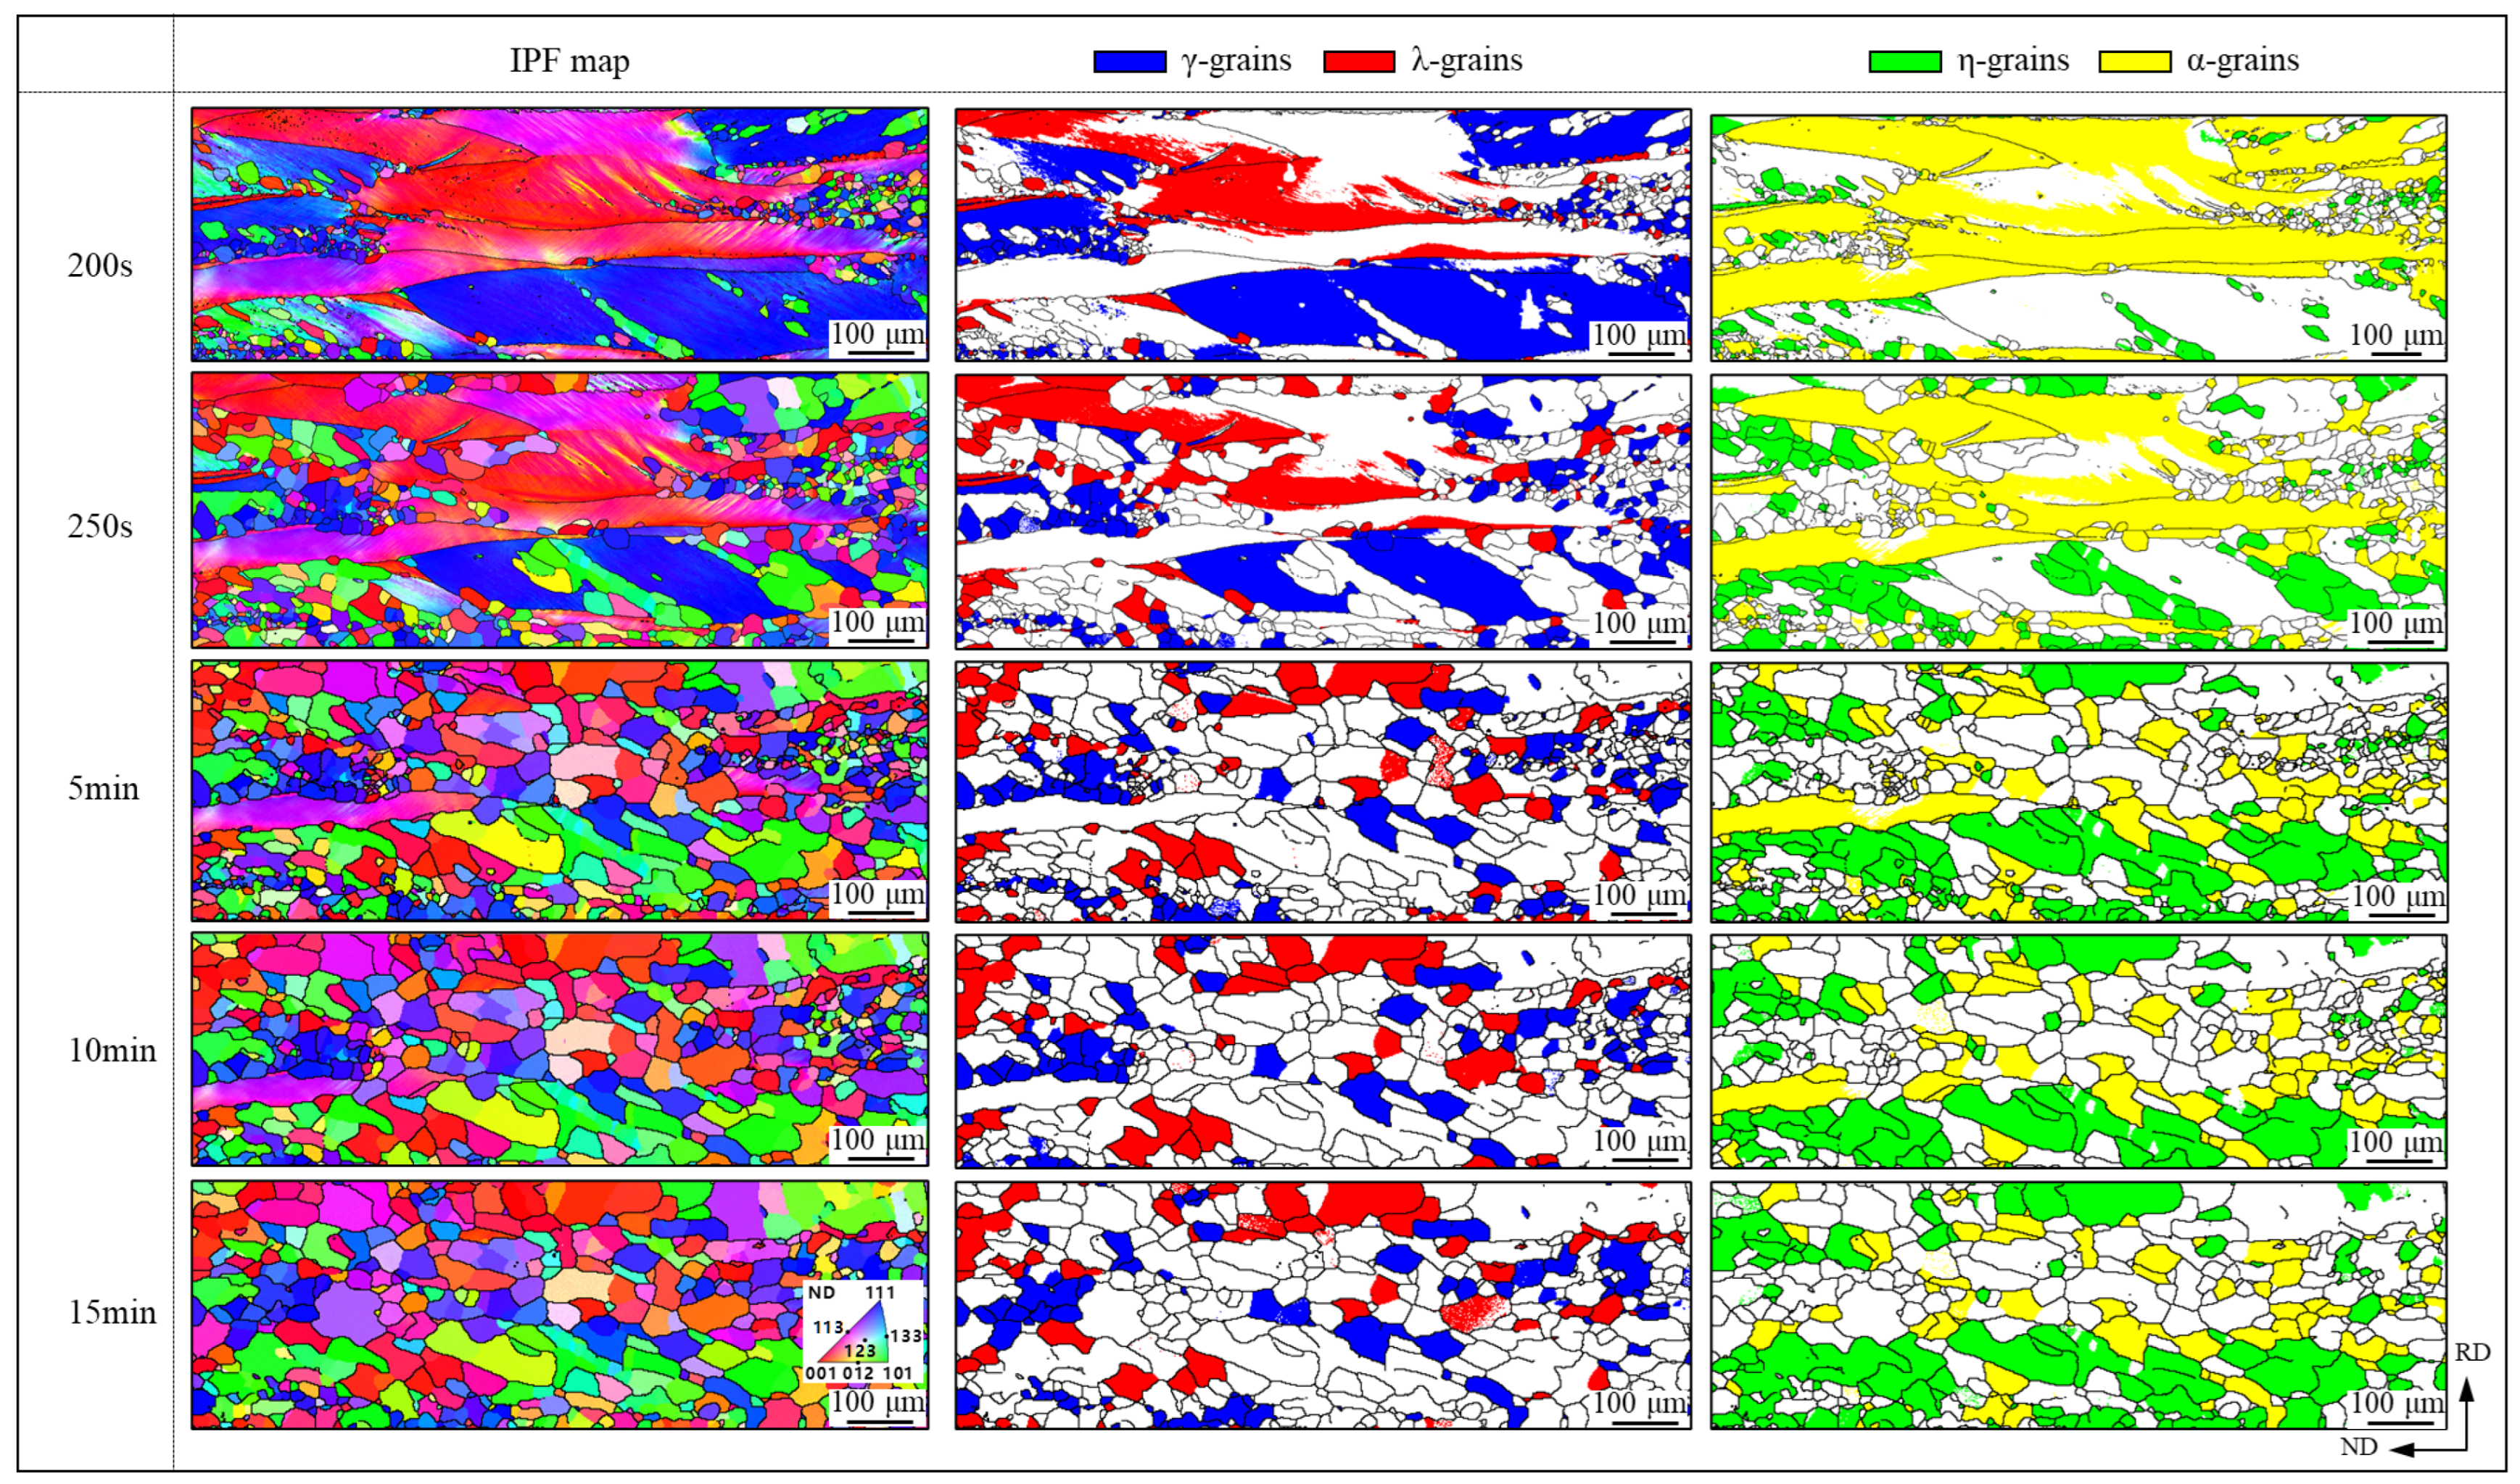
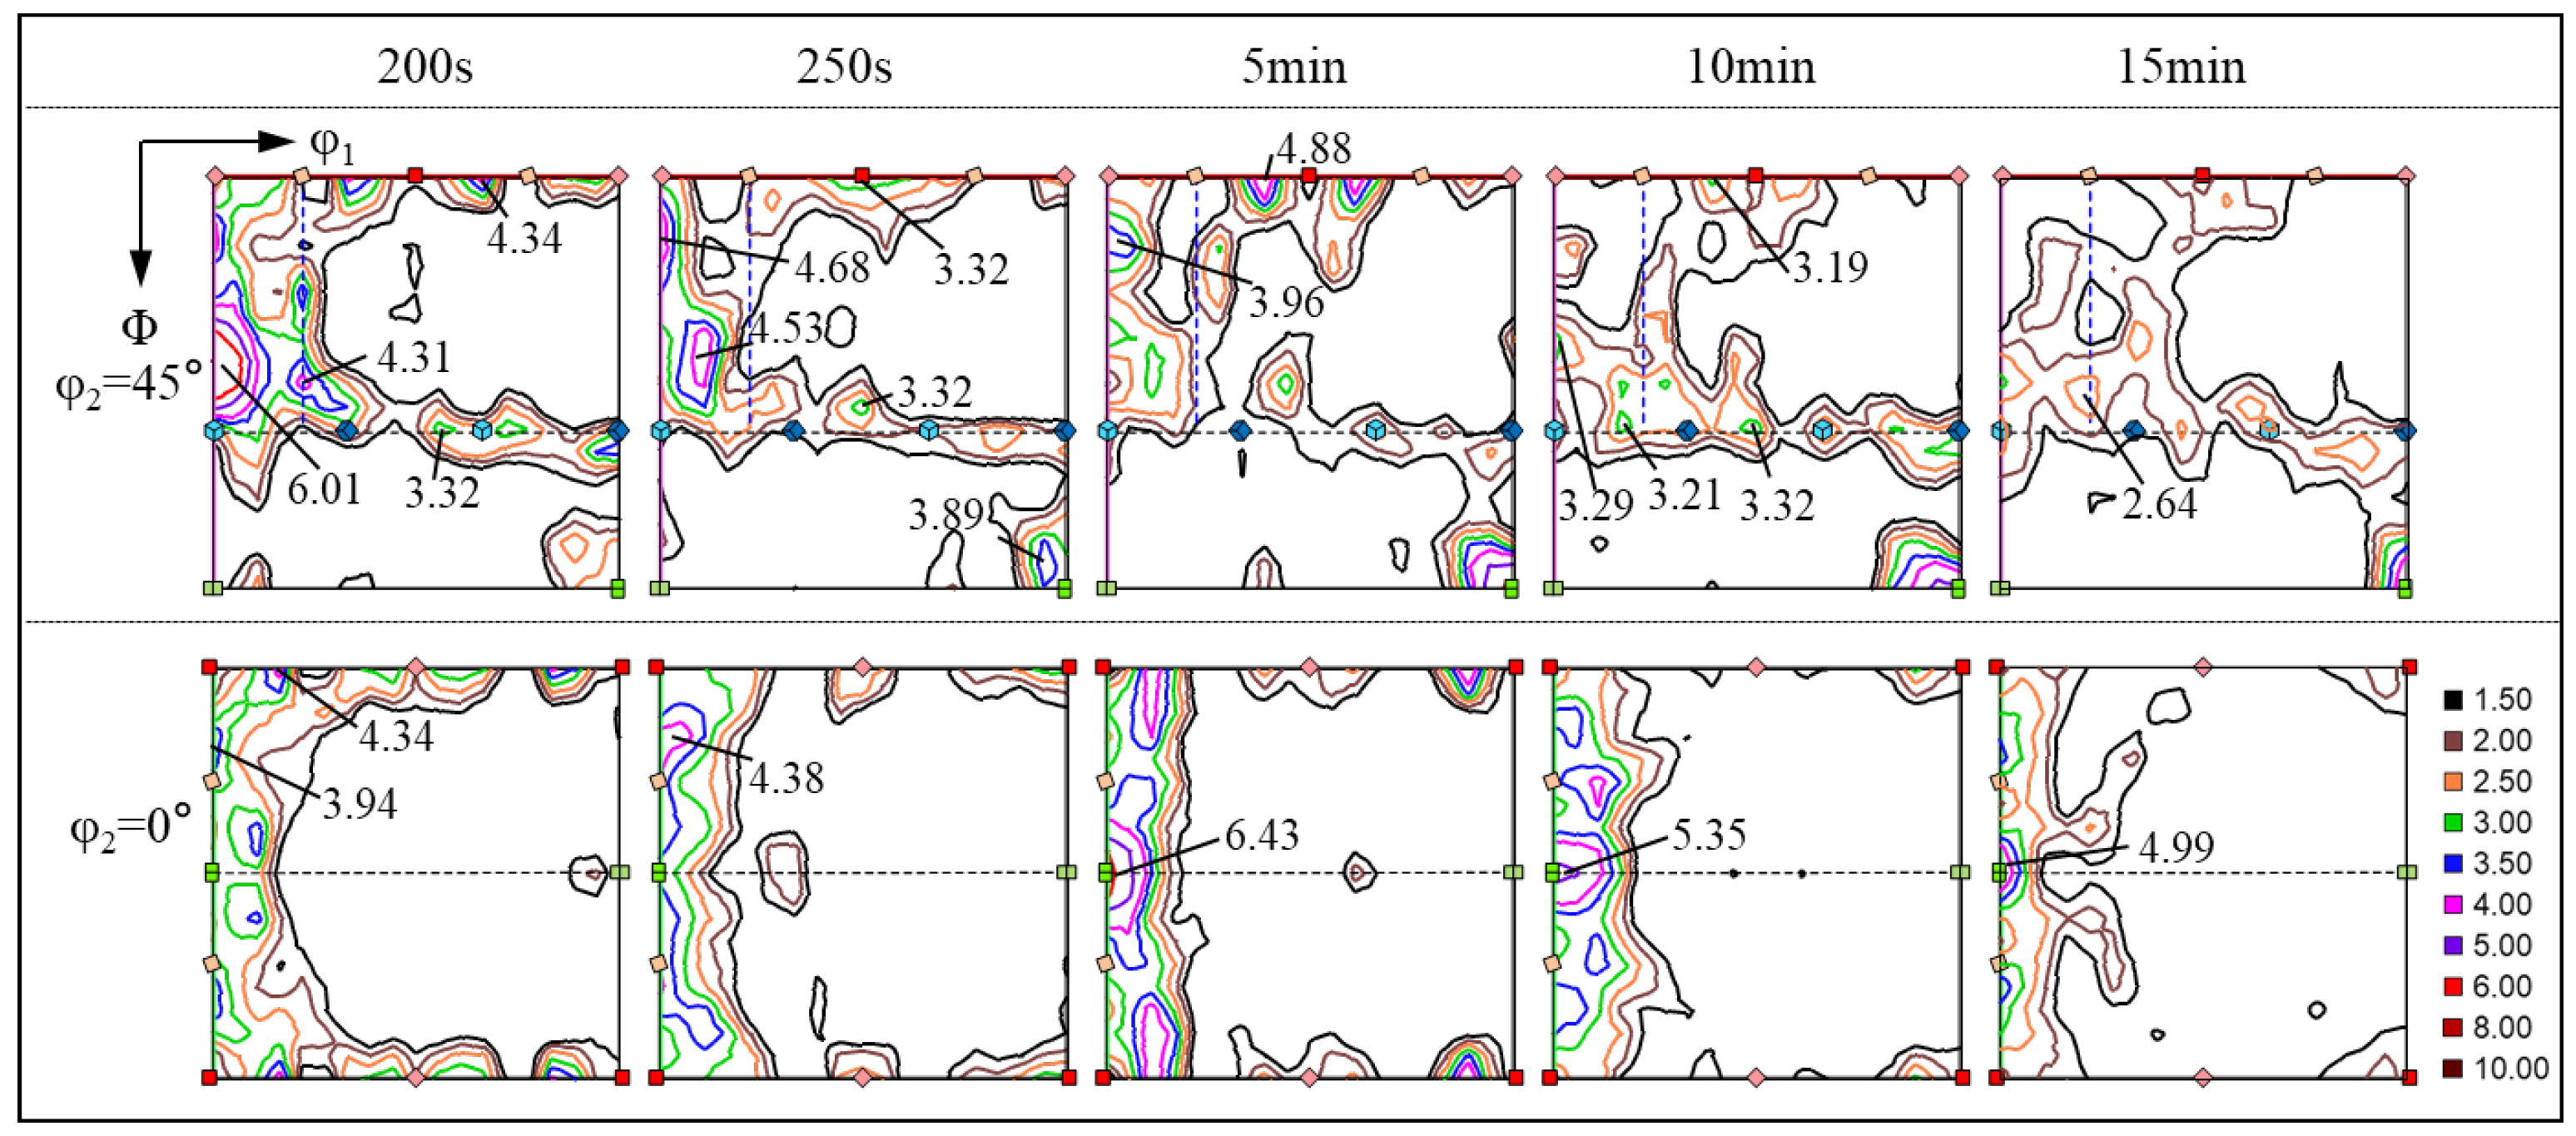
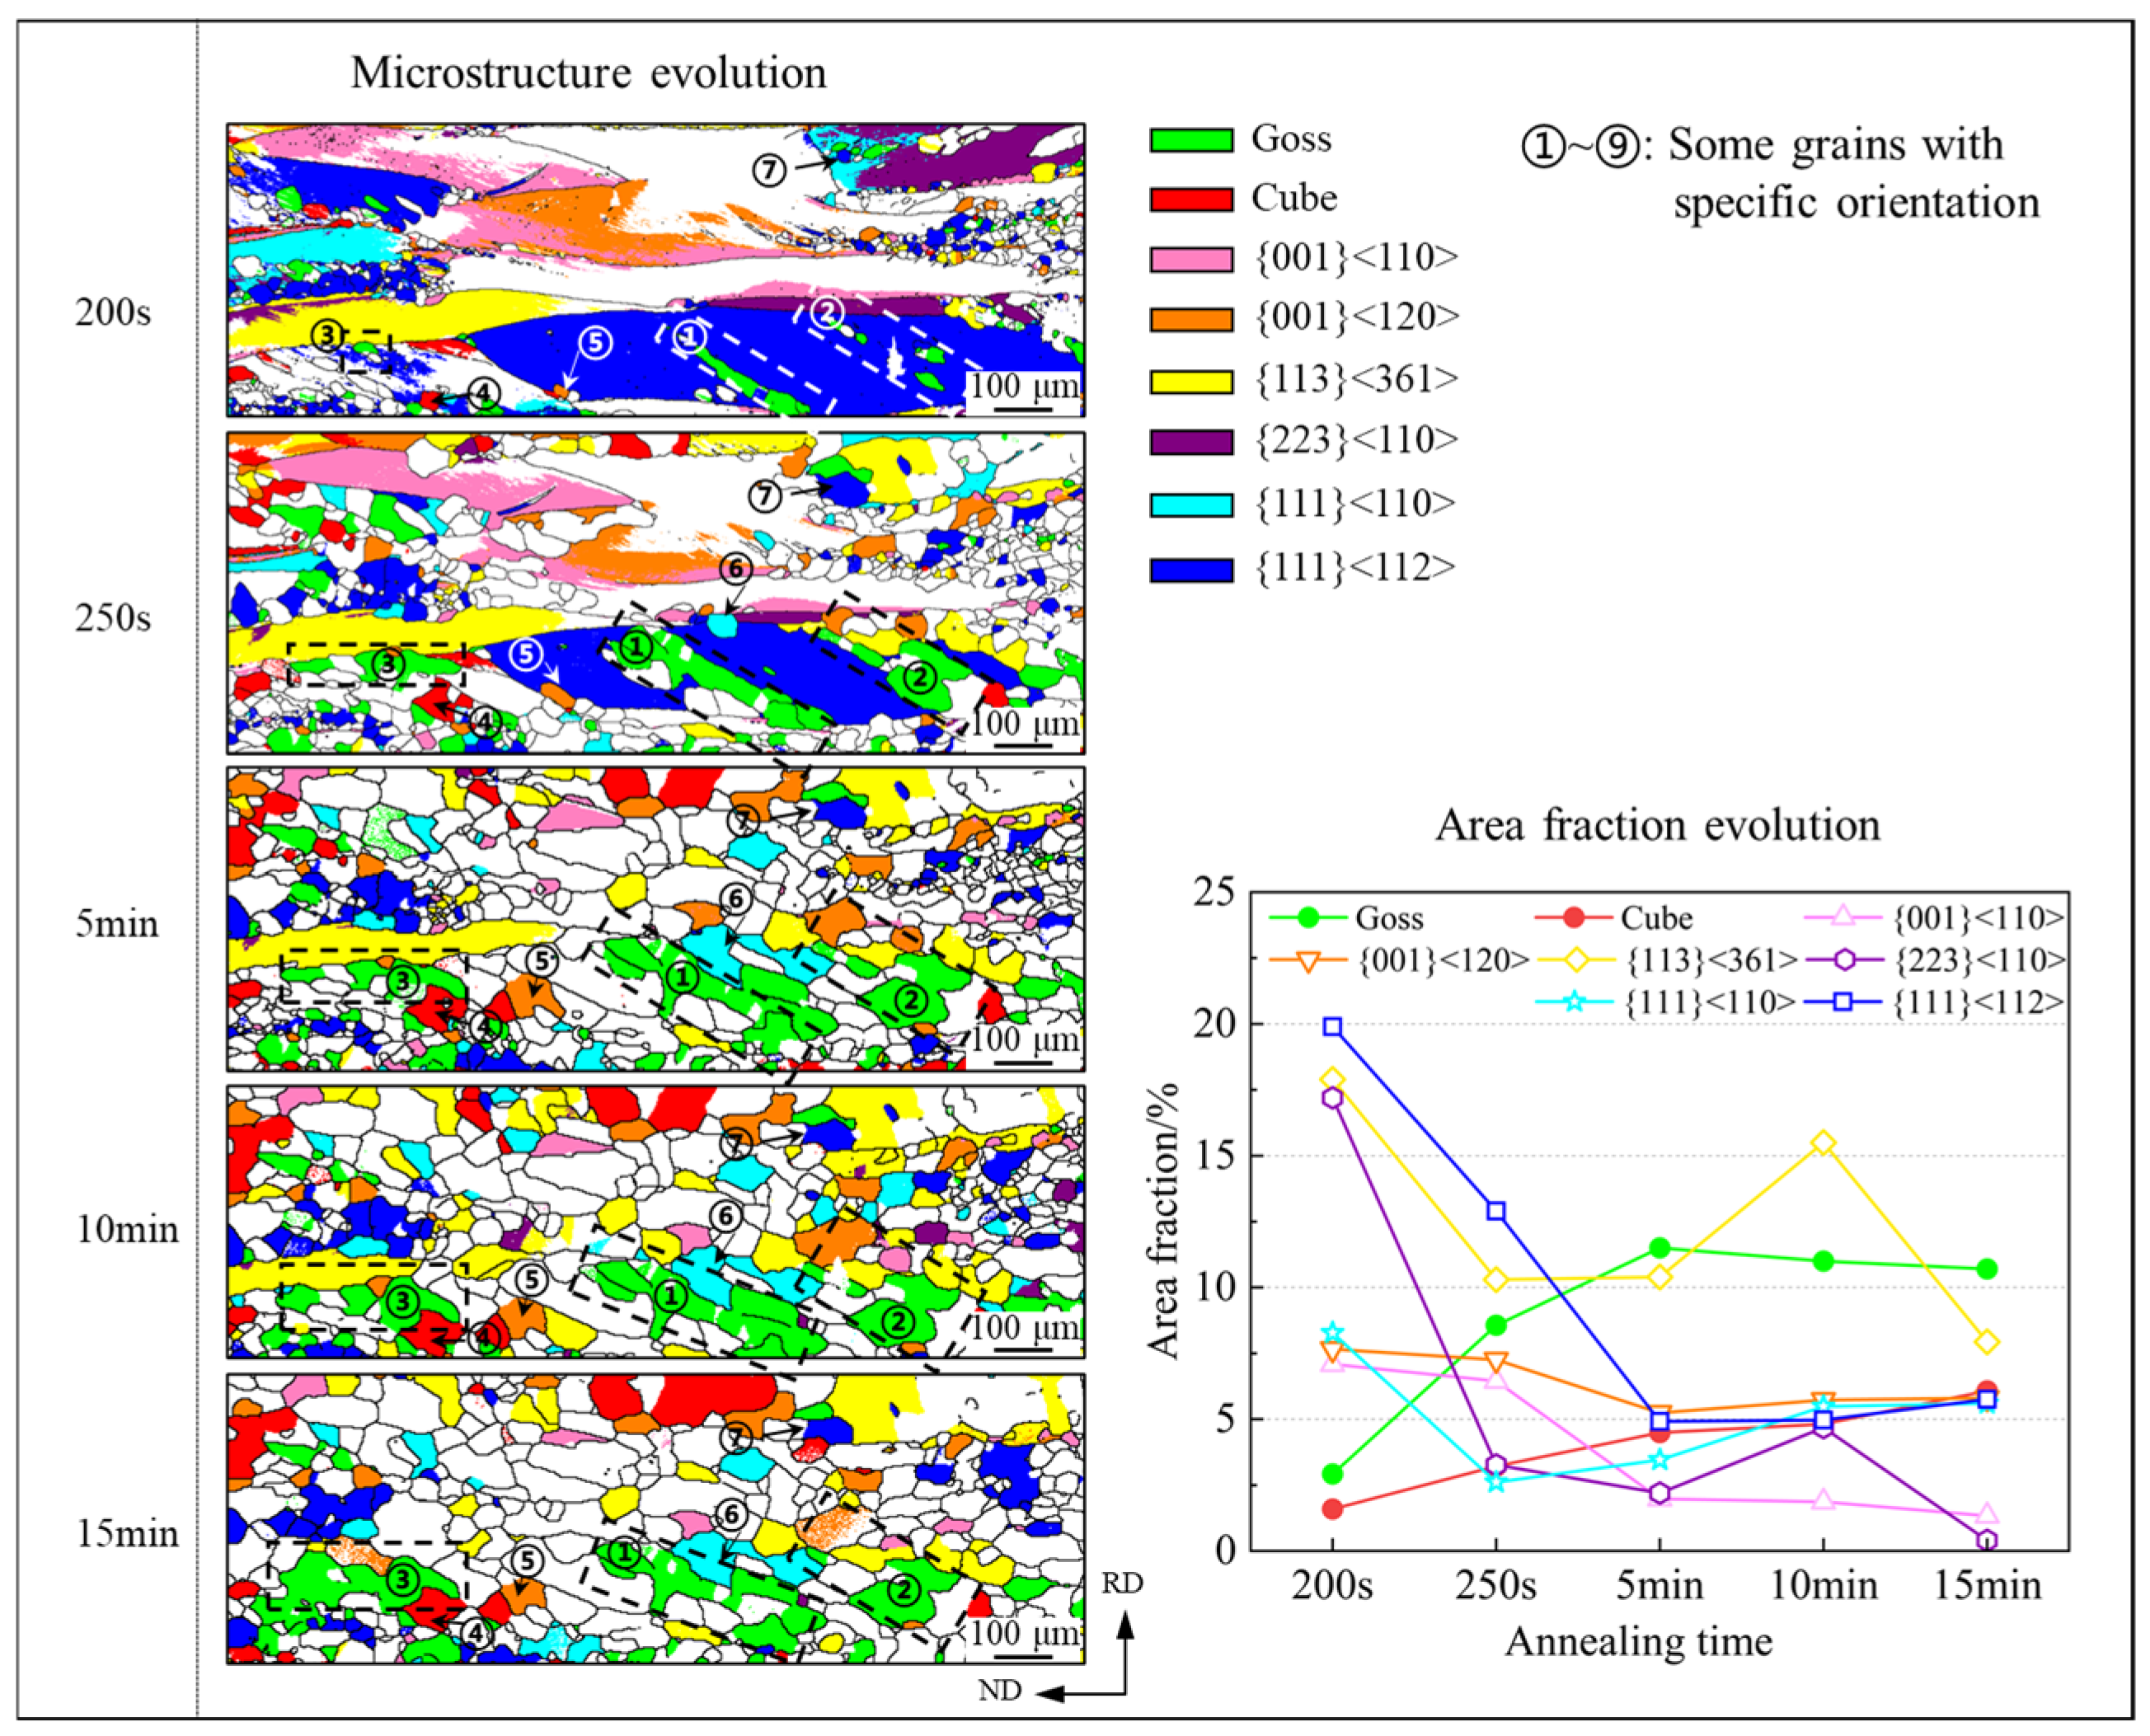
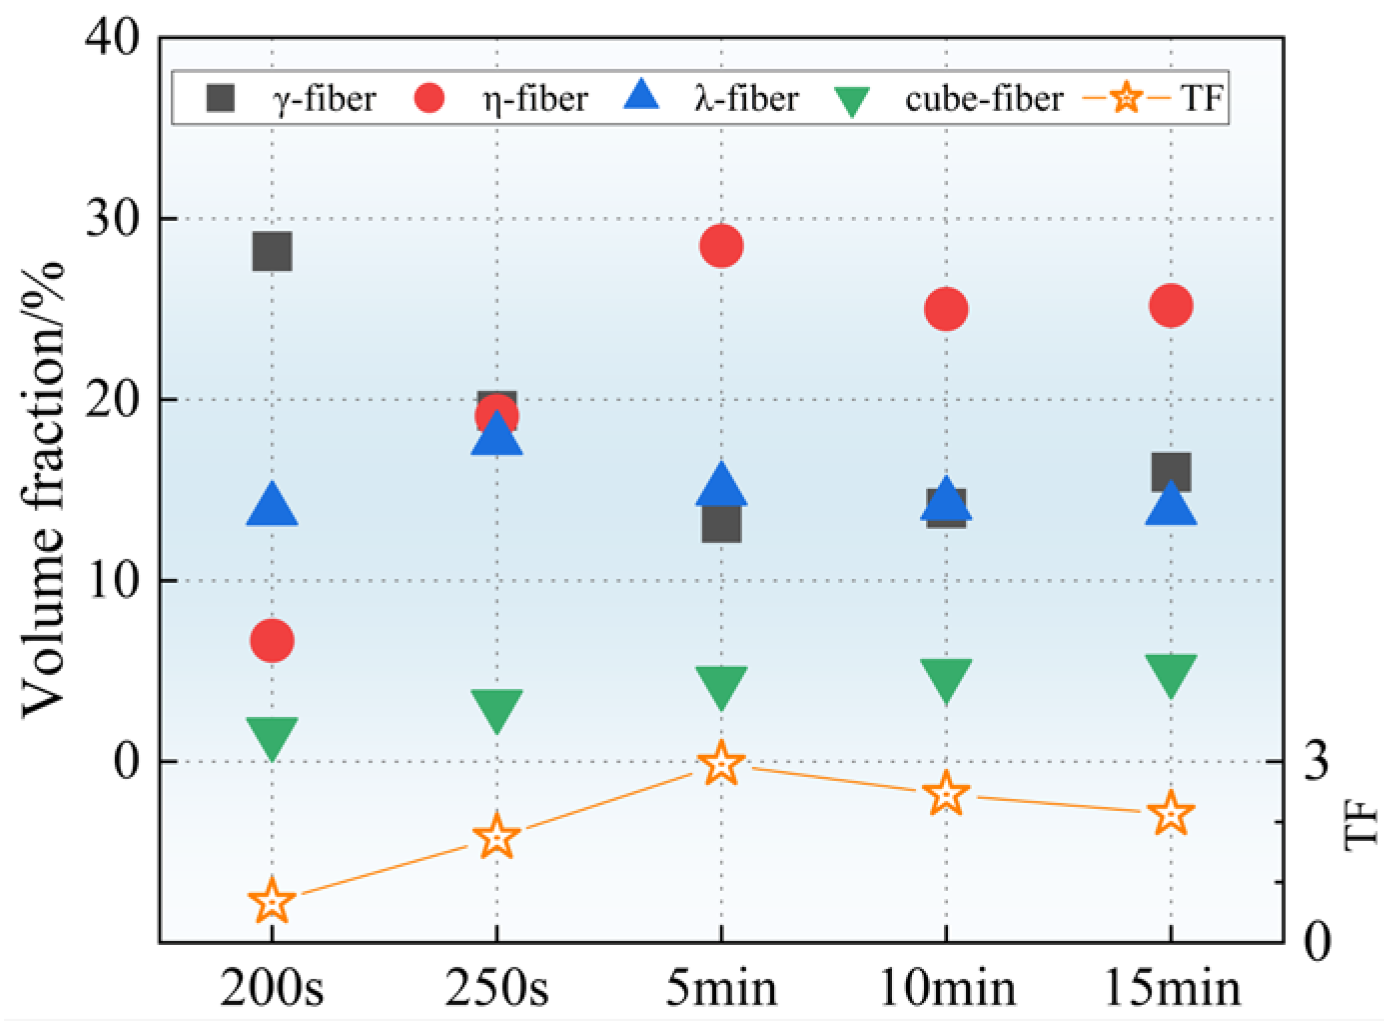
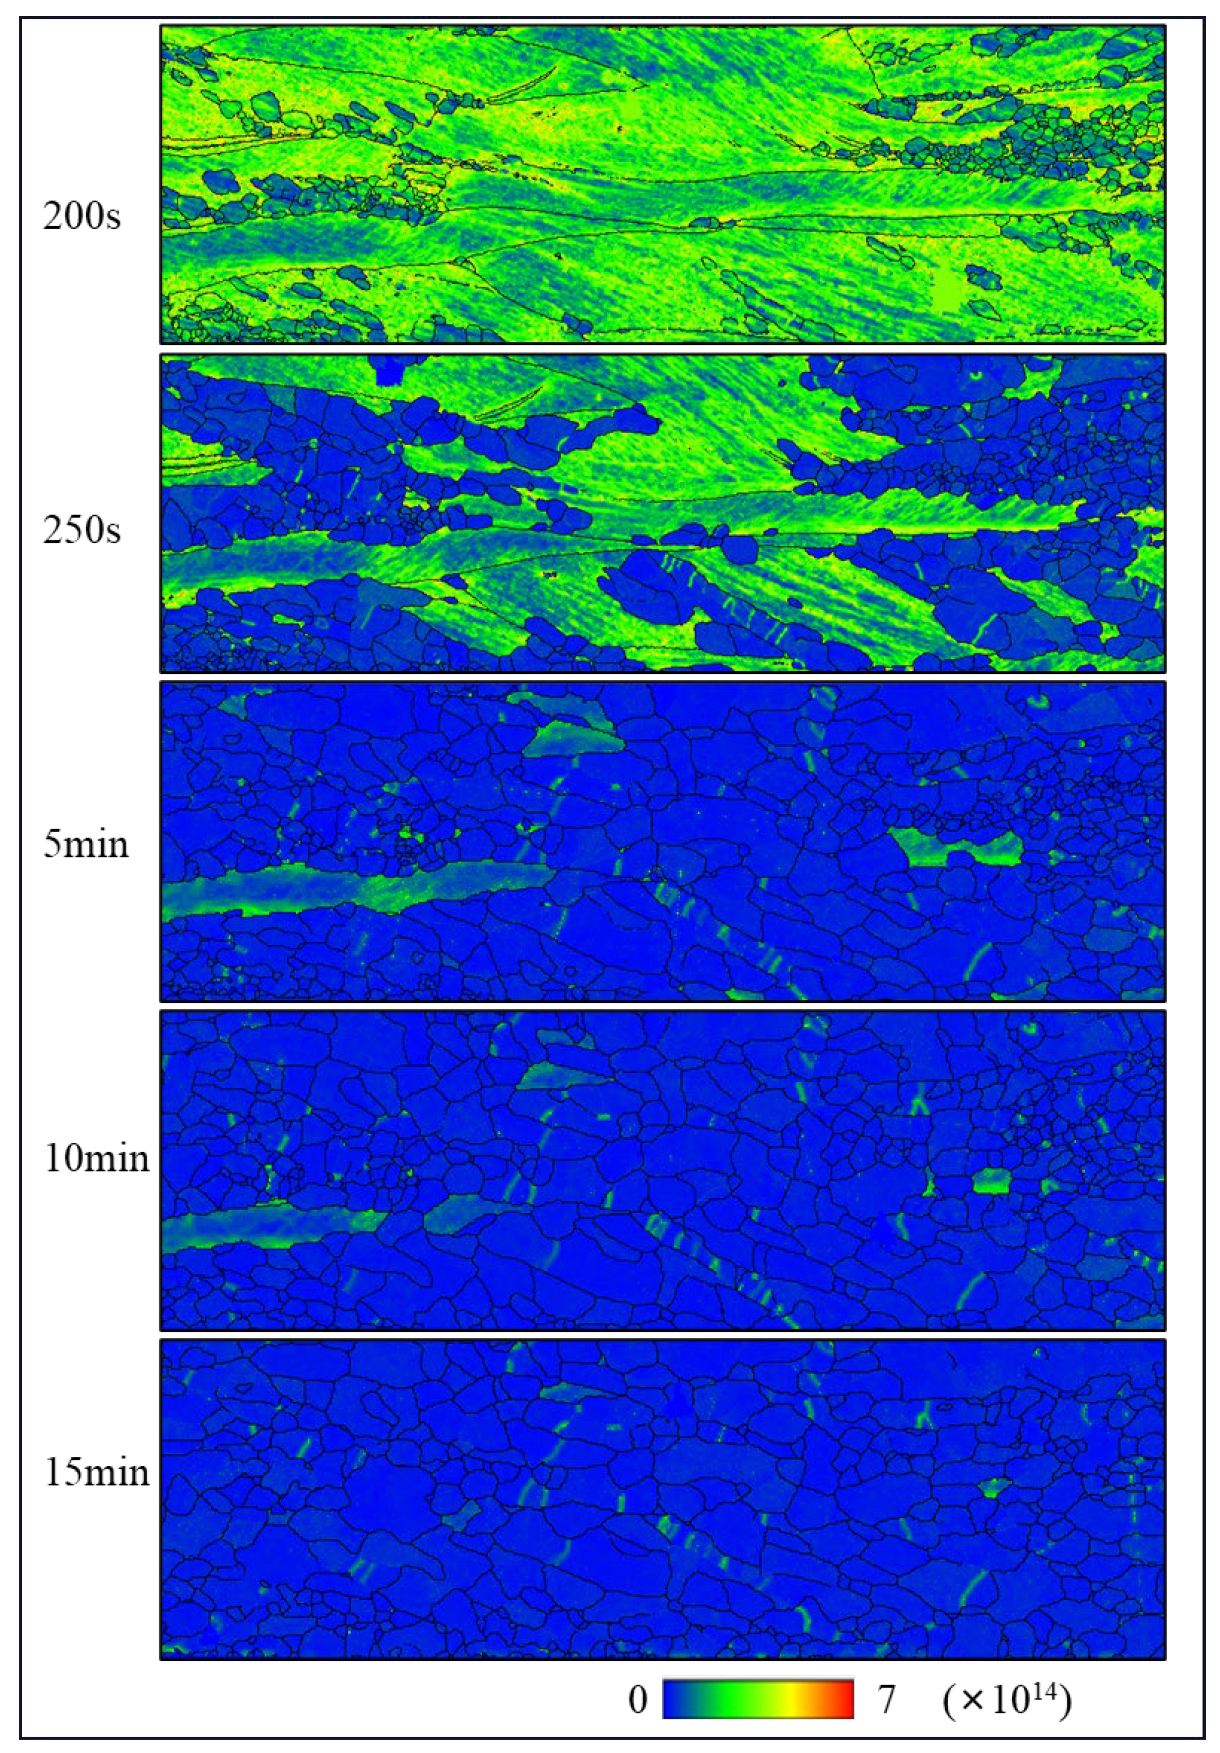
3.3. Microstructures and Textures of Final Annealed Sheets

Figure 5 shows the microstructures and textures of the final annealed sheets. After final annealing of the single-stage cold-rolled sheet in process D at 750 °C, the rolled microstructure was fully recrystallized with grain size of approximately 28.2 μm. The single-stage cold-rolled sheet formed a strong γ and α* fiber texture, with the strong point located in the {111}<112> component (intensity 9.61). In the double cold rolling processes, all samples achieved complete recrystallization after final annealing with average grain sizes of ~32.2, ~38.7 and ~42.9 μm in processes A, B, and C, respectively. In contrast to single-stage rolling, the double cold rolling processes significantly reduced the adverse γ texture after final annealing. Process A showed a relatively strong γ fiber, α* fiber, and strong η fiber texture with a peak near the {114}<481> component. In process B, the γ fiber texture disappeared, while the η texture was significantly enhanced with an intensity of 6.25. In process C, the adverse γ-fiber texture appeared again, whereas the η texture was weakened.

3.4. Magnetic and Mechanical Properties

Table 2 lists the magnetic and mechanical characteristics of Fe-3.3 wt% Si steel under different processes. The magnetic induction B50, iron loss P15/50, and P10/400 of samples in process D were 1.660 T, 3.85 W/kg and 28.27 W/kg, respectively. In contrast, the magnetic properties of the bands prepared by the double cold rolling processes were apparently enhanced. From process A to C, B50 first went up and then went down. The trend of P15/50 was opposite to that of B50, first decreasing and then increasing. P10/400 gradually decreased. When the reduction rates were 50% and 65% in process B, a good match between magnetic properties and mechanical properties was obtained (B50 = 1.683 T, P15/50 = 2.96 W/kg, P10/400 = 21.16 W/kg). Compared with single cold rolling, B50 increased by 0.023 T, P15/50, P10/400 and Rp0.2 decreased by 0.89 W/kg, 7.11 W/kg and 36 MPa, respectively.
Table 3 shows the magnetic and mechanical properties of Fe-3.3 wt% Si steel annealed for various times under process B. When the annealing time was 200 s, B50, P15/50, and P10/400 of the samples were 1.664 T, 4.40 W/kg and 29.42 W/kg, respectively. With the annealing time increasing to 5 min, B50 increased to 1.698 T, P15/50 and P10/400 decreased to 3.18 W/kg and 21.84 W/kg. When the annealing time was 10 min, the B50 of the sample decreased to 1.685 T and P10/400 slightly increased to 21.97 W/kg. When the annealing time increased to 15 min, B50 slightly decreased, P15/50 and P10/400 decreased to 2.96 W /kg and 21.16 W/kg, respectively. With an increase in annealing time from 200 s to 15 min, the yield strength continuously decreased from 621 MPa to 505 MPa. Evidently, the magnetic and mechanical properties were well matched at 5 min, with B50 of 1.698 T, P10/400 of 21.84 W/kg and RP0.2 of 578 MPa. B50 increased by 0.038 T, P10/400 reduced by 6.43 W/kg and the RP0.2 increased by 37 MPa in comparison with the single-stage cold rolling (process D). Table 4 shows the property comparison between the Fe-3.3 wt% Si steel in this study and the industrial steel B35AHS550 (typical value) [25]. The mechanical properties of double cold-rolled Fe-3.3 wt% Si steel were at the same level as that of B35AHS550, while P10/400 was reduced by 8.16 W/Kg and B50 increased by 0.038 T.

3.5. Relationship between Microstructure, Texture Evolution, and Properties

The texture of non-oriented silicon steel significantly influences the magnetic properties of the annealed sheets. This effect arises from the fact that the <001> direction of the BCC crystal structure exhibits the lowest magnetic crystal anisotropy energy, making it the preferred direction for magnetization. In contrast, the <111> direction represents a challenging magnetization direction. It is effective in improving the magnetic induction B50 of electrical steel by strengthening the λ and η textures (containing the most easily magnetized <100> direction), while minimizing the γ texture (containing the most difficult magnetized <111> direction) [4,26]. To investigate the correlation between various textures and magnetic characteristics, the texture factor (TF) [27,28], which is generally evaluated by the fraction of special textures, has been proposed. The η texture is considered in the texture factor, which is suitable for a strong η texture in this study. The texture factor can be expressed by the following formula:
T F = V < 100 > / / N D + V < 100 > / / R D V 100 < 001 > V < 111 > / / N D
where V is the volume fraction of different textures, %. Since both λ and η fibers contain the Cube component, the volume fraction of the Cube texture needs to be subtracted here.
Figure 6 shows the texture volume fractions and texture factors of the final annealed sheets under different processes. The λ and η textures are beneficial to the magnetic susceptibility of B50, whereas a stronger γ texture will worsen the magnetic induction B50 of silicon steel [29,30]. Obviously, the higher the TF value of the samples, the more favorable the magnetic properties [31]. Compared to the single-stage rolling process, the final annealed sheets prepared by double cold rolling contained lower γ and higher η and λ textures, leading to a higher texture factor and higher B50. For the double cold rolling process A, B, and C, the volume fractions of the λ and η textures first increased and then decreased with a decline in the reduction ratio of double cold rolling. The volume fraction of the Cube texture was relatively low and its change was not obvious. The volume fraction of the γ texture gradually decreased. The above changes caused the texture factor to first increase from 1.32 to 2.13 and then decrease to 1.96, and all of the texture factors were higher than those of the single stage (0.48); therefore, B50 first went up from 1.671 T to 1.683 T and then went down to 1.679 T with the decrease in the reduction rate in the two-stage cold rolling processes, and all of the B50 were higher than that of the single stage (1.66 T). Iron loss is mainly influenced by grain size and texture. As the grain size increased, the density of grain boundaries diminished, which reduced the grain boundary pinning effect during magnetization, subsequently resulting in lower iron loss [32]. In addition, when the favorable textures in the annealed sheet increased, the energy required for magnetization was reduced, leading to the reduction in iron loss [33].The average grain sizes of process A, B, C, D after annealing for 15 min were ~32.2, ~38.7, ~42.9 and 28.2 μm, the texture factors were 1.32, 2.13, 1.96, and 0.48, and the corresponding P10/400 were 21.46, 21.16, 21.15, and 28.27 W/kg, respectively. The grain sizes of process B and process C were similar and relatively large, and the texture factors were similar and relatively high; therefore, the iron loss P10/400 of process B and process C were similar and the lowest.
Figure 7 illustrates the microstructure and texture evolution in the final annealed sheet with different annealing times in process B. Figure 8 presents the evolution of the macro-texture in the final sheet. In the case of 200 s, the microstructure predominantly consisted of deformation bands. These deformation bands were predominantly composed of the γ- and α-fiber textures. Fine recrystallized grains were observed at the shear bands and boundaries of high-stored-energy γ-oriented grains, as well as at the boundaries of α-oriented grains. Recrystallized grains were largely absent in the α-oriented deformation bands, with nucleation occurring primarily at the grain boundaries. The newly formed grains did not grow significantly, and the overall texture primarily consisted of strong α- and γ-fiber textures, with the peak point located at {223}<110>. The recrystallization rate increased with increasing annealing time. At the annealing time of 250 s, recrystallized grains underwent some growth. Despite this growth, the overall microstructure changed slightly, with a significant presence of a deformation microstructure. The texture remained to be strong α- and γ-fiber components. The {223}<110> texture was significantly weakened, and the strong point was transferred to {118}<110>. A significant change in the microstructure was observed when the annealing time was extended to 5 min. The deformed grains were gradually consumed by the neighboring recrystallized grains, leading to a microstructure predominantly composed of recrystallized grains, with only a few incomplete deformed bands remaining. In addition, a strong component of the η fiber appeared in the sample, with the peak point located at the Goss texture and an intensity of 6.43. The γ fiber became dispersed and almost disappeared. During annealing from 10 min to 15 min, minimal changes in the microstructure and texture were noted. The microstructure gradually became homogeneous, while the texture continued to exhibit strong η-fiber characteristics, along with measurable intensities of the γ- and λ-fiber textures.
Figure 9 shows the nucleation growth process and area fraction change in grains with specific orientations. Many studies [34,35] have shown that Goss grains mainly nucleate and grow in the shear zone of γ-oriented deformed grains. At positions 1 and 2, a Goss-oriented grain nucleated at the shear band of the {111}<112> deformed structure, whereas at position 3, the Goss-oriented recrystallized grain nucleated at the boundary of the {111}<112> deformed grain and remained during the subsequent annealing process. During the annealing process of 200 s~5 min, the Goss-oriented grains nucleated and grew, and the area fraction increased rapidly from 2.92% to 11.5%. However, after 10 min, some Goss grains were invaded by nearby grains (e.g., grains at position 7). The area fraction decreased to 11.0% and 10.7% at 10 min and 15 min, respectively. At position 4, the Cube-oriented recrystallized grains nucleated and grew at the shear band within the {111}<112> deformed structure, but the nucleation density was significantly lower than that of the Goss grains [36]. During the annealing process, the area fraction of Cube grains increased from 1.59% at 200 s, but was always low, with a maximum of 6.08%. At position 5, a {001}<120>-oriented grain nucleated at the boundary of the {111}<112> deformed grain and gradually grew into the interior of the deformed grain [12]. The area fraction of {001}<120> showed a decreasing trend from 7.66% to 4.18%. It is generally believed that γ-oriented grains usually nucleate and grow at the inner or grain boundaries of γ-deformed grains, resulting in the annealing texture of γ-fibers [37]. Position 6 shows that a {111}<110> grain nucleated at the boundary of the {111}<112> deformed structure. Position 7 shows that a {111}<112> recrystallized grain nucleated at the boundary of the {111}<110> deformed structure. During the annealing process, the area fraction of the {111}<112> oriented grains decreased from 19.9% to 4.92%, and then gradually increased to 5.76%. The area fraction of the {111}<110>-oriented grains showed a similar trend, decreasing rapidly from 8.28% to 2.61% and then gradually increasing to 5.6%.
Figure 10 shows the volume fraction of specific textures and the texture factor in the final sheet for process B with different annealing times. Throughout the annealing process, the volume fraction of the Cube texture exhibited a slight increase. During annealing times of 200 s and 250 s, a significant number of deformed grains with γ orientation were observed. At an annealing time of 5 min, the deformed grains were progressively consumed by recrystallized grains with different orientations, leading to a rapid decrease in the fraction of the γ texture. The volume fractions of λ-fiber and η-fiber texture increased with the η-fiber texture component reaching its maximum, thereby achieving the highest texture factor. As γ-oriented grains nucleated and grew, the volume fraction of the γ-fiber texture increased again, while the dominance of λ and η textures diminished, causing a decrease in the volume fraction and a gradual reduction in the texture factor. Consequently, with increasing annealing time, the texture factor initially rose from 0.67 to 2.96 before subsequently declining to 2.13, and B50 exhibited a similar trend, increasing initially from 1.664 T to 1.698 T and then decreasing to 1.683 T. The texture factor was significantly increased compared with that of the single-stage rolling process (0.48); thus, B50 was improved up to 0.038 T.
As shown in Figure 7, short annealing time resulted in incomplete recrystallization of the sample. With increasing annealing time, the recrystallization rates gradually increased, which were 25.2%, 46.7%, 79.5%, 91.0%, and 97.6%, respectively. The incomplete recrystallized microstructures indicate that the sample contains many dislocations, and the distribution of dislocation density could be qualitatively represented by Geometrically Necessary Dislocations (GND). Figure 11 shows the GND maps of the final annealed sheet with different annealing times for process B. As the annealing time increased, the GND consistently decreased, indicating that dislocation density decreased gradually. Except for a slight increase at 10 min, the iron loss decreased with the increase in annealing time, which was mainly due to the increasing recrystallization, decrease in dislocation density, and possible grain growth. For similar reasons, with an increase in annealing time, the dislocation density decreased, resulting in a decrease in the effect of dislocation strengthening and a gradual decrease in yield strength. Compared to the single-stage process (~28.2 μm), although recrystallization was not complete, the average grain size of the sample was ~34.5 μm in the double-stage cold rolling process and annealing for 5 min, which finally reduced the iron loss P10/400 by 6.43 W/kg. At the same time, a moderate dislocation density enhanced the yield strength by 37 MPa through dislocation strengthening.

4. Conclusions

Fe-3.3 wt% Si steel was prepared by different cold rolling processes and various annealing times. The main results are summarized as follows:
(1)
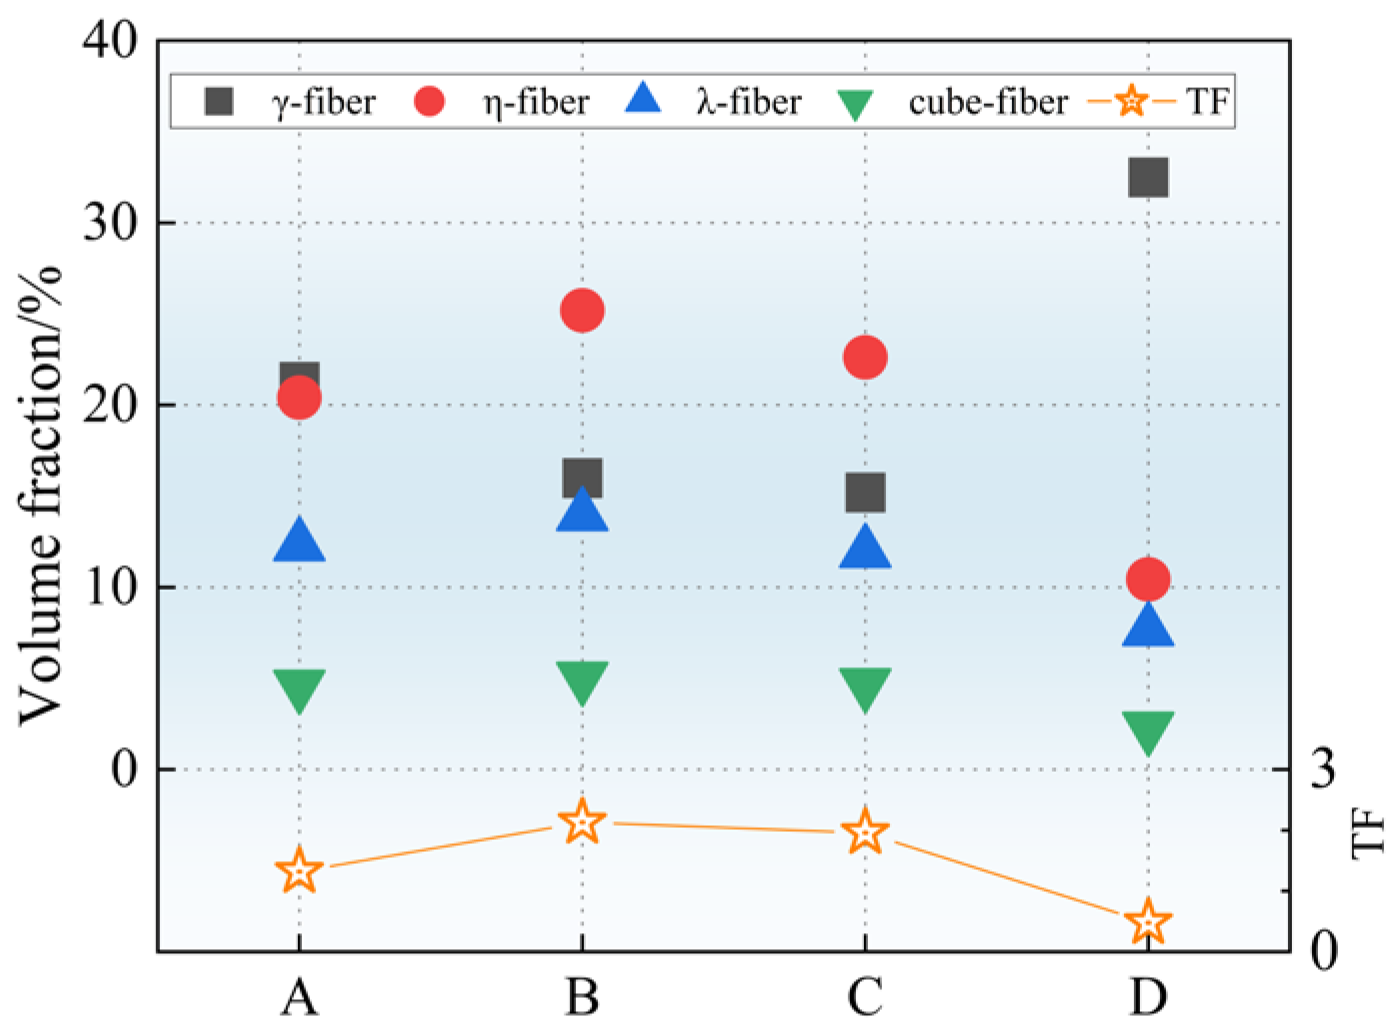
The final annealed sheet produced through the single-stage cold rolling process is mainly composed of strong γ and α* textures. In contrast, the double cold rolling processes significantly reduced the adverse γ texture, and a stronger η texture appears in the final annealed sheets, leading to a relatively high texture factor. Compared with single-stage cold rolling, the double cold rolling process can improve the magnetic induction and iron loss.
(2)
Under the double cold rolling process, with the increase in annealing time, the magnetic induction B50 first increases from 1.664 T to 1.698 T and then decreases to 1.683 T, and the yield strength continues to reduce from 621 MPa to 505 MPa. With a shorter annealing time, incomplete recrystallization can improve the yield strength of the samples, owing to stronger dislocation strengthening.
(3)
An optimized combination of magnetic properties (B50 of 1.698 T, P10/400 of 21.84 W/kg) and mechanical properties (Rp0.2 of 578 MPa) is obtained via a moderate rolling reduction (50%, 65%) and an appropriate annealing time (5 min). Compared with the single-stage cold rolling process, B50 increases by 0.038 T, P10/400 decreases by 6.43 W/kg and RP0.2 increases by 37 MPa.

Author Contributions

Conceptualization, Y.G.; investigation, Y.G.; resources, Z.G.; software, H.C. and B.Y.; data collection, H.C. and B.Y.; data analysis, H.C. and B.Y.; writing—original draft preparation, Y.G.; writing—review and editing, Y.X., L.Z. and Z.G.; visualization, H.C. and B.Y.; funding acquisition, Y.X. and L.Z. All authors have read and agreed to the published version of the manuscript.

Funding

This research was supported by National Natural Science Foundation of China (Nos. 51974085 and 51674080), National Key R&D Program of China (2017YFB0304105, 2017YFB0304400), the Key R&D Program of Shandong Province (2019TSLH0103) and the Fundamental Research Funds for the Central Universities (N2425035).

Data Availability Statement

The data required to reproduce these findings cannot be shared at this time due to technical or time limitations.

Conflicts of Interest

Author Zhenyu Gao was employed by the company Silicon Steel Division of Angang Steel Co., Ltd. The remaining authors declare that the research was conducted in the absence of any commercial or financial relationships that could be construed as a potential conflict of interest.

References

  1. Stornelli, G.; Faba, A.; Di Schino, A.; Folgarait, P.; Ridolfi, M.R.; Cardelli, E.; Montanari, R. Properties of Additively Manufactured Electric Steel Powder Cores with Increased Si Content. Materials 2021, 14, 1489. [Google Scholar] [CrossRef] [PubMed]
  2. Leuning, N.; Jaeger, M.; Schauerte, B.; Stöcker, A.; Kawalla, R.; Wei, X.; Hirt, G.; Heller, M.; Korte-Kerzel, S.; Böhm, L. Material Design for Low-Loss Non-Oriented Electrical Steel for Energy Efficient Drives. Materials 2021, 14, 6588. [Google Scholar] [CrossRef] [PubMed]
  3. Dou, Y.; Li, Y.; Zhang, C.; Yue, S.; Zhu, J. Effects of Uniaxial Stress Along Different Directions on Alternating Magnetic Properties of Silicon Steel Sheets. IEEE Trans. Magn. 2020, 56, 7512004. [Google Scholar] [CrossRef]
  4. Du, Y.; O’Malley, R.; Buchely, M.F. Review of Magnetic Properties and Texture Evolution in Non-Oriented Electrical Steels. Appl. Sci. 2023, 13, 6097. [Google Scholar] [CrossRef]
  5. Sahoo, G.; Singh, C.D.; Deepa, M.; Dhua, S.K.; Saxena, A. Recrystallization behaviour and texture of non-oriented electrical steels. Mater. Sci. Eng. A 2018, 734, 229–243. [Google Scholar] [CrossRef]
  6. Ou, J.; Liu, Y.; Breining, P.; Gietzelt, T.; Wunsch, T.; Doppelbauer, M. Experimental Characterization and Feasibility Study on High Mechanical Strength Electrical Steels for High-Speed Motors Application. IEEE Trans. Ind. Appl. 2021, 57, 284–293. [Google Scholar] [CrossRef]
  7. Tanaka, I.; Yashiki, H.; Iwamoto, S.; Takamaru, H.; Nakayama, T. Development of high strength electrical steel SXRC of resource-saving design. Mater. Jpn. 2011, 49, 29–31. [Google Scholar] [CrossRef]
  8. Zhong, B.; Cheng, Z.; Volkova, O.; Zhang, X.; Liu, J. Effect of microstructure modification on magnetic and mechanical properties of high-grade non-oriented silicon steel during annealing treatment. J. Mater. Res. Technol. 2023, 27, 7730–7739. [Google Scholar] [CrossRef]
  9. YU, L.; LUO, H. Effect of partial recrystallization annealing on magnetic properties and mechanical properties of non-oriented silicon steel. Acta Metall. Sin. 2019, 56, 291–300. [Google Scholar]
  10. Lin, Y.; Wang, H.; Wei, H.; Zhang, W.; Wang, S.; Qiu, S.; Lu, H.; Wang, Y. Thick-Gauge Ultra-High-Strength High-Silicon Non-Oriented Silicon Steel with Balanced Mechanical and Magnetic Properties Controlled by Partial Recrystallization Annealing. JOM 2022, 74, 3788–3798. [Google Scholar] [CrossRef]
  11. Zhang, B.; Liang, Y.; Wen, S.; Wang, S.; Shi, X.; Ye, F.; Lin, J. High-strength low-iron-loss silicon steels fabricated by cold rolling. J. Magn. Magn. Mater. 2019, 474, 51–55. [Google Scholar] [CrossRef]
  12. Takashima, M.; Komatsubara, M.; Morito, N. {001}<210> Texture Development by Two-Stage Cold Rolling Method in Non-oriented Electrical Steel. ISIJ Int. 1997, 37, 1263–1268. [Google Scholar]
  13. An, L.-Z.; Wang, Y.-P.; Wang, G.-D.; Liu, H.-T. Comparative study on microstructure and texture evolution of low silicon non-oriented electrical steels along one-stage and two-stage cold rolling processes. J. Magn. Magn. Mater. 2023, 567, 170358. [Google Scholar] [CrossRef]
  14. Qin, J.; Liu, D.-f.; Yue, Y.; Zhao, H.-j.; Lai, C.-b. Effect of normalization on texture evolution of 0.2-mm-thick thin-gauge non-oriented electrical steels with strong η-fiber textures. J. Iron Steel Res. Int. 2019, 26, 1219–1227. [Google Scholar] [CrossRef]
  15. Yao, Y.; Sha, Y.; Liu, J.; Zhang, F.; Zuo, L. Texture and microstructure for magnetic properties of two-stage cold-rolled Fe-6.5 wt pct Si thin sheets. Metall. Mater. Trans. A 2016, 47, 5771–5776. [Google Scholar] [CrossRef]
  16. Li, Z.-h.; Xie, S.-k.; Wang, G.-d.; Liu, H.-t. Ultrathin-gauge high silicon non-oriented electrical steel with high permeability and low core loss fabricated by optimized two-stage cold rolling method. Mater. Charact. 2022, 183, 111593. [Google Scholar] [CrossRef]
  17. Lu, Y.; Zu, G.; Luo, L.; Wang, Y.; Gao, L.; Yuan, L.; Ran, X.; Zhang, X. Investigation of microstructure and properties of strip-cast 4.5 wt% Si non-oriented electrical steel by different rolling processes. J. Magn. Magn. Mater. 2020, 497, 165975. [Google Scholar] [CrossRef]
  18. Mehdi, M.; He, Y.; Hilinski, E.J.; Kestens, L.A.I.; Edrisy, A. The evolution of cube ({001}<100>) texture in non-oriented electrical steel. Acta Mater. 2020, 185, 540–554. [Google Scholar]
  19. Sanjari, M.; He, Y.; Hilinski, E.J.; Yue, S.; Kestens, L.A.I. Development of the {113}<uvw> texture during the annealing of a skew cold rolled non-oriented electrical steel. Scr. Mater. 2016, 124, 179–183. [Google Scholar]
  20. Kim, T.-Y.; Kim, H.-K.; Jeong, Y.-K.; Ahn, Y.-K.; Shim, H.-S.; Kwon, D.; Hwang, N.-M. Ex-Situ Time Sequential Observation on Island and Peninsular Grains in Abnormally Growing Goss Grains in Fe–3%Si Steel. Met. Mater. Int. 2020, 26, 1200–1206. [Google Scholar] [CrossRef]
  21. Fang, F.; Yu, C.; Wang, J.; Ding, Q.; Zhang, Y.; Wang, Y.; Kang, J.; Zhang, X.; Yuan, G.; Wang, G. Abnormal grain growth with preferred orientation in non-oriented silicon steel: A quasi-in situ study. J. Mater. Sci. 2024, 59, 3150–3167. [Google Scholar] [CrossRef]
  22. Wang, Y.-Q.; Kong, W.-W.; Yuan, C.; Chen, Y.-P.; Liu, X.; Liu, S. Effects of annealing on microstructures and properties of cold-rolled GH3536 sheet. Mater. Charact. 2021, 180, 111409. [Google Scholar] [CrossRef]
  23. Li, Z.-H.; Xie, S.-K.; Wang, G.-D.; Liu, H.-T. Dependence of recrystallization behavior and magnetic properties on grain size prior to cold rolling in high silicon non-oriented electrical steel. J. Alloys Compd. 2021, 888, 161576. [Google Scholar] [CrossRef]
  24. Huang, Y.; Prangnell, P. The effect of cryogenic temperature and change in deformation mode on the limiting grain size in a severely deformed dilute aluminium alloy. Acta Mater. 2008, 56, 1619–1632. [Google Scholar] [CrossRef]
  25. Qiu, S.; Niu, Y.; Qiao, J.; Wang, H. A Review of Development and Performance Control of Non-Oriented Silicon Steel for Drive Motors. J. Anhui Univ. Technol. Nat. Sci. 2024, 41, 350–364. [Google Scholar]
  26. Jiao, H.; Xu, Y.; Zhao, L.; Misra, R.; Tang, Y.; Liu, D.; Hu, Y.; Zhao, M.; Shen, M. Texture evolution in twin-roll strip cast non-oriented electrical steel with strong Cube and Goss texture. Acta Mater. 2020, 199, 311–325. [Google Scholar] [CrossRef]
  27. Qiao, J.; Liu, C.; Guo, F.; Xiang, L.; Qiu, S.; Wang, H. Effect of recrystallization annealing temperature on texture and magnetic properties of 2.97% Si non-oriented silicon steel. Metall. Res. Technol. 2019, 116, 412. [Google Scholar] [CrossRef]
  28. Ni, Z.; Cheng, Z.; Jing, W.; Wendler, M.; Volkova, O.; Zhang, X.; Liu, J. Effects of Cu Content on Mechanical and Magnetic Properties of High-Strength Nonoriented Silicon Steel. Steel Res. Int. 2024, 2300865. [Google Scholar] [CrossRef]
  29. Chen, W.; Cheng, Z.; Wen, Q.; Wendler, M.; Volkova, O.; Liu, J. High-Strength Nonoriented Electrical Steel with Excellent Magnetic Properties Accomplished by Cu–Ni Multialloying. Steel Res. Int. 2024, 2400254. [Google Scholar] [CrossRef]
  30. Li, Z.-H.; Wang, G.-D.; Liu, H.-T. Effects of processing routes on recrystallization texture development and magnetic properties of 0.10 mm ultrathin non-oriented electrical steel sheets for high-frequency application. J. Alloys Compd. 2023, 935, 167984. [Google Scholar] [CrossRef]
  31. Ghosh, P.; Chromik, R.R.; Vaseghi, B.; Knight, A.M. Effect of crystallographic texture on the bulk magnetic properties of non-oriented electrical steels. J. Magn. Magn. Mater. 2014, 365, 14–22. [Google Scholar] [CrossRef]
  32. Leuning, N.; Steentjes, S.; Hameyer, K. Effect of grain size and magnetic texture on iron-loss components in NO electrical steel at different frequencies. J. Magn. Magn. Mater. 2019, 469, 373–382. [Google Scholar] [CrossRef]
  33. Ning, X.; Liang, Y.; Wang, Y.; Ye, F.; Lin, J. A comprehensive study on texture evolution and recrystallization mechanism of Fe-4.5 wt% Si with strong {114}<481>. J. Mater. Res. Technol. 2023, 27, 7506–7520. [Google Scholar]
  34. Liu, J.; Sha, Y.; Hu, K.; Zhang, F.; Zuo, L. Formation of Cube and Goss Texture After Primary Recrystallization in Electrical Steels. Metall. Mater. Trans. A 2014, 45, 134–138. [Google Scholar] [CrossRef]
  35. Zhang, Y.; Xia, Y.; Dun, H.; Wang, Y.; Fang, F.; Zhang, Y.; Zhang, J.; Chen, Q.; Zhai, K.; Misra, R.D.K. Evolution of the Shear Band in Cold-Rolling of Strip-Cast Fe-1.3% Si Non-Oriented Silicon Steel. Materials 2021, 14, 775. [Google Scholar] [CrossRef]
  36. Park, J.-T.; Szpunar, J.A. Evolution of recrystallization texture in nonoriented electrical steels. Acta Mater. 2003, 51, 3037–3051. [Google Scholar] [CrossRef]
  37. Hawezy, D.; Birosca, S. Disparity in recrystallization of α- & γ-fibers and its impact on Cube texture formation in non-oriented electrical steel. Acta Mater. 2021, 216, 117141. [Google Scholar]
Figure 1. Schematic diagram showing process flow of Fe-3.3 wt% Si steel with different processes.
Metals 14 01127 g001
Figure 2. Microstructure and textures of initial hot-rolled band (a) Microstructure; (b) Surface texture; (c) Subsurface texture; (d) Central layer texture.
Metals 14 01127 g002
Figure 3. Microstructures and textures of first-stage rolled and intermediate annealed bands.
Metals 14 01127 g003
Figure 4. Microstructures and textures of the final cold-rolled bands.
Metals 14 01127 g004
Figure 5. Microstructures and textures of the final annealed bands.
Metals 14 01127 g005
Figure 6. The volume fraction of specific textures and texture factors.
Metals 14 01127 g006
Figure 7. Microstructures and texture evolution of final sheet with different annealing times of process B.
Metals 14 01127 g007
Figure 8. Macro-texture evolution of final sheet with different annealing times of process B.
Metals 14 01127 g008
Figure 9. Microstructure and area fraction evolution of grains with specific orientations.
Metals 14 01127 g009
Figure 10. The volume fraction of specific textures and texture factors of final annealed sheet with different annealing times of process B.
Metals 14 01127 g010
Figure 11. GND density of final annealed samples with different annealing times of process B.
Metals 14 01127 g011
Table 1. The chemical composition of the Fe-3.3 wt% Si steel (wt.%).
CSiMnAlSNFe
≤0.0053.3≤0.5≤1.1≤0.005≤0.005Bal.
Table 2. Magnetic and mechanical properties of Fe-3.3 wt% Si steel under different processes.
SamplesP15/50
(W/Kg)
P10/400
(W/Kg)
B50
(T)
Rp0.2
(MPa)
Rm
(MPa)
E
(%)
A-15m3.2621.461.67150861219.4
B-15m2.9621.161.68350561318.2
C-15m3.0721.151.67949659420.1
D-15m3.8528.271.66054163414.7
Table 3. Magnetic and mechanical properties of Fe-3.3 wt% Si steel under process B.
SamplesP15/50
(W/Kg)
P10/400
(W/Kg)
B50
(T)
Rp0.2
(MPa)
Rm
(MPa)
E
(%)
B-200s4.4029.421.66462167110.6
B-250s3.8424.781.69060565511.9
B-5m3.2821.841.69857864813.4
B-10m3.2921.971.68552361915.9
B-15m2.9621.161.68350561318.2
Table 4. Comparison of properties of different silicon steels.
SamplesP10/400
(W/Kg)
B50
(T)
Rp0.2
(MPa)
Fe-3.3 wt% Si steel in this work21.841.698578
Commercial B35AHS55030.001.660575
Disclaimer/Publisher’s Note: The statements, opinions and data contained in all publications are solely those of the individual author(s) and contributor(s) and not of MDPI and/or the editor(s). MDPI and/or the editor(s) disclaim responsibility for any injury to people or property resulting from any ideas, methods, instructions or products referred to in the content.

