Article

Microscopic Simulation of RE3+ Migration in Ion-Type Rare Earth Ores Based on Navier–Stokes Equation—Exchange Reaction—Ion Migration Coupling

by
Dan Wang
1,2,
Fuyu Wu
3,*,
Yunzhang Rao
4,*,
Zhilian Zhao
1,
Wei Xu
4,5 and
Min Han
4
1
Faculty of Resources and Civil Engineering, Gannan University of Science and Technology, Ganzhou 341000, China
2
Ganzhou Key Laboratory of Mine Geological Disaster Prevention and Control and Ecological Restoration, Ganzhou 341000, China
3
Jiangxi Burequ of Geology Non-Ferrous Geological Brigade, Ganzhou 341000, China
4
School of Resources and Environmental Engineering, Jiangxi University of Science and Technology, Ganzhou 341000, China
5
The Seventh Geological Brigade of Jiangxi Bureau of Geology, Ganzhou 341000, China
*
Authors to whom correspondence should be addressed.
Metals 2024, 14(10), 1130; https://doi.org/10.3390/met14101130
Submission received: 29 August 2024 / Revised: 27 September 2024 / Accepted: 30 September 2024 / Published: 4 October 2024
(This article belongs to the Special Issue Advances in Mineral Processing and Hydrometallurgy—3rd Edition)

Abstract

:
In the in-situ leaching method of ionic rare earth, ion exchange reaction between rare earth ions and leaching agent ions is carried out, which allows the rare earth ions to be leached from the ore body as the leaching solution flows through the pores. This indicates that the leaching process of rare earth ions is closely related to the seepage field, ion exchange field, and ion migration process of the leaching solution. In this study, an ionic rare earth mine located in Longnan of Jiangxi Province was taken as the research object. By conducting nuclear magnetic resonance scanning on the ore samples of this mine and vectorizing the nuclear magnetic resonance images, a two-dimensional geometric model of pores was obtained. Then, COMSOL Multiphysics software was used to establish a coupled numerical model of seepage–exchange–migration of the ionic rare earth mine during the leaching process at the pore scale to study the seepage situation of leaching solution with different injection strengths and concentrations, as well as the exchange and migration process. The results show that increasing the concentration of magnesium ions can increase the difference of ion diffusion concentration, accelerate the forward exchange rate of ions, promote the forward exchange reaction, and improve the concentration gradient of rare earth ions in the leaching solution. The more significant the diffusion effect, the higher the ion migration rate, while at the same time inhibiting the reverse adsorption of rare earth ions, and accelerating the leaching efficiency of rare earth ions. In addition, increasing the strength of the injection solution allows rare earth ions to leach out of the ore body earlier, shortens the leaching cycle, and thus reduces the peak concentration of leached rare earth ions. By analyzing the effects of the strength of the injection solution and leaching concentration on ionic rare earth leaching, the influence of those two factors on engineering economy can be briefly evaluated, which can be provided as a reference for the optimization of ionic rare earth mining technology.

1. Introduction

Rare earth elements in ionic rare earth minerals are adsorbed on the surface of clay minerals in the ionic phase form, which has certain chemical stability, and which conventional methods cannot effectively enrich [1]. According to the physical and chemical characteristics of ionic rare earth minerals, after three generations of technological innovation, the in-situ leaching process has been widely promoted [2,3]. In-situ leaching technology mainly relies on a leaching solution to extract and collect rare earth ions in order to mine ionized rare earth ore. In the process of seepage in the pores of orebodies, the flow of the leaching solution is not only related to the type of liquid (liquid density, viscosity, and other factors), but also affected by pore friction, hydraulic shear, particle shape resistance, and natural gravity. The exchange reaction between active cations and rare earth ions in the leaching solution causes a change of solute content, which further affects the flow of the leaching solution.
The flow of leaching solution also affects the migration of various ions. In addition to convection, it can also affect the migration of ions through dispersion, diffusion, and other effects. Therefore, the leaching process of ionic rare earth is a multi-field coupling process of leaching fluid seepage, active cation and rare earth ion exchange, and ion migration.
Smooth seepage channels inside the ore body are conducive to the mutual contact between cations and rare earth ions, and also allow rare earth ions to be leached more smoothly with the leaching solution, thereby improving the leaching efficiency. Therefore, the hydraulic properties of clay minerals such as particle size (solid skeleton), pore structure, and permeability are important factors affecting the leaching process. At present, scholars mainly study the basic leaching theory of ionic rare earth based on laboratory tests, and focus on pore structure evolution, reduction of ammonia nitrogen pollution, and the mechanism of ore body strength weakening [4,5,6]. Most laboratory tests can only summarize the initial ore results to draw rules, and cannot intuitively show the hydrodynamic distribution of the leaching solution in the pores of the ore body, the ion exchange situation, the spatio-temporal distribution of ions during solute migration, etc. It is difficult to obtain instantaneous data in a non-equilibrium state. Therefore, it is difficult to describe the essential laws of the leaching process of ionic rare earth under multi field coupling relying solely on laboratory tests.
With the application and development of computer technology, numerical simulation test methods have gradually developed into an effective means of scientific research, as important as theoretical analysis and experimental methods [7,8]. Compared with laboratory tests, numerical simulation tests have the advantage of being able to consider multiple interactions and major control processes simultaneously. A model with complex initial parameters and boundary conditions can be simulated effectively [9]. Therefore, the use of a numerical simulation test can make up for the shortcomings of laboratory test research methods, directly display the transient data in the test process, and deepen the transient studies of the leaching process of ionic rare earth ore under the action of multi-field coupling. At present, in multi-field coupling simulation studies of the leaching process, the ore body is often regarded as a porous medium, and a uniform model is established with the help of the average concept to describe and simulate the leaching process [10,11,12,13]. However, without considering the non-uniformity of rare earth ore particle size and the disordered distribution of particles on seepage, it is impossible to accurately describe the spatiotemporal distribution of hydrodynamic parameters in various pores. With the development of modern testing technologies (CT, NMR, etc.), the internal pores of ionic rare earth ore bodies can be accurately displayed by these testing methods, laying a foundation for establishing the internal seepage channel model of ore bodies through pore images [14,15,16]. Sheikhzadeh [17] established an unsaturated seepage model of leach in two-dimensional uniform spherical ore particles considering the mass conservation relationship between the liquid phase in the particles and the ore layer. The model was solved by the implicit FDM method to study the influence of periodic infiltration of leach on vertical velocity distribution and saturation of ore body. Wu Chengyou [18] used the Boltzmann model of coupled ion exchange to study the seepage of leaching solution during the leaching process, and analyzed the influence of injection intensity and temperature on the rare earth ions transport. Liu Qingsheng [19] combined fluid dynamics, chemical reaction dynamics, and rock and soil mechanics to construct a coupled percolation–react–stress model of the leaching process, and studied the spatio-temporal evolution of seepage field, ion concentration field, and stress field during column leaching under different coaxial pressure, confining pressure and injection strength through COMSOL Multiphysics. Combining hydrodynamics and chemical reaction dynamics, Zeng Jia [20] explored the seepage law of leaching solution and the influence of ion exchange under different conditions by CFD simulation method, and put forward reasonable suggestions on the setting of injection strength. Wu [21] established a fully coupled model of flow–reaction–deformation–mass–transfer in the leaching process based on existing results with the consideration of the deformation factors of ore during the leaching process, and studied the distribution of porosity, saturation, leaching solution concentration, and leaching rare earth ion concentration in an ore heap under one-dimensional fixed spray and constant water head conditions. Liu Jinzhi [22] established the elastic deformation seepage control equation and mass transfer control equation of ore heap leaching, solved these two control equations through porosity coupling, and simulated the change law of leaching solution and leaching ion concentration during constant head leaching. Jiang Wang [23] constructed a real 3D model of an ionic rare earth mine using topographic data of the test stope, and constructed a coupling model of chemical react–dilute matter transfer based on Darcy’s law through the reaction particle bed module in COMSOL Multiphysics to study the spatio-temporal distribution and evolution of process rare earth ions during the leaching process.
In this paper, NMRI (nuclear magnetic resonance imaging) technology was applied to construct a geometric model of the internal seepage channel of rare earth ore body at pore scale, combined with the momentum conservation equation of motion of viscous incompressible fluid (Navier–Stokes equation, hereinafter referred to as: N-S equation), considering the mechanism of ion exchange (adsorption and desorption) and solute convection and diffusion, and a coupled numerical model of ionic rare earth minerals at pore scale was established. With the help of COMSOL Multiphysics, the leaching process multi-field coupling under saturation leaching state was simulated, the seepage law, ion exchange law, and solute migration law of the leaching solution in the pores were summarized, and the process was directly explored. The research results obtained can provide reference for the optimization of ionic rare earth ore mining technology.

2. Theory and Experimental Process

2.1. Theory and Mathematical Model

  • Seepage control equation
In this study, we assume that the leaching solution is an incompressible fluid, and its flow process in the pores of the mineral soil can be described by the Navier–Stokes equation [24,25,26]. The continuity equation is as follow:
u = 0
where u is the velocity vector of the fluid. The equation of motion is:
ρ u t + u u = p I + μ u + u T + F
where P is fluid pressure, Pa; ρ is the fluid density, kg/m3; μ is hydrodynamic viscosity; I is the unit vector; t is time, s; and F is the volume force vector, N/m3.
2.
Control equation of reaction kinetics
The reaction relationship between MgSO4 and ionic rare earth is expressed by the Arrhenius equation. At 25 °C, the activation energy of MgSO4 and ionic rare earth is 7.77 kJ/mol, and the equilibrium constant of the reaction is 20.
R r e = 0.09528 × C 0 1.554 × e E R T
where Rre is the Arrhenius reaction rate of MgSO4 leaching rare earth; E is the activation energy of chemical reaction, J/mol; R is the ideal gas constant, 8.314 J/(mol · K); and T is the temperature, 298.15 K.
When the leaching solution flows within the pores of the ore body, it also undergoes exchange reactions with rare earth ions adsorbed on the surface of the mineral soil particles [27]. Assuming that rare earth ions undergo tangential transfer along the surface, this process can be described by Fick’s law:
N t , i = D s , i t c s , i
where Nt,i is the surface molar flux, mol/(m · s); Ds,i is the surface diffusion coefficient of substance i, m2/s; and Cs,i is the concentration of surface substance i, mol/m2. The controlling equation for the concentration of each substance on the surface of mineral soil particles is:
c s , i t = t N t , i + R s , i
where Rs,i is the sum of source terms caused by surface reaction and adsorption analysis, mol/(m2 · s).
3.
Control equation of solute transport
After the ion exchange reaction, rare earth ions enter into the leaching solution and transfer in the pore of the ore during the seepage process [28]. This process is mainly controlled by convection and diffusion; therefore, the migration process of rare earth ions in the pores of the ore body during the leaching process can be described by the convection–diffusion equation:
c i t + u c i = R i + D i c i
where Ci is the concentration of substance i, mol/m3; Di is the diffusion coefficient of substance i, m2/s; Ri is the reaction rate of substance i, mol/(m3 · s); and u is the velocity vector of the fluid, m/s.

2.2. Column Leaching Experiment

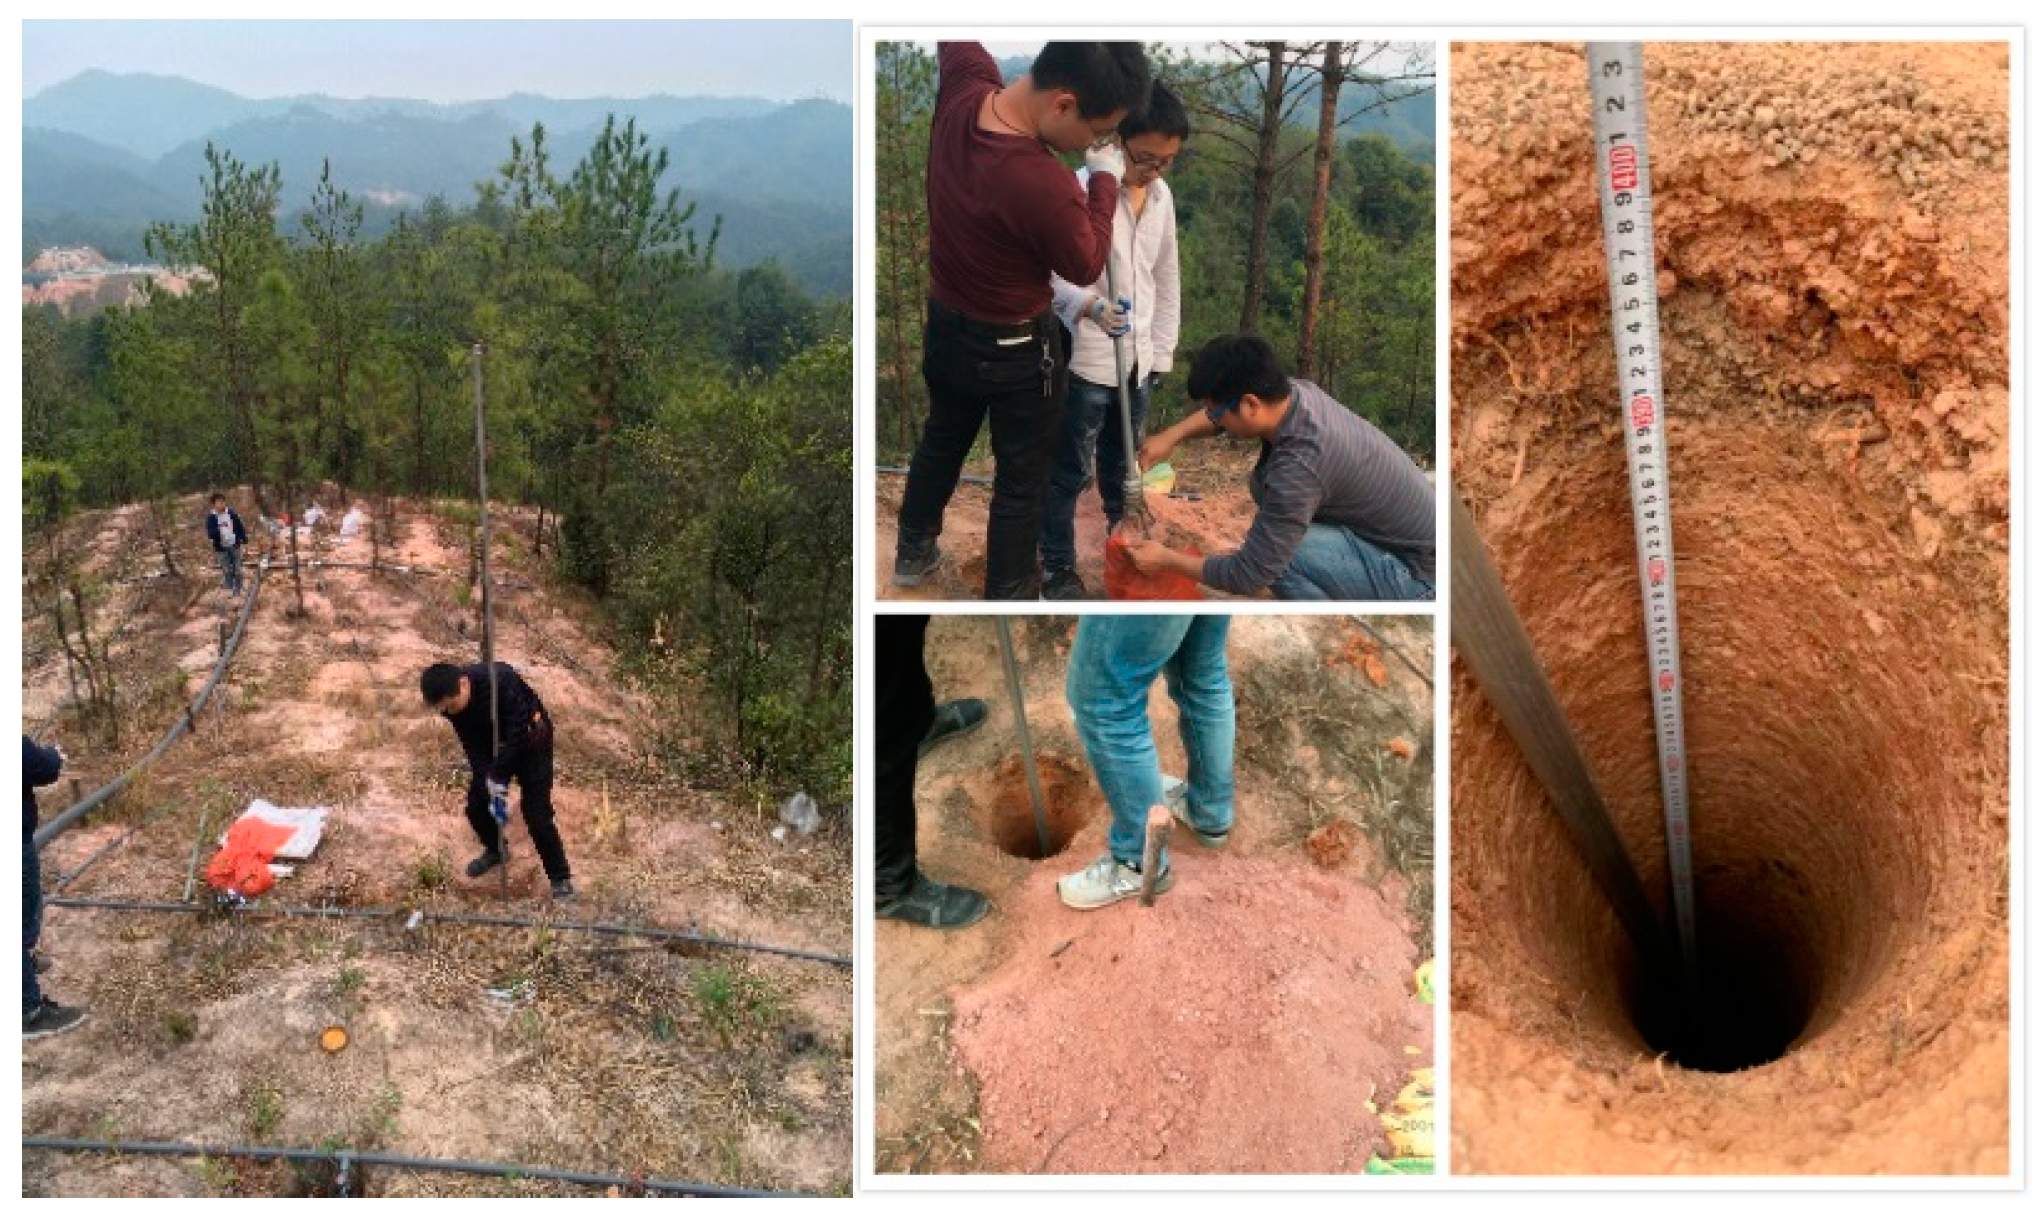
2.2.1. Soil Sampling

The study area is an ionic rare earth mining area in Longnan, Ganzhou of Jiangxi Province, as shown in Figure 1. Longnan is situated in the southernmost part of southern Jiangxi Province, which has a typical subtropical monsoon climate with the same period of rain and heat. The landform of the mine is mainly hilly and is a weathering denudation landform. The distribution of ore bodies in the area is consistent with the granite weathering layer, and the ore types are mainly ion adsorption type. The mine profile is divided from top to bottom into topsoil, weathered layer containing rare earth elements (total regolith and semi-regolith) and bedrock. The vertical thickness of the topsoil is about 0.4~1.2 m, which is composed of humus, sand, clay and quartz gravel. Due to the fuzzy interface between weathered layers, it is difficult to classify them. Generally, rock layers other than topsoil and bedrock are considered as ore body layers. The vertical thickness of the ore layer is 6.0~10.0 m, and the thickest part can reach 13.0 m. The bedrock layer is mainly composed of biotite granite and muscovite granite, which has a compact structure and low water permeability and is a good natural water barrier floor. The main groundwater types in this area are loose rock pore water and bedrock fissure water, the former with a buried depth of 0.5~1.0 m, and the latter with a buried depth of 2.6~4.5 m, mainly diving type. The geological data of the mine show that the rare earth minerals in this area are mainly phosphorite, with an average grade of 0.0877%. At present, the mine adopts an in-situ leaching method, and the impurity elements in the mother liquor are mainly aluminum and iron.
To obtain the physical properties of the soil in the test stope more truly, a luoyang shovel with diameter of 160 mm and a shovel were used to remove the humus layer on the surface first, and the shovel was applied to shovel to 0.5 m of ore soil before sampling. The sampling process was as follows: Dig 1 m each time, take 3 soil samples at the same depth, totaling 9 soil samples, and wrap the extracted soil samples with plastic wrap to avoid excessive evaporation of water from soil samples during subsequent transportation, which may affect the determination of physical properties of undisturbed soil [29]. At the same time, the remaining loose soil after sampling of the same depth was packed and brought back with woven bags and marked on the outside. The sampling site of the mineral soil is shown in Figure 2.
The ring tool method was used to drill a number of samples of different depths, and the density of the samples at each depth was tested [30]. Porosity is not only the main index to reflect the pore development of soil, but also a significant parameter to reflect the pore structure of mineral soil. Accurately measuring porosity and porosity ratio during this leaching process has significant practical significance. Based on the specific gravity and density ρ of the mineral soil, the porosity and porosity ratio were calculated as shown in Table 1. Using the vibrating screen method to screen the mineral soil at different depths, different mesh sieves were stacked on the vibrating screen machine. Samples of 500 g at different depths were placed in the top sieve, and the mineral soil was graded and vibrated for 10~15 min. The mineral soil mass on the sieve with different pore sizes was weighed and the proportion of particle size range was calculated. The particle size distribution results of samples at different depths are shown in Table 2.

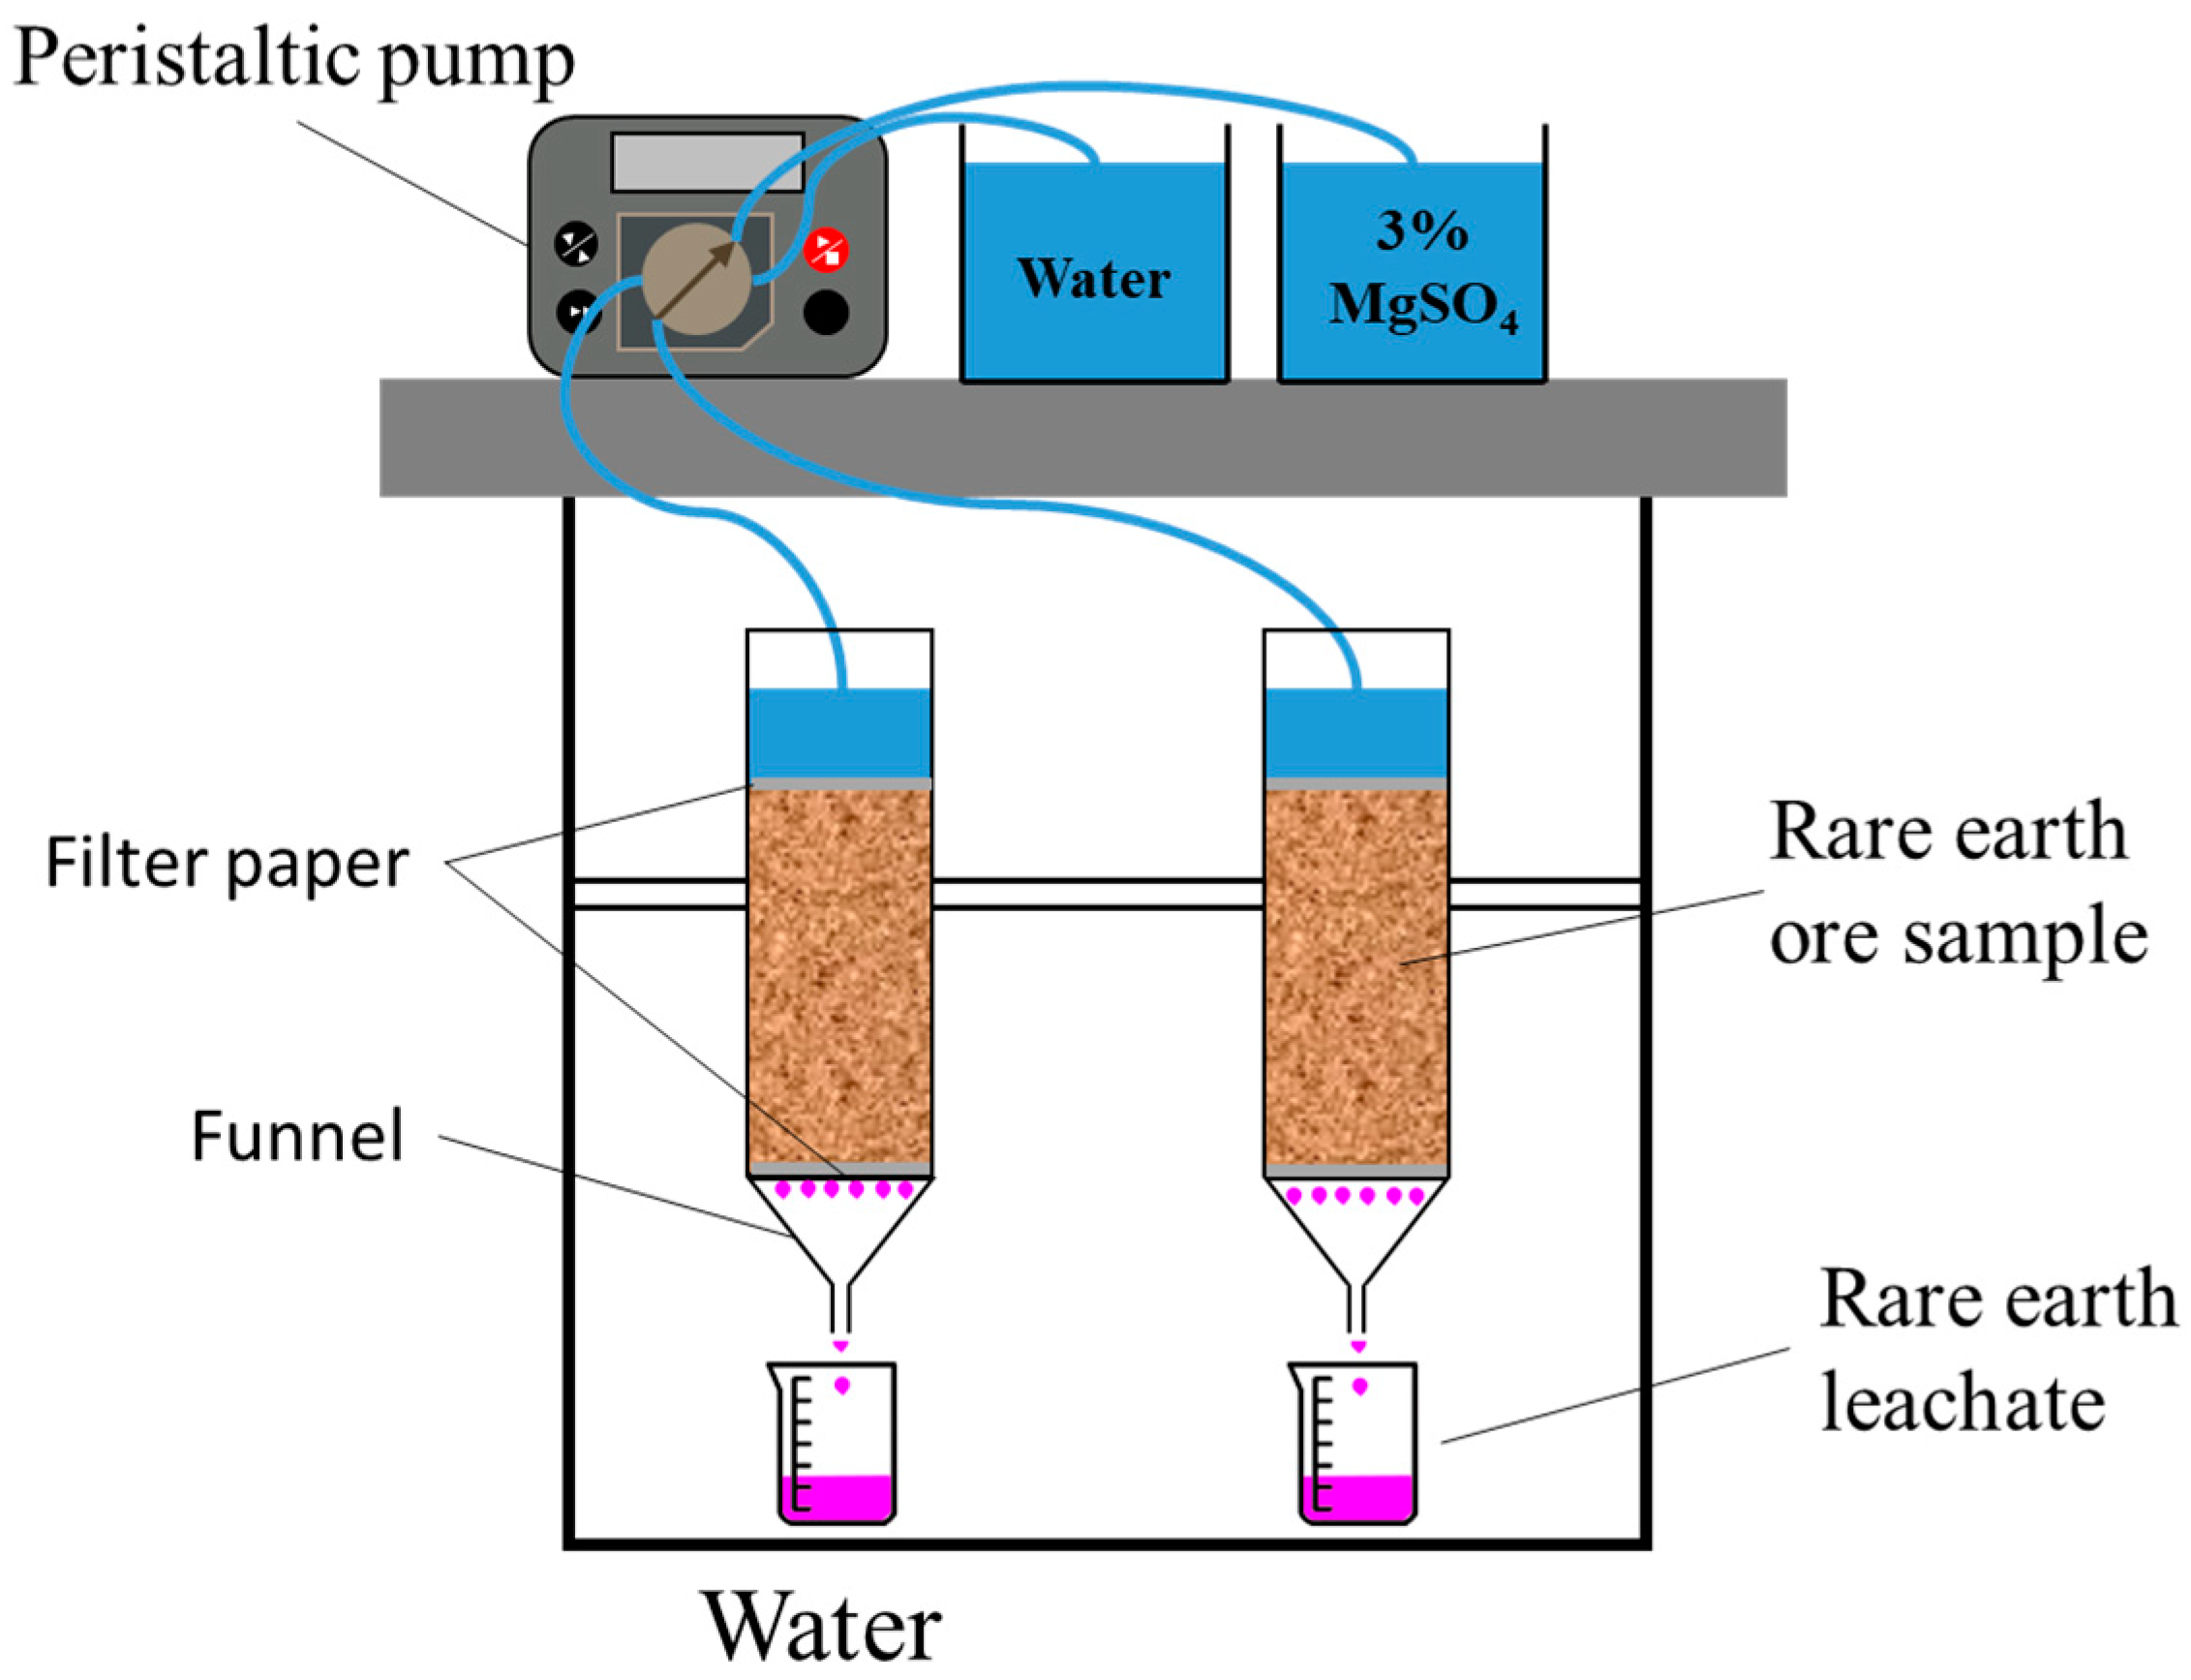
2.2.2. Column Leaching Test

The column leaching test device includes a liquid distribution/storage container, a disposable infusion tube, a loading stage, and a container for collecting leach liquid, as shown in Figure 3.
After the above research on the leaching kinetics of MgSO4 solution and combined with mine test stope experience, it can be concluded that using a 3% mass fraction MgSO4 solution for leaching is more effective, and other ions in the product can also be significantly reduced. In this experiment, an MgSO4 solution of this concentration was used for column leaching.
In this experiment, one terminal of the infusion tube was introduced into the liquid storage container, while the opposing terminal was positioned above the sample. The infusion rate was calibrated to 1 mL/min, and the infusion device was activated to replicate the leaching process. The leachate was subsequently collected at the outlet, and the concentration of rare earth ions in the leachate was quantified using the EDTA volumetric method. Measurements were conducted every 10 min during the initial phase and every 30 min during the subsequent phase, with data being recorded to elucidate the leaching process [31].

3. Model Establishment and Boundary Condition

The samples used in this study were taken from magnesium salt leaching test stope in Longnan. In order to obtain a more realistic internal pore microstructure of ionic rare earth ore body in the experimental leaching site, luoyang shovels were used to excavate to the bottom of the surface soil and a 2 m long, 42 mm diameter acrylic transparent tube was inserted into the ore body. In this way, an undisturbed sample was obtained when the tube body was extracted. Then, a cylindrical sample with a height of 100 mm with both ends was dug out, the two ends of the sample were sealed with permeable stone, and the pores of the cylindrical sample were filled with water after being treated with water for 48 h. In order to eliminate the disturbance caused by sample interception and closure, a nuclear magnetic resonance instrument was used to scan and image the samples with the height of 50 mm as the center and 30 mm at both ends along the axial direction. The higher the moisture content of the sample, the stronger the NMR signal, and the brighter the pixels displayed in the image, indicating the pore structure of the sample. In order to reflect the characteristics of the aggregate structure of the mineral soil, the gray image of the pore image generated at the position of the axial section was taken, and the image was processed by image processing software, such as light source correction, image segmentation, filtering, and denoising. Then, the solid skeleton and pore channel were digitized, and a two-dimensional geometric model of 42 mm × 60 mm was generated. The two-dimensional numerical model establishment process and the ion migration simulation calculation process are shown in Figure 4.
The NMR analysis and imaging system (MesomR23-060H-I V1, as shown in Figure 5) produced by Suzhou Niumai Analytical Instrument Co., Ltd. (Suzhou, China) was used to conduct NMR scanning and imaging of mineral samples. In this experiment, we set the magnetic field strength to 0.5 T, the probe coil diameter φ = 60 mm, and an effective testing length of 60 mm to conduct detection and analysis of the physical properties of samples, such as porosity, pore size distribution, oil/water saturation, and crack development, as well as the pore structure.
As the image analysis and processing technology has been widely used in aerospace, biomedicine, military and other fields, the development of this testing technology provides a possibility for the construction of ionic rare earth porous seepage channels [32,33,34]. In this study, Raster2Vector advanced raster image vectoring software system (hereinafter referred to as R2V) with good adaptability and high precision was adopted to vectorize the nuclear magnetic image of the pores of ionic rare earth ore, and complete the construction of its seepage channel, as shown in Figure 6 and 7. The detailed steps are as follows:
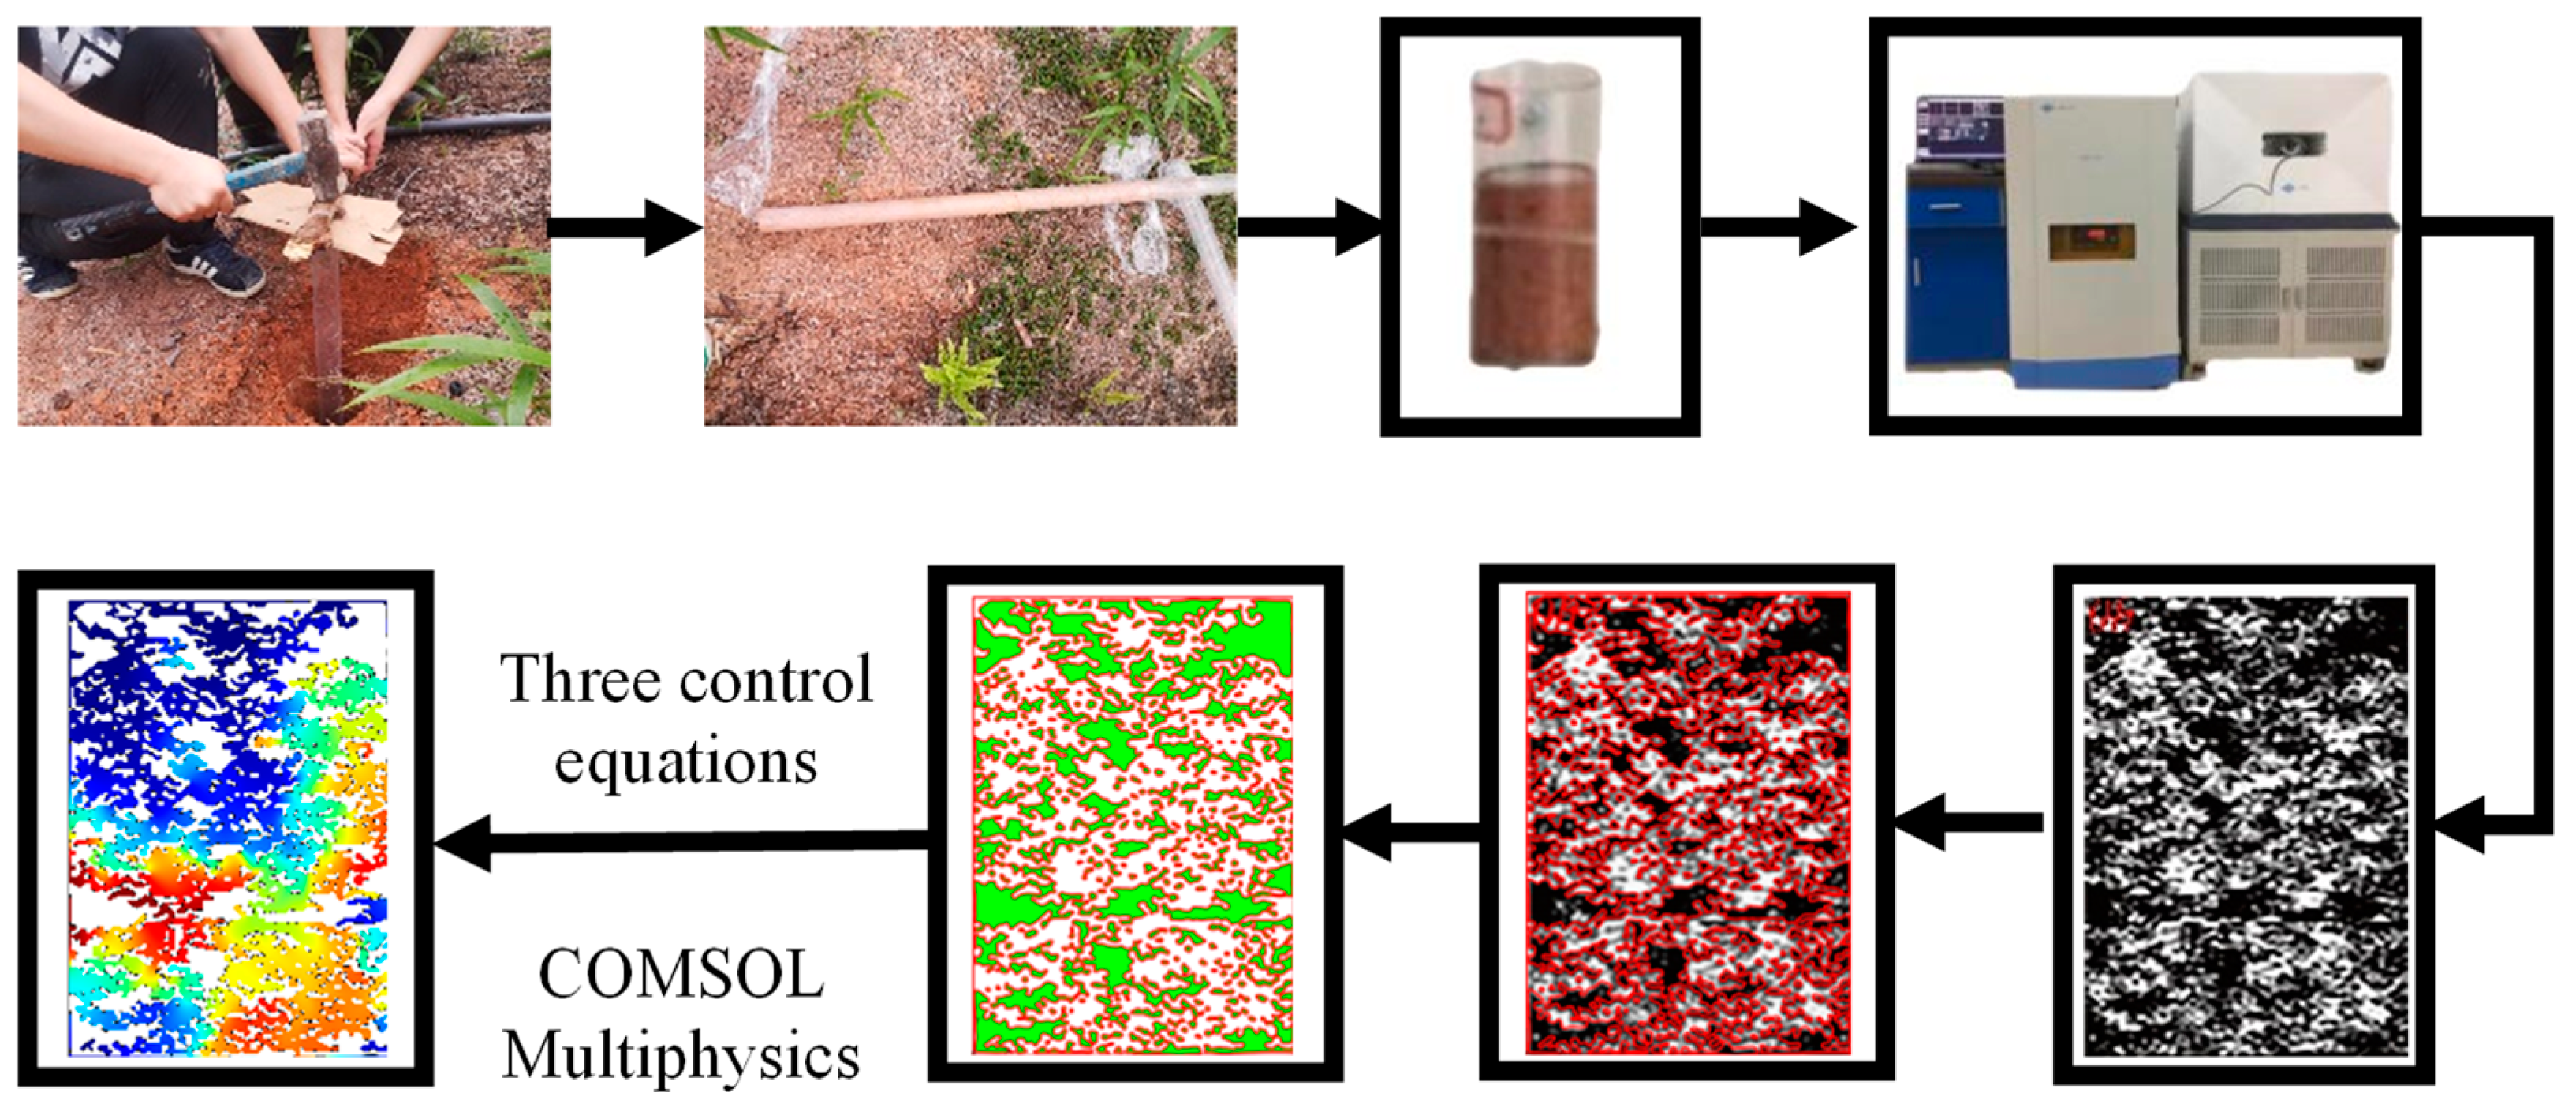
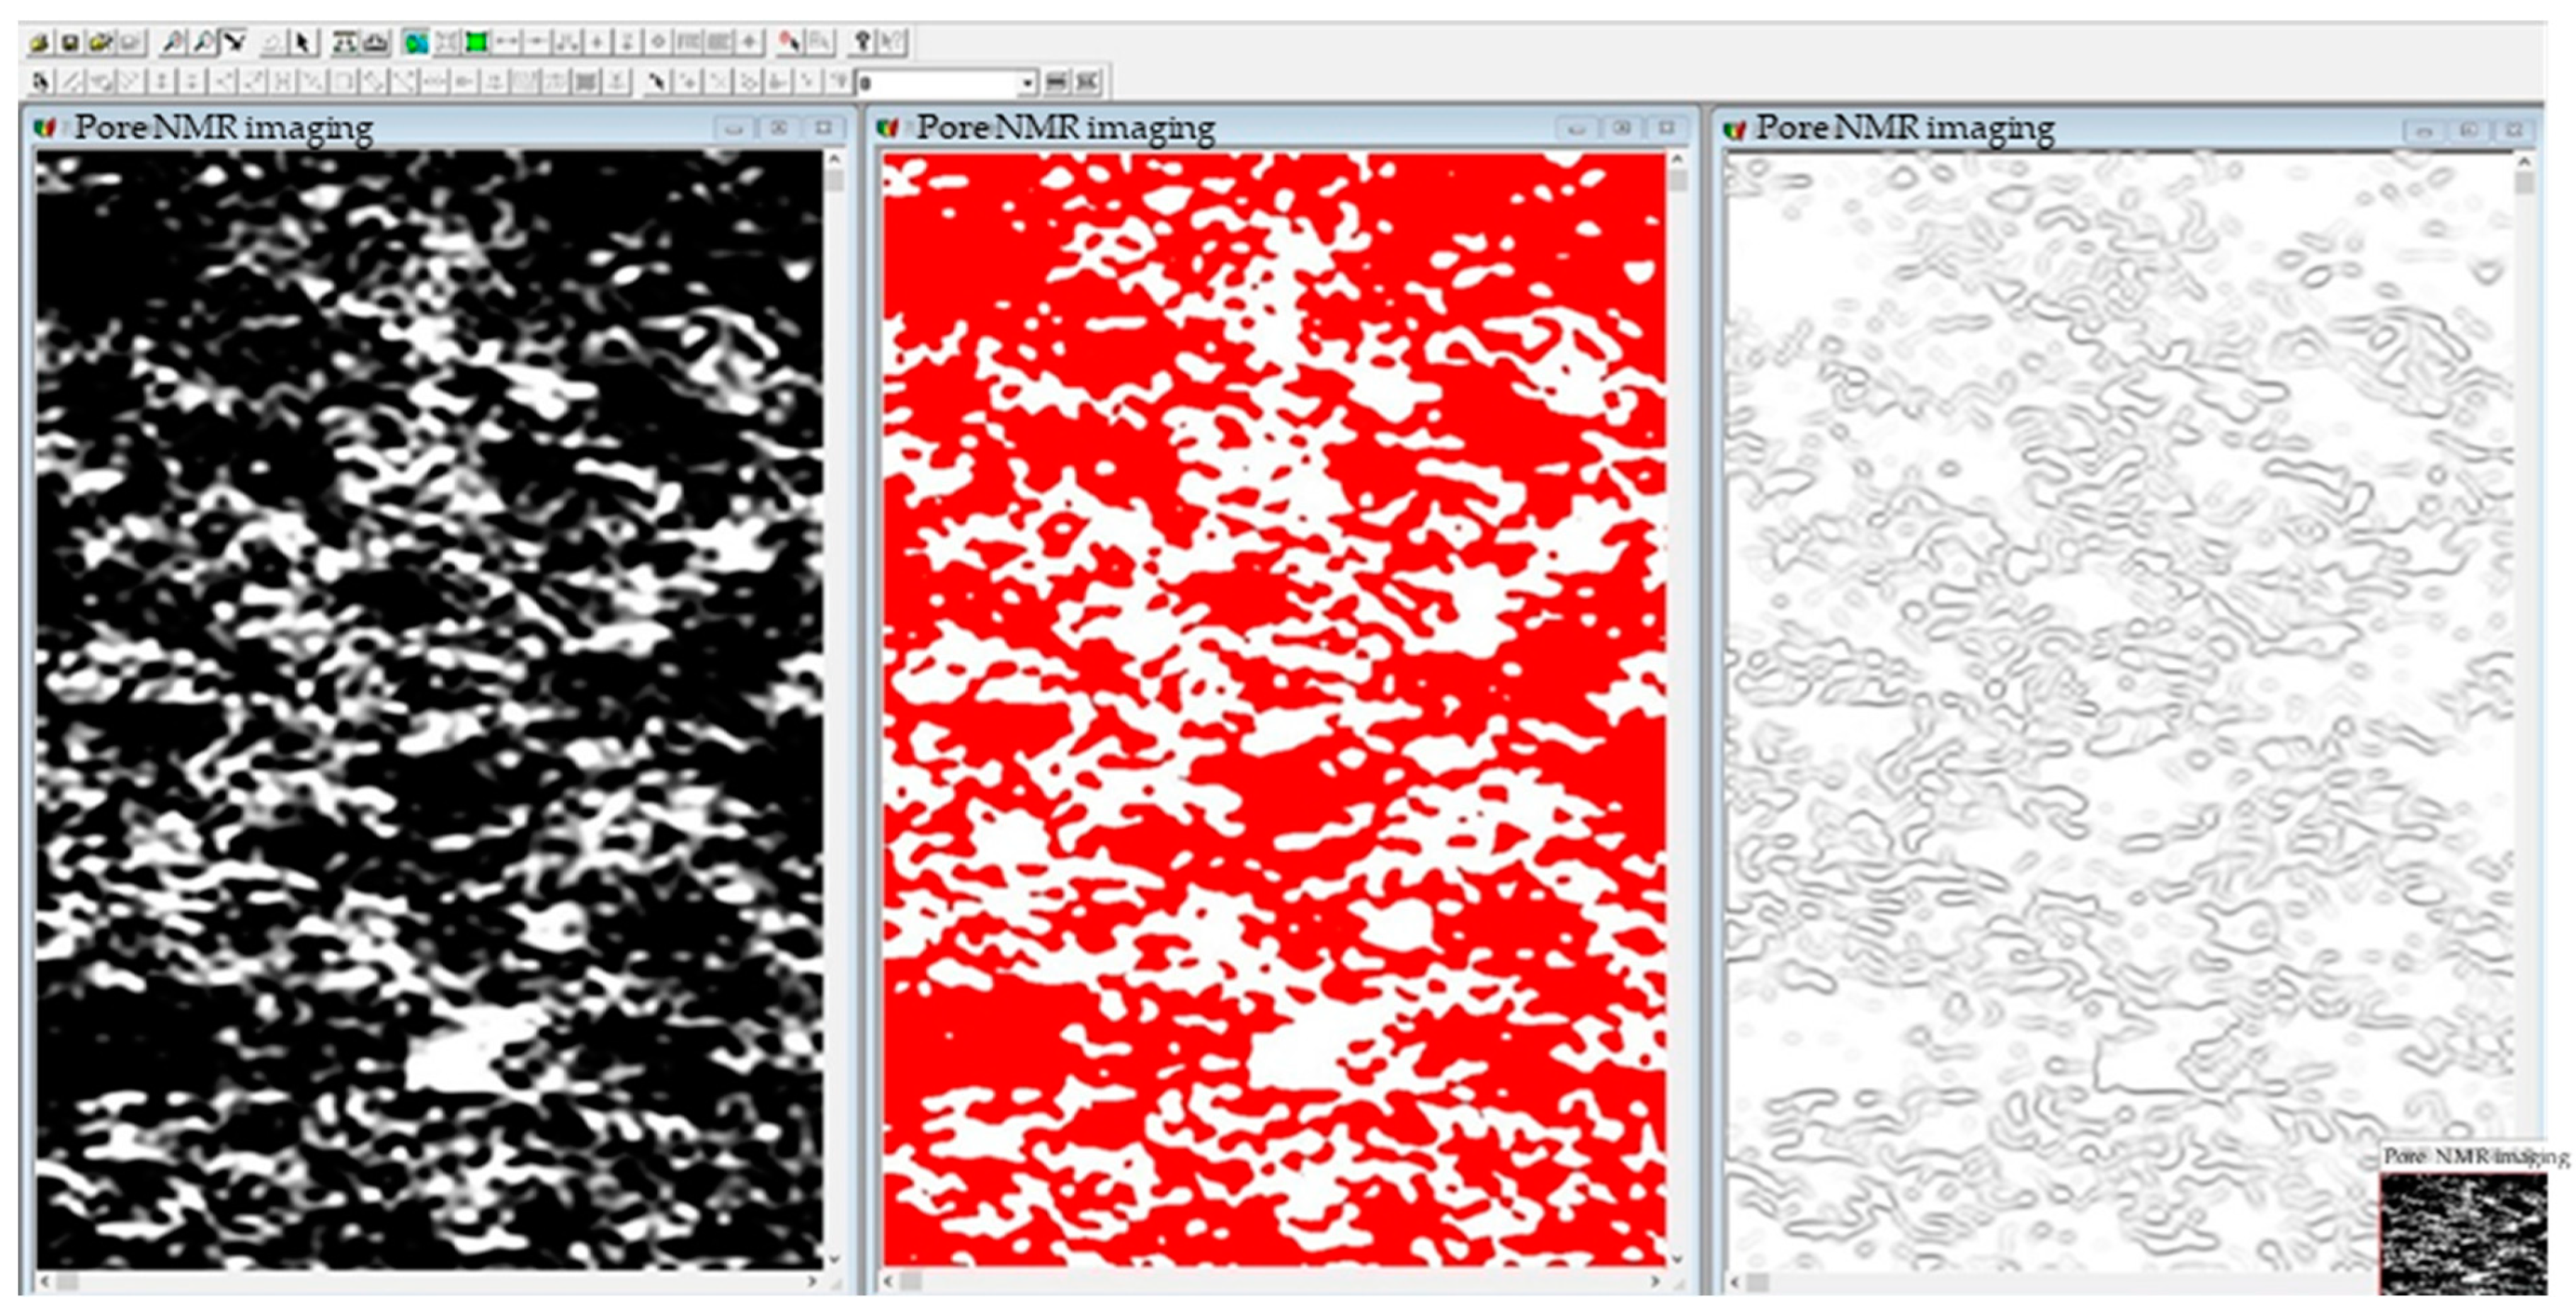
  • Image binarization and sharpening. NMR images were imported into R2V software and binarized. Image binarization was the process to control the grayscale value of each pixel in each image within the range of [0, 255], while using high-pass filtering to enhance the high-frequency semaphores of the image and filter the low frequency signals to achieve the purpose of sharpening the image, so as to make the outline of the ore body particle skeleton clearer and facilitate the edge detection and contour extraction in the later stage.
  • Threshold segmentation. The low threshold of the image obtained in the previous step was set to 0 and the high threshold to 56. Through the control of the high and low threshold, the area of the ore body particle skeleton located in the image was determined, which can effectively distinguish the area where the ore body particles and pores flow.
  • Edge detection. The Sobel operator was used to detect the edge of the image after threshold adjustment. The Sobel operator is a filter operator based on first derivative, which can detect the target edge contour effectively by fast convolution function. The Sobel operator usually includes a set of horizontal and vertical 3 × 3 matrices. The approximate brightness difference values of the horizontal and vertical images can be obtained by convolution of the image with the plane. The matrix formula is shown as follows:
S x = 1 0 + 1 2 0 + 2 1 0 + 1   S y = + 1 + 2 + 1 0 0 0 1 2 1
Horizontal and vertical edge detection images are expressed as: G x = S x × A , G y = S y × A , where A is the original image. The approximate values of horizontal and vertical gradients of each pixel in the edge detection image are calculated as follows: G = G x 2 + G y 2 . The direction of the gradient can be calculated by θ = tan 1 G y G x .
4.
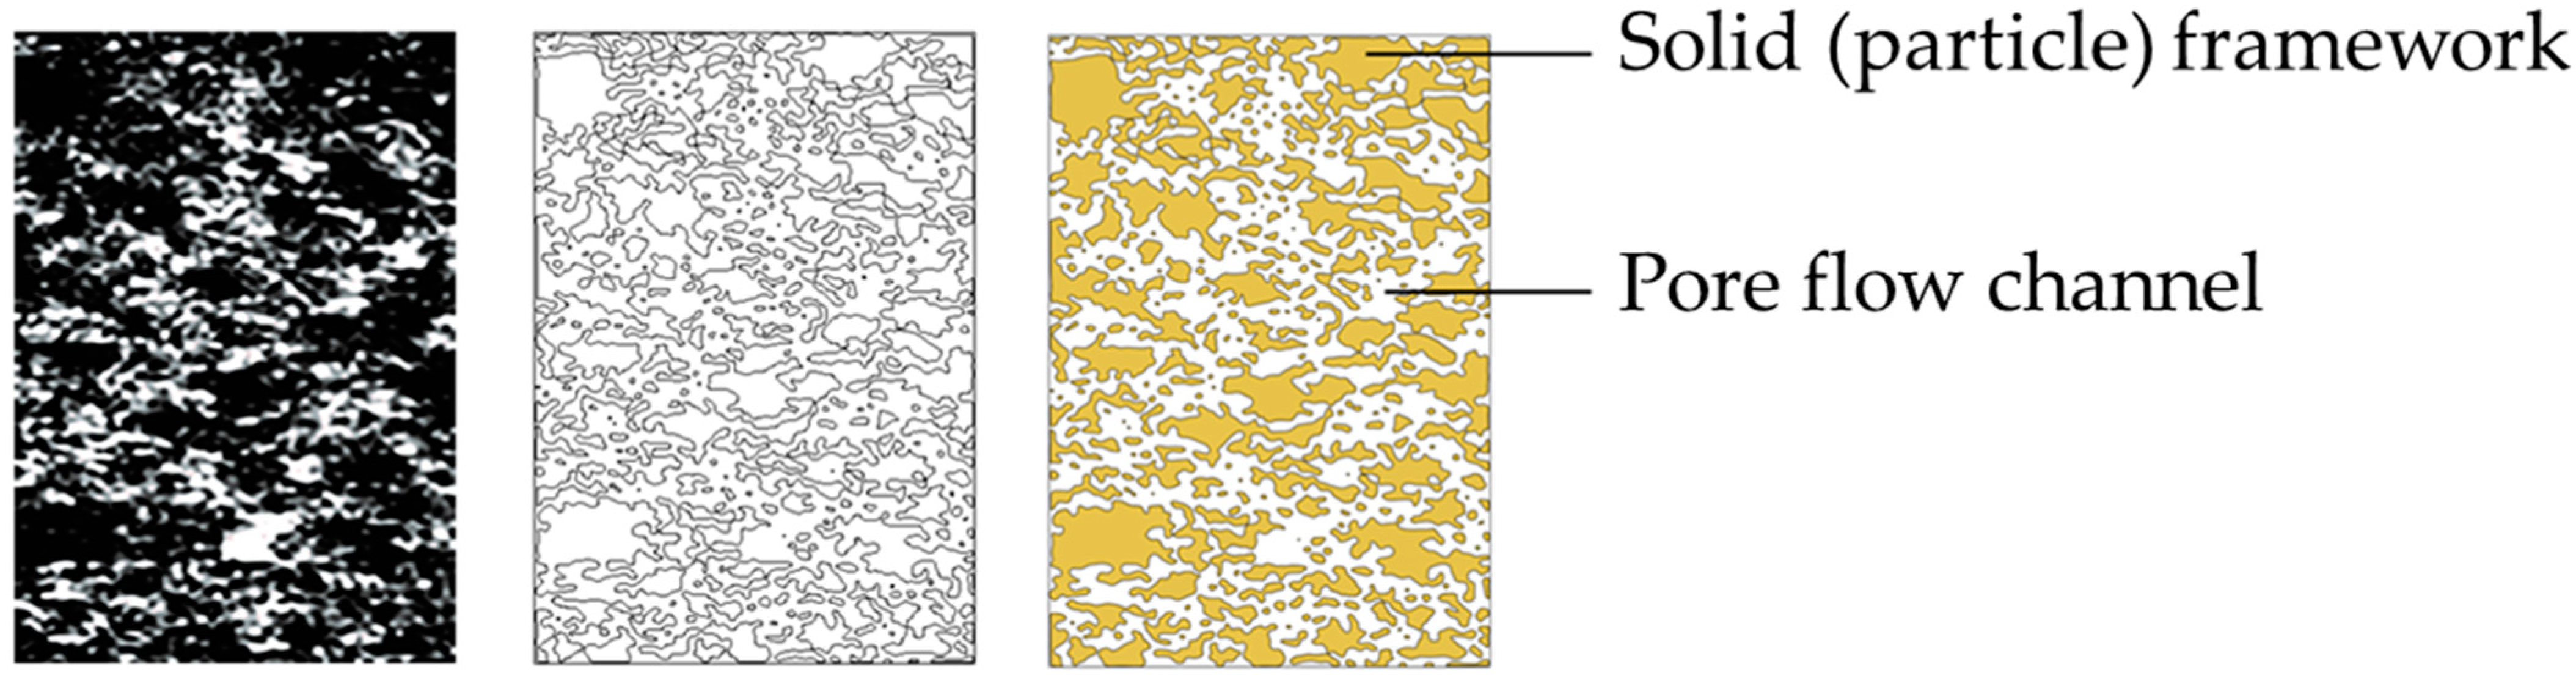
Contour extraction and edge processing. The frame edge of ore body particles detected by Sobel operator was vectorized by raster editing, and the edge contour vector of ore body particles was generated. The Sobel operator has a positive effect on the edge detection of the target, and the image noise after sharpening can be effectively suppressed, as shown in Figure 7.
5.
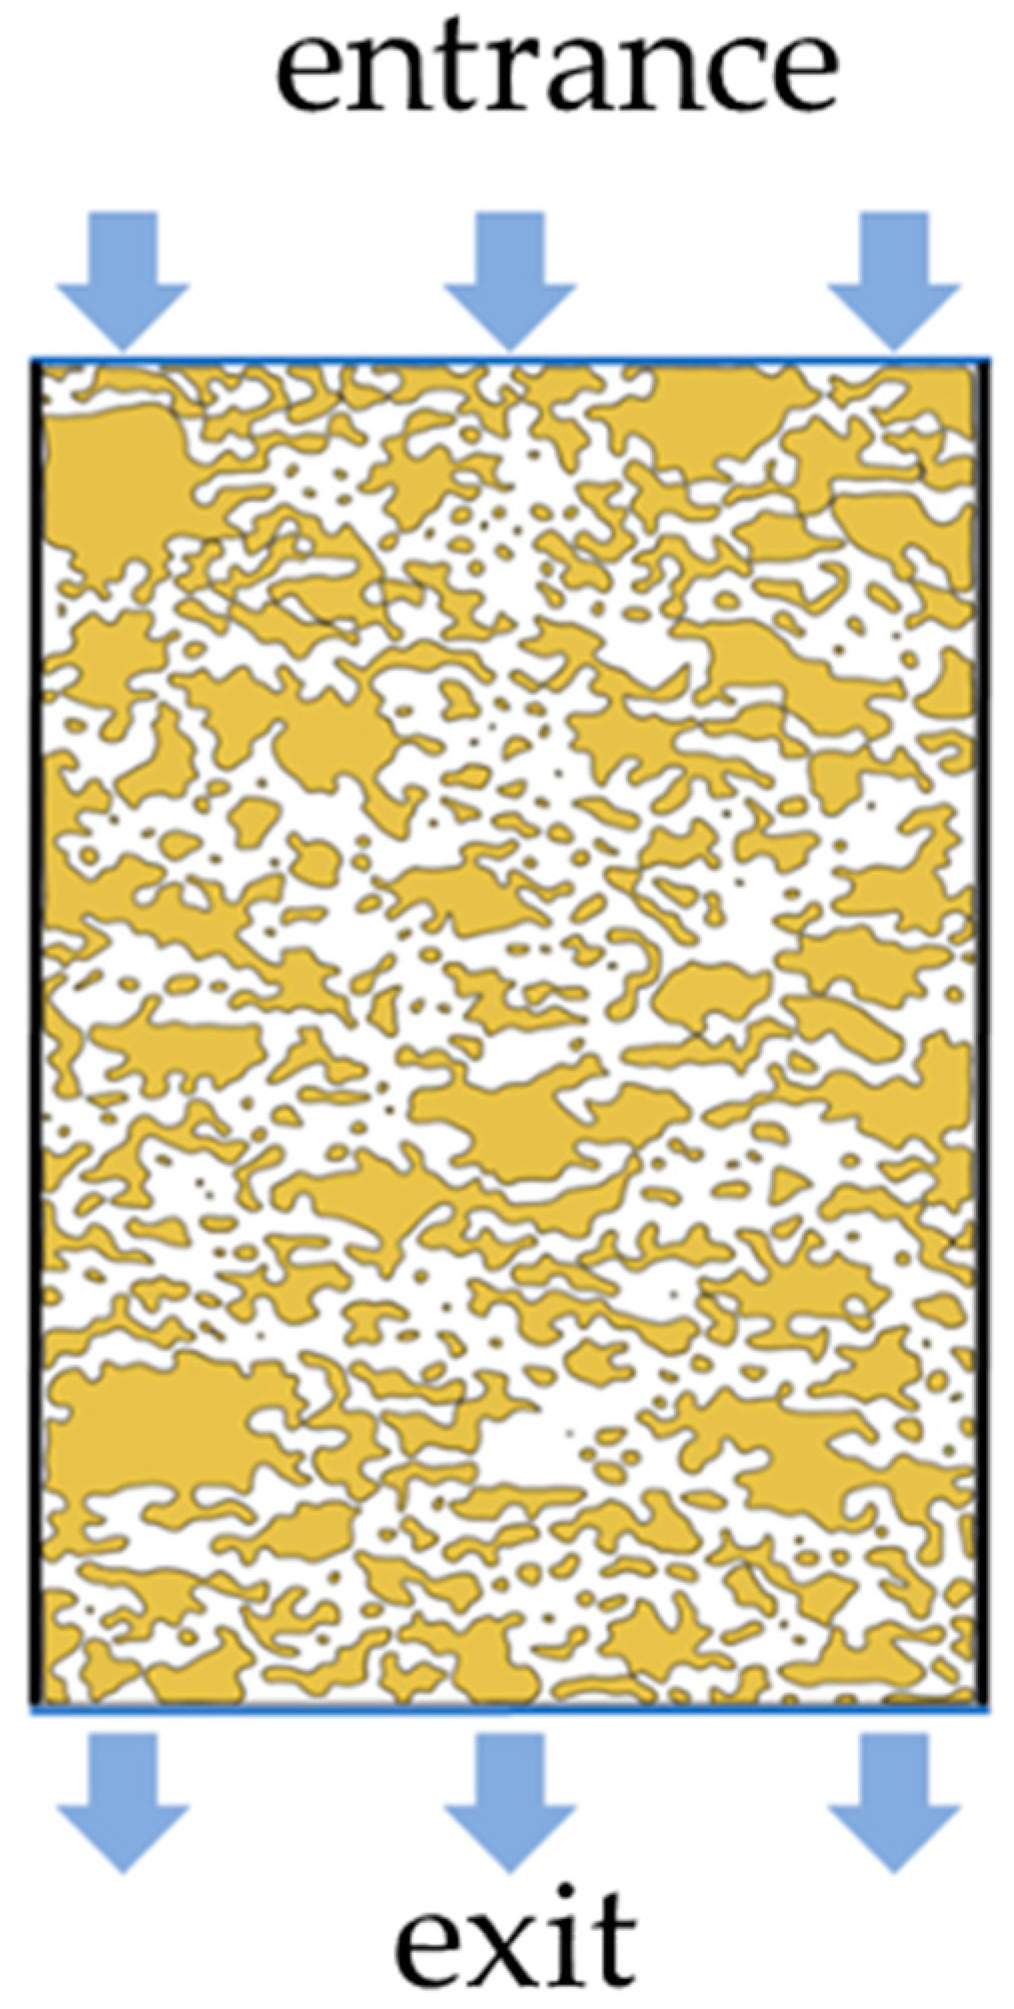
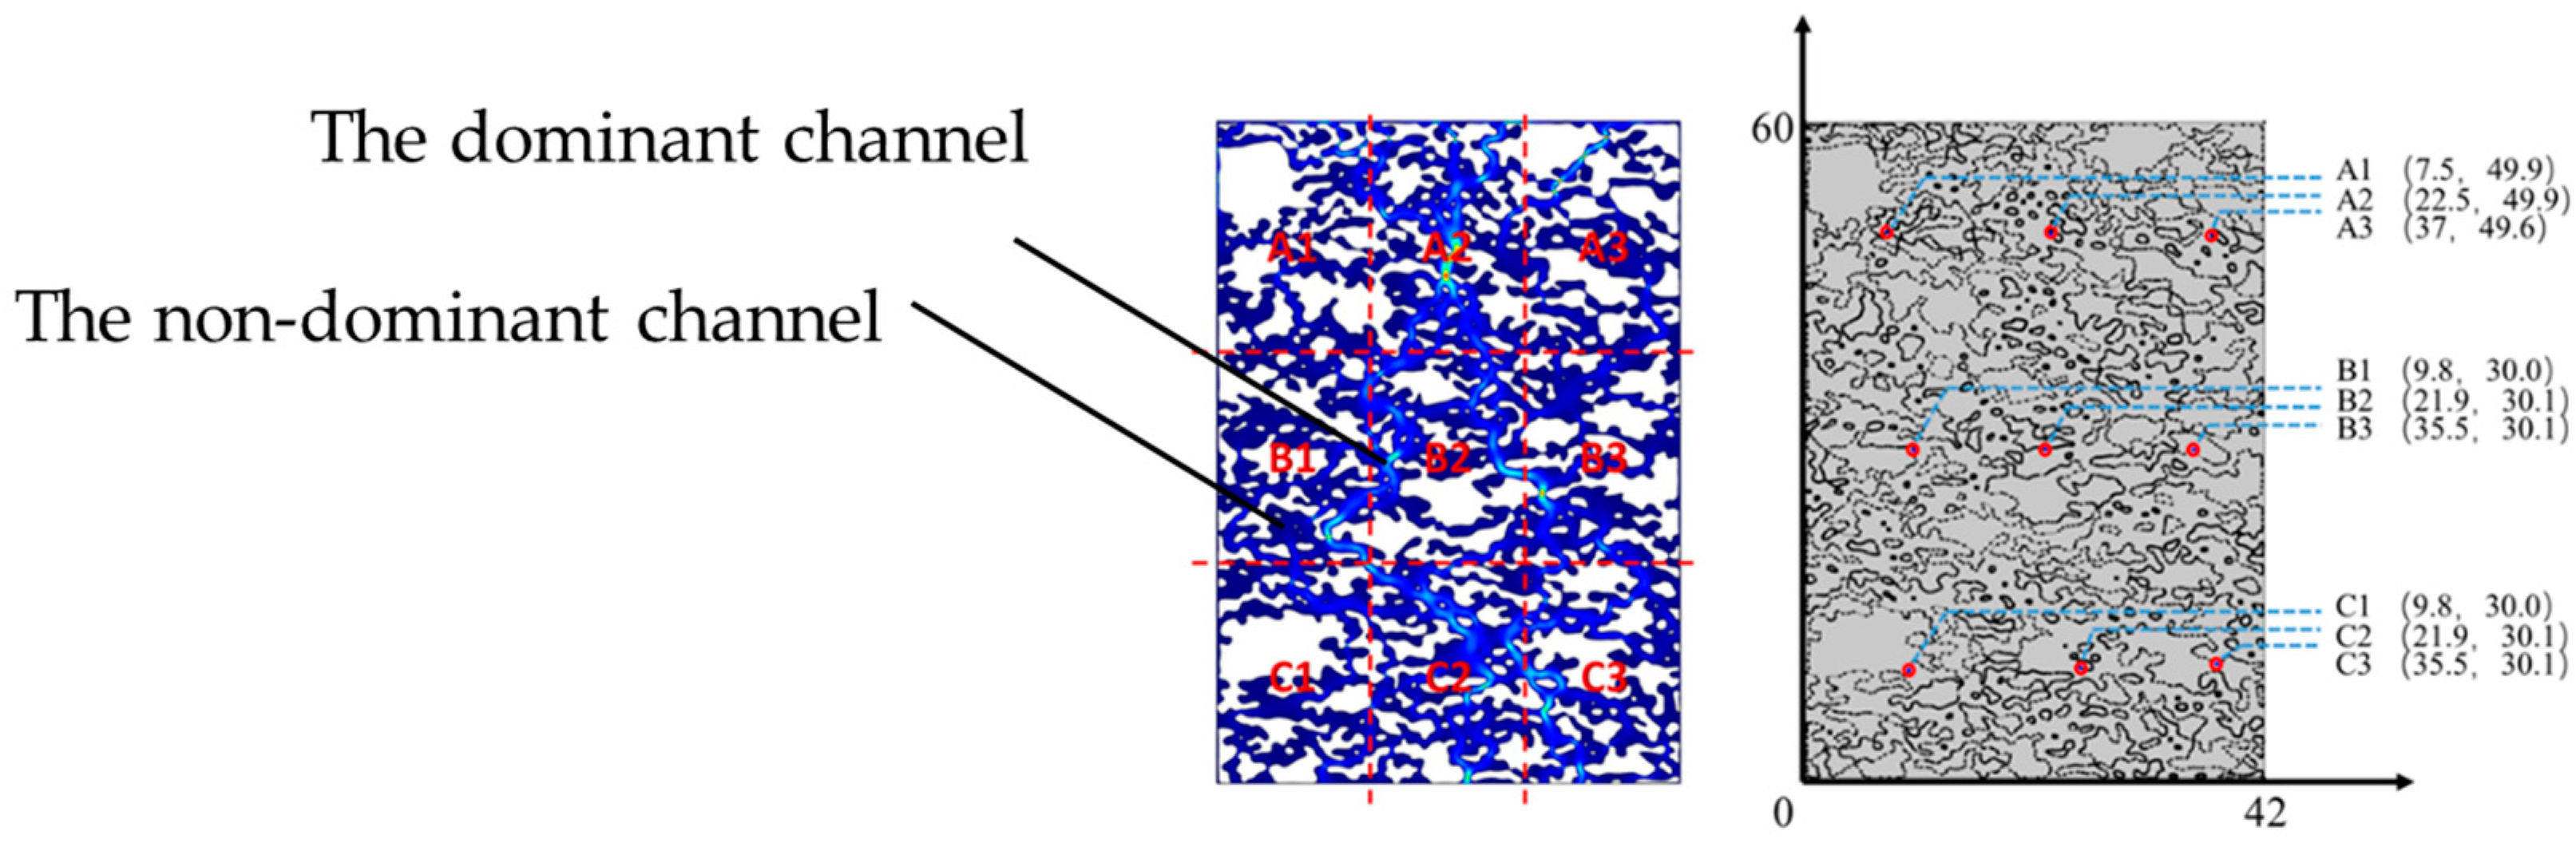
Pore channel connectivity processing. Since the NMR image is a two-dimensional image of the longitudinal section of the pillar, the vertical flow of the leaching solution can be reflected in the NMR image, while the seepage channel in the horizontal direction cannot be clearly reflected only through the image, and it is regarded as the particle part of the ore body.
The vector image obtained by the above steps was output into a DXF format file, the particle part of ore body was marked and distinguished, and the geometric model of the pore seepage channel of the ionic rare earth ore was obtained at pore scale. By comparison with the NMR image, the geometry model of the seepage channel can accurately restore the shape, size, and position distribution of the ore body particles and the distribution of pore channels, as shown in Figure 8.
According to the results of rare earth ion concentration and the amount of liquid collected in indoor experiment, the total weight of rare earth ions obtained was calculated to be 140.438 mg with MgSO4 at a mass concentration of 3%. At the same time, during the simulation, the concentration of rare earth ions on the surface of the mineral soil particles was calculated to be 0.12 mol/m2 based on the particle surface area setting. Selecting the condition with 3% MgSO4 and 1.0 mL/min injection intensity, the two-dimensional section model of undisturbed soil measured by nuclear magnetic resonance (hereinafter referred to as nuclear magnetic model) was compared with the results of column leaching experiment, as shown in Figure 9. The boundary conditions were set as follows: the top is the inflow boundary, and the type is the velocity boundary, with a velocity of 1.0 mL/min; the bottom boundary type is the pressure boundary, which is the free flow boundary, and the pressure is 0 Pa; both sides of the simulated tube wall are flux-free boundaries. According to the above three governing equations, the “Reaction engineering” interface in COMSOL Multiphysics software was used to calculate the relevant exchange reaction rate, diffusion coefficient, dispersion coefficient, and other parameters, and the chemical reaction process was coupled to the other two governing equations for solving.
The comparison of the changes in the average leached rare earth ion concentration (hereinafter referred to as leached concentration) over time between the experiment and simulation is shown in Figure 10. The leached concentration of the nuclear magnetic model and the column leaching experiment has a similar regular pattern with time, that is, in the initial stage, due to the fact that the leached mother liquor has not yet reached the outlet, the leached concentration maintains at a low level. As the mother liquor flows out from the outlet, the leached concentration gradually reaches its peak, and the peak leached concentration of the nuclear magnetic model and the indoor experiment are 9.31 g/L and 8.75 g/L, respectively. As the progress proceeds, the leached concentration continues to decrease and gradually approaches 0.0 g/L with the replacement of rare earth ions on the surface of the ore particles. Therefore, the nuclear magnetic model can reflect the micro-leaching process of in situ leaching well.

4. Results and Discussion

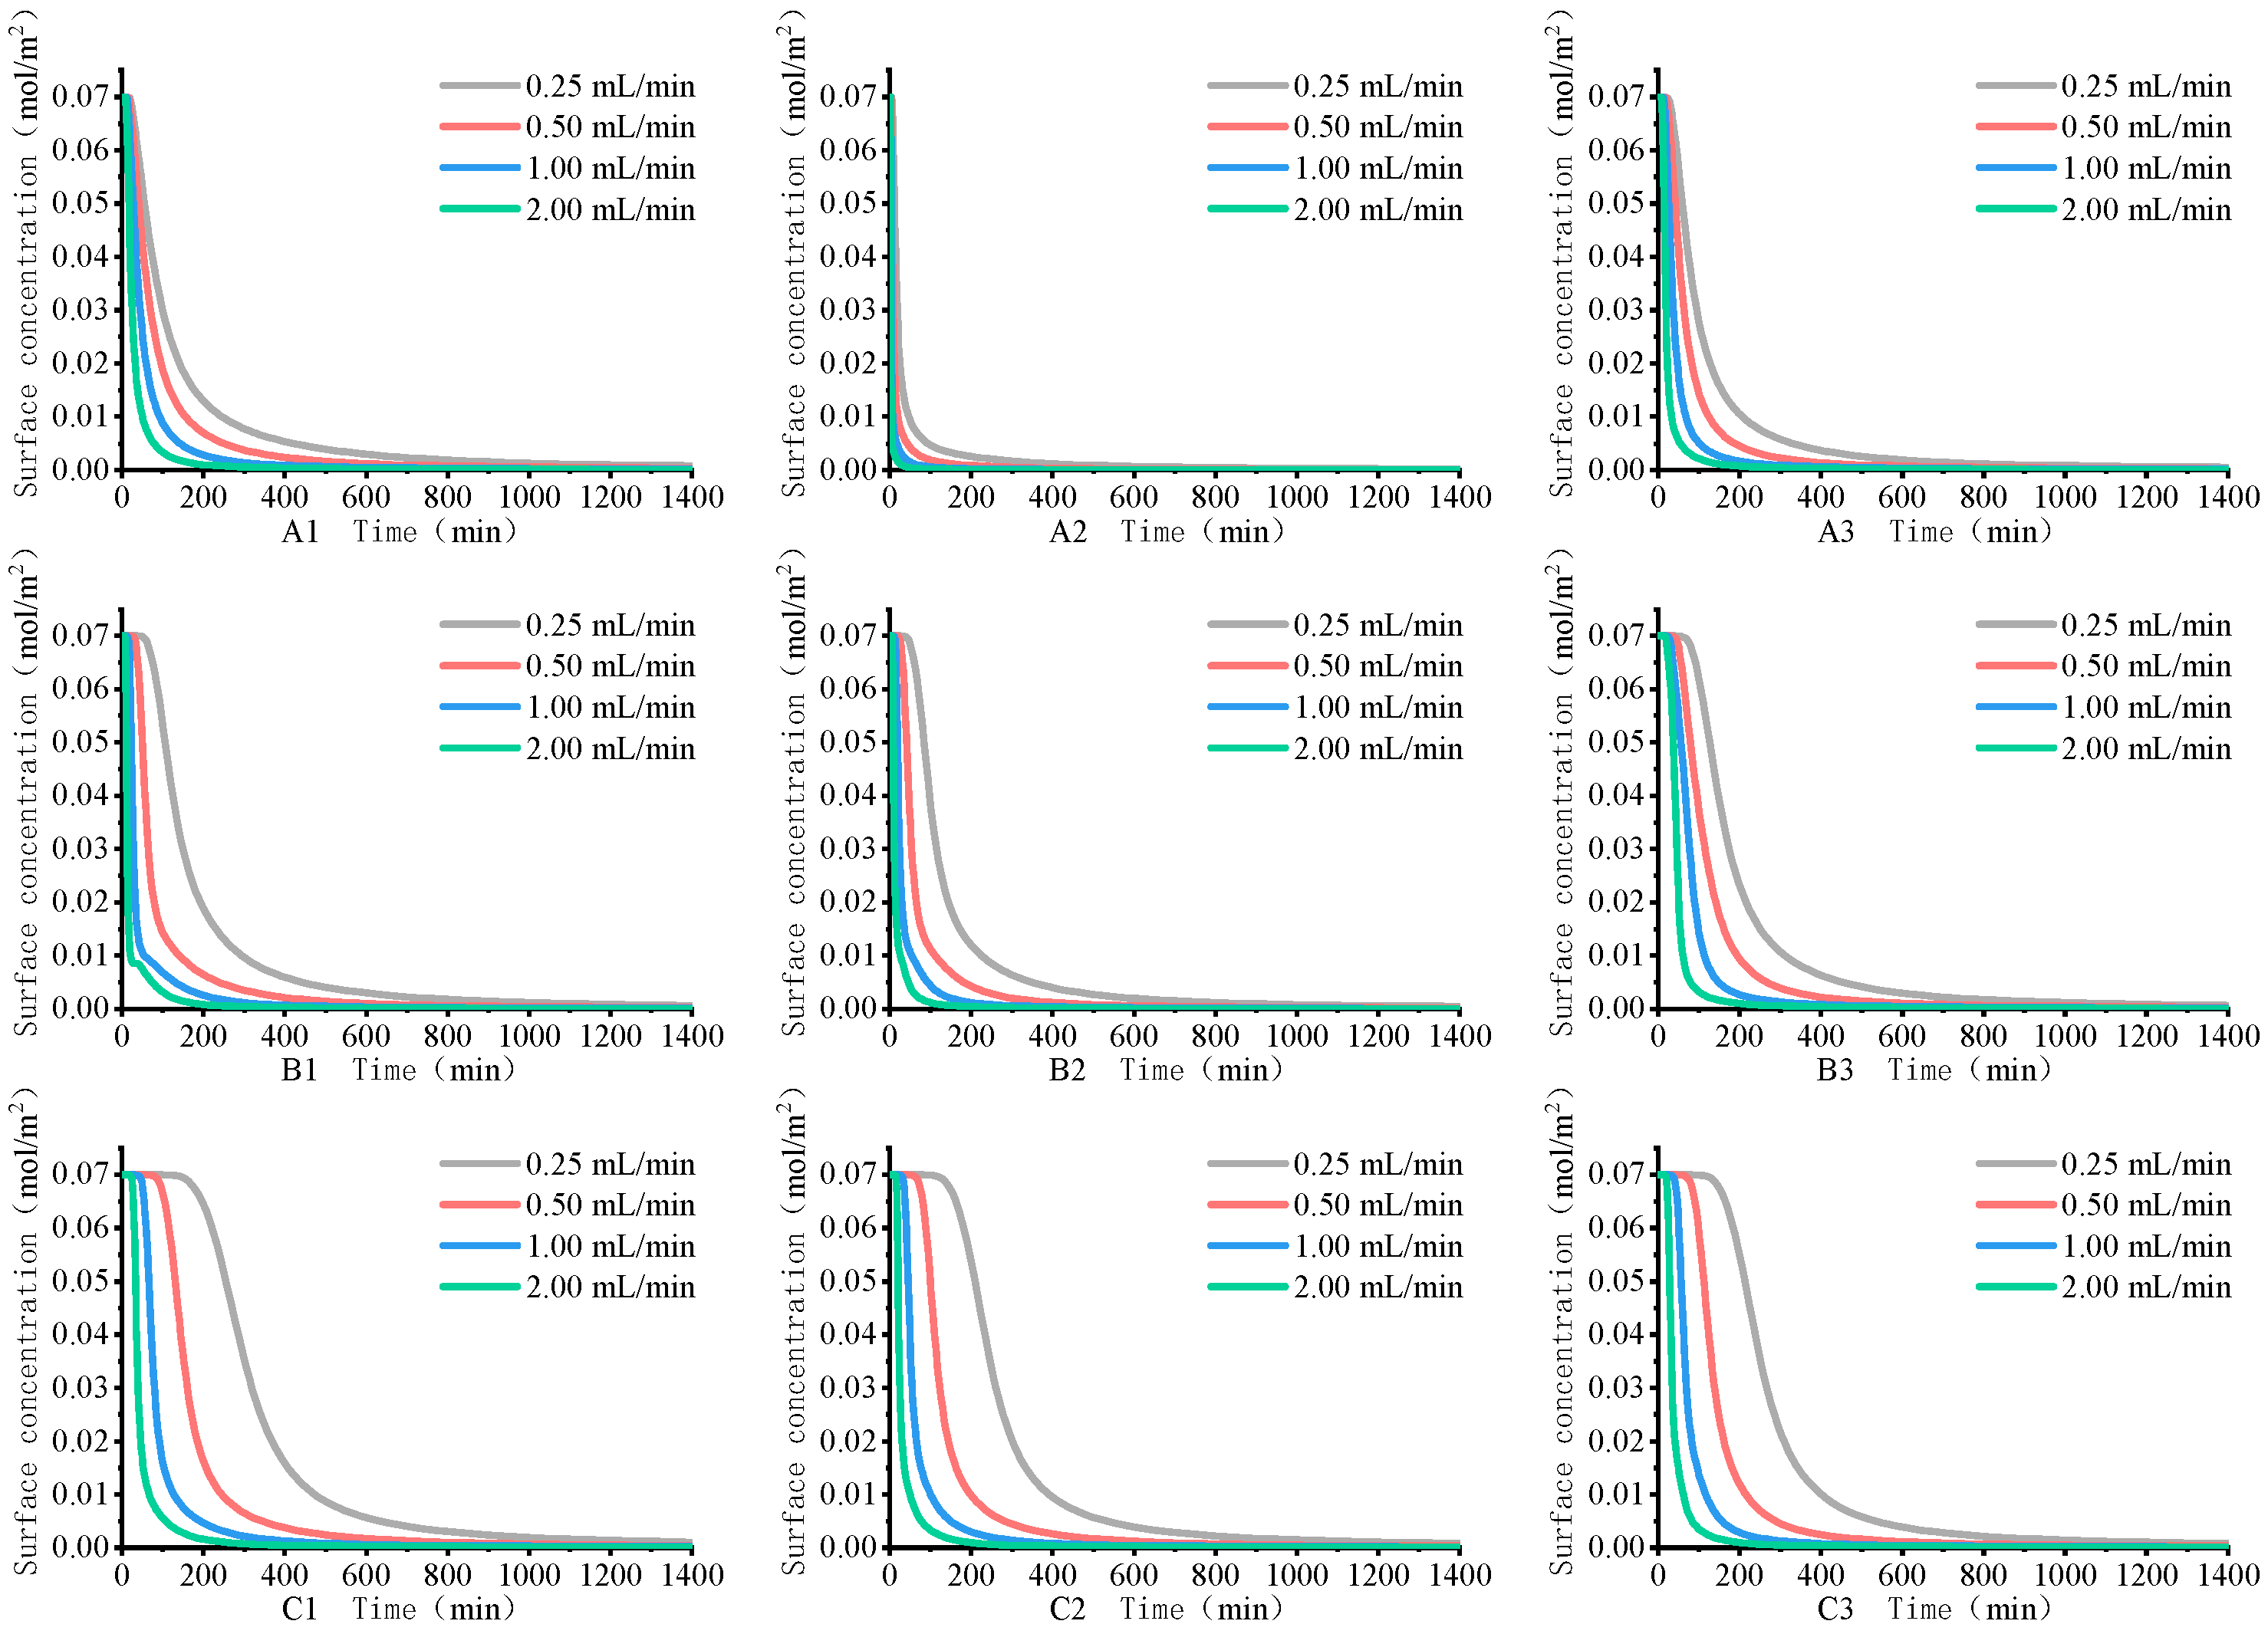
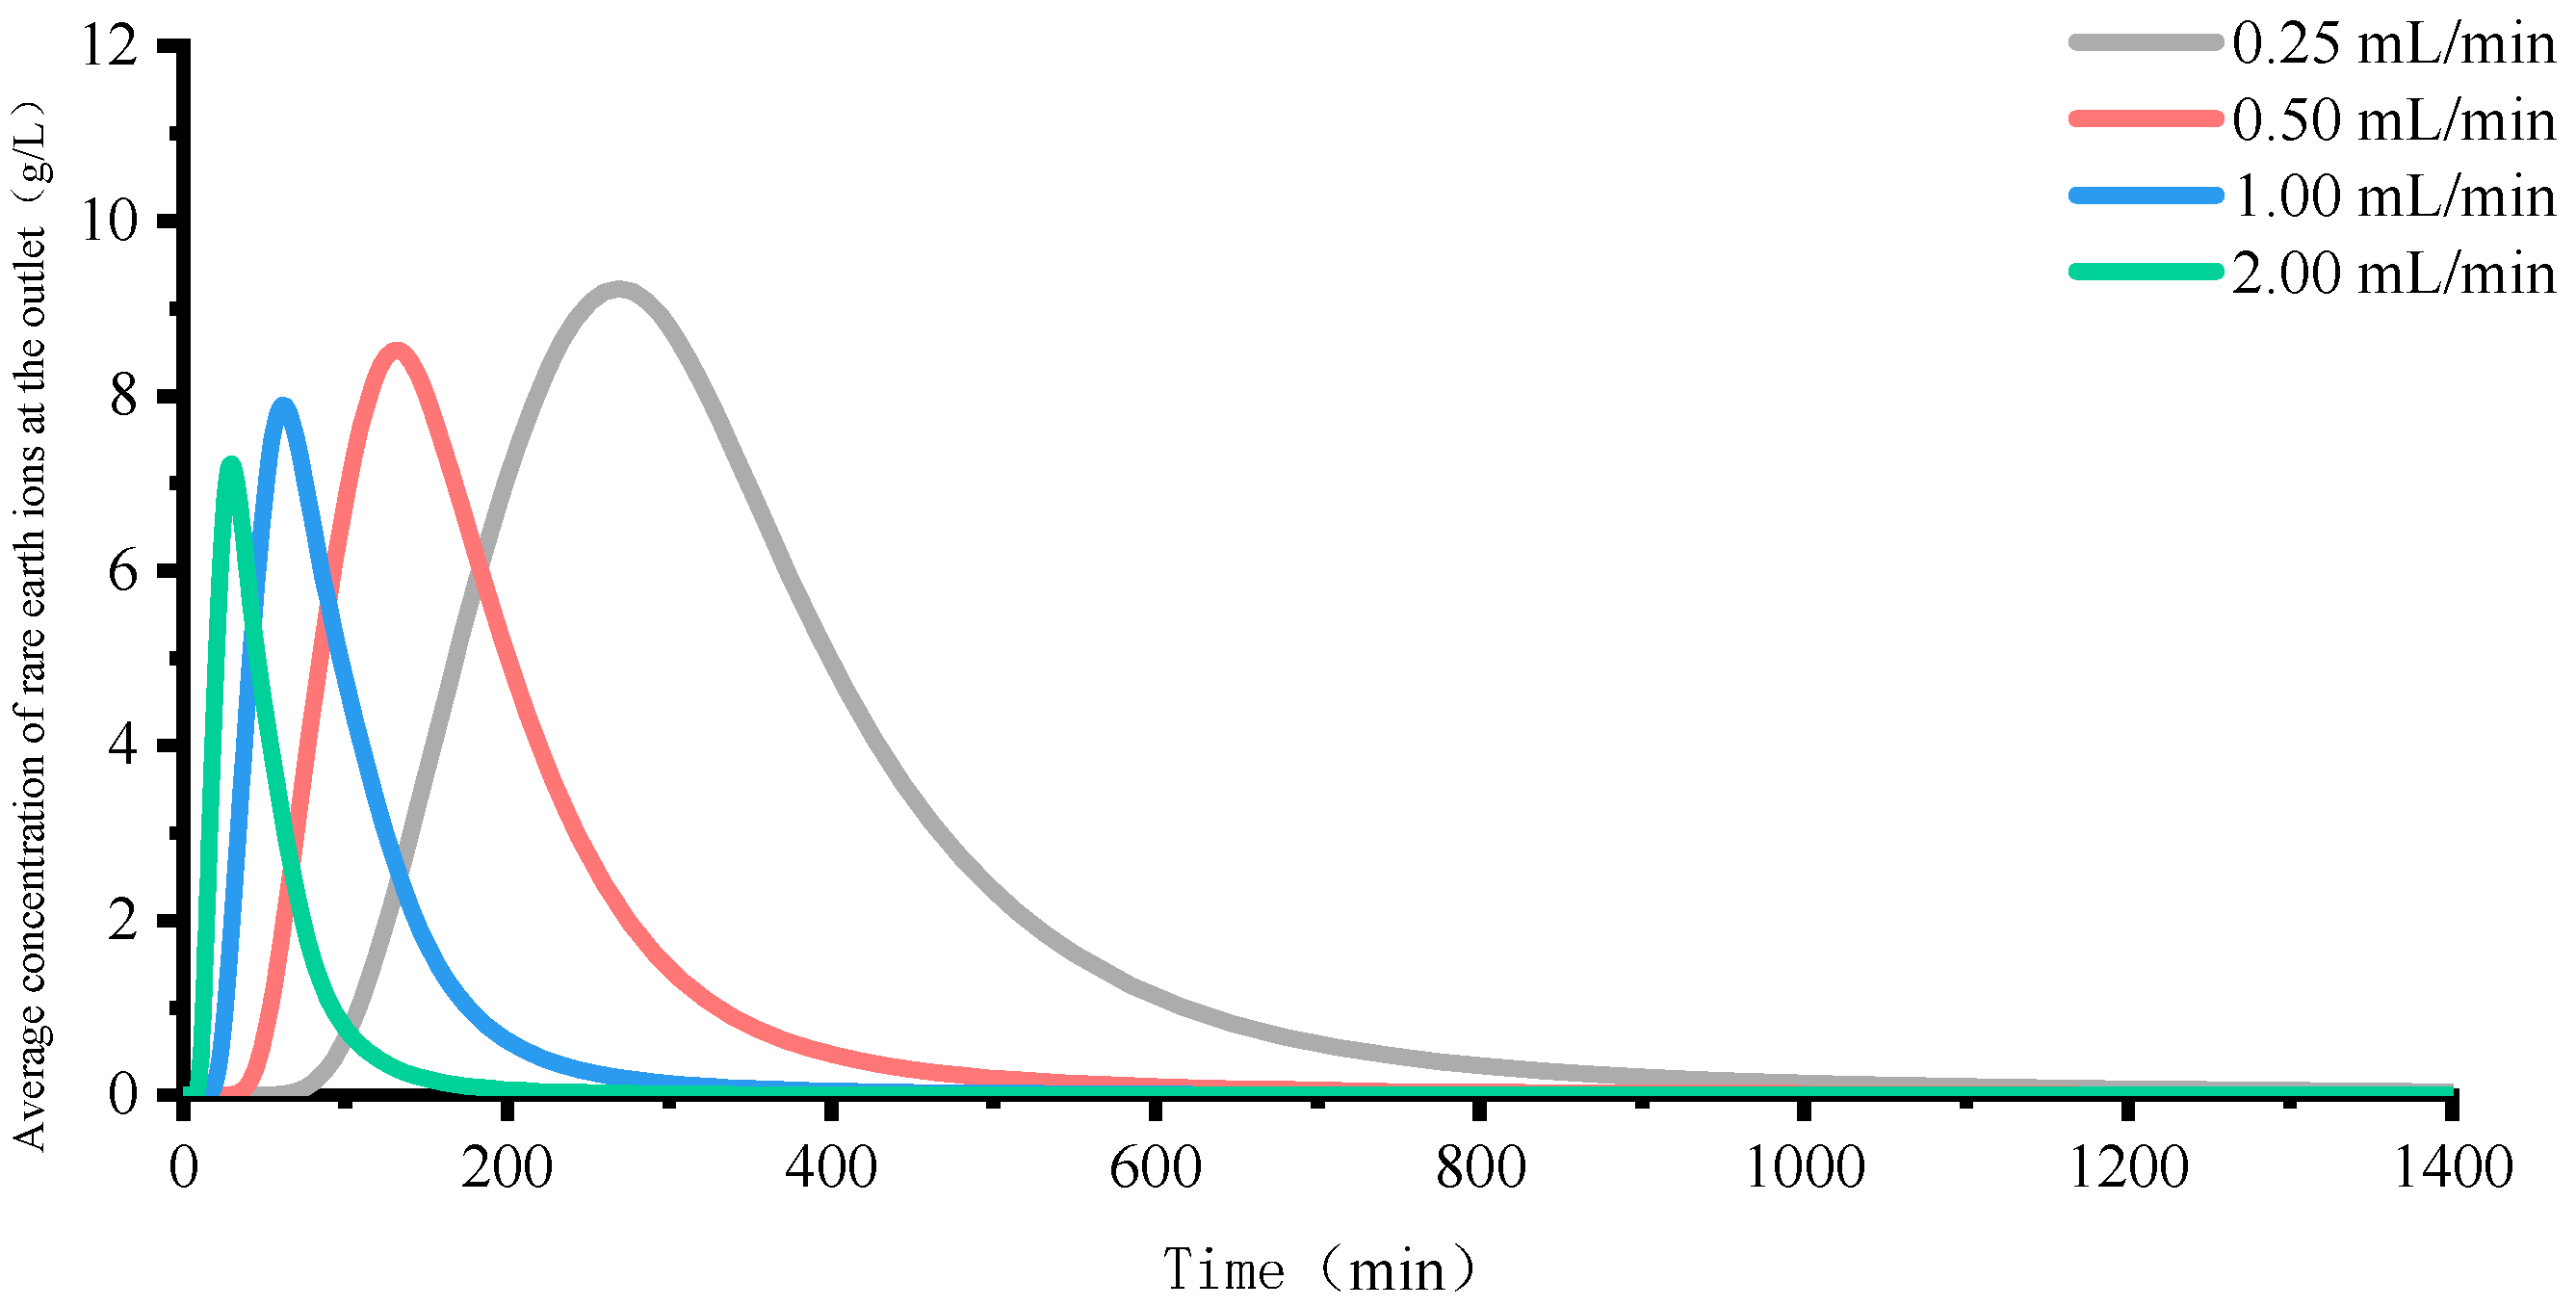
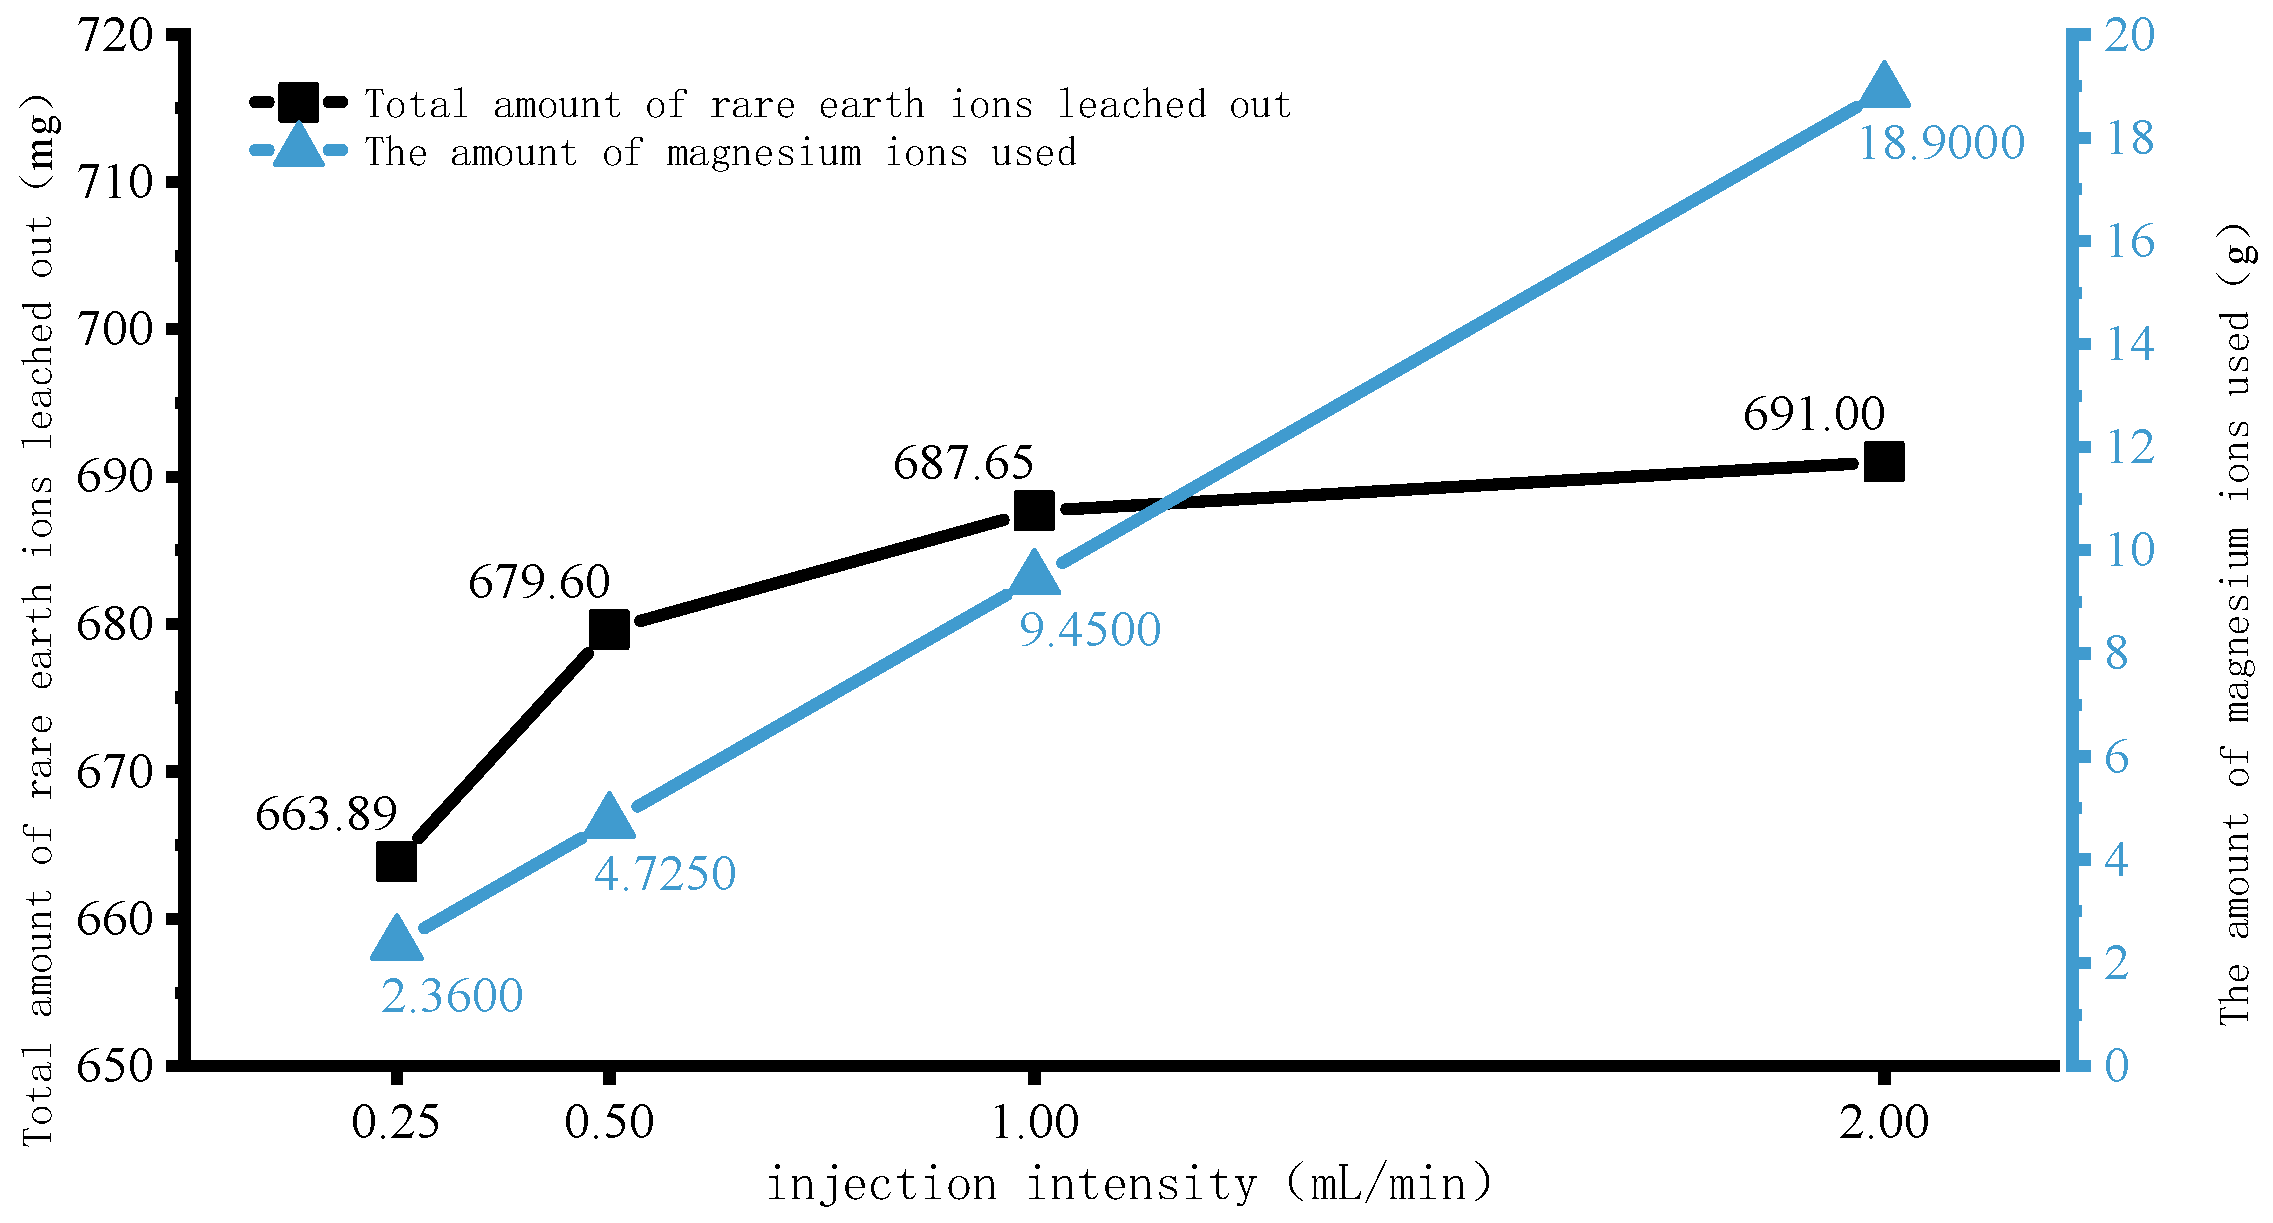
4.1. Rare Earth Ion Exchange and Migration Regular Patterns under Different Injection Intensity

In order to observe various ion exchange conditions on the particle surface of the ore body, 8887 probes were arranged in the model, as shown in Figure 11, to monitor the change of surface concentrations of rare earth ions, and magnesium ions over time on the particle surface of the ore body (i.e., the ion exchange reaction interface) during the leaching process. Nine points, A1, A2 (No. 4586), A3 (No. 7788), B1 (No. 1908), B2 (No. 4469), B3 (No. 7480), C1 (No. 1828), C2 (No. 5238), and C3 (No. 7880), were selected as representatives to explore the differences in ion exchange between dominant channels and non-dominant channels. In the vertical direction, the model was divided into three parts: upper, middle, and lower parts. In the horizontal direction, it was divided into left, middle, and right, and the nine monitoring points were selected from the dominant channel or non-dominant channel wall positions in these nine areas. Point A1 was taken from the non-dominant channel area on the left side of the upper part of the model, Point A2 from the middle dominant channel area in the upper part of the model, point A3 from the non-dominant channel area on the right side of the upper part of the model, point B1 from the non-dominant channel area on the left side of the upper part of the model, point B2 from the middle dominant channel area in the upper part of the model, point B3 from the non-dominant channel area on the right side of the upper part of the model, point C1 from the non-dominant channel area on the left side of the upper part of the model, point C2 from the middle dominant channel area in the upper part of the model, and point C3 was taken from the non-dominant channel area on the right side of the upper part of the model.
The variation curve of the surface rare earth ions concentration (hereinafter referred to as leached rare earth concentration) at point A1–C3 under the injection intensity of 0.25 mL/min, 0.50 mL/min, 1.00 mL/min, and 2.00 mL/min with time is shown in Figure 12. The initial surface rare earth ions concentration is 0.070 mol/m2, and the same regular pattern can be obtained from the variation curve of point A1–C3 at each injection intensity. Due to limited space, the following only takes the injection intensity of 0.25 mL/min as an example for specific analysis.
From the variation curves in Figure 12, it can be seen that the surface concentrations of rare earth ions at point A1, A2, and A3 on the model begin to decrease at 10.7 min, 3.2 min, and 14.9 min, respectively. At this time, ion exchange at these three points is progressing forward, the desorption amount of rare earth ions is greater than the adsorption amount, and rare earth ions begin to leach out. The decline time of point A2 is much earlier than A1 and A3, indicating that rare earth ions are leached first in the upper middle dominant channel area where A2 is located. The final surface concentrations of rare earth ions at each monitoring point are not 0, indicating that there are still rare earth ions that cannot been exchanged. At the time of 1400 min, the surface concentrations of residual rare earth ions (hereinafter referred to as residual rare earth ion concentration) in point A1, A2, and A3 is 6.61 × 10⁻⁴ mol/m2, 1.82 × 10⁻⁴ mol/m2, and 4.83 × 10⁻⁴ mol/m2, respectively, indicating that the leaching of rare earth ions in A2 region is more complete. The variation curves of B1, B2, and B3 in the middle point of the model began to decline at 33.6 min, 24.8 min, and 38.0 min respectively, and rare earth ions in the B2 region in the middle of the model are leached first. At the time of 1400 min, the residual rare earth ion concentrations of B1, B2, and B3 are 7.37 × 10⁻⁴ mol/m2, 4.76 × 10⁻⁴ mol/m2, and 6.79 × 10⁻⁴ mol/m2, respectively, indicating that the leaching of rare earth ions in the dominant channel area is more complete. The curves of C1, C2, and C3 at the middle points of the model begin to decline at 92.9 min, 62.2 min, and 75.4 min, respectively, and rare earth ions in the C2 region in the middle of the model are leached first. At the time of 1400 min, the concentrations of residual rare earth ions in C1, C2, and C3 are 1.03 × 10⁻³ mol/m2, 8.01 × 10⁻⁴ mol/m2, and 8.22 × 10⁻⁴ mol/m2, respectively; obviously, the leaching of rare earth ions in the dominant channel area is more complete. The flow rate of the fluid in the main flow channel is higher than that in other zones (hence its designation as the main flow channel). This increased flow rate allows more cations to pass through the zone, enabling a more thorough exchange between rare earth ions and cations. Additionally, the liquid entering the solution exits at a faster flow rate, thereby facilitating a more complete ion exchange. Comparing the curve decline time and residual rare earth ion concentration of the three groups of monitoring points (A1, B1, C1), (A2, B2, C2), and (A3, B3, C3), the flow velocity in the dominant channel is greater than that in the non-dominant channel, and more leaching solution passes through it per unit time. More active cations contact with rare earth ions, and the rare earth ions in the dominant channel always exchange preferentially. At the same time, the concentration of residual rare earth ions in the dominant channel is lower than that in the non-dominant channel at the same level and height. After the leaching is completed, the concentration of residual rare earth ions in the pores gradually increased from top to bottom, and the leaching of rare earth ions closer to the entrance end is more complete.
From the Figure 12, it can be seen that the point A1 curve at the injection intensities of 0.25 mL/min, 0.50 mL/min, 1.00 mL/min, and 2.00 mL/min start to decline at the time of 27.1 min, 6.5 min, 5.2 min, and 3.7 min, respectively, and the residual rare earth concentrations are 6.61 × 10⁻⁴ mol/m2, 3.33 × 10⁻⁴ mol/m2, 1.64 × 10⁻⁴ mol/m2, and 8.10 × 10⁻⁵ mol/m2, respectively. With the increase in liquid injection intensity, the point A1 curve decline time gradually advances, and the residual rare earth ion concentration decreases accordingly. This indicates that with the injection strength increases, the overall flow rate in the pores increases, and more active cations can exchange with rare earth ions per unit time, which can accelerate the desorption of rare earth ions, and is conducive to the complete leaching of rare earth ions, especially in non-dominant channels.
The variation curves of the leached rare earth concentration over time at 8887 monitoring points at injection intensities of 0.25 mL/min, 0.50 mL/min, 1.00 mL/min, and 2.00 mL/min are shown in Figure 13a–d. The surface concentrations curve at the initial moment of the four injection intensities begin to change, and the slope of curve decline is almost vertical. At the injection intensity of 0.25 mL/min, the descending time of the change curve at the latest is 197.0 min, and at 0.50 mL/min, 1.00mL/min, and 2.00 mL/min, the descending time is 154.0 min, 54.0 min, and 27.0 min, respectively. This shows that the increase of injection intensity can make ion exchange start earlier. The change rate of the curve reflects the rate of rare earth ion exchange. With the increase in liquid injection intensity, the decreasing slope of the 8887 curves becomes more vertical, and the area of the curve enclosed shape also decreases, indicating that the increase of liquid injection intensity is conducive to the rapid leaching of rare earth ions on the whole. At the end of the injection time (t = 1400 min), the lowest surface concentrations of rare earth ions is all 0 mol/m2, and the highest surface concentrations of rare earth ions are 1.26 × 10⁻³ mol/m2, 1.02 × 10⁻³ mol/m2, 0.80 × 10⁻⁴ mol/m2, and 0.67 × 10⁻⁴ mol/m2, respectively; this means that there is still a small portion of rare earth ions in some places in the pores that has not been leached, and increasing the injection intensity helps this portion of rare earth ions to be more completely leached.
The variation curve of the leached rare earth concentration at the outlet under the injection intensities of 0.25 mL/min, 0.50 mL/min, 1.00 mL/min, and 2.00 mL/min changes over time as shown in Figure 14. All four curves are unsymmetrical unimodal curves with a tail, and there is an initial stage of gentle rise for a period of time. As the injection intensity increases, the initial stage gradually shrinks, the rare earth concentration rises sharply, and the tailing time shortens. When the injection strength is 0.25 mL/min, the peak concentration of leach rare earth ions is 9.22 g/L. When the injection strength increases to 0.50 mL/min, 1.00 mL/min, and 2.00 mL/min, the peak leaching concentration is 8.52 g/L, 7.89 g/L, and 7.22 g/L, respectively. At the initial stage of rare earth ion concentration, the exchange mainly occurs in the upper part of the model, and rare earth ions migrate toward the outlet end with the flow of the leaching solution. The rare earth ions are primarily distributed in the upper non-preferential channels and the middle preferential channels. In the non-preferential channels, the flow velocity is lower, and the ions are less affected by convection, leading to slower ion migration compared to the preferential channels, causing an accumulation of rare earth ions in this area. When the injection intensity increases, the distribution of rare earth ions remains relatively unchanged, but their concentration increases. During the rising phase of rare earth ion concentration, the migration speed of rare earth ions in the preferential channels is significantly higher than in the non-preferential channels. As the injection intensity increases, rare earth ions continue to accumulate in the middle non-preferential channels, and their concentration increases accordingly. At the peak concentration stage, rare earth ions are mainly distributed in the lower preferential channels and the middle/lower non-preferential channel regions. When the injection intensity increases, the area where rare earth ions are distributed in the lower part of the model decreases, and the ion concentration decreases. During the declining and tailing stages, ion exchange primarily occurs in the middle/lower non-preferential channels. The tailing phenomenon in the time-varying curve of the average rare earth ion concentration is caused by the late occurrence of ion exchange in the middle/lower non-preferential channels and the slower migration speed in this region. The increase of flow rate per unit time dilutes the rare earth ions, resulting in a decrease in rare earth concentration. With the increase of injection intensity, the corresponding peak concentration of rare earth leaching time is 268.6 min, 133.3 min, 61.2 min, and 29.7 min, respectively, indicating that by increasing the injection intensity can accelerate the whole leaching process to some extent.
The comparison between the amount of magnesium ion and the total amount of rare earth ion leached under different injection intensity is shown in Figure 15. When the injection intensity increases from 0.25 mL/min to 0.50 mL/min, the amount of magnesium ion is doubled, and the total amount of rare earth ion leached is increased by 2.36%. When the injection intensity increases from 0.50 mL/min to 1.00 mL/min, the amount of magnesium ion is doubled, and the total amount of rare earth ion leached is increased by 1.18%. When the injection intensity increases from 1.00 mL/min to 2.00 mL/min, the amount of magnesium ion is doubled, and the total amount of rare earth ion leached is increased by 0.48%.
The analysis results indicate that as the injection intensity increases, the amount of magnesium ions also increases. However, the doubling of the amount of magnesium ions does not exchange the doubling of rare earth ions, which undoubtedly increases production costs. Although the injection intensity can shorten the leaching cycle and improve production efficiency, the risk of a landslide is also increased, and the reduction of leached concentration makes the purification of rare earth elements difficult. Therefore, in practical production, considering the production cost on the premise of ensuring engineering safety and production efficiency, it is recommended to control the injection strength between 0.50 mL/min and 1.00 mL/min for this mining area.

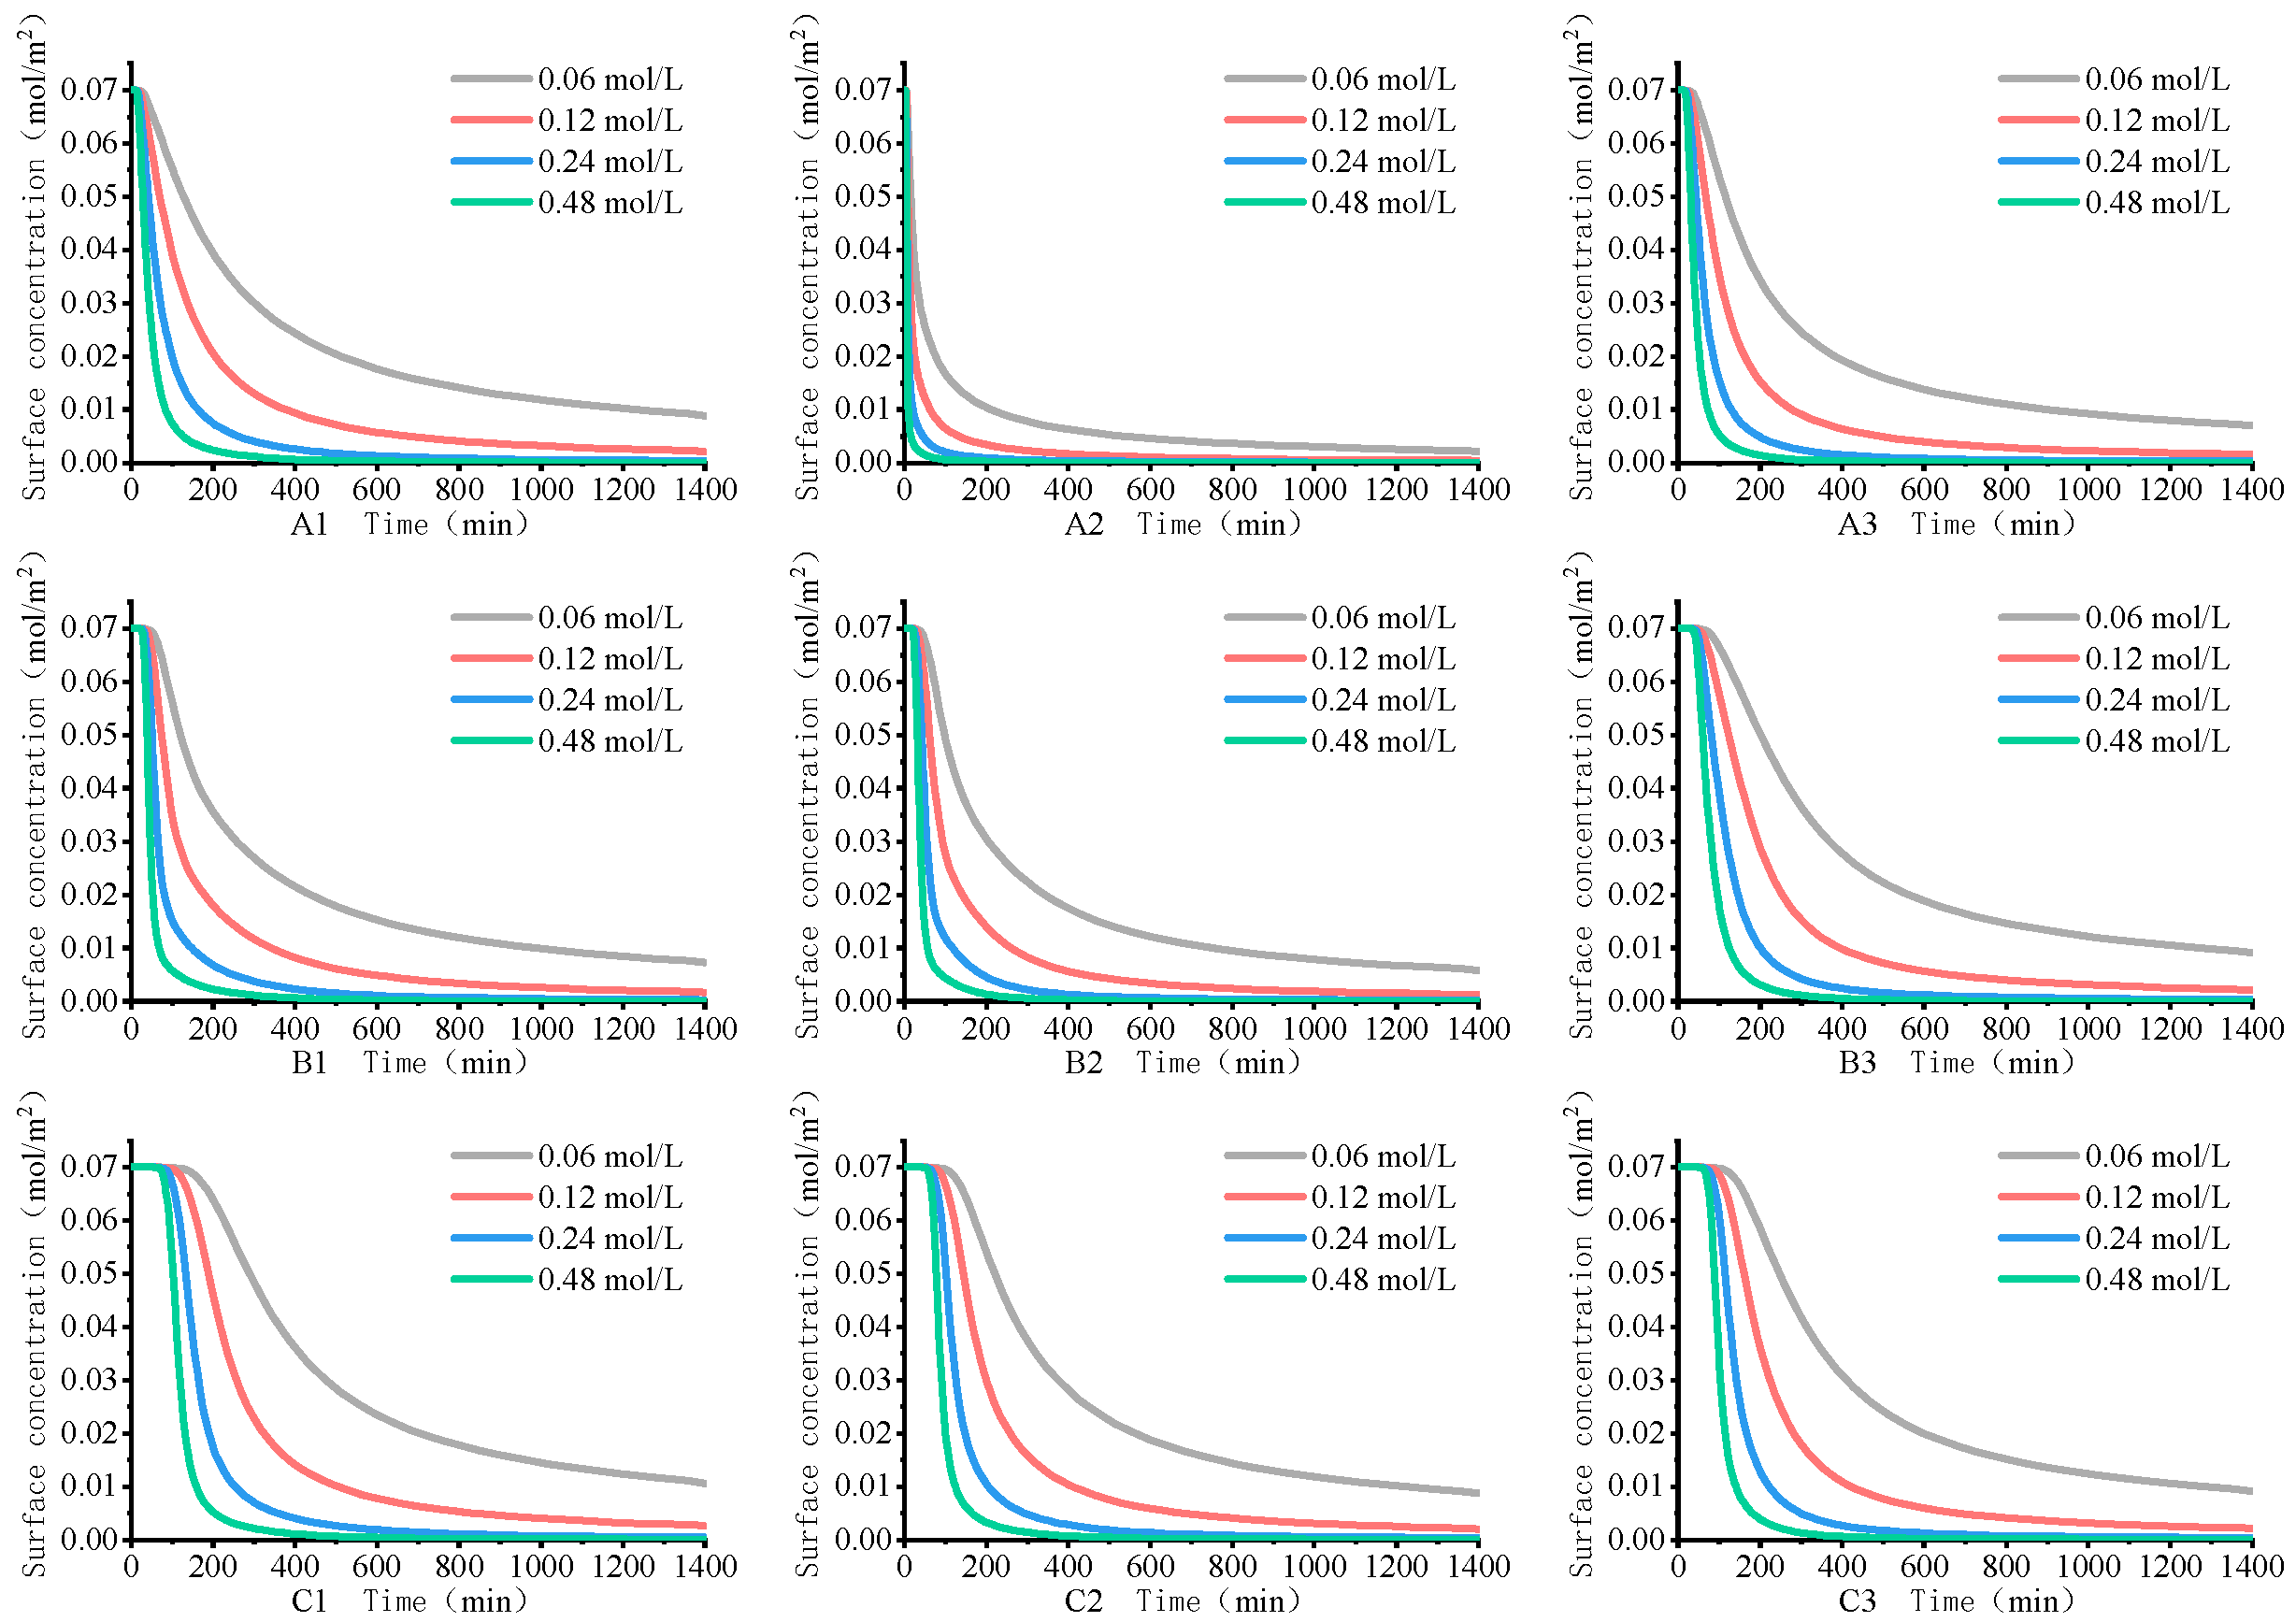
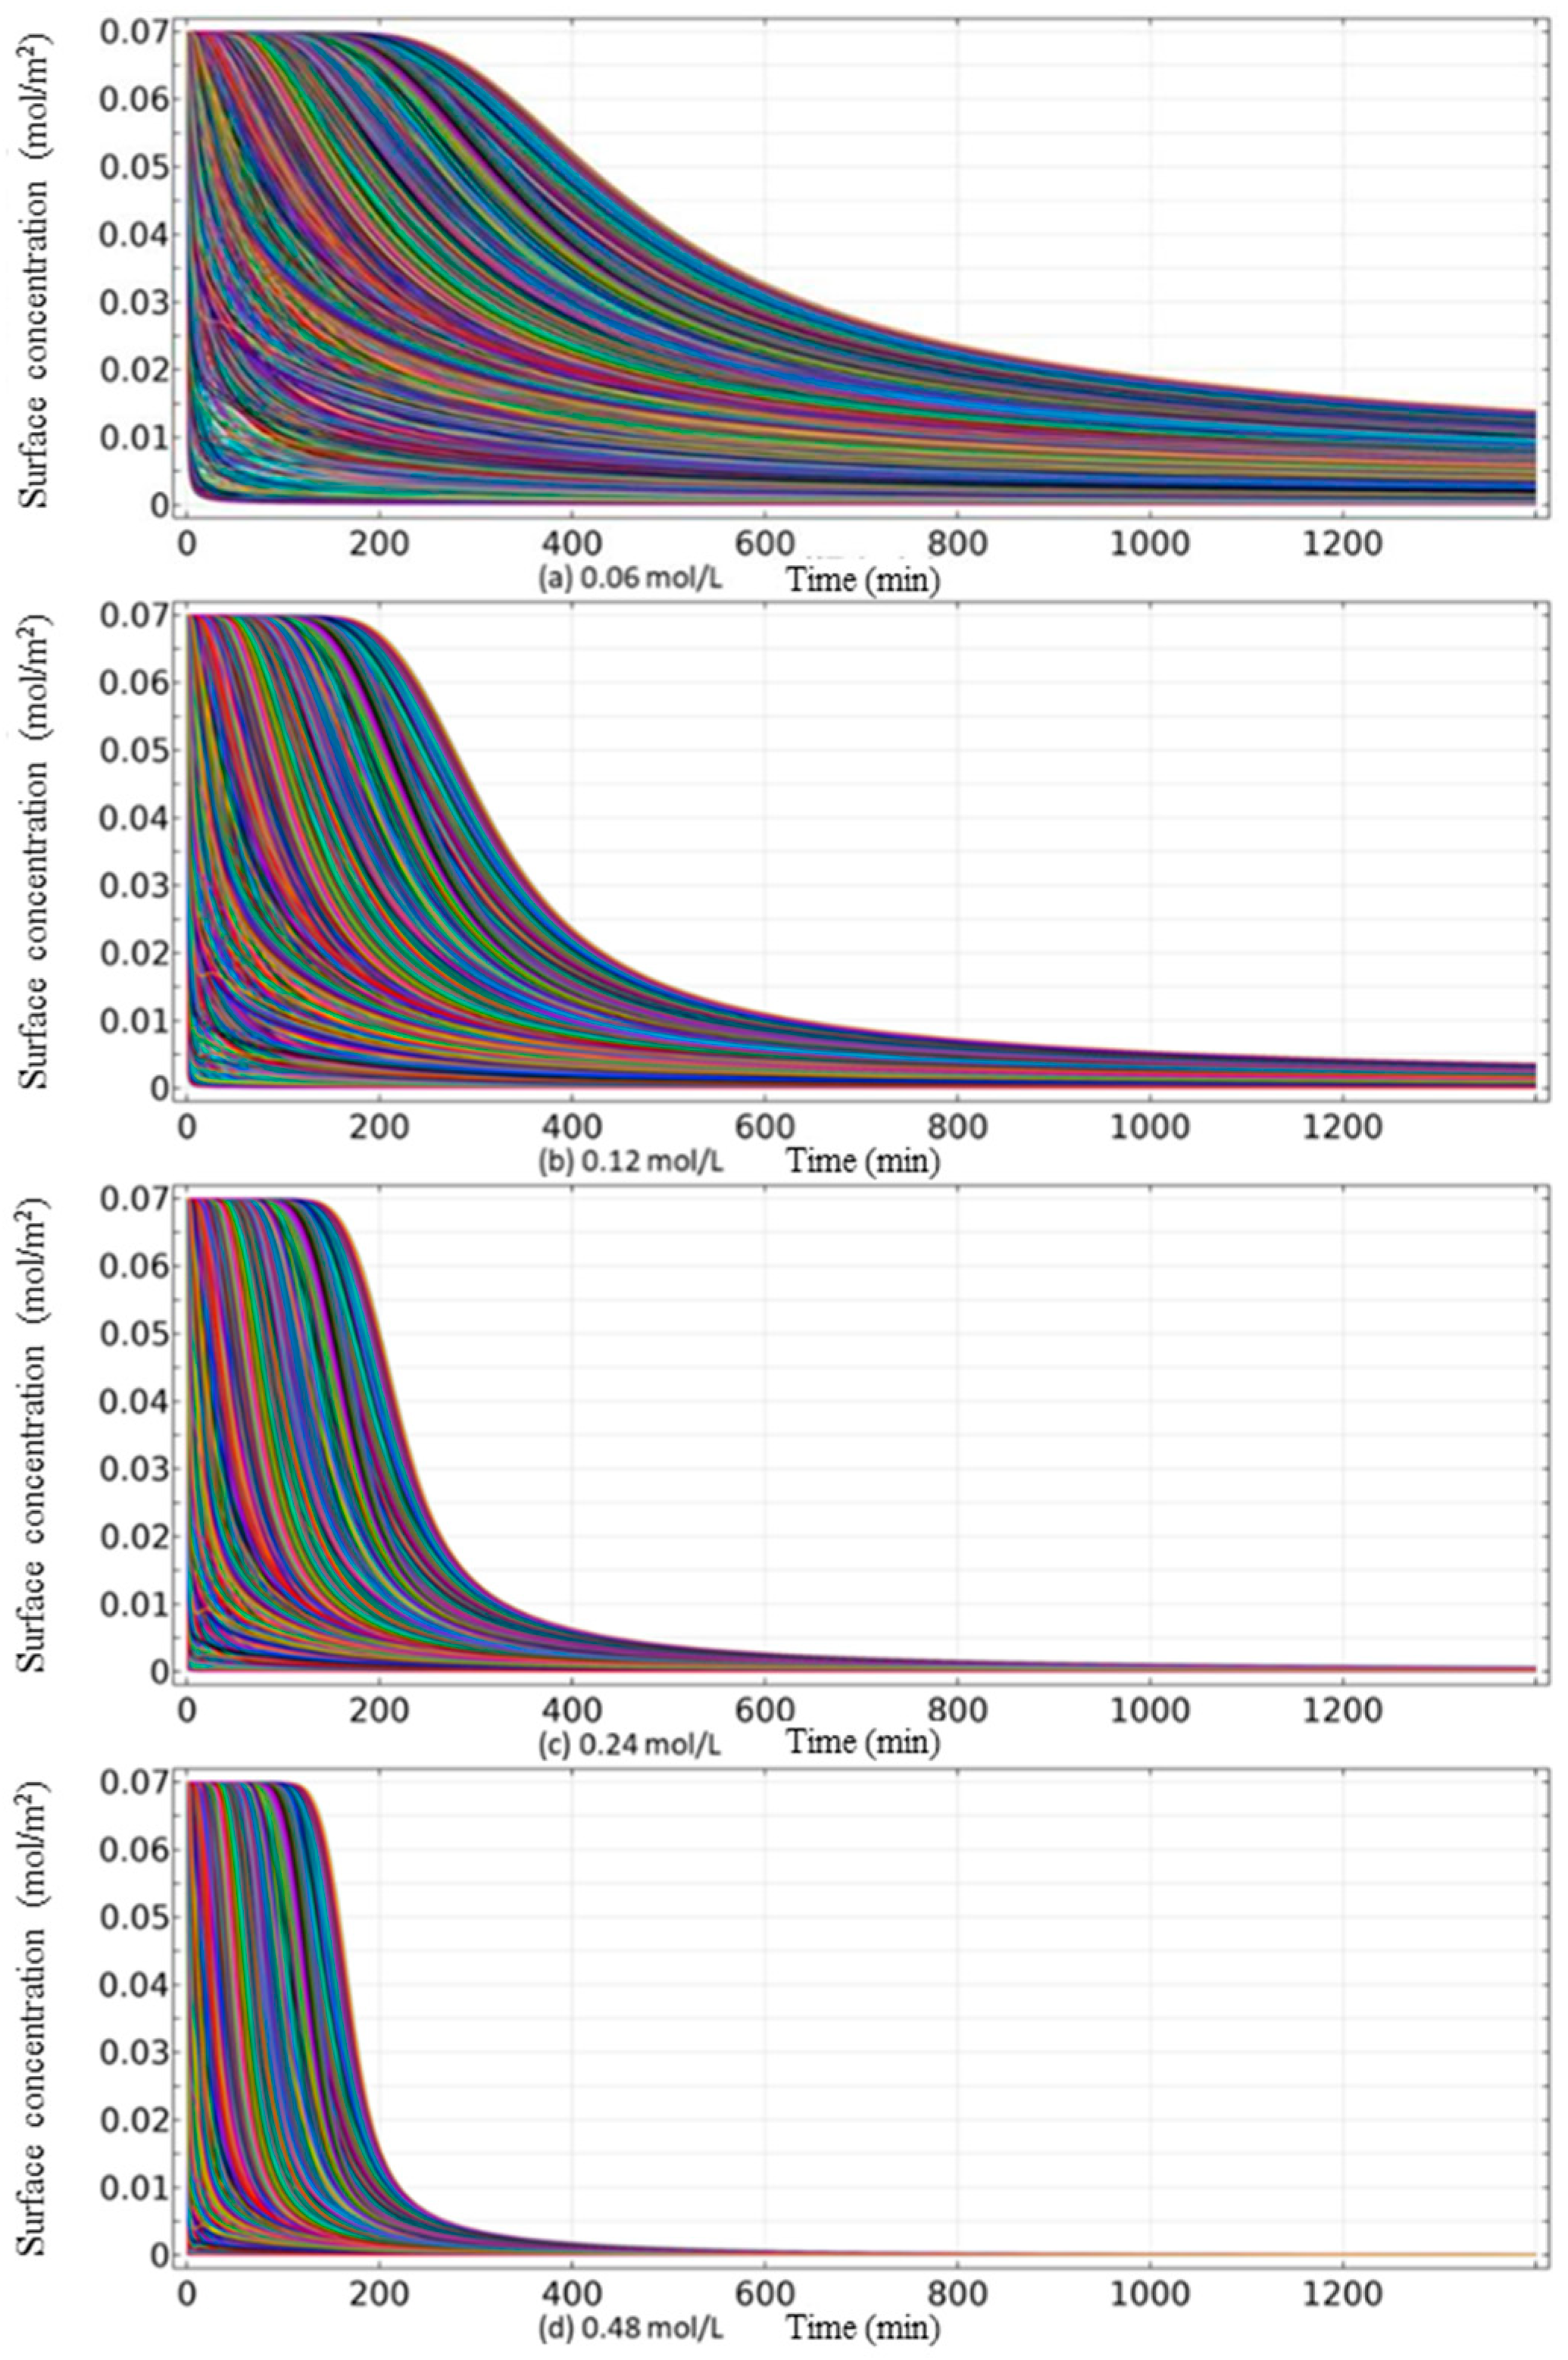
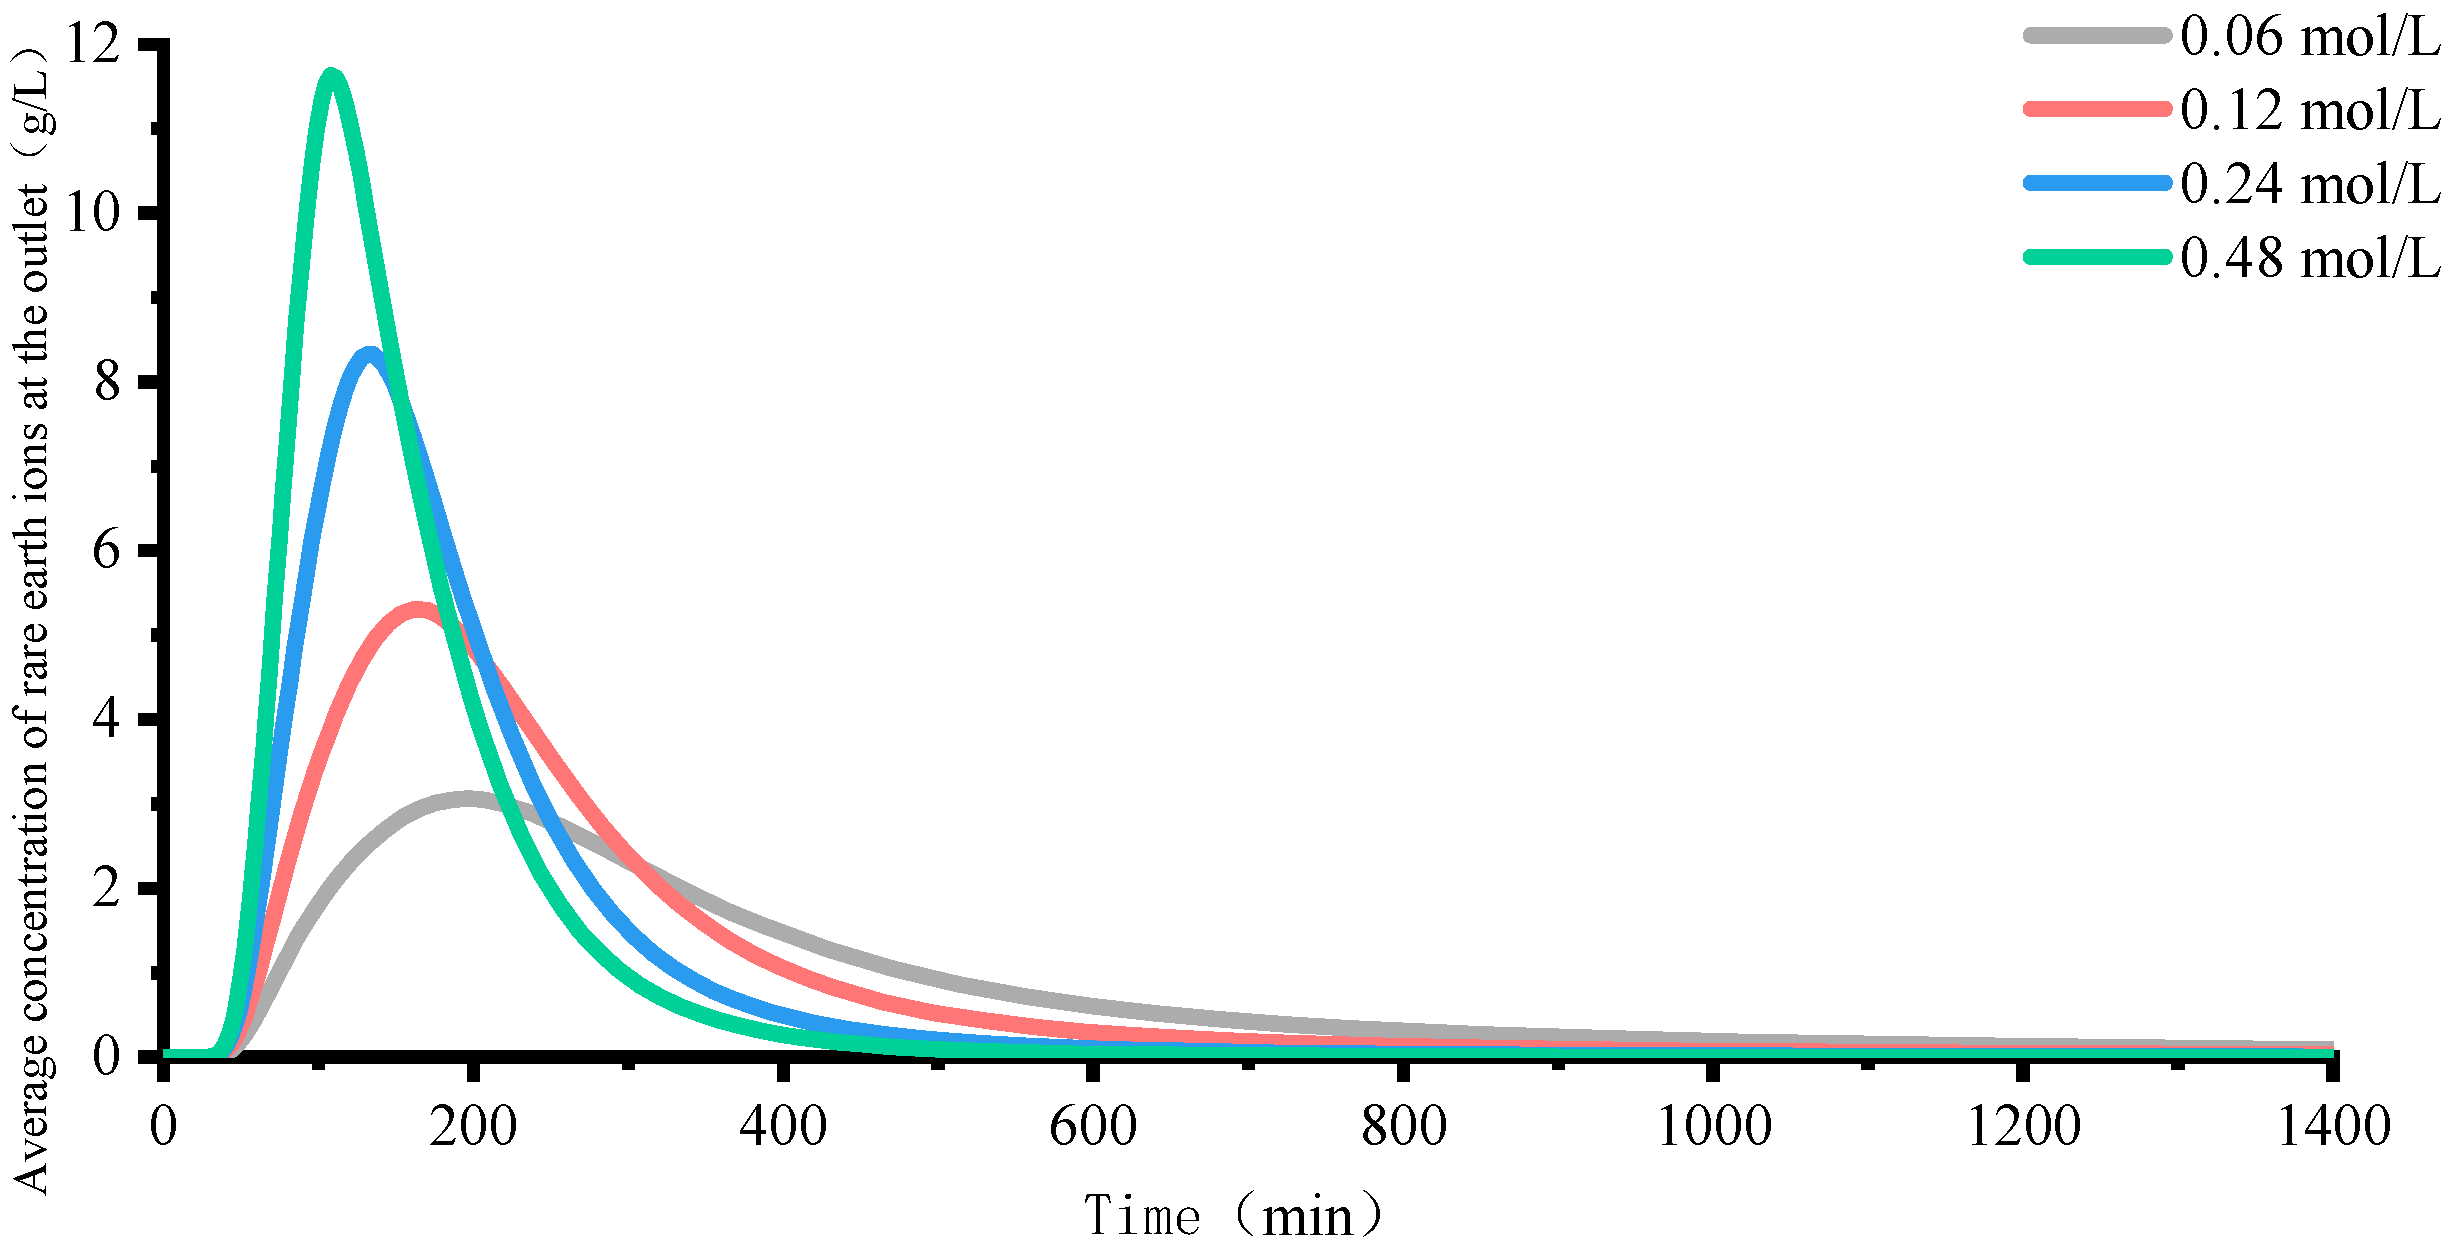
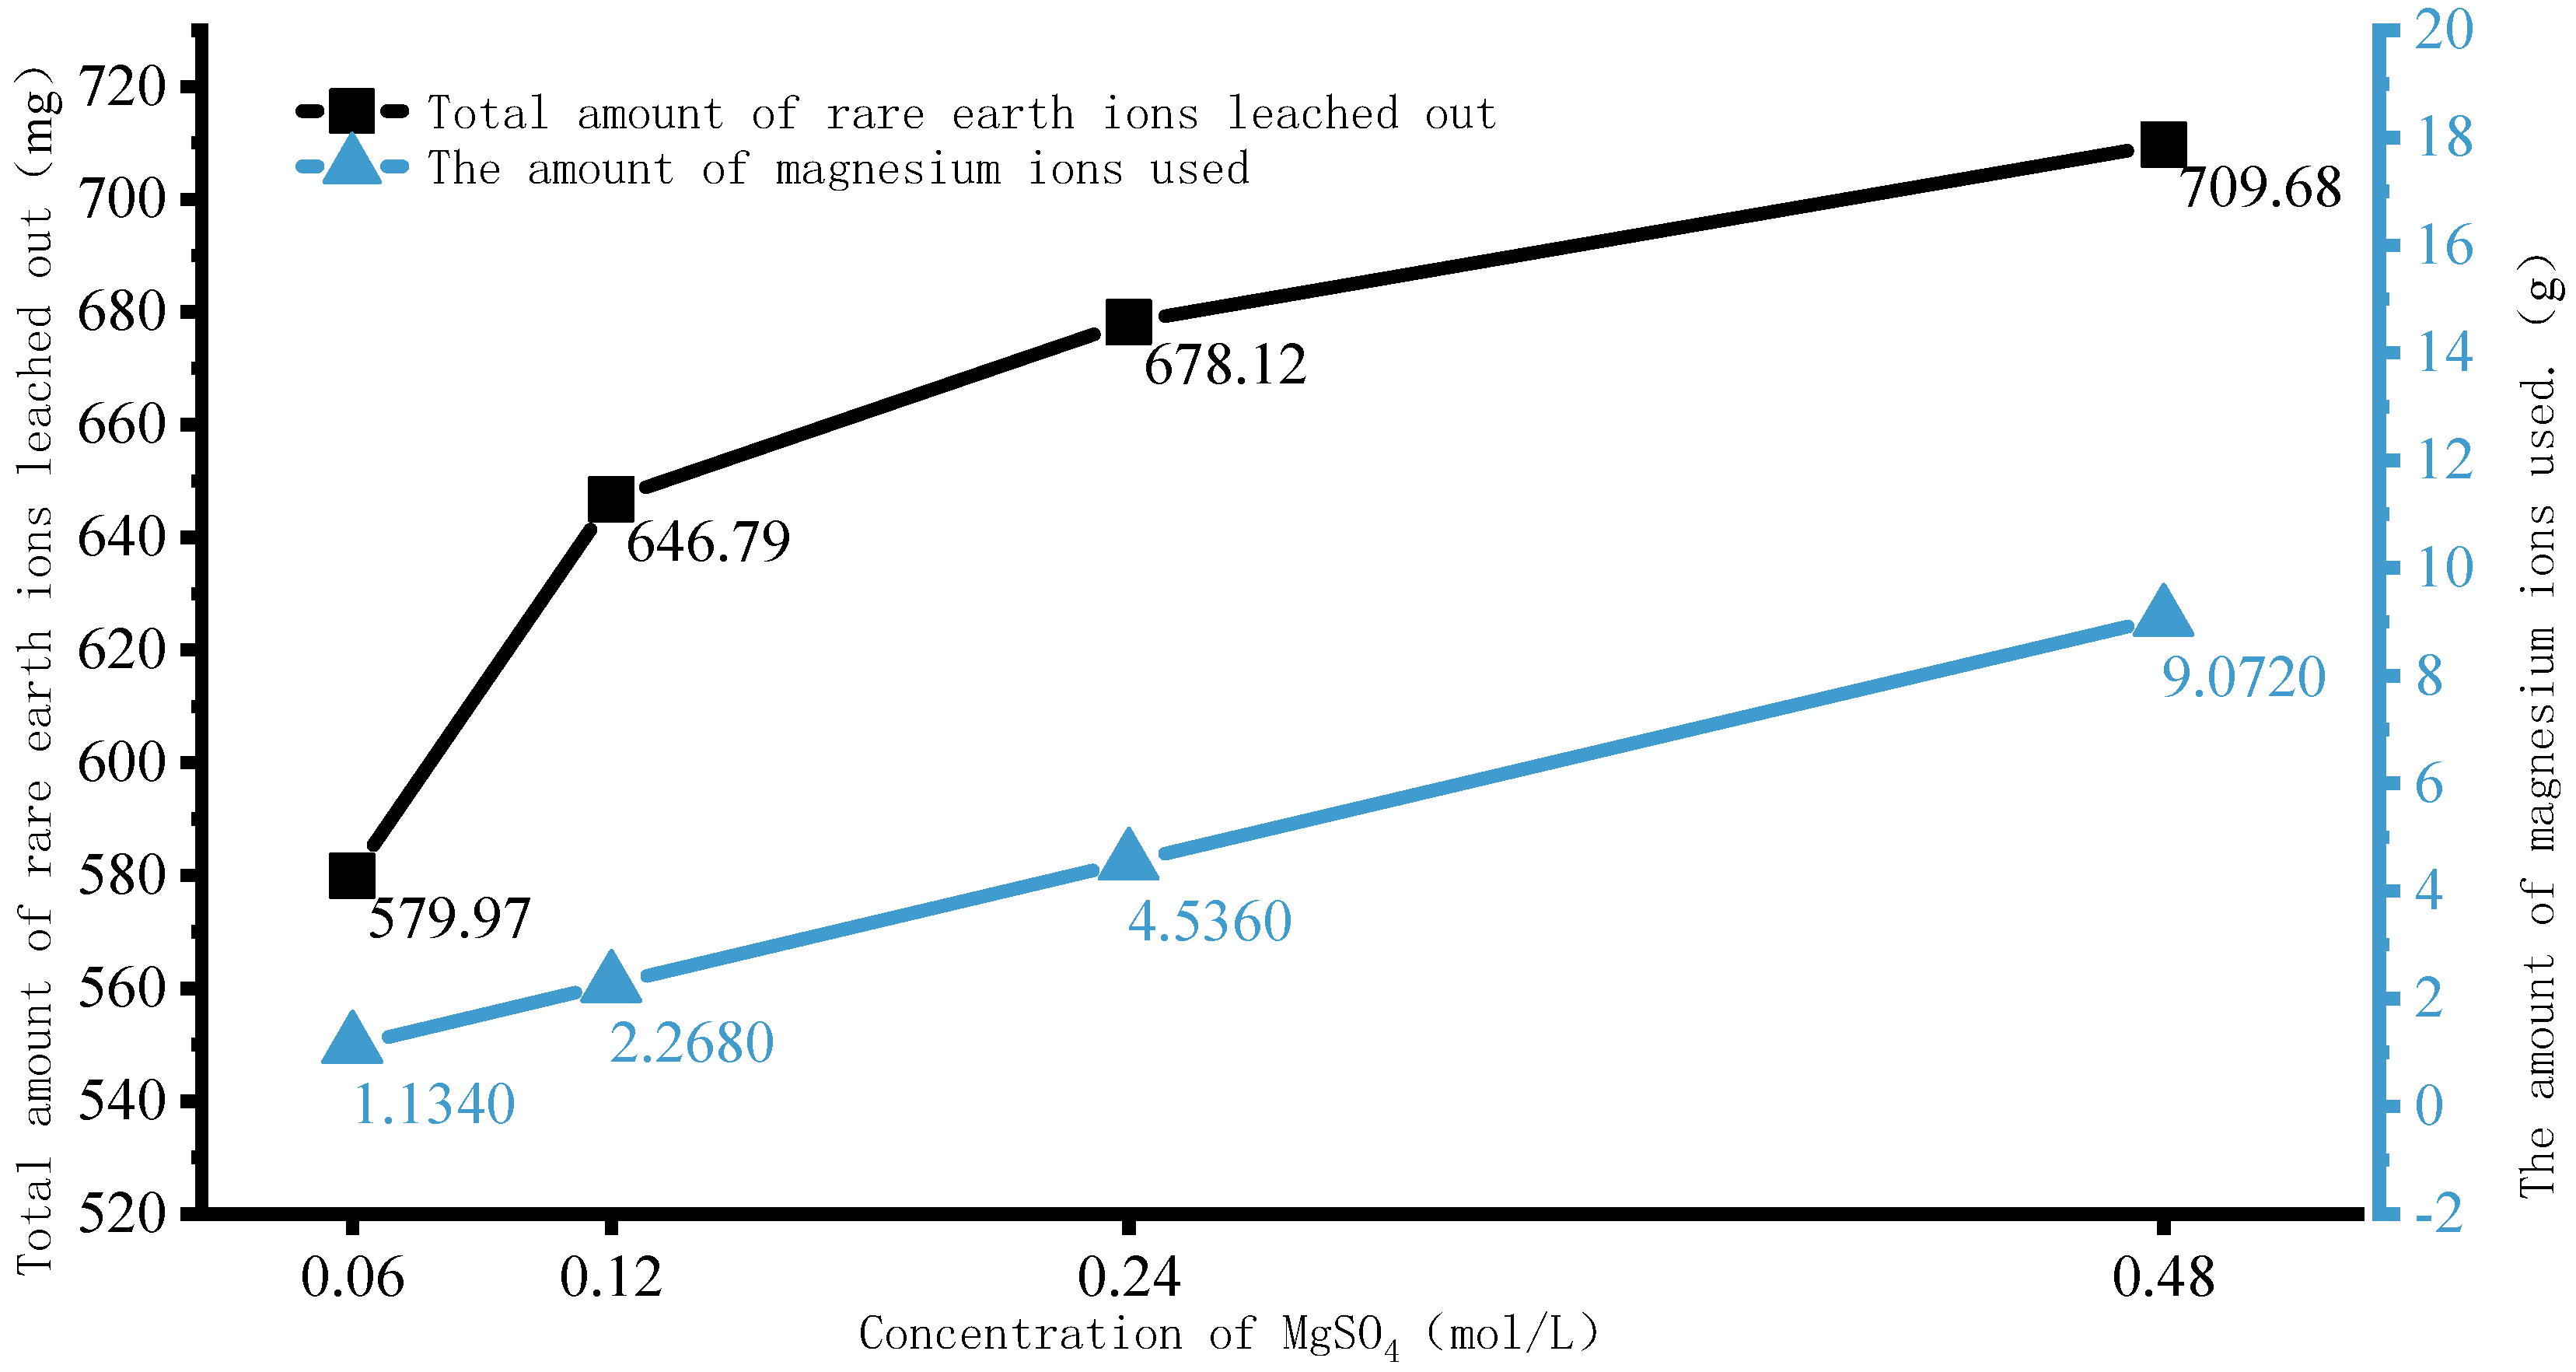
4.2. Rare Earth Ion Exchange and Migration Regular Patterns under Different Injection Concentrations

The variation curves of surface concentration of rare earth ions of points A1–C3 over time when the concentrations of magnesium sulfate solution are 0.06 mol/L, 0.12 mol/L, 0.24 mol/L, and 0.48 mol/L are shown in Figure 16. From those curves, it can be seen that when the curve of points A1–C3 begins to decline, the concentration of the leaching solution does not change significantly. Moreover, the curves at the same point have significant differences in the solubility of the four leaching solutions, which are manifested in the curve decline rate and the surface concentrations of residual rare earth ions. Taking the four curves of point A1 as an example, with the increase of leaching solution concentration, the curve decline rate increases, and the surface concentrations of residual rare earth ions is 8.84 × 10⁻³ mol/m2, 2.13 × 10⁻³ mol/m2, 3.76 × 10⁻⁴ mol/m2, and 6.08 × 10⁻⁵ mol/m2, respectively. This indicates that the concentration of the leaching solution mainly affects the forward exchange rate of rare earth ions, and significantly promotes the more complete leaching of rare earth ions. The same regular pattern can be obtained by analyzing the changes in point A2–C3 curves at the MgSO4 concentrations of 0.06 mol/L, 0.12 mol/L, 0.24 mol/L, and 0.48 mol/L. Therefore, the promotion effect of leaching solution on rare earth ion leaching is due to the increase in concentration, which increases the exchange rate of rare earth ions in all regions and leads to an increase in leaching efficiency accordingly.
The variation curves of surface concentrations of rare earth ions at those 8887 monitoring points when the concentrations of magnesium sulfate solution are 0.06 mol/L, 0.12 mol/L, 0.24 mol/L, and 0.48 mol/L over time are shown in Figure 17a–d. It is not difficult to see from the graph that as the concentration of the solution increases, the decline rate of those 8889 curves increases. In the 0.06 mol/L concentration curve, the latest descent time is 201.0 min; the descending time of the curve at 0.12 mol/L, 0.24 mol/L, and 0.48 mol/L is 179.0 min, 171.0 min, and 164.0 min, respectively. This indicates that the increase of the concentration of the leaching solution is beneficial for the ion exchange to start earlier, but the effect is weaker than that of the injection intensity. Moreover, as the concentration of leaching solution increases, the overall slope of those 8887 curves decreases more vertically, indicating that the concentration change has an effect on rare earth ion leaching mainly because the concentration increase has an effect on the rate of rare earth ion exchange. In addition, the minimum surface concentrations of rare earth ions at the end time (t = 1400 min) of those four leaching solution concentrations is 0 mol/m2, and the highest surface concentrations of rare earth ions are 1.41 × 10⁻² mol/m2, 3.78 × 10⁻³ mol/m2, 7.86 × 10⁻⁴ mol/m2, and 1.62 × 10⁻⁵ mol/m2, respectively; this indicates that increasing the concentration of leaching solution can promote more complete leaching of rare earth ions, and its promoting effect is more significant than that of injection intensity.
The variation curves of the average concentration of rare earth ions at the outlet when the concentrations of magnesium sulfate solution are 0.06 mol/L, 0.12 mol/L, 0.24 mol/L, and 0.48 mol/L over time are shown in Figure 18. It is obvious that under those four different leaching concentrations, the starting time of the single peak leaching curve is the same, and the time of the peak appearing is basically within the same position range. In addition, as the concentration of the leaching solution increases, the curve rises faster and faster, and the peak concentration increases as well. When the concentration of leaching solution is 0.06 mol/L, the peak concentration of leached rare earth ions is 3.06 g/L. When the concentration increases to 0.12 mol/L, 0.24 mol/L, and 0.48 mol/L, the peak leaching concentrations is 5.30 g/L, 8.33 g/L, and 11.63 g/L, with an increase of 73.20%, 57.16%, and 39.62%, respectively. During the continuous leaching process, rare earth elements continuously accumulate in the lower part of the ore column, causing the exchange zone to gradually move downward until the entire area completes the exchange reaction. As the concentration of magnesium sulfate increases, the leaching agent solute Mg²⁺ enters an excess state, significantly raising the Mg²⁺ content in the solution. The concentration of Mg²⁺ in the exchange zone also increases, and the concentration gradient grows accordingly, further enhancing the diffusion capacity of Mg²⁺. This accelerates its internal diffusion rate and speeds up the exchange reaction. As a result, the total amount of rare earth ions leached per unit time increases, and the peak concentration of leached rare earth ions rises with the concentration of the injected solution. As the concentration of the leaching solution increases, the corresponding moments of peak concentration are 196.6 min, 161.3 min, 131.4 min, and 108.2 min, respectively; this indicates that effect of increasing the concentration of the leaching solution on the leaching process is limited, and the leaching period remains constant.
The amount of magnesium ion and the total amount of rare earth ion leached under different leaching solution concentration are shown in Figure 19. When the concentration of leaching solution increases from 0.06 mol/L to 0.12 mol/L, the total amount of rare earth ions leached increases by 11.52%. When the concentration of leaching solution increases from 0.12 mol/L to 0.24 mol/L, the amount of magnesium ion is doubled, and the rare earth ions leached increases by 4.84%. When the concentration of leaching solution increases from 0.24 mol/L to 0.48 mol/L, the amount of magnesium ion is doubled, and the rare earth ions leached increases by 4.65%.
The amount of magnesium ions increases with the increase of the concentration of the leaching solution. Although the growth rate of the total leached rare earth ions is very impressive in the range of 0.06 mol/L to 0.12 mol/L, the total leached rare earth ions does not increase linearly with the increase of the amount of magnesium ions. Increasing the concentration of magnesium sulfate has a significant effect on increasing the concentration of rare earth leaching, but it is very limited in accelerating the leaching cycle. Therefore, it is not advisable to continuously increase the concentration of MgSO4 to improve production efficiency and leaching concentration, as it will not only raise the cost of mineral leaching but also increase the concentration of residual magnesium ions in the soil, thereby raising the cost of leaching magnesium ions from the soil. For this mining area, it is recommended to control the concentration of leaching solution in the production process within the range of 0.12~0.24 mol/L (molar concentration of 1.4~2.8%).

5. Conclusions

This paper took an ionic rare earth mine in Longnan, southern Jiangxi Province as the research object, and constructed a porous scale ionic rare earth percolation–exchange–migration model based on nuclear magnetic images. Through numerical simulation test, the influence of injection intensity and leaching concentration on rare earth leaching process, leaching fluid seepage, exchange, and migration of rare earth were studied, and the regular law of leaching fluid seepage, ion exchange, and migration were summarized. Based on the percolation–exchange–migration model of ionic rare earth ore at pore scale, reasonable suggestions for the setting of injection intensity and leaching concentration were put forward. The conclusions are as follows:
  • The samples were scanned by NMR, the scanned NMR images were vectorized by image processing technology, and a two-dimensional pore percolation channel geometric model of ionic rare earth ore was established, and combined with control equations of ionic rare earth pore percolation–exchange–migration to simulate the meso-leaching-process of rare earth ions.
  • Increasing the injection intensity can facilitate rare earth ions to leach out earlier and outflow from the ore body, thereby shortening the leaching period and expediting the leaching process. However, it can also lead to a decrease in the peak concentration of rare earth ions in the leaching process. For this mining area, it is recommended to control the injection intensity between 0.50 mL/min and 1.00 mL/min.
  • Increasing the concentration of leaching solution accelerates the forward exchange rate of leaching agent cations and rare earth ions, thereby enhancing the leaching efficiency of rare earth ions. The greater the concentration gradient of rare earth ions in the leaching solution, the more significant the molecular diffusion effect and the faster the ion migration rate. Although the high concentration leaching solution is conducive to the leaching of rare earth ions, once the rare earth ions are essentially leached from the ore body, on the one hand, the exchange competition between rare earth and impurity ions is weakened, and impurity ions are leached out under better exchange conditions. On the other hand, the continuous injection of leaching solution causes a waste of resources. For this mining area, it is recommended to control the concentration of leaching solution between 0.12 mol/L and 0.24 mol/L.

Author Contributions

Conceptualization, D.W. and Y.R.; methodology, D.W.; software, F.W. and W.X.; validation, Z.Z., D.W., and W.X.; formal analysis, M.H., Z.Z., and D.W.; investigation, W.X. and M.H.; resources, Y.R.; data curation, F.W. and W.X.; writing—original draft preparation, D.W.; writing—review and editing, Y.R. and Z.Z.; visualization, D.W. and M.H.; supervision, D.W.; project administration, Y.R.; funding acquisition, Y.R. All authors have read and agreed to the published version of the manuscript.

Funding

This research was funded by the National Natural Science Foundation of China, grant number 51964014.

Data Availability Statement

The data that support the findings of this study are available from the corresponding author (V.S.) upon reasonable request.

Acknowledgments

The authors appreciate the editors and anonymous reviewers for their great efforts on the manuscript.

Conflicts of Interest

The authors declare no conflicts of interest.

References

  1. Liu, L.; Rao, Y.Z.; Tian, C.S.; Huang, T.; Lu, J.C.; Zhang, M.D.; Han, M. Adsorption Performance of La(III) and Y(III) on Orange Peel: Impact of Experimental Variables, Isotherms, and Kinetics. Adsorpt. Sci. Technol. 2021, 2021, 7189639. [Google Scholar] [CrossRef]
  2. Zhou, F.; Zhang, Y.X.; Liu, Q.; Huang, S.H.; Wu, X.Y.; Wang, Z.W.; Zhang, L.S.; Chi, R.A. Modified tailings of weathered crust elution-deposited rare earth ores as adsorbents for recovery of rare earth ions from solutions: Kinetics and thermodynamics studies. Miner. Eng. 2023, 191, 107937. [Google Scholar] [CrossRef]
  3. He, Z.Y.; Zhang, R.; Sha, A.Y.; Zuo, Q.; Xu, Z.G.; Wu, M.; Chi, R.A. Anti-swelling mechanism of DMDACC on weathered crust elution-deposited rare earth ore. J. Rare Earths 2022, 40, 1803–1811. [Google Scholar] [CrossRef]
  4. Han, M.; Wang, D.; Rao, Y.; Xu, W.; Nie, W. An Experimental Study on the Kinetics of Leaching Ion-Adsorbed REE Deposits with Different Concentrations of Magnesium Sulfate. Metals 2023, 13, 1906. [Google Scholar] [CrossRef]
  5. Luo, X.P.; Yuan, X.Q.; He, K.Z.; Zhang, Y.B.; Luo, C.G.; Liu, Z.S.; Zhou, H.P. Precipitation process for combined impurity removal from a magnesium sulphate-based leachate of ionic rare earth ore. Miner. Eng. 2022, 189, 107911. [Google Scholar] [CrossRef]
  6. Li, L.Q.; Liu, C.H.; Zhang, H.P.; Huang, B.; Luo, B.; Bie, C.; Sun, X.Q. The enrichment of rare earth from magnesium salt leaching solution of ion-adsorbed type deposit: A waste-free process for removing impurities. J. Environ. Manag. 2022, 310, 114743. [Google Scholar] [CrossRef]
  7. Wu, X.Y.; Zhou, F.; Liu, C.F. Effect of polyacrylamide on the process of removing impurities in the rare earth leachate. Physicochem. Probl. Miner. Process. 2021, 57, 182–191. [Google Scholar] [CrossRef]
  8. Bezaatpour, J.; Fatehifar, E.; Rasoulzadeh, A. Coarse-grained geological porous media structure modeling using heuristic algorithm and evaluation of porosity, hydraulic conductivity, and pressure drop with experimental results. Environ. Earth Sci. 2021, 80, 1–14. [Google Scholar] [CrossRef]
  9. Zhao, K.; Zhuo, Y.L.; Wang, X.J.; Zhong, W. Aggregate Evolution Mechanism during Ion-Adsorption Rare Earth Ore Leaching. Adv. Mater. Sci. Eng. 2018, 2018, 4206836. [Google Scholar] [CrossRef]
  10. Wang, S.F.; Lv, L.; Xue, K.X.; Zhang, D.J.; Li, M.D.; Li, D.W.; Yuan, C. Micropore Structure and Fractal Characteristics of Clays Due to Freeze-Thaw and Compression Based on Mercury Intrusion Porosimetry. Front. Earth Sci. 2022, 10, 851673. [Google Scholar] [CrossRef]
  11. Gong, L.X.; Nie, L.; Xu, Y.; Ji, X.K.; Liu, B.M. Characterization of Micro-Scale Pore Structure and Permeability Simulation of Peat Soil Based on 2D/3D X-ray Computed Tomography Images. Eurasian Soil Sci. 2022, 55, 790–801. [Google Scholar] [CrossRef]
  12. Yin, S.H.; Chen, X.; Yan, R.F.; Wang, L.M. Pore structure characterization of undisturbed weathered crust elution-deposited rare earth ore based on X-ray micro-CT scanning. Minerals 2021, 11, 236. [Google Scholar] [CrossRef]
  13. Kihm, J.H.; Hwang, G. Numerical Simulation of Water Table Drawdown due to Groundwater Pumping in a Contaminated Aquifer System at a Shooting Test Site, Pocheon, Korea. Econ. Environ. Geol. 2021, 54, 247–257. [Google Scholar] [CrossRef]
  14. Lu, D.C.; Li, X.Q.; Du, X.L.; Lin, Q.T.; Gong, Q.M. Numerical simulation and analysis on the mechanical responses of the urban existing subway tunnel during the rising groundwater. Tunn. Undergr. Space Technol. Inc. Trenchless Technol. Res. 2020, 98, 103297. [Google Scholar] [CrossRef]
  15. Xu, J.; Lan, W.; Ren, C.; Zhou, X.G.; Wang, S.H.; Yuan, J. Modeling of coupled transfer of water, heat and solute in saline loess considering sodium sulfate crystallization. Cold Reg. Sci. Technol. 2021, 189, 103335. [Google Scholar] [CrossRef]
  16. Wu, Z.J.; Lu, H.; Weng, L.; Liu, Q.S.; Shen, J.Q. Study on the seepage characteristics of fractured sandstone based on real-time imaging technology of nuclear magnetic resonance. Chin. J. Rock Mech. Eng. 2021, 40, 263–275. [Google Scholar]
  17. Sheikhzadeh, G.A.; Mehrabian, M.A.; Mansouri, S.H.; Sarrafi, A. Computational modelling of unsaturated flow of liquid in heap leaching—Using the results of column tests to calibrate the model. Int. J. Heat Mass Transf. 2005, 48, 279–292. [Google Scholar] [CrossRef]
  18. Wu, C.Y. Simulation and Analysis for Percolation Leaching Process of Ionic Rare Earth Ore. Master’s Thesis, Jiangxi University of Science and Technology, Ganzhou, China, 2016. [Google Scholar]
  19. Liu, Q.S.; Xiao, H.; Tan, C.L.; Yu, X.Y.; Wang, D.L.; Qiu, T.S. Coupled simulation of percolation-reaction-stress in leaching process of ion-type rare earth ore. J. Chin. Soc. Rare Earths 2022, 40, 880–892. [Google Scholar]
  20. Zeng, J. Numerical simulation of seepage characteristics and ion exchange reaction in leaching process of ionic rare earth ore. Master’s Thesis, Jiangxi University of Science and Technology, Ganzhou, China, 2022. [Google Scholar]
  21. Wu, A.X.; Yin, S.H.; Wang, H.J.; Su, D.Y. Solutes transport mechanism and model of dump leaching. J. Cent. South Univ. 2006, 2, 385–389. [Google Scholar]
  22. Wu, A.X.; Liu, J.Z.; Tang, L.Y. Simulation of Coupled Flowing-Reaction-Deformation with Mass Transfer in Heap Leaching Processes. Appl. Math. Mech. 2007, 28, 327–335. [Google Scholar] [CrossRef]
  23. Wang, D.; Wu, F.Y.; Rao, Y.Z.; Xu, W.; Han, M.; Shi, L. Simulation of an Ionic Rare Earth Leaching Process Based on the Darcy Law-Chemical Reaction Engineering-Transfer of Dilute Substance Coupling. Minerals 2022, 12, 1500. [Google Scholar] [CrossRef]
  24. Hu, S.L.; Cao, X.J.; Wang, G.S.; Long, P.; Zhou, X.Y. An Ion Exchange Model for Leaching Process of Weathered Crust Elution-deposited Rare Earth. Min. Metall. Eng. 2018, 38, 1–5. [Google Scholar]
  25. Long, P.; Wang, G.S.; Tian, J.; Hu, S.L.; Luo, S.H. Simulation of one-dimensional column leaching of weathered crust elution-deposited rare earth ore. Trans. Nonferrous Met. Soc. China 2019, 29, 625–633. [Google Scholar] [CrossRef]
  26. Li, Q.; Qin, L.; Wang, G.S.; Long, P.; Peng, C.L. Leaching Mechanism of Ion-Adsorption Rare Earth. J. Chin. Soc. Rare Earths 2021, 39, 543–554. [Google Scholar]
  27. Guo, Z.Q.; Zhao, K.; Jin, J.F.; Zhu, Z.C.; Li, G. Solute Transport Mechanism of Ion-Adsorption Type R are Earth in-situ Leaching Mining. J. Chin. Soc. Rare Earths 2019, 37, 121–128. [Google Scholar]
  28. Liu, J.; Brady, B.H. Evaluation of velocity-dependent in situ leaching processes: Single-porosity model. Metall. Mater. Trans. B. Process Metall. Mater. Process. Sci. 1998, 29, 1227–1234. [Google Scholar] [CrossRef]
  29. Phong, P.H.; Anh, P.B.V.; Ha, V.T.T.; Hung, L.Q.; Thanh, L. Simulating and Monitoring the Temporal and Spatial Transfer of NPK Fertilizer in Agricultural Soils Using a Mathematical Model and Multi-Channel Electrical Conductivity Measurement. J. Soil Sci. Plant Nutr. 2020, 21, 374–388. [Google Scholar] [CrossRef]
  30. Yang, Z.B.; He, Q.Q.; Wang, K.; Liu, N. Application of Portable X-ray Fluorescence Spectrometer in the Investigation of Contaminated Site. Environ. Monit. Forewarning 2023, 15, 23–26+51. [Google Scholar]
  31. Gao, L.H.; Xing, R.R.; Zhu, Y.R.; Zhao, W.Y. The total amount of rare earth in rare earth ferroalloy was determined by EDTA titration. Met. Funct. Mater. 2022, 29, 98–102. [Google Scholar]
  32. Yang, B.H.; Wu, A.X.; Miu, X.X.; Liu, J.Z. 3D characterization and analysis of pore structure of packed ore particle beds based on computed tomography images. Trans. Nonferrous Met. Soc. China 2014, 24, 833–838. [Google Scholar] [CrossRef]
  33. Wu, A.X.; Yang, B.H.; Liu, J.Z.; Zhang, J. Analysis of Pore Structure Evolution of Ore Granular Media during Leaching Based on X-ray Computed Tomography. Chin. J. Process Eng. 2007, 5, 960–966. [Google Scholar]
  34. Luo, X.P.; Zhang, Y.B.; Zhou, H.P.; He, K.Z.; Zhang, B.Y.; Zhang, D.M.; Xiao, W.J. Pore structure characterization and seepage analysis of ionic rare earth orebodies based on computed tomography images. Int. J. Min. Sci. Technol. 2022, 32, 411–421. [Google Scholar] [CrossRef]
Figure 1. Aerial view of the mining area.
Metals 14 01130 g001
Figure 2. Rare earth sampling site.
Metals 14 01130 g002
Figure 3. Indoor column immersion device.
Metals 14 01130 g003
Figure 4. Simulation process of rare earth ion migration.
Metals 14 01130 g004
Figure 5. NMR scanning of rare earth pillars.
Metals 14 01130 g005
Figure 6. Nuclear magnetic image binarization, threshold segmentation and edge detection.
Metals 14 01130 g006
Figure 7. Contour extraction, edge processing and connectivity processing of nuclear magnetic images.
Metals 14 01130 g007
Figure 8. Nuclear magnetic resonance image, ore body particle profile, and pore model.
Metals 14 01130 g008
Figure 9. Nuclear magnetic model.
Metals 14 01130 g009
Figure 10. Comparison between experimental and simulated leaching concentration.
Metals 14 01130 g010
Figure 11. Probe point location and nine representative points in the region.
Metals 14 01130 g011
Figure 12. Surface concentrations of rare earth ions at points A1–C3 under different injection intensities.
Metals 14 01130 g012
Figure 13. Surface concentration changes of rare earth ions at 8887 monitoring points under different injection intensities.
Metals 14 01130 g013
Figure 14. Average rare earth ion concentration at the outlet under different injection strength.
Metals 14 01130 g014
Figure 15. Magnesium ion dosage and total leach amount of rare earth ion under different injection strength.
Metals 14 01130 g015
Figure 16. Surface concentrations of rare earth ions at points A1–C3 at different concentrations.
Metals 14 01130 g016
Figure 17. Surface concentration changes of rare earth ions at 8887 monitoring points under different concentrations.
Metals 14 01130 g017
Figure 18. Average rare earth ion concentration at the outlet under different injection concentrations.
Metals 14 01130 g018
Figure 19. The amount of magnesium ions and the total amount of rare earth leached at different concentrations.
Metals 14 01130 g019
Table 1. Soil sample density.
Soil Sample NumberVolume/cm3Weight/gNatural Density/(g/cm3)Mean Density/(g/cm3)Porosity (n)Void Ratio (e)
150.068.511.371.380.4730.898
250.067.851.36
350.070.381.41
Table 2. Particle size distribution of soil samples at different depths.
Particle SizeParticle Diameter/mm
>52.5~51~2.50.5~10.075~0.5<0.075
Percent12.83%33.70%17.53%16.87%12.63%6.43%
Disclaimer/Publisher’s Note: The statements, opinions and data contained in all publications are solely those of the individual author(s) and contributor(s) and not of MDPI and/or the editor(s). MDPI and/or the editor(s) disclaim responsibility for any injury to people or property resulting from any ideas, methods, instructions or products referred to in the content.

