Abstract
To reveal the correlation between the mechanical properties of JSC590R/JSC980YL steel pulse-laser-welded joints and welding parameters, this study adopts the response surface analysis test method to determine the welding parameters, and examined the macroscopic morphology, microstructure, microhardness, and tensile properties of the cross-section of the welded joints. The results revealed that the key factors influencing welded joints quality, in descending order of importance, are distance to focus, welding speed, and single-pass heat input. The interaction between these factors is extremely significant. The weld zone of the joints is primarily composed of lath martensite, while the heat-affected zone is composed of ferrite, martensite, carburite, tempered martensite, and residual austenite. The optimized welding parameters align with actual expectations, yielding an average engineering stress of 616.9 MPa for the joint. Notably, the fracture area shifts from the heat-affected zone of JSC590R to the base material.
1. Introduction
Lightweight automobiles have become the focus of the automobile manufacturing industry to reduce emissions and yield energy savings. Therefore, scholars have conducted a lot of research on the joining processes of metal plates [1,2,3,4,5,6]. As a type of technology for the manufacturing of automobile parts, laser welding has become widely used owing to its advantages, such as its high material utilization, ease of design and development, process and cost savings [7,8,9], and weight reduction. By welding different thicknesses and types of steel, this technology meets the requirement of different automobile parts while avoiding wasting materials and minimizing costs [10,11].
Advanced high-strength steel (AHSS) is a type of low-alloy high-strength steel whose microstructure mainly consists of ferrite and martensite. It has the characteristics of high strength, good ductility, and a high cost performance and is suitable for manufacturing load-bearing, safe, and reinforcing parts of automobiles. Nevertheless, a softening zone is present in the welded joints of AHSS, which reduces the tensile strength and elongation. Consequently, the influence of soft zones on the quality of welded joints is an important aspect of process control [12,13,14,15,16]. Pulse laser welding has the advantage of a small average power and large peak power, which can concentrate energy in a smaller area to reduce the effect of the soft zone. However, different pulse welding parameters can affect the quality of welded joints, especially in the welding of steel plates of unequal thickness, and the control of process parameters is more difficult [17,18,19,20,21]. To solve this problem, the response surface analysis method can be used to improve the model and reduce costs by drastically decreasing the number of experiments [22,23,24]. Therefore, in this study, we optimized the pulse welding parameters of JSC590R/JAC980YL dissimilar steels based on the response surface analysis method and investigated their joint performance.
2. Materials and Methods
The test materials used in this study were JSC590R steel (thickness: 1.2 mm) and JAC980YL steel (thickness: 1.6 mm) supplied by Wuhan Excellent Steel Center (Lot 18MA, Wuhan Economic and Technological Development Zone, China). The parent material organization of the steels is shown in Figure 1. The specimen size was 80 mm × 80 mm, and its main chemical composition (mass fraction) is listed in Table 1.
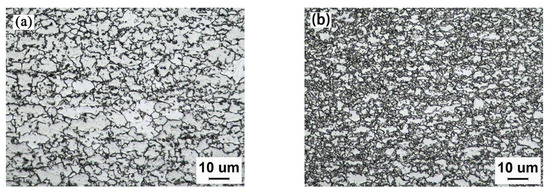
Figure 1.
Microstructure of base material: (a) JSC590R and (b) JAC980YL.

Table 1.
Chemical compositions of JSC590R and JSC980YL (wt.%).
The JHM-4GX-300 pulsed laser, manufactured in Germany supplied by Shanghai University of Electric Power, was employed in laser welding tests of dissimilar steels of differing thickness. The laser wavelength was set to 1064 um, the diameter of the fiber was set to 200 um, and the maximum output power was 300 W. A schematic of the welding process is shown in Figure 2.
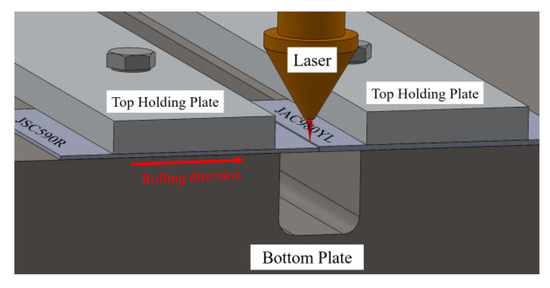
Figure 2.
Laser welding schematic.
Prior to laser welding the steel plate, the welding surface of the specimen was polished with 1000# sandpaper and cleaned with anhydrous ethanol to remove any oxides or organic matter present on the welding surface. In the welding process, the pulse frequency was set to 30 Hz, the pulse width time of a single shot was set to 5 ms, the laser beam was maintained perpendicular to the surface of the specimen, and argon was selected as the shielding gas with a flow rate of 10 L/min. The use of a shielding gas during the welding process reduced the oxidation of the weld.
This study is primarily based on the response surface analysis test to investigate the impact of various welding parameters on the quality of JSC590R/JAC980YL welded joints. Previous experiments showed that the most important parameters affecting the welding quality in pulsed laser welding were the (A) out-of-focus amount (the distance to focus), (B) welding speed, and (C) heat input, which were designated as the test variables. Following a series of single-factor tests, the high and low levels of each factor were identified, and the following values were determined: (A) the out-of-focus amount was set at −1–1 mm, (B) the welding speed was 1.5–4.5 mm/s, and (C) the single-pass heat input was set at 7–9 J. A Box–Behnken design (BBD) was then created through linear transformation with −1, 0, and 1 representing the low, medium, and high levels, respectively. Based on this, BBD surface response tests were designed using Design-Expert 13 (Version: 13.0.1.0 64-bit) as shown in Table 2.
Table 2.
Factor coding and level.
After the test was completed, a metallographic specimen of the welded head was prepared using the hot-setting method. Following grinding and polishing, the specimen was corroded using a 4% nitric acid–alcohol solution. The macromorphology and microstructure of the metallographic specimens were observed using a Leica CTR6 LED optical microscope. A hardness test was conducted on a section of the joint using a Buehler Wilson VH1102 micro Vickers hardness tester. The test positions are shown in Figure 3. The distance between adjacent hardness points was 150 um, the load pressure was 300 g, and the holding time was 10 s. The tensile specimens were prepared in accordance with the GB/T 228.1-2021 standard [25], as shown in Figure 3. The tensile properties of the base material and welded joints of the JSC590R and JAC980YL steels were then tested using an electronic universal material testing machine at a tensile rate of 2 mm/min. All the above chemicals & reagents, devices, instruments are provided by Shanghai Intelligent Manufacturing R&D and Transformation Functional Platform(Building 3, Lane 99, Ocean Road 4, Lingang section of Shanghai Pilot Free Trade Zone, Shanghai, China).
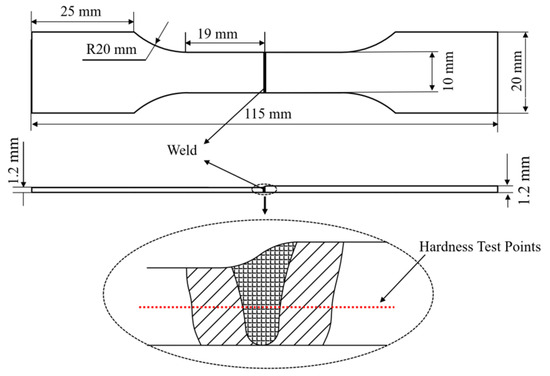
Figure 3.
Tensile and hardness testing schematic (mm).
3. Results and Discussion
3.1. Response Surface Test Results
A response surface test was conducted using three factors and three levels. The design included 17 test points, with the weld depth of fusion, weld area, and tensile force chosen as the response results. The program design and test results are listed in Table 3.
Table 3.
Design and results of response surface.
The three models were subjected to an analysis of variance (ANOVA), and the results are shown in Table 4, Table 5 and Table 6. The p-values of all the models were less than 0.0001, indicating that they were extremely significant. The response surface regression model reached a highly significant level (p < 0.001), and the misfit term was insignificant (p-values of 0.2524, 0.8785, and 0.2617, which were greater than zero). The R2 and R2Adj values were all greater than 0.9, while the values of R2-R2Adj were all less than 0.2, indicating that the three models fit well with the actual test and had good accuracy and test stability. Therefore, the model can be used to analyze the effects of these factors on the depth of melting, weld area, and tensile force in the pulsed laser welding tests.
Table 4.
Variance analysis for the penetration model.
Table 5.
Variance analysis for the fusion core area model.
Table 6.
Variance analysis for the tensile model.
The above model was tested by analyzing the distribution of the residuals in Figure 4 and the comparison of the actual and predicted values in Figure 5. The results showed that the data points of the model’s residuals and the actual and predicted values were distributed around the 45° line, suggesting that the model was more stable and had a higher level of credibility within the given range. The p-value is a probability value, with a lower value indicating more evidence that negates the original hypothesis. This was used to indicate the significance of this source of variance in the response surface model. A p-value of less than 0.05 is considered significant, a p-value of less than 0.01 is regarded as highly significant, and a p-value of less than 0.001 is considered extremely significant [26].
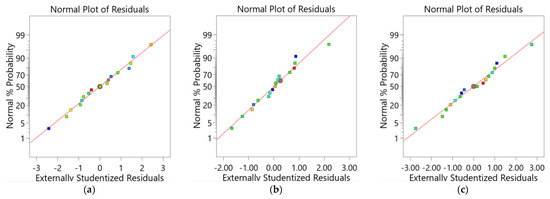
Figure 4.
Residual distribution of the model. (a) Depth of fusion residuals, (b) Weld area residuals, (c) Tensile residuals.
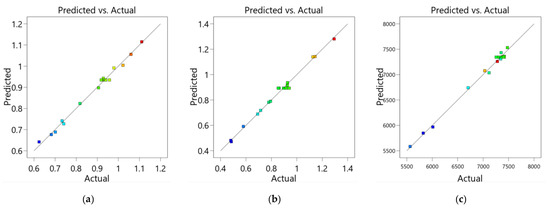
Figure 5.
Comparison of actual and predicted values. (a) Comparison of melting depths, (b) Comparison of weld area, (c) Comparison of tensile strengths.
The results of the testing as shown in the tables were analyzed using the Design-Expert 13 software as listed in Table 3. The primary, interaction, and secondary terms were selected to calculate the regression equations. It was determined that the factors of tertiary terms and above had negligible effects on the response results. Based on this, the regression equations for the welded joint depth of fusion, weld area, and tensile strength were obtained in the following order: (1), (2), and (3).
H = 2.185 − 0.121A − 0.908B − 0.018C + 0.002AB −
0.002AC + 0.112BC − 0.097A2 − 0.0002B2 − 0.017C2
0.002AC + 0.112BC − 0.097A2 − 0.0002B2 − 0.017C2
Z = −3.163 + 0.083A − 0.527B + 1.094C + 0.050AB −
0.051AC + 0.038BC − 0.073A2 + 0.018B2 − 0.066C2
0.051AC + 0.038BC − 0.073A2 + 0.018B2 − 0.066C2
F = 778.3 − 1408.55A − 2217.867B + 2319.025C − 270.8AB +
212.85AC + 308.00BC − 344.25A2 − 76.556B2 − 188.050C2
212.85AC + 308.00BC − 344.25A2 − 76.556B2 − 188.050C2
By analyzing the ANOVA of the depth of fusion model, it was possible to determine the order of factors affecting the depth of melting. This was achieved by considering the primary terms A and C; the interaction term BC; the secondary term A2, which is extremely significant; the primary term B, which is significant; and other factors that are not significant. The results indicate that the order of factors affecting the depth of melting is as follows: the amount of scorching > the amount of heat input in a single pass > the welding speed, as shown in Table 4. Similarly, by analyzing the weld area modeling, tensile force modeling, and the ANOVA of Table 5 and Table 6, the order of factors affecting the weld area was determined as follows: the welding speed > out-of-focus amount > single-pass heat input. The order of factors affecting the tensile strength is as follows: the welding speed > out-of-focus amount > single-pass heat input.
The response surface model was analyzed using the Design-Expert 13 software, and a regression equation was used to plot the three-dimensional (3D) response surface. This was used to investigate the effects of various factors on the joint quality. Figure 6 shows that to achieve a greater depth of fusion, it is necessary to control the out-of-focus amount to be around -0.04 mm, to vary the welding speed at different single-pass heat inputs, and to continue to strive for a maximum depth of fusion of 1.1 mm at a single-pass heat input of eight J. Figure 7 shows that, concurrent with the out-of-focus amount and welding speed parameters, the greater the single-pass heat input, the larger the weld area. The weld area consistently affected the quality of the joints at single-pass heat inputs of seven J, eight J, and nine J. The data for seven J, eight J, and nine J demonstrated a consistent pattern: as the out-of-focus amount and welding speeds decreased, the weld area exhibited an increasing trend. Figure 8 shows the influence of the interaction between the out-of-focus amount and welding speeds on the tensile force at various heat inputs. The 3D surface slope in Figure 8a is greater than those in Figure 8b,c, indicating that the tensile force is more sensitive to changes in the out-of-focus amount and welding speed at seven J. The lowest value of the tensile force was less than 2000 N. Consequently, to achieve a greater tensile force, it was essential to ensure that the low heat input was matched with a lower welding speed. Concurrently, to achieve a greater tensile strength, a low single-pass heat input must be matched with a slower welding speed, while a high single-pass heat input must be matched with a faster welding speed.
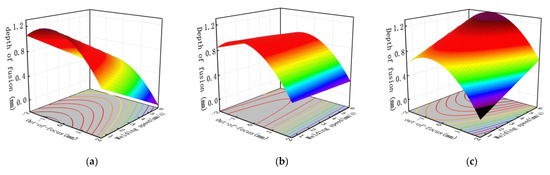
Figure 6.
Influence of out-of-focus amount and welding speed on penetration value under different single-pass heat inputs: (a) 7 J, (b) 8 J, and (c) 9 J.
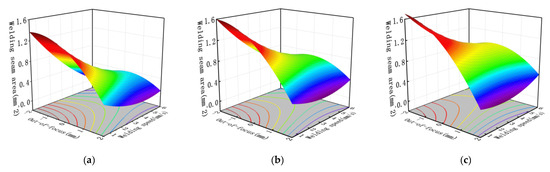
Figure 7.
Influence of out-of-focus amount and welding speed on fusion-core area value under different single-pass heat inputs: (a) 7 J, (b) 8 J, and (c) 9 J.
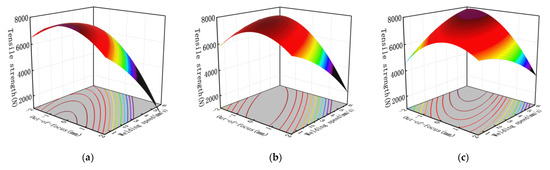
Figure 8.
Influence of out-of-focus amount and welding speed on tensile value under different single-pass heat inputs: (a) 7 J, (b) 8 J, and (c) 9 J.
Combined with the results of the actual tests, the analysis revealed a complex relationship between the out-of-focus amount, welding speed, and amount of heat input in a single pass. For certain test parameters, the welded joints exhibited a larger weld area, yet their depth of fusion and tensile strength decreased. This is primarily due to the excessive welding heat input, which can result in welding defects such as spatter and concave depression. These defects reduce the depth of fusion, while a larger weld area creates a wider soft zone, thereby converting the welded joints from base metal fractures into soft zone fractures. The welding parameters must not only meet the greater depth of fusion and higher tensile strength of the welded joint, but also have a weld area in the range of 0.8–1 mm².
Design-Expert 13 software was employed to solve the equations to optimize the welding process parameters. This resulted in the identification of the following parameters: an out-of-focus amount of −0.13 mm, a welding speed of 4.5 mm/s, and a single-pass heat input of nine J. These parameters were then subjected to welding tests, and the results of the predicted software output and actual test results are listed in Table 7. The error rate was within three percent, which is consistent with the predicted value. This indicates that the welding parameters are reliable and have practical applications.
Table 7.
Variance analysis for the tensile model.
3.2. Macroscopic Morphology and Microstructure of the Joint Cross-Section
The results of the response surface test indicated that the following optimized pulse welding parameters should be employed: an out-of-focus amount of −0.13 mm, a welding speed of 4.5 mm/s, and a single-pass heat input of nine J for the welding test. Figure 9a shows the macroscopic morphology and local microstructure of the welded joints, which exhibits a distinct demarcation line. This line serves as a reference, demarcating the center line of the weld, and the left and right side of the JSC590R and JAC980YL steel joints, respectively. As the distance from the center of the seam increases, the joints can be divided into the weld zone (fusion zone, or FZ) and heat-affected zone (HAZ). The HAZ can be further divided into two subzones: HAZ1 and HAZ2. HAZ1 contains coarse and fine crystal zones, while HAZ2 contains an incomplete phase transition zone and tempering zone. A comparison of the width of each HAZ revealed that the JAC980YL steel was wider than the JSC590R steel. This is attributed to the inferior heat dissipation properties of the JAC980YL steel compared to those of the JSC590R steel. The martensite content and thickness of the JAC980YL steel were greater than that of the JSC590R steel, which reduced the thermal conductivity of the material. Consequently, JAC980YL steel has a greater capacity to withstand elevated temperatures than JSC590R steel, facilitating the growth of internal structures.
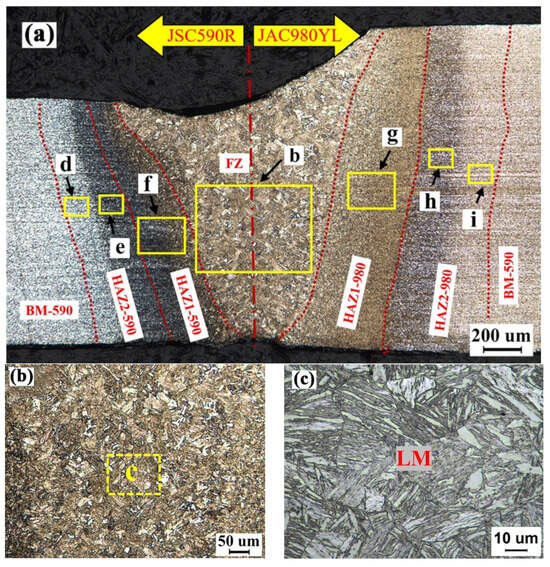
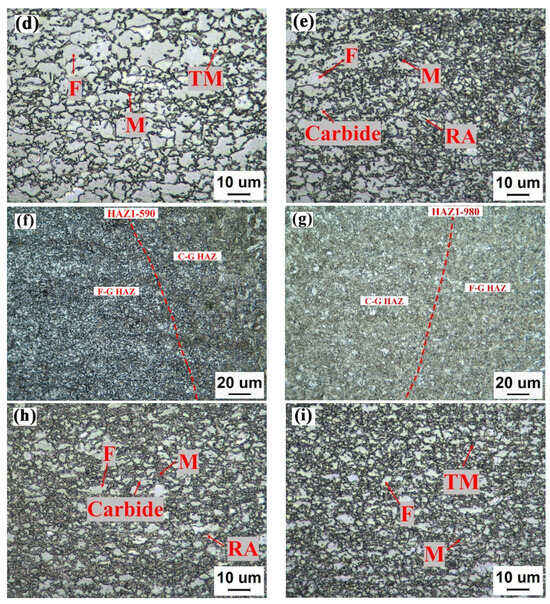
Figure 9.
Macroscopic morphology and local microstructure of welded joints: (a) macroscopic morphology of welded joint, (b) FZ of welded joint, (c) lath martensite in weld zone, (d) S-C HAZ of JSC590R, (e) I-C HAZ of JSC590R, (f) F-G HAZ and C-G HAZ of JSC590R, (g) C-G HAZ and F-G HAZ of JAC980YL, (h) I-C HAZ of JAC980YL, (i) S-C HAZ of JAC980YL (F: ferrite, M: martensite, LM: lath martensite, RA: retained austenite, TM: tempered martensite).
The parent material organization of the two high-strength steels mainly consists of martensite and ferrite. There is more martensite in the JAC980YL steel than in the JSC590R steel. The temperature of the weld zone exceeds the melting point of the two high-strength steels. The grains, as seen in Figure 9b, were seriously grown up and uniformly distributed, and a coarse lath martensite was obtained after cooling, as shown in Figure 9c. In Figure 9d,i, the temperature of the tempering zone is lower than Ac1. The martensite undergoes a tempering reaction upon reaching the tempering temperature, producing tempered martensite [27]. The temperature of the incomplete phase transition zone is between Ac1 and Ac3, at which the martensite and part of the ferrite are transformed into austenite. However, due to the fact that this zone is far away from the weld zone and is subjected to a small amount of heat, the cooling rate is slow, and some of the austenite is transformed into ferrite and residual austenite in the cooling process [28], as shown in Figure 9e,h; thus, the ferrite content of this zone is higher than the base material. Figure 9f,g show that the temperature in HAZ1 (the fine grain zone and coarse grain zone) is higher than the temperature of Ac3, at which point the martensite and ferrite are fully converted to austenite. Owing to the temperature distribution during the welding process, the closer to the weld zone, the higher the temperature and the larger the grain organization. During cooling, the austenite in the coarse zone was transformed into larger equiaxed martensite, while the fine zone received finer equiaxed martensite and some ferrite.
3.3. Microhardness and Tensile Properties of Joints
The hardness of the welded joints was tested, and the microhardness distributions of the joints are shown in Figure 10.
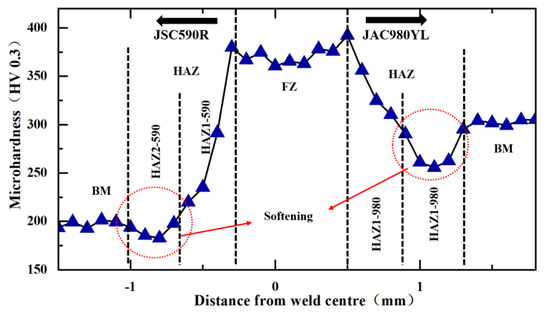
Figure 10.
Microhardness distribution of welded joints.
Figure 10 shows that there is a significant difference in the hardness of the different regions of the welded joints. The average hardness of the JSC590R steel-based material is 197 HV. There is a softening zone in the HAZ on the side of the JSC590R steel. The hardness was approximately five percent lower than that of the base material, and its width was approximately 0.25 mm. The distribution of softened areas in HAZ2-590 was based on microstructure observations. This is because the martensite in the tempering zone in this region underwent tempering decomposition to form tempered martensite. The incomplete phase transition zone in the ferrite increased, while the martensite content decreased, thus lowering the hardness of HAZ2-590 relative to the base material. Subsequently, there was a notable increase in the hardness of the HAZ in HAZ1-590, specifically at the coarse crystal and weld zone boundaries. This reached a maximum value of 380 HV, with the weld zone exhibiting an average hardness of 378.4 HV. The base material of the JAC980YL steel exhibited a hardness value of 303 HV, while the HAZ exhibited a hardness value of 378.4 HV. The distribution pattern of the HAZ hardness was similar to that of the JSC590R steel. However, the decline in the softening zone (HAZ2-980) hardness was more pronounced than that in the parent material, with a decrease of approximately 13%. This is because the JAC980YL steel is thicker, resulting in poorer heat dissipation and a greater amount of tempered martensite, leading to a more pronounced hardness drop [29,30,31,32,33].
The engineering stress–strain curves of the welded joints are shown in Figure 11. The maximum average engineering stress of the welded joint was 616.9 MPa. Compared with the results of the previous test, the tensile fracture region of the optimized joint shifted from the HAZ to the base material, and the fracture morphology exhibited a plastic fracture mode, as shown in Figure 12. This is because of the low heat input per unit of time, which resulted in a minimal change in the softening degree of the JSC590R steel softening zone and a reduction in the width of the softening zone.

Figure 11.
Stress–strain curves of welded joints.
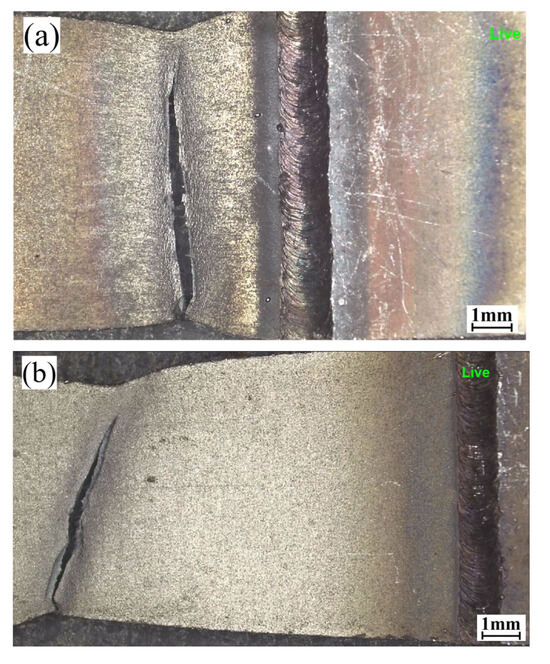
Figure 12.
Tensile fracture areas of welded joints. (a) Tensile fracture area of welded joint before optimization; (b) Tensile fracture area of welded joint after optimization.
4. Conclusions
- The primary factors influencing the quality of the pulsed-laser-welded joints of JSC590R/JSC980YL heterogeneous steel with varying thicknesses were identified through a response surface test analysis. The importance of these factors is as follows: the out-of-focus amount, the welding speed, and then the single-pass heat input. The interactions between these factors were extremely significant. The welding parameters that were optimized based on Design-Expert 13 software were as follows: an out-of-focus amount of −0.13 mm, a welding speed of 4.5 mm/s, and a single-pass heat input of 9 J.
- Macroscopic morphological observations and a local microstructure analysis of the optimized JSC590R/JSC980YL welded joints yielded the following insights. The welding process resulted in the formation of a distinct line separating the weld zone and HAZ which could be further subdivided into HAZ1 and HAZ2. The weld zone was primarily composed of coarse slate martensite dispersed throughout, with a particularly dense concentration near the centerline. The microstructure of HAZ1 comprised various sizes of equiaxed martensite, while HAZ2 contained martensite, ferrite, and small amounts of residual austenite, carbides, and tempered martensite.
- The performance testing of the welded joints revealed that a softening zone (HAZ2) was observed on both sides of the HAZ of the welded joints. The hardness of the optimized JSC590R and JAC980YL steel decreased by approximately 5% and 13%, respectively, compared to the base material. The average engineering stress of the welded joints was 616.9 MPa in the tensile test. The fracture region shifted from the HAZ of the JSC590R steel to the base material zone, exhibiting a plastic fracture mode.
Author Contributions
Conceptualization, R.Z. and Q.F.; Methodology, Q.F.; Software, R.Z. and S.T.; Validation, R.Z. and S.T.; Formal analysis, S.N. and M.L.; Investigation, C.W. and S.T.; Resources, Q.F.; Data curation, R.Z. and C.W.; Writing—original draft, R.Z.; Writing—review & editing, S.N. and M.L.; Supervision, M.L.; Project administration, Q.F.; Funding acquisition, Q.F. All authors have read and agreed to the published version of the manuscript.
Funding
This research was funded by the National Natural Science Foundation of China (Grant Nos. 52175343 and 52175345) and the Science and Technology Commission of Shanghai Municipality (19DZ2271100).
Data Availability Statement
The original contributions presented in the study are included in the article, further inquiries can be directed to the corresponding author.
Conflicts of Interest
The authors declare no conflicts of interest.
References
- Xia, Y.J.; Li, Z.; Wang, W.; Yang, T.; Pi, G.; Li, Y. Influence Mechanism of Initial Gap Disturbance on the Resistance Spot Welding Process. Automot. Innov. 2024, 7, 360–372. [Google Scholar] [CrossRef]
- Zhang, B.; Ma, Y.; Yu, F.; Liu, Y.; Zhou, E.; Fan, Z.; Ge, E.; Li, Y.; Lin, Z. Strengthening flat-die friction self-pierce riveting joints via manipulating stir zone geometry by tailored rivet structures. Int. J. Mach. Tools Manuf. 2024, 203, 104223. [Google Scholar] [CrossRef]
- Xia, Y.J.; Lv, T.L.; Ghassemi-Armaki, H.; Li, Y.B.; Carlson, B.E. Quantitative interpretation of dynamic resistance signal in resistance spot welding. Weld J 2023, 102, 69–87. [Google Scholar] [CrossRef]
- Viňáš, J.; Brezinová, J.; Brezina, J.; Maruschak, P.O. Structural and Mechanical Features of Laser-Welded Joints of Zinc-Coated Advanced Steel Sheets. Mater. Sci. 2019, 55, 46–51. [Google Scholar] [CrossRef]
- Zhu, X.; Li, Y.; Chen, X.; Yin, G.; Chen, Y.; Xiao, C. Microstructure and mechanical properties of CP780 steel-7075 aluminum alloy laser welded joint assisted by rotating magnetic field. Mater. Res. Express 2024, 11, 106515. [Google Scholar] [CrossRef]
- Kumar, A.; Pandey, C. Autogenous laser-welded dissimilar joint of ferritic/martensitic P92 steel and Inconel 617 alloy: Mechanism, microstructure, and mechanical properties. Arch. Civ. Mech. Eng. 2022, 22, 39. [Google Scholar] [CrossRef]
- Czerwinski, F. Current trends in automotive lightweighting strategies and materials. Materials 2021, 14, 6631. [Google Scholar] [CrossRef]
- Sandrini, G.; Gadola, M.; Chindamo, D.; Candela, A.; Magri, P. Exploring the Impact of Vehicle Lightweighting in Terms of Energy Consumption: Analysis and Simulation. Energies 2023, 16, 5157. [Google Scholar] [CrossRef]
- Lina, S.; You, L.; Junxiang, J. Effect of laser welding and laser wire filling on forming and properties of dissimilar steel welded joints. Mater. Res. Express 2023, 10, 126504. [Google Scholar] [CrossRef]
- Öztürk, E.; Arıkan, H. Investigation of mechanical properties of laser welded dual-phase steels at macro and micro levels. Opt. Laser Technol. 2023, 157, 108713. [Google Scholar] [CrossRef]
- Wang, H.; Liu, L.; Wang, H.; Zhou, J. Control of defects in the deep drawing of tailor-welded blanks for complex-shape automotive panel. Int. J. Adv. Manuf. Technol. 2022, 119, 3235–3245. [Google Scholar] [CrossRef]
- Alves, P.; Lima, M.; Raabe, D.; Sandim, H.R.Z. Laser beam welding of dual-phase DP1000 steel. J. Mater. Process. Technol. 2018, 252, 498–510. [Google Scholar] [CrossRef]
- Kuril, A.A.; Ram, G.J.; Bakshi, S.R. Solidification and Liquation Cracking Behavior of Dual-Phase Steel DP600. Metall. Mater. Trans. B 2019, 50, 2029–2036. [Google Scholar] [CrossRef]
- Zhai, Z.; Zhao, L.; Zhu, J. Microstructure and Mechanical Behavior of DP600 Welded Joints Obtained by Fiber Laser Welding. JOM 2023, 75, 2662–2668. [Google Scholar] [CrossRef]
- Gao, S.; Li, Y.; Yang, L.; Qiu, W. Microstructure and mechanical properties of laser-welded dissimilar DP780 and DP980 high-strength steel joints. Mater. Sci. Eng. A 2018, 720, 117–129. [Google Scholar] [CrossRef]
- Farabi, N.; Chen, D.L.; Zhou, Y. Tensile Properties and Work Hardening Behavior of Laser-Welded Dual-Phase Steel Joints. J. Mater. Eng. Perform. 2011, 21, 222–230. [Google Scholar] [CrossRef]
- Dak, G.; Sirohi, S.; Pandey, C. Study on microstructure and mechanical behavior relationship for laser-welded dissimilar joint of P92 martensitic and 304L austenitic steel. Int. J. Press. Vessel. Pip. 2022, 196, 104629. [Google Scholar] [CrossRef]
- Sun, Q.; Di, H.-S.; Li, J.-C.; Wang, X.-N. Effect of pulse frequency on microstructure and properties of welded joints for dual phase steel by pulsed laser welding. Mater. Des. 2016, 105, 201–211. [Google Scholar] [CrossRef]
- Shamov, E.; Mishin, M.; Shiganov, I.; Taksants, M.; Efimov, E. Features of pulsed laser welding with deep fusion penetration. Weld. Int. 2019, 33, 358–364. [Google Scholar] [CrossRef]
- Herzog, R.; Strelnikov, D. An optimal control problem for single-spot pulsed laser welding. J. Math. Ind. 2023, 13, 4. [Google Scholar] [CrossRef]
- Gandhi, A.D.; Kundu, A.; Kumar, R.; Chakraborti, P.C. Effect of Heat Input on the Weld Thermal Cycle, Microstructure, Tensile Damage and Fracture Behavior of Pulsed Laser-Welded Dual-Phase Steel. J. Mater. Eng. Perform. 2023, 1–18. [Google Scholar] [CrossRef]
- Ghattas, B.; Manzon, D. Machine Learning Alternatives to Response Surface Models. Mathematics 2023, 11, 3406. [Google Scholar] [CrossRef]
- Yao, Z.; Liu, K.; Ding, R.; Luo, Z.; He, J. Optimization of Ultrasonic Welding Parameters Based on Response Surface Methodology. J. Phys. Conf. Ser. 2023, 2474, 012029. [Google Scholar] [CrossRef]
- Attah, B.I.; Lawal, S.A.; Bala, K.C.; Ikumapayi, O.M.; Adedipe, O.; Mahto, R.P.; Akinlabi, E.T. Optimization and numerical analysis of friction stir welding parameters of AA7075-T651 and AA 1200-H19 using tapered tool. Int. J. Interact. Des. Manuf. (IJIDeM) 2023, 18, 6639–6653. [Google Scholar] [CrossRef]
- GB/T 228.1-2021; Metallic Materials—Tensile Testing—Part 1: Method of Test at Room Temperature. China Standards Press: Beijing, China, 2021.
- Nirgude, S.; Kalpande, S. Parametric optimization of friction stir welding of AA 6101 T-64 and pure Cu using response surface methodology. IJIDeM 2024, 18, 1789–1807. [Google Scholar] [CrossRef]
- Mathevon, A.; Massardier, V.; Fabrègue, D.; Douillard, T.; Rocabois, P.; Ollagnier, A.; Perez, M. Tempering of Dual Phase steels: Microstructural evolutions and mechanical properties. Mater. Sci. Eng. A 2024, 908, 146762. [Google Scholar] [CrossRef]
- Saha, D.C.; Biro, E.; Gerlich, A.P.; Zhou, Y. Influences of blocky retained austenite on the heat-affected zone softening of dual-phase steels. Mater. Lett. 2020, 264, 127368. [Google Scholar] [CrossRef]
- Nawaz, B.; Long, X.; Li, Y.; Yang, Z.; Zhang, F. Effect of Ferrite/Martensite on Microstructure Evolution and Mechanical Properties of Ultrafine Vanadium Dual-Phase Steel. J. Mater. Eng. Perform. 2022, 31, 4305–4317. [Google Scholar] [CrossRef]
- Yu, H.; Zhang, C.; Qiao, L.; Yan, Y. Embrittlement mechanism of ferrite-martensite dual-phase steel during strain-baking. Mater. Sci. Eng. A 2023, 884, 145544. [Google Scholar] [CrossRef]
- Avendaño-Rodríguez, D.; Rodriguez-Baracaldo, R.; Weber, S.; Mujica-Roncery, L. Martensite content effect on fatigue crack growth and fracture energy in dual-phase steels. Fatigue Fract. Eng. Mater. Struct. 2024, 47, 884–902. [Google Scholar] [CrossRef]
- Rezazadeh, V.; Hoefnagels, J.P.M.; Geers, M.G.D.; Peerlings, R. On the critical role of martensite hardening behavior in the paradox of local and global ductility in dual-phase steels. Eur. J. Mech.-A/Solids 2024, 104, 105152. [Google Scholar] [CrossRef]
- Khorasani, F.; Jamaati, R.; Jamshidi Aval, H. Effect of Intercritical Annealing Time on the Microstructure and Mechanical Properties of Dual-Phase Steel Processed by Large-Strain Asymmetric Cold-Rolling. Steel Res. Int. 2023, 94, 2300086. [Google Scholar] [CrossRef]
Disclaimer/Publisher’s Note: The statements, opinions and data contained in all publications are solely those of the individual author(s) and contributor(s) and not of MDPI and/or the editor(s). MDPI and/or the editor(s) disclaim responsibility for any injury to people or property resulting from any ideas, methods, instructions or products referred to in the content. |
© 2024 by the authors. Licensee MDPI, Basel, Switzerland. This article is an open access article distributed under the terms and conditions of the Creative Commons Attribution (CC BY) license (https://creativecommons.org/licenses/by/4.0/).