
Enhancing High-Temperature Durability of Aluminum/Steel Joints: The Role of Ni and Cr in Substitutional Diffusion Within Intermetallic Compounds

 ,
,  ,
,  and
and 
Abstract
1. Introduction
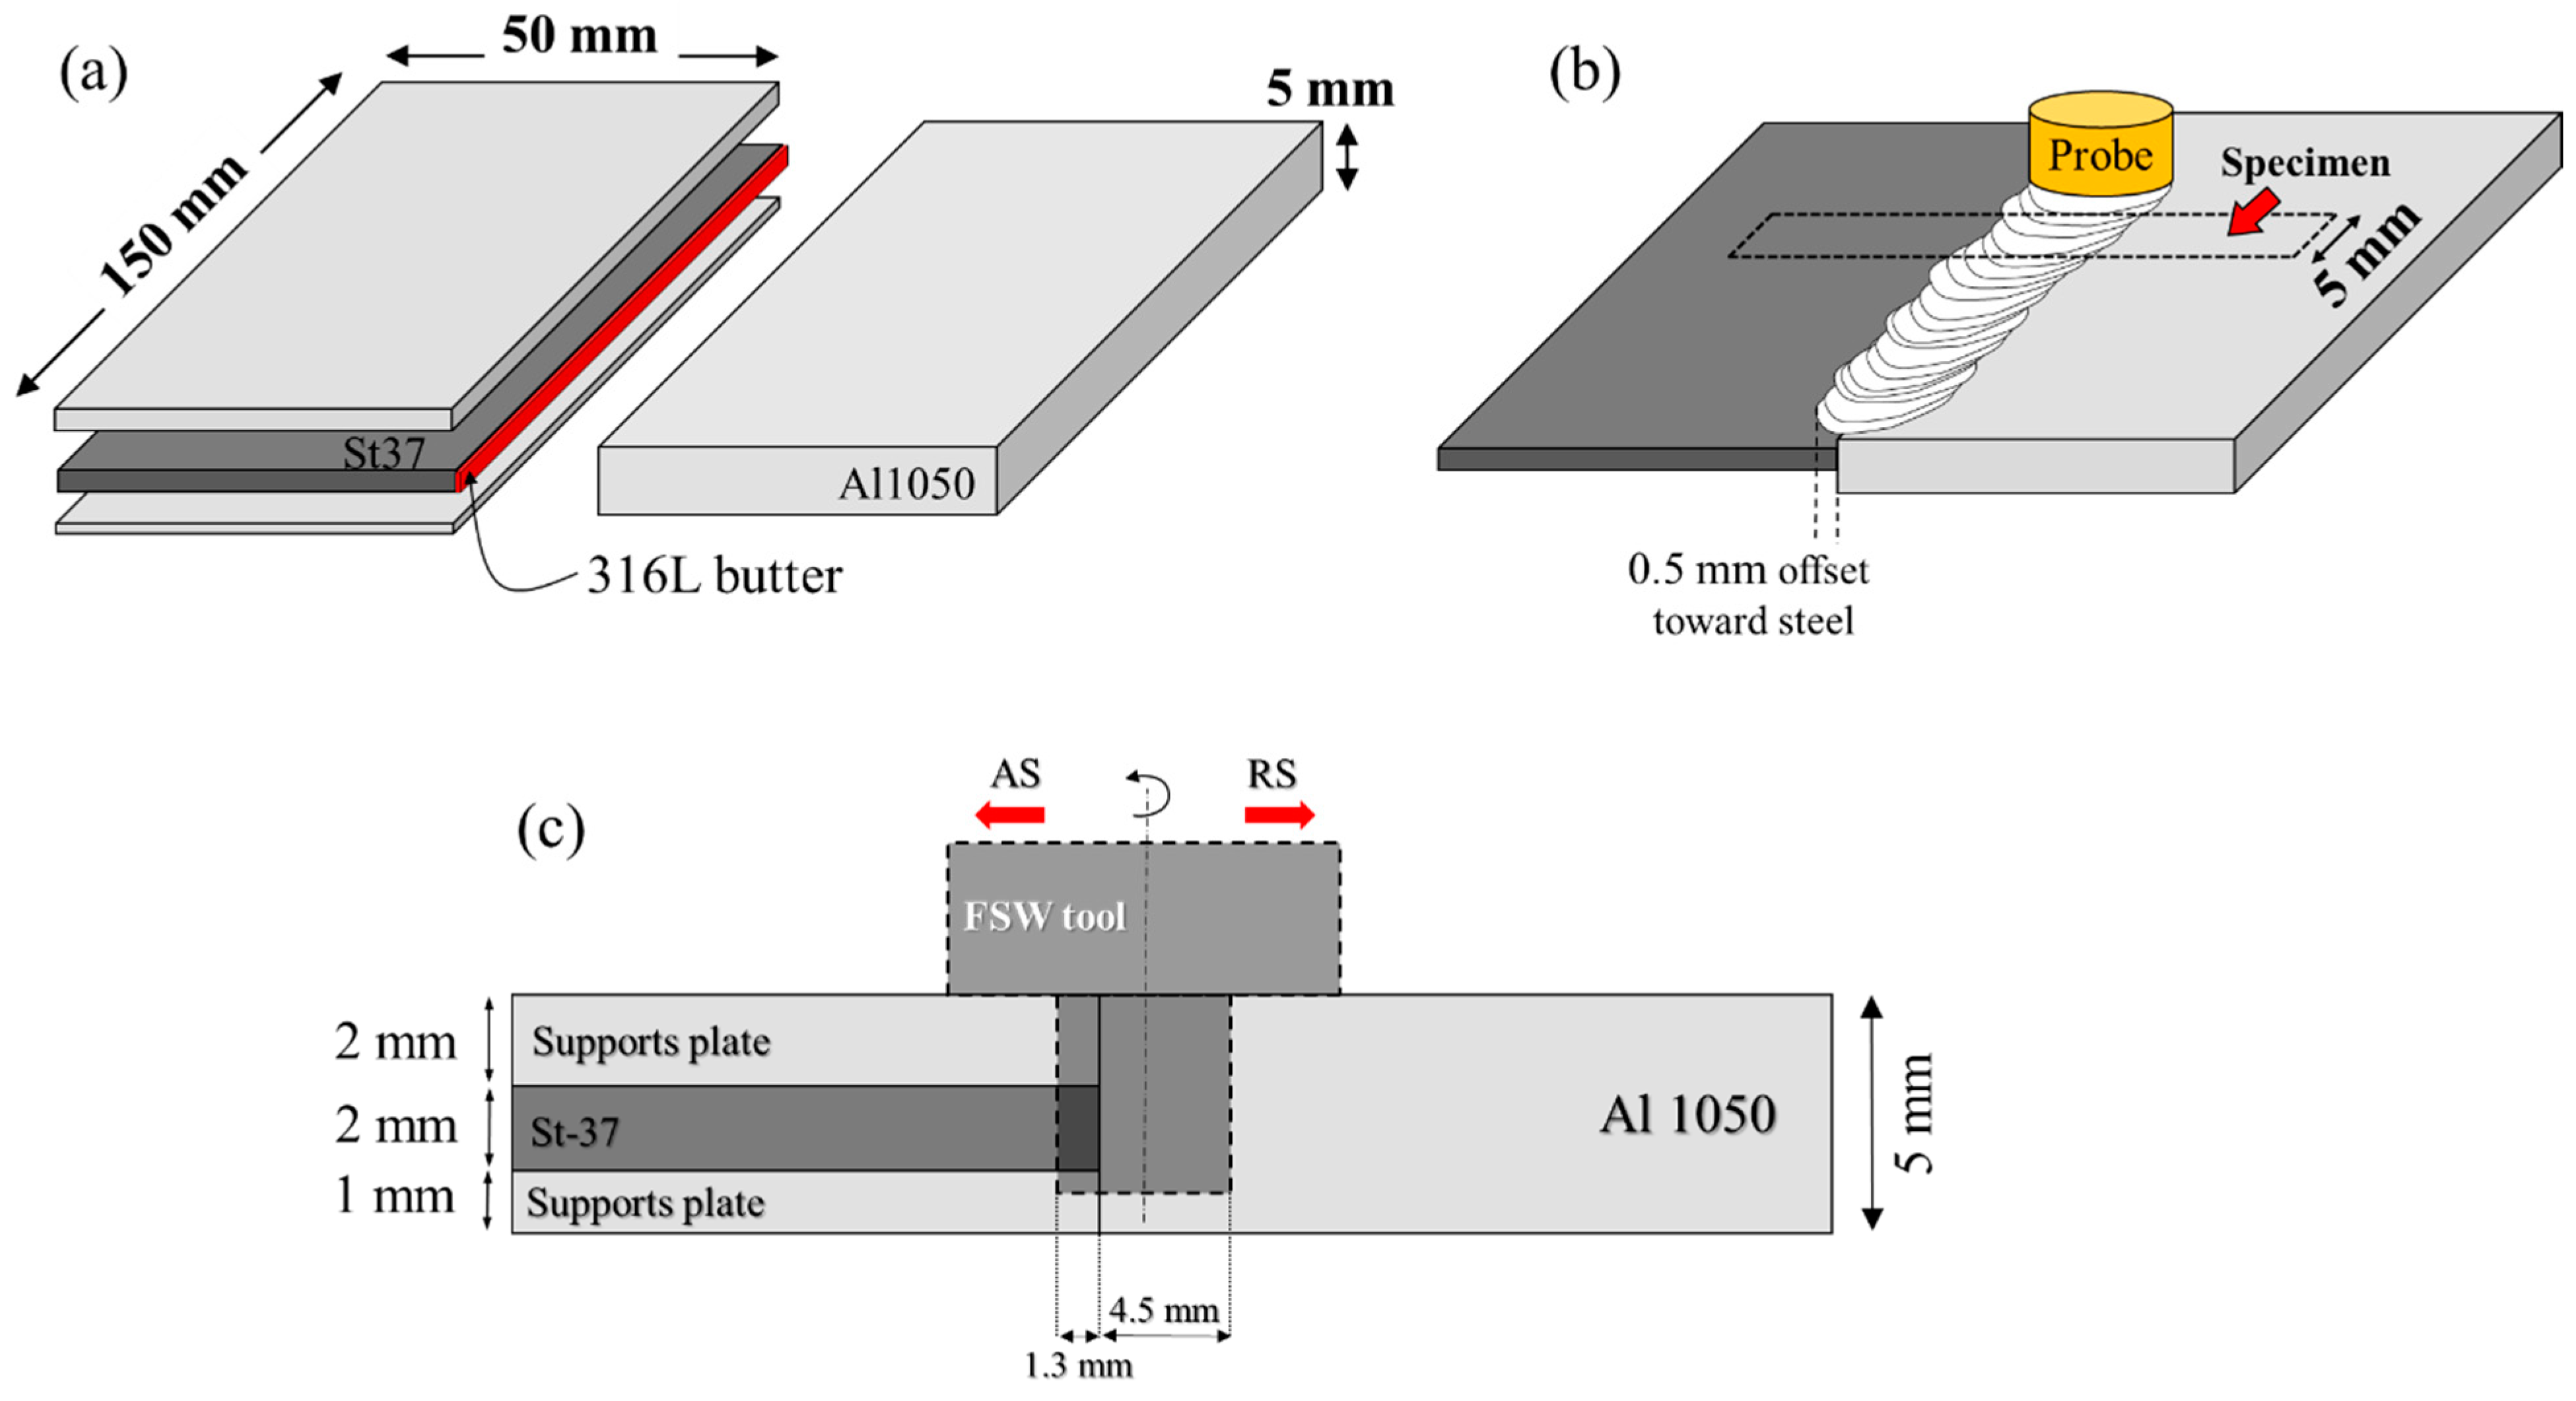
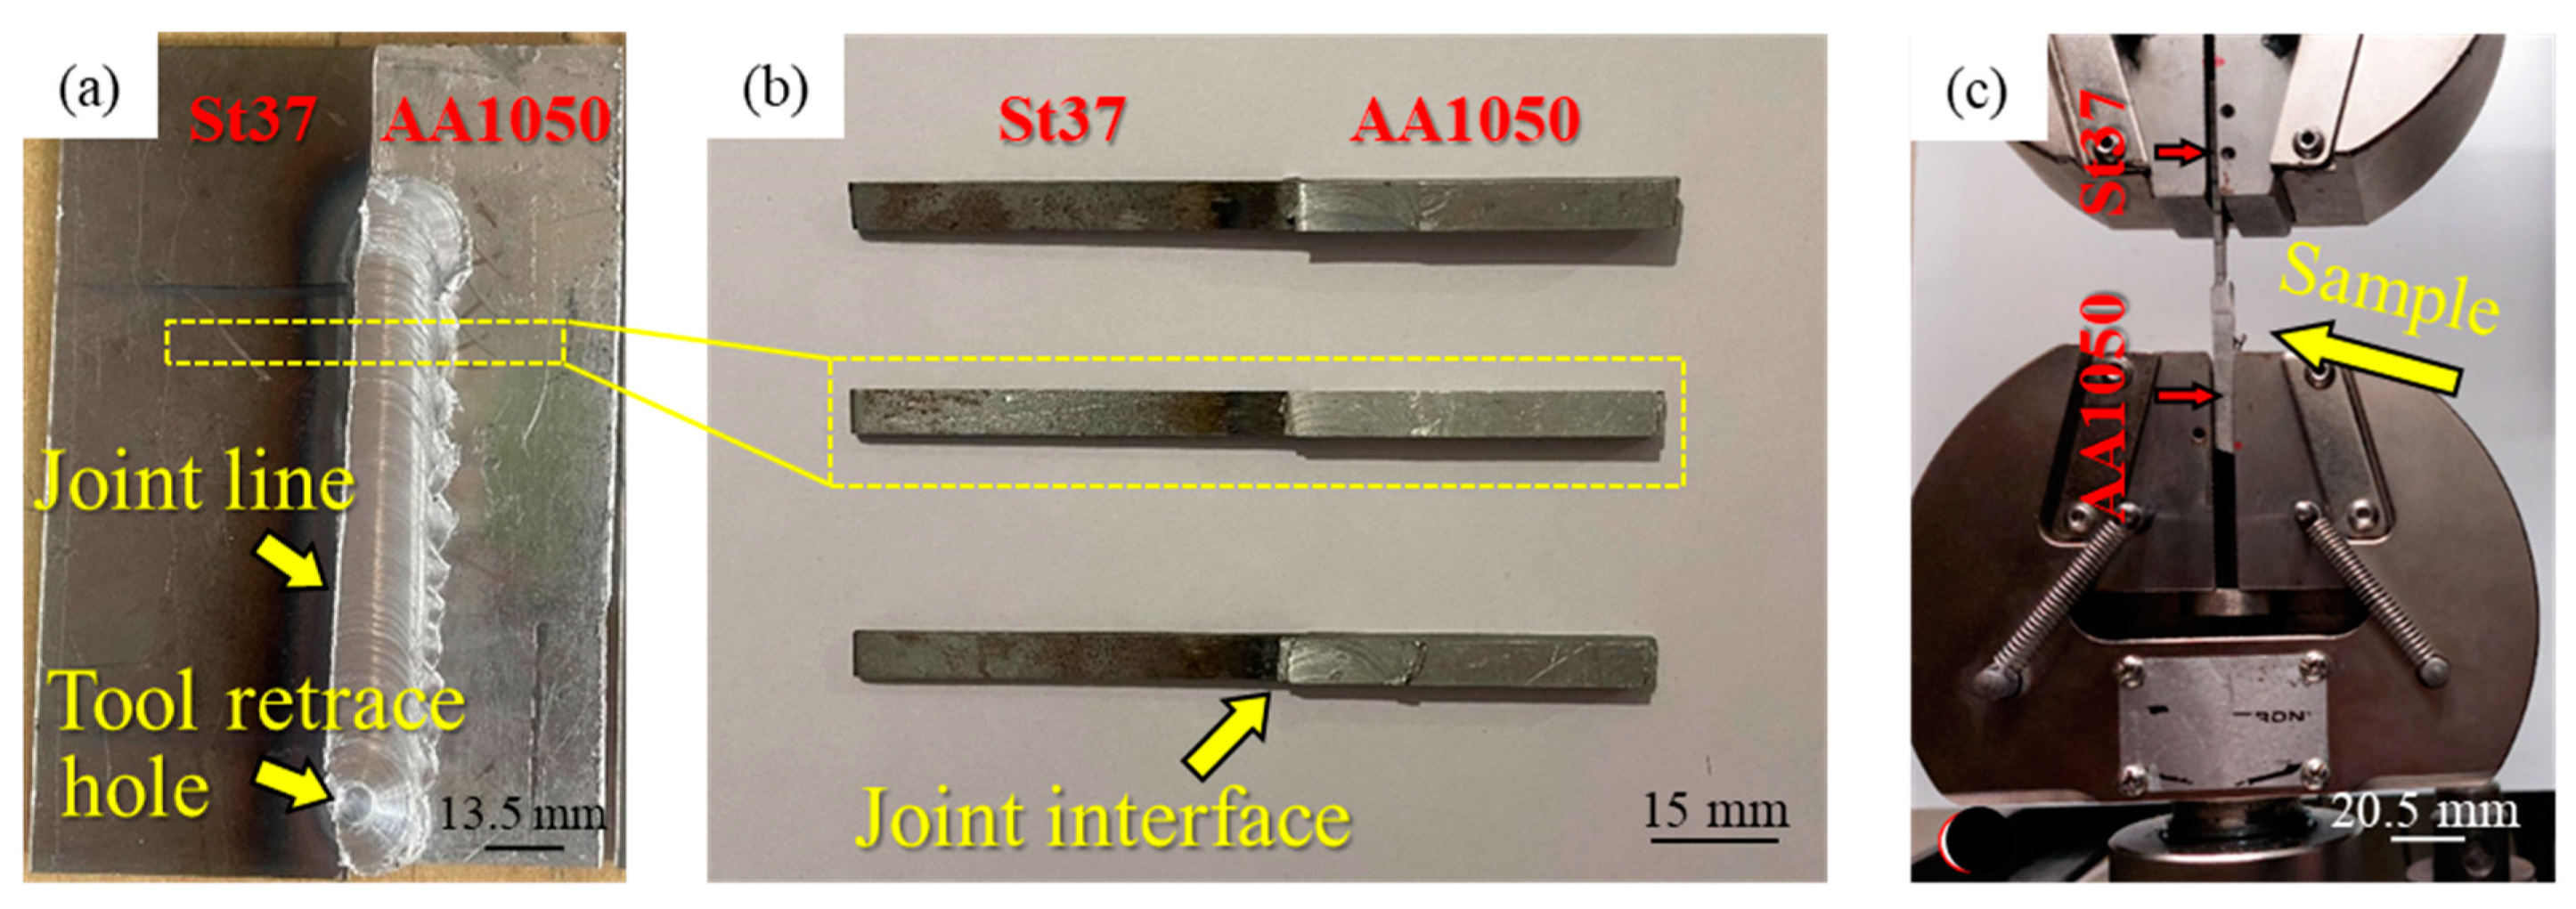
2. Material and Methods
3. Results and Discussion
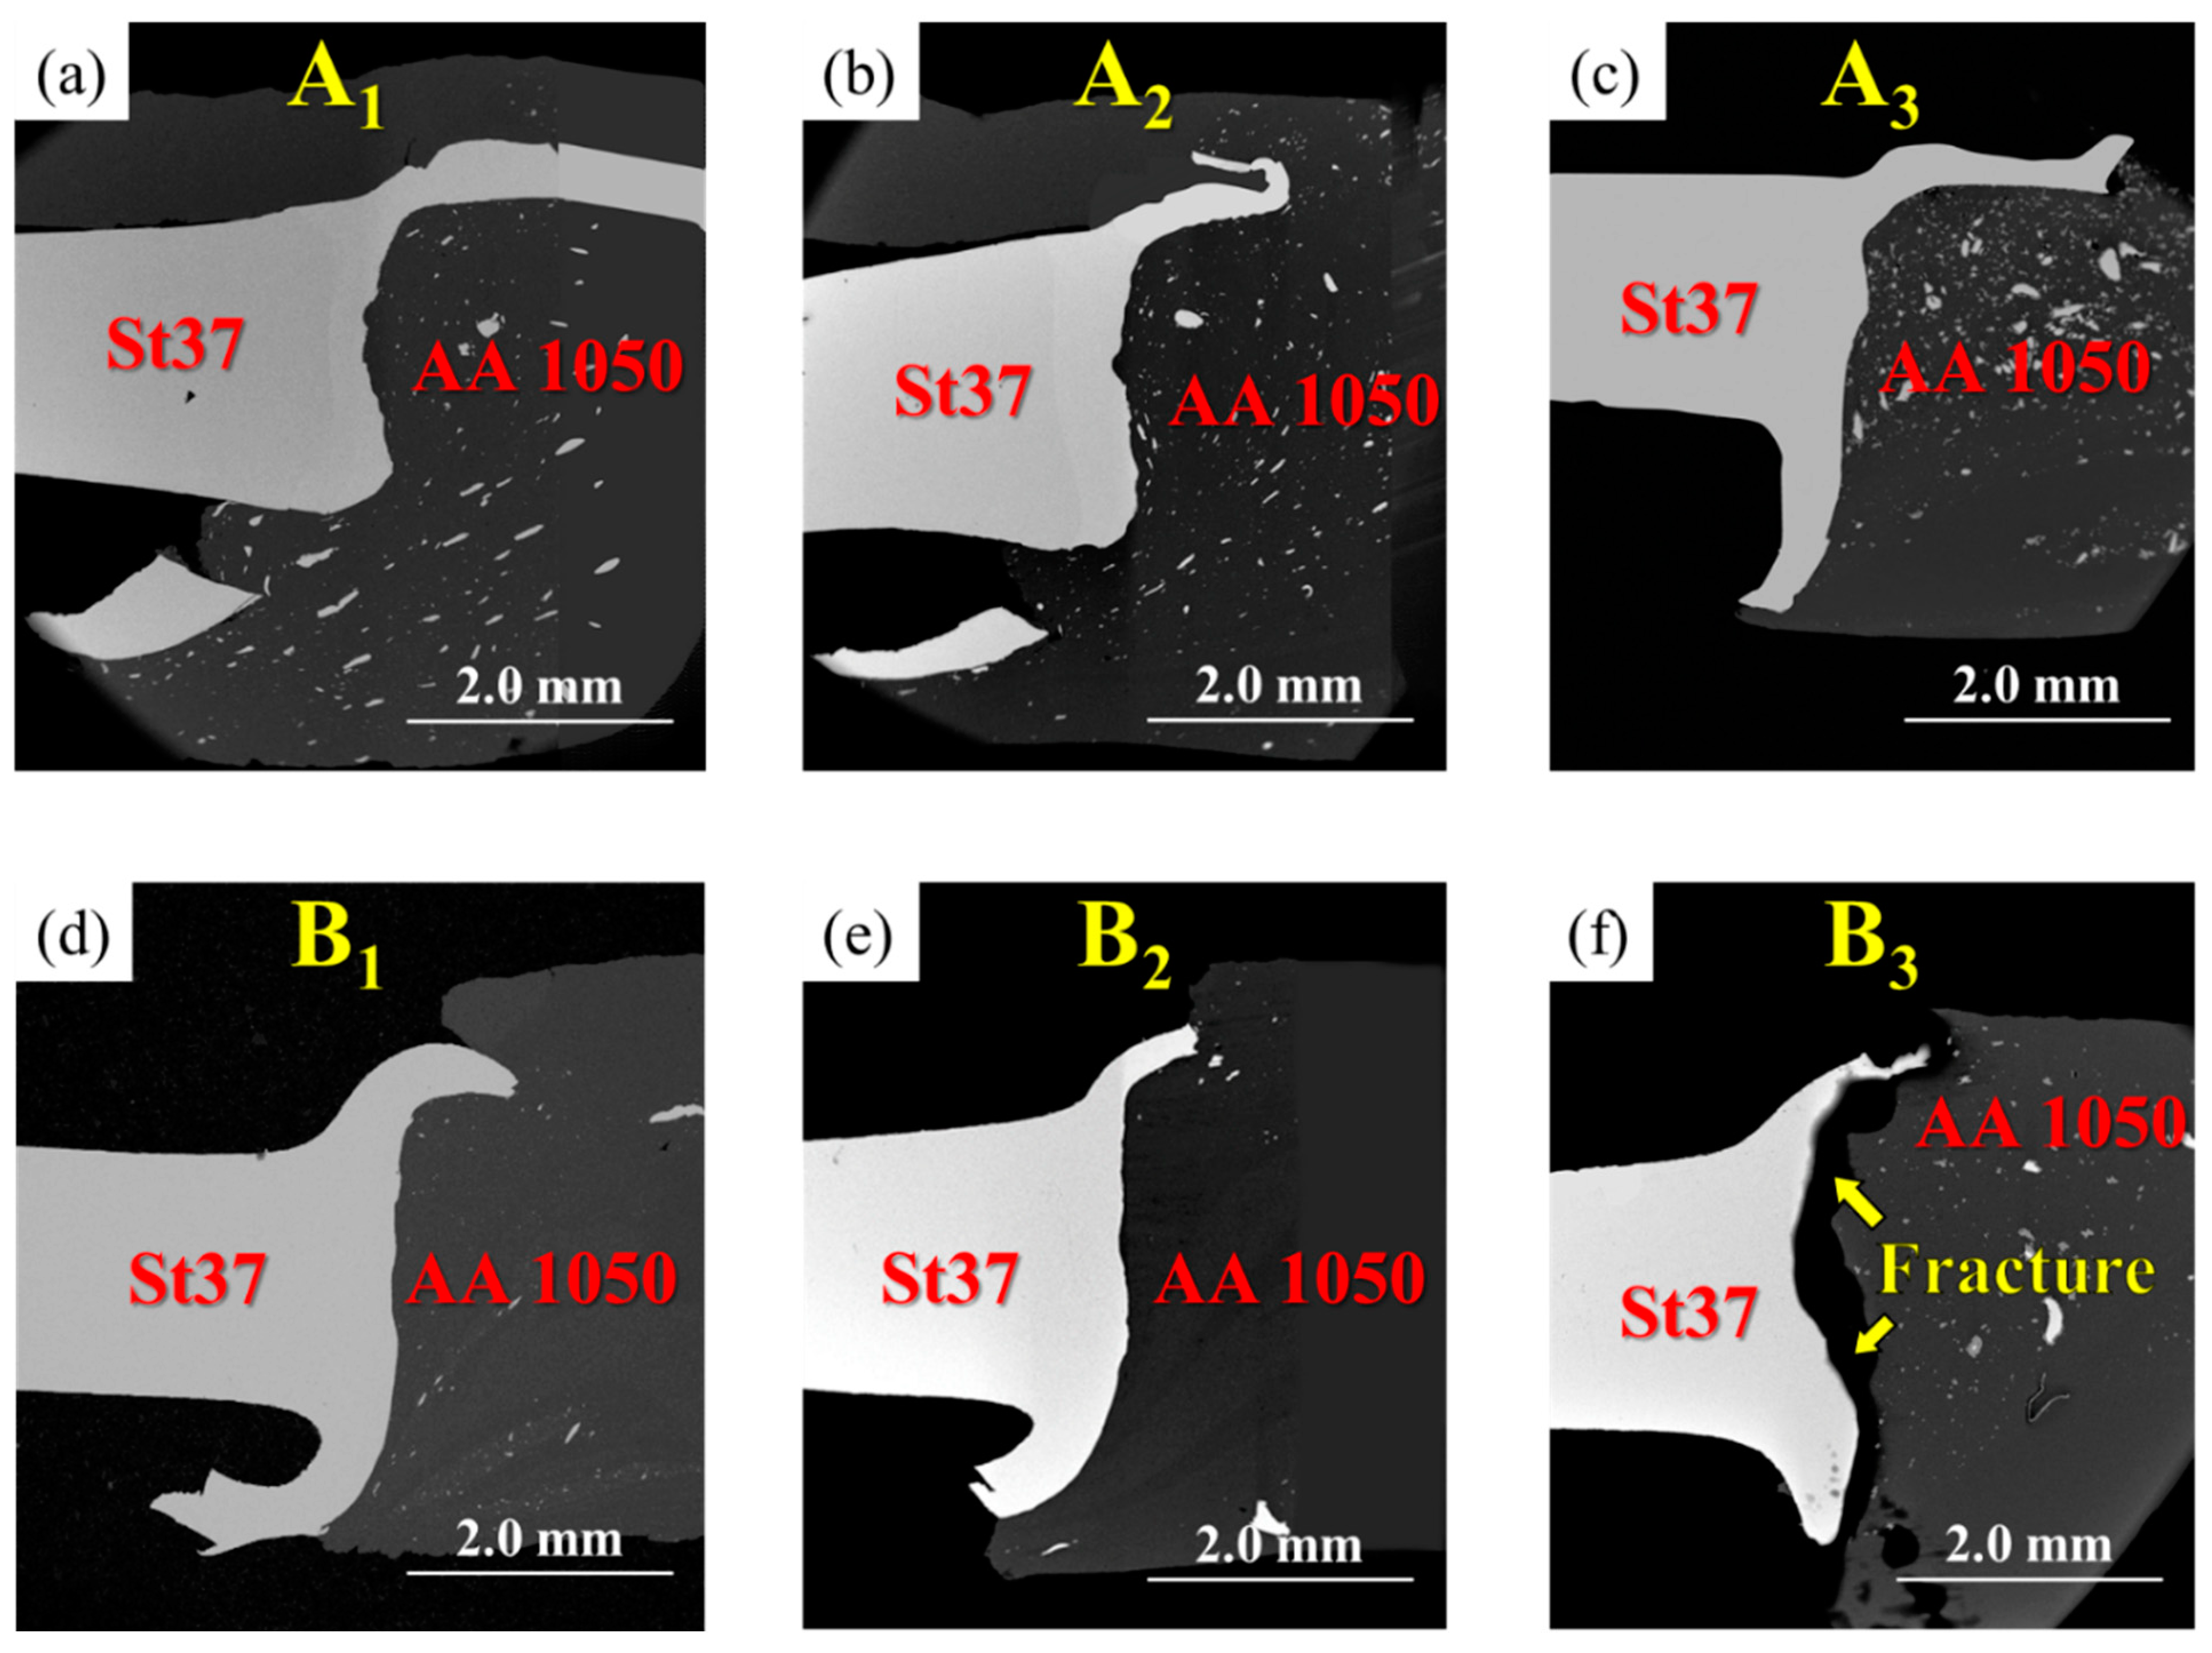
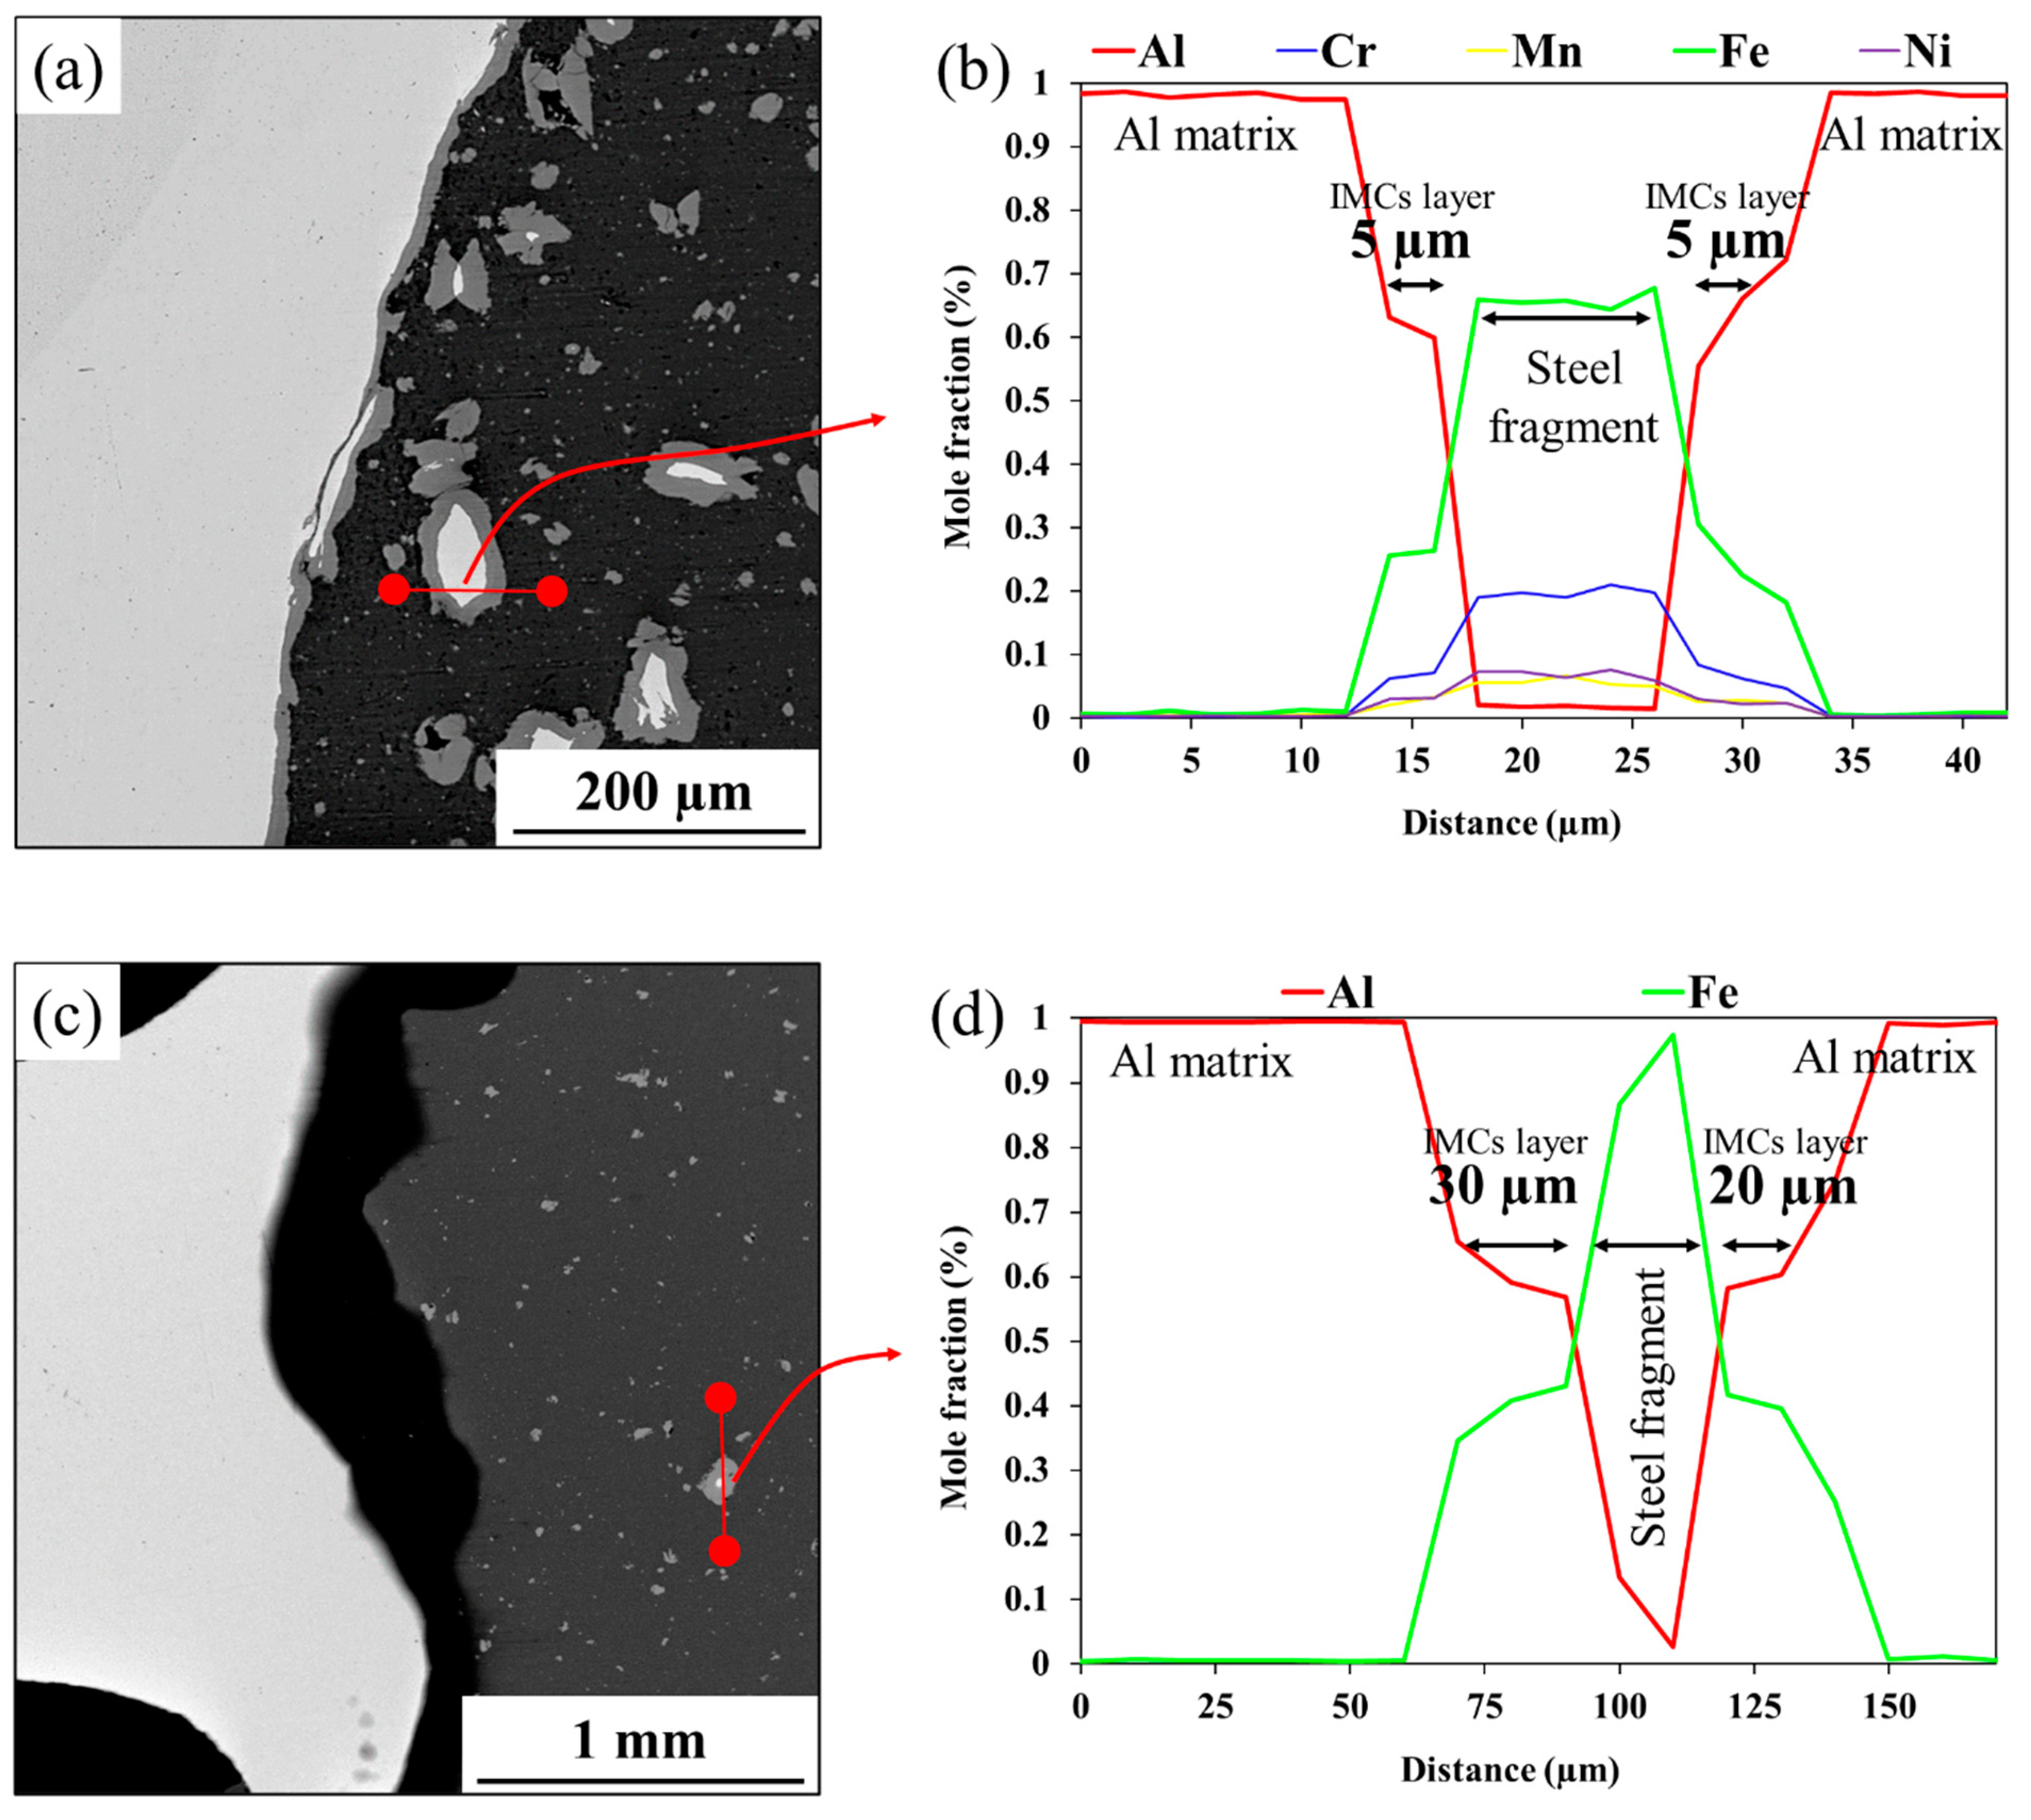
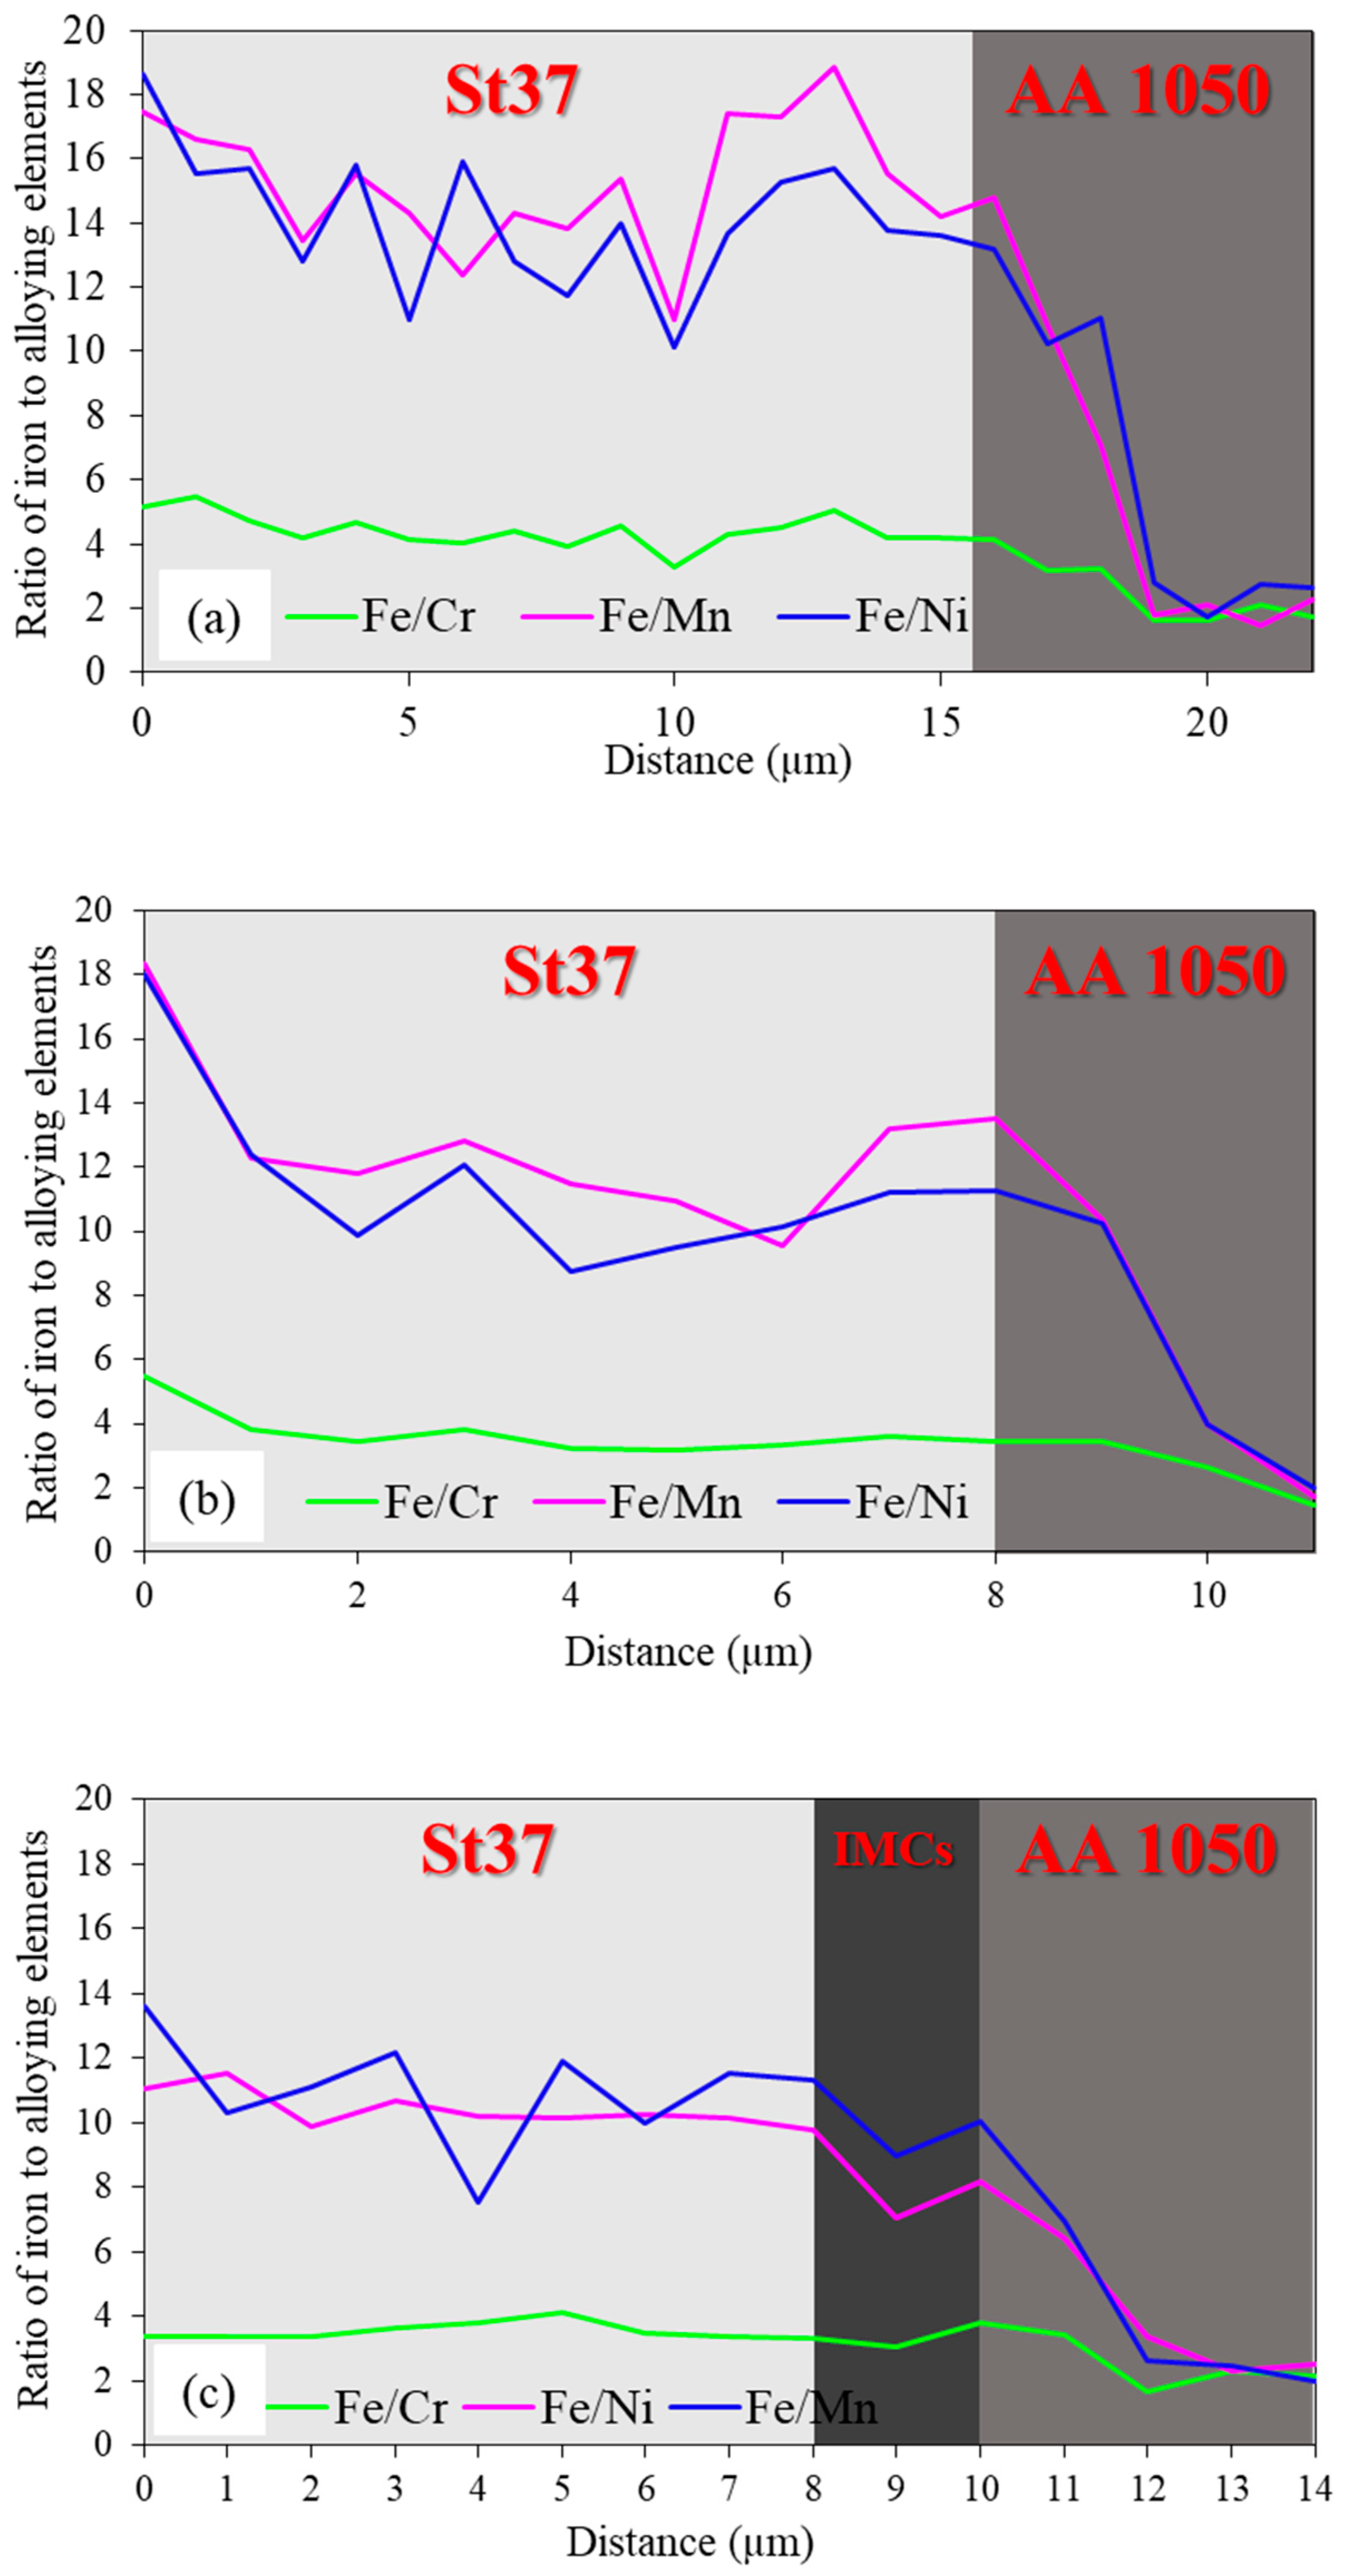
3.1. Al-St Joint Interface Microstructure
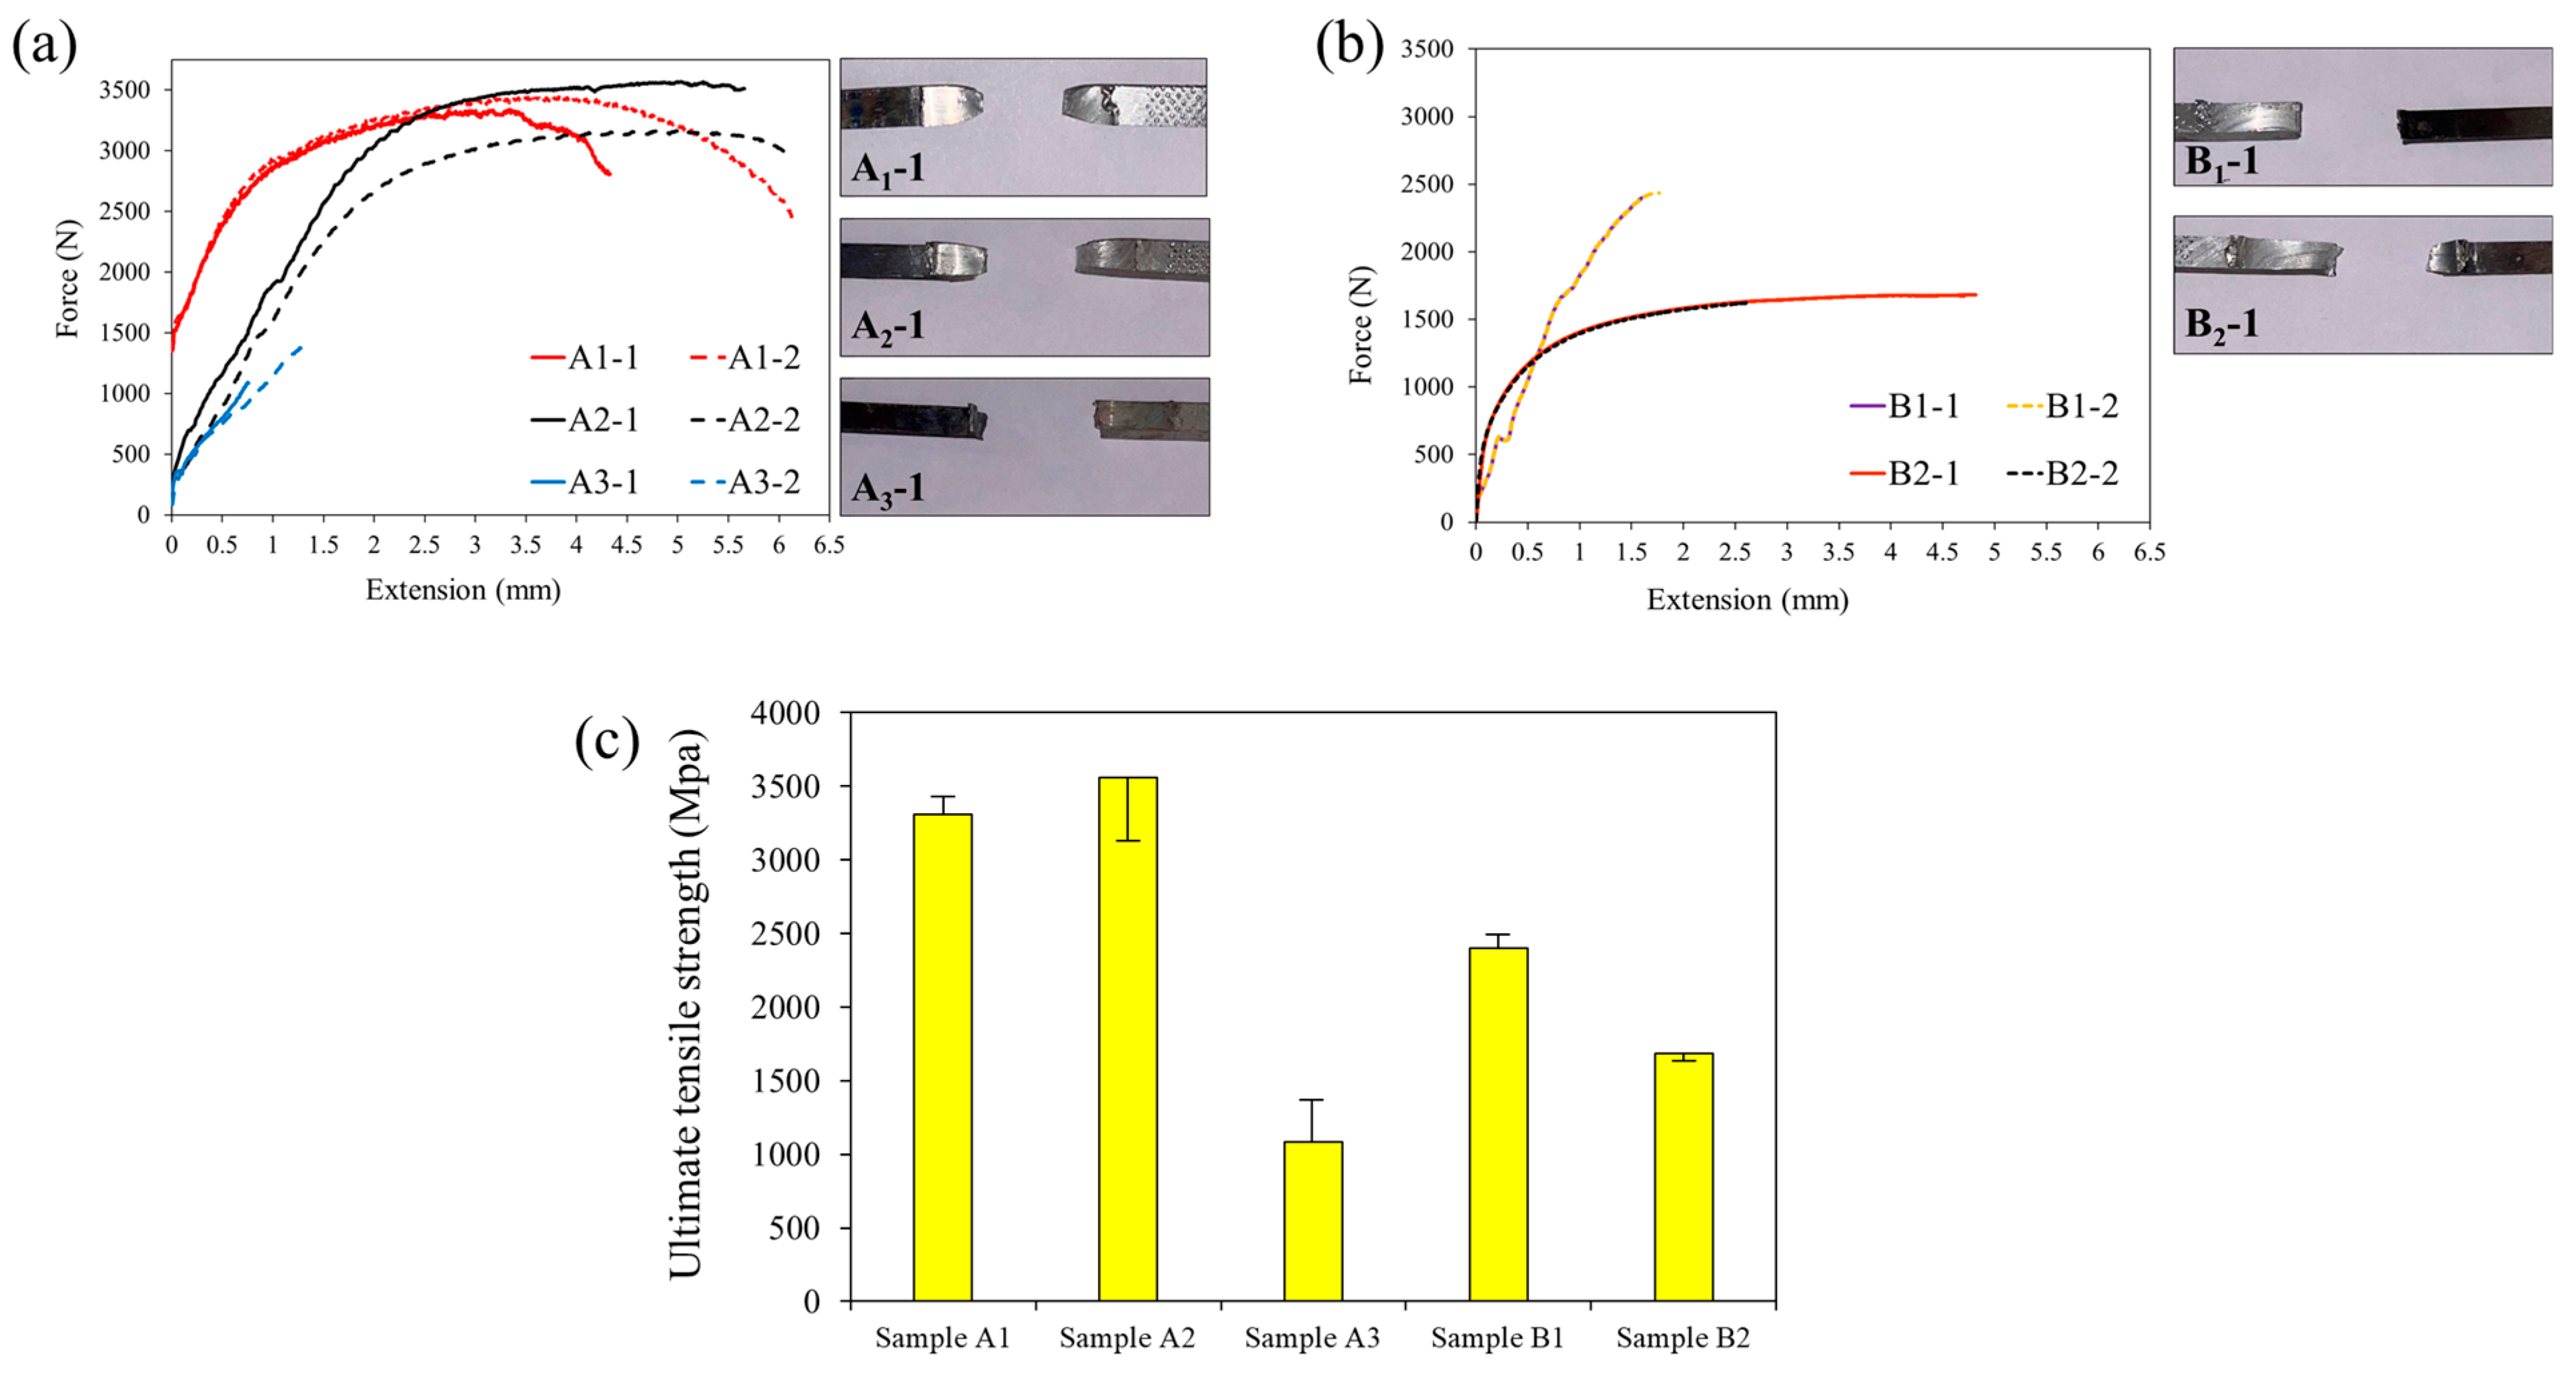
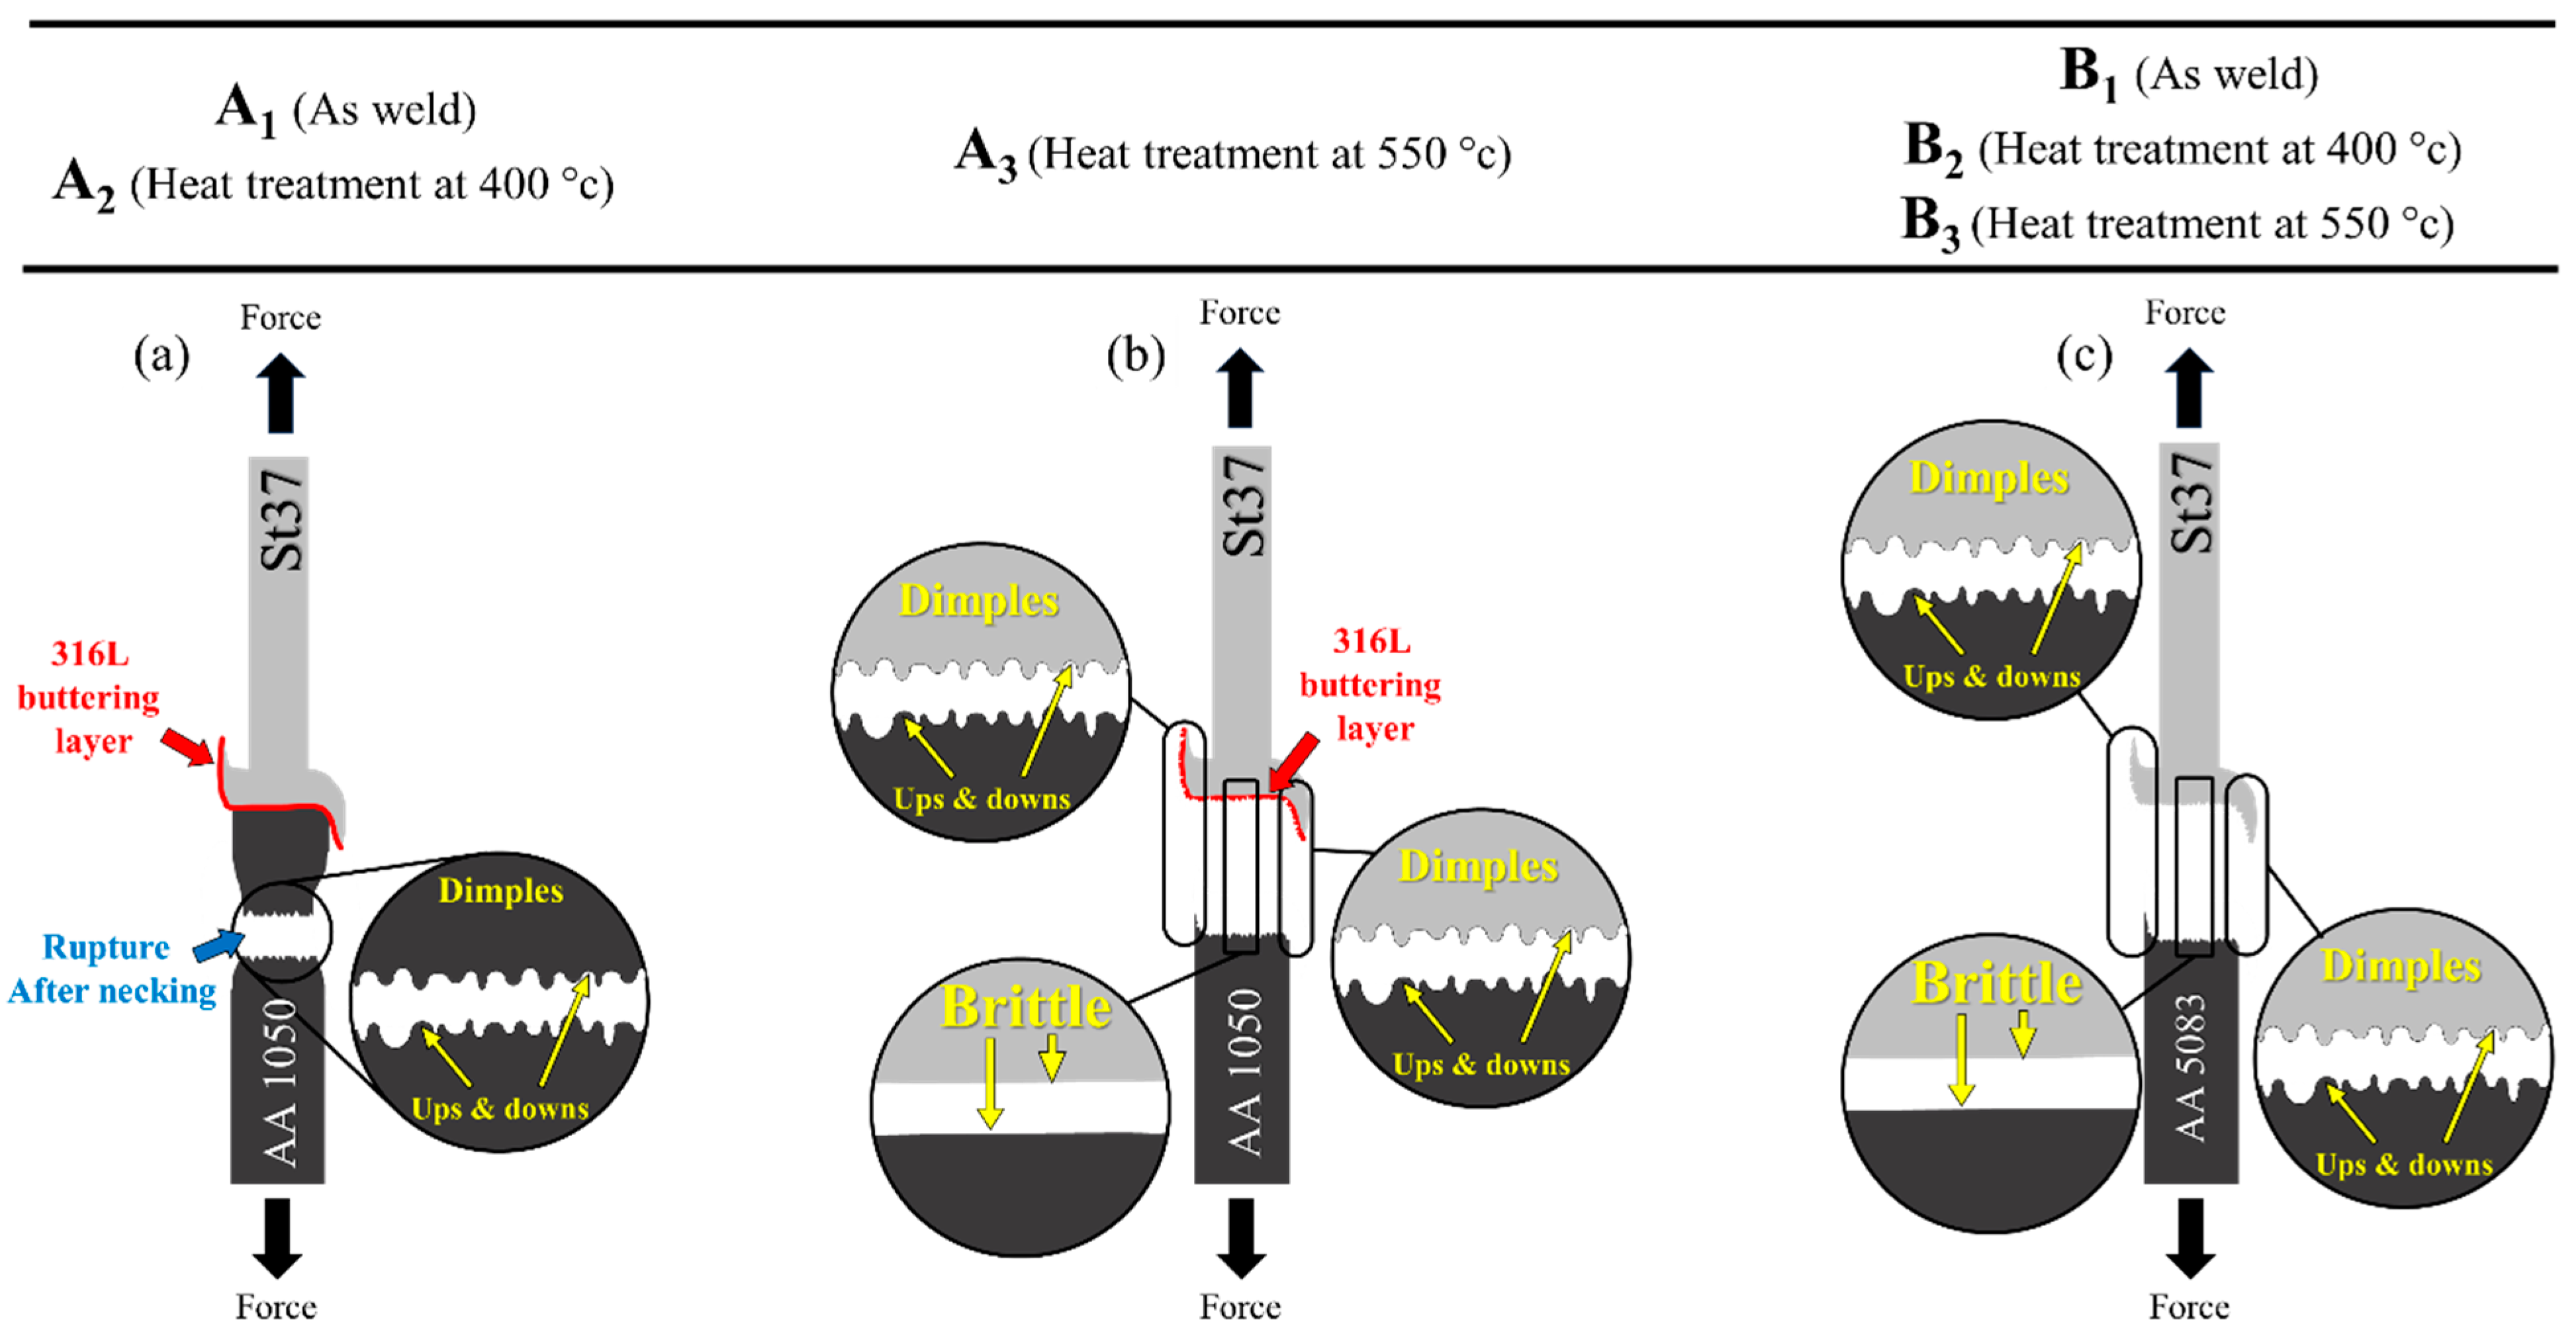
3.2. Mechanical Properties
4. Conclusions
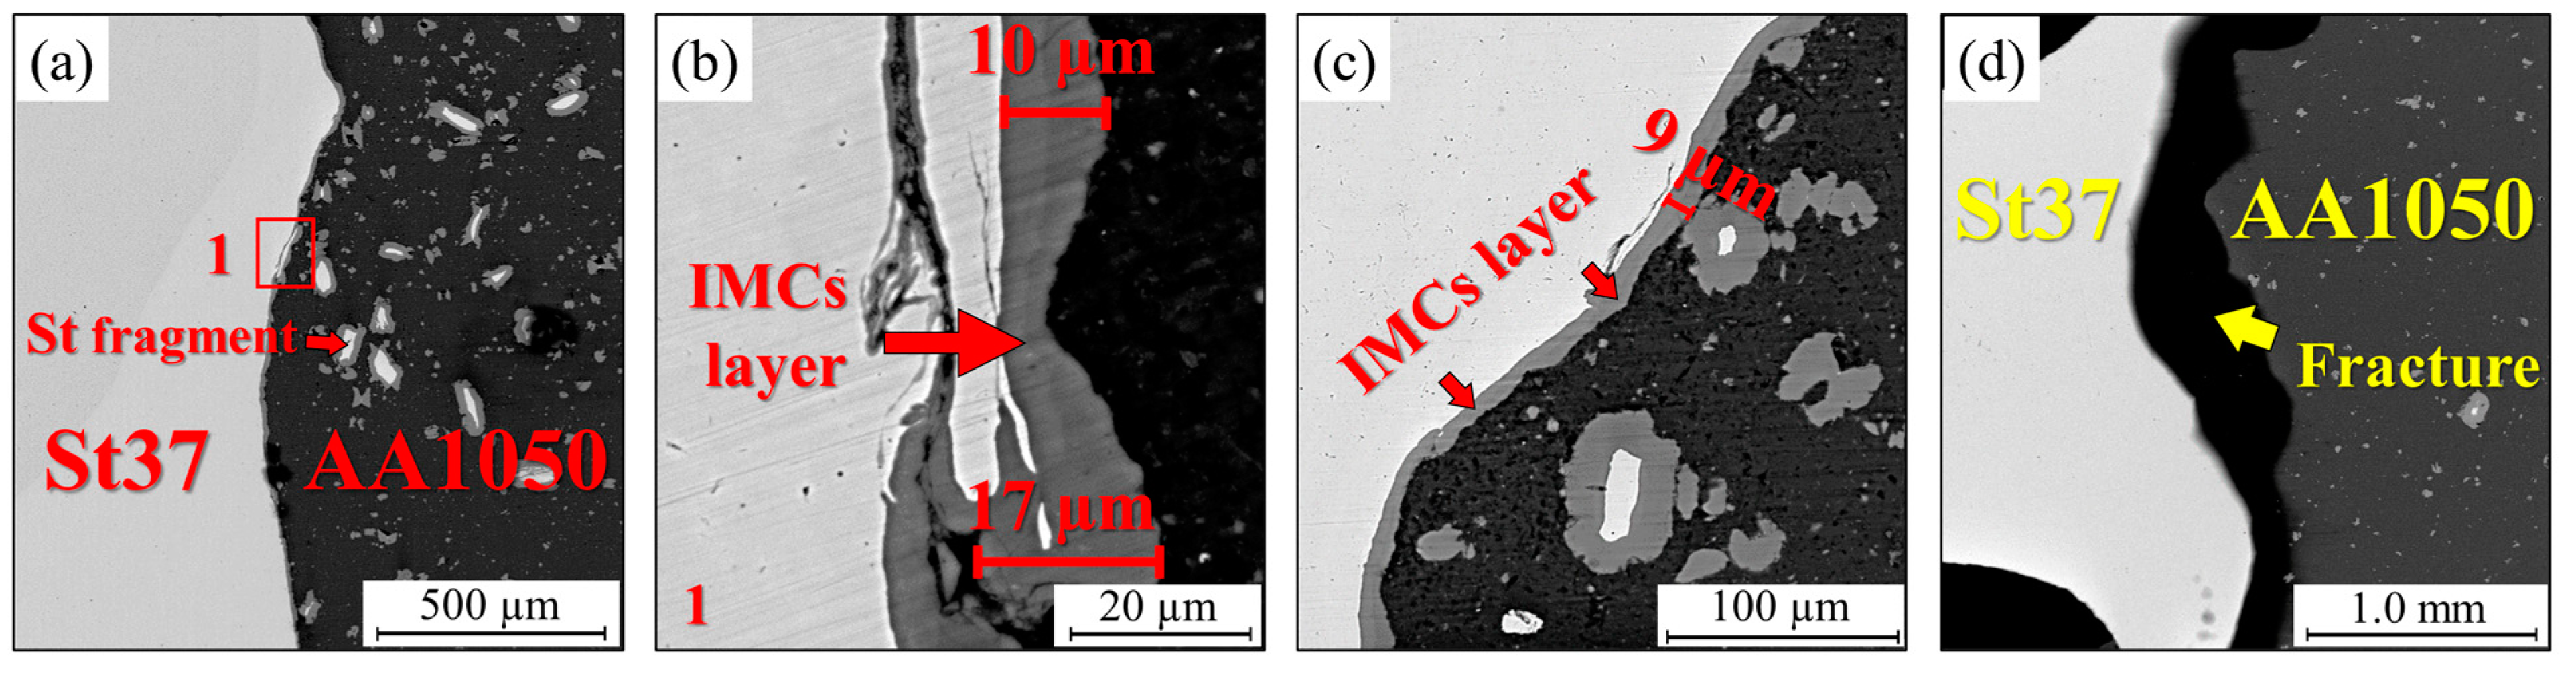
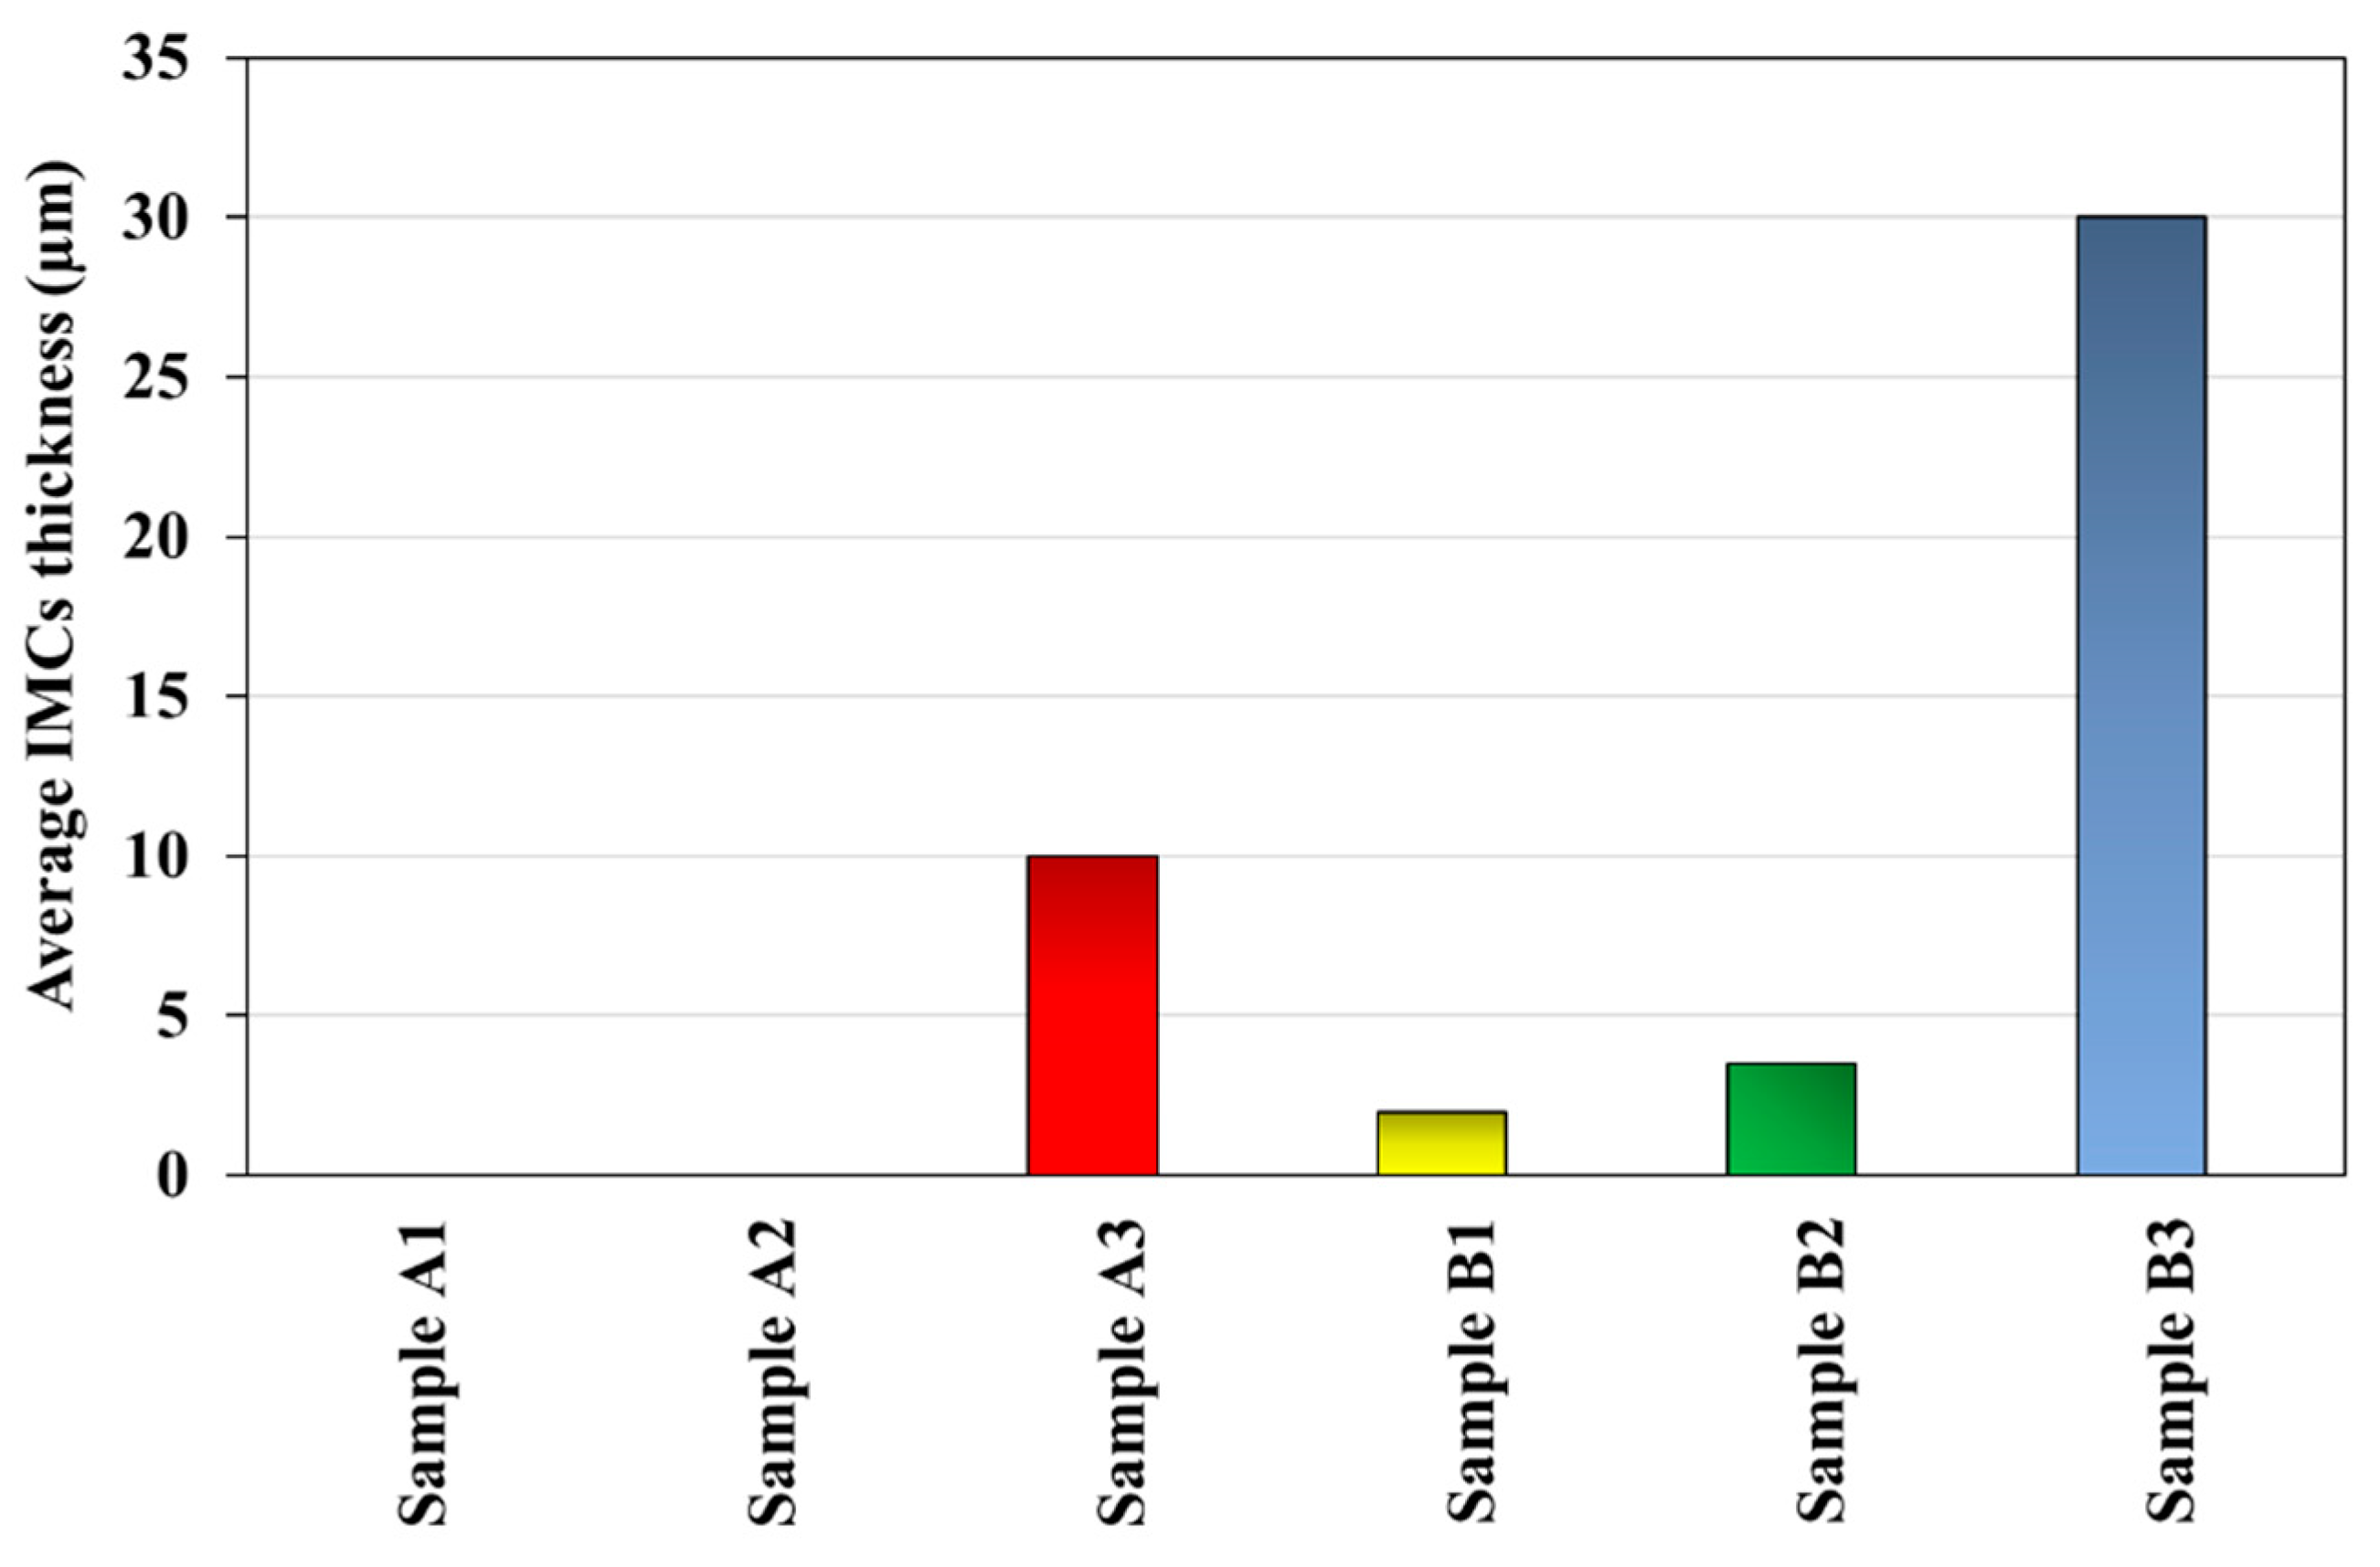
- IMC Suppression by Intermediate Layer: The intermediate layer, created by depositing the St37 faying surface with SS316L, significantly retarded IMC formation during FSW, resulting in an IMC thickness of less than 100 nm.
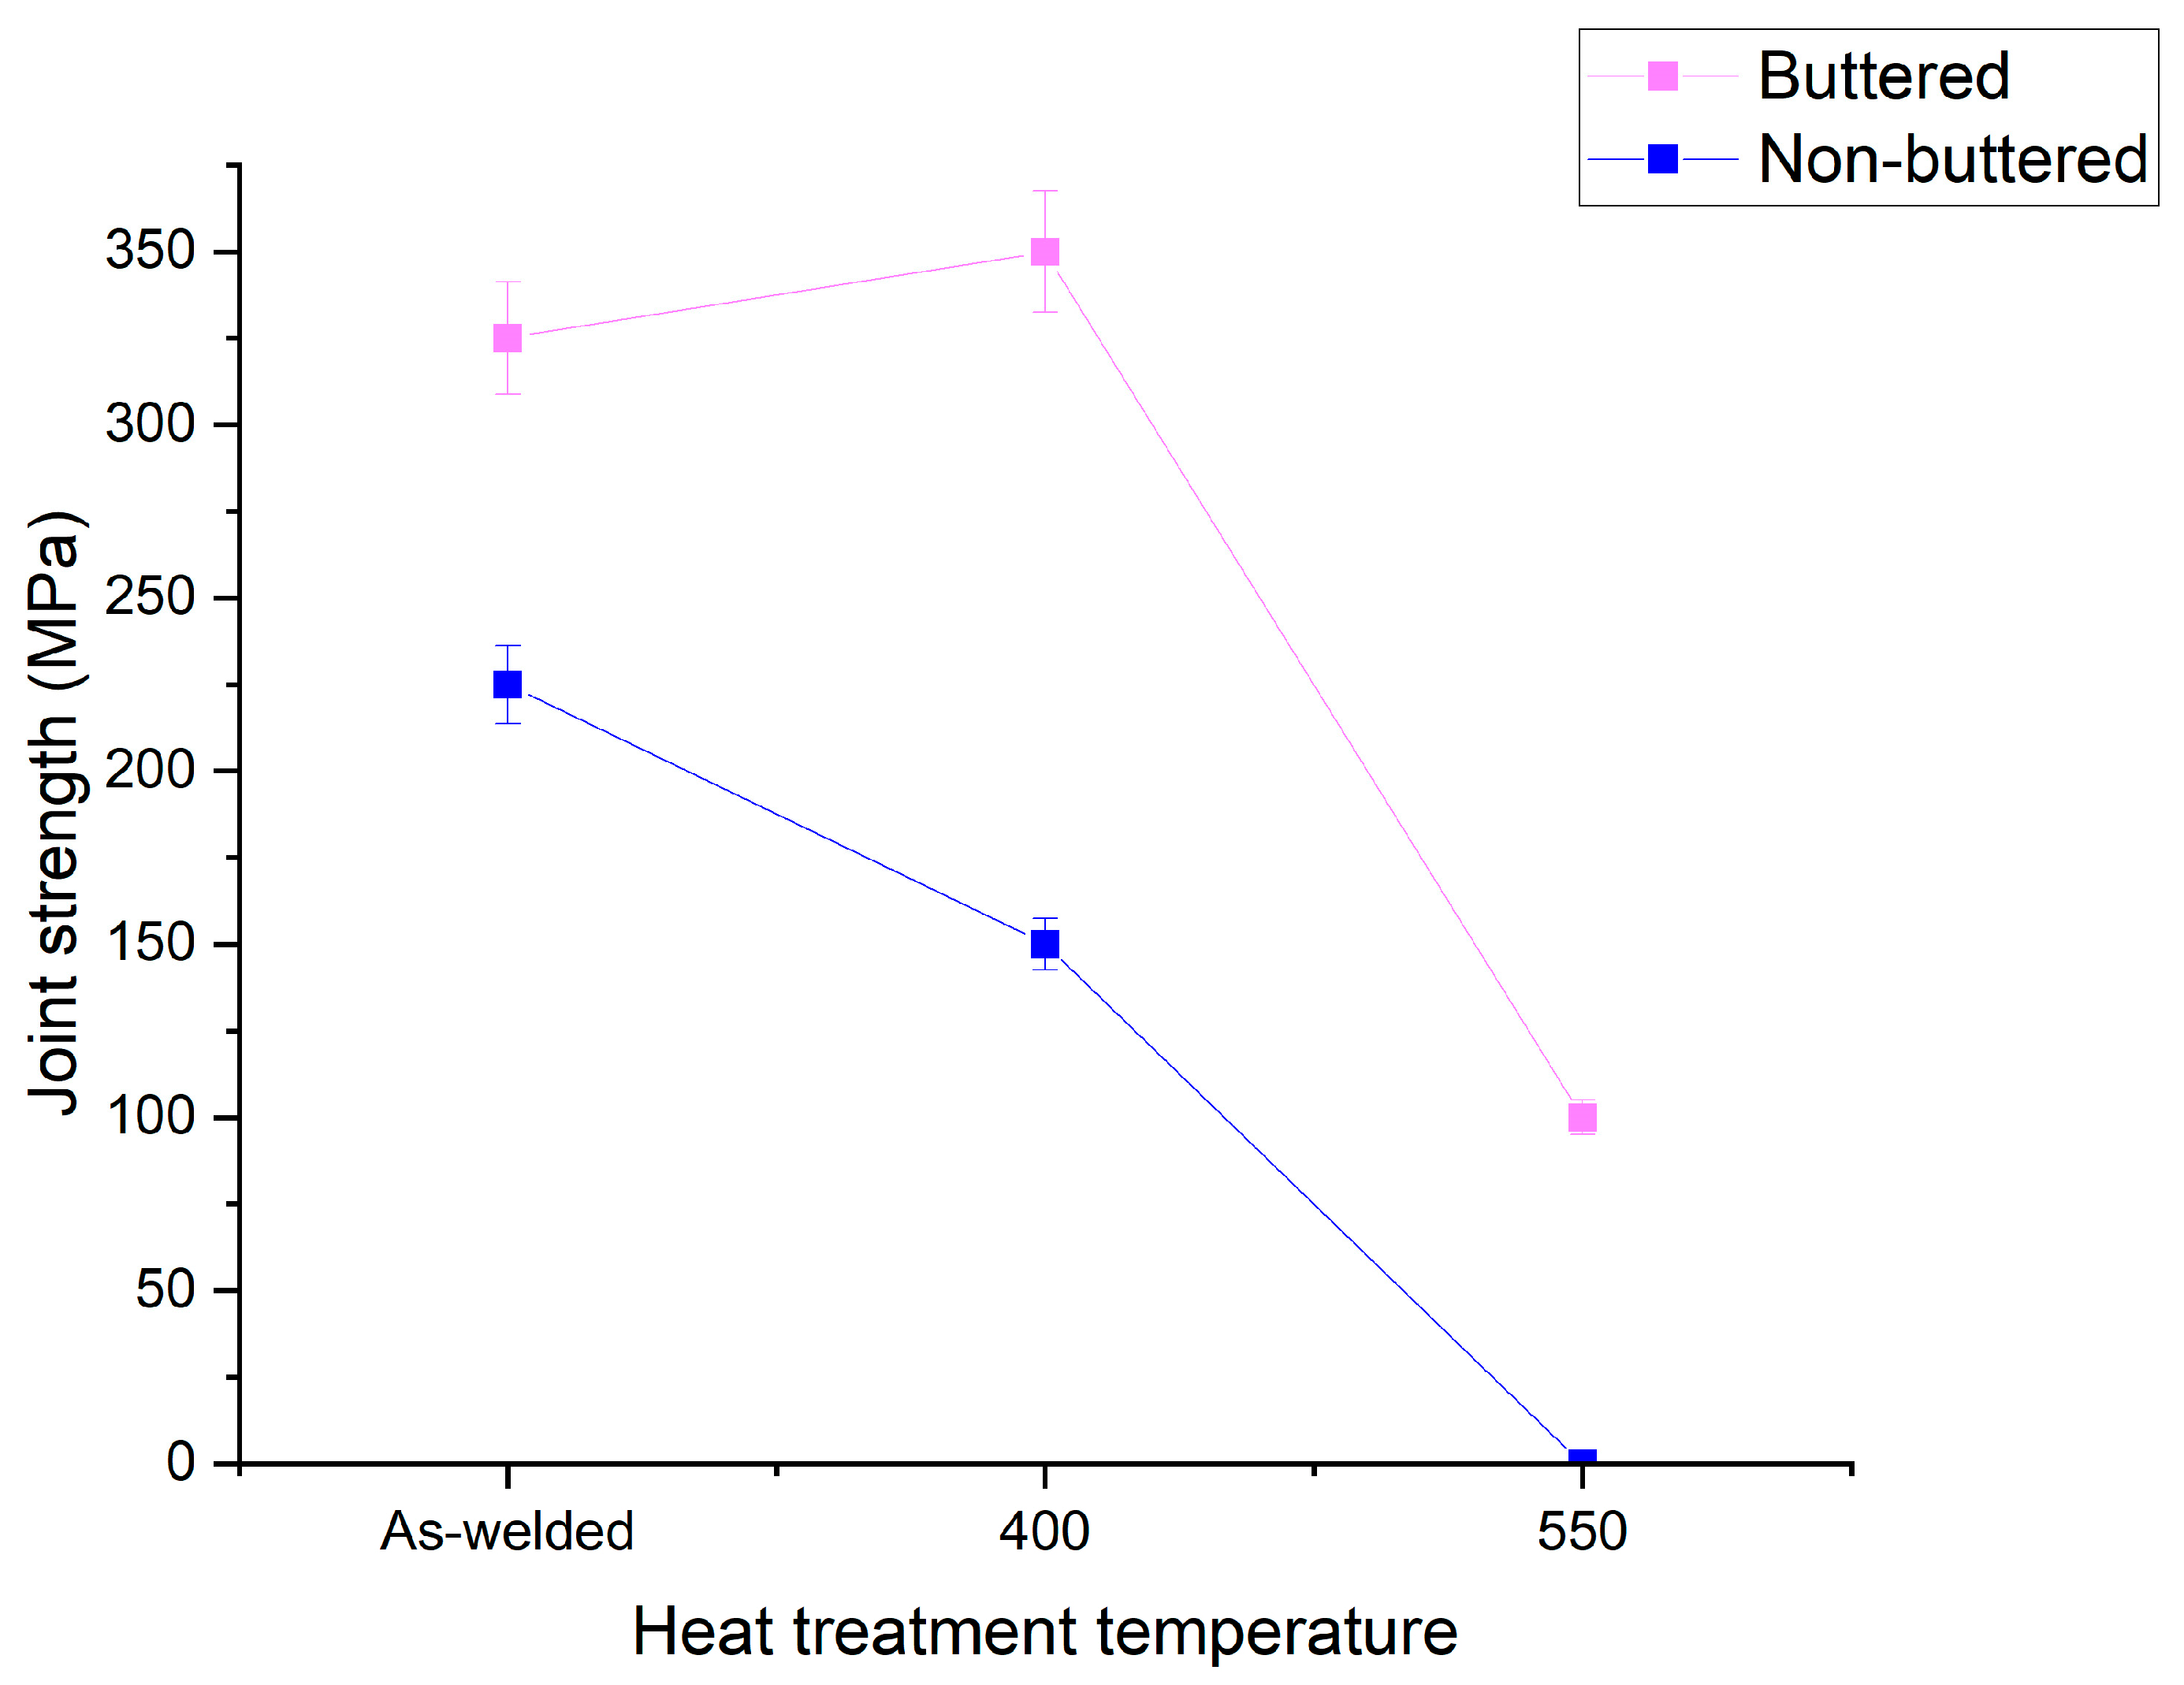
- Improved Strength at 400 °C: Annealing at 400 °C increased the strength of the joint with the intermediate layer from 325 MPa (as-welded) to 350 MPa, with no observable IMC growth. This improvement is attributed to the release of residual stresses.
- Strength Reduction in Conventional Joints: In contrast, the joint without the intermediate layer experienced a decrease in strength from 225 MPa (as-welded) to 150 MPa after annealing at 400 °C. This decline is attributed to the elimination of irregularities and protrusions in the IMC layer, which reduced its toughness.
- High-Temperature Performance at 550 °C: Heat treatment at 550 °C increased the IMC thickness in the joint with the intermediate layer to 13 µm, causing a sharp decline in strength from 350 MPa to 100 MPa. However, this strength is still significantly higher than that of the conventional joint, which lost all strength under the same conditions.
- Enhanced Thermal Durability: The use of an intermediate layer prior to FSW significantly improves the thermal durability of Al-St joints, making them safer and more reliable for high-temperature applications, even at critical temperatures above 500 °C, where conventional joints fail entirely. This is attributed to hindered diffusion rate caused by the presence of Cr and Ni in the intermediate layer.
Author Contributions
Funding
Data Availability Statement
Conflicts of Interest
References
- Boumerzoug, Z.; Helal, Y. Friction stir welding of dissimilar materials aluminum AL6061-T6 to ultra low carbon steel. Metals 2017, 7, 42. [Google Scholar] [CrossRef]
- Bahador, A.; Hamzah, E.; Mamat, M.F. Effect of filler metals on the mechanical properties of dissimilar welding of stainless steel 316L and carbon steel A516 GR 70. J. Teknol. 2015, 75. [Google Scholar] [CrossRef]
- Polmear, I.; StJohn, D.; Nie, J.-F.; Qian, M. Light Alloys: Metallurgy of the Light Metals; Butterworth-Heinemann: Oxford, UK, 2017. [Google Scholar]
- Li, J.C.-M. Microstructure and Properties of Materials; World Scientific: Singapore, 1996; Volume 2. [Google Scholar]
- Karim, M.A.; Park, Y.-D. A review on welding of dissimilar metals in car body manufacturing. J. Weld. Join. 2020, 38, 8–23. [Google Scholar] [CrossRef]
- Liyanage, T.; Kilbourne, J.; Gerlich, A.; North, T. Joint formation in dissimilar Al alloy/steel and Mg alloy/steel friction stir spot welds. Sci. Technol. Weld. Join. 2009, 14, 500–508. [Google Scholar] [CrossRef]
- Lee, C.-Y.; Choi, D.-H.; Yeon, Y.-M.; Jung, S.-B. Dissimilar friction stir spot welding of low carbon steel and Al–Mg alloy by formation of IMCs. Sci. Technol. Weld. Join. 2009, 14, 216–220. [Google Scholar] [CrossRef]
- Zhang, Z.; Chen, W.; Hu, X.; Yi, G.; Chen, B.; Wang, J.; Jiang, L.; Jiang, X.; Li, Q. Influence of temperature gradient bonding on the micromorphology and shear performance of Sn-based solder joints: Experiments and first principles calculations. J. Manuf. Process. 2024, 121, 446–460. [Google Scholar] [CrossRef]
- Singh, J.; Arora, K.S.; Shukla, D.K.; Kumar, H. Mechanical and microstructural characterization of cold metal transfer (CMT) spot aluminium-steel weld-brazed joints. Proc. Inst. Mech. Eng. Part L J. Mater. Des. Appl. 2022, 236, 2506–2515. [Google Scholar] [CrossRef]
- Wang, C.; Du, Z.; Cheng, A.; He, Z. A comparative study on self-piercing riveting and pre-holed self-piercing riveting of high-strength steel and aluminum alloy. Proc. Inst. Mech. Eng. Part L J. Mater. Des. Appl. 2024, 14644207241286111. [Google Scholar] [CrossRef]
- Liu, W.; Ma, J.; Atabaki, M.M.; Kovacevic, R. Joining of advanced high-strength steel to AA 6061 alloy by using Fe/Al structural transition joint. Mater. Des. 2015, 68, 146–157. [Google Scholar] [CrossRef]
- Singh, P.; Deepak, D.; Brar, G.S. Comparative evaluation of aluminum and stainless steel dissimilar welded joints. Mater. Today Proc. 2020, 33, 1488–1492. [Google Scholar] [CrossRef]
- Sun, Z.; Karppi, R. The application of electron beam welding for the joining of dissimilar metals: An overview. J. Mater. Process. Technol. 1996, 59, 257–267. [Google Scholar] [CrossRef]
- Barenji, A.B.; Russo, M.; Jabar, S.; Kotadia, H.; Ceglarek, D.; Ayarkwa, K.; Smith, J.; Franciosa, P. Effect of cooling rate on metallurgical and mechanical properties in continuous wave laser welding of hot-dip galvanised steel-to-aluminium sheets in a zero part-to-part gap lap joint configuration. J. Adv. Join. Process. 2025, 11, 100290. [Google Scholar] [CrossRef]
- Mishra, R.S.; Mahoney, M.W.; Sato, Y.; Hovanski, Y.; Verma, R. Friction Stir Welding and Processing VI; John Wiley & Sons: Hoboken, NJ, USA, 2011. [Google Scholar]
- Dubourg, L.; Dacheux, P. Design and properties of FSW tools: A literature review. In Proceedings of the 6th International Symposium on Friction Stir Welding, Saint-Sauveur, QC, Canada, 10–13 October 2006. [Google Scholar]
- Mishra, R.S.; Mahoney, M.; McFadden, S.; Mara, N.; Mukherjee, A. High strain rate superplasticity in a friction stir processed 7075 Al alloy. Scr. Mater. 1999, 42, 163–168. [Google Scholar] [CrossRef]
- Mishra, R.S.; Ma, Z. Friction stir welding and processing. Mater. Sci. Eng. R Rep. 2005, 50, 1–78. [Google Scholar] [CrossRef]
- Shen, Z.; Chen, Y.; Haghshenas, M.; Gerlich, A. Role of welding parameters on interfacial bonding in dissimilar steel/aluminum friction stir welds. Eng. Sci. Technol. Int. J. 2015, 18, 270–277. [Google Scholar] [CrossRef]
- Watanabe, M.; Feng, K.; Nakamura, Y.; Kumai, S. Growth manner of intermetallic compound layer produced at welding interface of friction stir spot welded aluminum/steel lap joint. Mater. Trans. 2011, 52, 953–959. [Google Scholar] [CrossRef]
- Tanaka, T.; Nezu, M.; Uchida, S.; Hirata, T. Mechanism of intermetallic compound formation during the dissimilar friction stir welding of aluminum and steel. J. Mater. Sci. 2020, 55, 3064–3072. [Google Scholar] [CrossRef]
- Ma, L.; Xu, Z.; Zhang, T.; Chen, G.; Sun, S.; Zhou, L.; Yu, M.; Song, X. In-situ formed amorphous phase in aluminum/steel friction stir welds: Interface evolution and strength improvement. J. Adv. Join. 2024, 9, 100220. [Google Scholar] [CrossRef]
- Liu, X.; Lan, S.; Ni, J. Analysis of process parameters effects on friction stir welding of dissimilar aluminum alloy to advanced high strength steel. Mater. Des. 2014, 59, 50–62. [Google Scholar] [CrossRef]
- Schmidt, H.; Hattel, J.; Wert, J. An analytical model for the heat generation in friction stir welding. Model. Simul. Mater. Sci. Eng. 2003, 12, 143. [Google Scholar] [CrossRef]
- Bozzi, S.; Helbert-Etter, A.; Baudin, T.; Criqui, B.; Kerbiguet, J. Intermetallic compounds in Al 6016/IF-steel friction stir spot welds. Mater. Sci. Eng. A 2010, 527, 4505–4509. [Google Scholar] [CrossRef]
- Coelho, R.S.; Kostka, A.; Dos Santos, J.F.; Kaysser-Pyzalla, A. Friction-stir dissimilar welding of aluminium alloy to high strength steels: Mechanical properties and their relation to microstructure. Mater. Sci. Eng. A 2012, 556, 175–183. [Google Scholar] [CrossRef]
- Pourali, M.; Abdollah-Zadeh, A.; Saeid, T.; Kargar, F. Influence of welding parameters on intermetallic compounds formation in dissimilar steel/aluminum friction stir welds. J. Alloys Compd. 2017, 715, 1–8. [Google Scholar] [CrossRef]
- Bokov, D.O.; Jawad, M.A.; Suksatan, W.; Abdullah, M.E.; Świerczyńska, A.; Fydrych, D.; Derazkola, H.A. Effect of pin shape on thermal history of aluminum-steel friction stir welded joint: Computational fluid dynamic modeling and validation. Materials 2021, 14, 7883. [Google Scholar] [CrossRef] [PubMed]
- Naseri Alenjagh, M.; Saeid, T. Microstructure and mechanical properties in dissimilar friction stir welding between aluminum 1050 and 316L stainless steel. J. Weld. Sci. Technol. Iran 2023, 9, 67–82. [Google Scholar]
- Beygi, R.; Galvão, I.; Akhavan-Safar, A.; Pouraliakbar, H.; Fallah, V.; da Silva, L.F. Effect of alloying elements on intermetallic formation during friction stir welding of dissimilar metals: A critical review on aluminum/steel. Metals 2023, 13, 768. [Google Scholar] [CrossRef]
- Beygi, R.; Carbas, R.; Barbosa, A.; Marques, E.; Da Silva, L. Buttering for FSW: Enhancing the fracture toughness of Al-Fe intermetallics through nanocrystallinity and suppressing their growth. J. Manuf. Process. 2023, 90, 233–241. [Google Scholar] [CrossRef]
- Movahedi, M.; Kokabi, A.; Reihani, S.S.; Najafi, H.; Farzadfar, S.; Cheng, W.; Wang, C. Growth kinetics of Al–Fe intermetallic compounds during annealing treatment of friction stir lap welds. Mater. Charact. 2014, 90, 121–126. [Google Scholar] [CrossRef]
- Springer, H.; Kostka, A.; Dos Santos, J.F.; Raabe, D. Influence of intermetallic phases and Kirkendall-porosity on the mechanical properties of joints between steel and aluminium alloys. Mater. Sci. Eng. A 2011, 528, 4630–4642. [Google Scholar] [CrossRef]
- Beygi, R.; Zarezadeh Mehrizi, M.; Akhavan-Safar, A.; Safaei, S.; Loureiro, A.; Da Silva, L. Design of friction stir welding for butt joining of aluminum to steel of dissimilar thickness: Heat treatment and fracture behavior. Int. J. Adv. Manuf. Technol. 2021, 112, 1951–1964. [Google Scholar] [CrossRef]
- Jindal, V.; Srivastava, V.; Das, A.; Ghosh, R. Reactive diffusion in the roll bonded iron–aluminum system. Mater. Lett. 2006, 60, 1758–1761. [Google Scholar] [CrossRef]
- Porter, D.A.; Easterling, K.E. Phase Transformations in Metals and Alloys (Revised Reprint); CRC Press: Boca Raton, FL, USA, 2009. [Google Scholar]
- Mehrer, H. Diffusion in Solids: Fundamentals, Methods, Materials, Diffusion-Controlled Processes; Springer Science & Business Media: Berlin/Heidelberg, Germany, 2007; Volume 155. [Google Scholar]
- Jönsson, B. Ferromagnetic ordering and diffusion of carbon and nitrogen in bcc Cr-Fe-Ni alloys. Int. J. Mater. Res. 1994, 85, 498–501. [Google Scholar] [CrossRef]
- Wang, L.-P.; Yang, W.; Ma, Z.-B.; Zhu, J.-H.; Li, Y.-T. First-principles study of chromium diffusion in the ferritic Fe-Cr alloy. Comput. Mater. Sci. 2020, 181, 109733. [Google Scholar] [CrossRef]
- Hirano, K.; Cohen, M.; Averbach, B. Diffusion of nickel into iron. Acta Metall. 1961, 9, 440–445. [Google Scholar] [CrossRef]
- He, H.; Zhang, L.; Liu, Z.; Zhao, W. Evolution of intermetallics between solid Fe-Cr/Fe-Ni alloys and molten aluminium. Int. J. Mech. Sci. 2023, 257, 108549. [Google Scholar] [CrossRef]


| Mo | Ni | Cr | Ti | Zn | Mg | Cu | Si | Mn | C | Al | Fe | |
| - | - | - | - | - | - | - | - | 0.25–0.4 | 0.08 | - | Bal. | St37 |
| 0.05 | 0.07 | 0.05 | 0.05 | 0.25 | 0.05 | - | Bal. | 0.4 | AA1050 | |||
| 2–3 | 10–14 | 16–18 | - | - | - | - | 1.0 | 2.0 | 0.03 | - | Bal. | 316l SS |
| Hardness (VH) | Yield Strength (Mpa) | Tensile Strength (Mpa) | ||||||||||
| 120 | 300 | 370 | St37 | |||||||||
| 41 | 85 | 100–135 | AA1050 | |||||||||
| Tool Specification | Friction Stir Welding Parameters | ||
|---|---|---|---|
| Material: | H13 tool steel | Tool rotation speed (ω): | 950 rpm |
| Tool shoulder diameter (φ): | 18 mm | Tool traverse speed (Vx): | 20 mm/min |
| Tool shoulder concavity: | 2.5° | Tool offset: | 1.3 mm to AS |
| Tool pin diameter: | 5 mm | Tool tilt angle (θ): | 2.5° |
| Tool pin length: | 4.7 mm | Pin plunge depth: | 4.8 mm |
| Pieces Name | Sample Name | Features | Time-Temperature Cycle Heat Treatment |
|---|---|---|---|
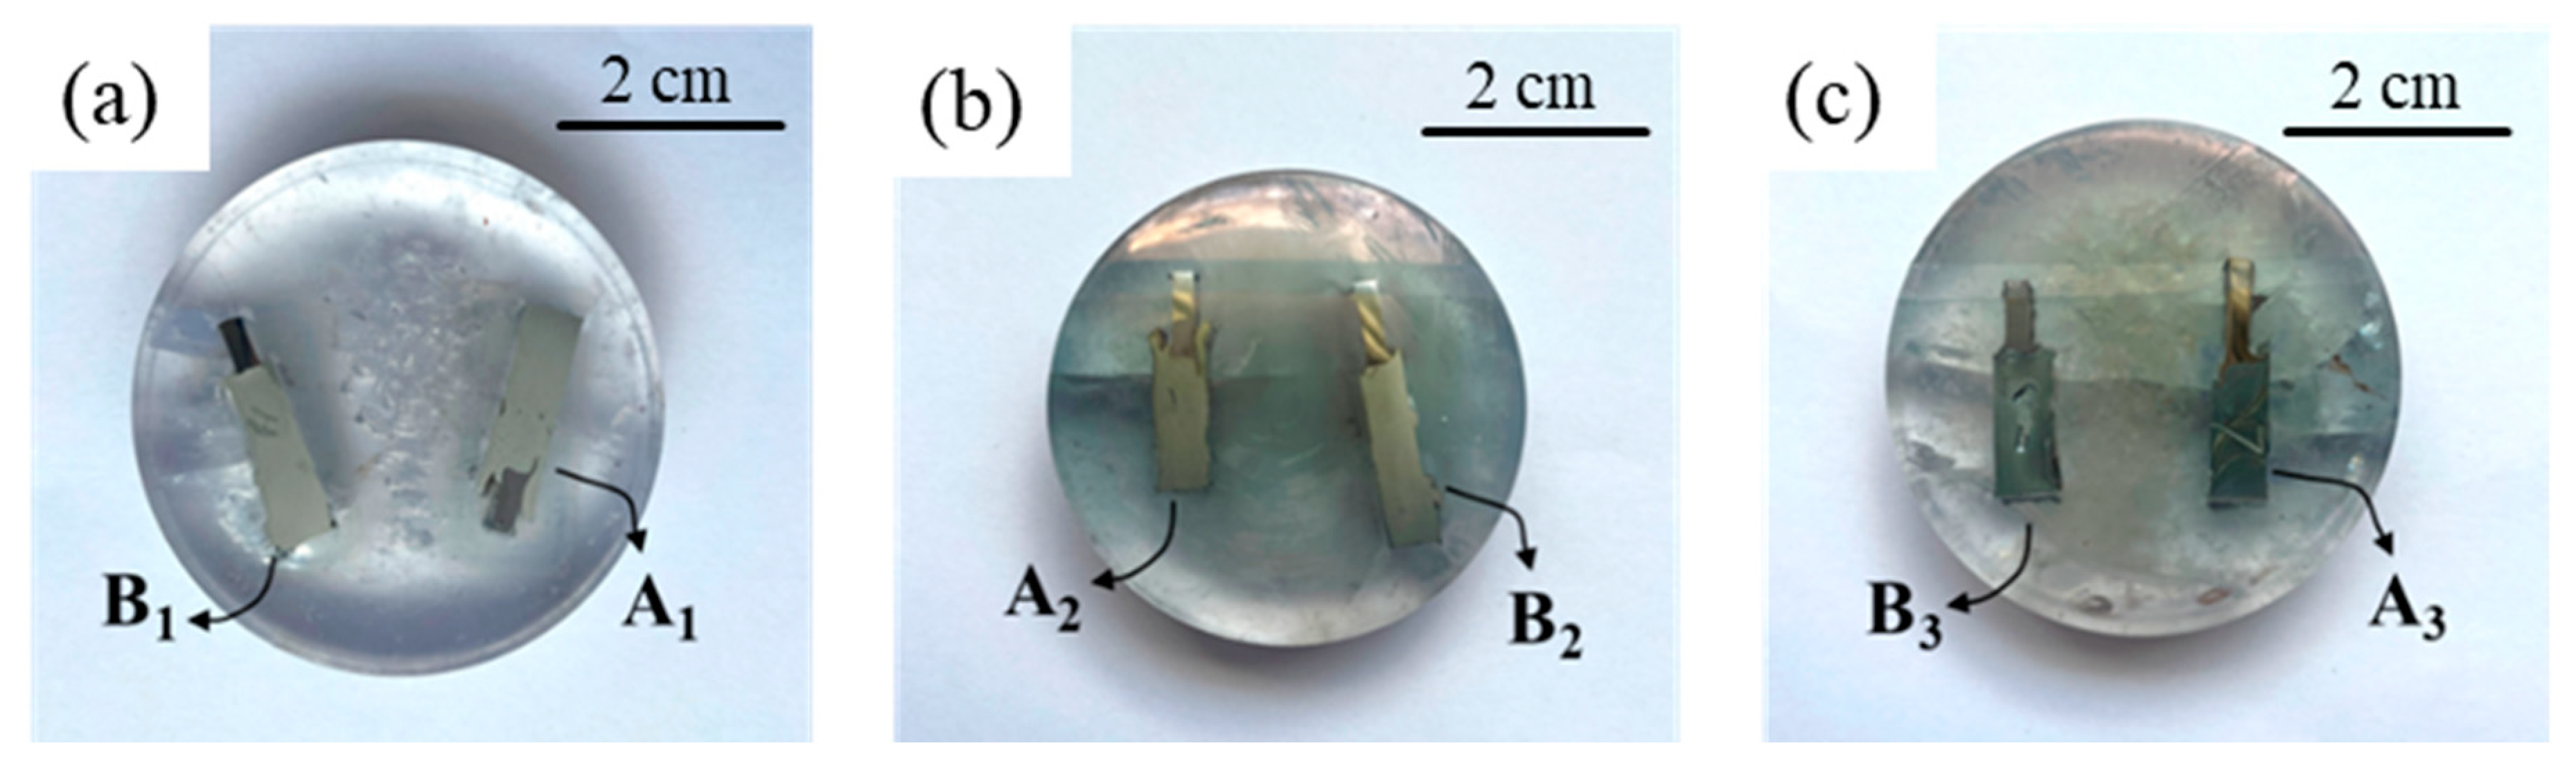
| A-series | A1 | with intermediate layer | As-welded |
| A2 | with intermediate layer | 400 °C-90 min | |
| A3 | with intermediate layer | 550 °C-90 min | |
| B-series | B1 | without intermediate layer | As-welded |
| B2 | without intermediate layer | 400 °C-90 min | |
| B3 | without intermediate layer | 550 °C-90 min |
| Sample | X (m)/IMCs Thickness | t (s)/Annealing Time | ) |
|---|---|---|---|
| A2 | 0 | 5400 (s) | 0 |
| A3 | 10 × (m) | 5400 (s) | 1.85 × |
| B2 | 3.5 × (m) | 5400 (s) | 2.26 × |
| B3 | 30 × (m) | 5400 (s) | 1.66 × |
Disclaimer/Publisher’s Note: The statements, opinions and data contained in all publications are solely those of the individual author(s) and contributor(s) and not of MDPI and/or the editor(s). MDPI and/or the editor(s) disclaim responsibility for any injury to people or property resulting from any ideas, methods, instructions or products referred to in the content. |
© 2025 by the authors. Licensee MDPI, Basel, Switzerland. This article is an open access article distributed under the terms and conditions of the Creative Commons Attribution (CC BY) license (https://creativecommons.org/licenses/by/4.0/).
Share and Cite
Bolhasani Hesari, M.; Beygi, R.; Teixeira, T.O.G.; Marques, E.A.S.; Carbas, R.J.C.; da Silva, L.F.M. Enhancing High-Temperature Durability of Aluminum/Steel Joints: The Role of Ni and Cr in Substitutional Diffusion Within Intermetallic Compounds. Metals 2025, 15, 465. https://doi.org/10.3390/met15040465
Bolhasani Hesari M, Beygi R, Teixeira TOG, Marques EAS, Carbas RJC, da Silva LFM. Enhancing High-Temperature Durability of Aluminum/Steel Joints: The Role of Ni and Cr in Substitutional Diffusion Within Intermetallic Compounds. Metals. 2025; 15(4):465. https://doi.org/10.3390/met15040465
Chicago/Turabian StyleBolhasani Hesari, Masih, Reza Beygi, Tiago O. G. Teixeira, Eduardo A. S. Marques, Ricardo J. C. Carbas, and Lucas F. M. da Silva. 2025. "Enhancing High-Temperature Durability of Aluminum/Steel Joints: The Role of Ni and Cr in Substitutional Diffusion Within Intermetallic Compounds" Metals 15, no. 4: 465. https://doi.org/10.3390/met15040465
APA StyleBolhasani Hesari, M., Beygi, R., Teixeira, T. O. G., Marques, E. A. S., Carbas, R. J. C., & da Silva, L. F. M. (2025). Enhancing High-Temperature Durability of Aluminum/Steel Joints: The Role of Ni and Cr in Substitutional Diffusion Within Intermetallic Compounds. Metals, 15(4), 465. https://doi.org/10.3390/met15040465