Article

Effect of Cooling Rate on Microstructure Evolution and Mechanical Properties of SCM435 Steel

1
Metallurgical Technology Institute, Central Iron and Steel Research Institute, Beijing 100081, China
2
Hebei Xinggang Technology Co., Ltd., Xingtai 054027, China
3
Xingtai Iron and Steel Co., Ltd., Xingtai 054027, China
4
School of Material Science and Engineering, Hebei University of Science and Technology, Shijiazhuang 050018, China
5
Hebei Key Laboratory of Material Near-Net Forming Technology, Shijiazhuang 050018, China
6
Hebei Engineering Laboratory of Aviation Lightweight Composite Materials and Processing Technology, Shijiazhuang 050018, China
7
Hebei Institute of Mechanical and Electrical Technology, Xingtai 054000, China
*
Authors to whom correspondence should be addressed.
Metals 2024, 14(2), 140; https://doi.org/10.3390/met14020140
Submission received: 6 December 2023 / Revised: 3 January 2024 / Accepted: 19 January 2024 / Published: 24 January 2024
(This article belongs to the Special Issue Design and Development of High-Strength Low-Alloy Steels)

Abstract

:
The microstructural evolution of SCM435 cold heading steel at different cooling rates was investigated by means of scanning electron microscopy, TEM, XRD, and electron backscatter diffraction. The results show that the cooling rate has a significant effect on the microstructure of the experimental steel. With an acceleration in the cooling, the microstructure of the steel gradually changed from ferrite and pearlite to ferrite, pearlite, and granular bainite; finally, the pearlite disappeared, and the microstructure changed to acicular ferrite, bainite, and martensite. With an increase in the cooling rate, the morphology of the carbide underwent an evolution from sheet carbide to short-rod carbide, granular carbide, and ultimately thin-strip carbide. With the acceleration in cooling, the proportion of large-angle grain boundaries gradually decreased, and the area of small-angle grain boundaries gradually increased. When the cooling rate was 0.1 °C/s, the proportion of large-angle grain boundaries was as high as 52.8%, and the dislocation density was only 1.91 × 1012 cm−2. When the cooling rate was 2.0 °C/s, the proportion of large-angle grain boundaries was only 27.1%, and the dislocation density increased to 5.38 × 1012 cm−2. With the increase in the cooling rate, the depth of the decarbonization layer and the thickness of the scale oxide gradually decreased, the proportion of the FeO phase in the scale phase gradually decreased, and the proportion of the Fe3O4 phase and Fe2O3 phase gradually increased. The tensile strength increased monotonously with the increase in cooling rate, whereas the elongation and area reduction first decreased, then increased, and then decreased. When the cooling rate was 1.0 m/s, the short rod and granular bainite in the material structure endowed the SCM435 steel with excellent strength and toughness matching, and the tensile strength and elongation of the steel reached 895 MPa and 24%, respectively.

1. Introduction

Cr–Mo microalloyed high-strength fasteners are being used more frequently, and they are commonly used as 10.9–12.9 high-strength bolts [1,2,3,4] through the complete solid solution of Cr and Mo in ferrite, improving its strength [5] without reducing its plasticity, and can inhibit the precipitation of carbide in the tempering process of steel. Thus, it is advantageous to use a tempering method as a heat treatment [6,7,8]. In our test steel, chromium is mainly used to improve its strength and maintain its toughness after tempering. Moreover, molybdenum (Mo) improves the hardenability and thermal strength of steel to prevent tempering brittleness. Mo can make parts with large sections deeper and quenched. Mo improves the tempering resistance or tempering stability of steel so that parts can be tempered at higher temperatures to eliminate (or reduce) residual stress and effectively improve plasticity [9,10,11].
The goal of controlled rolling and controlled cooling technology for high-strength cold heading steel is to obtain a material microstructure and mechanical properties that meet the various needs of deep processing [12,13,14]. In particular, the cooling rate of high-strength cold heading steel determines its physical quality: the material phase composition, grain orientation, dislocation distribution, and physical properties [15,16]. Therefore, our study on the effect of the cooling rate on the laws of structure evolution aims to propose a high-quality, strong-plastic-matching control process for cooling, reveal the regulation law for the microstructural properties of high-strength cold heading steel during cooling, build a theoretical system for the strength and toughness of high-strength cold heading steel, and establish a combined mechanism model for strength and toughness.
In the process of controlling rolling and controlled cooling to ensure the toughness of materials, the decarburization and oxidation state of steel are often overlooked. Firstly, the decarburization and oxidation behavior of steel are inevitable during the heating and cooling processes, and they are influenced by multiple factors such as composition, temperature, and cooling rate, making it extremely complex [17,18,19]. However, there are rare reports considering the influence of the cooling rate on surface decarburization and oxidation behavior in theory, both domestically and internationally [20,21]. Therefore, achieving a balance between the internal structure toughness of high-strength cold heading steel and the surface decarburization and oxidation matching is the main research objective of this paper.

2. Materials and Methods

The chemical composition of SCM435 is shown in Table 1. Its smelting process was as follows: 80t converter smelting, ladle furnace refining, Ruhrstahl Hausen vacuum degassing, and continuous casting under dynamic light reduction to 280 mm × 325 mm. The rectangular billet became a square billet sized 160 mm × 160 mm after nine bloom passes. This process was carried out on the industrial production line of a high-speed wire rod mill.
In the industrial production line of a high-speed wire rolling mill, a square billet of 160 mm × 160 mm was heated in a regenerative heating furnace at 1100 °C and then held for 120 min after six rough rolling, eight medium rolling, four prefinishing, eight finishing, and four reduced diameter rolling passes. After spinning, a Stelmor cooling line (length = 110 m) was slowly cooled. The design of the rolling process is shown in Table 2. The cooling rate is achieved by adjusting the fan speed under the Stelmor cooling line and the number of open insulation covers on the Stelmor cooling line.
The sample was cut from a hot-rolled wire rod. After the metallographic sample was ground and polished in the vertical direction, the sample was etched for 10 s with 4% HNO3 + 96% C2H5OH (volume fraction, the same below) solution, and then the tissue was observed through a JSM-5610LV scanning electron microscope (JEOL Ltd., Tokyo, Japan). The fine structure was observed through a JEM-2010 transmission electron microscope (JEOL Ltd., Tokyo, Japan). XRD was used to detect the diffraction peak. A classical empirical formula was used to calculate the diffraction parameters, where the scanning area was set to 15 mm × 10 mm, the scanning voltage was set to 40 kV, the current was set to 40 mA, the X-ray diffraction step was set to 0.02°, and the range of the scanning angle for the diffraction peak was 20° (2θ)–120° (2θ). The electron backscatter diffraction (EBSD) system module (Oxford symmetry, Oxford Instruments, Abingdon, UK) installed in the Zeiss Gemini scanning electron microscope (Carl Zeiss AG, Jena, Germany) was used to measure the effective grain size, crystallographic orientation, grain boundary distribution, and phase structure of the oxide in the experimental steel under different conditions. We used an EBSD scan step of 0.1 μm. According to the requirements of GB/T228, a tensile sample was intercepted along the rolling direction, and tensile testing was carried out using a WAW500 universal tensile testing machine at room temperature.

3. Experimental Results and Discussion
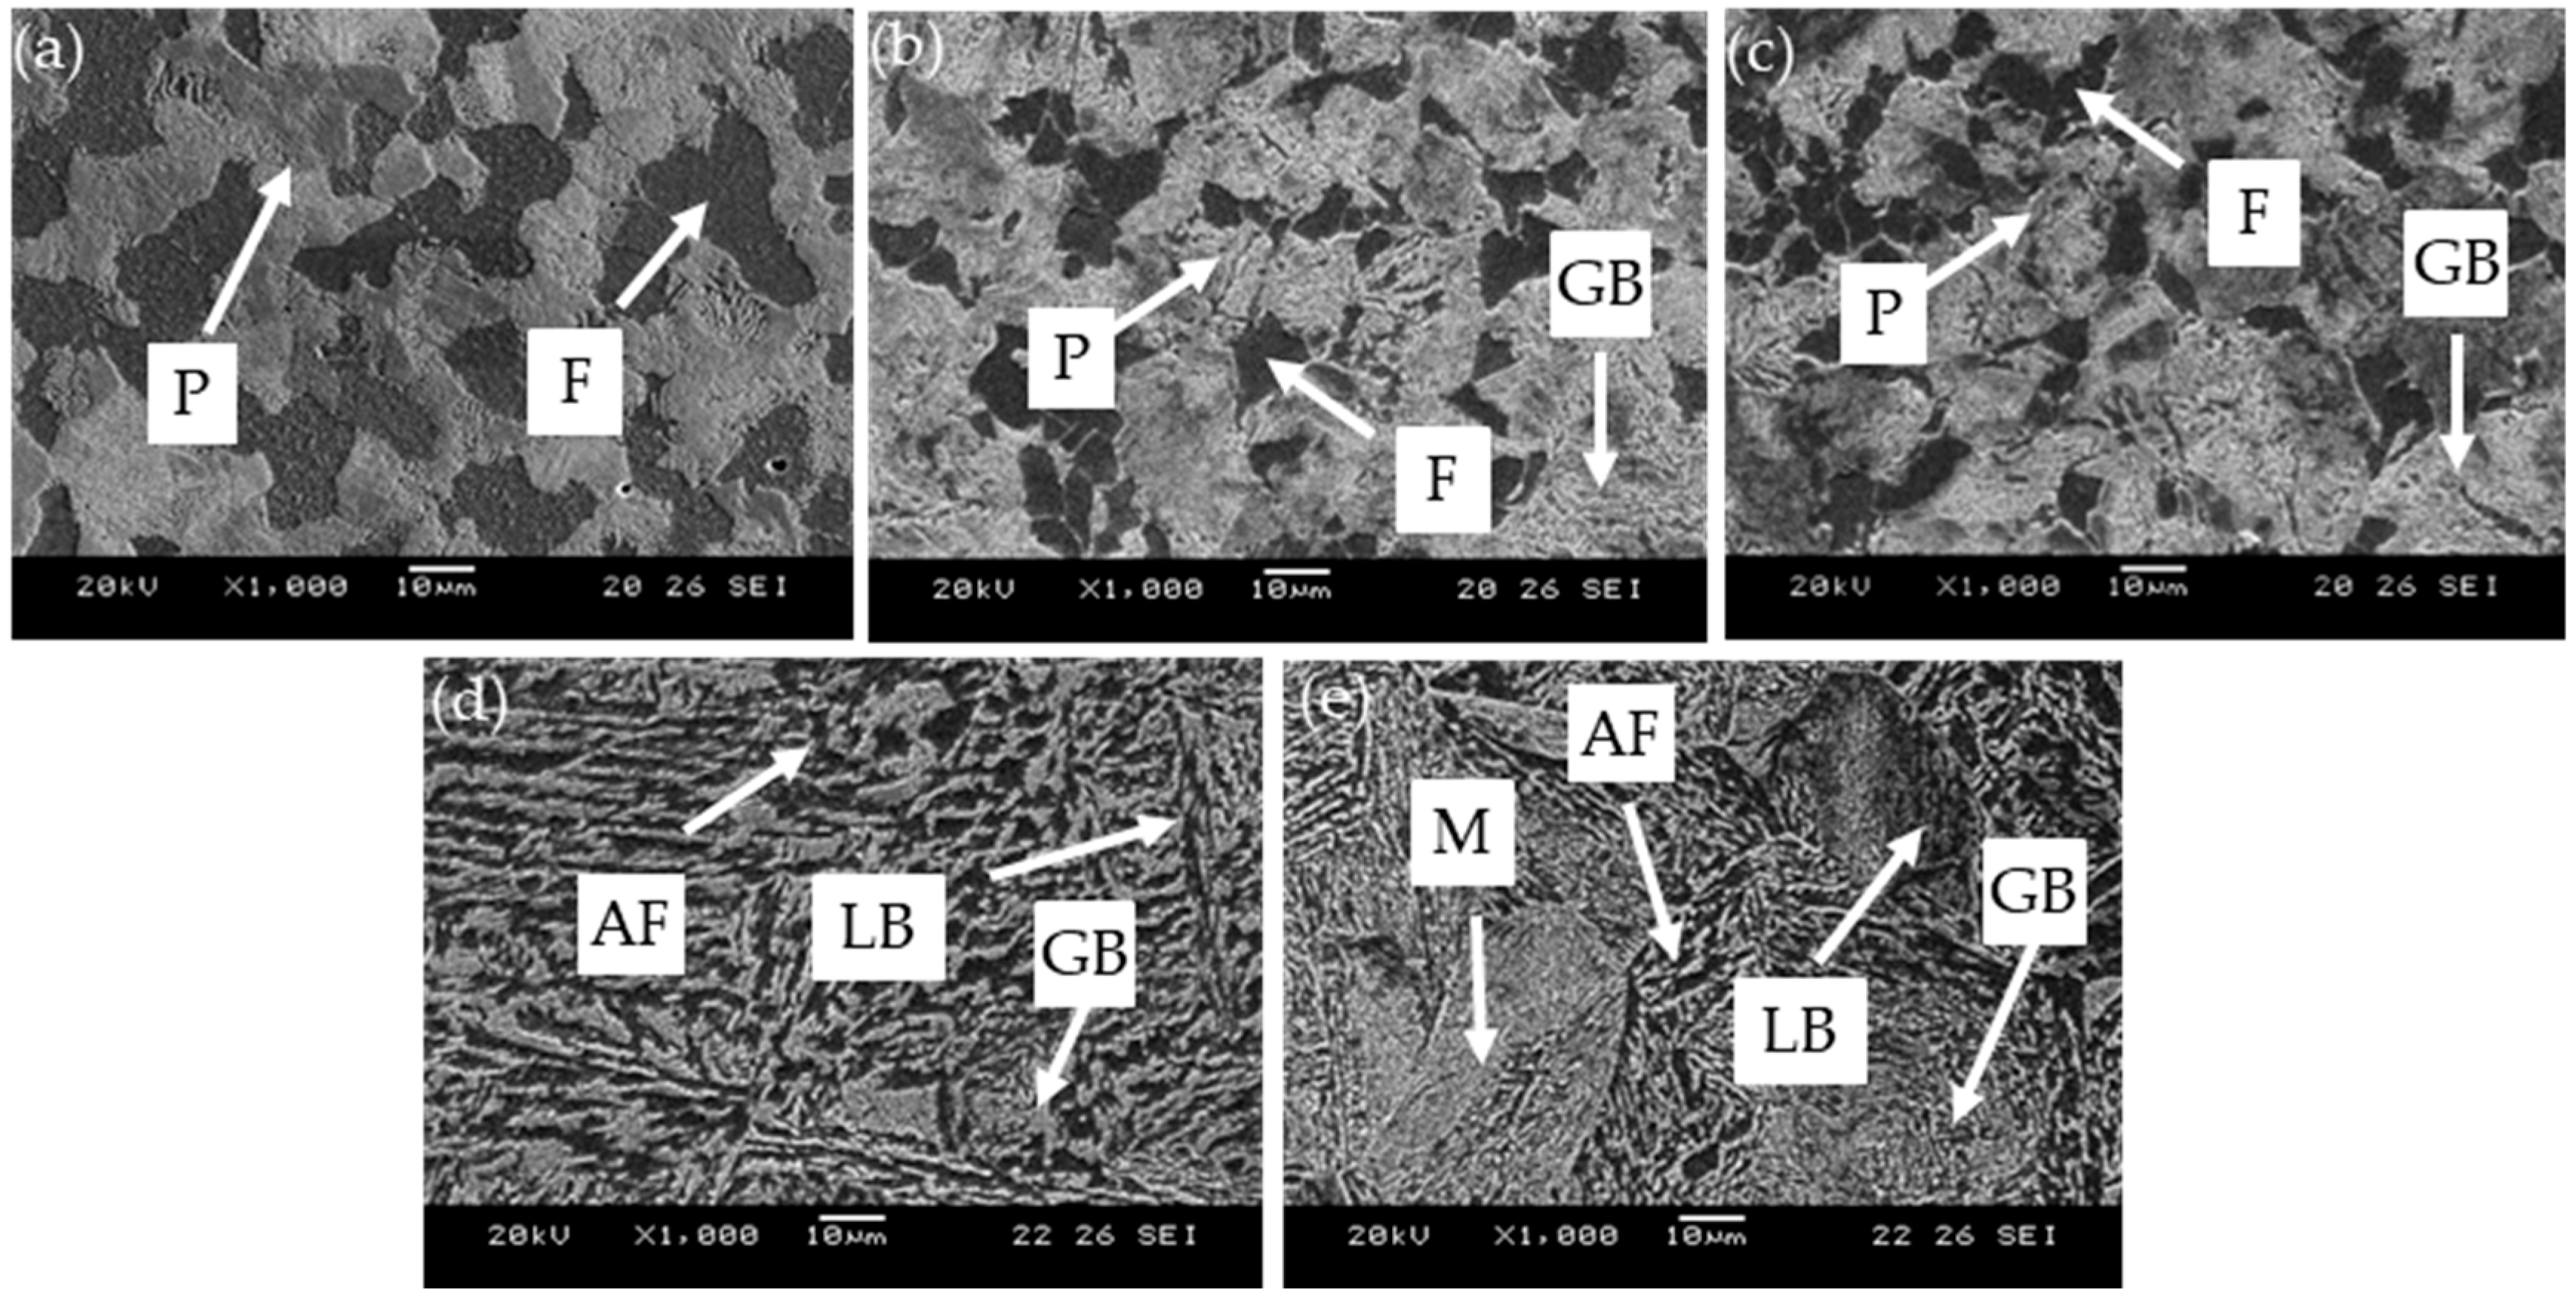
3.1. Microstructure

The microstructure of the experimental steel at different cooling speeds was observed using scanning electron microscopy (SEM), as shown in Figure 1. The experimental results show that with an increase in the cooling rate, the microstructure gradually changes from ferrite (F) + pearlite (P) to F + P + granular bainite (GB), and then the pearlite disappears, and, finally, the microstructure changes to F + bainite (B) + martensite (M). When the cooling rate is 0.1 °C/s, the microstructure of the experimental steel is an irregular polygonal ferrite and lamellar pearlite. Under SEM, the grey-black phase group is divided into ferrite, and the bright white phase group is divided into pearlite, in which the proportion of ferrite is 61%, as shown in Figure 1a. When the cooling rate is 0.5 °C/s, the amount of ferrite in the experimental steel is significantly reduced, some pearlite in the structure is distributed in granular form along the ferritic grain boundary, and GB begins to precipitate in the microstructure, as shown in Figure 1b. With a further increase in the cooling rate, acicular ferrite (AF) forms in the microstructure, and the pre-eutectoid ferrite coexists with random massive ferrite. When the cooling rate is 1.5 °C/s, the pearlite phase in the material matrix disappears, the proportion of the bainite phase further increases to 78%, and the bainite exists in two forms: one form has an irregularly intersecting short-rod or granular distribution, with granular cementite distributed in short-rod-like bainite, and the other is lamellar bainite (LB) with a certain orientation. The AF phase accounts for only 5%, as shown in Figure 1d. When the cooling rate reaches 2 °C/s, the proportion of the bainite phase in the matrix is reduced to 63%, and martensite precipitation appears, as shown in Figure 1e. According to this analysis, when the cooling speed is 0.1–1.5 °C/s, the austenite transforms to ferrite (A→F); when the cooling speed is 0.1–1.0 °C/s, the pearlite transformation occurs (A→P); when the cooling speed is 0.5–2.0 °C/s, the bainite transformation occurs (A→B); and when the cooling speed is 2.0 °C/s, the martensite transformation occurs (A→M). The experiment shows that when the cooling rate is ≥0.5 °C/s, the transformation to bainite occurs. Cr (chromium) and Mo (molybdenum) can shift the C-curve of steel to the right, significantly improving the hardenability of steel. They can also effectively suppress the transformation of pearlite and ferrite, prolonging the incubation period and promoting the occurrence of bainite transformation, allowing steel to obtain a bainitic microstructure at a certain cooling rate.

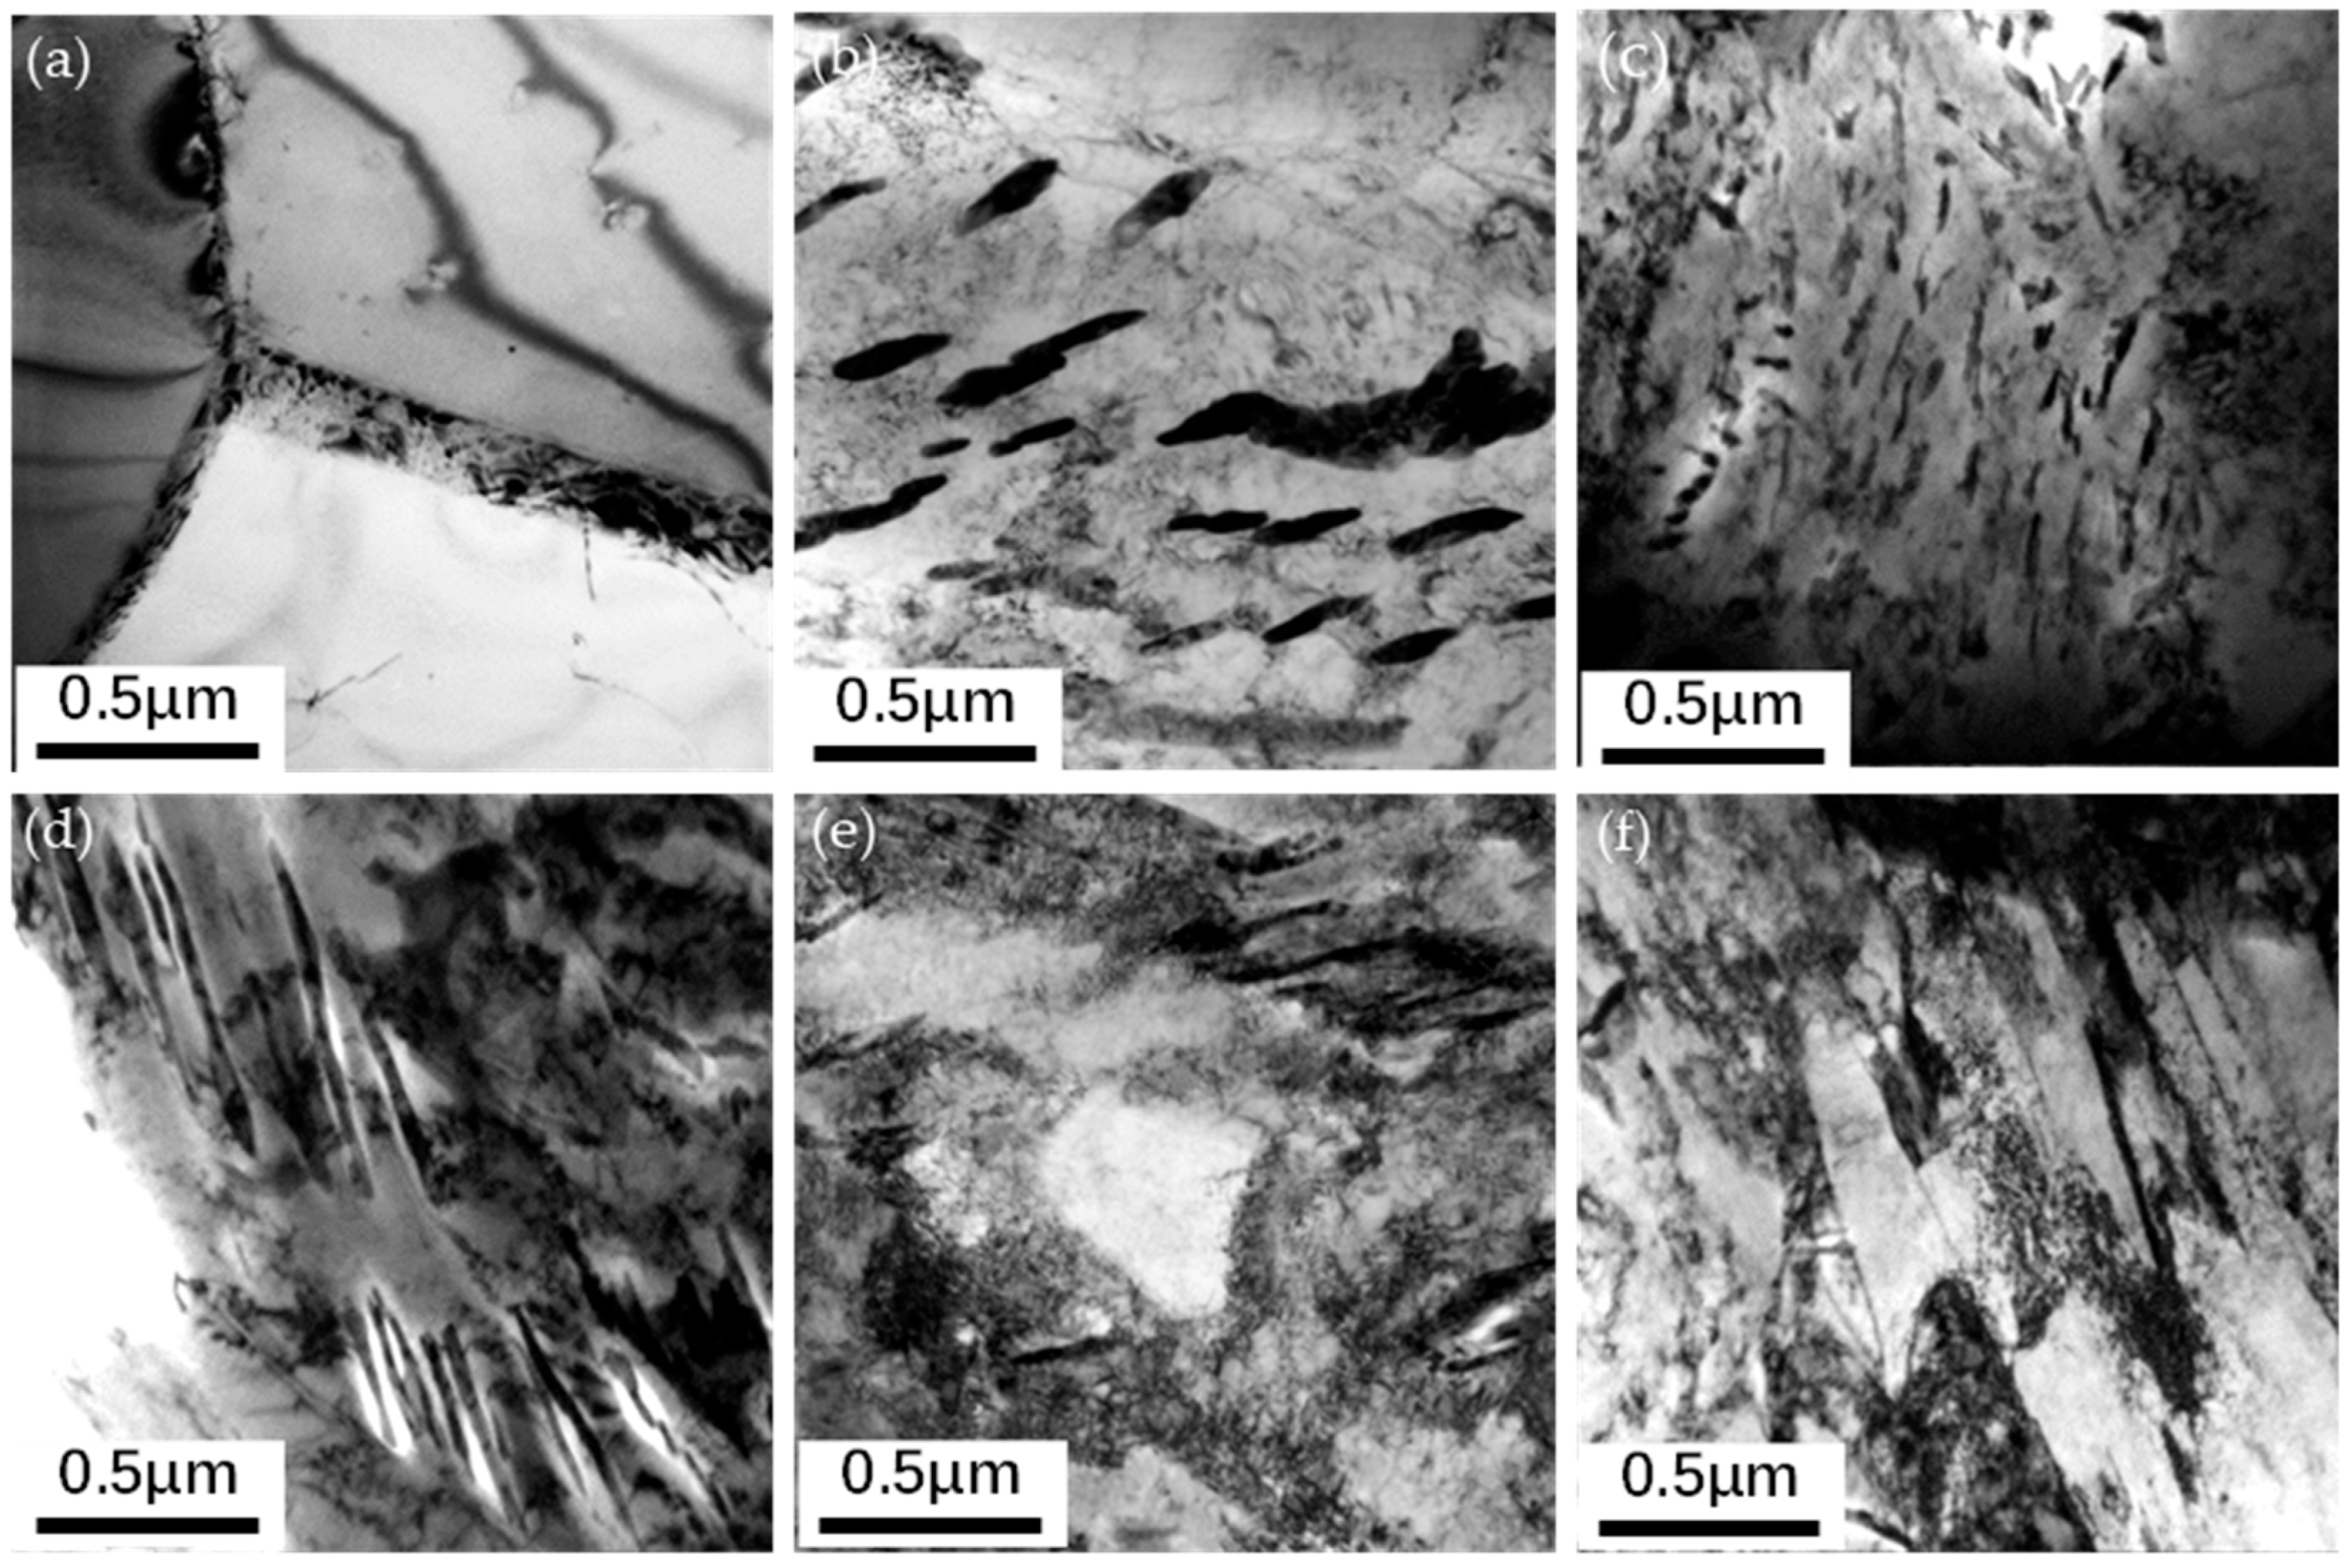
3.2. Carbide Morphology

Figure 2 shows TEM images of the carbide morphology in the microstructure of the experimental steel for different cooling rates. It can be seen that the carbide morphology of high-strength cold heading steel forms quite differently at different speeds of cooling: with an increase in cooling speed, the carbide morphology obeys the law of evolution for sheet carbide, short-rod carbide, granular carbide, and thin-strip carbide. It is evident from the analysis that when the cooling rate is 0.1 °C/s, carbides have a certain distribution in a transverse orientation to the austenite. The flake carbide group is separated by the austenite grain boundary, and it has distinct orientation rules. The flake carbide is a carbon-rich zone of the matrix. The distance between them determines the strength and plasticity of a material. As shown in Figure 2a, when the cooling rate is 0.5 °C/s, some of the continuous lamellar carbides are interrupted to form short rod-like carbides, as shown in Figure 2b, which means that at a certain degree of supercooling, the austenite grains form unevenly dispersed cementates. At the phase transition, short rod-like carbides are immediately formed. At this time, the carbides maintain a certain orientation relationship. When the cooling rate is 1.0 °C/s, the short rod-like carbides are fine and further dispersed, which shows that most of the granular carbides with fixed orientations are dispersed and distributed in the ferrite phase. However, some carbides begin to disperse and grow around the original orientation to form a kind of granular island, as shown in Figure 2c. In this state, the material has better plasticity. When the cooling rate is 1.5 °C/s, the granular carbide particles in the ferrite phase grow larger, and thin strips of carbides appear in the matrix. The formation temperature of the carbides is approximately 400 °C. As the cooling rate increases to 2.0 °C/s, the coniferous thin strips of carbide become darker and finer in shape, as shown in Figure 2e. Local lath martensite can be observed.

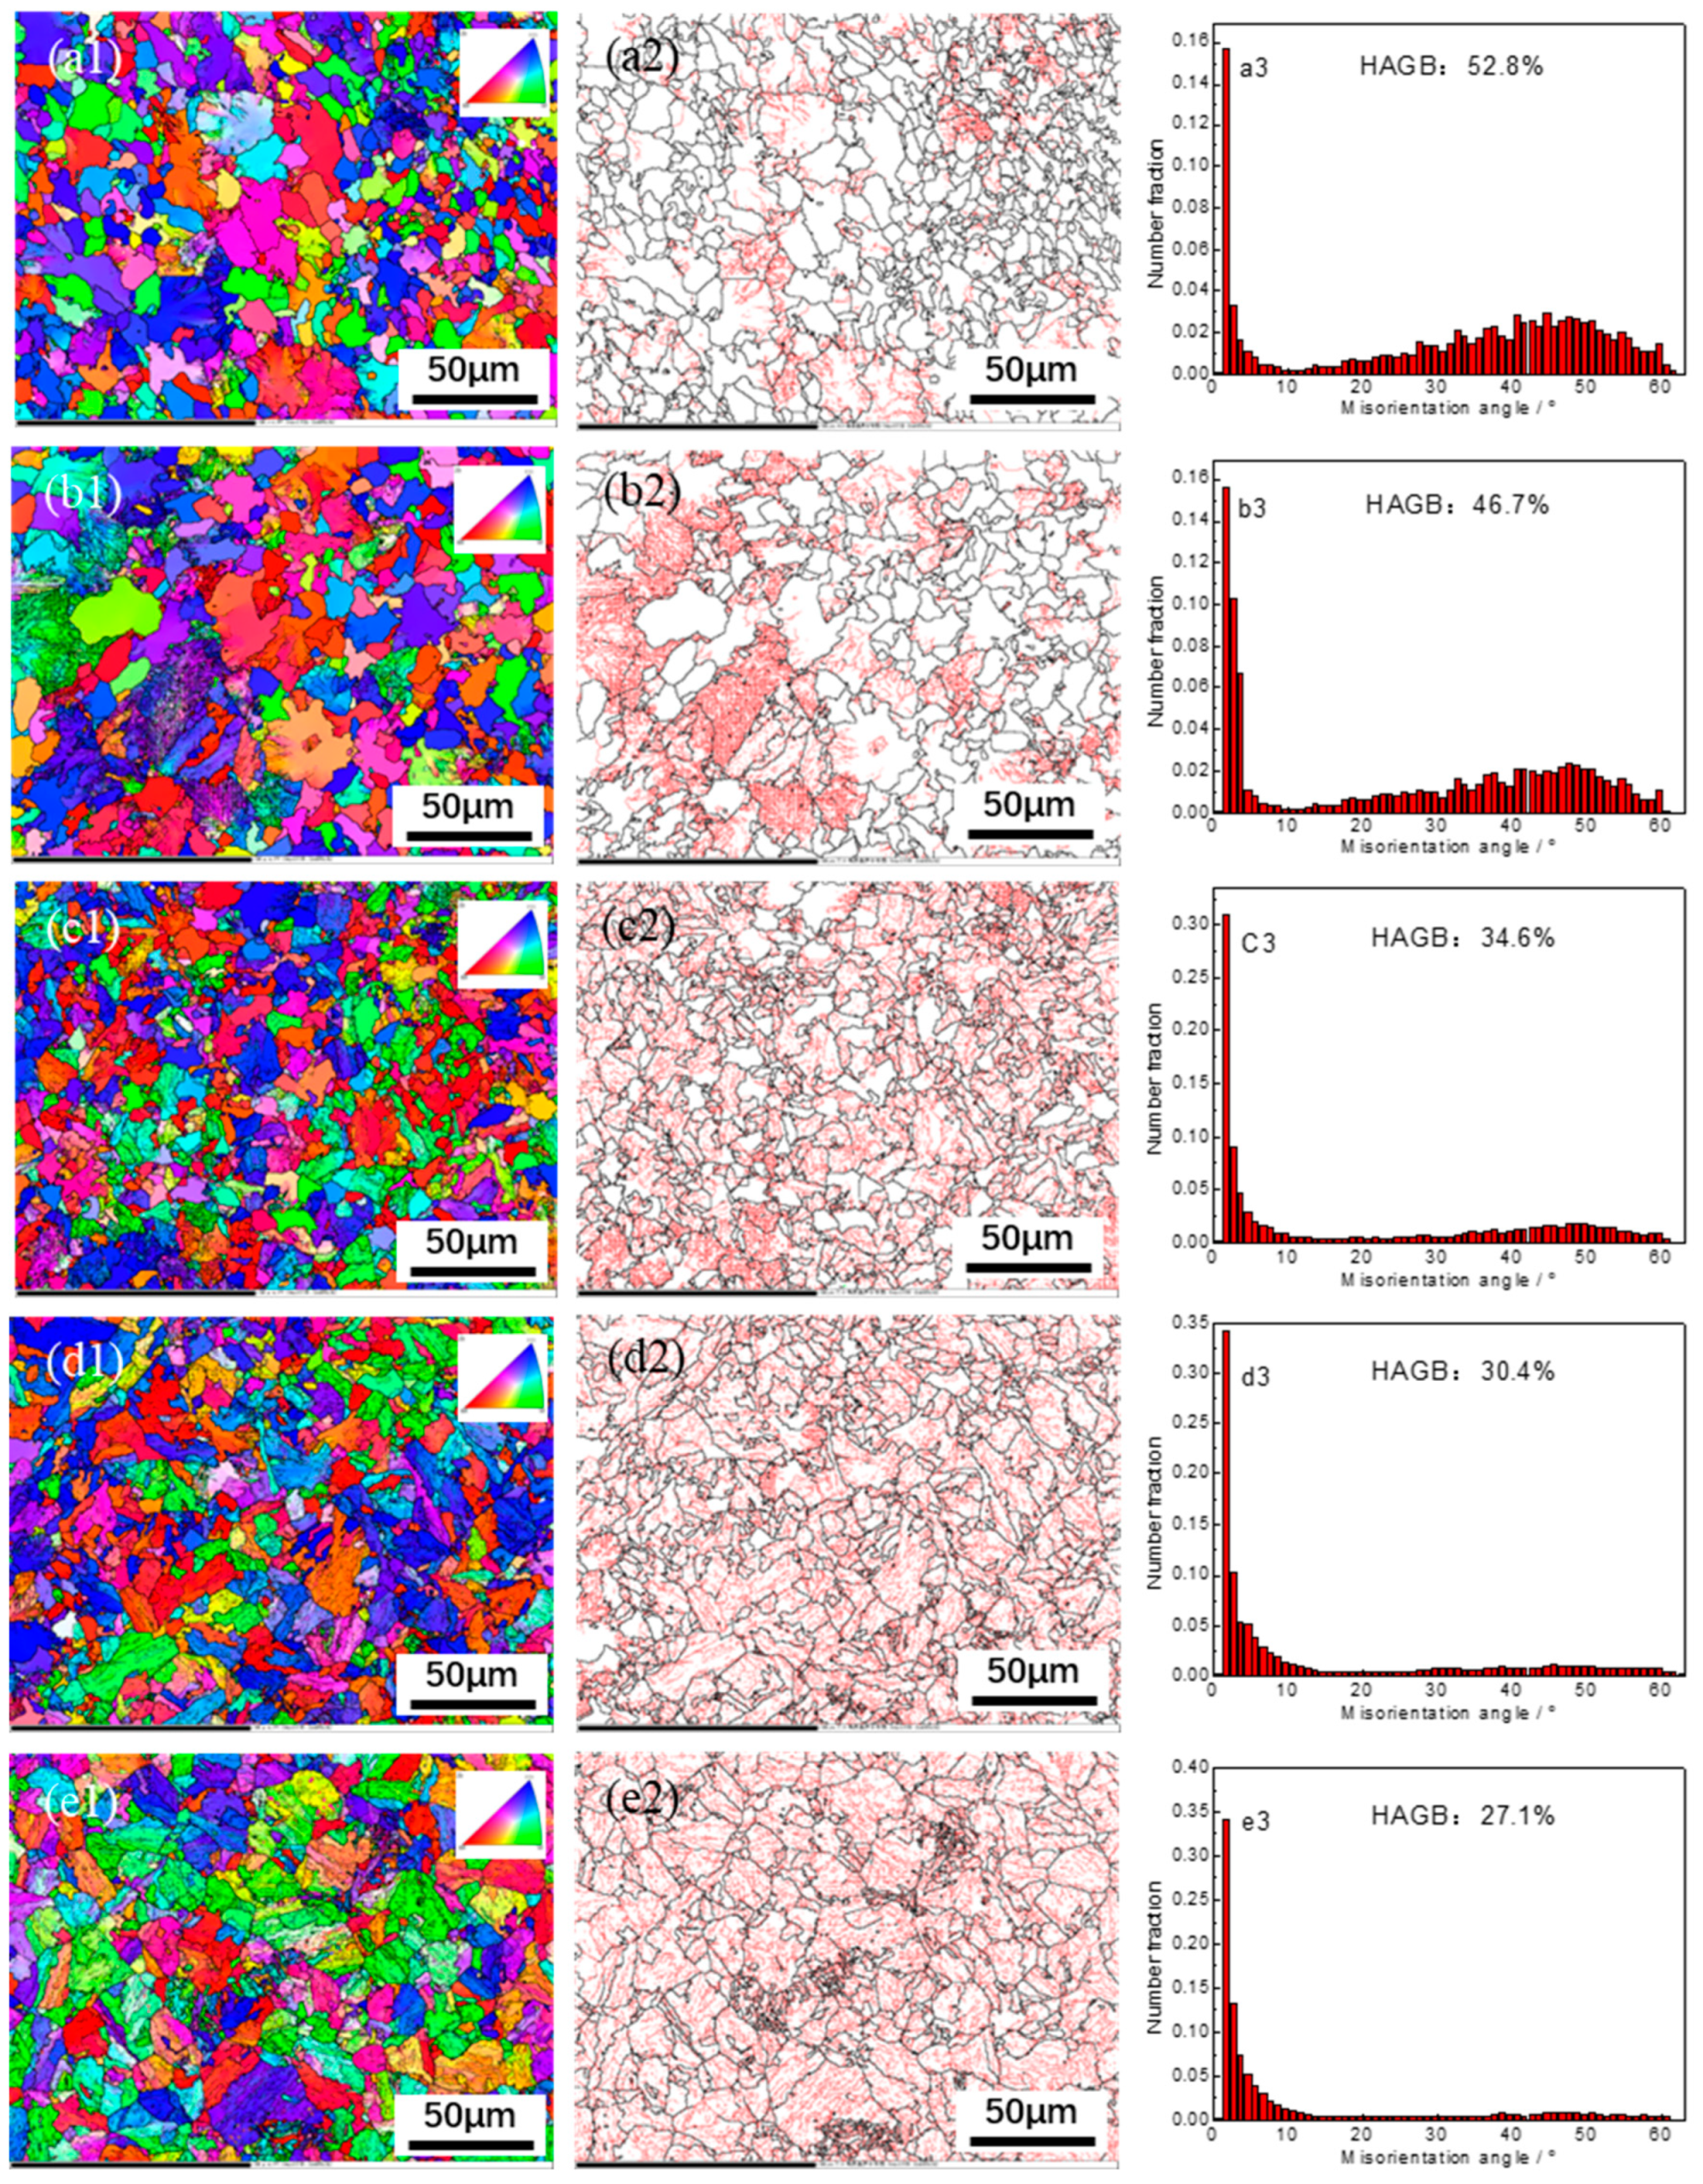
3.3. Grain Boundary Orientation

EBSD technology was used to characterize the grain boundary orientation characteristics of high-strength cold heading steel cooled at different cooling rates, as shown in Figure 3. Figure 3(a1–e1) shows the orientation images at the cooling rates of 0.1 °C/s, 0.5 °C/s, 1.0 °C/s, 1.5 °C/s, and 2.0 °C/s, respectively. Figure 3(a2–e2) shows the distribution diagrams of the grain boundaries of the experimental steel cooled at different cooling rates, which represent the distribution of the grain boundary size and angle in the visual field matrix, and the detection results can be seen. With an acceleration in cooling, the proportion of large-angle grain boundaries (with an orientation difference of >15°) gradually decreases, and the distribution area of small-angle grain boundaries (orientation difference of <15°) in the red region gradually increases, which means that the proportion of small-angle grain boundaries is gradually increasing. Figure 3(a3–e3) shows the distribution of orientation differences at the corresponding cooling rate and characterizes the proportion of large- and small-angle grain boundaries. When the cooling rate is 0.1 °C/s, the proportion of large-angle grain boundaries is the highest at 52.8%; when the cooling rate is 2.0 °C/s, the proportion of large-angle grain boundaries is the lowest at only 27.1%. With an acceleration in cooling, the dislocation density continues to increase, the disordered entanglement dislocation in the ferritic crystals gradually transitions from an orderly distribution to an irregular arrangement, and the dislocations sharpen to form small-angle grain boundaries (orientation difference <15°). Large-angle grain boundaries can hinder crack initiation and propagation during impact fracture and improve the impact energy of high-strength cold heading steel, which then improves the toughness of the material.
The experimental results show that from 0.1 °C/s to 2.0 °C/s, the proportion of large-angle grain boundaries in the experimental steel decreases by 25.7%. It can be seen that the effect of the cooling rate on the large-angle grain boundaries is between the effect of the final rolling temperature and spinning temperature on grain orientation, which indicates that the final rolling temperature is a deformation parameter. The influence of the dynamic recovery mechanism and recrystallization is greater than that of the cooling rate, and the influence of the cooling rate mechanism is greater than that of static recovery or the initial cooling temperature of recrystallization. The effective grain size of the experimental steel increases significantly with an increase in the cooling rate, which is mainly affected by the cooling degree and the microstructure transformation.

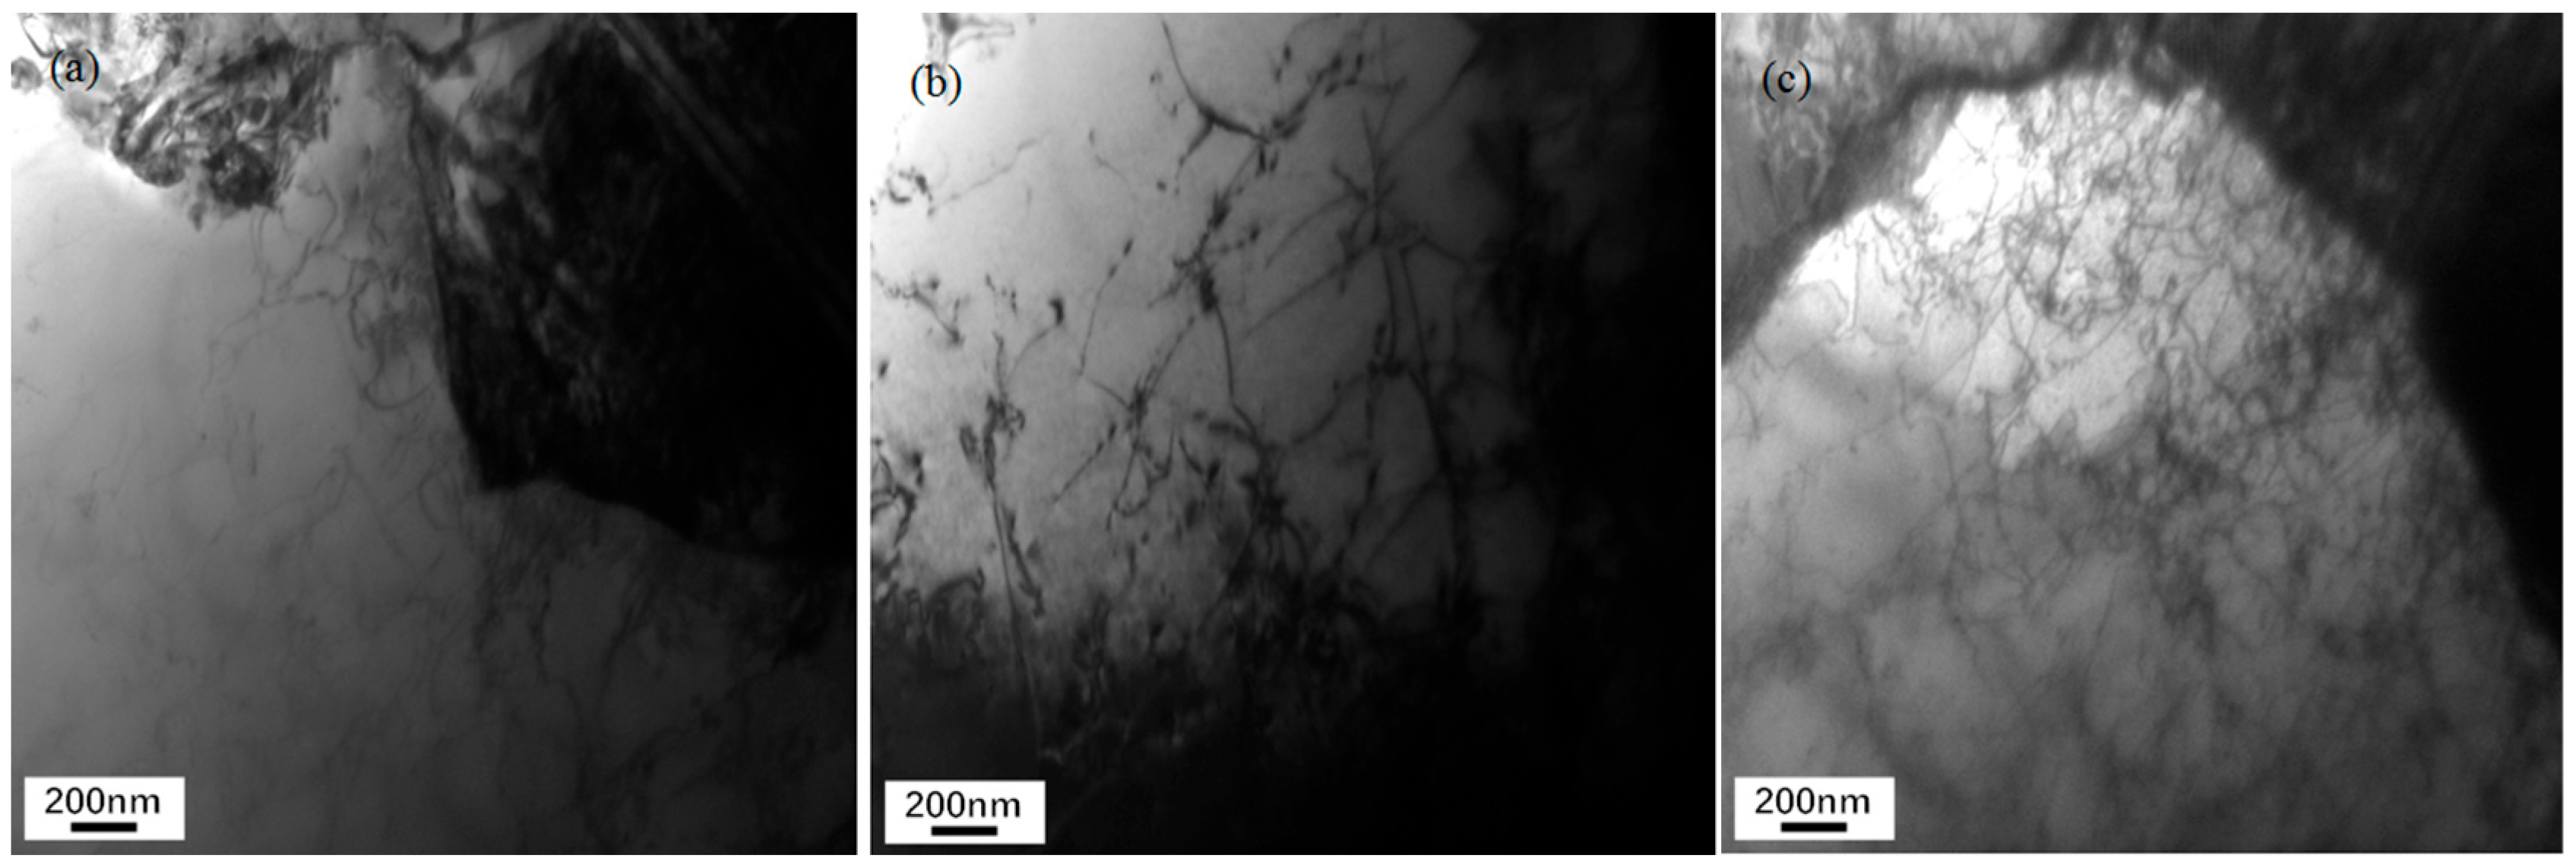
3.4. Dislocation Density

The distribution of dislocations at different cooling rates was characterized and analyzed. The evolution of the dislocation morphology was observed under TEM, as is shown in Figure 4. At various cooling speeds, dislocations occur in the microstructure, which takes the form of bundles of roughly parallel massive ferrite and a nonlayered structure composed of intermingled cementite. However, our comparison shows that the dislocation density in the fine structure of the material is significantly higher for high-speed cooling than for low-speed cooling, as shown in Figure 4. Cooling rates below 1.0 °C/s result in improved dislocation density.
XRD was used to measure the diffraction pattern of the experimental steel under different cooling rates and temperatures, and the density of dislocations in the steel was calculated using the modified Williamson–Hall formula (MWH), as shown in Table 3. According to the calculated value of dislocation density, the corresponding microstructure evolution analysis shows that the experimental steel is only 2.18 × 1012 cm−2 at a cooling rate of 0.5 °C/s, and the dislocation density of the experimental steel increases exponentially at 2.0 °C/s. In combination with the microstructure evolution, a large proportion of the grain boundaries in the experimental steel microstructure are small-angle grain boundaries, which further verifies the close relationship between the proportion of small-angle grain boundaries and the measure of dislocation density and also verifies the corresponding relationship between dislocation entanglement and small-angle grain boundaries in the bainite and martensite microstructure.

3.5. Phase Structure of Oxide

The EBSD analysis results for the distribution of scale phase on the surface of the experimental steel for different cooling rates are shown in Figure 5. The test results show that with the acceleration in the cooling rate, the thickness of the oxide sheet on the surface of the material gradually decreases, which is consistent with our observation using the microscope. The phase structure is mainly the FeO phase, the Fe3O4 phase, and a small amount of the Fe2O3 phase, and the interphase gap is large. With an acceleration in cooling, the proportion of the FeO phase gradually decreases, and the proportion of Fe3O4 and Fe2O3 phases increases gradually. It can be seen from the test data that in the cooling speed range of 0.1–0.5 °C/s, the oxide phase is dominated by the FeO phase and the Fe3O4 phase, which account for 54% and 43%, respectively. The phase structure of the oxide layer has no obvious stratification and is in a cross-mixed distribution state. When the cooling rate rises to 1.0 °C/s, the proportion of the FeO phase and the Fe3O4 phase becomes 31% and 58%, respectively. At this cooling rate, the FeO phase and Fe3O4 phase are evenly distributed inside and outside, and the Fe2O3 phase is scattered throughout the FeO phase and Fe3O4 phase. When the cooling rate is 2.0 °C/s, no oxide sheet is found under EBSD. The experiment shows that when the cooling rate is controlled in the range of 0.1–1.0 °C/s, the transformation of the oxide sheet is mainly the FeO phase, the Fe3O4 phase, and a small amount of the Fe2O3 phase. The acceleration in the cooling rate is conducive to an increase in the proportion of the Fe3O4 phase, and the corrosion protection of the surface oxide layer is maintained as the oxide sheet thins.

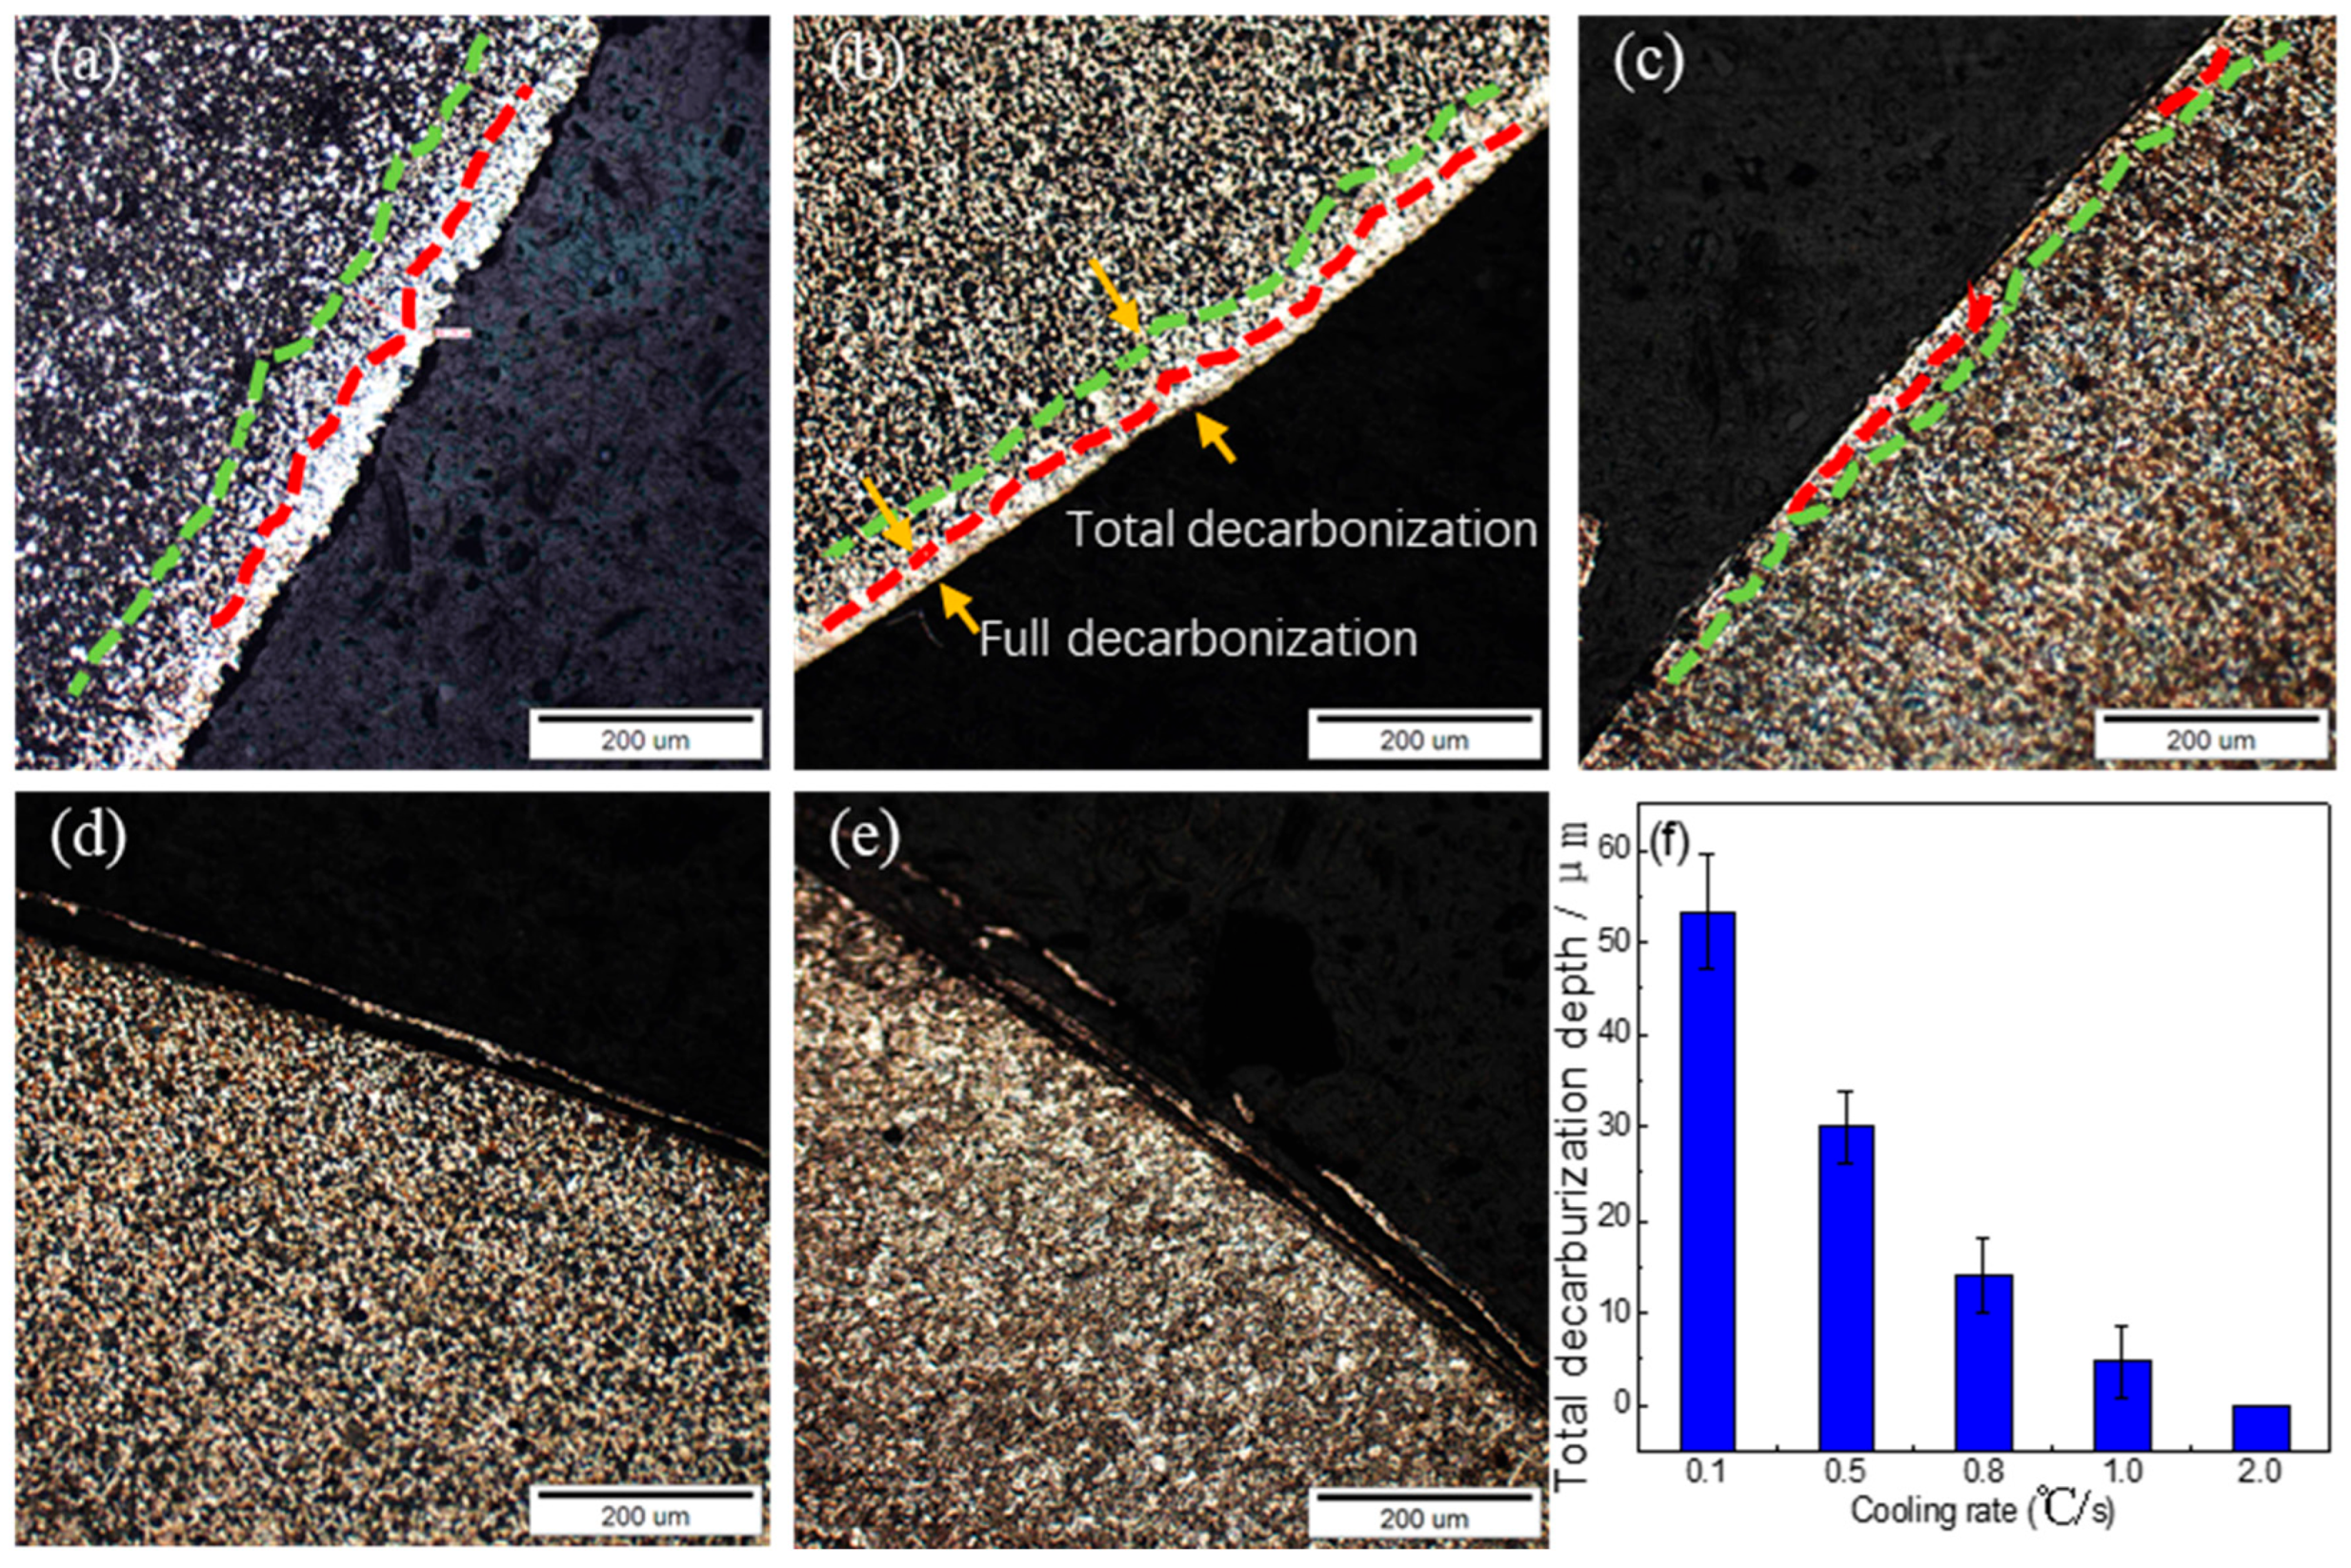
3.6. Surface Decarburization

Metallographic observations were taken of the surface decarburization structure of the experimental steel cooled at different cooling rates; the decarburization structure of the sample is shown in Figure 6. The results show that the surface decarburization of steel decreases gradually with an increase in the cooling rate, and the decarburization layer is inhibited when the cooling rate is higher than 1.5 °C/s. When the cooling rate is 0.1 °C/s, the fully decarburized layer and the partially decarburized layer coexist, as is shown in Figure 6a. When the cooling velocity reaches 1.0 °C/s, a complete decarburization layer of 4 μm and a partial decarburization layer of 10 μm remain on the surface. When the cooling rate is greater than 1.5 °C/s, no decarburization layer is detected. This experiment shows that the acceleration in the cooling rate inhibits the surface decarburization of steel. When the cooling rate is ≥1.5 °C/s, there is no decarburization on the surface of the steel. The inhibition by the cooling speed of the decarbonization transformation is mainly reflected in the reduction in the residence time of the steel in the high-temperature section. We estimate that at 0.1 °C/s, it takes 25 min for the temperature to drop from 850 °C to 700 °C, which means that the decarbonization of the steel continues at 700–850 °C. When the cooling speed is 1.0 °C/s, it only takes 2.5 min for the temperature to drop below 700 °C. The diffusion of carbon atoms is significantly inhibited.

3.7. Mechanical Property

The tensile stress–strain curves of the SCM435 steel at room temperature for different cooling rates are shown in Figure 7. It can be seen that the SCM435 steel has no obvious yield platform at room temperature, and its resistance to microplastic deformation in the initial stage of the tensile experiment is not obvious. With an increase in the cooling rate, the tensile strength (σb) gradually increases, and the elongation and area reduction after fracture first decrease, then increase, and then decrease. When the cooling rate is 0.1 m/s, the tensile strength (σb) of the material under slow cooling is 708 MPa, the elongation at break is 31.5%, and the area reduction after breaking is 62%, which is the best plastic state of the material. With an acceleration in cooling, the tensile strength increases, and the elongation and area reduction decrease, which is due to the increase in the pearlite content and results in increased obstruction to dislocation movement, increased plastic deformation resistance, and better tensile strength. When the cooling rate is 1.0 m/s, the tensile strength further increases to 895 MPa. Simultaneously, the elongation and surface area reduction after fracture stop decreasing and begin to rise. This occurs because the uniform distribution of short-rod and GB improves the tensile strength of the steel while maintaining good plastic toughness, which corresponds to the changes in the steel structure. This high strength is well-matched with high-quality plastic toughness. It is the structure control target of high-strength steel in industrial production. With a further increase in the cooling rate, the tensile strength increases to 1019 MPa, and the plasticity of the material further deteriorates.
The mechanical properties testing data of SCM435 steel for tensile tests at room temperature are shown in Table 4.

4. Conclusions

(1) The observed microstructure of SCM435 steel cooled at different cooling rates showed that when the cooling rate was 0.1 °C/s, the microstructure was an irregular polygon ferrite and lamellar pearlite; when the cooling rate was 0.5–1.0 °C/s, the microstructure gradually changed to ferrite, pearlite, and GB; when the cooling rate was 1.5 °C/s, the pearlite disappeared. The bainite was found to be in granular and strip form, and the first eutectoid ferrite formed. When the cooling rate reached 2 °C/s, martensite precipitation appeared in the matrix.
(2) The morphology of the carbide in SCM435 steel was different under different cooling speeds. When the cooling speed was 0.1 °C/s, flake carbides were distributed along the austenite in a certain orientation. When the cooling speed was 0.5 °C/s, some continuous lamellar carbide grains were interrupted, and short rod-like carbides formed. When the cooling rate was above 1.5 °C/s, the matrix was mainly thin-strip carbides.
(3) The grain boundary orientations in SCM435 steel were different under different cooling speeds. When the cooling speed was 0.1 °C/s, the proportion of large-angle grain boundaries reached 52.8%, and the dislocation density was only 1.91 × 1012 cm−2; when the cooling speed was 2.0 °C/s, the proportion of large-angle grain boundaries was only 27.1%, and the dislocation density increased to 5.38 × 1012 cm−2.
(4) The decarburization and oxidation behavior of SCM435 under varying cooling rates was investigated. The depth of decarburization exhibited a consistent decrease with an increasing cooling rate. Simultaneously, the thickness of the oxide layer decreased gradually. Moreover, the composition of the oxide layer underwent a transformation: the proportion of the FeO phase decreased, while the proportions of Fe3O4 and Fe2O3 phases increased gradually.
(5) With the increase in the cooling rate, the tensile strength showed a monotonically increasing trend, whereas the elongation and area reduction showed a fluctuating trend of first decreasing, then increasing, and then decreasing. When the cooling rate was 1.0 m/s, the short-rod and GB in the material structure endowed SCM435 steel with excellent matching strength and toughness, and its tensile strength and elongation were 895 MPa and 24%, respectively.

Author Contributions

Conceptualization, J.C. and G.F.; methodology, J.C., G.F. and Y.Z.; software, J.C. and P.L.; validation, J.C., G.F., P.L. and Y.L.; formal analysis, J.C., G.F. and L.W.; investigation, G.F., Y.Z. and Y.L.; resources, G.F., Y.Z., P.L., L.W. and Y.L.; data curation, J.C. and Y.Z.; writing—original draft, J.C.; writing—review and editing, J.C., Y.Z., P.L. and L.W.; visualization, Y.L.; supervision, G.F., P.L., L.W. and Y.L.; project administration, J.C. and G.F.; funding acquisition, J.C. and G.F. All authors have read and agreed to the published version of the manuscript.

Funding

This research received no external funding.

Data Availability Statement

The original contributions presented in the study are included in the article, further inquiries can be directed to the corresponding authors.

Conflicts of Interest

Authors Jilin Chen, Lijun Wang and Yongchao Li was employed by Hebei Xinggang Technology Co., Ltd. and Xingtai Iron and Steel Co., Ltd. The remaining authors declare that the research was conducted in the absence of any commercial or financial relationships that could be construed as a potential conflict of interest.

References

  1. Dong, H.; Lian, X.T.; Hu, C.D.; Lu, H.; Peng, W.; Zhao, H.; Xu, D. High Performance Steels: The Scenario of Theory and Technology. Acta Metall. Sin. 2020, 56, 558–582. [Google Scholar]
  2. Hu, C.D.; Meng, L.; Dong, H. Research and development of ultrahigh strength steels. Trans. Mater. Heat Treat. 2016, 37, 178–183. [Google Scholar]
  3. Hui, W.J.; Dong, H.; Weng, Y.Q. Research and development trends of high strength steel for bolts. Mater. Mech. Eng. 2002, 26, 1–4. [Google Scholar]
  4. Yongbing, L.I.; Yunwu, M.A.; Ming, L.O.U.; Haiyang, L.; Zhongqin, L. Advances in Welding and Joining Processes of Multi-material Light weight Car Body. J. Mech. Eng. 2016, 52, 1–23. [Google Scholar]
  5. Sun, H.R. Review on the Fastener Steels for Automobiles. China Metall. 2011, 21, 7–9. [Google Scholar]
  6. Hui, W.J.; Zhang, Y.J.; Zhao, X.L.; Shao, C.; Wang, K.; Sun, W.; Yu, T. Influence of cold deformation and annealing on hydrogen embrittlement of cold hardening bainitic steel for high strength bolts. Mater. Sci. Eng. A 2016, 662, 528–536. [Google Scholar] [CrossRef]
  7. Wang, Q.; Zhu, J.L. Certain new techniques of wire production development in recent years. China Metall. 2014, 24, 1–4. [Google Scholar]
  8. Ruan, S.P.; Wang, L.J.; Chen, J.L.; Guo, M.Y.; Zhai, J.P. Effect of Control-Rolling-Cooling Process on Structure and Properties of Steel SCM435 Rod Coil. Spec. Steel 2016, 5, 45–47. [Google Scholar]
  9. Kitade, A.; Kawabata, T.; Kimura, S.; Takatani, H.; Kagehira, K.; Mitsuzumi, T. Clarification of micromechanism on Brittle Fracture Initiation Condition of TMCP Steel with MA as the trigger point. Procedia Struct. Integr. 2018, 13, 1845–1854. [Google Scholar] [CrossRef]
  10. Elhigazi, F.; Artemev, A. The influence of carbide formation in ferrite on the bainitic type transformation. Comp. Mater. Sci. 2021, 186, 109961. [Google Scholar] [CrossRef]
  11. Elhigazi, F.; Artemev, A. The interaction between the displacive transformation and the diffusion process in the bainitic type transformation. Comp. Mater. Sci. 2019, 169, 109079. [Google Scholar] [CrossRef]
  12. Ranjan, R.; Singh, S.B. Isothermal bainite transformation in low-alloy steels: Mechanism of transformation. Acta Mater. 2021, 202, 302–316. [Google Scholar] [CrossRef]
  13. Chen, G.H.; Xu, Y.W.; Liu, M. Effect of high-temperature deformation and undercooling on bainite transformation of a medium-carbon bainitic steel. J. Iron Steel Res. Int. 2020, 32, 984–989. [Google Scholar]
  14. Ravi, A.M.; Kumar, A.; Herbig, M.; Sietsma, J.; Santofimia, M.J. Impact of austenite grain boundaries and ferrite nucleation on bainite formation in steels. Acta Mater. 2020, 188, 424–434. [Google Scholar] [CrossRef]
  15. Yong, Q.L.; Ma, M.T.; Wu, B.R. Microalloyed Steel-Physical and Mechanical Metallurgy; China Machine Press: Beijing, China, 1989; p. 57. [Google Scholar]
  16. Zheng, C.S.; Li, L.F.; Yang, W.Y.; Sun, Z. Microstructure evolution and mechanical properties of eutectoid steel with ultrafine or fine (ferrite+cementite) structure. Mater. Sci. Eng. A 2014, 599, 16–24. [Google Scholar] [CrossRef]
  17. Liang, Z.Y.; Wang, Y.G.; Gui, Y.; Zhao, Q. Micro-structural evolution of oxide scales formed on a Nb-Stabilizing heat-resistant steel at the initial stage in high-temperature water vapor. Mater. Chem. Phys. 2020, 242, 122443. [Google Scholar] [CrossRef]
  18. Liu, Y.B.; Zhang, W.; Tong, Q.; Wang, L. Effects of temperature and oxygen concentration on the characteristics of decarburization of 55SiCr spring steel. ISIJ Int. 2014, 54, 1920–1926. [Google Scholar] [CrossRef]
  19. Noh, W.; Lee, J.M.; Kim, D.J.; Song, J.H.; Lee, M.G. Effects of the residual stress, interfacial roughness and scale thickness on the spallation of oxide scale grown on hot rolled steel sheet. Mater. Sci. Eng. A 2019, 739, 301–316. [Google Scholar] [CrossRef]
  20. Solimani, A.; Nguyen, T.; Zhang, J.Q.; Young, D.J.; Schütze, M.; Galetz, M.C. Morphology of oxide scales formed on chromium-silicon alloys at high temperatures. Corros. Sci. 2020, 176, 109023. [Google Scholar] [CrossRef]
  21. Huang, T.H.; Deng, C.M.; Song, P.; Ji, Q.; Li, C.; Chen, R.; Hua, C.; Yi, J. Investigation of oxide scale formation and internal oxidation of an Fe-based coating at 500 °C and 600 °C. Surf. Coat. Technol. 2020, 402, 126309. [Google Scholar] [CrossRef]
Figure 1. Microstructure evolution of steel under different cooling rates: (a) 0.1 °C/s; (b) 0.5 °C/s; (c) 1 °C/s; (d) 1.5 °C/s; (e) 2 °C/s.
Metals 14 00140 g001
Figure 2. Carbide morphology under different cooling rates of steel. (a) 0.1 °C/s: Flake carbide; (b) 0.5 °C/s: short-rod carbide; (c) 1 °C/s: granular carbide; (d) 1.5 °C/s: thin-strip carbide; (e) 2 °C/s sliver carbide; (f) 2 °C/s: lath martensite.
Metals 14 00140 g002
Figure 3. EBSD analysis results for different cooling rates of steel. Grain orientation imaging: (a1e1); grain boundary distribution map of large and small angles: (a2e2); grain boundary misorientation distribution map: (a3e3); 0.1 °C/s (a1a3); 0.5 °C/s (b1b3); 1 °C/s (c1c3); 1.5 °C/s (d1d3); 2 °C/s (e1e3).
Metals 14 00140 g003
Figure 4. Dislocations in steel under different cooling rates: (a) 0.1 °C/s; (b) 1 °C/s; (c) 2 °C/s.
Metals 14 00140 g004
Figure 5. EBSD scale analysis of steel for different cooling rates: (a) 0.1 °C/s; (b) 0.5 °C/s; (c) 1.0 °C/s; (d) phase distribution map.
Metals 14 00140 g005
Figure 6. Decarburization layer morphology of steel for different cooling rates: (a) 0.1 °C/s; (b) 0.5 °C/s; (c) 1.0 °C/s; (d) 1.5 °C/s; (e) 2.0 °C/s; (f) curve of decarburization depth.
Metals 14 00140 g006
Figure 7. Tensile engineering stress–strain curves of steel at room temperature.
Metals 14 00140 g007
Table 1. Chemical composition of SCM435 microalloyed steels (wt%).
SteelCSiMnPSCrMo
SCM4350.350.180.820.0010.00080.980.22
Table 2. Rolling technology for SCM435 steels.
ProcessHeating Temperature/°CFinishing Temperature/°CHeat CoverBlowerCooling Rate/m/s
11100 ± 10900 ± 10CloseClose0.1
21100 ± 10900 ± 10OpenClose0.5
31100 ± 10900 ± 10OpenOpen1.0
41100 ± 10900 ± 10OpenOpen1.5
51100 ± 10900 ± 10OpenOpen2.0
Table 3. Measured value of dislocation density of experimental steel.
SteelDislocation Density /1012·cm−2
0.1 °C/s0.5 °C/s1.0 °C/s1.5 °C/s2.0 °C/s
1.912.182.984.195.38
Table 4. Tensile mechanical properties of SCM435 steel at different cooling rates.
Cooling Rate/m/sTensile Strength/MPaElongation/%Reduction in Area/%
0.170831.562
0.579425.853
1.089528.557
1.595920.651
2.0101914.547
Disclaimer/Publisher’s Note: The statements, opinions and data contained in all publications are solely those of the individual author(s) and contributor(s) and not of MDPI and/or the editor(s). MDPI and/or the editor(s) disclaim responsibility for any injury to people or property resulting from any ideas, methods, instructions or products referred to in the content.

