Article

Heterogeneous Microstructure Provides a Good Combination of Strength and Ductility in Duplex Stainless Steel

1
Faculty of Materials Science and Engineering, Kunming University of Science and Technology, Kunming 650093, China
2
City College, Kunming University of Science and Technology, Kunming 650504, China
3
Nano and Heterogeneous Materials Center, School of Materials Science and Engineering, Nanjing University of Science and Technology, Nanjing 210094, China
*
Author to whom correspondence should be addressed.
Metals 2024, 14(2), 193; https://doi.org/10.3390/met14020193
Submission received: 26 November 2023 / Revised: 30 January 2024 / Accepted: 1 February 2024 / Published: 3 February 2024

Abstract

:
SAF2507 duplex stainless steel (DSS) is often used as a structural component in ocean-going vessels and marine petroleum exploitation equipment, which require superior mechanical properties. In this study, we used cold rolling (CR) at room temperature with 55% or 80% deformation amounts and subsequent annealing at 1273 K in 1 min to prepare SAF2507 samples with a heterogeneous structure (HS) that was composed of ferrite and austenite phases with different grain sizes. Compared with the homogeneous structure samples, the yield strength of the HS samples increased, while the ductility did not decrease. The 55%-1273 and 80%-1273 samples exhibited the hetero-zone boundary-affected regions on both sides of the grain boundary, phase boundary, and twin boundary. This resulted in hetero-deformation-induced (HDI) strengthening and strain hardening of samples during tensile deformation, which improved the ultimate tensile strength of the HS samples while maintaining a good uniform elongation. In addition, the heterogeneous structure of DSS had better corrosion resistance than the initial sample of coarse grain (CG) structure; mainly because the HS samples had finer grains and more grain boundaries on the DSS surface than the CG structure, which is conducive to the formation of high-density passivation film on the surface of stainless steel. The current study provides a new method of material selection of some structural components with the demands of high strength and good ductility.

1. Introduction

Stainless steel (SS) is widely used in the nuclear power industry, seawater systems, medical instruments, aerospace, and manufacturing because of its excellent resistance to corrosion and oxidation [1,2,3,4,5]. However, due to the harsh working environments in which it is used SS needs to combine strength and ductility, as well as corrosion resistance. Therefore, improving its mechanical and corrosion properties has always been of great interest to researchers and industry. In recent years, many metal materials with a heterogeneous structure (HS) have successfully overcome the trade-off between strength and ductility, and exhibit superior mechanical properties [6,7,8]. The outstanding mechanical properties of heterostructured materials are attributed to the interaction coupling between two regions with different mechanical properties (named soft and hard regions) coexisting in the same microstructure. When the HS metal materials are stretched or compressed, the soft and hard micro-regions cannot deform synchronously, leading to back stress and front stress at the interface. These collectively produce hetero-deformation-induced (HDI) strengthening to improve the yield strength and HDI strain hardening to maintain or enhance the ductility of the materials [9].
Currently, some research has been conducted on the mechanical properties of heterogeneous stainless steel materials. It has been found that 316 stainless steel with a gradient structure (GS) exhibits a better combination of strength and ductility than stainless steel with a coarse-grained structure [10]. Additionally, 316 SS with a heterogeneous layered structure exhibits greater strength and ductility than SS with a coarse grain (CG) structure [11]. In addition, compared with UFG and CG SS, bimodal SS exhibits a better combination of strength and ductility, which is attributed to the multi-size grain distribution [12]. Compared to single-phase SS, little attention has been given to the design and research of heterogeneous structures in duplex stainless steel (DSS). SAF2507 DSS is composed of ferrite and austenite in similar proportions, and it often undergoes stress and corrosion in its usage environment. Therefore, design and research of such materials need to focus on improving their mechanical properties without reducing their corrosion characteristics. An important feature of heterostructured materials is that they can combine different properties to ensure their multifunctional properties [9]. Therefore, designing heterostructures for SAF2507 steel is a key route to improving its mechanical properties. Thermomechanical methods can produce HS materials, mainly by combining rolling-based processes with partial recrystallization heat treatments, such as short-time annealing [13,14,15]. In this study, micro-heterostructures will be introduced into SAF2507 DSS using cold rolling, with different deformation amounts being combined with high-temperature–short-time annealing. The reasons for improvement of its mechanical properties through heterostructures will then be explored. Improving the mechanical properties of stainless steel plates with different thicknesses through heterostructure design can broaden the application of this material in the industrial field.

2. Materials and Methods

The chemical composition of the initial material was Cr-25, Ni-7.2, Mo-3.5, Mn-0.6, N-0.2, Fe-Balance (in wt%). This was obtained using energy-dispersive X-ray spectroscopy (EDS). The as-received SAF2507 DSS was vacuum annealed at 1523 K for 2 h to produce a uniform coarse-grain structure (hereafter referred to as CG sample). Next, the annealed plate (which was 11 mm thick) underwent 4 to 6 passes of cold rolling (CR) at room temperature. Deformation of approximately 10–15% per pass was achieved, resulting in a sample with 55–80% deformation and a plate thickness of 5 mm or 2.2 mm; hereafter, these will be referred to as CR55% or CR80% samples, respectively. The cold rolled plates with different thicknesses were cut into smaller sections with the dimensions of 120 mm × 10 mm (length × width) using wire-electrode cutting, and the plates were sealed using vacuum sealing machines (MRVS-3002, Partulab, Wuhan, China). After that, the sealed samples underwent vacuum (p > 1 × 10⁻³ Pa) annealing treatment at 1273 K for 1 min. This was followed by air cooling, after which the samples are named 55%–1273 or 80%–1273, respectively.
Dog-bone-shaped tensile samples, with the dimensions shown in Figure 1, were cut from the CG, CR55%, CR80%, 55%-1273, and 80%-1273 plates along the rolling direction using wire-electrode cutting. A uniaxial tensile test was performed at room temperature using a SHIMADZU Universal Testing Machine (Shimadzu, Tokyo, Japan), using a maximum load of 100 KN and a quasi-static strain rate of 6.6 × 10⁻⁴ s−1. The sample was stretched and deformed along the elongation direction shown in Figure 1. The loading-unloading-reloading (LUR) tests also used the SHIMADZU Universal Testing Machine under a 4.95 × 10⁻⁴ s−1 of quasi-static strain rate, which was set to strain points of 1%, 3%, 5%, 7%, 9%, 11%, and 13%. Because of the difference in gauge length compared to the uniaxial tensile test, there was a change in strain rate. At each strain, the sample was unloaded in a load-control mode to 20 N at an unloading rate of 1000 N·min–1, followed by reloading back to the level of applied load before unloading. At least three tensile tests were conducted under each testing condition to ensure the reproducibility of the stress–strain curves. The digital image correlation (DIC) method was used to observe in situ the strain distribution and evolution on the rolling direction surface of specimens during the tensile test. Random speckle patterns were placed on the observed surface by painting a white background and then spraying black dots over it. During the tensile test, the image of the tensile specimen was captured at a speed of 20 frames per second by the CCD camera. GOM Correlate software (2018, Rev.115656) was utilized for the DIC data analysis after the tensile test, which used the step size of 15 pixels and the subset size of 19 × 16 pixels. In addition, the sampling area of the Vickers microhardness tester (HVST-1000Z, Yingjianda, Chongqing, China) measured the microhardness of different phases and phase boundaries on the RD-TD plane. In the microhardness experiment, an applied load of 490 mN and a dwell time of 10 s were used for each hardness point. The distance between two adjacent indentations was 50 μm, with 10 points in each line; and 10 lines were extended in a direction perpendicular to the cross-section, with a total of 100 points forming a hardness-point matrix. The morphological characteristics, chemical composition, and microhardness position of the CG, CR, and 1273 K annealed samples were observed by field emission scanning electron microscope (FE-SEM, NOVA Nano SEM 450, FEI company, Hillsboro, OR, America) equipped with the electron backscatter diffraction (EBSD, Oxford Instrument NordlysMax2 detector, Abingdon, UK) and the energy-dispersive X-ray spectroscopy (EDS). The solution containing 10% potassium hydroxide and 90% pure water is used to conduct electrolytic corrosion on each sample for 30~45 s under 5 V voltage to inspect surface morphology characteristics. The grain orientation, grain size distribution, crystallographic defects, and substructures in the EBSD test of the samples were analyzed using Channel 5 software. Transmission electron microscopy (TEM, FEI-Tecnai-F30, FEI company, Hillsboro, OR, USA)—operating at 300 kV with selected area electron diffraction (SAED) and the EDS plugin—was used to study the microscopic morphology characteristics of the samples. To prepare for this, the samples with a diameter of 3 mm were mechanically thinned down to the thickness of 60 μm; this was followed by twin-jet electropolishing in a 25 V electrolyte mixture consisting of 10% perchloric acid, 20% ethylene glycol butyl ether, and 70% methanol at 248 K.
Electrochemical corrosion performances of 2507 DSS in 3.5 wt% NaCl solution were evaluated by an electrochemical station (CS2350H). A typical three-electrode system consisting of DSS samples as the working electrode, platinum as the counter electrode, and a saturated calomel electrode as the reference electrode was used for electrochemical measurement under normal atmospheric temperature. Before each test, the polished samples were ultrasonically cleaned in acetone and ethanol, then covered in copper wire and cathodically polarized at −1.2 VAg/AgCl for 300 s to remove the natural passive film. The potentiodynamic polarization tests were conducted at a sweep rate of 1 mV·s−1, and the AC signal amplitude of 5 mV within a frequency range of between 100 kHz and 10 mHz was used for the electrochemical impedance spectroscopy measurements.

3. Results and Discussion

3.1. Microstructure Characterization

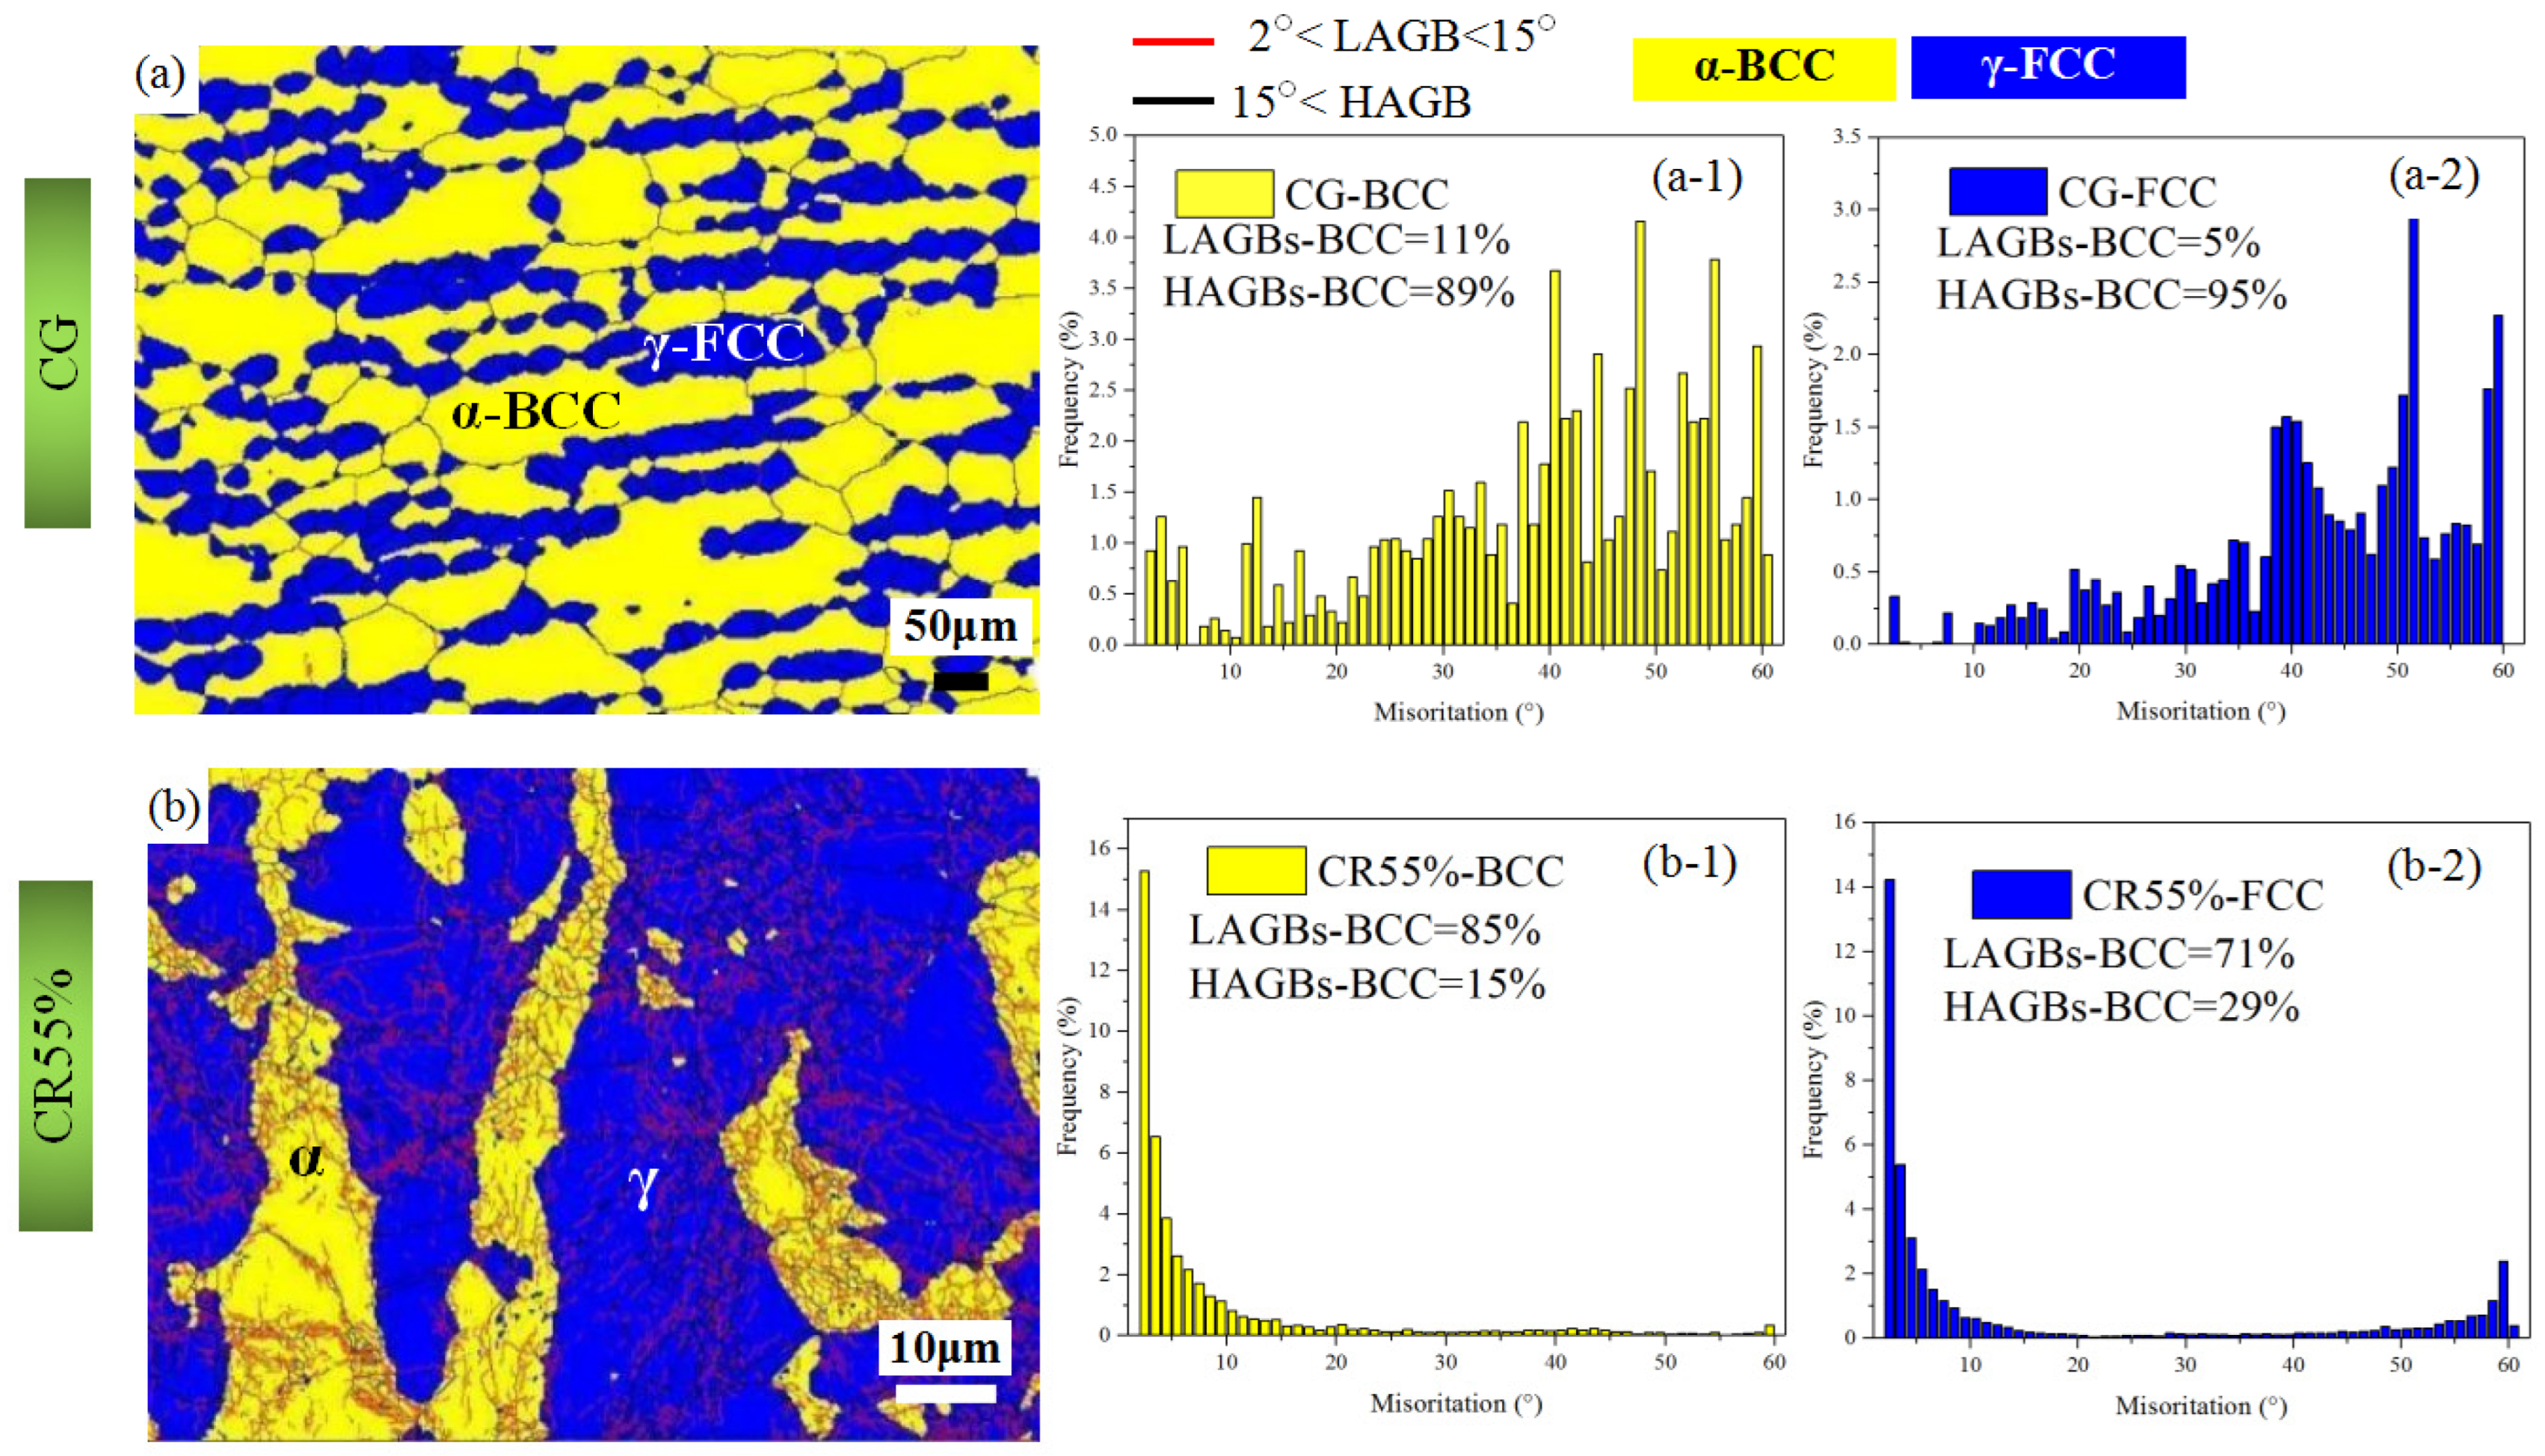
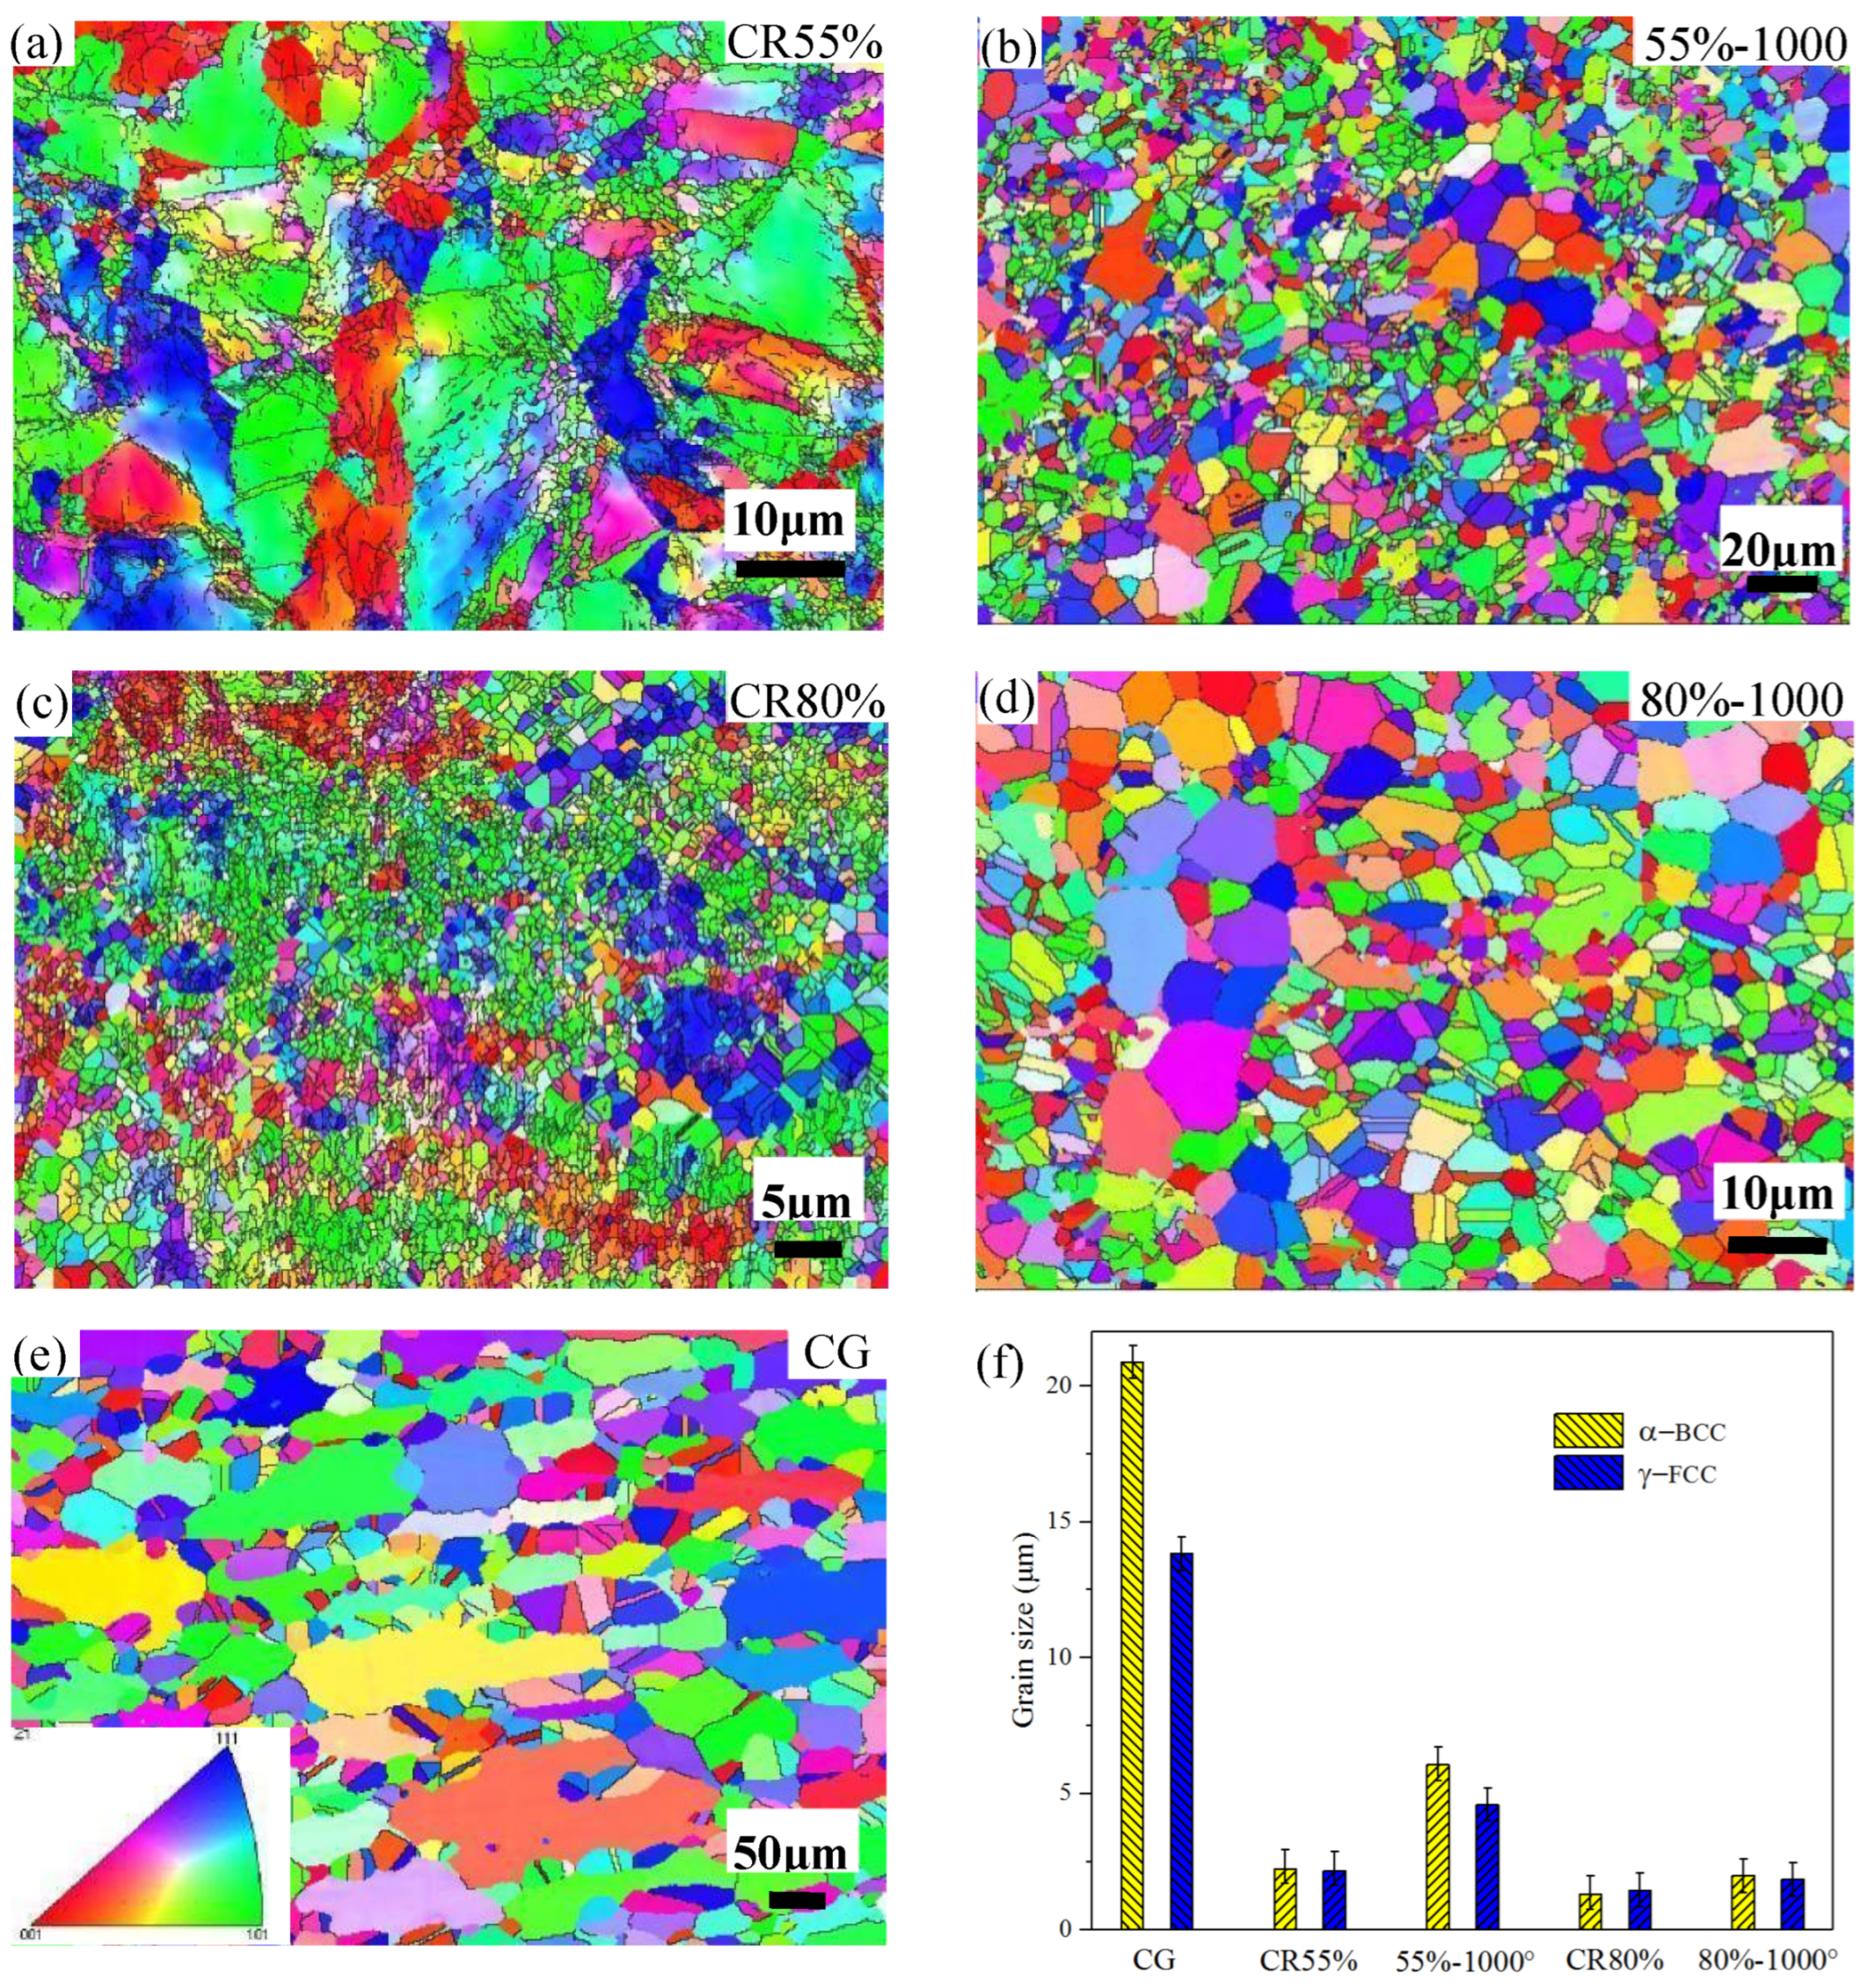
3.1.1. EBSD Analysis
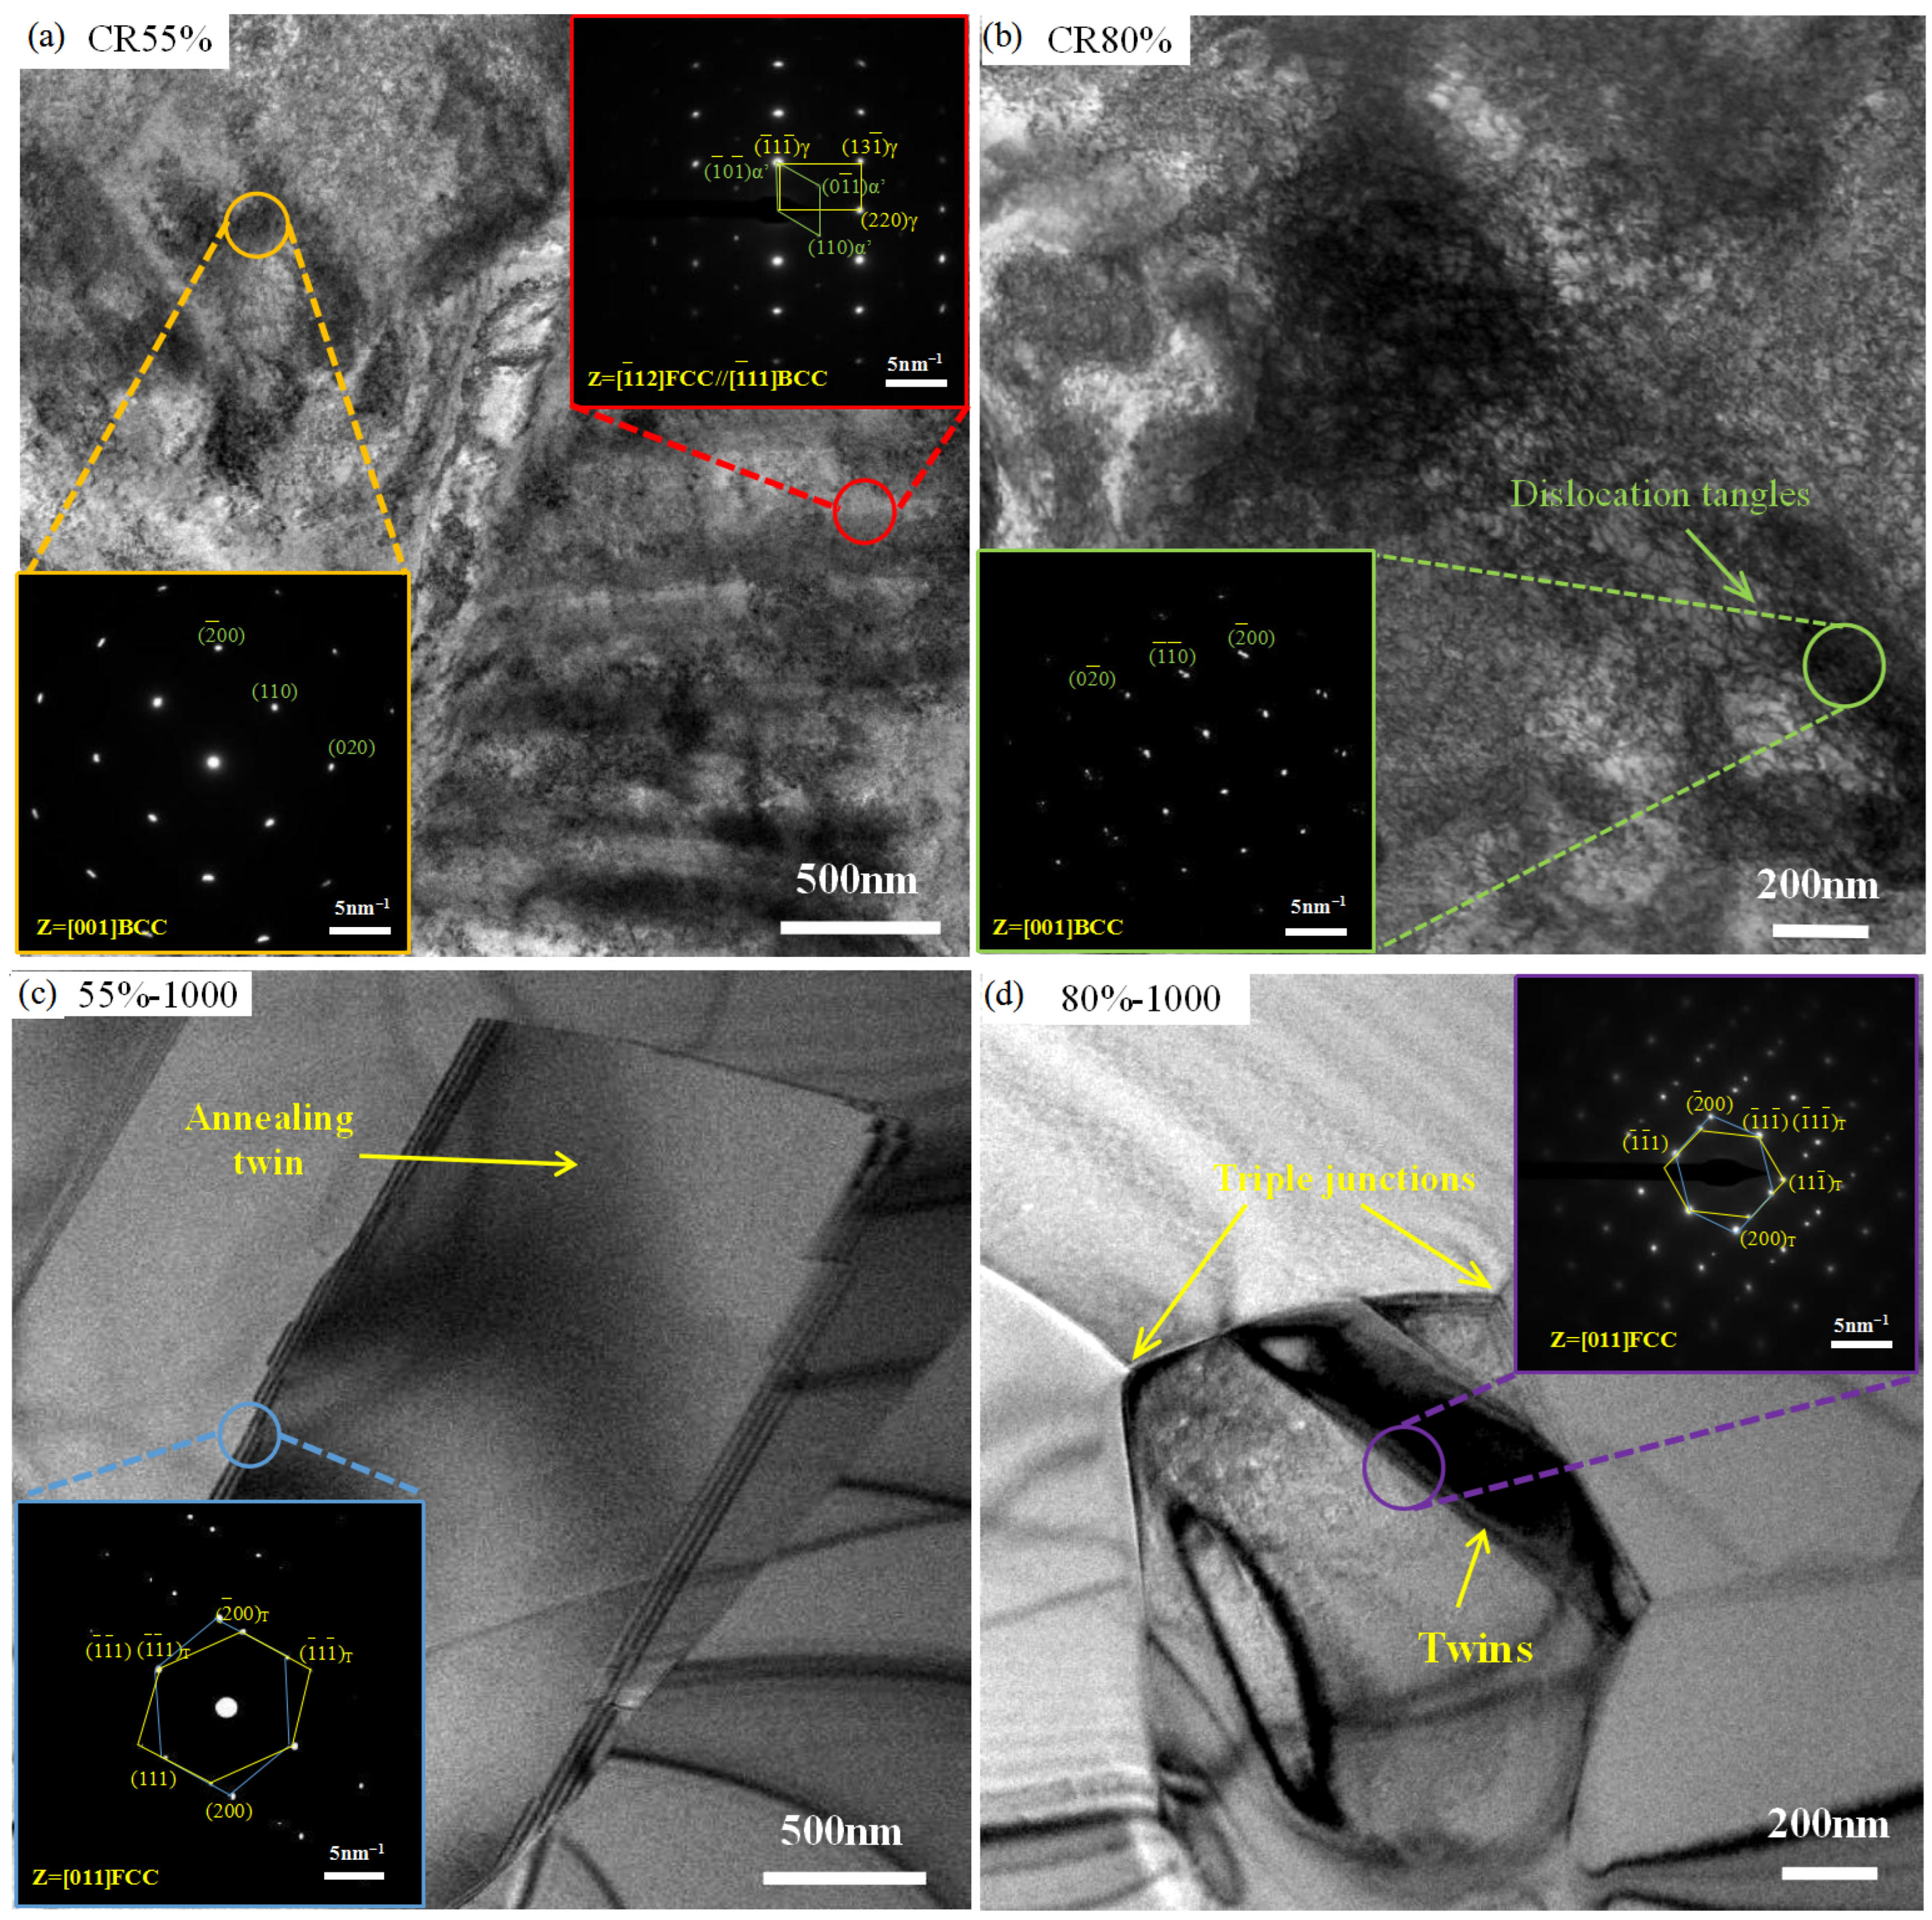
The ferrite, with the body-centered cubic (BCC) structure; and the austenite, with the face-centered cubic (FCC) structure are represented as yellow and blue areas, respectively, in Figure 2. The proportion of BCC-phase and FCC-phase in the initial sample, rolled sample, and short-time annealed sample are shown in Table 1; this was determined through EBSD testing of at least three regions. The content of the BCC-phase in the cold rolling samples is increased to a certain extent, while the content of the FCC-phase decreases slightly. It is speculated that the rolling deformation can lead to the transformation of austenite into deformed martensite, which is the reason for the reduction of FCC-phase content in the sample after rolling. Due to the body-centered tetragonal structure of the deformed martensite, it is classified as BCC-phase in EBSD analysis, and this increases the BCC-phase content of the rolled sample. However, after short-time annealing, the content of the FCC-phase in the sample rapidly increased, while the content of the BCC-phase decreased. It is thought that this is because the deformed martensite phase was transformed into the austenite phase under high temperature, increasing the content of the FCC-phase. Due to the high content of stable austenite phase elements such as Ni and Mn in 2507 steel, only a small portion of metastable austenite phase transformation occurred during the rolling process. Therefore, the change in the content of the two phases is not significant, and after high-temperature annealing the content recovers to similar levels to those in the initial sample.
The grain boundary (GB) distribution maps including the corresponding misorientation angle distributions in the CG, CR55%, CR80%, 55%-1273, and 80%-1273 samples are shown in Figure 2a–e and Figure 2(a-1–e-2), respectively. The red lines represent the low-angle grain boundaries (LAGBs) with the misorientation between 2° and 15°, while the black lines represent high-angle grain boundaries (HAGBs) with a misorientation greater than 15° including the twin boundaries. Misorientation below 2° is not calculated in the grain boundary distribution map. This is because of the orientation noise arising from the testing instruments and micro-defects on the surface of samples. In the CG sample, after high-temperature annealing treatment, thick and big equiaxed grains are formed, and the grain boundaries of the two phases are mainly composed of HAGBs, with the annealing twin boundaries included in the HAGBs of the FCC-phase. After the rolling deformation, a large amount of LAGBs are formed in both phases of the CR55% and CR80% samples, leading to grain refinement. However, a certain proportion of the HAGBs appeared in the FCC-phase of the rolled samples. This is due to the inclusion of twin boundaries generated by rolling deformation into the austenite structure (as shown in Figure 2(b-2,d-2)). In Figure 2(c-1,e-1) showing the 55%-1273 and 80%-1273 samples that underwent high-temperature annealing, the content of the HAGBs in BCC-phase increased rapidly, and the overall grain boundaries are distributed in multiple sizes. However, the FCC-phase is mainly composed of the HAGBs, accounting for up to 92% (as shown in Figure 2(c-2,e-2)).
In order to investigate whether the grains undergo rolling and annealing treatment to produce texture characteristics, the inverse pole figure (IPF) area distribution map of the CG, CR55%, 55%-1273, CR80%, and 80%-1273 samples are measured by EBSD and exhibited in Figure 3. From Figure 3a–e, it can be seen that the five types of sample do not exhibit strong texture characteristics with special crystallographic directions. Figure 3f shows the average grain size, calculated using Channel 5 software (5.0.9.0), of the two phases in different samples from the EBSD test at the RD-TD plane. It can be seen that the CG sample is mainly composed of large-size grains, and the average grain size of the ferrite and austenite are 21 μm and 14 μm, respectively. The grain size of both ferrite and austenite phases in the two samples subjected to cold rolling is significantly refined. The average grain size of the CR55% sample is approximately 2 μm, while the CR80% sample is in the range of 1 μm–1.5 μm. Although the average grain size of the 55%-1273 samples is smaller than that of the CG sample, there are some large grains above 15 μm; and the ferrite and austenite are 6.1 μm and 4.6 μm, respectively. However, the average grain size of the 80%-1273 sample is less than 2 μm, and the grain sizes have been significantly refined compared to the CG sample. This is due to the inverse relationship between the degree of cold rolling deformation and the size of recrystallized grains. As cold rolling deformation increases, the storage energy driving grain nucleation and growth continuously increases and the nucleation rate is improved; this leads to the gradual refinement of recrystallized grain sizes. In addition, it can be seen in Figure 2d,e that there are about 6–8 small austenite grains around one coarse ferrite grain in the 1273 K annealed samples, while only 3–4 austenite grains surround the ferrite of the CG sample. According to Figure 2 and Figure 3, it can be observed that the SAF2507 stainless steel obtained the heterostructure composed of the mosaic distribution of large- and small-size grains, multi-size grain boundaries, and twins.
The changes in microstructure within the initial material of SAF2507 stainless steel after rolling and annealing are shown in Figure 4(a-1–e-2). The deformed, substructured, and recrystallized grains of the CG, CR55%, 55%-1273, CR80%, and 80%-1273 samples are measured by the internal average misorientation angle within the grains, which are attained from the total local misorientation values divided by pixel number in grains [9]. The grains of the red areas signal “deformation”, which indicates that the average disorientation angle of the grains exceeds 2° due to the occurrence of severe dislocation accumulation. The particles with yellow regions are then divided into “substructures”, which indicate an internal mean orientation error of less than 2°. In addition, particles in the blue region are defined as “recrystallized”; that is, the particles are recrystallized with little or no average declination. From Figure 4(a-1,a-2), it can be seen that, after 2 h of 1523 K annealing, both the ferrite (α-BCC) phase and the austenite (γ-FCC) phase formed equiaxed recrystallized grains, and the grain sizes of the austenite phase are smaller than the ferrite phase. Due to the difference in crystal structure between ferrite and austenite, the microstructure changes of the two phases are also different during later rolling deformation and annealing processes. The BCC-phase of the CR55% sample is mainly composed of deformed grains, and some grain boundaries appear inside the larger grains after cold rolling (Figure 4(b-1)). At the same time, except for a large number of deformed grains, a certain number of recovery substructure grains and twins also appear in the FCC-phase (Figure 4(b-2)). When the rolling deformation increased to 80%, a certain number of recrystallized grains appeared in the BCC-phase (Figure 4(c-1)), while many recovery substructure grains were added in the FCC-phase (Figure 4(c-2)). This is because the plastic deformation mechanism of the BCC-phase is dominated by dislocation slip, so microstructure evolution during the rolling process is mainly dislocation increment and recrystallization. However, the deformation mechanism of the FCC-phase is dominated by recovery and twins, so the microstructure changes that occur during rolling deformation are presented as twins and substructure grains. High temperature–short-time annealing resulted in a large number of recrystallized grains in the BCC phase and the FCC phase of the 55%-1273 sample, and the grain sizes of the BCC phase grew significantly, as shown in Figure 4(d-1). However, there is twins distribution in the FCC-phase of the 55%-1273 sample (Figure 4(d-2)), and the degree of grain growth is lower than that of the BCC phase. In the BCC-phases of the 80%-1273 sample shown in Figure 4(e-1), recrystallized grains are mainly present, and the grain sizes of the BCC phase have slightly increased compared with the CR80% sample. However, the grain size of the FCC phase is not significantly different from the corresponding rolled sample, and a large number of recrystallized grains appear near the twin boundaries of the FCC phase (Figure 4(e-2)). The reason for this phenomenon is that the stacking fault energy of the austenite (FCC) phase is lower than that of the ferrite (BCC) phase [16]. During the deformation process, the austenite phase with lower stacking fault energy will accumulate more lattice distortion and produce more crystal defects such as stacking faults and twins [17]. The recrystallized grains near the defects are more likely to nucleate after annealing [18]. Due to the accumulation of more lattice distortion than the ferrite phase, as well as high-density twins hindering grain growth, finer austenite recrystallized grains are formed in the rolled–annealed sample.

3.1.2. TEM Analysis

The microstructure characteristics of the rolled and rolled–annealed samples as revealed by TEM are shown in Figure 5. It can be seen in Figure 5a that the ferrite grain of the BCC structure on the left side of the CR55% sample is mainly distributed with dislocations, while the austenite on the right side is calibrated by selected area electron diffraction (SAED) and the deformed martensite (α’) appears on the austenite matrix. This is because the austenite phase of the FCC structure with low stacking fault energy undergoes deformation-induced martensitic transformation due to cold rolling. In the CR80% sample, as shown in Figure 5b, it can be observed that as rolling deformation increases, dislocation entanglement appears in the ferrite phase, which will gradually form the dislocation cell structures and refine the grain size. In the short-time annealed 55%-1273 sample, the annealing twins are shown in the austenite phase (Figure 5c). In Figure 5d, the obvious triple junction means that the austenite grains of the 80%-1273 sample are recrystallized on both sides of the twins boundary, which indicates that austenite refines the grain size through recrystallization. In addition, similar to the sample of 55%-1273, triple junctions remain at the austenite grain boundaries, and the black defects inside the twins are speculated to be the residual dislocations. The deformation process of ferrite is mainly dominated by the cross-slip of dislocations; therefore, the dislocations are prone to entanglement and form dislocation cells that are micrometers or nanometers in size. This refines the grain size of the ferrite phase. Unlike ferrite in the cold rolling samples, during the deformation process of austenite, grain segmentation and refinement are mainly achieved through the twins. During high-temperature—short time annealing, due to the fact that recrystallization nucleation often occurs near crystal defects, high-density dislocation, grain boundaries, and twins distribution in the rolled samples provide the dense nucleation area for recrystallization. Therefore, the recrystallization grains in the 55%-1273 and 80%-1273 samples contain grains of micrometers or even nanometers in size.

3.2. Mechanical Properties

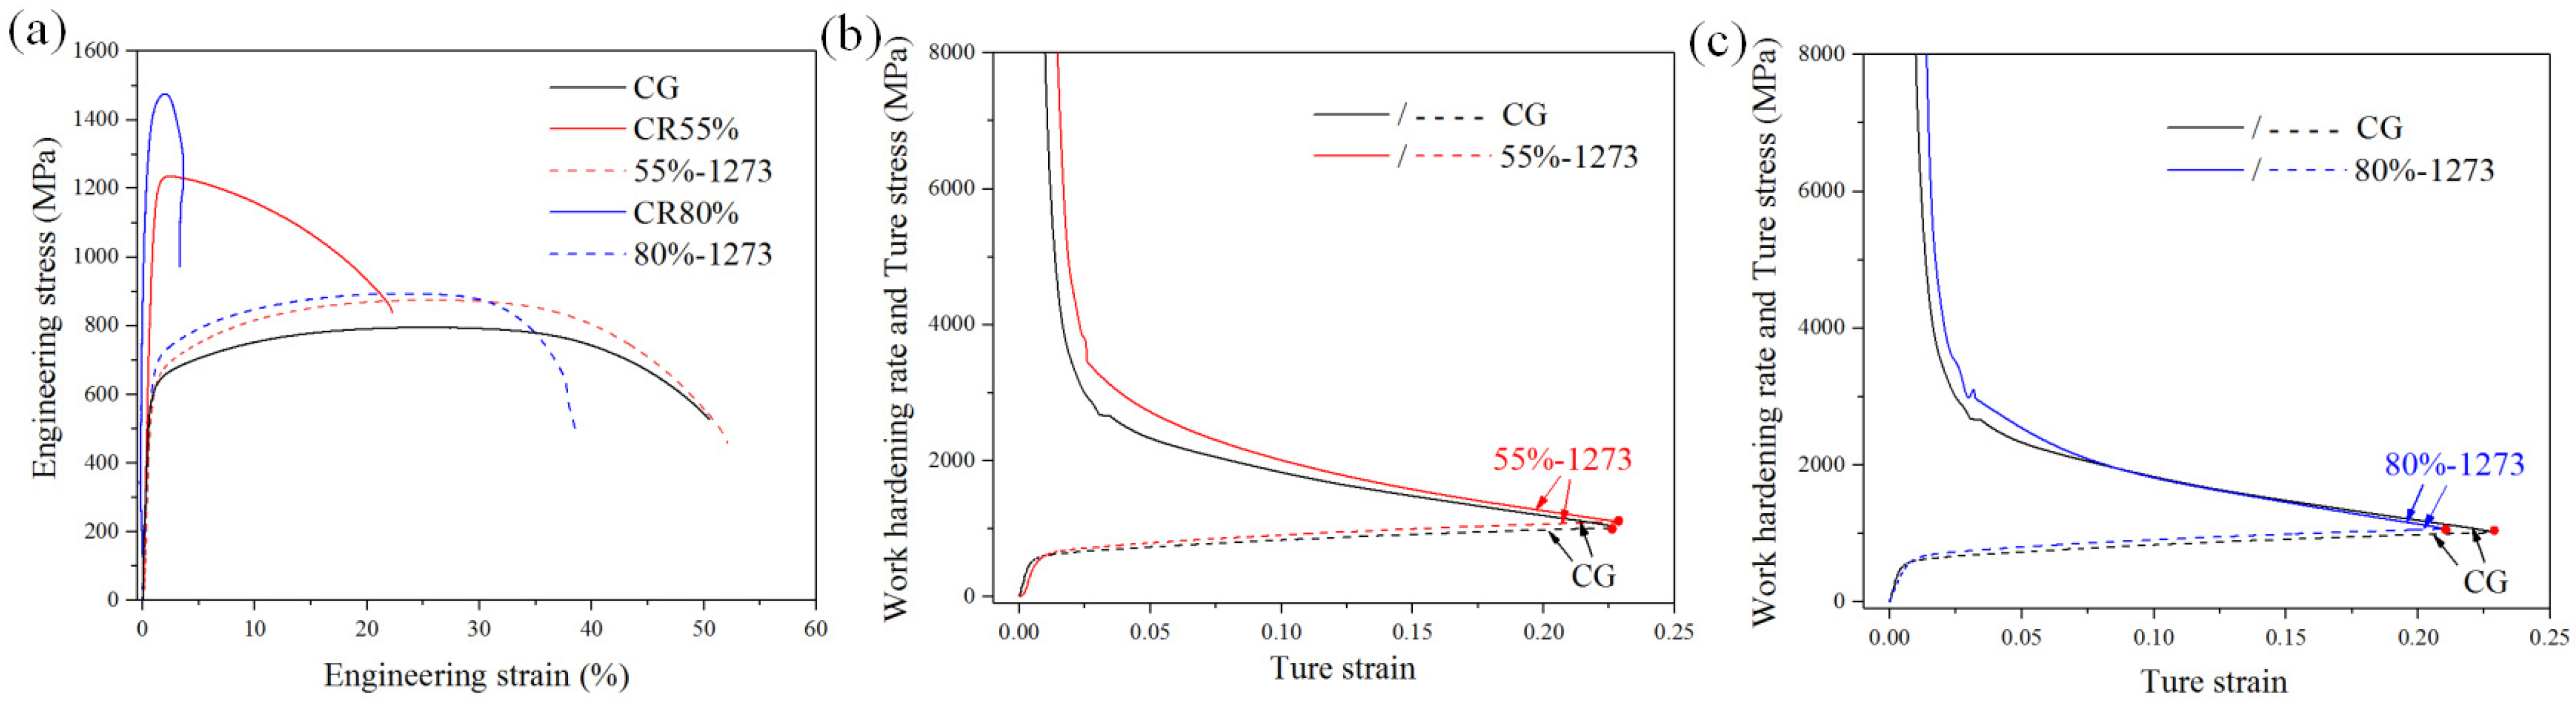
3.2.1. Tensile Property and Microhardness

The engineering stress–strain curves and the CG, CR, and short-time annealing samples are shown in Figure 6a. The values of the tensile properties and microhardness are summarized in Table 2. The rolled samples showed a significant increase in yield strength (YS) and ultimate tensile strength (UTS) compared to the CG sample, and a loss in uniform elongation (UE) of the material. This is because rolling increases a large number of grain boundaries, refines grain size, and at the same time increases a large number of dislocations in the grains. During tensile deformation, a large number of grain boundaries hinder the movement of dislocations, increasing the external force required for tensile deformation and thus improving material strength. Due to the limited ability of the fine deformed grains and substructure grains generated by rolling to accommodate dislocations, as the deformation of the sample continues to increase, the dense accumulation of dislocations at the grain boundaries makes it impossible to continue coordinated deformation between grains; thereby promoting the generation of cracks and reducing the ductility of the samples. In Table 2, compared with the hardness of the CG sample, the two-phase hardness and overall hardness of the rolled sample have been significantly improved, which further explains the increased strength of the CR sample.
From Figure 6a, it can be seen that after annealing at 1273 K, the YS of the two rolled samples rapidly decreased but the UE significantly increased. This is due to annealing causing grain growth in both phases and the disappearance of crystal defects generated by rolling due to annealing. The hardness of the 55%-1273 and 80%-1273 samples significantly decreased, resulting in a significant reduction in yield strength compared to the rolled samples. It is worth noting that the YS of the 55%-1273 sample shows a slight increase compared to the CG sample, while UTS improvement is more significant. The reason for this phenomenon is that the heterostructure distribution of 55%-1273 sample, different sizes of grain boundaries, and twins can coordinate the generation, movement, and storage of dislocations during tensile deformation, thereby enhancing the strain hardening of the rolled–annealed sample (Figure 6b). This results in a higher UTS in the 55%-1273 sample compared to the CG sample. However, the 80%-1273 sample still maintains a small grain size after annealing, and its strength and strain hardening are improved under the effect of fine-grain strengthening (Figure 6c). Therefore, the YS and UTS of the 80%-1273 sample are much higher than that of the CG sample. In addition, the intersection point (red dot) of the strain-hardening curve and the true stress–strain curve represent the true strain value at the beginning of the necking in the sample. In Figure 6b,c, the strain values for the necking start of the 55%-1273 and 80%-1273 samples are very close to those of the CG sample. Combined with the UE values of the three types of samples in Table 2, this indicates that the rolled–annealed samples have similar ductility to the CG sample.
The rolled–annealed SAF2507 steel maintains similar ductility to the initial sample while increasing its microscopic heterogeneous structure. From Table 2, it can be seen that the hardness of the austenite phase (FCC) is higher than that of the ferrite phase (BCC). During tensile deformation, the BCC for the soft region would begin plastic deformation first, but development of the deformation would be restricted by the surrounding FCC for the hard region, leading to the accumulation of geometrically necessary dislocations (GNDs) at the boundary of the two domains; this results in the strain gradients. In addition, the 1273 K annealed samples have the multi-size distribution of the grain boundary, phase boundary, and twins boundary. This indicates the presence of massive hetero-zone boundary-affected regions (Hbar) in the HS samples [9], which leads to the accumulation of GNDs at the grain, twins, or phase boundaries during tensile deformation; this results in the enhancement of strain gradients at the Hbar interfaces. Increased strain gradient accompanies the increased tensile strain at the interfaces and this will continue to generate hetero-deformation-induced (HDI) stress, resulting in HDI strengthening and HDI strain-hardening effects in the HS samples.

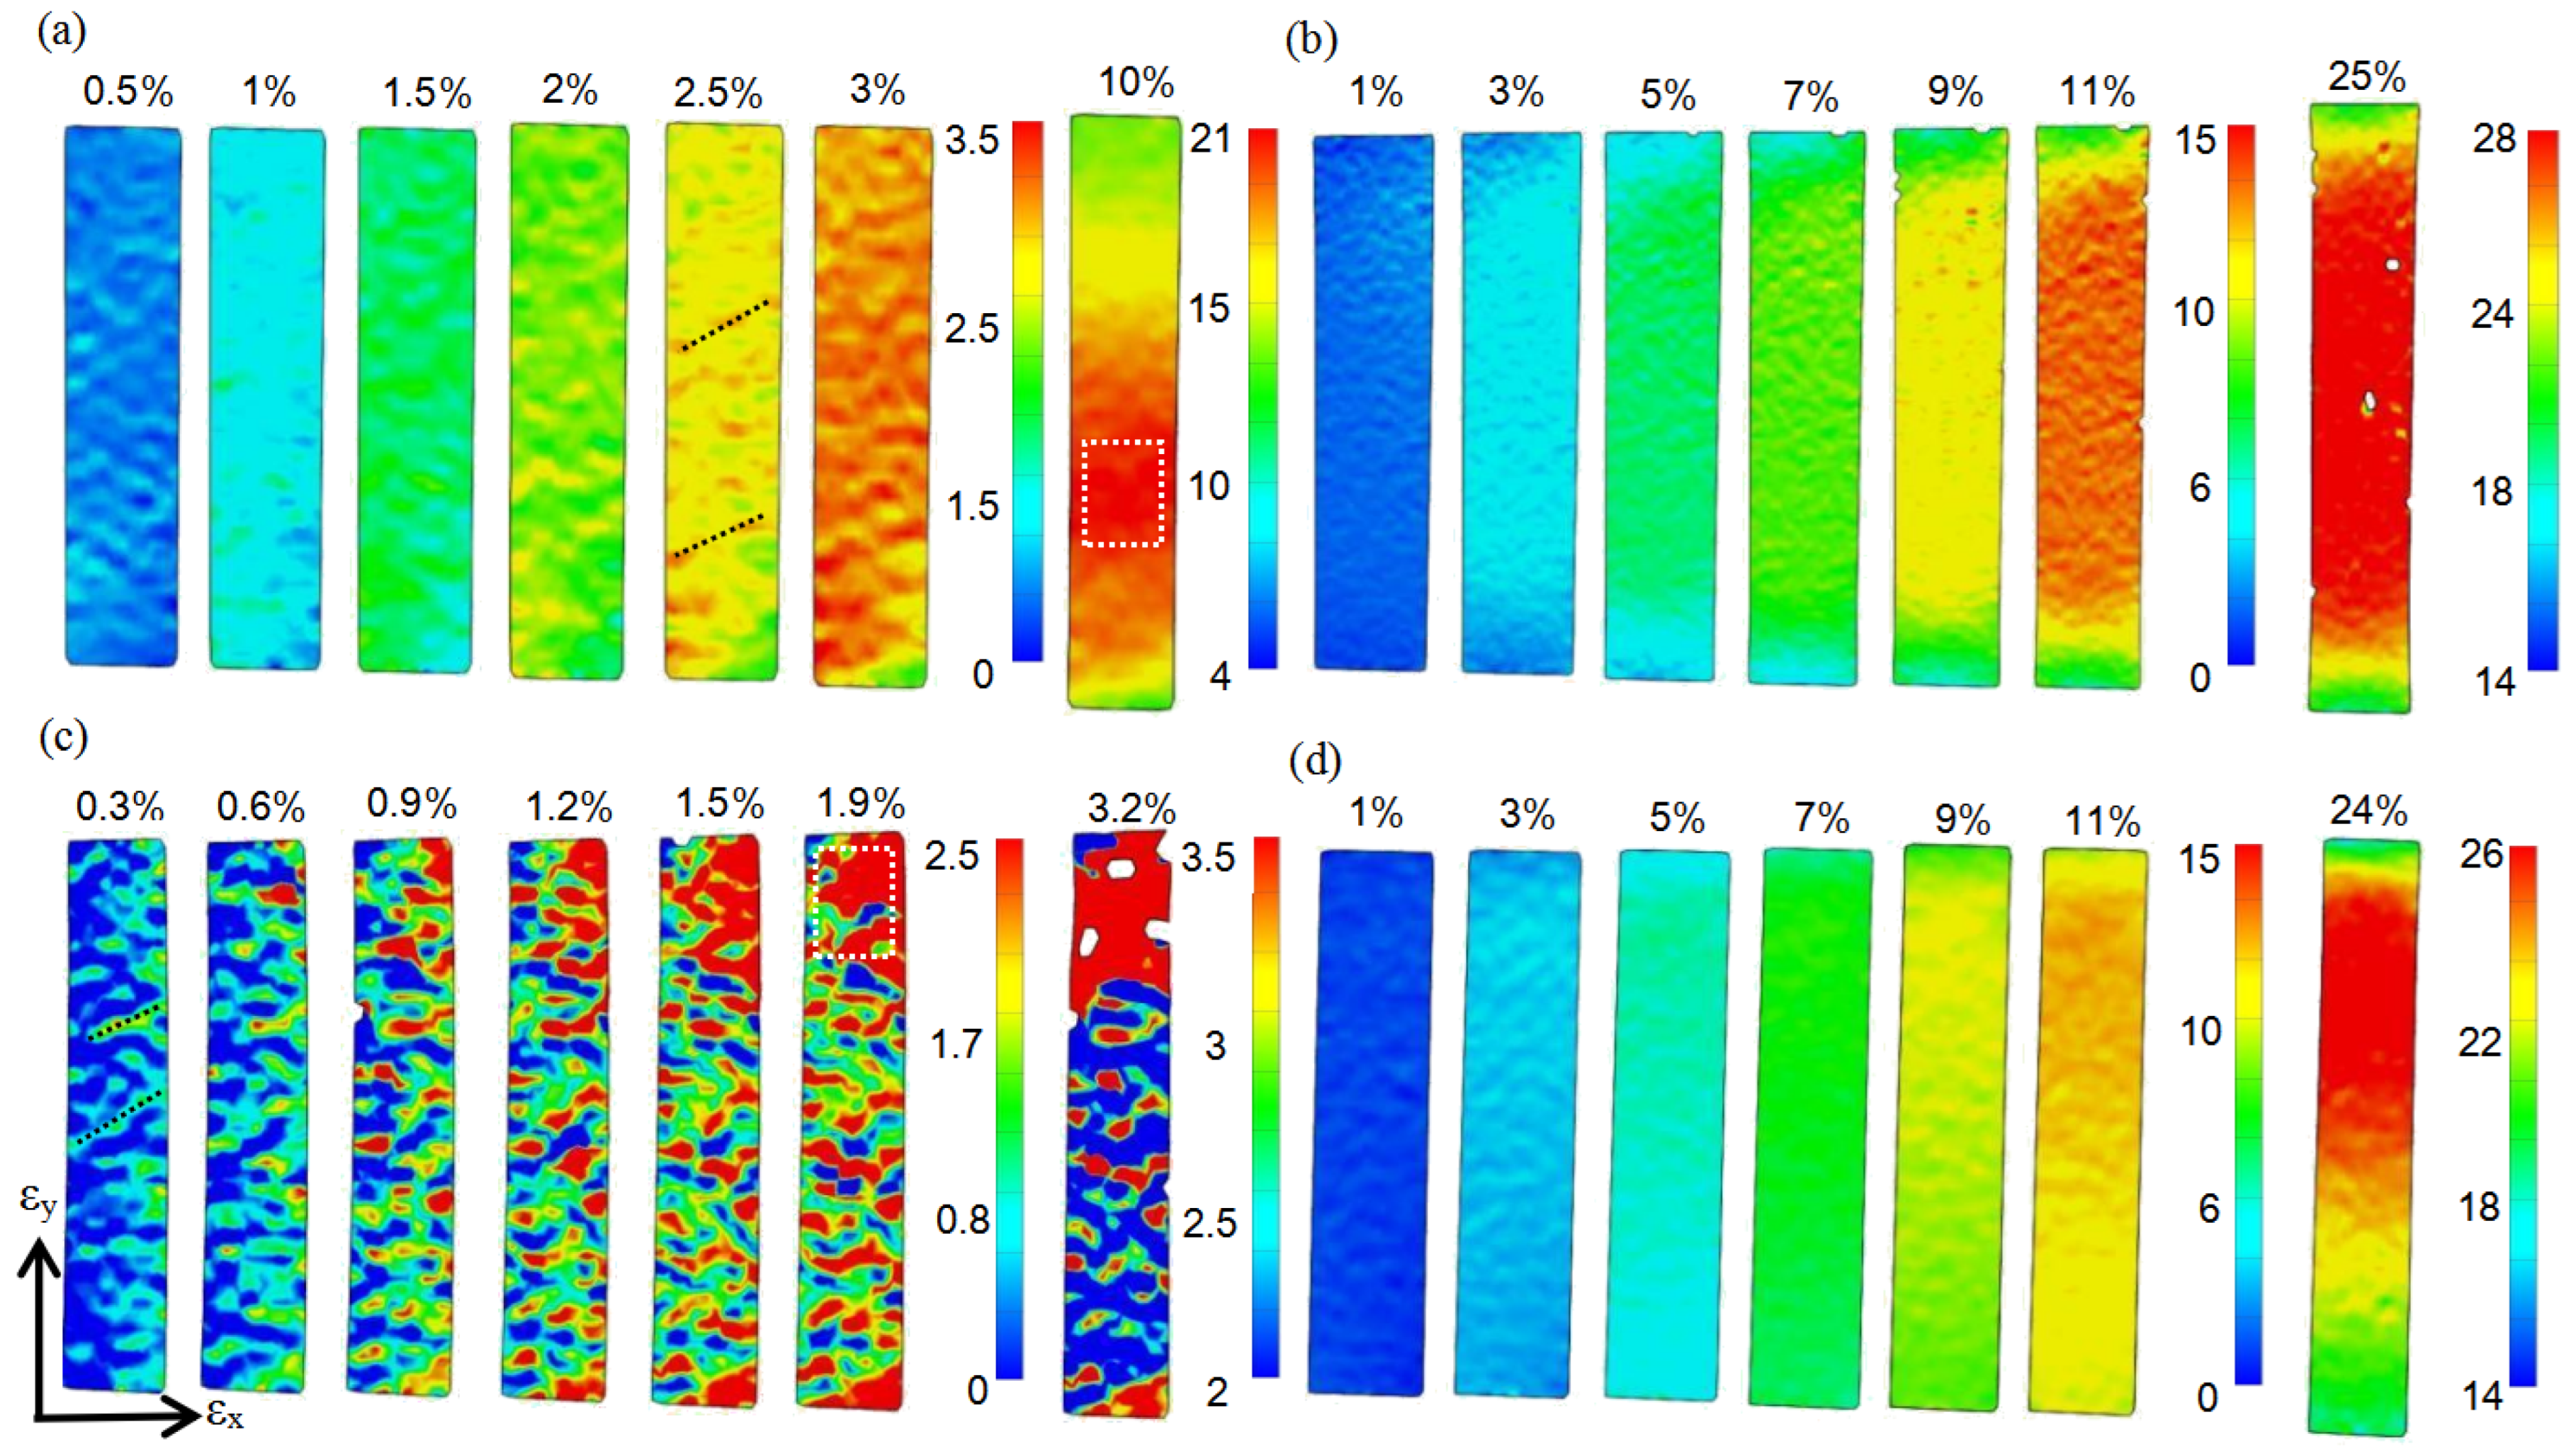
3.2.2. HDI Strengthening and HDI Strain Hardening

The generation of HDI stress comes from the accumulation of GNDs during the deformation process, and some of the dislocations generated during the rolling process could still be retained in the samples after short-time annealing treatment. These residual dislocations, especially GNDs, would contribute to the increase of yield strength during tensile deformation of 55%-1273 and 80%-1273 samples, which is the HDI stress strengthening effect. The GNDs can change the orientation of the lattice, and EBSD can be used to measure the local orientation changes of the BCC-phase and FCC-phase grains to reflect the distribution of GNDs in the rolled–annealed samples. In Figure 4(a-3–e-4), local misorientation (LM) maps of two phases in CG, CR55%, CR80%, 55%-1273, and 80%-1273 samples are shown. In this work, the kernel average misorientation (KAM) method is used to determine the local misorientation from the EBSD orientation data [19] and calculate the GND density of the α-BCC phase and γ-FCC phase in samples using the following formula [20]:
ρGND = 2θ/μb
where θ is the average value of local orientation difference in the region, μ is the step size for the EBSD experiment selected, and b is the Burgers vector with 0.248 nm for BCC structure and 0.256 nm for FCC structure. According to Formula (1), the GND density values of the ferrite and austenite phases in the initial sample are 5.22 × 10¹² m−2 and 6.33 × 10¹² m−2, respectively. After cold rolling, as can be seen in Figure 4(b-3,b-4,c-3,c-4), the GND density distribution of the CR samples was significantly increased. The higher the rolling deformation amount, the higher the GNDs density of the samples; as a result, the yield strength and two-phase hardness of the CR80% sample are higher than that of the CR55% sample. Compared to the CR55% sample, the GND density values of the 55%-1273 sample decrease rapidly; and the ferrite and austenite phases are 6.67 × 10¹² m−2 and 7.6 × 10¹² m−2, respectively. Due to the lack of significant grain size refinement in the 55%-1273 sample and the small difference in GND density values compared to the CG sample, grain refinement strengthening and dislocations strengthening make little contribution to the enhancement of the yield strength in the 55%-1273 sample. However, in the 80%-1273 sample, the GND density values of the two phases are 1.56 × 10¹³ m−2 and 1.69 × 10¹³ m−2, respectively. This indicates that the 80%-1273 sample has a higher GND density and significantly finer grain size than that of the CG sample. This results in a combined effect of grain refinement and value increase of dislocations to improve the yield strength of the 80%-1273 sample.
Homogeneous materials can also generate HDI stress, but their values are usually relatively low [21]. This is due to the Bauschinger effect and HDI strengthening having the same physical origin [22]. Therefore, the LUR experiment can be used to quantitatively measure the Bauschinger effect, to reflect the HDI stress strengthening caused by the increase of the GND density in different samples. The LUR stress–strain curves of CG, 55%-1273, and 80%-1273 samples are shown in Figure 7a, and the HDI stress can be calculated with the formula [23]:
σ HDI = σ r + σ u 2
where σu and σr as the unloading and reloading yield stress are defined in the LUR stress–strain curve at the lower right corner of Figure 7a. From Figure 7b, it can be seen that the HDI stress value of the 55%-1273 sample is relatively close to that of the CG sample at lower true strains. This indicates that the 55%-1273 sample has a relatively small increase in YS, which is also consistent with the small difference in stress between the two types of samples, shown in Figure 7a, when the strain values are low. However, as the strain continues to increase, the difference between the HDI stress of the 55%-1273 sample and the CG sample begins to widen, and the proportion of HDI stress in the flow stress gradually increases, resulting in a significant enhancement of the HDI strain-hardening effect in the 55%-1273 sample. Due to the different accumulation of GND density in the early stage, the HDI stress value of the 80%-1273 sample is significantly higher than that of the CG sample at 1% strain (as shown in Figure 7c). This suggests that HDI stress plays an important role in strengthening the early deformation of the sample and leads to a significantly better yield strength in the 80%-1273 sample than in the CG sample. In Figure 7b,c, which compares the HDI stress values for the CG sample with that of the rolled–annealed samples shows that the gaps between the curves gradually increase as the strain increases. This indicates that HDI stress begins to dominate the strain hardening of the sample after rolling and annealing. This is the reason why the UTS of the 55%-1273 and 80%-1273 samples are higher than that of the CG sample, while the UE is almost consistent with the CG sample. In addition, due to the lower density of GNDs retained in the 55%-1273 sample compared to the 80%-1273 sample, the strengthening effect of HDI stress on the yield strength of the sample is weaker when the tensile strain is small. However, due to the greater differences in grain size between the two phases in the 55%-1273 sample compared to the 80%-1273 sample, the larger size of ferrite grain has lower hardness of grain boundaries, which are more likely to be crossed by dislocations during tensile deformation. As the strain values increase, the coarse ferrite grains can accommodate more dislocations to coordinate the deformation between the two phases [24]. Therefore, the 55%-1273 sample has more ductility than the 80%-1273 sample.
The strain distribution on the RD-TD plane of SAF2507 steel rolled and rolled–annealed samples during in situ tensile tests is observed using the DIC method, and this is shown in Figure 8a–d with the contour maps. The CR55% and CR80% samples have shown obvious strain band distribution during the early deformation process (εy < 3%), indicating that the sample exhibits local strain concentration in the early stage of deformation. In Figure 8a,c, it can be seen that as the tensile strain increases, the distribution of strain bands concentrates in a small region, ultimately leading to the fracture of the sample at this location. However, in the samples of 55%-1273 and 80%-1273, there is almost no local strain concentration before 9% of applied strain in Figure 8b,d. It is not until the tensile strain reaches the UE value that the strain concentration distribution appears in a large region. Due to the lower hardness of ferrite compared to austenite, dislocations are more likely to pass through the two-phase interface and enter the ferrite grains during tensile deformation. As the larger grain size of ferrite can accommodate and store more dislocations, it delays the concentration of strain regions caused by the accumulation of dislocations at the interface, resulting in more dispersed strain distribution in the sample [25]. At the same time, due to the presence of a large number of stacking faults in austenite, twinning is more likely to form during deformation, leading to the TWIP effect, which is beneficial for improving the tensile plasticity of the sample [26,27]. Therefore, SAF2507 steel with obvious heterostructure has greater strength than CG samples, while also possessing good ductility.

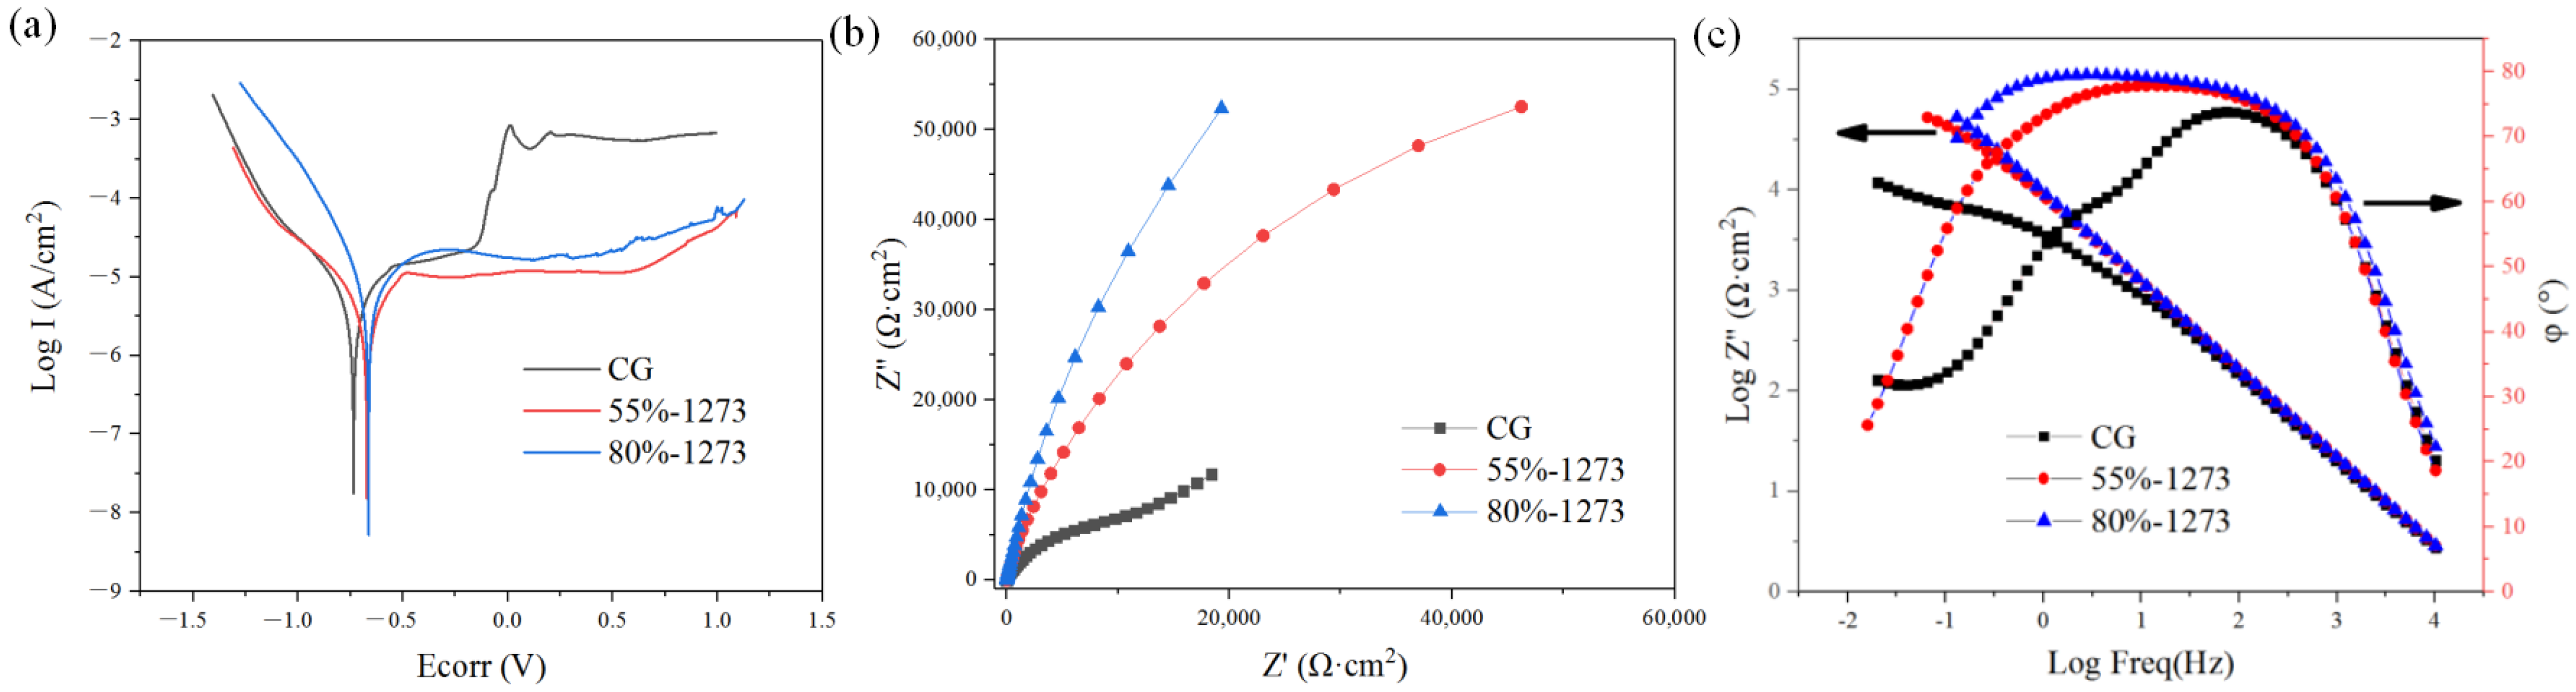
3.3. Corrosion Properties

The corrosion performance of the different samples is evaluated by the electrochemical method, and this is shown in Figure 9a. The main characteristic values of the potentiodynamic polarization curve are shown in Table 3. Compared with the CG sample, the corrosion potential (Ecorr) of the two rolled–annealed samples is higher and the corrosion current density (Icorr) values are also lower than that of the CG sample. This indicates that the corrosion resistance of heterogeneous SAF2507 steel is stronger than the as-received sample. The reason for this phenomenon is the small grain size of heterostructure samples, which shortens the distance of Cr diffusion from the inside of the grains to the grain boundaries and accelerates the formation of passivation films on the surface of the samples [28]. In addition, due to the fact that heterogeneous samples have more grain boundaries than the initial sample, their surface has a higher density of passivation film. This has a very positive effect on improving the corrosion resistance of duplex stainless steel [29]. The passivation current density (Ipass) can reflect the dissolution rate of the passivation film, and the lower the current density, the better the corrosion resistance. The pitting potential (Epit) can reflect the lowest potential value that can cause pitting corrosion on the passivated metal surface. The higher the pitting potential, the better the anti-potting performance of the metal material. From Table 3, it can be seen that the Ipass values of the two annealed 1273 K samples are smaller than those of the CG sample, and the Epit values are significantly higher than those of the CG sample. This further indicates that the corrosion resistance of heterogeneous SAF2507 stainless steel is better than that of stainless steel with an homogeneous (coarse grain) structure.
Electrochemical impedance testing can also investigate the difference in corrosion resistance between homogeneous and heterogeneous structure samples. The electrochemical impedance spectra of three types of samples in 3.5% sodium chloride solution are shown in Figure 9b, and the curve in the Nyquist plot shows an incomplete capacitive arc. The radius of the capacitive arc corresponds to the stability of the passivation film and the corrosion resistance of the sample. The larger the radius of the capacitive arc, the greater the corrosion resistance of the metal in the corresponding medium. It can be seen that the capacitance arc radii of the 55%-1273 and 80%-1273 samples are significantly larger than those of the CG sample, and the annealing sample with more rolling deformation corresponds to a larger capacitance arc radius. The reason for this phenomenon is that grain refinement increases the density of passivation film distribution on the surface of the metal sample. In addition, Figure 9c shows the Bode plot between frequency and phase angle as well as frequency and impedance mode values. From the graph, it can be seen that the two heterogeneous samples annealed at 1273 K have a phase angle of nearly 80° in a wider frequency range compared to the CG sample. At the same time, the impedance mode values of the two types of samples in the low-frequency range are also significantly higher than those of the CG sample. This indicates that the surface of the rolled–annealed samples forms a more complete passivation film than that of the CG sample, resulting in better corrosion resistance of heterogeneous duplex stainless steel compared to that with a homogeneous structure.

4. Conclusions

Samples of SAF2507 duplex stainless steel (DSS) with a heterostructure (HS) were prepared using either a cold rolling (CR) or an annealing (1273 K at 1 min) process, with different deformation amounts. This produced a good combination of strength and ductility. The microstructure characteristics, mechanical properties, and corrosion resistance of the HS samples were studied systematically. The following conclusions can be drawn.
The yield strength (YS) and ultimate tensile strength (UTS) of CR55% and CR80% samples exceeded 1000 MPa, but the uniform elongation (UE) was only 1.9% and 2.5%, respectively. Compared with the coarse grain (CG) sample, the YS of 55%-1273 samples did not show a significant improvement due to lack of grain refinement strengthening and dislocation strengthening effects. However, due to the hetero-deformation-induced (HDI) strain hardening effect, the 55%-1273 sample has a higher UTS and the same UE as the CG sample. In addition, the ferrite and austenite phases of the 80%-1273 sample were composed of smaller grain sizes and higher geometrically necessary dislocations density values than the as-received sample, resulting in the YS being higher than that of the initial stainless steels.
The heterostructure sample has a better combination of strength and ductility (YS: 634 MPa, UE: 24.2%) than the initial sample. This is because the HS sample has the hetero-zone boundary-affected regions on both sides of the grain boundary, phase boundary, and twin boundary; this results in HDI strengthening and HDI strain hardening of samples during tensile deformation, which improved the strength of HS samples while maintaining a good uniform elongation. Using the digital image correlation test, it can be observed that the uniform strain distribution of the heterogeneous structure DSS during the tensile process also reflects their good ductility. In addition, it was found that at the same annealed temperature, the larger the deformation of SAF2507 steel plates during cold rolling, the more remarkable the heterogeneous microstructure that can be formed, which leads to the obvious effect of improving the strength–ductility balance of the sample.
The corrosion resistance of heterogeneous duplex stainless steel samples is significantly better than that of homogeneous structured samples. This is because grain refinement enhances the speed of Cr diffusion to grain boundaries, which is conducive to the rapid formation of the passivation film on the sample surface. At the same time, the dense grain boundary distribution promotes the complete coverage of the passivation film on the surface of the HS-DSS samples.

Author Contributions

Investigation, methodology, data curation, writing—original draft: J.Y.; conceptualization, formal analysis: X.L. and L.S.; investigation, data curation: Z.Z., Z.K. and C.L.; validation, visualization: S.Q. (Shuwei Quan) and S.Q. (Shen Qin); writing—review and editing, supervision, funding acquisition: B.G. and X.Z. All authors have read and agreed to the published version of the manuscript.

Funding

This research was funded by the Natural Science Foundation of China (NSFC) under Grants No. 51664033, 51861015, 51931003, and 52201124. It also funded by Yunnan Science and Technology Program under Grants No. 202305AF150014, 2019IC004 and the Basic Research Project of Yunnan Science and Technology Program under Grants No. 202001AU070081.

Data Availability Statement

The data presented in this study are available on request from the corresponding author.

Acknowledgments

We acknowledgment the Shimadzu Management China Co., Ltd.

Conflicts of Interest

The authors declare no conflicts of interest. The funders had no role in the design of the study; in the collection, analyses, or interpretation of data; in the writing of the manuscript, or in the decision to publish the results.

References

  1. Romero-Resendiz, L.; El-Tahawy, M.; Zhang, T.; Rossi, M.C.; Marulanda-Cardona, D.M.; Yang, T.; Amigó-Borrás, V.; Huang, Y.; Mirzadeh, H.; Beyerlein, I.J.; et al. Heterostructured stainless steel: Properties, current trends, and future perspectives. Mater. Sci. Eng. Rep. 2022, 150, 100691. [Google Scholar] [CrossRef]
  2. Niinomi, M.; Nakai, M.; Hieda, J. Development of new metallic alloys for biomedical applications. Acta Biomaterialia 2012, 8, 3888–3903. [Google Scholar] [CrossRef]
  3. Ren, Y.B.; Zhao, H.C.; Liu, W.P.; Yang, K. Effect of cold deformation on pitting corrosion of 00Cr18Mn15Mo2N0.86 stainless steel for coronary stent application. Mater. Sci. Eng. C 2016, 60, 293–297. [Google Scholar] [CrossRef] [PubMed]
  4. Haghdadi, N.; Cizek, P.; Hodgson, P.D.; Beladi, H. Microstructure dependence of impact toughness in duplex stainless steels. Mater. Sci. Eng. A 2019, 745, 369–378. [Google Scholar] [CrossRef]
  5. Yang, S.F.; Li, C.W.; Chen, A.Y.; Gan, B.; Gu, J.F. Microstructure and corrosion resistance of stainless steel manufactured by laser melting deposition. J. Manuf. Process. 2021, 65, 418–427. [Google Scholar] [CrossRef]
  6. Fu, Z.R.; Li, X.F.; Li, C.; Pan, H.J.; Bai, Y.H.; Zhang, Z.H.; Liu, Y.; Liu, Y.F.; Yang, J.R.; Gong, Y.L.; et al. Superior mechanical properties of pure Zr with heterogeneous structure. Mater. Charact. 2022, 194, 112437. [Google Scholar] [CrossRef]
  7. Li, J.S.; Gao, B.; Huang, Z.W.; Zhou, H.; Mao, Q.Z.; Li, Y.S. Design for strength-ductility synergy of 316L stainless steel with heterogeneous lamella structure through medium cold rolling and annealing. Vacuum 2018, 157, 128–135. [Google Scholar] [CrossRef]
  8. Sun, Y.T.; Kong, X.; Wang, Z.B. Superior mechanical properties and deformation mechanisms of a 304 stainless steel plate with gradient nanostructure. Int. J. Plast. 2022, 155, 103336. [Google Scholar] [CrossRef]
  9. Zhu, Y.T.; Wu, X.L. Introduction to Heterostructured Materials; Acta Materialia Inc. Publishing: Bethesda, MD, USA, 2023. [Google Scholar]
  10. Ghosh, S.; Bibhanshu, N.; Suwas, S.; Chatterjee, K. Surface mechanical attrition treatment of additively manufactured 316L stainless steel yields gradient nanostructure with superior strength and ductility. Mater. Sci. Eng. A 2021, 820, 141540. [Google Scholar] [CrossRef]
  11. Li, J.; Mao, Q.; Chen, M.; Qin, W.; Lu, X.; Liu, T.; She, D.; Kang, J.; Wang, G.; Zhu, X.; et al. Enhanced pitting resistance through designing a high-strength 316L stainless steel with heterostructure. J. Mater. Res. Technol. 2021, 10, 132–137. [Google Scholar] [CrossRef]
  12. Selvam, K.; Saini, J.; Perumal, G.; Ayyagari, A.; Salloom, R.; Mondal, R.; Mukherjee, S.; Grewal, H.S.; Arora, H.S. Exceptional cavitation erosion-corrosion behavior of dual-phase bimodal structure in austenitic stainless steel. Tribol. Int. 2019, 134, 77–86. [Google Scholar] [CrossRef]
  13. Sun, G.; Du, L.; Hu, J.; Zhang, B.; Misra, R.D.K. On the influence of deformation mechanism during cold and warm rolling on annealing behavior of a 304 stainless steel. Mater. Sci. Eng. A 2019, 746, 341–355. [Google Scholar] [CrossRef]
  14. Shirdel, M.; Mirzadeh, H.; Parsa, M.H. Nano/ultrafine grained austenitic stainless steel through the formation and reversion of deformation-induced martensite: Mechanisms, microstructures, mechanical properties, and TRIP effect. Mater. Charact. 2015, 103, 150–161. [Google Scholar] [CrossRef]
  15. Li, Y.; Li, W.; Li, S.; Min, N.; Jiang, L.; Zhou, Q.; Jin, X. Ensuring the strength and ductility synergy in an austenitic stainless steel: Single- or multi-phase hetero-structures design. Scr. Mater. 2021, 193, 81–85. [Google Scholar] [CrossRef]
  16. He, J.S.; Chen, M.; Li, J.S.; Wang, C.X.; Xing, S.L.; Li, Q. Improved Mechanical Property and Corrosion Resistance of SAF2507 Duplex Stainless Steel with Heterogeneous Lamella Structure. Steel Res. Int. 2021, 93, 2100360. [Google Scholar] [CrossRef]
  17. Gubicza, J.; Chinh, N.Q.; Lábár, J.L.; Hegedűs, Z.; Langdon, T.G. Langdon. Principles of self-annealing in silver processed by equal-channel angular pressing: The significance of a very low stacking fault energy. Mater. Sci. Eng. A 2010, 527, 752–760. [Google Scholar] [CrossRef]
  18. Xue, P.; Xiao, B.L.; Ma, Z.Y. Enhanced strength and ductility of friction stir processed Cu–Al alloys with abundant twin boundaries. Scr. Mater. 2013, 68, 751–754. [Google Scholar] [CrossRef]
  19. Calcagnotto, M.; Ponge, D.; Demir, E.; Raabe, D. Orientation gradients and geometrically necessary dislocations in ultrafine grained dual-phase steels studied by 2D and 3D EBSD. Mater. Sci. Eng. A 2010, 527, 2738–2746. [Google Scholar] [CrossRef]
  20. Kubin, L.P.; Mortensen, A. Geometrically necessary dislocations and strain-gradient plasticity: A few critical issues. Scr. Mater. 2003, 48, 119–125. [Google Scholar] [CrossRef]
  21. Li, X.Y.; Lu, L.; Li, J.G.; Zhang, X.; Gao, H.J. Mechanical properties and deformation mechanisms of gradient nanostructured metals and alloys. Nat. Rev. Mater. 2020, 5, 706–723. [Google Scholar] [CrossRef]
  22. Liu, X.L.; Yuan, F.P.; Zhu, Y.T.; Wu, X.L. Extraordinary Bauschinger effect in gradient structured copper. Scr. Mater. 2018, 150, 57–60. [Google Scholar] [CrossRef]
  23. Lu, W.; Luo, X.; Ning, D.; Wang, M.; Yang, C.; Li, M.; Yang, Y.; Li, P.; Huang, B. Excellent strength-ductility synergy properties of gradient nano-grained structural CrCoNi medium-entropy alloy. J. Mater. Sci. Technol. 2021, 112, 195–201. [Google Scholar] [CrossRef]
  24. Huang, J.X.; Liu, Y.; Xu, T.; Chen, X.F.; Lai, Q.Q.; Xiao, L.R.; Pan, Z.Y.; Gao, B.; Zhou, H.; Zhu, Y.T. Dual-phase hetero-structured strategy to improve ductility of a low carbon martensitic steel. Mater. Sci. Eng. A 2022, 834, 142584. [Google Scholar] [CrossRef]
  25. Zhang, Y.M.; Wang, C.Y.; Reddy, K.M.; Li, W.; Wang, X.D. Study on the deformation mechanism of a high-nitrogen duplex stainless steel with excellent mechanical properties originated from bimodal grain design. Acta Mater. 2022, 226, 117670. [Google Scholar] [CrossRef]
  26. Wu, X.L.; Zhu, Y.T. Heterostructured Materials: Novel Materials with Unprecedented Mechanical Properties; Jenny Stanford Publishing: New York, NY, USA, 2021. [Google Scholar]
  27. Liang, Z.; Liu, Y.; Wang, X.; Liu, R.; Huang, M. Revealing the individual hardening effects of twins, dislocations, grain boundaries and solid solution in a twinning-induced plasticity steel. Mater. Sci. Forum 2016, 879, 2489–2494. [Google Scholar] [CrossRef]
  28. Lü, A.Q.; Zhang, Y.; Li, Y.; Liu, G.; Zang, Q.H.; Liu, C.M. Effect of nanocrystalline and twin boundaries on corrosion behavior of 316L stainless steel using SMAT. Acta Met. Sin. (Engl. Lett.) 2006, 19, 183–189. [Google Scholar] [CrossRef]
  29. Gollapudi, S. Grain size distribution effects on the corrosion behaviour of materials. Corros. Sci. 2012, 62, 90–94. [Google Scholar] [CrossRef]
Figure 1. A schematic illustration of the approach used to prepare the material for the experiment. T: thickness; RD: rolling direction; ND: normal direction; TD: transverse direction.
Metals 14 00193 g001
Figure 2. Grain boundary distribution maps combined with BCC and FCC phases and corresponding misorientation angle distribution conditions of LAGBs and HAGBs. (ae) and (a-1e-2) represent the CG, CR55%, CR80%, 55%-1273, and 80%-1273 samples, respectively.
Metals 14 00193 g002aMetals 14 00193 g002b
Figure 3. The IPF maps and the average grain size of BCC (α) and FCC (γ) phases of the CG, CR, and rolled–annealed samples: (a) CR55%; (b) 55%-1273; (c) CR80%; (d) 80%-1273; (e) CG; (f) the average grain size distribution.
Metals 14 00193 g003
Figure 4. The recrystallized (blue area), substructured (yellow area), and deformed (red area) grain maps and the local misorientation (LM) maps reflect the GND density of ferrite (α) and austenite (γ) in samples: (a-1a-4) as CG; (b-1b-4) as CR55%; (c-1c-4) as CR80%; (d-1d-4) as 55%-1273; (e-1e-4) as 80%-1273. The color-coded bar of misorientation in the top inset shows: blue—<1°, green and yellow—1–3°, red—4–5°. Special note: in order to facilitate observation of the microscopic characteristics in one phase, another phase is not analyzed in the same figure and these are presented as white areas.
Metals 14 00193 g004
Figure 5. Bright field images and corresponding SAED patterns of the rolled and rolled–annealed DSS: (a) the microstructure of the CR55% sample with the distribution of dislocations in BCC and partial martensite transformation in FCC, and the corresponding SAED patterns at two diagonal positions; (b) the dislocation tangles and corresponding SAED of BCC phase in the CR80% sample; (c) the annealing twin in the FCC phase and corresponding SAED of the 55%-1273 sample; (d) the triple junctions and twins in the FCC phase of the 80%-1273 sample and the corresponding SAED of twins.
Metals 14 00193 g005
Figure 6. (a) Tensile engineering stress-strain curve, including the CG, CR55%, 55%-1273, CR80%, and 80%-1273 sample; (b,c) the strain-hardening rate curves and true stress-strain curves of samples with CG and different rolled–annealed, respectively.
Metals 14 00193 g006
Figure 7. Bauschinger effect and HDI strengthening of CG, 55%-1273 and 80%-1273 specimens: (a) LUR true stress–strain curves, inset is the schematic of hysteresis loop; (b,c) evolution of the values in HDI stress with the strain point 1%, 3%, 5%, 7%, 9%, 11%, and 13% in 55%-1273 and 80%-1273 samples, respectively.
Metals 14 00193 g007
Figure 8. The strain distribution and the tension direction on the RD-TD plane: (a,c) in the CR55% and CR80% sample, respectively; (b,d) in the 55%-1273 and 80%-1273 specimen. The εy represents the tensile loading direction. The number above each contour map represents the tensile strain value. The black dotted lines (a,c) represent the generation of strain bands (SB). The white dashed box represents the local strain distribution area.
Metals 14 00193 g008
Figure 9. The potentiodynamic polarization curves and the electrochemical impedance spectroscopy of the CG, 55%-1273, and 80%-1273 samples, respectively; (a) Polarization curves; (b) Nyquist plots; (c) Bode plots.
Metals 14 00193 g009
Table 1. The BCC or FCC structure phase content of CG, CR55%, CR80%, and 1273 K annealed samples.
PhaseCGCR55%55%-1273CR80%80%-1273
BCC45%48%44%49%44%
FCC55%52%56%51%56%
Table 2. The tensile properties of CG, CR55%, CR80%, 55%-1273, and 80%-1273 samples. YS—yield strength; UE—uniform elongation; UTS—ultimate tensile strength; YS × UTS—yield ratio.
SampleYS (MPa)UE%UTS (MPa)YS/UTSAverage Hardness (GPa)
αγα + γ
CG54125.27950.683.854.083.94
CR55%10872.512360.884.454.834.64
55%-127357425.88740.663.914.123.98
CR80%13421.914750.914.955.475.19
80%-127363424.28940.713.944.214.09
Table 3. Polarization parameters evaluated from the polarization curves for CG, 55%-1273, and 80%-1273 samples.
SamplesEcorr (V)Icorr (A/cm2)Ipass (A/cm2)Epit (V)
CG−0.731097.9804 × 10−72.41301 × 10⁻⁵−0.16262
55%-1273−0.667724.8292 × 10−71.17202 × 10−50.57799
80%-1273−0.663574.6601 × 10−72.21371 × 10−50.54003
Disclaimer/Publisher’s Note: The statements, opinions and data contained in all publications are solely those of the individual author(s) and contributor(s) and not of MDPI and/or the editor(s). MDPI and/or the editor(s) disclaim responsibility for any injury to people or property resulting from any ideas, methods, instructions or products referred to in the content.

