Article

Study of Galena Ore Powder Sintering and Its Microstructure

1
Department of Geology, The University of Jordan, Amman 11942, Jordan
2
Department of Chemistry, Faculty of Science, Jerash University, Jerash 26150, Jordan
3
Department of Basic Pharmaceutical Sciences, Faculty of Pharmacy, Isra University, Amman 11622, Jordan
4
Department of Studies, Research and Development, Ministry of Energy and Infrastructure, Abu Dhabi 11191, United Arab Emirates
5
Department of Chemistry, College of Arts and Sciences, University of Petra, Amman 11196, Jordan
6
Department of Chemistry, The University of Jordan, Amman 11942, Jordan
7
Department of Land, Water, and Environment, The University of Jordan, Amman 11942, Jordan
*
Author to whom correspondence should be addressed.
Metals 2024, 14(4), 439; https://doi.org/10.3390/met14040439
Submission received: 27 February 2024 / Revised: 1 April 2024 / Accepted: 8 April 2024 / Published: 10 April 2024

Abstract

:
Galena is a natural mineral enriched with lead sulfide (PbS). It typically forms in hydrothermal veins associated with igneous rocks and can also occur as a gangue mineral in other ore deposits. PbS is of special importance for scientific research applications due to the possibility of tuning its semiconductor energy gap using nanotechnology in conjunction with powder metallurgy as an easy, controllable production route. In this paper, almost pure PbS was successfully produced starting from a high ratio of PbS phase galena ore. As-received galena lumps were roughly pulverized and milled to produce four particle size ranges of 38, 63, 125, and 250 µm prior to compaction and sintering in a vacuum (pre-flushed with argon gas). SEM coupled with the EDAX analysis unit was employed to investigate the microstructure and chemical composition of the as-received galena and the subsequent products after sintering. The chemical analysis confirmed the high ratio of PbS compound in the as-received galena and sintered products with approximately 85% Pb and 13% S mass ratio. The sintering process of the galena powder was carried out at different values of temperature, time, and compaction pressure. Additionally, the effect of length to diameter ratio of compacted and sintered samples was investigated. XRD analysis confirmed the existence of the PbS phase in the as-received and sintered samples at 700 °C with approximately 98 wt.%, as well as a new phase that is formed at 800 °C with a lower percentage. The micro-hardness of the as-received and sintered samples was measured and compared with the as-received galena ore. The results showed a significant reduction in the hardness of sintered galena powder compared with the bulk as-received galena by 52%. Furthermore, a relative sintered density of 99.3% for the as-received galena density signifies a novel result using powder metallurgy techniques.

1. Introduction

Galena is mainly composed of lead and sulfur, resulting in the formation of lead sulfide (PbS) as well as trace amounts of other elements, including silver, zinc, iron, copper, silicon, and aluminum. It is a naturally occurring mineral that typically forms in hydrothermal veins associated with igneous rocks and can also occur as a gangue mineral in other ore deposits. The formation of galena is often linked to the hydrothermal alteration of lead-bearing minerals in the presence of sulfur-rich fluids. Additional compounds like lead carbonate and lead sulfate can also be present in galena, depending on the location of the ore mining site [1,2,3,4,5,6]. PbS, with a lead-to-sulfur ratio of 86:13 mass percent, is found in the Japanese and American galena ores [1]. This compound is commonly used in various practical applications, including solar energy and infrared sensors, due to its low energy gap of bulk pieces (~0.4 eV), optoelectronics, semiconductors, thermoelectric materials, and biconical uses [7,8,9,10,11]. The physical properties of PbS depend on many factors, such as its purity (composition), particle size, grain size, and heat treatment. The properties of the different forms of chemically produced PbS (powder or thin films) depend on the starting materials and production routes. Nano-sized PbS has been found to have superior properties for electronics and optical systems. A recent review by Mamiyev and Balayeva focused on the production and nanostructure of PbS, as well as its optical and electrical behavior [12]. They concluded that the energy gap (Eg) of the PbS nanoscale product is almost inversely proportional to the particle size. Thus, the particle size plays a vital role in controlling its properties and applications. The theoretical study of galena electronic structures has been investigated by Kang et al. in 2023 [13]. A part of their remarkable result was that the theoretical and experimental values of galena energy gab and Lattice constant were almost perfect. Theoretically, they are 0.41 eV and 0.5931 nm, while experimentally, they are 0.478 eV and 0.5999 nm.
In general, the production route of PbS is dictated by the required application. Powder metallurgy offers a method for creating bulk PbS from high-grade galena ore as specified through milling, pressing, controlling the chemical composition, purity of the starting materials, and sintering. It is an ideal technique for shaping bulk galena into the required geometry or particle size due to its brittleness and difficulty to machine. The literature is abundant, with significant information about powder metallurgy and its applications in numerous fields [14,15,16,17,18].
Depending on the preceding information about powder metallurgy, the bulk of PbS starting from high-grade PbS galena ore can be produced in the required shape after converting it into a suitable fine powder, using different methods of milling, followed by pressing and appropriate sintering procedure. Electrical properties of produced bulk samples, beginning from galena ingots by milling, compaction, and sintering with different temperatures and times, have been studied by many workers in this area of research [19,20,21]. The electrical properties of sintered PbS have been reported, using almost pure powder of this compound through hot-press sintering, with a high pressure of approximately 0.9 GPa at 550 °C for 1 h [22].
However, there is a lack of information about the sintering of commercial galena ore powder with specific physical properties and shapes using the powder metallurgy method. Galena’s chemical composition, physical properties, and microstructure vary significantly based on its mining location. So, powder metallurgy is a viable means of production for galena and other special alloys, which can yield specific properties and shapes for scientific research and practical industrial applications.
This research aims to obtain a product of PbS based on high-content PbS compound galena lumps available in the local market in Amman, Jordan. The product is mainly sold to be used in traditional painting and make-up after it is milled and sometimes mixed with other ingredients. The research includes a microscopic and chemical analysis investigation of the commercially available galena employing scanning electron microscopy. The as-received galena is then milled mechanically, and the gained powder is sieved using four types of stainless-steel sieves. The produced powders are then investigated, followed by sintering to fabricate a high-density bulk of PbS from commercial galena ore via powder metallurgy techniques. This involves using a homemade single-end die compaction at varying pressures, sintering temperatures, and times in a vacuum atmosphere to find the ideal sintering state conditions to produce a high relative density product. In addition, microscopic analysis and X-ray diffraction are carried out to distinguish the original phases of the as-received galena and the formed phases after sintering. The ratio of the length to diameter (L/D) of the compacted pieces is studied. Finally, the micro-hardness of the as-received and sintered samples is measured for comparison purposes.

2. Some Powder Metallurgy Concepts

Before starting, it is very necessary to highlight some important and key concepts in powder metallurgy that will be used in the production process, from raw material to the final form. They are as follows:

2.1. Green Density

This concept is an expression given to the density of the part after compacting by any powder metallurgy method in which the starting material is a powder. It is one of the most important properties to be specified in a powder metallurgy process. In general, the green density increases under the following conditions:
  • Increasing compaction pressing to the extent of endurance.
  • Using a wide range of particle-size powder.
  • Compacting of a ductile powder, such as Cu, Zn, Pb, Sn, and Al, or their mixture. This depends on prior knowledge of the mechanical properties of compacted powders.
  • Mixing lubricant materials with the powder before compaction facilitates the particles slipping to obtain a high green density, as the additive lubricant then volatilizes during the sintering process.

2.2. Sintering

In most cases, the green compacted powder cannot be withstood as a finished part because of brittleness and low strength. Sometimes, the compacted pieces are required to have a certain porosity. In all cases, the mechanical properties of compacted powder must be improved by means of a heat treatment process, which is termed “sintering”. This mainly aims to increase the cohesion between the compacted particles of the green parts or even within a loose powder confined to a desired shape for special applications. There are two types of sintering:

2.3. Solid State Sintering

Sintering can occur in the solid state at a temperature below the melting point of the compacted powder. Usually, the sintering temperature is approximately 0.6 to 0.8 of the melting point of the compacted powder [23]. This process bonds the compacted or loose particles together and increases the strength of the compacted pieces utilizing the powder metallurgy route. The solid-state sintering process is characterized by mutual diffusion between compacted and even merely confined particles during sintering at a temperature lower than the melting point of a single type of compacted powder or at the lowest melting point of powder of more than one component compacted part. During sintering, the mobility of the atoms on the surfaces of the particles increases towards the contact points because of thermal energy, which forms grain boundaries for the new product. In this stage, the air or any gases present between the particles begin to escape as the volume decreases and the pores between the particles shrink, which leads to an increase in sintered density. High relative density products can be obtained by continuing the heat treatment of high green density pieces at the appropriate sintering temperature, time, and atmosphere, which is an experimental process to reach the desired aim of sintering.
Generally, many sequential steps occur during the sintering process, namely, initial particle contacts, necking formation due to mutual diffusion and growing grain boundaries, pores closing after gases are released, solid-state solidification, and shrinkage, which subsequently increase the relative density of the products. It is strongly recommended to sinter in a vacuum atmosphere to avoid oxidation and reaching high sintered densities unless otherwise required. More information about powder metallurgy and sintering has been reported [24].

2.4. Liquid Phase Sintering

This kind of sintering can be defined as the sintering of compact or loose powders to produce consolidation under conditions where a liquid phase is present during part of the sintering cycle. This process is widely used for consolidating metallic, different powders, ceramics, or both together into final products. The advantage of using this route of production is a very fast densification rate and physical and mechanical properties superior to those fabricated via solid-state sintering. It is vital to summarize some characteristics of utmost liquid phase sintering as follows.
  • The liquid phase of the lower melting point particles of the mixed powders should wet the surface of the other solid particles, i.e., the reaction between mixed materials is sufficient to ensure a high degree of wetting. This means that diffusion can occur during the sintering process at the liquid state of one constituent of the mixed powders.
  • Sufficient difference in the melting temperatures of the mixed powder components, such as mixing iron and copper powders to form an alloy of Fe-Cu, where the melting of Fe and Cu are around 1538 °C and 1085 °C, respectively.
  • The amount of liquid should be enough to surround most or all of the solid particles to ensure high sintering density.
  • The fine particle size of the mixed powders will facilitate fast infiltration and, subsequently, rapid densification. That is due to the high surface area, which normally leads to a high rate of reaction. Therefore, generally, the particle size of the compacted powder plays an essential role in producing high-sintered density products using powder metallurgy technique if required.
To sinter a mixture of more than one type of compacted powders using the liquid phase sintering, the heat treatment should be at the lowest melting temperature powder, and make sure that the “sweating” phenomenon does not occur. This condition is shown by the existence of droplets of the supposed element to be melted at the chosen sintering temperature. If this happened, no liquid phase sintering can occur.

2.5. Sintering Density

The density of the products after sintering is usually compared with the theoretical density of the basic element, alloy, or compound. Reaching the maximum value of sintered density is normally considered as a criterion of the quality of the sintered final products. The sintered product density depends on many parameters of sintering, such as powder types, either ductile or hard, the ratio of L/D, the particle size range of the compacted powder, sintering temperature and time, sintering atmospheres, and the cycle(s) of the heat treatment. The sintered density of the final product is normally compared with the theoretical density of the starting materials. Therefore, reaching the maximum value of sintered density in contrast with the theoretical one is considered as a criterion of the sintering quality unless otherwise required, such as when a porous structure is needed.

2.6. Length to Diameter Ratio (L/D) of Compacted Part

The green density homogeneity is dependent on the geometrical dimensions of compacted pieces, such as the ratio (L/D) [25]. Generally, when this ratio decreases, the green density becomes high and more homogenous. The result can be justified due to frictional forces that are developed during the compaction action between the die wall and the used powder. This factor is very important to be considered for obtaining almost uniform green density and then sintered density as a result. In principle, the lower the value of L/D, the more homogenous and high sintered density.

3. Material and Instruments

Lumps of galena ore were purchased from the local market in Amman. Scanning electron microscopes (SEMs) (Thermo Scientific Phenom Desktop SEM, JU-24112022, Waltham, MA, USA, and Inspect F50-FEI Company, Eindhoven, The Netherlands) were used for microstructure and chemical analysis using the energy dispersive X-ray (EDAX) analysis that is fitted with the Thermo Scientific SEM. Emery papers of grades 600, 800, 1200, and 2000 were used for gentle grinding as required. Different particle sizes of diamond paste of 7 µm, 3 µm, and 1 µm were used for the final polishing. A digital micro-balance (Model SEJ-205, Taipei, Taiwan) was used for high-accuracy weighing. A test tube of 25 mL was used for as-received galena ore density determination by water displacement. High-precision dimensions measurements were carried out using a digital caliper with a minimum reading of 0.01 mm (Total, TMT 322001, Guangzhou, China) for green and sintered densities determination. X-ray diffraction (Malvern Panalytical, Aeris, Cu kα1, 0.15406 nm, 0.01 step angle, 2θ ranged from 10° to 90°, Almelo, The Netherlands) was used to identify the phases in the as-received galena and in the produced sintered pieces. A vibrating milling machine with a vibration frequency of 3000 min−1 (TEMA, Woodford Halse, UK), which contains tungsten carbide multi-rings with central tungsten core, was used to produce fine powder within a short time prior to the sieving process by different hole-size stainless steel sieves of 250 µm, 125 µm, 63 µm, and 38 µm. Compaction of the produced galena powders with various particle sizes was compacted using a homemade single-end die compaction unit coupled with a CARVER press (model 4350.L, S/N 4350-1401, CARVER, INC., Wabash, IN, USA). After compaction, sintering of the green compacted galena was conducted using (Protherm alumina tube furnace, Model PTF 12/50/450, serial No. 0907234, Turkey) integrated with home vacuum-gas fittings for clean-vacuum heat treatment. A rotary pump (Bs. 24008-G, rpm 1425, GEC Machines LTD, Newcastle, UK) was used for vacuum purposes as required at about 10−3 torr, as well as argon gas inlet for pre-flushing. Also, the microhardness of the as-received galena and sintered samples was determined using Micro Vickers Hardness Tester (MVHS), Mod/HTMV 2000M, SN/20190000187, echo LAB, Milan, Italy). The general properties of galena ore are metallic, opaque, bright-grey, very brittle, main elements Pb and S, mainly PbS compound cubic crystal structure with cell parameter a = 5.9362 Å, perfect cleavage {111}, common impurities Ag, Cu, Fe, and Bi, Vickers hardness 79–104 HV, and density in the range of 7.4–7.6 g/cm3 [26,27].

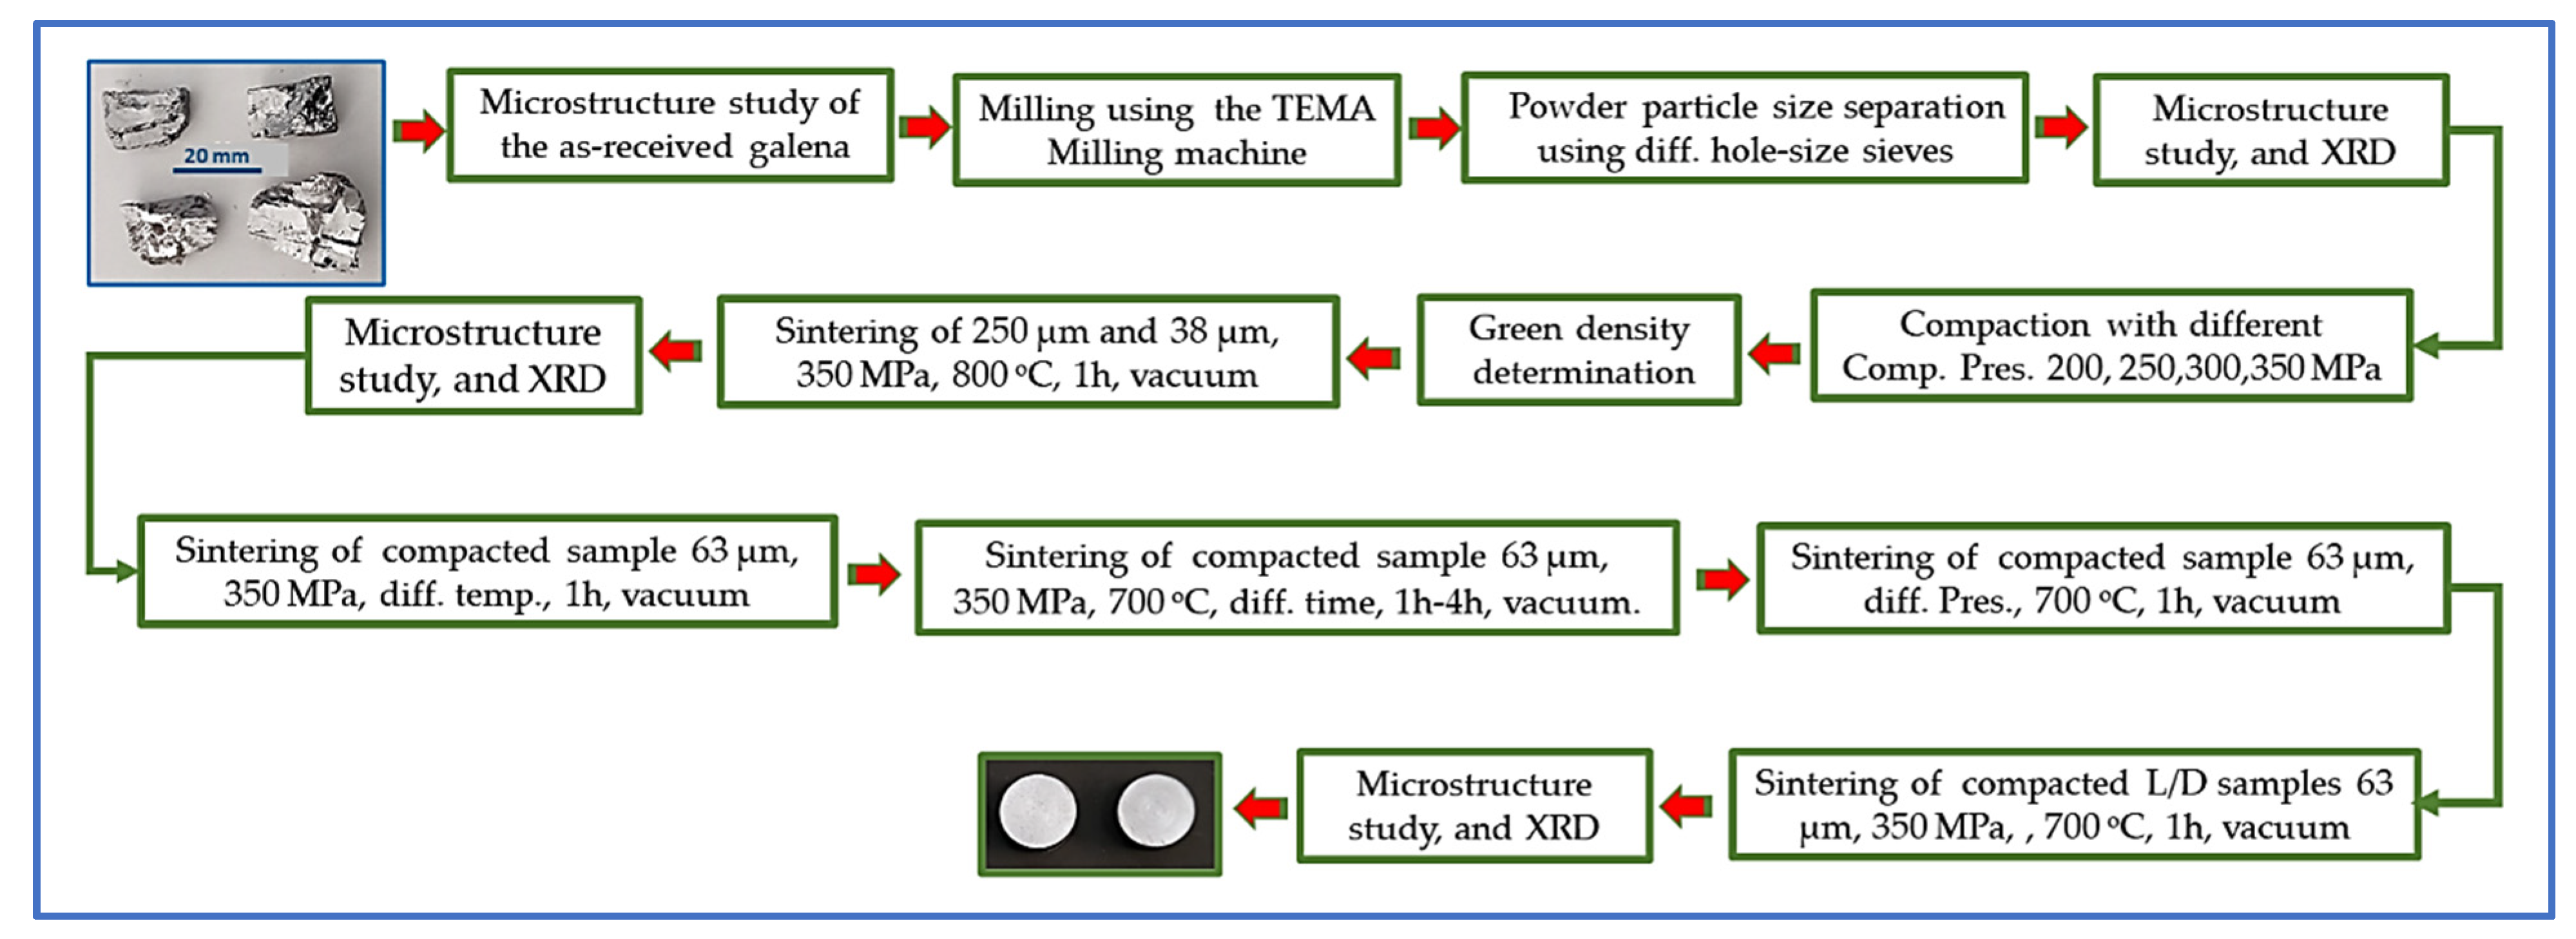
4. Experimental Procedure

The research project started with making a general implementation plan. The flowchart of the experimental procedure is schematically shown in Figure 1.
The experimental plan was implemented as follows:

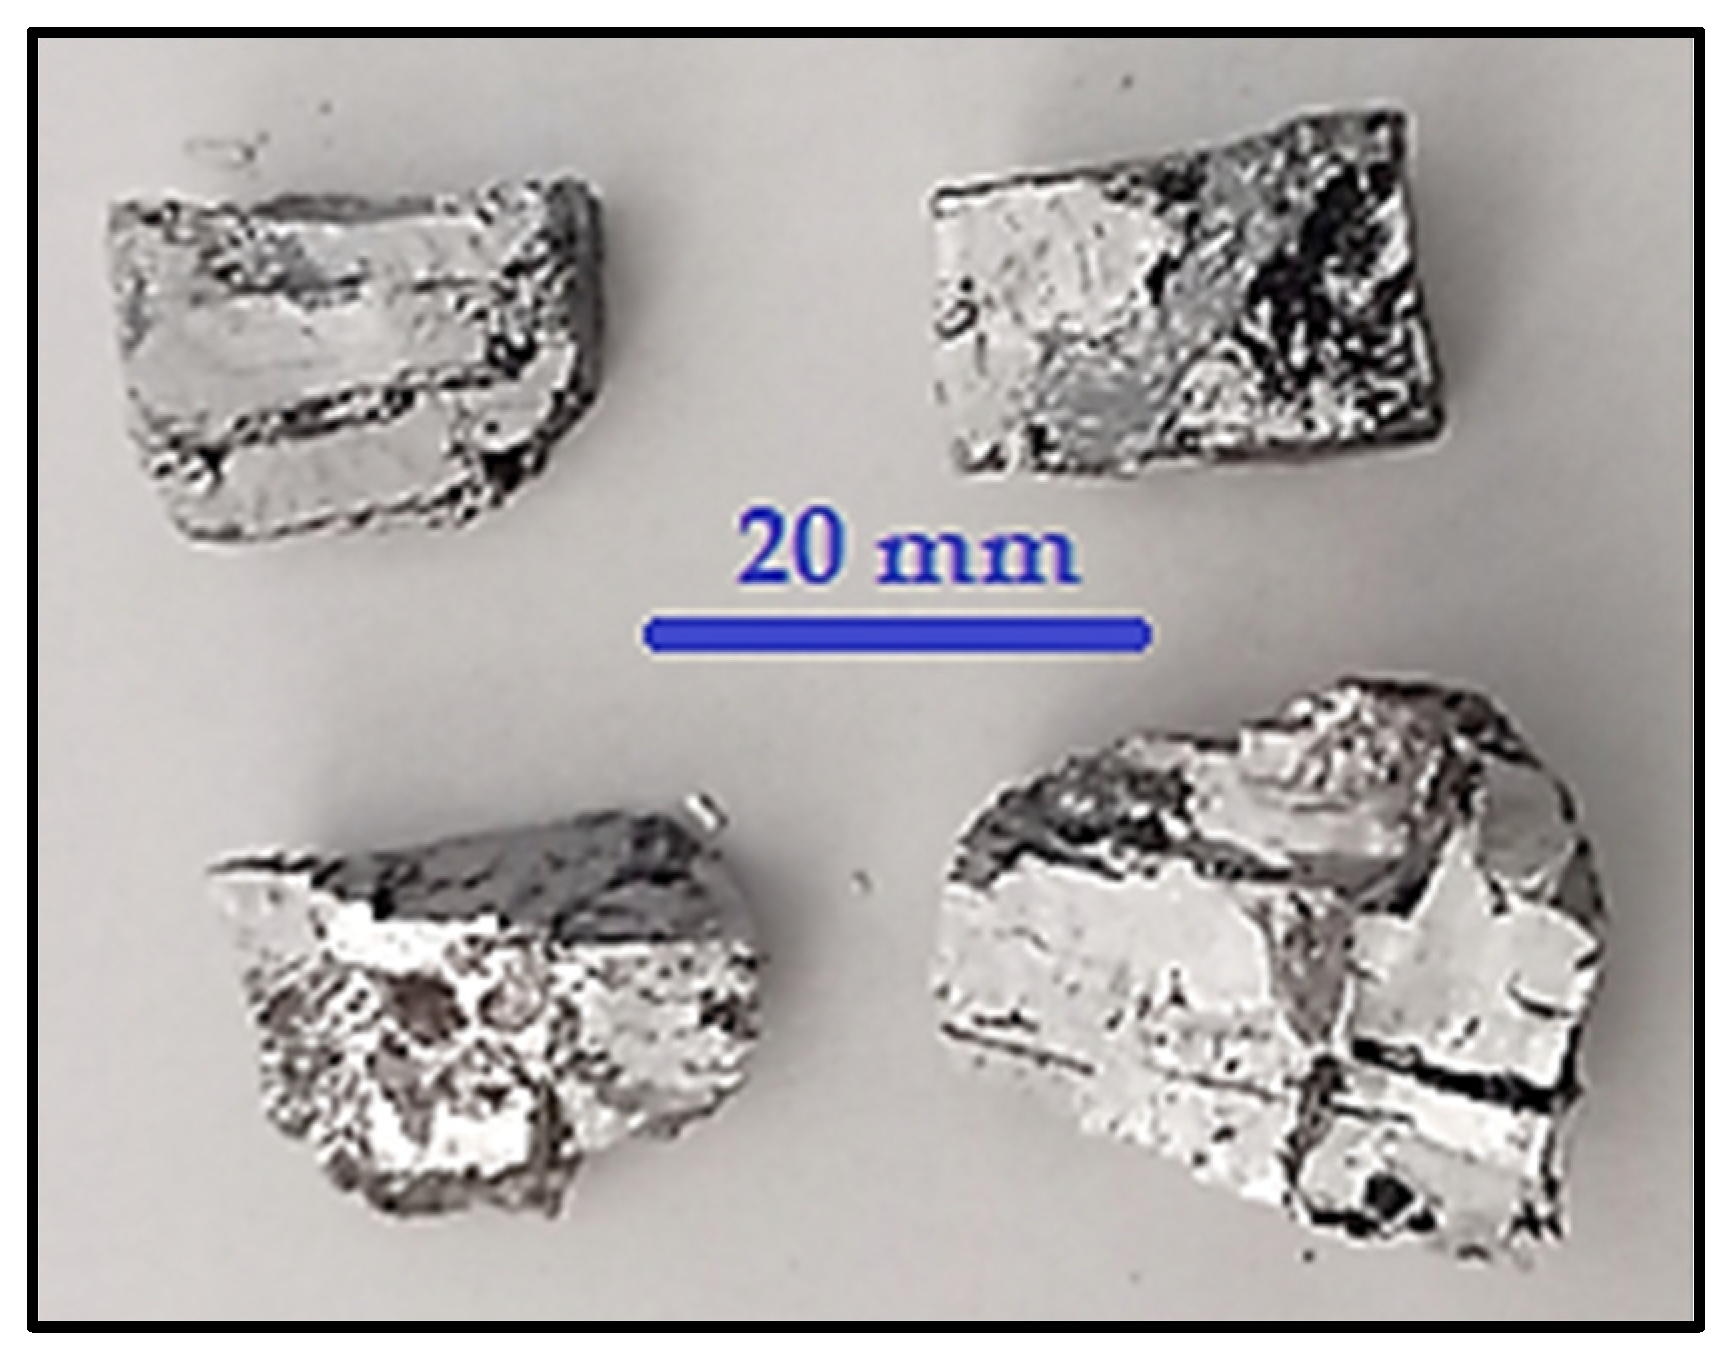
4.1. SEMs Investigation of the Galena Ore

The as-received galena lump was examined using the Thermo Scientific SEM. The advantage of using this instrument is due to the coupled EDAX unit, which facilitates the chemical composition analysis together with the microstructure. Figure 2 is a photograph of four as-received galena lumps.
A fractured surface specimen from the received galena was chosen as almost a semi-flat surface for an easy SEM examination. The selected specimen, which had an area of approximately 1 cm2, was well-washed with acetone and then dried. The specimen was then fixed on an aluminum stub 12 mm in diameter using a double adhesive carbon sticker, so the specimen must be earthed with the SEM specimens’ stage to be ready for chemical analysis by the EDAX unit and imaging. Moreover, the SEMs were used to investigate the surface of the milled galena powder as well as the sintered products. The fractured surfaces of sintered pieces were prepared in the same way above for the SEM test.

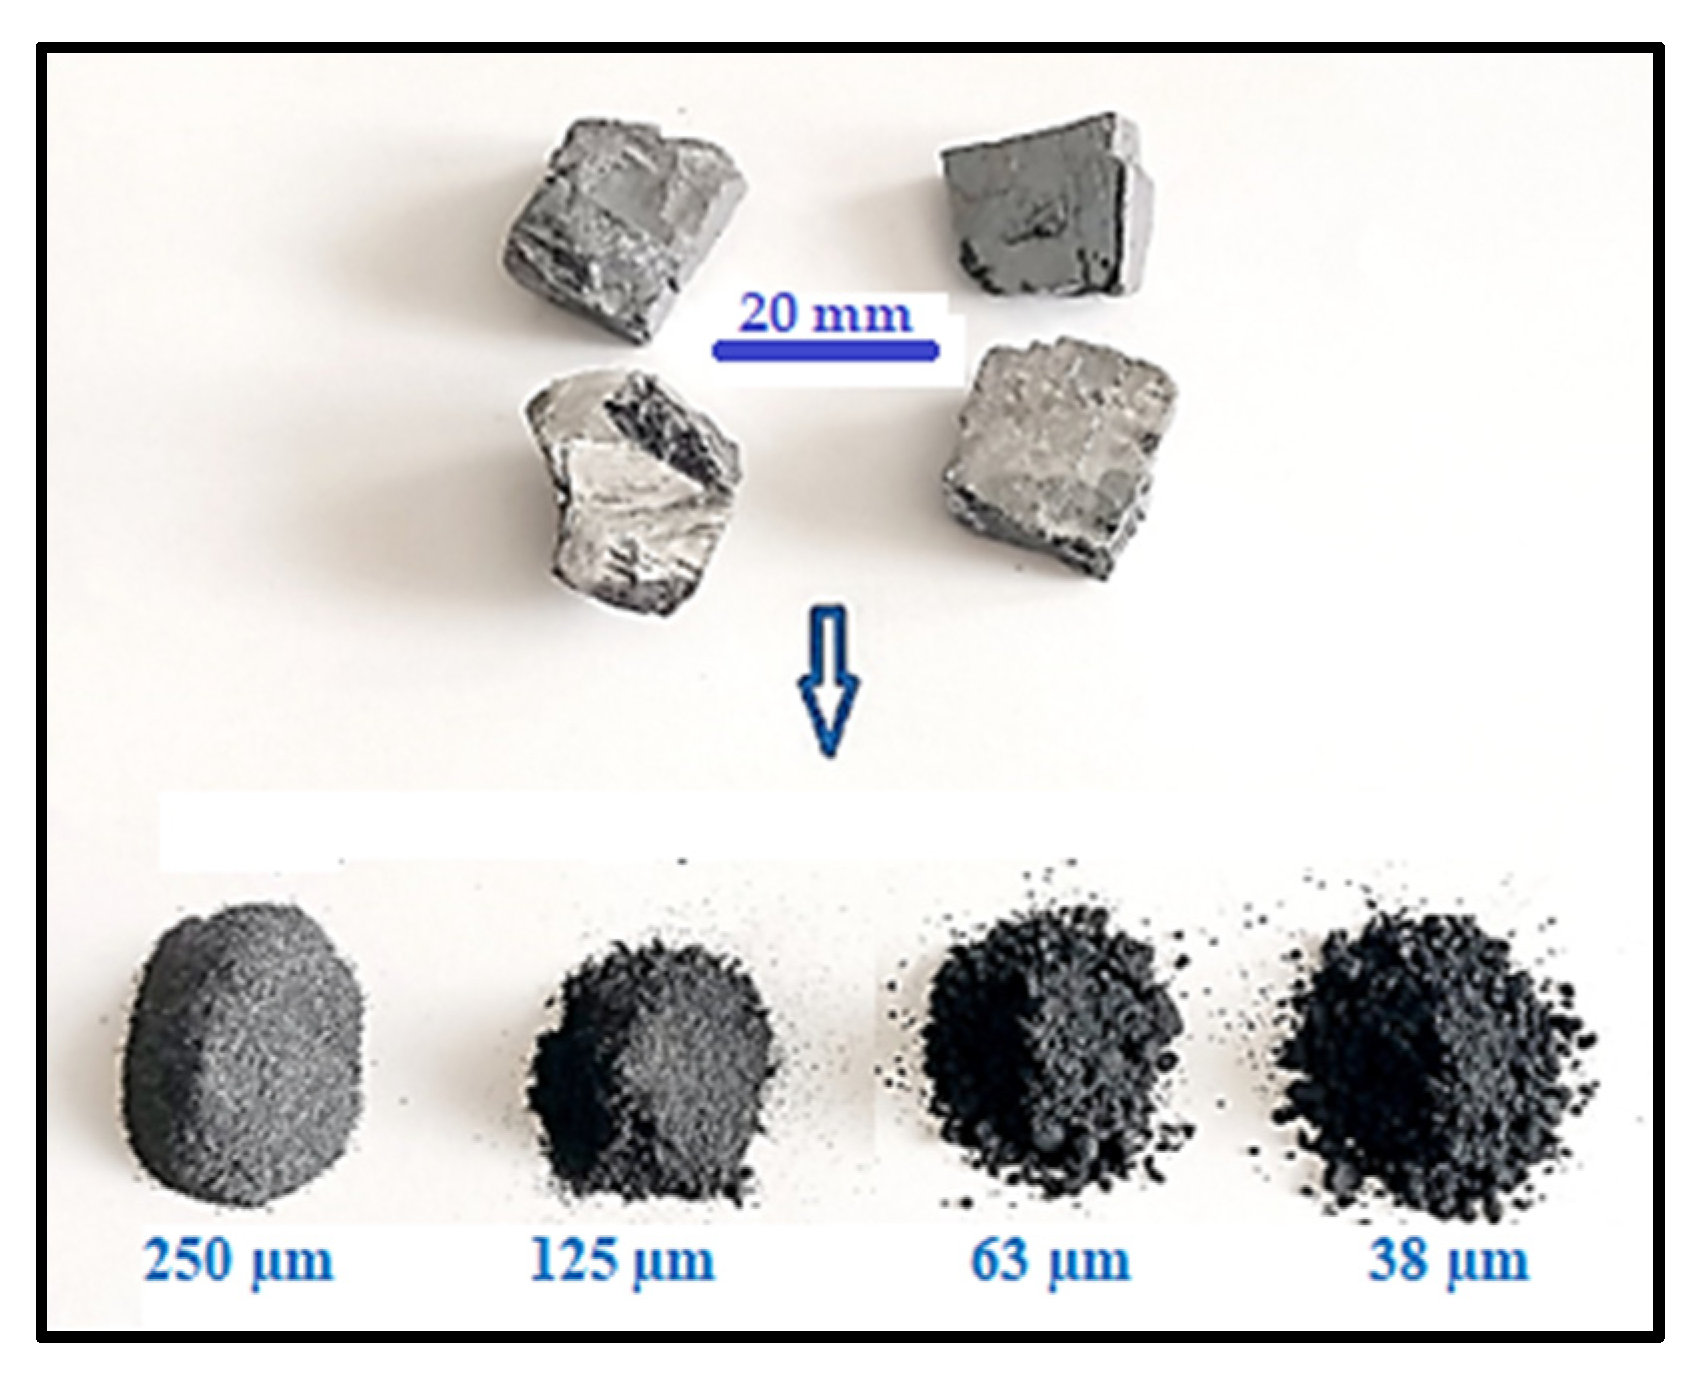
4.2. Milling of Galena Lumps

Powder of PbS from galena bulks was produced using the Vibrating milling machine. Many Galena lumps were mechanically crushed into small pieces of approximately 0.25 cm in diameter and then dry milled for 5 min under a normal atmosphere. The produced powder was sieved using the stainless-steel micro-sieves of 38, 63, 125, and 250 µm hole size in decreasing order. The obtained four types of PbS powder from galena ore were as follows: 38 µm and less, 63 µm to greater than 38 µm, 125 µm to greater than 63 µm, and 250 µm to greater than 125 µm. For easy dealing with particle size factors, they are denoted as 38, 63, 125, and 250 µm galena powder particle size. The SEM micrographs of the sieved powders with various sieve hole-size were imaged for particle size distribution information, general microstructures, and feature comparison purposes. Each specimen of the four powders was prepared by pressing the aluminum stub with a double adhesive carbon sticker on a small amount of the targeted powder. The powder that was not well stuck to the carbon sticker was then disposed of using a low-pressure air blower to avoid contamination of the SEM chamber, and then the prepared specimens were examined.

4.3. Compaction and Sintering of Galena Powders and the SEM Characterization of Sintered Products

All compacted and sintered samples were duplicated, and their green and sintered densities were the average of the two samples. The samples were compacted using a homemade single-die compaction unit integrated with a CARVER press, as mentioned in Section 3. Each compacted sample was left approximately 2 min. after reaching the required pressure before gentle ejection from the die. The green density (GD) and sintered density (SD) of each compacted and sintered sample were determined using the digital caliber to find the sample volume, and its mass was measured using the digital micro-balance, and then finding their densities (density = mass/volume). All obtained data were drawn using the Origin drawing software (version 8.6). Sample compaction and sintering were conducted as follows:
  • All sintering processes of compacted samples were carried out under a vacuum of approximately 10−3 torr. To start the sintering with as clean an atmosphere as possible, the procedure to prepare the used furnace was evacuated to the vacuum above, and the argon gas was pumped several times while the evacuation continued. Then, argon was flushed out, and the vacuum was set to reach 10−3 torr again prior to the sintering step according to the research plan. The rate of heating was around 10 °C/min. for all sintered samples, and the samples were furnace-cooled to room temperature at a rate of cooling of approximately 2.5 °C/min as a mean value. All sintered samples were doubled to take the average of green and sintered densities.
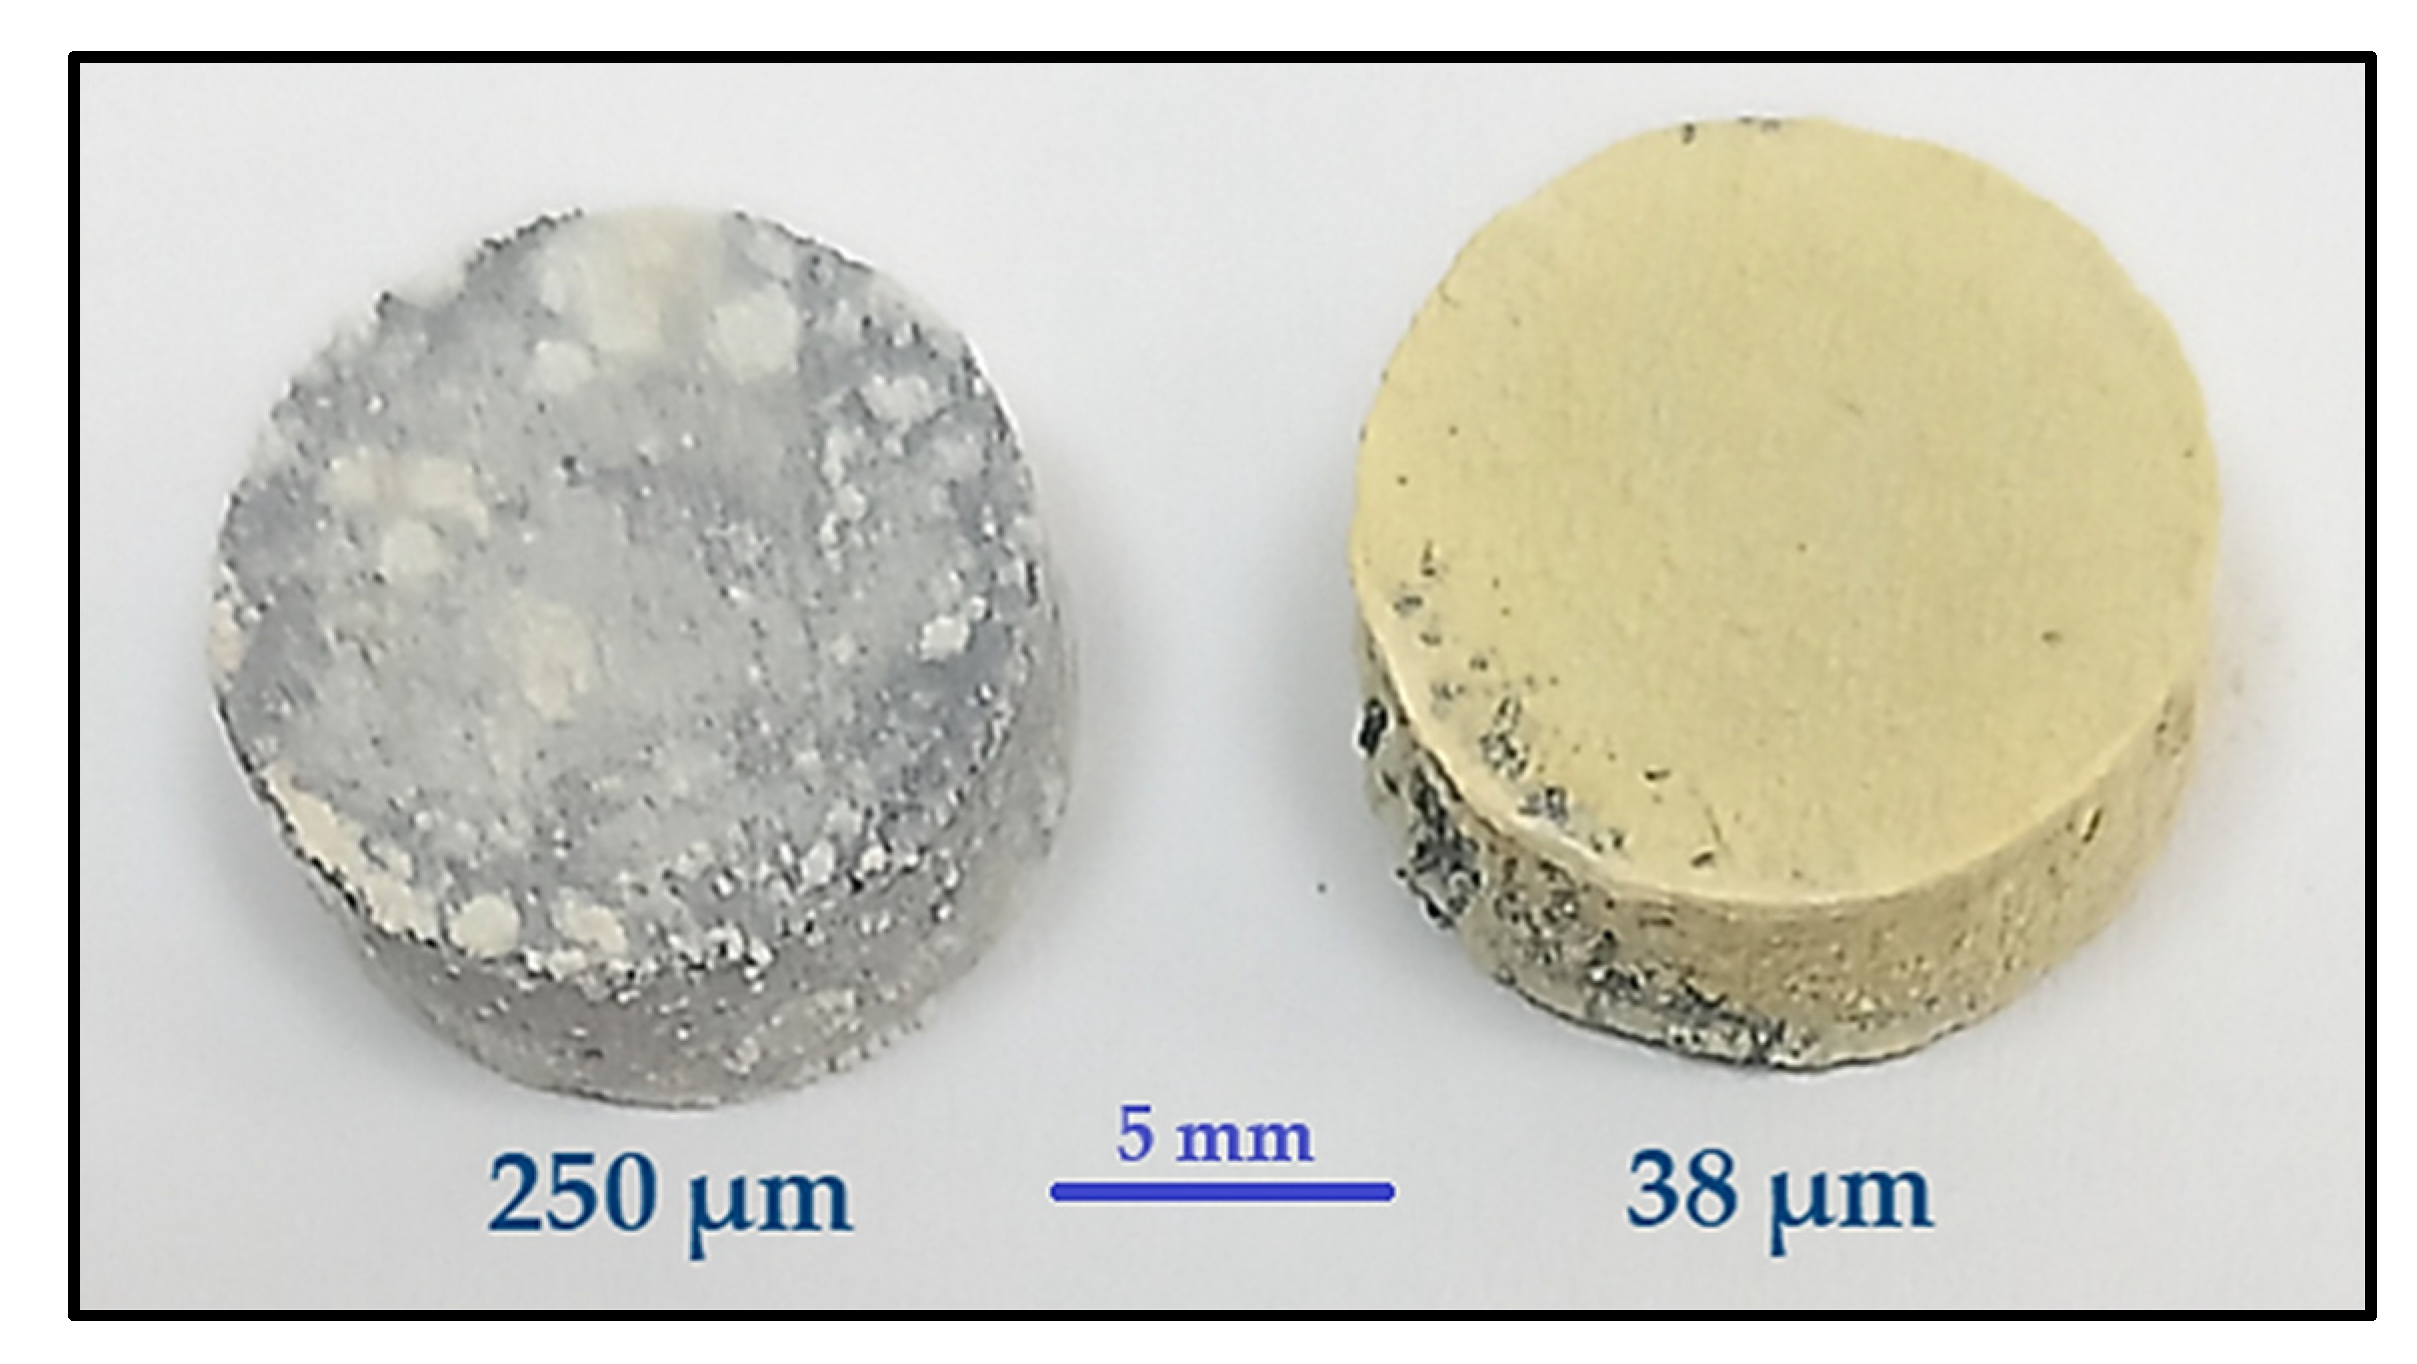
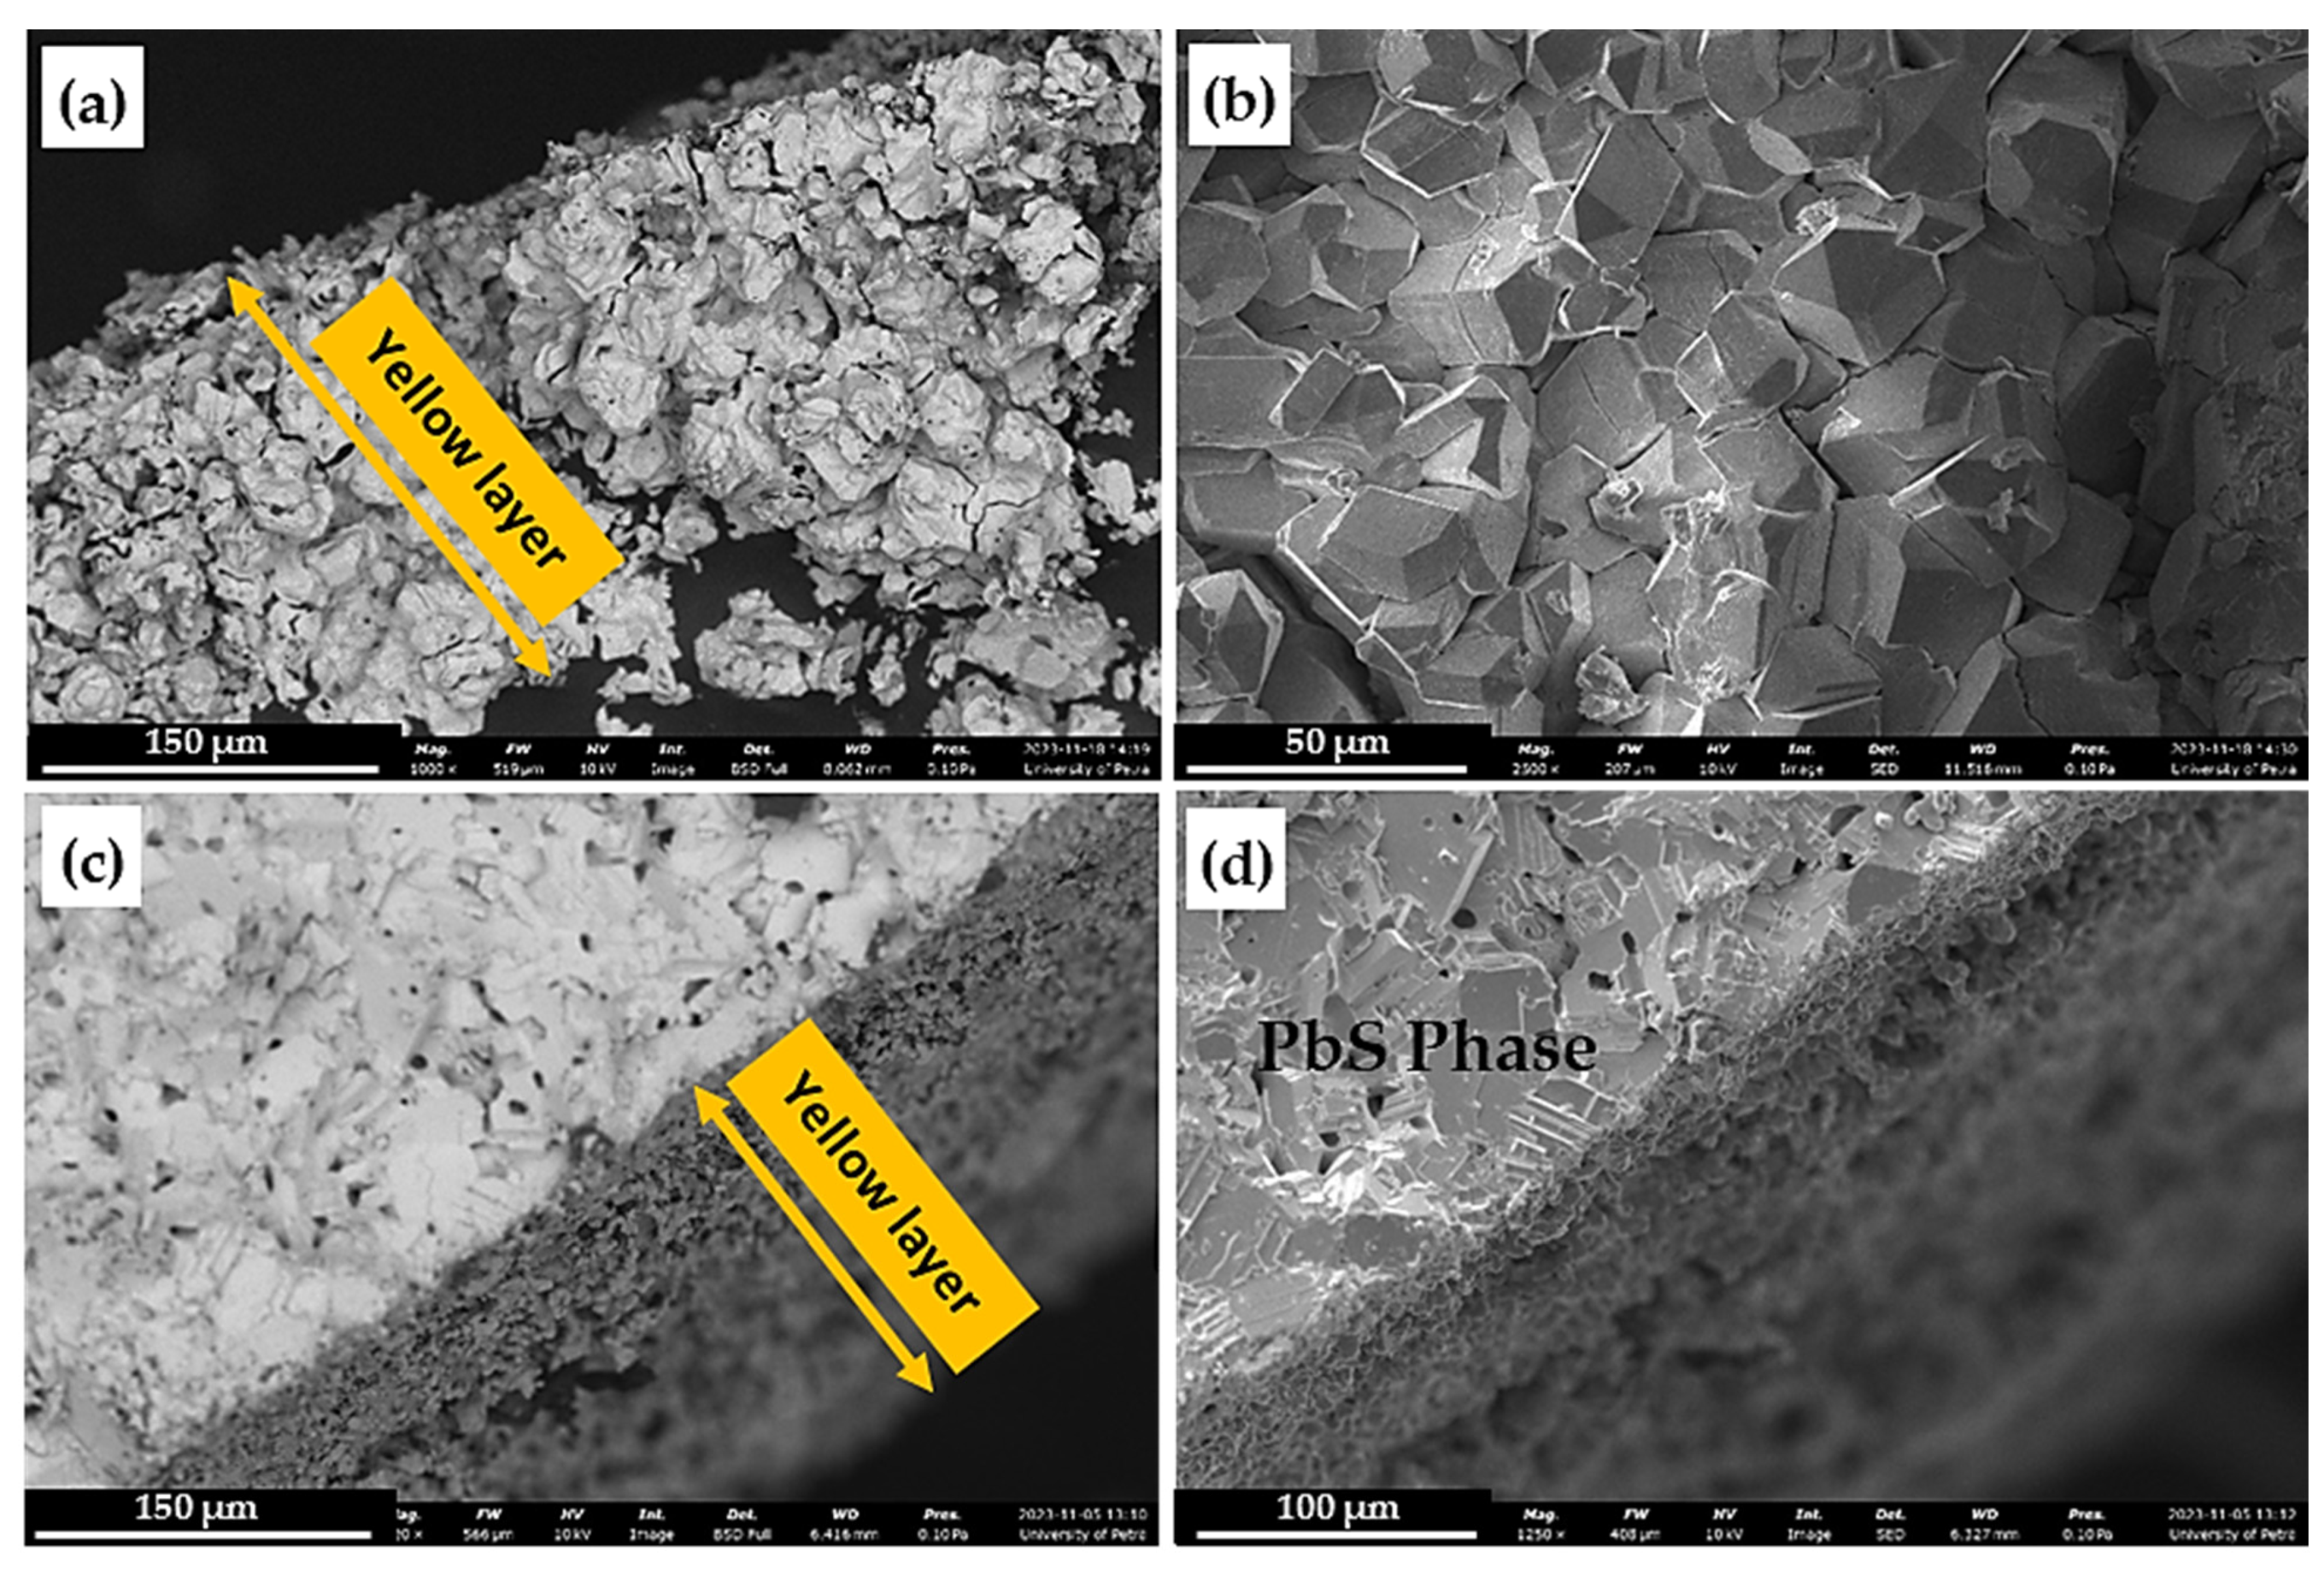
  • The first attempt at compaction was at a pressure of 300 MPa to produce four samples using the homemade single-die compaction unit, two of each 38 µm and 250 µm sieved galena milled powder. The samples were then sintered at 800 °C for 1 h under vacuum to find out the nearest suitable sintering temperature for galena powder. The result showed the formation of a yellow powdery layer, which was then analyzed using the SEM. Thus, the subsequent sintering temperatures were less than 800 °C. The two sintered samples of 38 µm and 250 µm were photographed for comparison purposes to show the difference in their features after sintering.
  • Compaction of sieved powders was continued as required. Four compaction pressures 200, 250, 300, and 350 MPa were utilized on the 63 µm galena powder to realize the effect of compaction pressure on GD and consequently on SD products as a result. The produced green bulks were sintered at 700 °C for 1 h to find out the highest SD with regard to compaction pressure, to be adopted in the subsequent sintering stage. The highest SD was at a pressure of 350 MPa, where the result was graphed.
  • A compaction set of the four-milled galena powder of 38, 63, 125, and 250 µm with constant pressure of 350 MPa was carried out for particle-size effect on GD and SD of finished pieces. The green compacted samples were sintered at 700 °C for 1 h in the same sintering condition above, and the result was plotted.
  • A group of compacted samples of 63 µm powder at a constant pressure of 350 MPa was sintered with different temperatures of 550, 600, 650, and 700 °C for 1 h to realize the change in the SD with sintering temperatures. The SD of all cases was graphed as a function of sintering temperature and relative sintered density (RSD%), where the obtained SD values were treated according to the following equation:
R S D % = S D D g a l e n a × 100
where Dgalena is the as-received density of the used galena determined by the water displacement method.
  • Also, the SD with respect to sintering time of 0.5, 1, 2, and 3 h at a constant sintering temperature of 700 °C and constant pressure of 350 MPa was investigated, and the result was plotted with the RSD%.
  • Finally, a set of compactions at a pressure of 350 MPa using 63 µm powder was conducted to report the effect of the L/D ratio on the GD and SD.
SEM and XRD investigations were carried out after sintering for microstructure and chemical analysis to interpret the obtained results. For the SEM, fracture surfaces of some sintered specimens were well stuck on the double adhesive carbon tape that is already fixed on aluminum stubs to be ready for the test. The specimens did not need coating with a thin conducting layer, such as gold, platinum, or carbon, as they are semiconductors and will be already earthed with the SEM stage.

4.4. Vickers Micro-Hardness Measurement for the As-Received Galena and Sintered Product

Vickers micro-hardness measurement for the as-received sample and sintered one of 38 µm that is compacted at 350 MPa and sintered at 700 °C for 1 h was carried out using the Micro Vickers Hardness Tester listed in Section 3. The samples were ground by emery papers ranging from 600 to 2000, with a rotation of 90° when switching from one paper to another after well cleaning with alcohol between grinding steps. The ground samples were then polished using the diamond pastes of 7, 3, and 1 µm in sequence with good cleaning after each stage of polishing. The process of grinding and polishing was essential to obtain a smooth surface ready for the macro-hardness test. The hardness values were then tabulated with the applied load.

4.5. X-ray Diffraction (XRD) Test

The XRD examination for three samples was conducted using the X-ray system mentioned in Section 3. The investigated samples were as follows: one of them is a milled galena powder of 38 µm, the other one is a powder of milled sintered pellet of 38 µm at 700 °C for 1 h, and the third one is a powder of milled sintered pellet of 38 µm at 800 °C for 1 h. The aim of these tests was to distinguish their patterns for compression purposes and new phase findings. The determination of phases and other analyses were carried out using the XRD HighScore Plus software, version 5.2 (Malvern Panalytical, Almelo, The Netherlands) and gathered in one figure for comparison purposes.

5. Result and Discussion

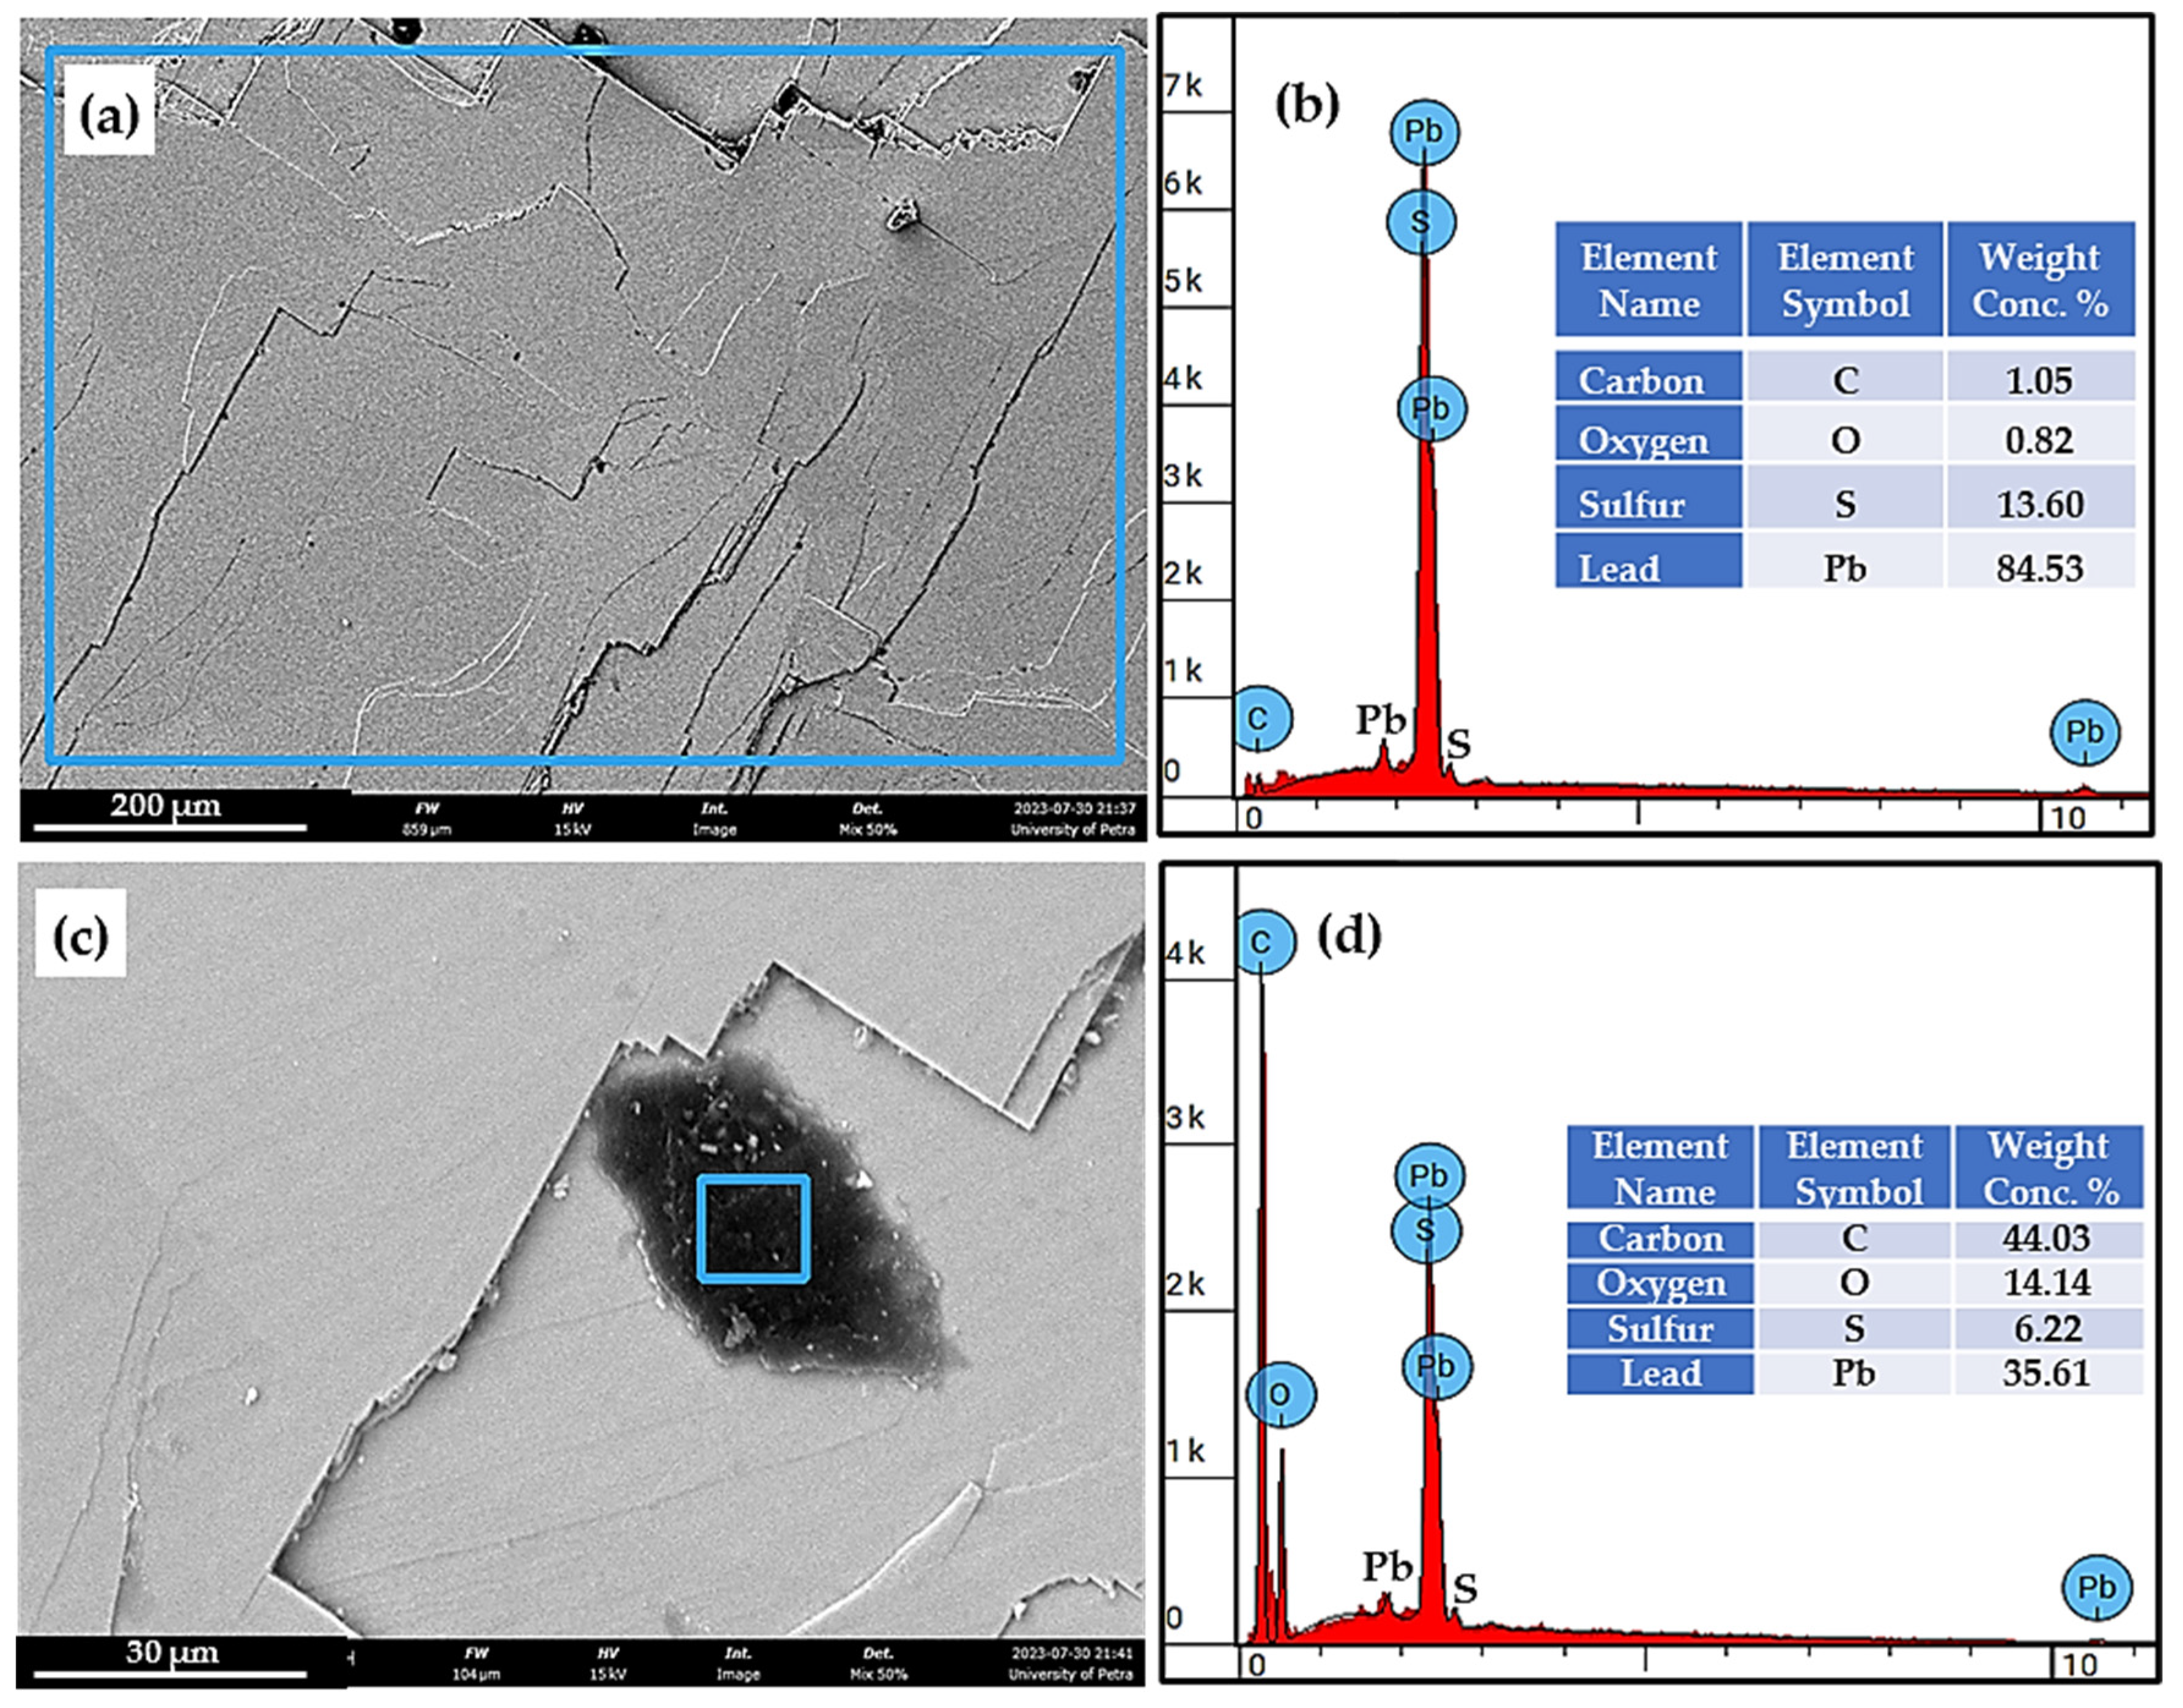
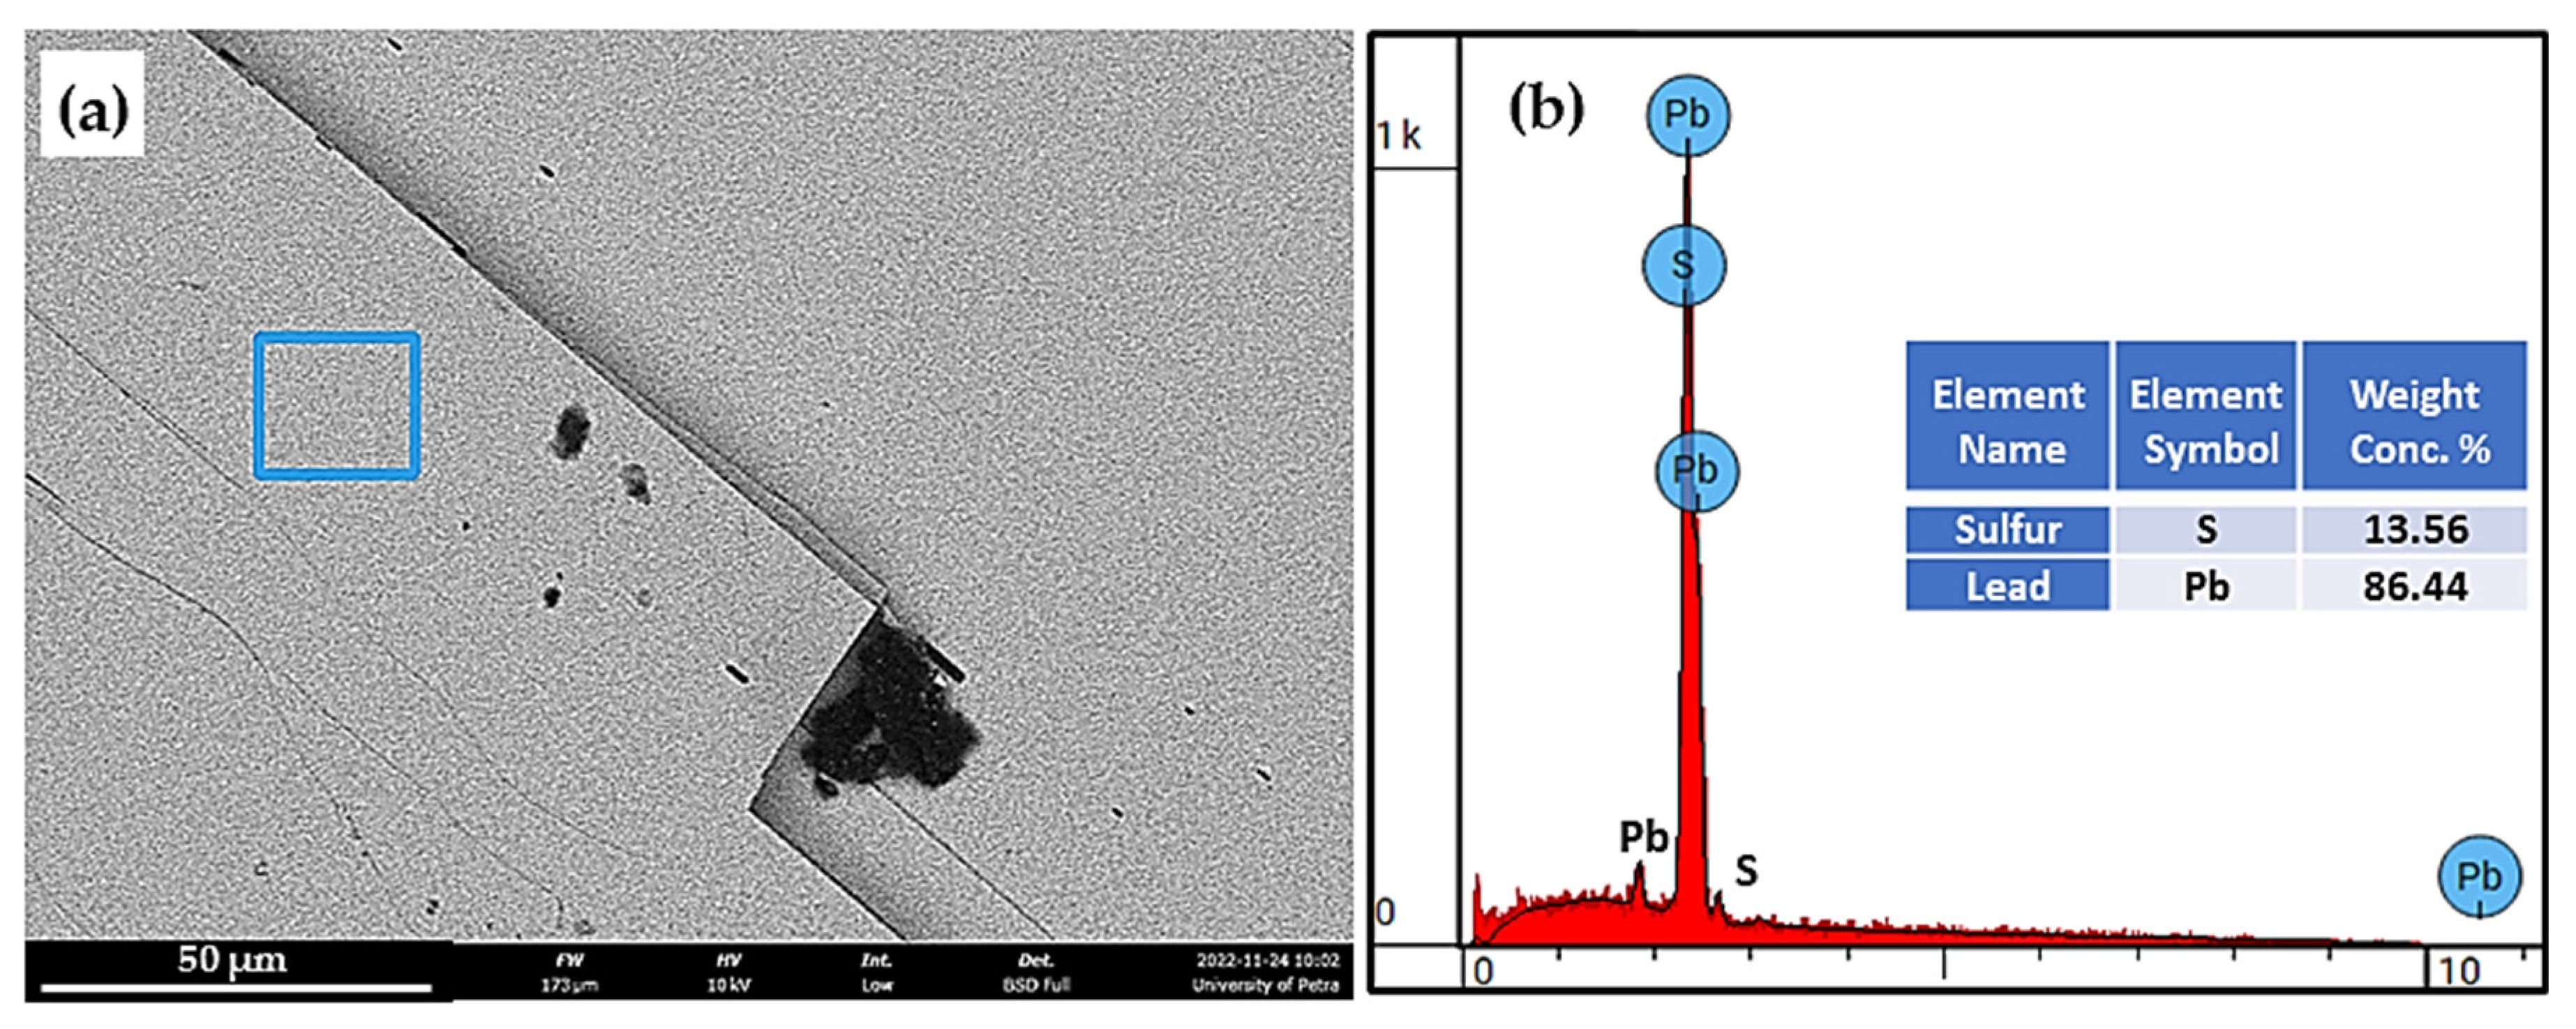
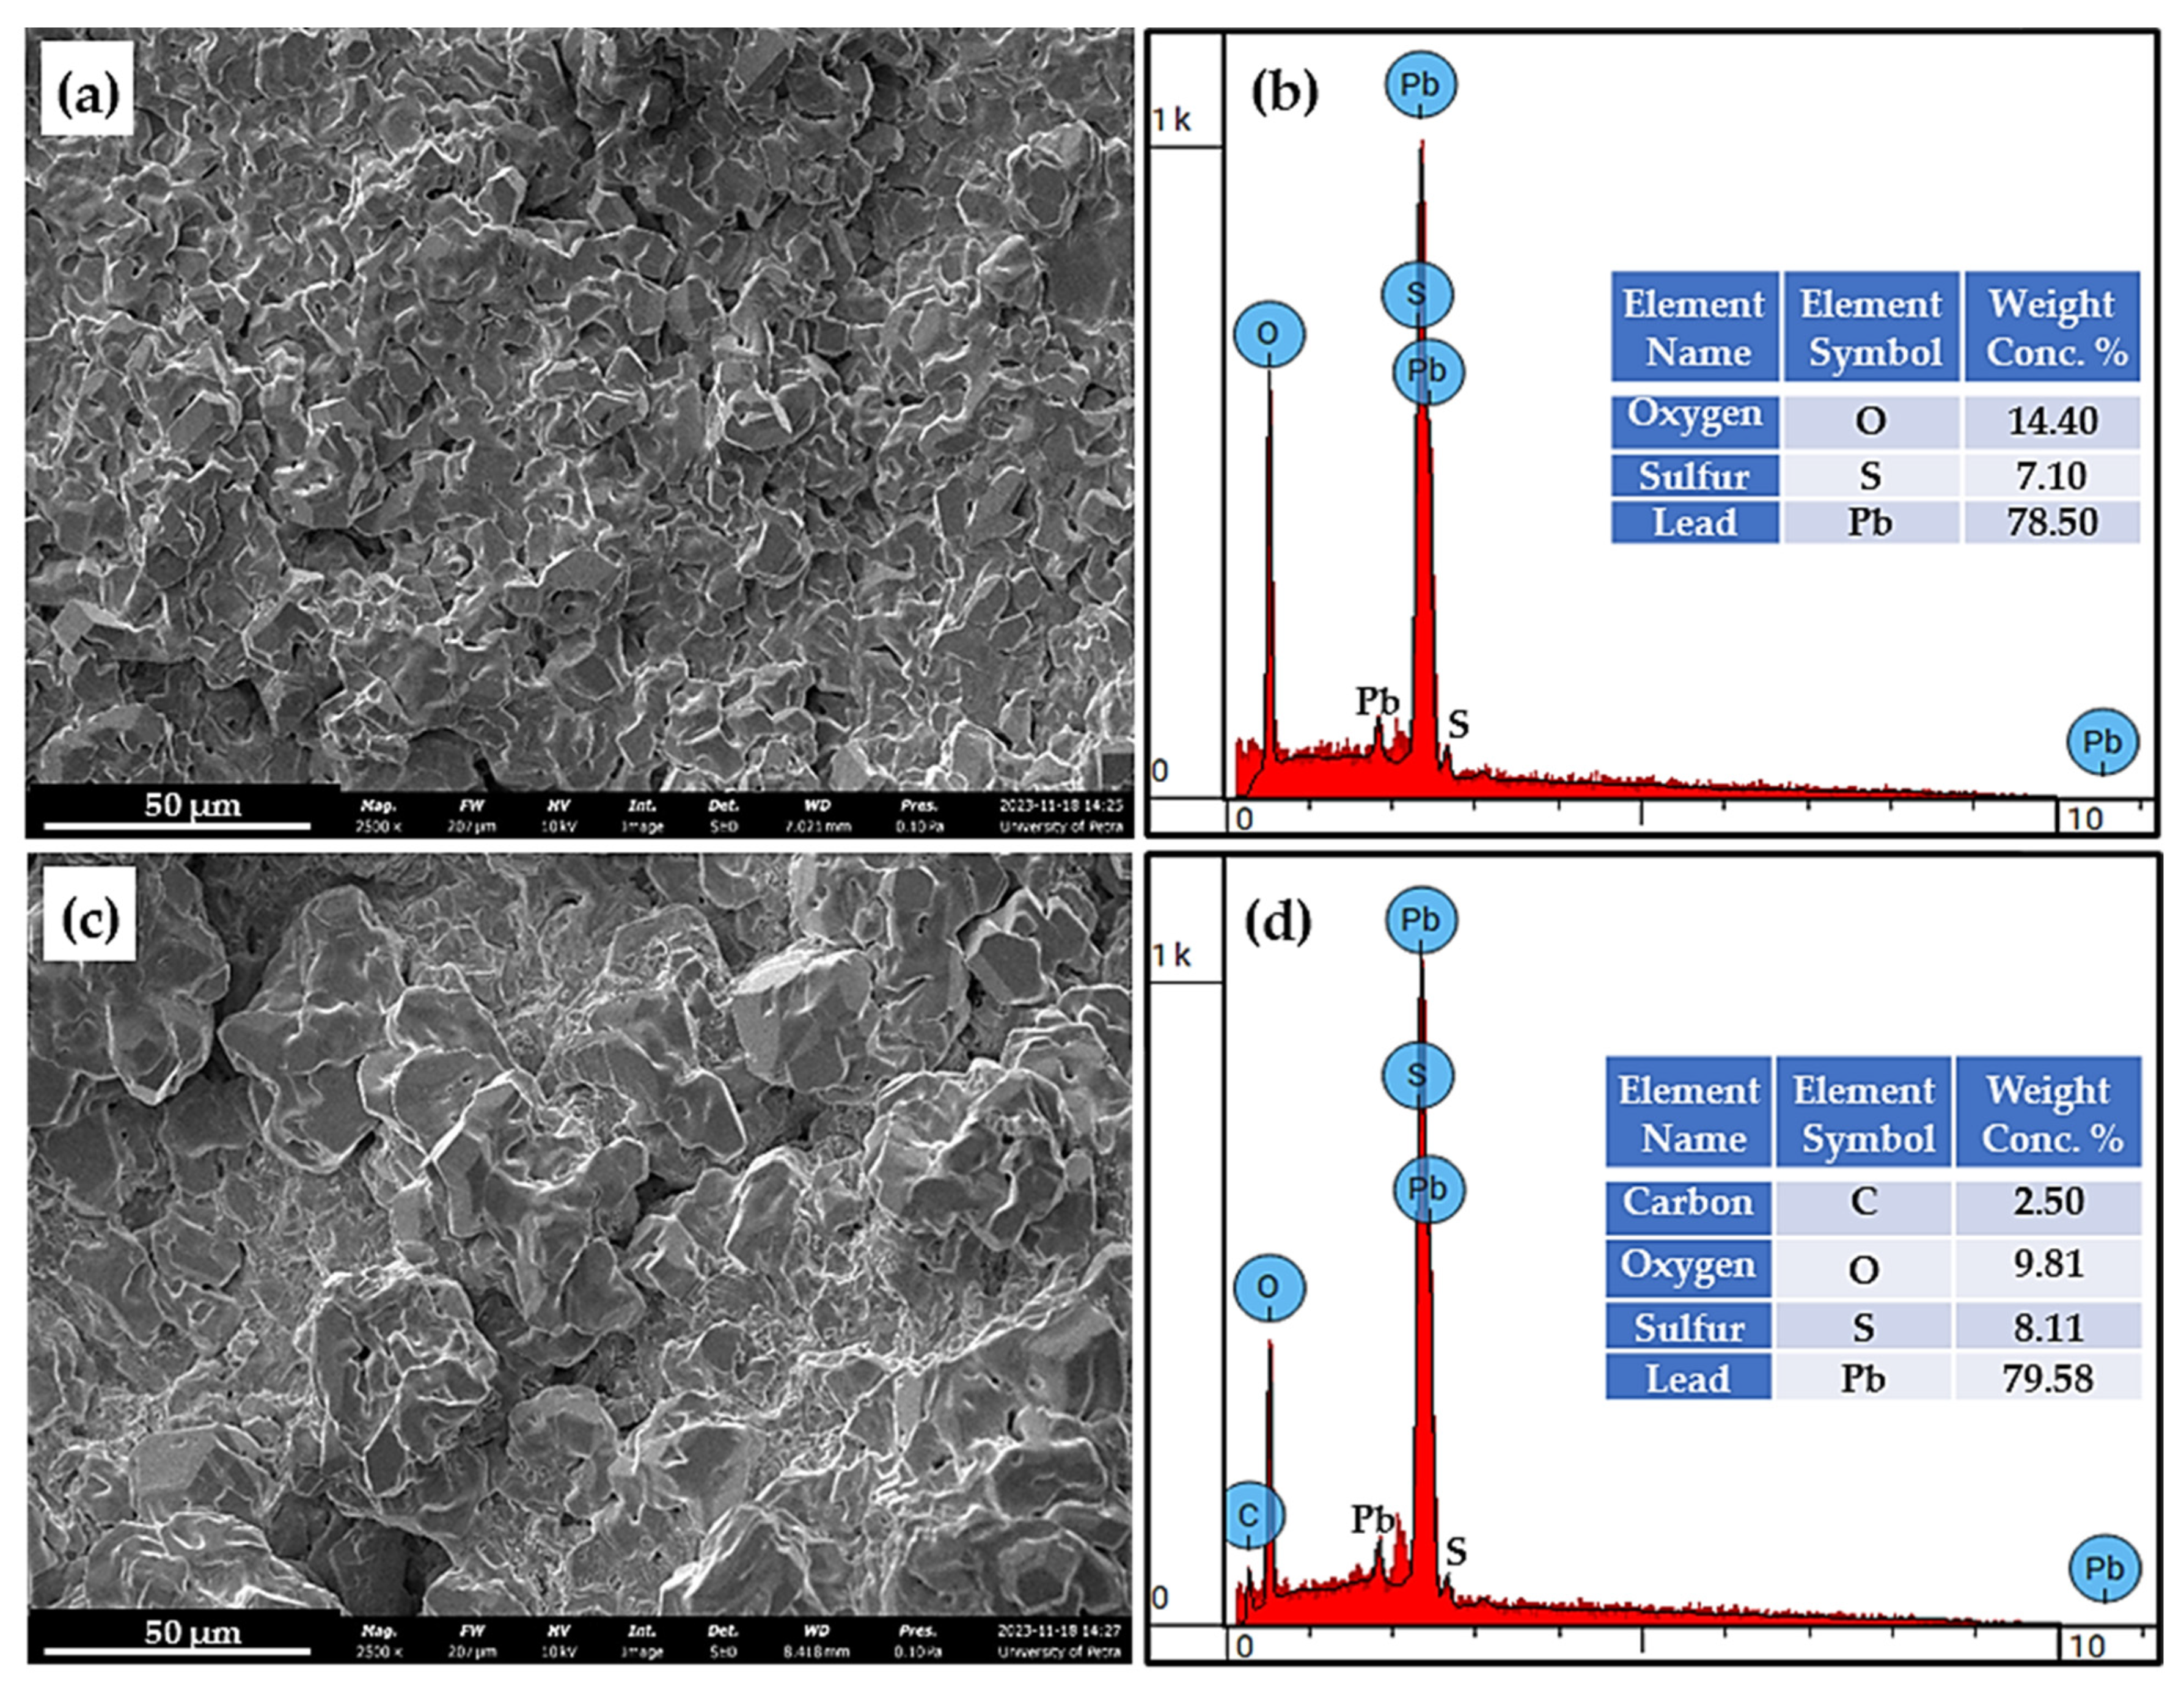
5.1. Microstructure and Chemical Composition of the As-Received Galena

It is necessary to note that the fractured nature of galena ore is very brittle and easy to break. The fracture surface was preferred to be semi-flat for good SEM microstructure and chemical analysis. The SEM examination exhibited that the features of the as-received galena show 90° cleavage fractures as displayed in Figure 3a. The EDAX investigation confirmed that the general chemical composition of the used galena was almost an inorganic PbS compound with 1.05 wt.% of carbon and 0.82 wt.% of oxygen (Figure 3b). According to the SEM instrument’s manufacturer, the accuracy of the elemental analysis by the EDAX is about 1 wt.%, and the sensitivity is approximately 0.1 wt.% for all detected elements. Meanwhile, the EDAX was used to identify the black spots that spread in the microstructure (Figure 3c), and it turns out that these spots are C-rich and O-rich (Figure 3d). The carbon presence in the general analysis of galena, which appears to be concentrated in a certain phase, came from the galena ore used initially.
Figure 4 displays an SEM image of the PbS matrix phase in addition to its EDAX spectrum and chemical analysis table. The EDAX result confirmed that the matrix phase of the as-received galena is a PbS compound with 13.56 wt.% of S and 86.44 of Pb, which are comparable with the theoretical values of S and Pb elements in this compound of 13.4 wt.%, and 86.6 wt.%, respectively. This is an encouraging result in relying on galena with a high concentration of lead sulfide phase as a source of this compound for practical applications.

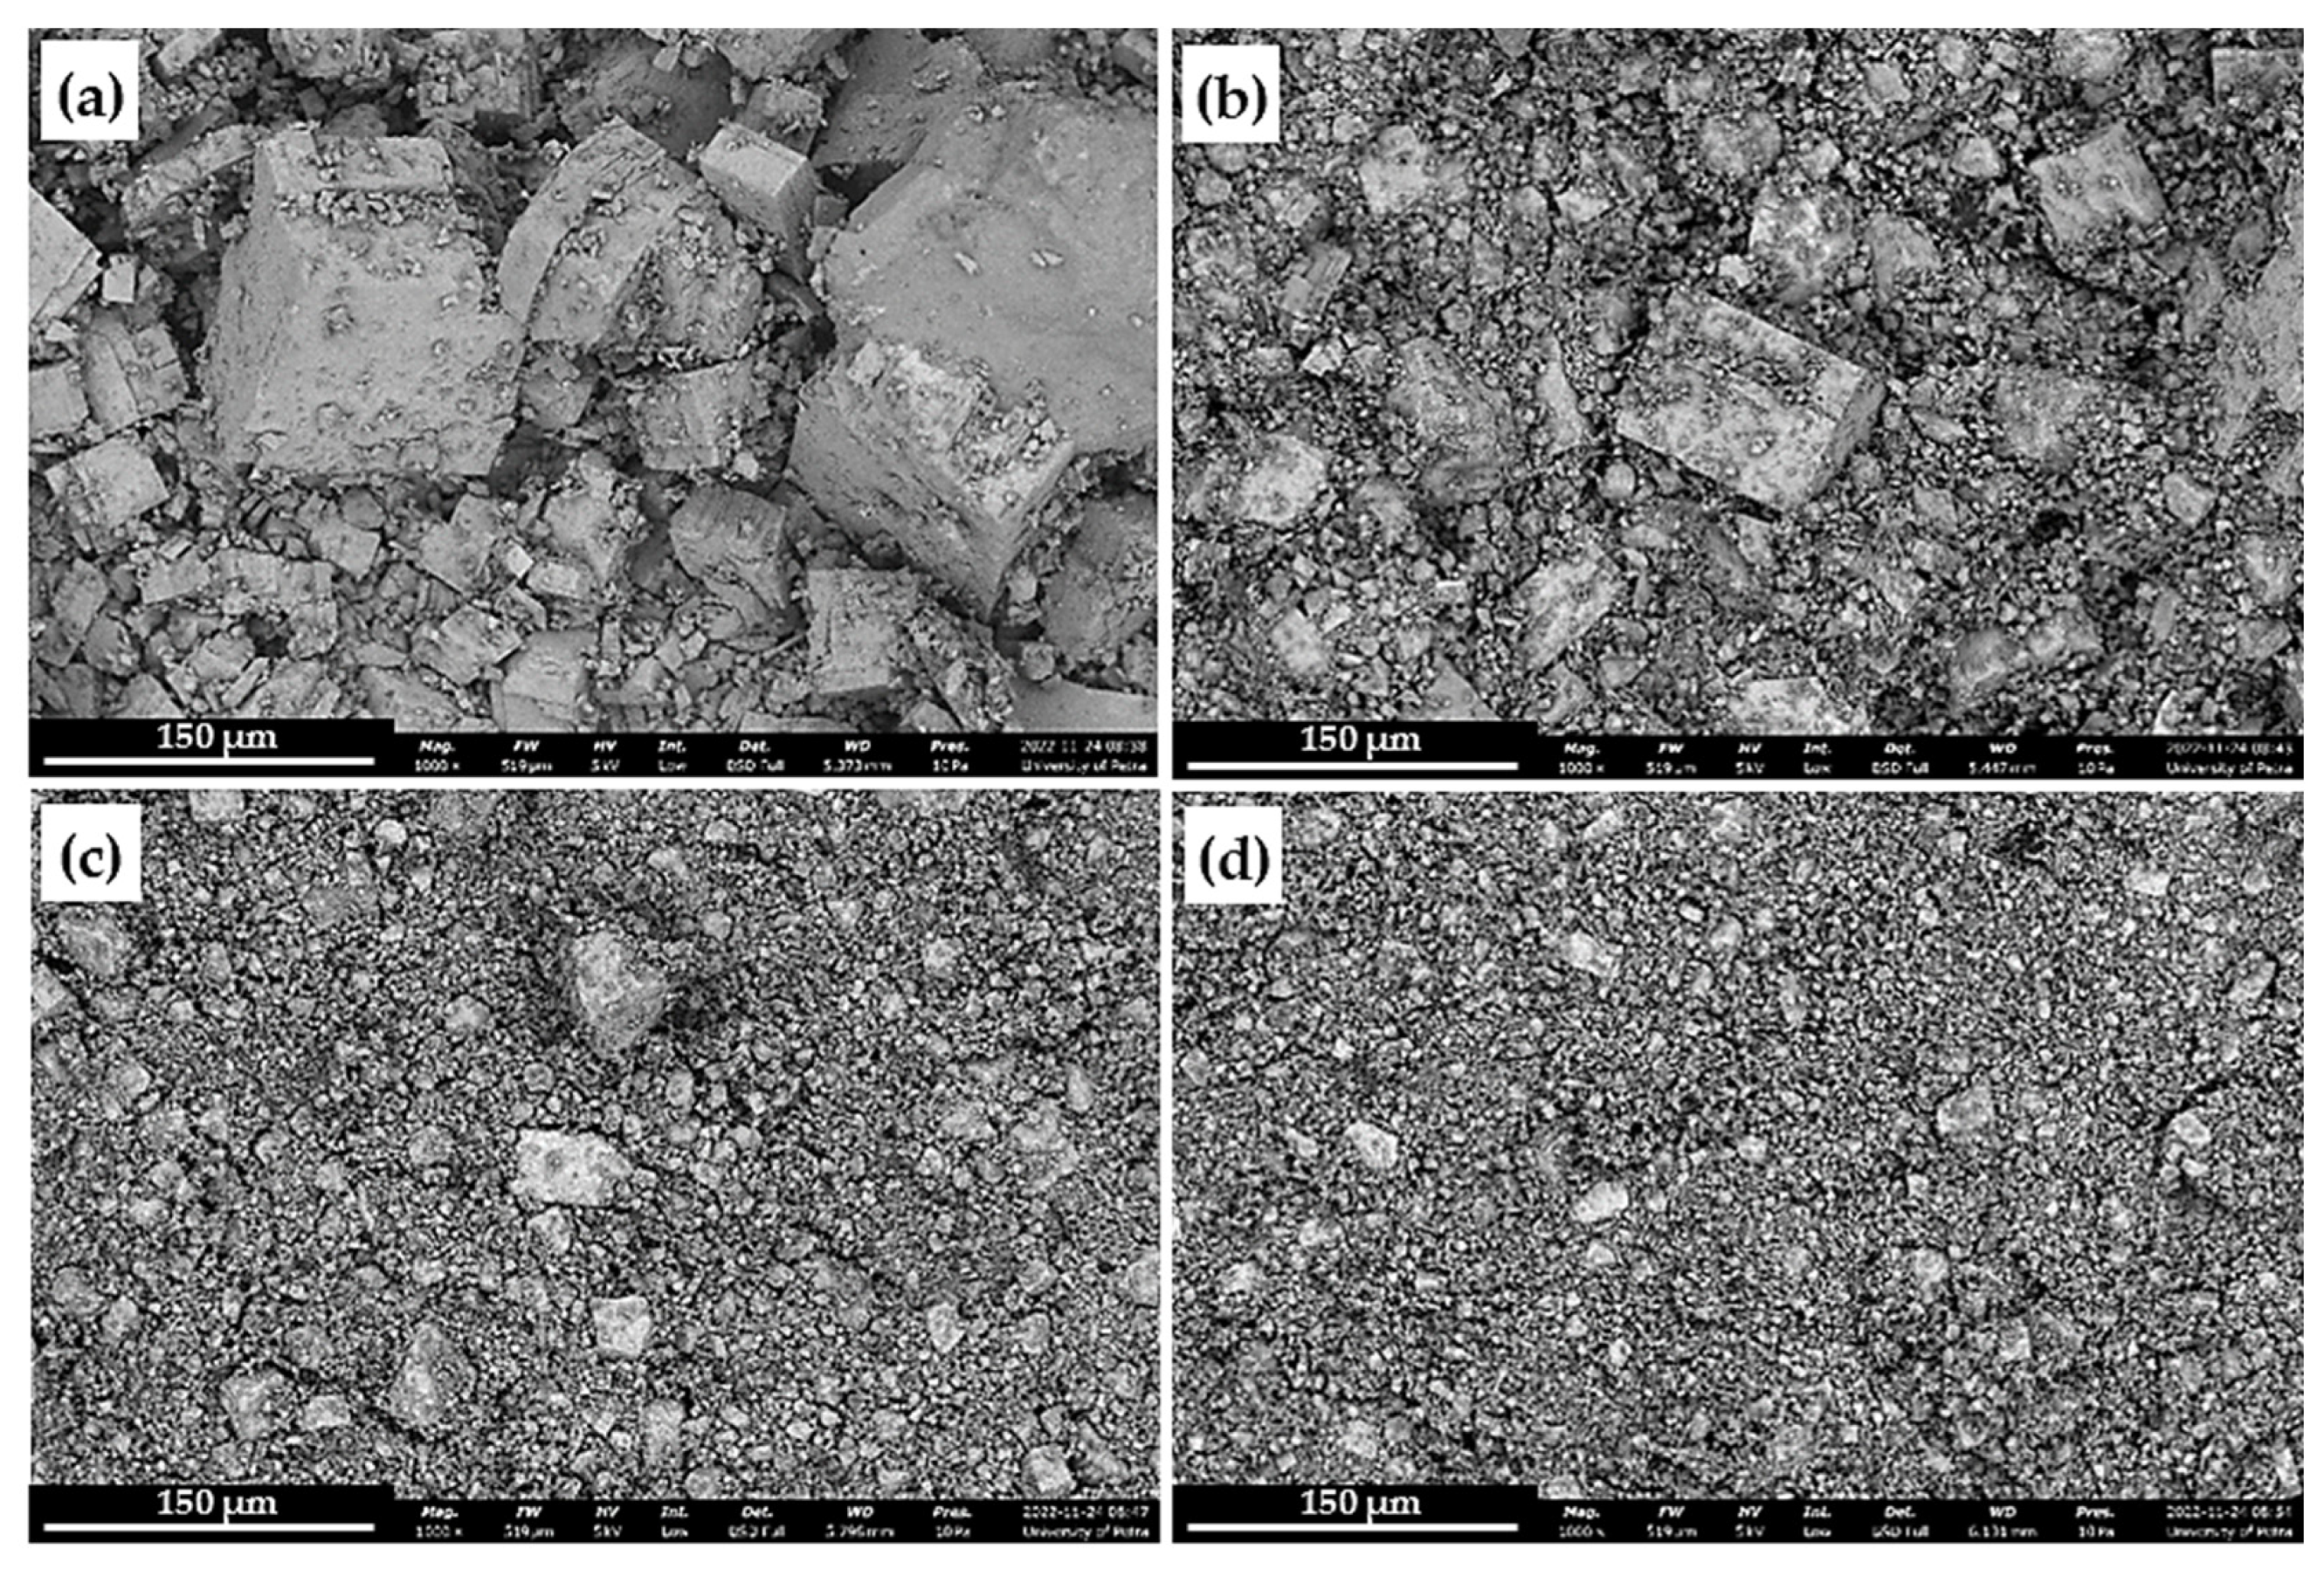
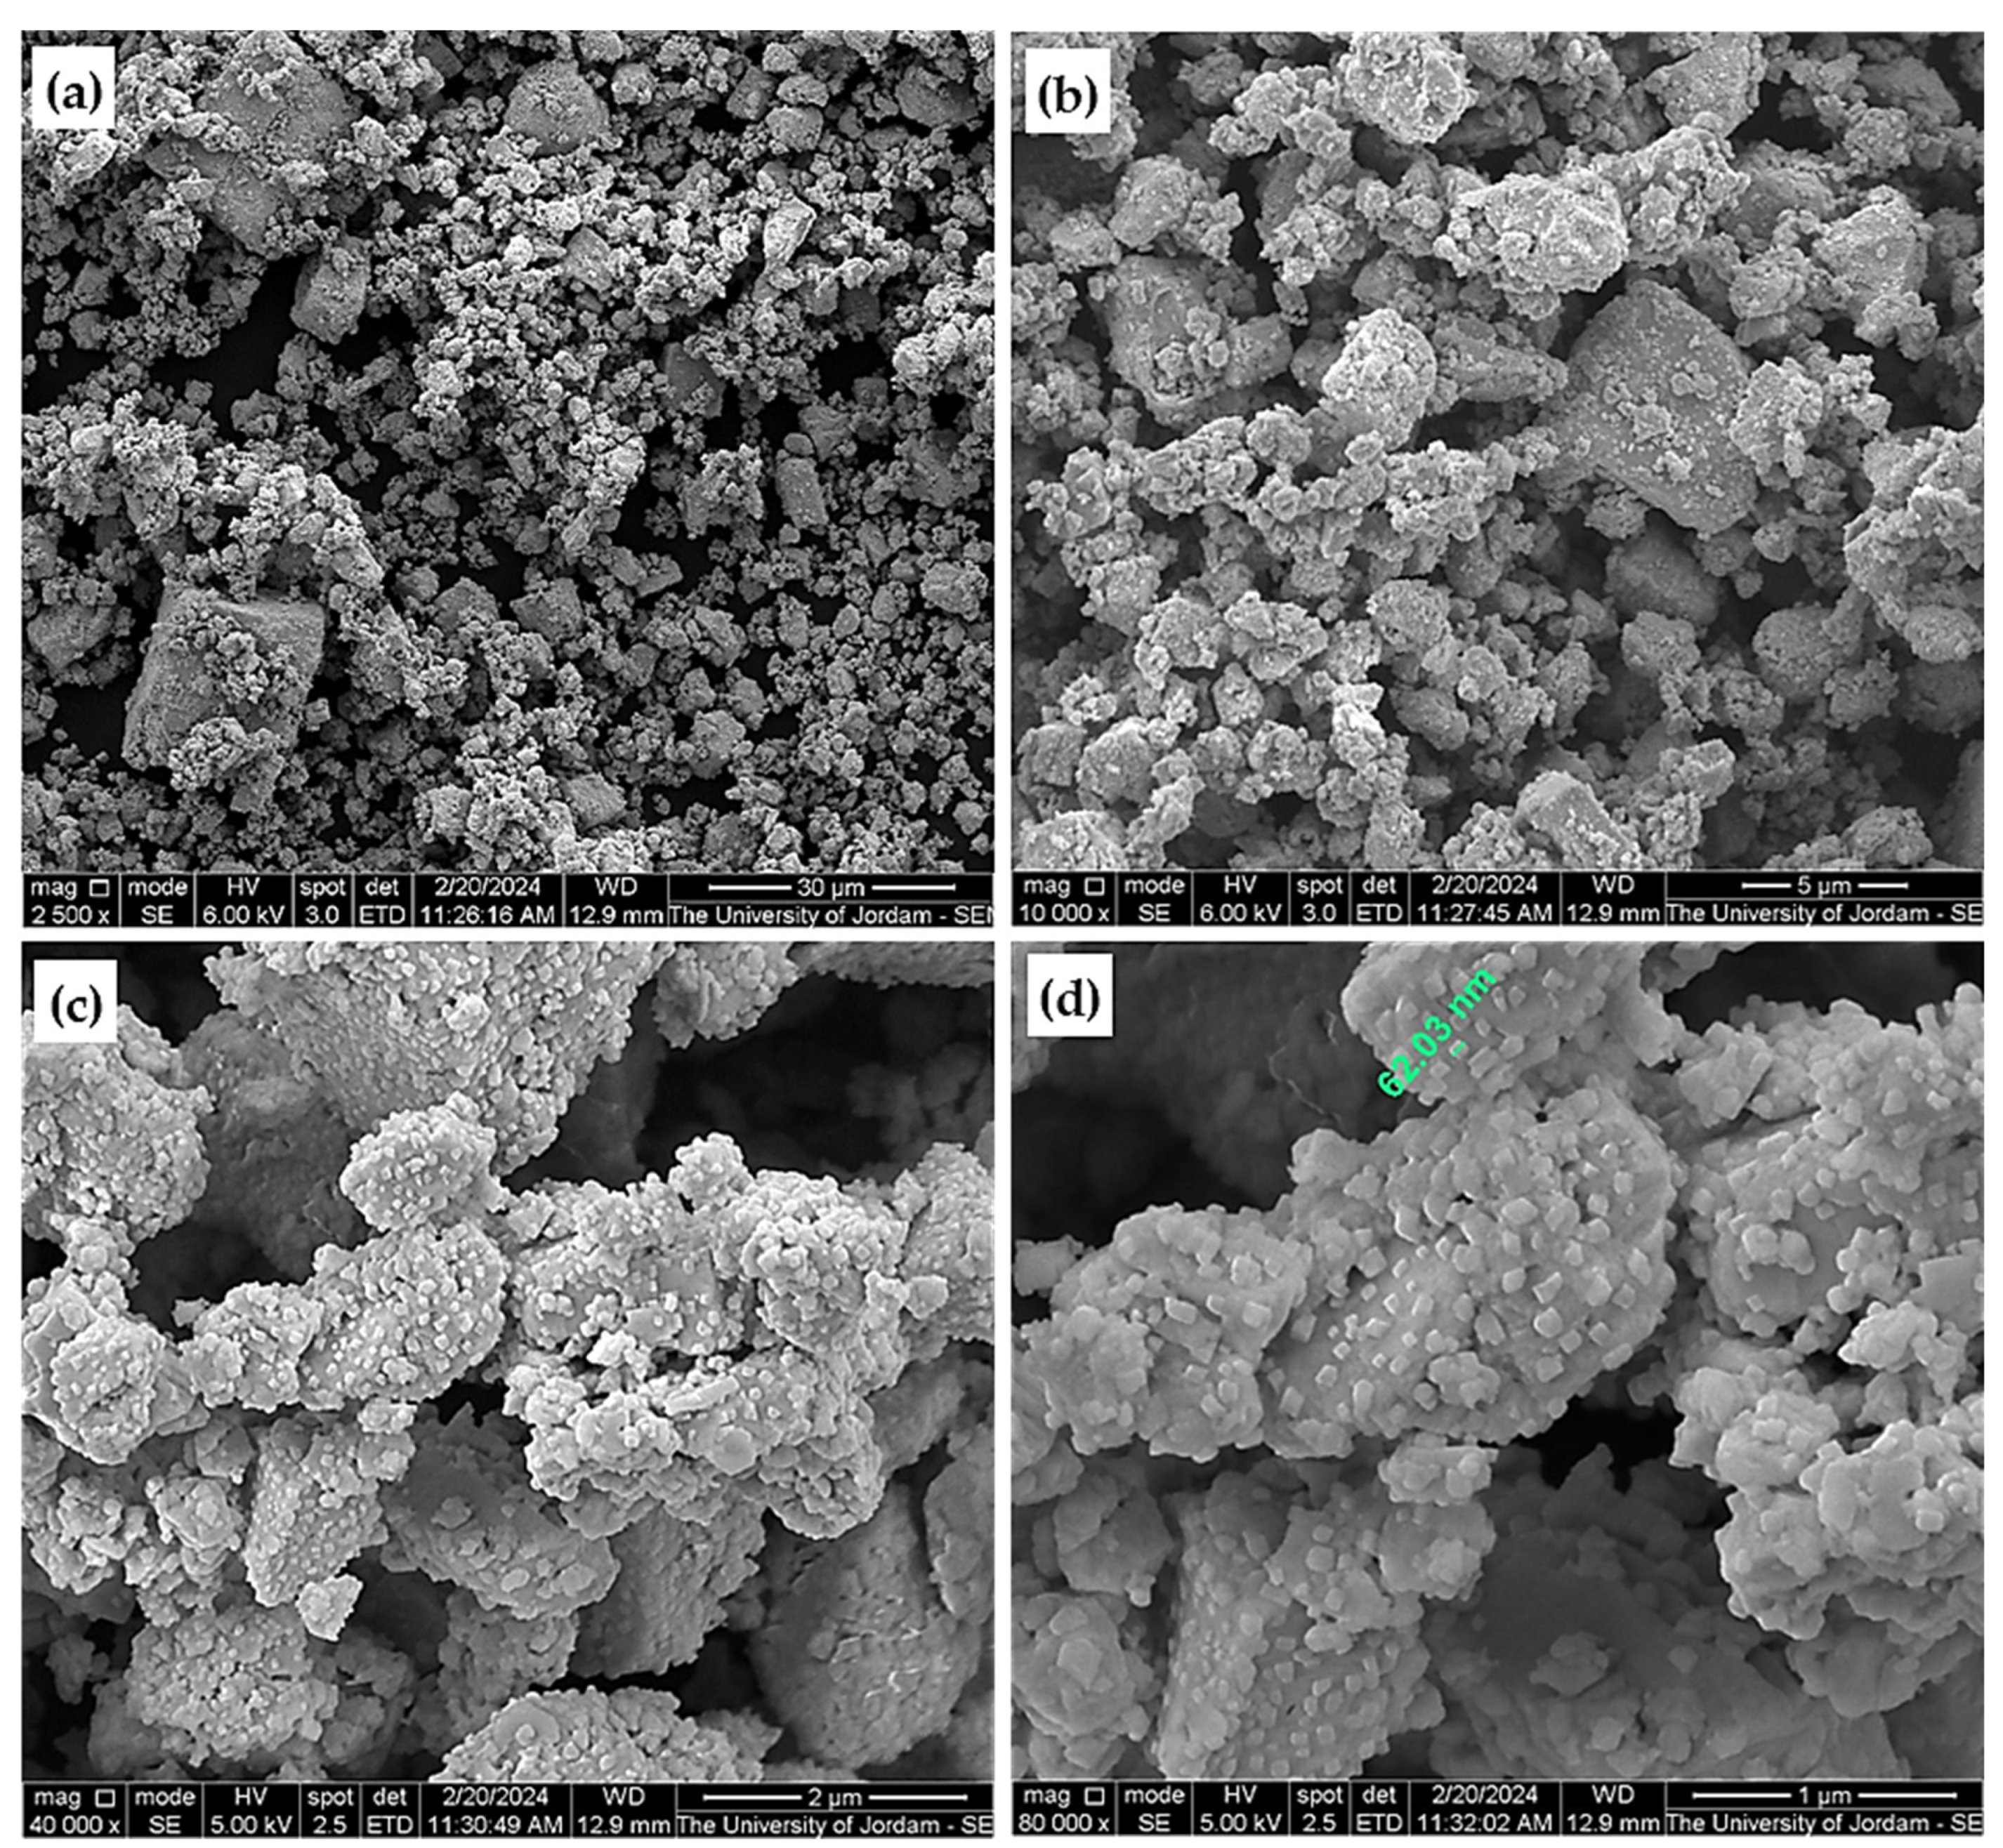
5.2. Investigation of the Milled Galena

The time of milling using the high-speed vibrating milling machine was around 5 min, which is relatively short because of the high efficiency of the milling machine. The disadvantage of this machine is that it needs a large quantity of material because of its large milling capacity. The starting galena lumps and the milled powders after using the four stainless-steel micro-sieves are shown in Figure 5. It can be observed that the nature of the powder produced for each sieve is different by color and pourability. The finer the powder, the darker its color; because of that, light reflection is less for finer particle size compared with larger particle size powders.
Figure 6 shows the SEM micrographs at the same magnification of 1000× for the four-range particle size of galena powder for a direct comparison of the particle size change after milling and sieving. It can be seen from the figure that the particle size range becomes narrower as the sieve hole decreases (Figure 6d). This case occurs upon the milling of brittle materials, such as the galena ore.
High magnification and resolution SEM micrographs were taken to assess the microstructure and surface morphology of the sieved powder. Figure 7 shows four different magnifications for the 38 µm sieved powder. A wide range of particle sizes of approximately 5 µm to less than 0.6 µm and very few large particles (>25 µm) can be identified. This result of a wide range of particle sizes and irregular particle shapes is expected for high brittleness alloy milling. For the 10,000×, particles of diameter equivalent to approximately 500 nm can be calculated, which exists in the sieved powder of 38 µm, and the largest particle size is about 25 µm as shown in the 2500× magnification. Also, the images of 40,000× and 80,000× confirm that the commercial galena large grains originally consisted of nanocrystals of 130 nm on average.
Obtaining a fine powder within a short milling period of 5 min. When using the high-vibration milling machine, it is attributed to the high brittleness characteristic of galena and the high milling efficiency of the machine. Generally, in powder metallurgy, compaction of a wide range particle size leads to high green density compared to the narrow range particle sizes powder and vice versa. Because the voids between the large particles will be filled with the small ones, as we will see when determining the green densities of the compacted products.

5.3. Sintering of Galena Powder, Green and Sintered Densities, and Microstructure

5.3.1. Sintering at 800 °C under Vacuum and the SEM Investigation

The photograph of the first run of sintering at 800 °C for 1 h under vacuum for two particle sizes of 250 µm and 38 µm is shown in Figure 8. The result was forming a yellow powdery layer on the sample of 38 µm, while a mottled layer close to white color was formed on the one of 250 µm. Table 1 summarizes the masses of sintered samples before and after sintering, which were compacted at 350 MPa. The results indicated mass redaction after sintering, which means that evaporation took place during the heat treatment at 800 °C. The averaged mass reduction of the 38 µm and 250 µm sintered powders were about 0.04 and 0.02 g, respectively. The reason for this result is due to the big particle size difference between the two cases. As expected, the smaller the particle size, the greater the reactivity during the sintering stage.
The SEM images of sintered samples of 250 µm and 38 µm at 800 °C for 1 h with their EDAX spectra confirmed that the surface layers were both crystalline structures, as shown in Figure 9. It is clear from the figure that the grain size of the 250 µm sample surface is smaller than that of the 38 µm sample by approximately 50%, and their chemical compositions are shown in the inset tables in the figure. The reason for this result is probably due to the existence of much fine particle size powder in the sample of 38 µm, which in turn leads to easy segregation and agglomeration at the surface during the sintering process and hence forms larger grains. The forming of the yellow layer on the 38 µm sample may be due to the forming of yellow PbO compound and PbSO4 compound because of the decomposition of lead sulfide and the ions of Pb and S react with very little available O element in the starting material as was shown in Figure 3c. However, it seems that the quantity of the PbO was higher than the PbSO4, which is a white compound; thus, the yellow color became dominant for the formed layer on the 38 µm sample. The fine particles of the 38 µm powder help to ease decomposition. The color of the 250 µm surface layer was white-speckled, which may be due to the forming of a PbSO4 compound, that its texture is a white crystalline solid. This topic needs more detailed and comprehensive future study.
The thickness of the yellow surface layer of the sintered 38 µm sample was about 200 µm at the sintering condition at 800 °C for 1 h, as exposed in Figure 10. The figure confirms the ideal crystalline structure of the yellow layer as shown in the image (Figure 10b), which was taken for an individual powder of this layer, and the average crystal diameter is about 5 µm. The figure also proves that the phase beneath the surface layer is a crystalline PbS compound. Figure 10a was taken for fracture of the compacted-sintered sample at the sintering condition above to perceive the detail of the yellow layer formation.

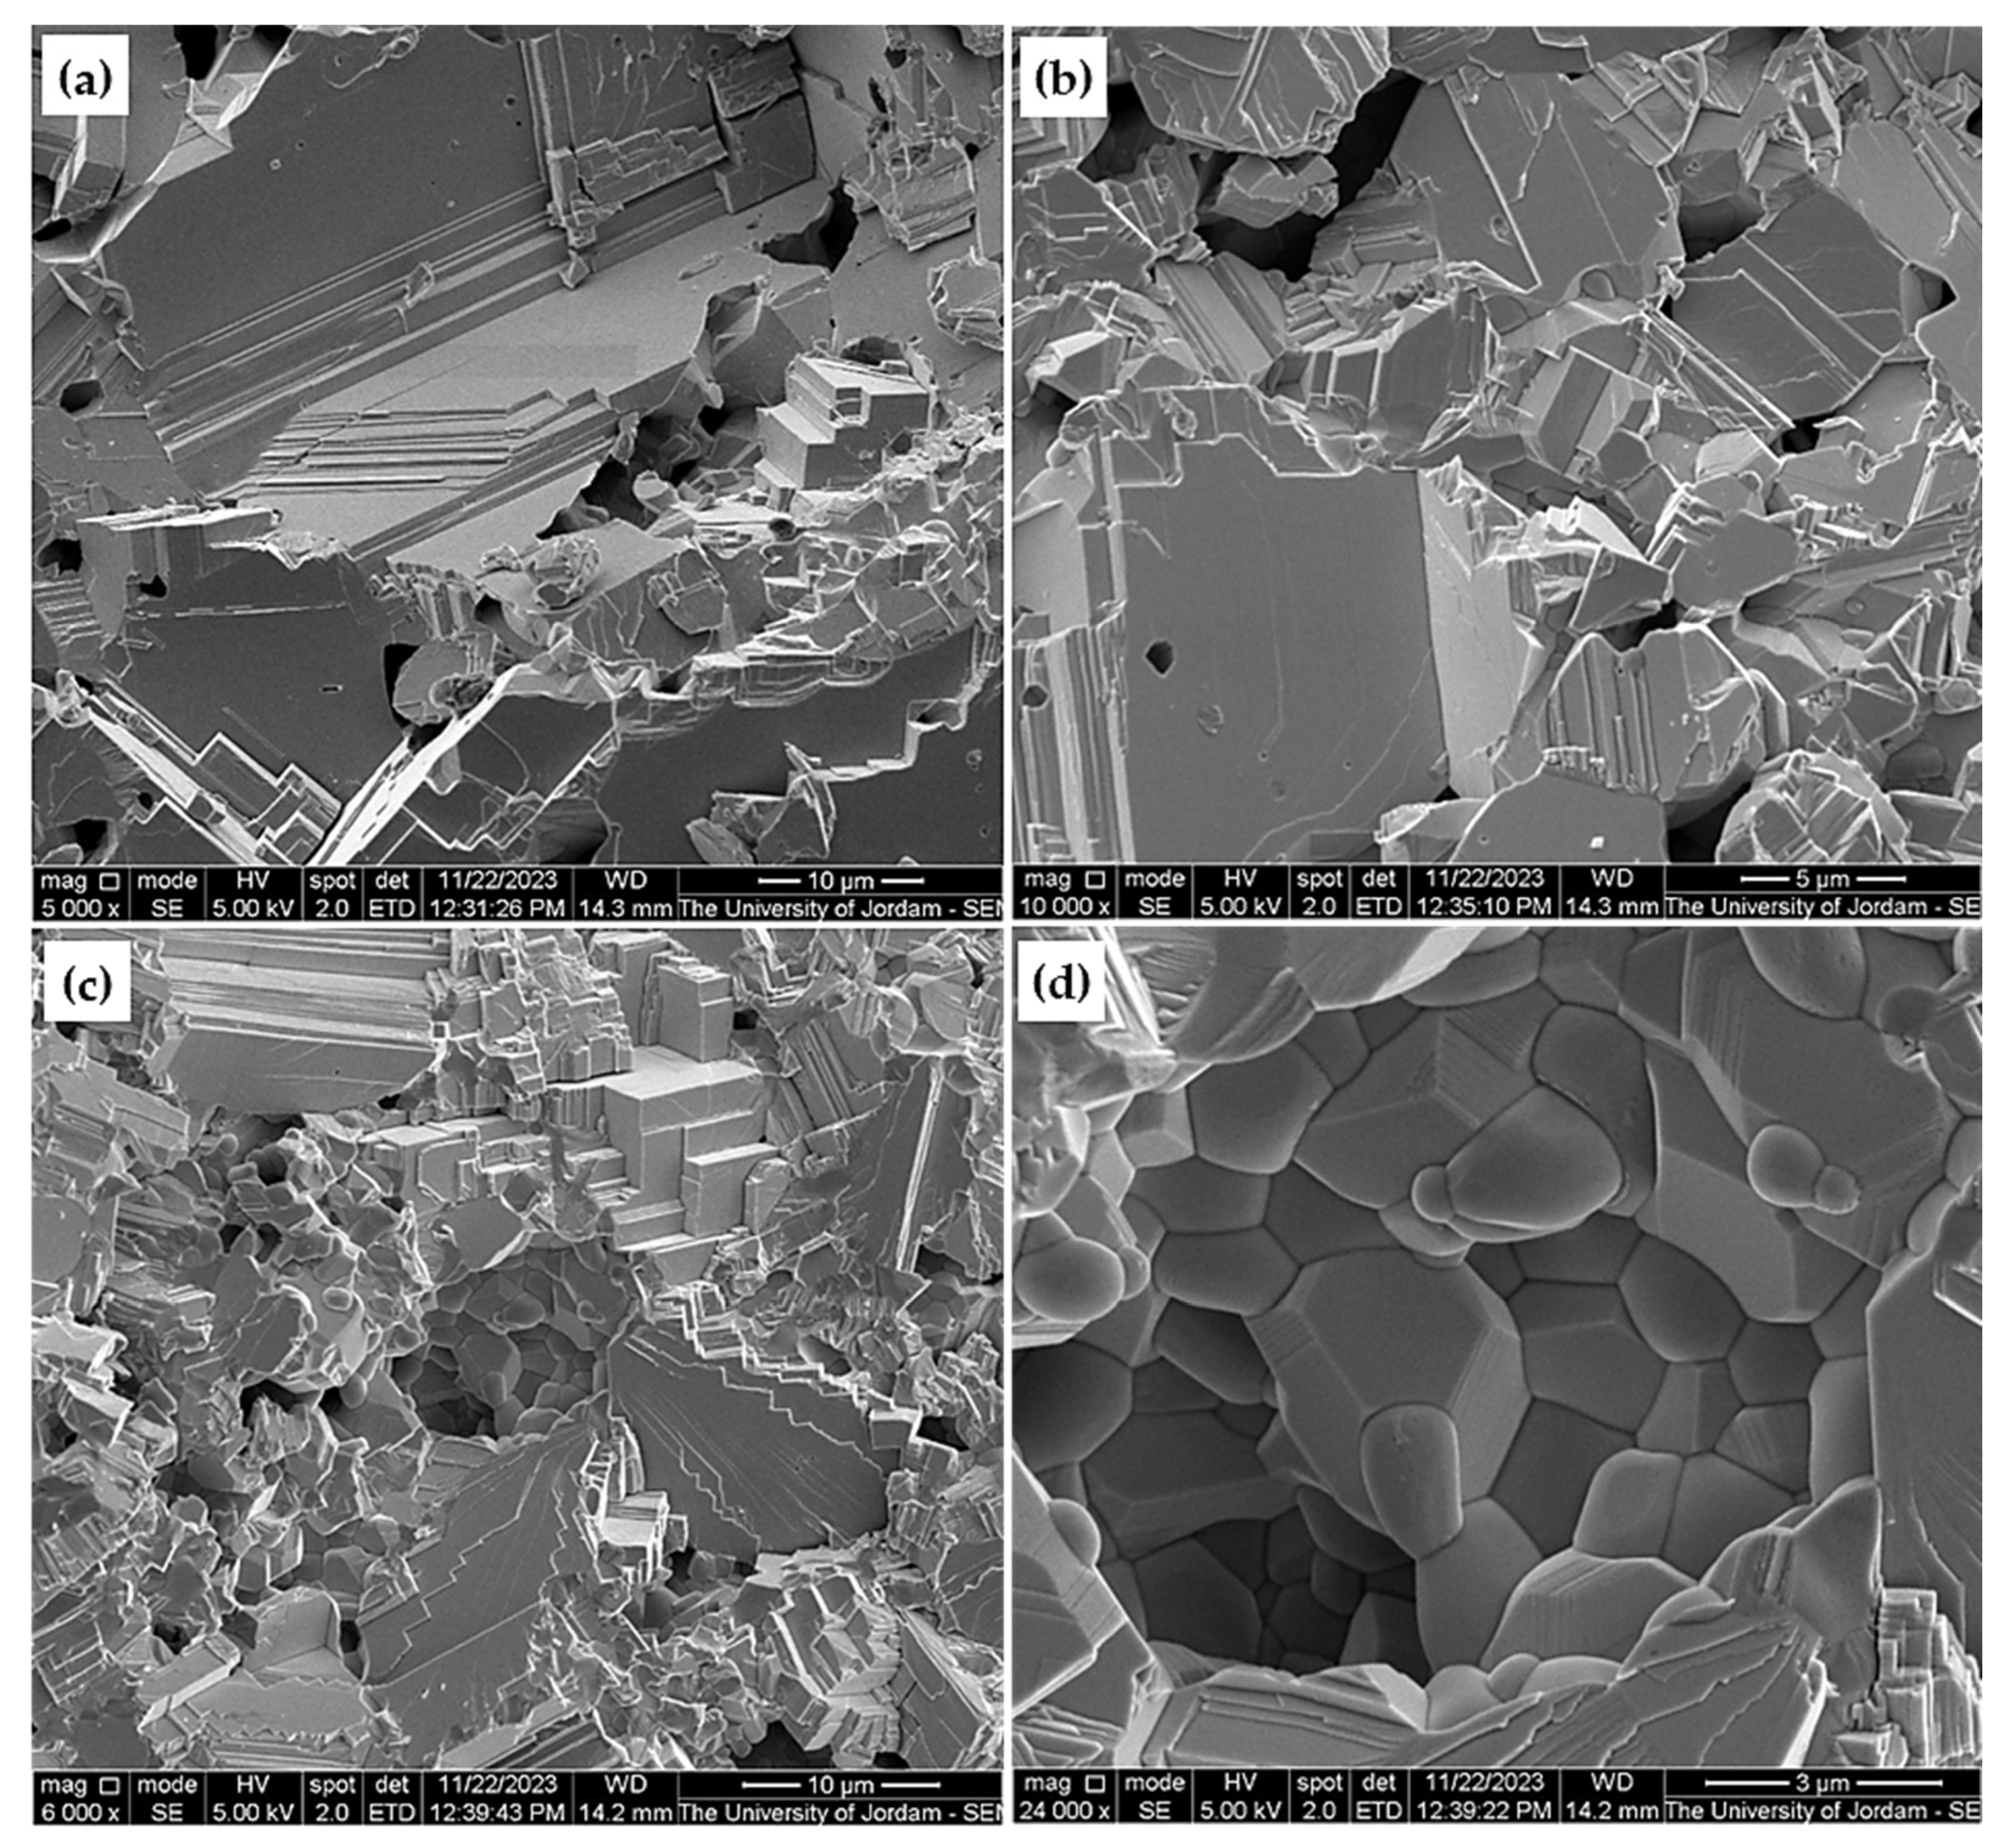
5.3.2. Green and Sintered Densities Feedback and Microstructure of Sintered Products

Green density (GD) is defined as the density of the compacted powder, and the density after sintering is sintered (SD) density. Generally, increasing the compaction pressure within the allowed limit, using a wide range of particle-size powder, and adding lubricant materials leads to an increase in GD and subsequently increases the SD of the final product unless otherwise required. The as-received galena density was determined using the water displacement method and found to be approximately 7.41 g/cm3, to be a reference for GD and SD of galena powder products. Therefore, approaching this value is evidence of the success of sintering in terms of compaction pressure, sintering temperature and atmosphere, and time. The GD and SD of compacted and sintered galena sieved powder of 63 µm with four different compaction pressures were geometrically calculated and drawn. Also, the GD and SD of a compacted and sintered set of four samples at constant pressure with four particle sizes of 38, 63, 125, and 250 µm were evaluated. The two cases were sintered at 700 °C for 1 h under vacuum, and their result is displayed in Figure 11. It can be concluded from part (a) of the figure that the SD reached a steady state, that is, about 7.36 g/cm3 at a pressure of 300 MPa and above at 700 °C sintering temperature for 1 h in the vacuum atmosphere for 63 µm galena powder. This value is approximately 99.3% of the as-received galena lump density (7.41 g/cm3) when using Equation (1), which is a superior result using the powder metallurgy production route.
R S D % = S D D g a l e n a × 100 = 7.36 g / c m 3 7.41 g / c m 3 × 100 = 99.3 %
Furthermore, part (b) of the figure indicates that the GD increases with particle size increasing, while the case is reversed for the SD. This outcome is probably due to the wide range of the 250 µm compacted powder, which already leads to higher GD at constant pressure (Figure 6a,d), in addition to discussing this condition in Section 2.1. The GD increases with the increasing particle size range, as the small particles of the compacted powder will fill the vacancies in between the large ones, which subsequently leads to higher green density. However, in the case of the 38 µm sample, the SD is directly proportional to the particle size reduction. This result is expected because the sinterability increases with particle size reduction, which, in turn, increases the surface area of sintered powder in general. In addition, the SEM showed perfect images of the PbS phase for a 63 µm sintered pellet at 700 °C for 1 h as an example for the sintered product, as shown in Figure 12. Generally, the feature of the PbS phase is similar to the staring galena PbS phase, but the grain size is smaller compared with the staring galena bulk (Figure 3). It is also noted that colonies of small grains exist that are sintered in a different way, as seen in images (c and d). It is believed that these colonies resulted from the sintering of very small galena particles, which are already formed as a result of extremely brittle milled galena ore.
Figure 13 illustrates the result of two runs of 63 µm powder sintering to study the SD as a function of sintering temperature and time with a constant compaction pressure of 350 MPa together with their RSD%. From it, it can be realized that the sintering temperature plays a vital role in the sintering process for reaching the highest SD within the range limit of sintering treatment. The maximum SD was at 700 °C for 1 h, as seen in part (a) of the figure. The sintering with respect to time showed that the maximum SD was obtained after one hour or more, as shown in part (b) of the figure. This sintering temperature of galena powder is about 63% of the melting point of pure PbS compound (1114 °C), which is an encouraging result as the sintering temperature generally starts at about 70% of the melting point of any sintered powder in solid state sintering condition. The time of sintering is also very important for getting the highest SD when determining the sintering temperature. The process is experimental until the ideal state for the sintering process is reached in a regrade of temperature and time for a certain powder. In addition, sometimes, post-sintering treatment is very important to improve the physical properties of powder metallurgy products, especially in the case of liquid phase sintering [28]. Increasing the sintering time more than enough may change the properties of the final product. Therefore, the sintering temperatures and times must be studied extensively to obtain the desired result.
Figure 14 summarizes the study of GD and SD with regard to L/D ratios of compacted samples of 63 µm galena powder in the range of 0.24–0.71. Both the GD and SD gradually decline with the increase of L/D, as expected and discussed in Section 2.6. Thus, it is highly recommended to go for a low L/D ratio to produce high packing and homogenous green density and obtain a high SD as a result when using the powder metallurgy technique. The ideal condition for this process is to apply the appropriate compaction pressure with no defect during the ejection action from the die of compaction.
In addition, curve-fitting and inferring their linear equations was performed using the graphical Origen software, version 8.6 (Northampton, MA, USA. Table 2 summarizes the general equation of GD and SD as a function of L/D with the predicted parameters when applied to determine GD and SD according to their production condition. The following are the calculation equations of GD and SD according to the obtained data in Table 2:
G D = A + b x = 6.64651 0.6517 x
S D = A + b x = 7.47494 0.4794 x
where x is the value of L/D of the compacted sample. The experimental results of GD and SD were in good agreement with the feedback of the equations above. The slope of the SD curve is less than that of the GD curve because the volume of the sintered sample decreases during sintering while its mass mostly stays constant.
It is very important to mention that the maximum compaction pressure to obtain a high green density depends on the compressibility of the compacted powder, adding some lubricant to the compacted powder, particle size range, and the L/D ratio. Also, higher pressure than required leads to green products breaking during the ejection process from the die due to the high residual strain condition. Normally, the hard material powder is not easy to compact at high pressure, and vice versa. So, the compaction of a new powder needs to apply gradual pressure until it reaches the maximum value with no damage to the product during the ejection stage. In the case of needing a porous structure product for a certain application, it is possible to use low pressures according to the required porosity, and this is typical experimental work. Very significant information about powder metallurgy and its various applications has been reported [17,29,30,31].

5.4. Micro-Hardness Result of the As-Received and Sintered Product

The micro-hardness of a product reflects an idea of the change in its properties as a result of a physical action performed on it, such as milling and sintering. The measurement of the micro-hardness that was carried out on the as-received galena and sintered sample of 38 µm gave a mean value of approximately 80.52 and 42.25 MHV, respectively. Table 3 includes five values of each sample and their mean values. The micro-hardness of the sintered sample is about 52.5% of the as-received galena ore micro-hardness. The standard deviation of the as-received galena bulk is almost twice of the sintered powder of galena, which is the expected result as the sintered sample has a more relaxed and homogenous structure than that of the natural galena ore. The reason for this reduction in the hardness of the used galena is due to the stress relief, which is usually conjugated with materials and heat treatments as an inevitable result in general. According to the specification of the used instrument, the percentage of the error is 2%.

5.5. XRD Investigations

The XRD patterns for the as-received galena powder, sintered pellet powder of 38 µm at 700 °C for 1 h in a vacuum, and 38 µm sintered pellet powder at 800 °C for 1 h in a vacuum are shown in Figure 15. The patterns of the as-received and the sintered one at 700 °C are similar, and all peaks belong to the PbS compound except one peak in the 700 °C curve, as analyzed by the supported x-ray system program mentioned in Section 3. This result confirmed that the sintering process was successful in maintaining the PbS phase as it was in the as-received powder after sintering. This confirms the possibility of producing sintered pieces of PbS compound for practical uses starting from a high PbS compound ratio galena ore.
The XRD characteristics of the tested samples are summarized in Table 4 using the space group Fm-3 m, reference code 96-900-0002 for galena analysis and 96-154-2231 for the second phase analysis. The lattice parameter of the as-received galena powder refers to the PbS phase in all samples, and their unit cells are almost similar to the values reported in the literature [32,33,34]. The trace second phase in the sample of as-received and the sintered one at 700 °C is a monoclinic compound of PbO (PbSO4). Nevertheless, the pattern of 800 °C reveals the formation of a mixture of monoclinic PbSO4 (PbO)2. The PbO compound (yellow color) in the 800 °C sample is twice the 700 °C sintered one, which dominates the yellow color to the surface layer of the 800 °C sample because the color of the PbSO4 compound is white. Also, the EDAX test for the yellow layer that formed on the surface of the 38 µm sintered sample at 800 °C confirmed the existence of Pb, S, and O elements as discussed in Section 5.3 (Figure 9), which supports the result of the XRD investigation. Furthermore, the goodness of fit for all cases is low, which supports the work accuracy.

6. Conclusions

The microstructure and chemical analysis of the as-received galena, milling, and classification of the milled powder, compaction, and sintering at different conditions, followed by microstructure and XRD analysis, microhardness for the as-received and sintered samples, were investigated. The research focused on studying the locally available galena, which was found to be highly enriched with the PbS compound. The results can be briefed as follows:
  • The microfracture and chemical analysis were well investigated, and proved that the as-received galena was found to be mostly a PbS compound.
  • The processes of compaction and sintering in a vacuum were very successful in producing perfect PbS pellets.
  • At a compaction pressure of 350 MPa and a sintering temperature of 700 °C for 1 h, the results confirmed reaching a high RSD% of approximately 99.3%, which is excellent in the case of solid-state sintering upon using the powder metallurgy route.
  • After sintering, SEM and XRD investigations confirmed maintaining the PbS phase as it was in the as-received starting galena.
  • After sintering at 800 °C for 1 h, yellow and white colored layers were formed on the surface of the 38 µm and the 250 µm sintered pellets, respectively.
  • The micro-hardness measurement showed a sharp reduction of about 52% in the hardness of the sintered 38 µm sample in comparison with the as-received galena.
  • The ratio of length to diameter (L/D) of compacted and sintered samples was studied, and the result indicated that the GD and SD decrease as the ratio increases.
Overall, we demonstrated that galena ore with a high content PbS phase can be used to produce the semiconductor pieces of PbS employing the powder metallurgy method in a vacuum atmosphere. Sintered products can be used according to the desired shapes, as the powder metallurgy route provides precise control over the sizes, chemical compositions, and product shapes.

Author Contributions

Conceptualization, B.S.A.-S., A.M.A., I.S.M. and E.A.; Methodology, A.A.-M., Y.A.-D., A.N.A.-M., I.H., I.S.M. and E.A.; Software, Y.A.-D., I.H., Q.A.-A., M.M.Z., M.E. and I.S.M.; Validation, A.N.A.-M., I.H., M.E., I.S.M. and E.A.; Formal analysis, A.M.A., I.H., I.S.M. and E.A.; Investigation, A.A.-M., Y.A.-D., I.H., Q.A.-A., M.M.Z., M.E. and I.S.M.; Resources, B.S.A.-S., A.A.-M., A.N.A.-M., I.S.M. and E.A.; Data curation, A.A.-M., A.M.A., M.E., I.S.M. and E.A.; Writing—Original draft, I.S.M. and E.A.; Writing—Review & editing, B.S.A.-S., A.A.-M., I.H., I.S.M. and E.A.; Visualization, I.H., Q.A.-A. and I.S.M.; Supervision, A.M.A., I.S.M. and E.A.; Project administration, E.A.; Funding acquisition, B.S.A.-S., A.N.A.-M. and E.A. All authors have read and agreed to the published version of the manuscript.

Funding

The authors would like to acknowledge the deanship of scientific research at University of Jordan for funding this research project. Research grant no. 2529.

Data Availability Statement

The original contributions presented in the study are included in the article, further inquiries can be directed to the corresponding author.

Acknowledgments

The authors highly acknowledge Waddah Mahmoud from the Department of Geology at the University of Jordan for his kind help in the SEM work.

Conflicts of Interest

The authors declare no conflict of interest.

References

  1. Nnanwube, I.A.; Onukwuli, O.D. Hydrometallurgical Processing of a Nigerian Galena Ore in Nitric Acid: Characterization and Dissolution Kinetics. J. Miner. Mater. Charact. Eng. 2018, 6, 271–293. [Google Scholar] [CrossRef]
  2. Raza, M.A.; Bhatti, M.A.; Nasir, S.; Bashir, F.; Mahmood, Z.; Kazmi, K.R.; Hafeez, I. Study on Low-Grade Galena-Barite Ore Beneficiation In Khuzdar, Balochistan, Pakistan. Min. Miner. Depos. 2019, 13, 1–8. [Google Scholar] [CrossRef]
  3. Chaerun, S.K.; Putri1, E.A.; Mubarok, M.Z. Bioleaching of Indonesian Galena Concentrate with an Iron- and Sulfur-Oxidizing Mixotrophic Bacterium at Room Temperature. Front. Microbiol. 2020, 11, 557548. [Google Scholar] [CrossRef] [PubMed]
  4. Al-Saqarat, B.S.; Al-Mobydeen, A.; Al-Masri, A.N.; Esaifan, M.; Hamadneh, I.; Moosa, I.S.; AlShamaileh, E. Facile Production Method of PbS Nanoparticles via Mechanical Milling of Galena Ore. Micromachines 2023, 14, 564. [Google Scholar] [CrossRef]
  5. Ogwata, C.M.; Onwughalu, M.K. Occurrence of Galena and its Potentials for Economic and Green Energy Revolution in Nigeria. IRE J. 2019, 3, 139–142. Available online: https://www.academia.edu/43430505/Occurrence_of_Galena_and_its_Potentials_for_Economic_and_Green_Energy_Revolution_in_Nigeria (accessed on 27 March 2024).
  6. Tan, J.; Cao, Z.; Wang, S.; Zhong, H. Selective recovery of lead from galena-sphalerite by electro-oxidation. Hydrometallurgy 2019, 185, 218–225. [Google Scholar] [CrossRef]
  7. Ezekoye, B.A.; Emeakaroha, T.M.; Ezekoye, V.A.; Ighodalo1, K.O.; Offor, P.O. Optical and structural properties of lead sulphide (PbS) thin films synthesized by chemical method. Int. J. Phys. Sci. 2015, 10, 385–390. [Google Scholar] [CrossRef]
  8. Nafees, M.; Ikram, M.; Ali, S. Thermal stability of lead sulfide and lead oxide nano-crystalline materials. Appl. Nanosci. 2017, 7, 399–406. [Google Scholar] [CrossRef]
  9. Jameel, M.H.; Saleem, S.; Hashim, M.; Roslan, M.S.; Somaily, H.H.N.; Hessin, M.M.; El Bahy, Z.M.; Ashiq, M.G.B.; Hamzah, M.Q.; Jabbar, A.H.; et al. A comparative study on characterizations and synthesis of pure lead sulfide (PbS) and Ag-doped PbS for photovoltaic applications. Nanotechnol. Rev. 2021, 10, 1484–1492. [Google Scholar] [CrossRef]
  10. Wu, S.; Qin, L.; Li, Q.; Wu, Z.; Nie, Z.; Jiang, Y.; Wang, J.; Wang, Z.; Zhou, Y.; Yu, K.; et al. Hot-carrier infrared detection in PbS with ultrafast and highly sensitive responses. Appl. Phys. Lett. 2022, 120, 42101. [Google Scholar] [CrossRef]
  11. Islam, M.A.; Sarkar, D.K.; Shahinuzzaman, M.; Wahab, Y.A.; Khandaker, M.U.; Tamam, N.; Sulieman, A.; Amin, N.; Akhtaruzzaman, M. Green Synthesis of Lead Sulphide Nanoparticles for High-Efficiency Perovskite Solar Cell Applications. Nanomaterials 2022, 12, 1933. [Google Scholar] [CrossRef]
  12. Mamiyev, Z.; Balayeva, N.O. PbS nanostructures: A review of recent advances. Mater. Today Sustain. 2023, 21, 100305. [Google Scholar] [CrossRef]
  13. Kang, J.; An, Y.; Xue, J.; Ma, X.; Li, J.; Chen, F.; Wang, S.; Wan, H.; Zhang, C.; Bu, X. Density Functional Theory Study of the Electronic structures of Galena. Processes 2023, 11, 619. [Google Scholar] [CrossRef]
  14. Yang, L.; Ren, X.; Ge, C.; Yan, Q. Status and development of powder metallurgy nickel-based disk superalloys. Int. J. Mater. Res. 2019, 110, 901–910. [Google Scholar] [CrossRef]
  15. Moosa, I.S.; Maqableh, B.B. Temperature difference with respect to exposure time for black paint and galena powder-black paint composite selective surfaces. In Proceedings of the World Renewable Energy Congress XVI, Murdoch University, Western Australia, Australia, 5–9 February 2017; Transition Towards 100% Renewable Energy, Ali Sayigh, Chapter 13, e. Book; Springer: Berlin/Heidelberg, Germany, 2018; pp. 139–147, ISBN 978-3-319-69844-1. [Google Scholar]
  16. Vergara-Hernández, H.J.; Olmos, L.; Solorio, V.M.; Bouvard, D.; Villalobos-Brito, J.; Chávez, J.; and Jimenez, O. Powder Metallurgy Fabrication and Characterization of Ti6Al4V/xCu Alloys for Biomedical Applications. Metals 2023, 13, 888. [Google Scholar] [CrossRef]
  17. Novák, P. Advanced Powder Metallurgy Technologies; MDPI: Basel, Switzerland, 2020; ISBN 978-3-03936-524-1. [Google Scholar]
  18. Čapek1, J.; Vojtěch, D. Powder Metallurgical Techniques for Fabrication of Biomaterials. Manuf. Technol. 2015, 15, 964–969. [Google Scholar] [CrossRef]
  19. Chatterjee, S.; Acharya, H.N.; Ratnam, V.V. Effects of sintering temperature and time on the electrical properties of pellets made from beneficiated galena ore. J. Mater. Sci. 1987, 22, 2793–2798. [Google Scholar] [CrossRef]
  20. Özkaplan, H. Studies of feasibilities of using galena for preparing thermoelements. Conmmun. Fac. Sei. Univ. Ank. Ser. A2 A3 1990, 39, 1–6. [Google Scholar] [CrossRef]
  21. BOSE, S.A. method of fabricating n-type thermoelements from galena concentrate. Bull. Mater. Sci. 1994, 17, 479–486. [Google Scholar] [CrossRef]
  22. Zha, L.; Li, H.; Wang, N. Preparation of high purity compact galena bulk by hot pressed sintering. Mater. Lett. 2019, 234, 233–236. [Google Scholar] [CrossRef]
  23. Kabir, H.; Munir, K.; Wen, C.; Li, Y. Recent research and progress of biodegradable zinc alloys and composites for biomedical applications: Biomechanical and biocorrosion perspectives. Bioact. Mater. 2021, 6, 836–879. [Google Scholar] [CrossRef]
  24. Danninger, H.; Calderon, R.D.; Gierl-Mayer, C. Powder Metallurgy and Sintered Materials; eBook; Wiley-VCH Verlag GmbH & Co. KgaA: Weinheim, Germany, 2017; Available online: https://www.academia.edu/39247101/Powder_Metallurgy_and_Sintered_Materials (accessed on 27 March 2024).
  25. Hirschhorn, J.S. Introduction to Powder Metallurgy, 1st ed.; Colonial Press Inc.: Miami, FL, USA, 1969; p. 133. [Google Scholar]
  26. Julius, U.A.; Offiong, I.A.; Idorenyin, O.E. The Use of Galena as Weighting Material in Drilling Mud. JSRR 2015, 7, 455–465. [Google Scholar] [CrossRef]
  27. The Hudson Institute of Mineralogy (Mindat.org), Keswick, VA, USA. Available online: https://www.mindat.org/min-1641.html (accessed on 29 March 2024).
  28. Moosa, I.S.; Johnson, G.W.; Nutting, J. The structure and magnetic properties of Nd-Fe-B magnets produced by conventional and HD routes. J. Less Common Met. 1990, 158, 51–58. [Google Scholar] [CrossRef]
  29. Moosa, I.S. Powder Metallurgy and its Application in the Production of Permanent Magnets. Int. J. Adv. Res. Eng. Technol. 2013, 4, 127–141. [Google Scholar]
  30. Ertuğ, B. Sintering Applications; InTech: Rijeka, Croatia, 2013. [Google Scholar]
  31. Wang, T.; Huang, Y.; Ma, Y.; Wu, L.; Yan, H.; Liu, C.; Liu, Y.; Liu, B.; Liu, W. Microstructure and mechanical properties of powder metallurgy 2024 aluminum alloy during cold rolling. J. Mater. Res. Technol. 2021, 15, 3337–3348. [Google Scholar] [CrossRef]
  32. Chongad, L.S.; Sharma, A.; Banerjee, M.; Jain, A. Synthesis of Lead Sulfide Nanoparticles by Chemical Precipitation Method. J. Phys. Conf. Ser. 2016, 755, 12032. [Google Scholar] [CrossRef]
  33. Önal, M.; Altiokka, B. Chemical Bath Deposition of PbS Thin Films. Mugla J. Sci. Technol. 2020, 6, 94–98. [Google Scholar] [CrossRef]
  34. Chatterjee, B.; Bandyopadhyay, A. Characterization of PbS nanoparticles synthesized using sodium lauryl sulfate at room temperature. Mater. Today Proc. 2023, 76, 114–119. [Google Scholar] [CrossRef]
Figure 1. An experimental overview flowchart plan from raw galena lumps to final products.
Metals 14 00439 g001
Figure 2. A photograph of the as-received galena lumps.
Metals 14 00439 g002
Figure 3. SEM micrographs (SEI) and their EDAX spectra with inserted elements tables for fracture surface of galena lump, (a) General features, line scale 200 µm, (b) the EDAX information of (a,c) higher magnification, line scale 30 µm, (d) the EDAX details of the blue square inside the inclusion in (c).
Metals 14 00439 g003
Figure 4. SEM fracture surface micrograph of as-received galena with its EDAX details, (a) BSI image, line scale 50 µm, (b) the EDAX result of the blue square of the PbS phase.
Metals 14 00439 g004
Figure 5. Galena lumps with sieve-produced powders using four types of sieves.
Metals 14 00439 g005
Figure 6. SEM micrographs (SEI) for the four produced sieved powders at the same magnification, 1000×, line scale 150 µm for all, (a) 250 µm, (b) 125 µm, (c) 63 µm, and (d) 38 µm.
Metals 14 00439 g006
Figure 7. SEM micrographs (SEI) of 38 µm sieved galena powder at different magnifications, (a) 2500×, (b) 10,000×, (c) 40,000×, (d) 80,000×.
Metals 14 00439 g007
Figure 8. As-sintered galena powder of 250 µm and 38 µm at 800 °C for 1 h under vacuum.
Metals 14 00439 g008
Figure 9. SEM micrographs (SEI) at the same magnification for sintered samples at 800 °C for 1 h under vacuum with their EDAX spectra, (a) surface of 250 µm sintered powder, (b) the EDAX of image a, (c) surface of 38 µm sintered powder, (d) the EDAX spectrum of image c.
Metals 14 00439 g009
Figure 10. SEM images (SEI) for the sintered 38 µm sample at 800 °C for 1 h, (a) the cross-section of a compacted-sintered piece, (b) the individual yellow powder, (c) the fracture surface with the yellow layer in focus, (d) the fracture surface with PbS phase in focus.
Metals 14 00439 g010
Figure 11. Green and sintered densities (GD and SD), (a) as a function of compaction pressure with the same sintering temperature at 700 °C, 1 h, under vacuum, 63 µm sieved galena powder, and (b) as a function of particle size, with the same compaction pressure and sintering conduction.
Metals 14 00439 g011
Figure 12. SEM fracture surface micrographs (SEI) of the sintered sample of 63 µm galena powder with different magnifications and areas. The compaction pressure is 350 MPa and the sintering temperature is 700 °C for 1h in vacuum. The magnification value is (a) 5000×, (b) 10,000×, (c) 6000×, (d) 24,000×.
Metals 14 00439 g012
Figure 13. Sintered density (SD) and relative sintered density (RSD %), (a) with the sintering temperature at a constant sintering time of 1 h, (b) with the sintering time for sieved, both for galena powder of 63 µm with the recorded information in the figure.
Metals 14 00439 g013
Figure 14. (a) GD and SD against L/D ratio, 350 MPa compaction pressure for 63 µm sieved galena powder, sintering at 700 °C for 1 h under vacuum, (b) Fit curves of GD and SD.
Metals 14 00439 g014
Figure 15. XRD patterns as detailed in the figure for galena powder of 38 µm particle size.
Metals 14 00439 g015
Table 1. Details of duplicate compacted and sintered samples with a compaction pressure of 350 MPa.
SampleMass before
Sintering (g)
Mass after Sintering (g)Mass Reduction (g)Sint. Condition
38 µm3.36113.32210.0390800 °C, 1 h, vacuum, rate of heating: 10 °C/min., rate of cooling to room temp.: 2.5 °C/min.
38 µm3.43913.39700.0421
250 µm3.542813.50660.0215
250 µm3.41043.39060.0198
Table 2. The equation of GD and SD with respect to the L/D ratio and its parameters for each case.
Equation: y = a + bx
ParameterValueStandard Error
GDIntercept6.646510.03170
Slope−0.651700.06312
R-Square0.95528-
SDIntercept7.474940.02590
Slope−0.479400.05156
R-Square0.96351-
Table 3. Micro-hardness measurements for the as-received galena and sintered sample of 38 µm galena powder, 700 °C, 1 h.
MHV
As-Received
MHV
Sintered Sample
Used Load
83.2343.550.98 N
79.4540.93
81.6742.98
80.9141.70
77.3442.09
Mean value 80.52Mean value: 42.25
Standard deviation: 2.00Standard deviation: 0.93
Table 4. The XRD characteristics and analysis of the as-received and sintered samples.
SampleGoodness of FitPhasewt.%Crystal StructureLattice Parameters
As-received galena1.1526PbS98.9Cubica = 5.93542
PbO/PbSO41.1Monoclinica = 14.16136
b = 5.60205
c = 7.20988
Galena-sintered
700 °C, 1 h
1.197PbS98.5Cubica = 5.93471
PbO/PbSO41.5Monoclinica = 13.75149
b = 5.69768
c = 7.07152
Galena-sintered
800 °C, 1 h
1.550PbS81.3Cubica = 5.93535
(PbO)2/PbSO4 18.7Monoclinica = 7.18478
b = 5.78746
c = 8.05508
Disclaimer/Publisher’s Note: The statements, opinions and data contained in all publications are solely those of the individual author(s) and contributor(s) and not of MDPI and/or the editor(s). MDPI and/or the editor(s) disclaim responsibility for any injury to people or property resulting from any ideas, methods, instructions or products referred to in the content.

