Article

Morphological and Dimensional Evolution of Nanosized Amorphous Silicon Nitride in α-Fe: Diffusional and Elastic Effects

by
Sylvie Bordère
1,
Hugo-Paul Van Landeghem
2,
Abdelkrim Redjaïmia
3 and
Mohamed Gouné
4,*
1
Institut de Mécanique et d’Ingénierie de Bordeaux, Université de Bordeaux, Centre National de la Recherche Scientifique, UMR 5295, F-33600 Bordeaux, France
2
SIMaP, Université Grenoble Alpes, Centre National de la Recherche Scientifique, Grenoble INP, SIMAP, F-38000 Grenoble, France
3
Institut Jean Lamour, UMR CNRS 7198, Université de Lorraine, F-54011 Nancy, France
4
ICMCB, Bordeaux INP, Centre National de la Recherche Scientifique, Université de Bordeaux, UMR 5026, F-33600 Bordeaux, France
*
Author to whom correspondence should be addressed.
Metals 2024, 14(4), 442; https://doi.org/10.3390/met14040442
Submission received: 22 February 2024 / Revised: 3 April 2024 / Accepted: 7 April 2024 / Published: 10 April 2024
(This article belongs to the Section Computation and Simulation on Metals)

Abstract

:
We present a detailed analysis based on both experimental and 3D modelling approaches of the unique silicon nitride precipitation sequence observed in ferritic Fe-Si alloys upon nitriding. At 570 °C, Si3N4 silicon nitride was shown to form as an amorphous phase into α-Fe ferrite matrix, which is morphologically unstable over time. Precipitates nucleated with a spheroidal shape, then developed a cuboidal shape for intermediate sizes and octapod-like morphology for a longer time. Using transmission electron microscopy, we show that the transition between spheroid and cuboid morphology depended on particle size and resulted from competition between interfacial energy and elastic strain energy. The resulting morphology was then shown to be a cuboid shape whose faces were always parallel to the {100} planes of the α-Fe; the <100> directions of the matrix corresponded to the elastically soft directions. There was a critical size of around 45 nm for which the transition between the cuboid shape and the octapod-like morphology took place. This was characterised by a transformation of quasi-flat facets into concave ones and the development of lobes in the <111> directions of the bcc crystal. To better assess the kinetic effects of diffusion fields and internal stresses on the morphological instability observed, an original 3D model that explicitly coupled phase transformations and mechanical fields was developed and applied. The latter, validated on the basis of model cases, was shown to be able to describe the time-evolution of both chemical and mechanical fields and their interactions in diffusive mass transport. Using a model system, it was shown that the concentration field around the precipitates and the internal stresses played opposing roles in the cuboid to octapod-like morphological instability. This work gives some clarification regarding the morphological evolution of amorphous Si3N4 precipitates, an important point for controlling the mechanical properties of nitrogen steels.

1. Introduction

The need to improve fuel efficiency and safety has led to a high and growing demand for high-strength steels in the automotive industry. The potential of weight reduction directly depends on the improvement of mechanical properties, which are in turn controlled by the microstructural features. In that context, the precipitation of amorphous Si3N4 into α-Fe has received a growing attention over the last ten years [1,2,3,4,5]. There are several reasons for this interest. On the one hand, the nanometric size and high density of these particles significantly increase the strength of the alloy [6,7]. On the other hand, the amorphous Si3N4 has a density half that of iron, imparting a substantial weight saving potential to Si3N4-containing steel sheets for automotive applications [6].
From a more fundamental point of view, the precipitation of Si3N4 in α-Fe has very singular characters. (i) The amorphous nature of the precipitates is unusual for nitrides and carbides in steels and, more generally, for precipitates formed at low temperature in a metal matrix [1,4]. (ii) These amorphous precipitates are stable over remarkably long treatment durations and, under certain conditions, can transform into a crystalline phase of the same composition [5]. (iii) The observed precipitates display a cuboidal shape, which is remarkable since it is usually explained by crystallographic orientation relationships that do not exist here since Si3N4 is amorphous [1,4,5]. Indeed, considering solely the interfacial energy would lead to expect a sphere. (iv) The development of uniquely octapod-shaped nanosized amorphous silicon nitride precipitates in a ferrite matrix was observed at 650 °C (not at 570 °C) [3]. It was explained (but not proved) by the anisotropic growth induced by the anisotropic stress field around the developing precipitates after nucleation. We will come back to this point later.
Morphological instabilities are not only fascinating from a scientific point of view, they also play an important role in the evolution of mechanical properties. For example, the transformation of a spherical particle into a cubic particle negatively affects the ductility of the material due to the increase in plastic strain concentration in the particle sharp corners [8]. In superalloys, it is also recognised that changes in precipitate morphology during exposure to typical service temperature influence the mechanical properties [9]. It is therefore important to gain a better understanding of the phenomena behind morphological instabilities. To this end, a number of studies have been carried out in Ni-based, Ti-Al based, and Al-based alloys during ageing. For instance, in Ni-based superalloys, sphere-to-cube and cube-to-plate shape transitions were reported together with the so-called “reverse coarsening” corresponding to the splitting of a single cuboidal precipitate into a pair of plates [10,11,12]. Another well-known example is the evolution of Al3Sc precipitates from spheres to cuboids and then to petals [13]. Even if it is difficult to summarise all the conclusions of these studies, given their scale, most of the morphological instabilities can be explained on the basis of thermodynamic arguments, taking into account the contributions of interfacial and elastic energies as well as their anisotropies [14]. However, kinetic instability phenomena can play an important role. Indeed, as suggested very recently in the case of precipitation of iron-rich precipitates in Cu-Fe-Co alloys, the morphological instability which turns the flat facets into concave ones cannot be understood by means of thermodynamic arguments only [15]. The kinetic instability phenomena linked to diffusional processes necessarily play a significant role in the observed changes.
In this work, we highlight a size-dependent morphological instability that occurs during the pure growth of Si3N4 in α-ferrite at 570 °C. The precipitates nucleate in the form of spheres and gradually transform into cubes and further, into octapods. To clarify the mechanisms involved, the microstructural evolutions were investigated using transmission electron microscopy (TEM) and 3D modelling able to describe the time-evolution of both chemical and mechanical fields and their interactions. In particular, this work clarifies for the first time the interplay between diffusional processes and local mechanical fields in the morphological instability of amorphous Si3N4 precipitates in ferrite during nitriding, an important point for controlling the mechanical properties of nitrogen steels.

2. Materials and Methods

2.1. Processing and Nitriding

The systems studied in this work are two binary alloys: Fe-1.5wt%Si and Fe-3.3wt%Si. They were first cast in 60 × 125 × 240   m m 3 ingots. They were then hot rolled down to a 3 mm thickness. The hot rolling end temperature was 850 °C. The resulting sheet was cooled at a rate of 30 °C/s down to 580 °C and at 20 °C/s afterwards down to room temperature. Prior to nitriding, samples of 1 × 10 × 75   m m 3 were cut from the annealed sheet. They were ground on SiC papers down to P2400 grit before being cleaned in an ultrasound cleaner in ethanol. Specimens were annealed so as to obtain an equiaxed ferritic microstructure with an average grain size of roughly 35 µm. They were subsequently nitrided through either gaseous or plasma routes at 570 °C for determined durations. After the treatment duration, the plasma was interrupted, and the samples were left to return to room temperature at a reduced pressure. During nitriding, nitrogen diffuses into the materials and combines with alloying elements (here, Fe and Si) to form a compound layer on the surface (visible on Figure 1) and a diffusion zone underneath. The latter is of particular interest because it can contain a fine dispersion of silicon nitride, thereby influencing the overall mechanical properties of the material. The matrix is recrystallised and has a bcc structure, as shown by both the micrograph and the X-ray diffraction pattern (see Figure 1).

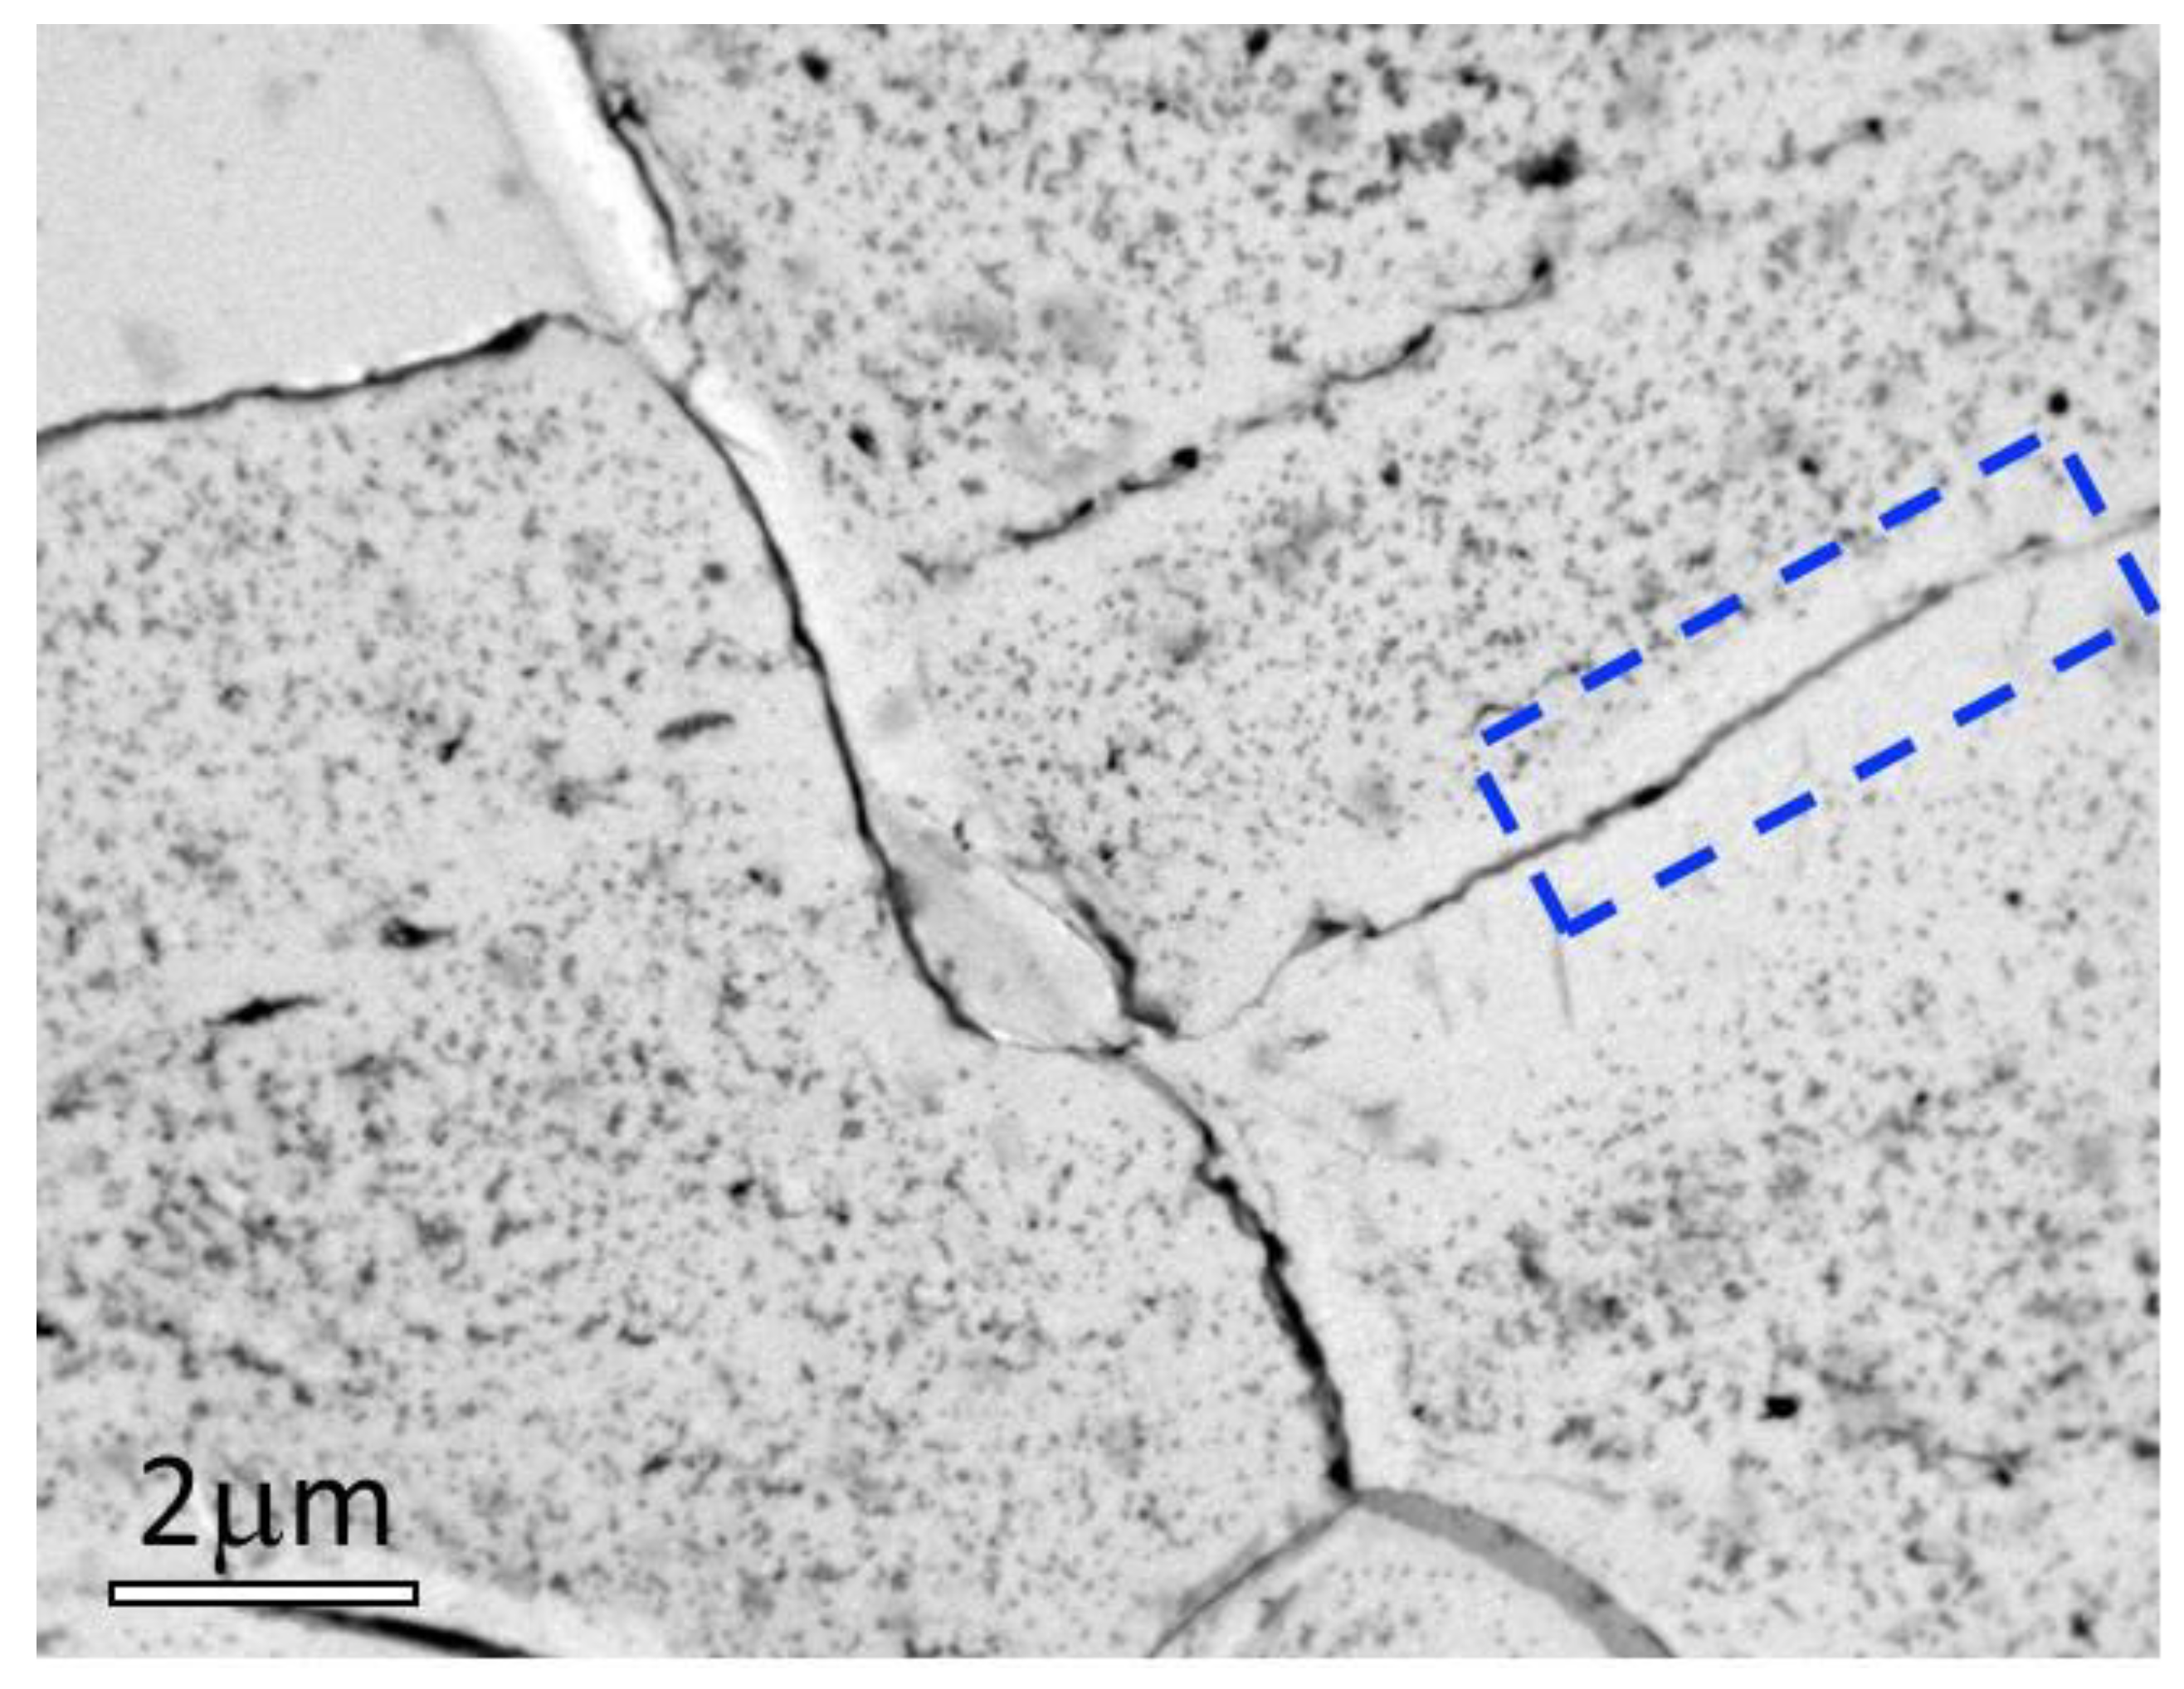
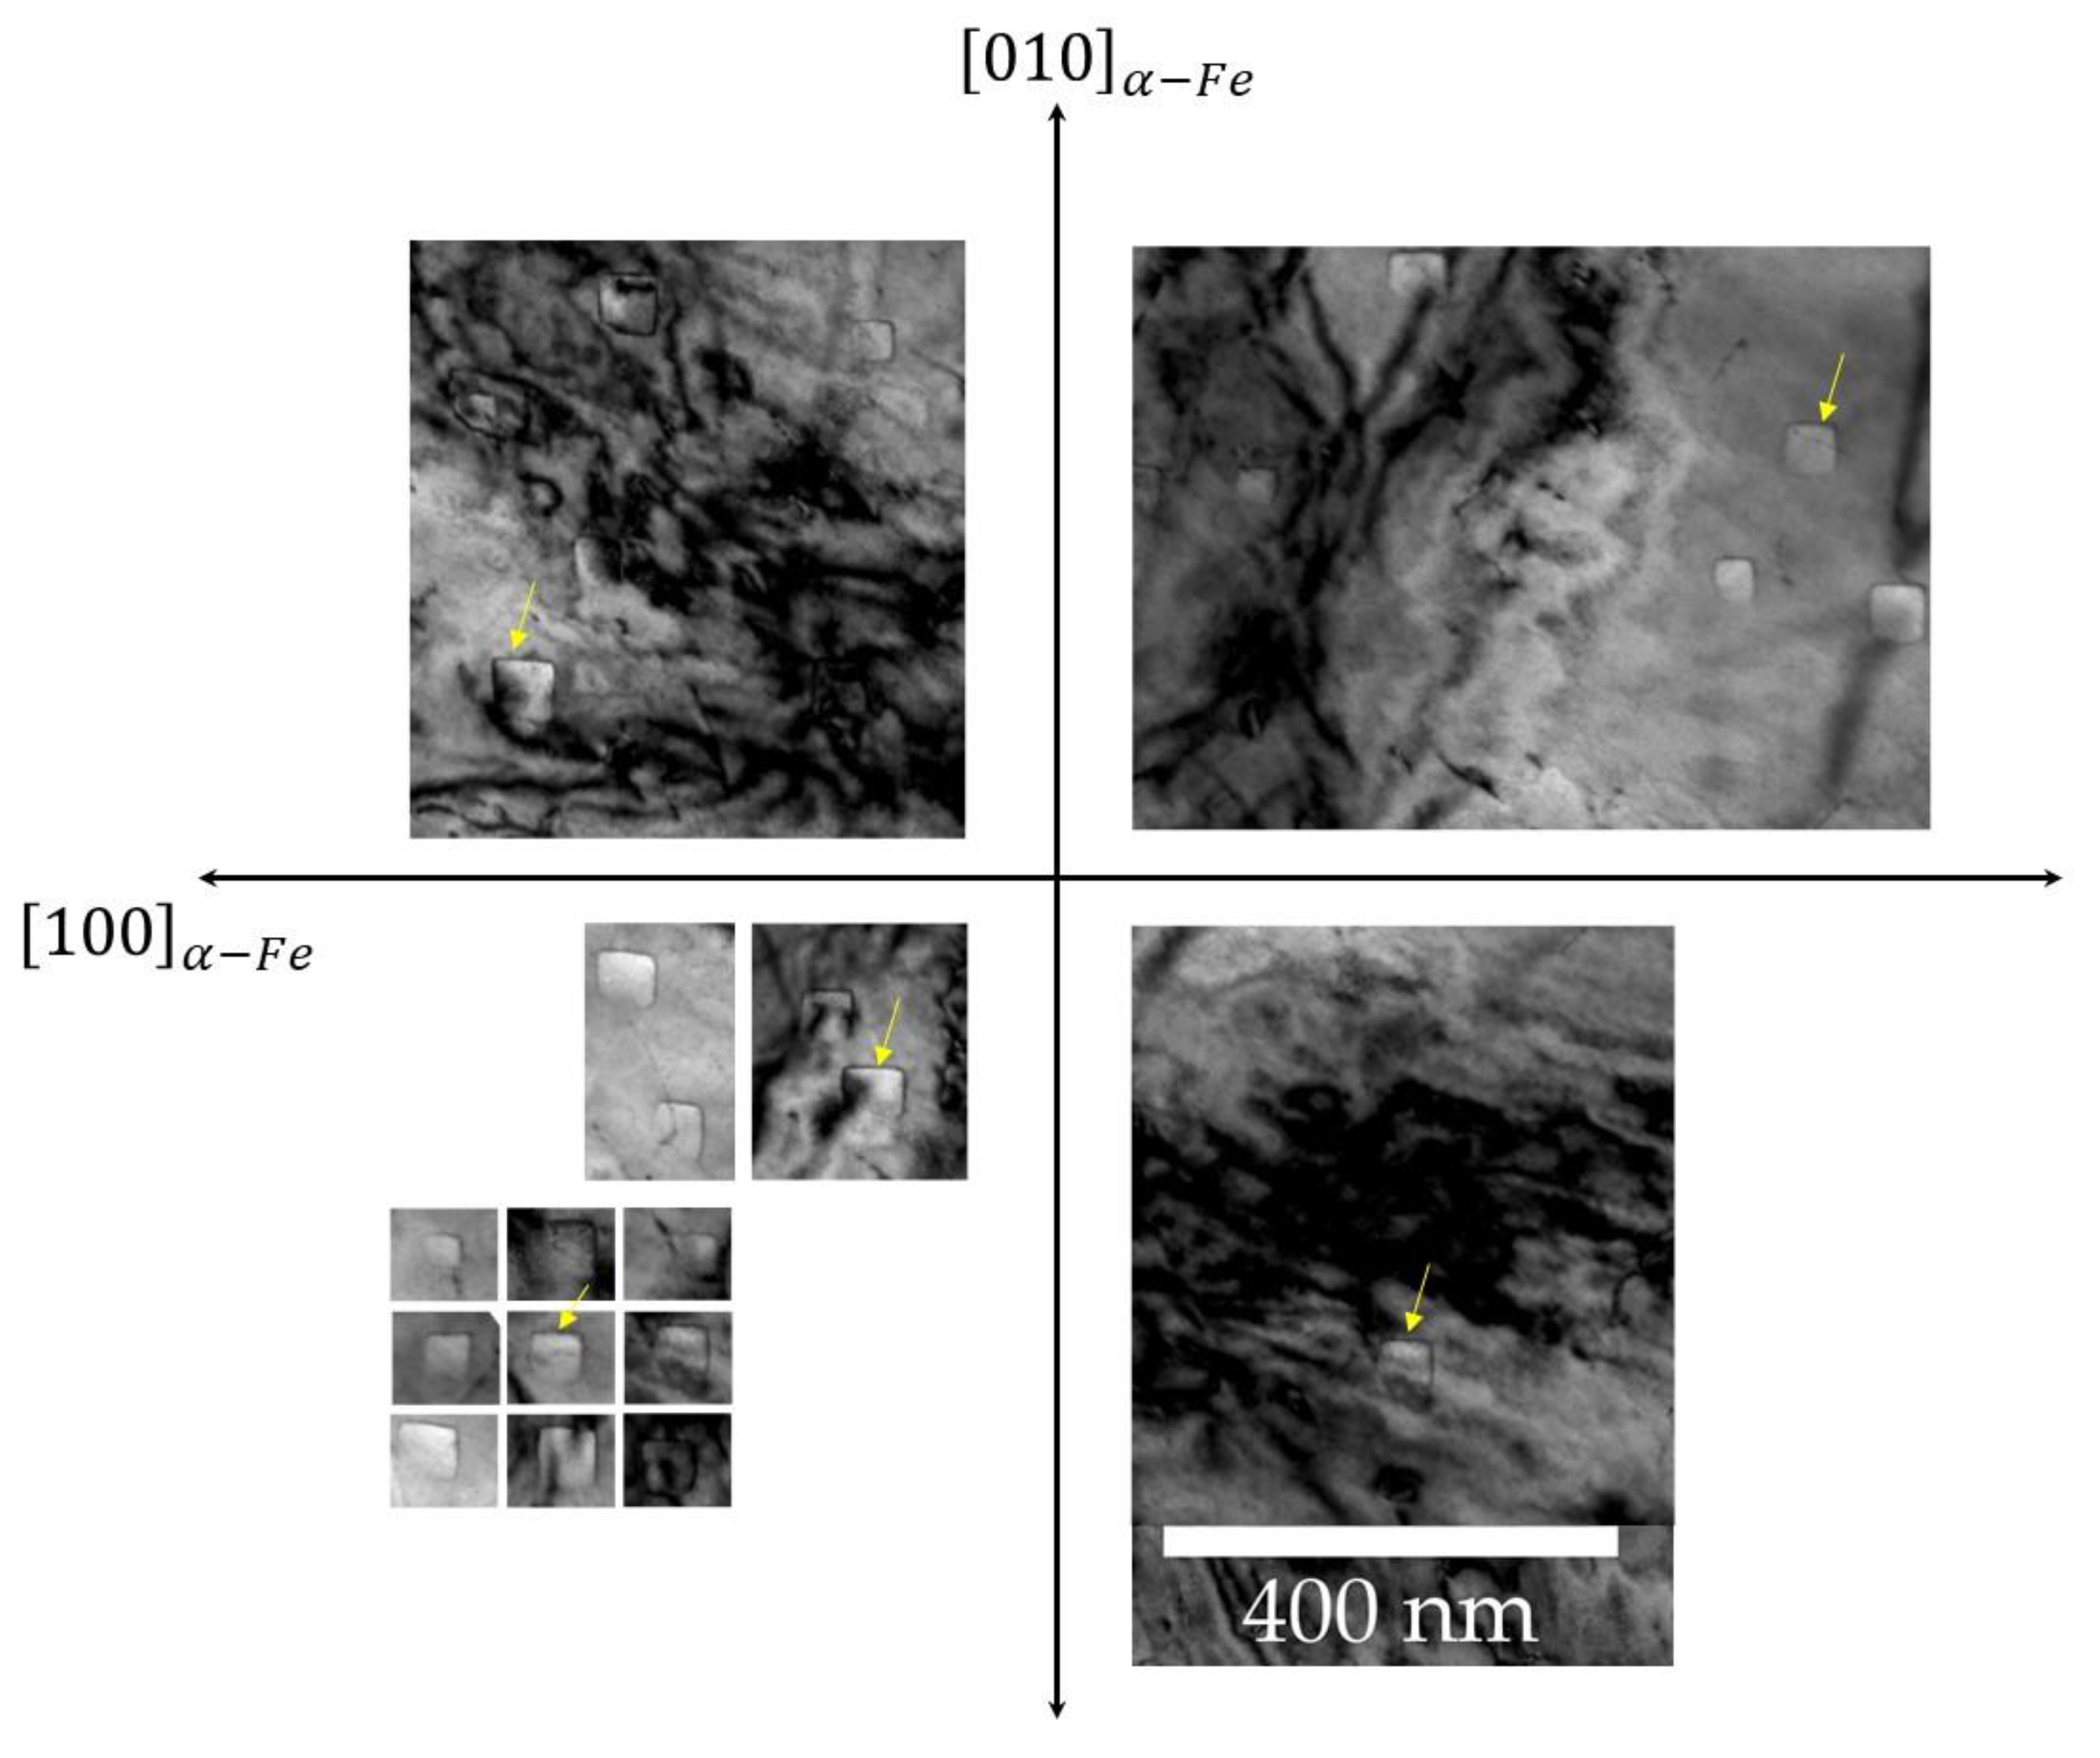
2.2. Sample Characterisation

The TEM observations and analyses were carried out in different ways and using different microscopes.
All methods started from samples with a surface finish of metallographic quality. Thin foils were prepared by grinding them down to a 60 µm thickness before punching 3 mm discs that were electrolytically thinned with a Struers Tenupol 5 (Aimil Ltd., New Delhi, India) in a 95 vol.% 2-butoxyethanol/5 vol.% perchloric acid electrolytic bath at 27 V, before thorough rinsing in ethanol. Extractive replicas were prepared from samples etched in Nital 4% for 30 s, rinsed, and dipped in acetone before being laid face down on a biodene film. After the acetone dried out, the film was peeled off the sample and a thin layer of carbon (several nanometers) was sputtered on it. The film was cut in pieces fitting onto standard 3 mm TEM copper grids and dissolved in butan-2-one (Spectrum Chemical, New Brunswick, NJ, USA). Several foils were also prepared via focused ion beam (FIB) milling. Observations were carried out using two TEM, a Philips CM200 equipped (Philips, Amsterdam, The Netherlands) with an EDAX EDXS as well as a Jeol 2010-F (JEOL, Tokyo, Japan); both operated at 200 kV.

3. Modelling

3.1. Methodology

The dynamic coupling between diffusive phase transformation and mechanical fields remains a difficult task for numerical modelling, since it requires to deal with concentration and pressure jumps at the interface, as well as moving interfaces induced by mass transfers between phases [16,17]. The physical models describing phase transformations, with or without mechano-chemical coupling, can be classified into two main approaches: (i) the two-field approaches [18,19], in which the mass transport is resolved within each phase separately, with a condition at the interface for mass conservation which induces the interface movement; (ii) the one-field approaches in which mass transport and transfer are modelled by a unique equation for the overall system [20,21]. Phase field modelling belong to the latter since it is based on a free energy functional defined at every point of the multi-phase systems [22,23]. They present great advantages for modelling the evolution of complex 3D microstructures. Within that phase transformation modelling field, there are a few papers dealing within mechano-chemical coupling of the diffusion mass transport and transfer at the interface mostly based on phase field modelling [16,17,24].
The problem addressed in the present is a diffusional phase change involving non-isobaric conditions, described in the framework of a binary system (atoms A and B) and two-phase (phases α and β) compounds. The algebraic volume-of-fluid (VOF)-based interface advection method [25] is used to differentiate the two phases and to deal with interface displacement. The methodology is based, for the overall two-phase system, on a single diffusional mass transport equation defined trough an extended chemical potential, described in Equation (1) [21]. This methodology is based on the Darken method [26], readable in [27], in which the intrinsic fluxes of atoms are coupled with a drift velocity (Darken velocity) for mass conservation [28]. It was shown that this drift velocity is that of the interface displacement as well when mass transfers are involved through the interface [21]. The conservation of total momentum is also written using the one-field equation described in Equation (2) [29,30]. The mechano-chemical coupling is here achieved through the formulation of the chemical potential, as well as the variation of pressure induced by the phase transformation when the partial molar volumes of the atoms differ from one phase to the other.

3.2. Mass Transport Equation

The mass transport equation system and transfer at the interface, previously developed for constant pressure and molar volume for A and B within the overall system [21], is here extended to non-isobaric condition and various molar volumes of A and B, which can be highly different from one another, and from a phase to the other. It is defined as
c k t + V · c k = · j k d c k · V w i t h j k d = c k D k R T μ k μ k = μ k * + R T   l n x k x k * + Ω k p p * V = V D + V σ V D = k = A , B Ω k j k d ,
where (i) c k is the concentration of the k-species; (ii) j k d is the intrinsic diffusion flux of the k-species defined within the lattice frame of reference using intrinsic diffusion coefficient D k of the k-atom and the extended chemical potential μ k ; (iii) μ k is defined with the reference potential μ k * is the same in both phases at equilibrium, the pure chemical contribution through the term R T   l n x k / x k * ( x k and x k * being the atom and the equilibrium atom fractions of the k-species, respectively) and the mechanical contribution through the term Ω k p p * ( p and p * being the pressure and reference pressure, respectively); (iv) V is the advection velocity which is the same for every species and corresponds to the addition of the Darken velocity V D and elastic stress relaxation velocity V σ when mass transfer at the interface induces pressure variation in relation to the molar volume difference of atoms between the two phases. The Darken velocity is calculated with the intrinsic flux of each species and their molar volume Ω k . The stress relaxation velocity V σ is the result of the mechanical governing equation solving Equation (2). For the solving of this diffusion transport equation, Neumann conditions are considered at system boundaries, ensuring zero flux at boundaries and thus mass conservation.

3.3. Mechanical Governing Equation and Time Derivative of Variables

The elastic stress relaxation velocity V σ can be calculated through the conservation of momentum equation that was developed for fluid/solid or solid/solid systems considering for solids’ elastic behaviour [29,30]. This equation is written as
ρ V σ t + V σ V σ = p + τ ,
where ρ = M A c A + M B c B is the density defined using the molar mass M A and M B of the A and B atoms, respectively, and τ the elastic shear stress tensor.
The time derivative of pressure is defined as
p d t + V σ p = 1 χ T V σ + V Σ σ ,
where · V Σ σ is an equivalent velocity divergence located at the interface and induced by the molar volume change of the B-atoms during its transfer from the α -phase to the β -phase. This divergence is defined as
· V Σ σ = ϕ D d t · Ω β Ω α Ω α ,
where the constant χ T is the isothermal compressibility coefficient which depends on the Young’s modulus E Y and the Poisson coefficient ν through the first and second Lamé’s coefficients μ E and λ E ( χ T = 2   μ E + 3 λ E   / 3   , with μ E = E y / 2 1 + ν and λ E = E Y / 1 + ν 1 2 ν ); d ϕ D / d t is the variation of the phase function induced by the Darken velocity; and Ω α and Ω β are the molar volume of both A- and B-atoms in the α and β phases, respectively.
The time derivative of the elements of the shear stress tensor is defined as
d τ i j d t = τ i j t + V σ τ i j = 2 μ E 1 2 V σ + t V σ 1 3 V σ I i j
The displacement of the interface is determined through the advection equation of the phase function ϕ :
ϕ t = V D + V σ ϕ = 0 .
During the simulation, the physical characteristics P are updated using the phase function ϕ with ϕ = 0 for the α-phase (matrix) and ϕ = 1 (particle) for the β-phase, and the P α and P β constant values characterising the α and β phases, respectively. P defines either the compressibility coefficient χ T , the Lamé’s coefficient μ E , the k-species diffusion coefficient D k , the equilibrium molar fraction of the k-species x k * at reference pressure p*, or the molar mass of the k-species M k .
P = 1 ϕ P α + ϕ P β .
Constant external pressure p e x t = 0 is considered for solving Equation (2), allowing total elastic strain energy to relax.

3.4. Numerical Methodology and Discretisation

The one-field Equations (1) and (2) are discretised in time and space by explicit/implicit methods, respectively, on a staggered grid [21,30] using the parallel framework of the Notus 0.6.0 Computational Fluids Dynamics code [31,32]. A second-order centred scheme is used for the discretisation of Equation (2) and the diffusion term only in Equations (1) and (2). A Lax–Wendroff scheme with a super bee flux-limiter [25] is used to solve the advection term of Equations (1), (3), (5) and (6). Figure 2 shows the two-phase system discretisation and the matrix/precipitate-interface represented by the value of the phase function ϕ = 0.5.

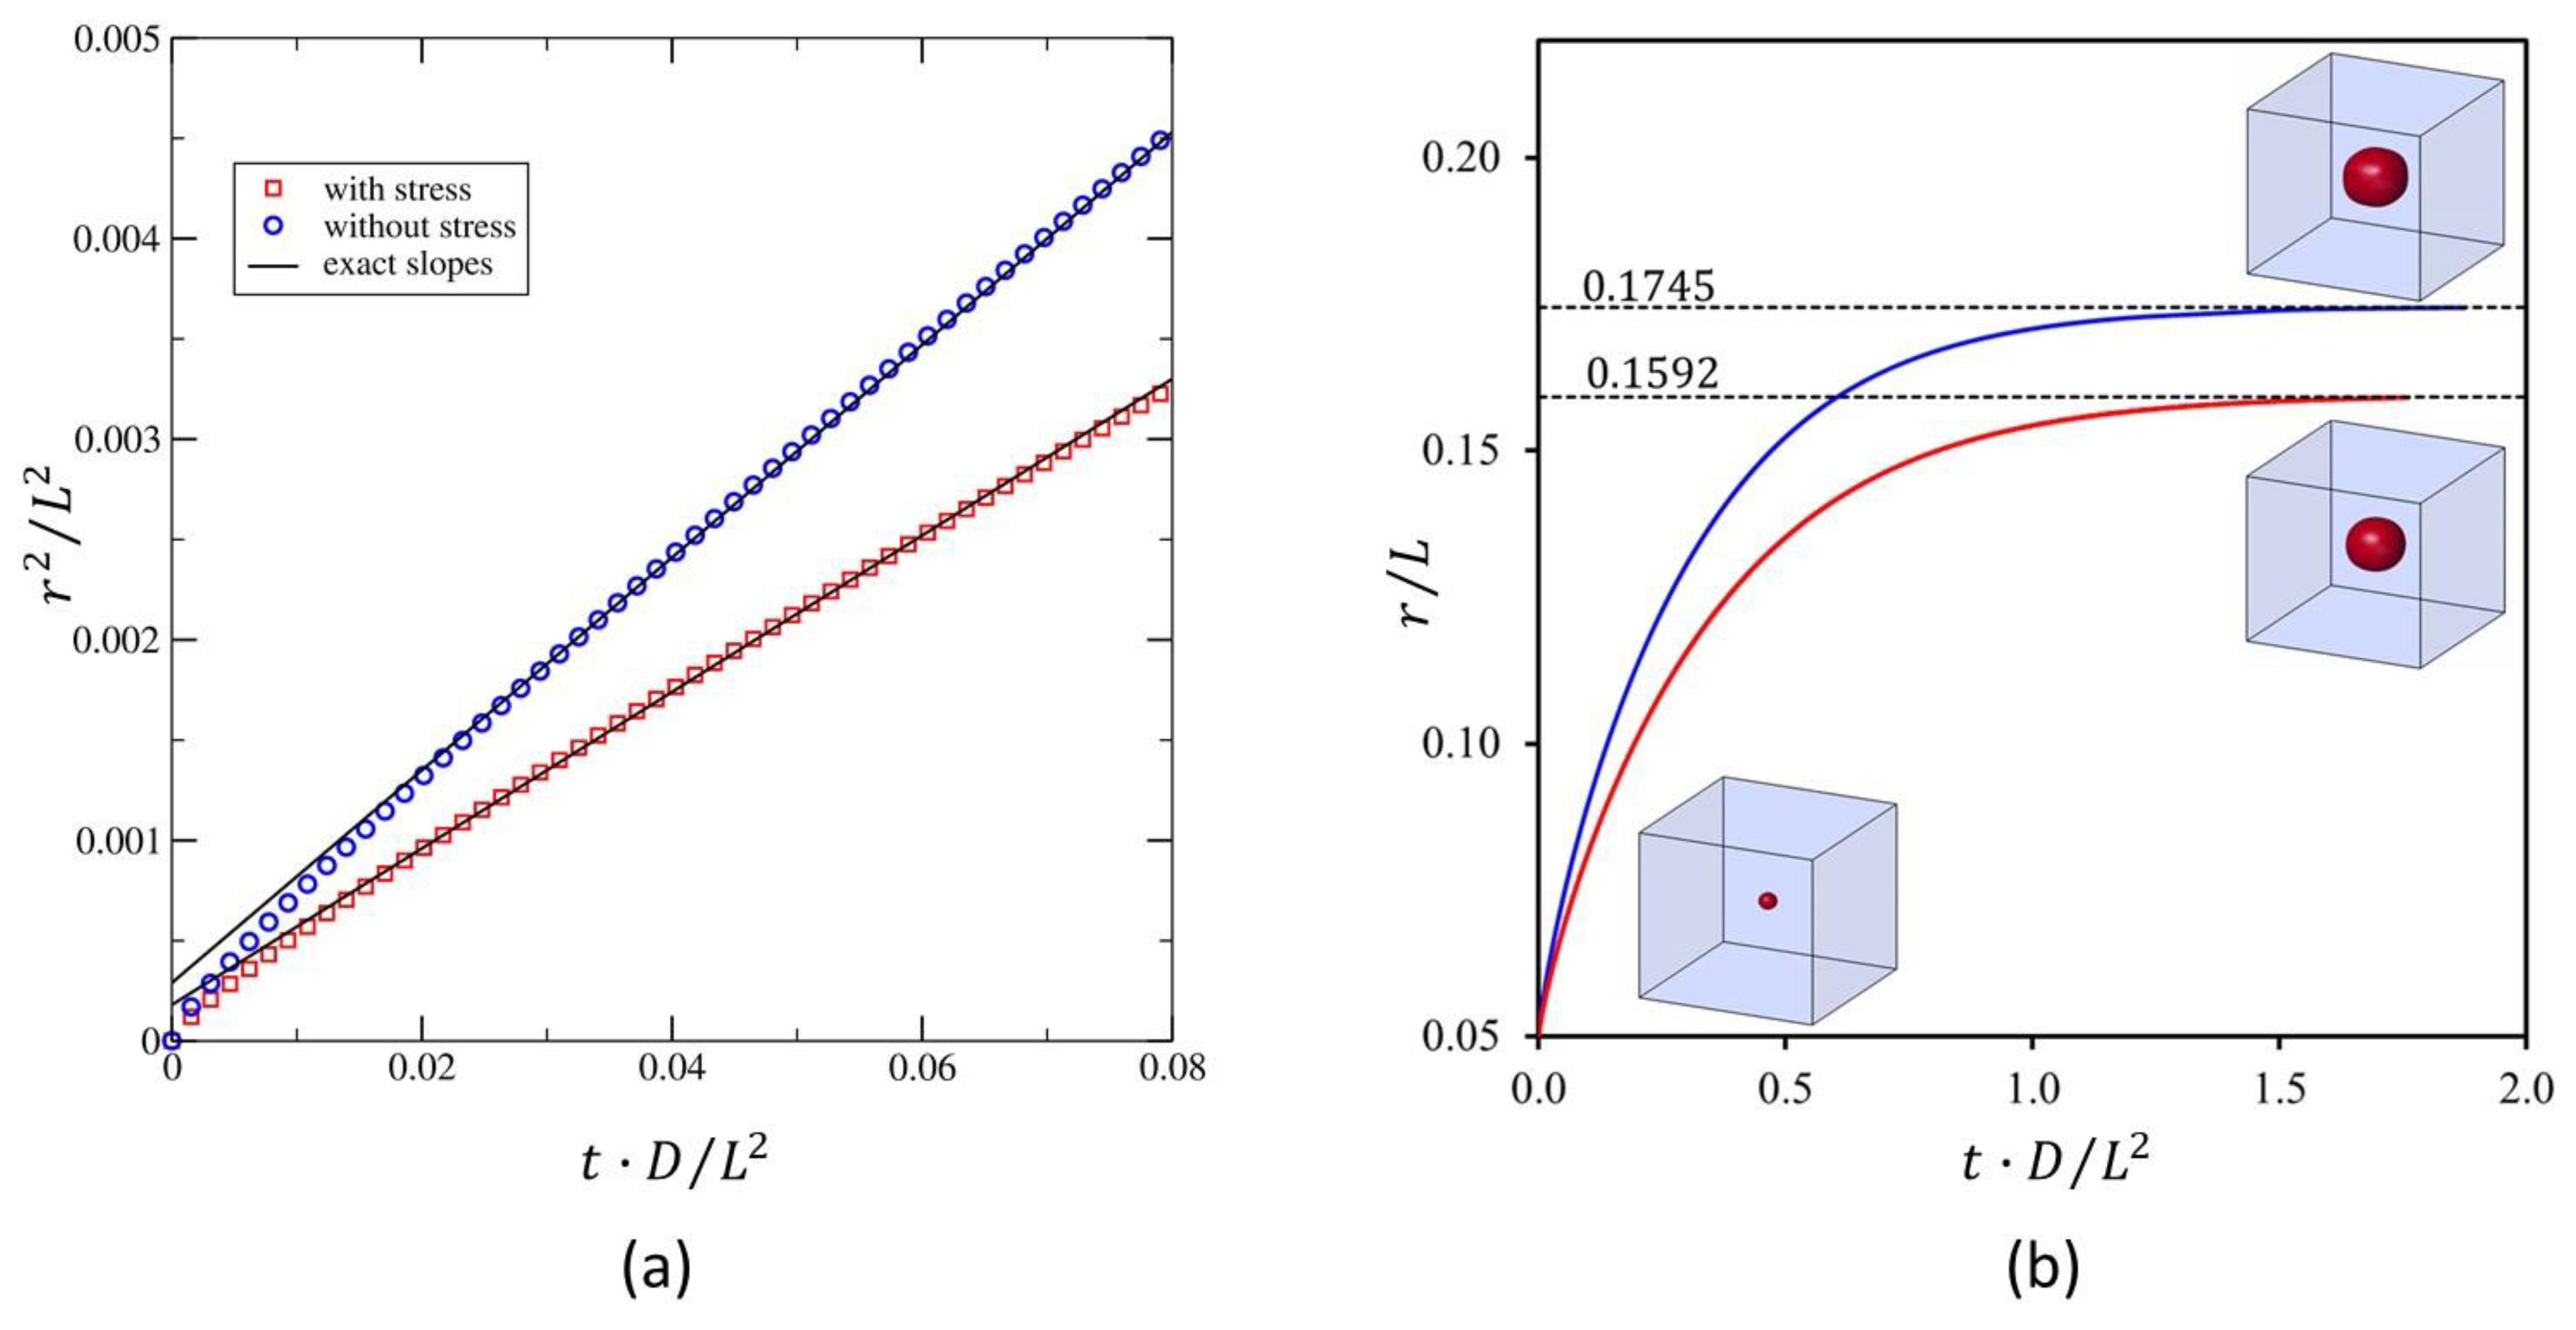
3.5. Modelling Validation

3.5.1. Analytical Kinetic Solutions

The modelling methodology, which aims to deal with mechano-chemical coupling of diffusion mass transport and transfer through the interface, is here validated.
The simulation results will thus be compared to the exact solution of the spherical particle growth kinetics developed by Zener [33]. This analytical solution, without any stress field, was completely described in the previous work dealing with the diffusion-controlled phase transformation using the Darken method [21]. For homogeneous β-phase c B β = c B β * , assuming Fick’s first law for the diffusion of the B-atoms in the α-phase with a constant inter-diffusion coefficient D , and considering a semi-infinite system insuring zero-flux boundary condition, c B α ( x = , t ) = c B α 0 , the growth kinetics of the particle radius r is defined by
r t = κ 4 D t ,
where κ is obtained by solving an equation depending on ω [33]. For constant total phase concentration C α = C α = C , the supersaturation degree is defined by
ω = x B α * x B α 0 x B α * x B β * ,
where x B α 0 is the initial atom fraction within the α-phase. The stress field induced by a misfitting spherical particle into a matrix will modify, through mechano-chemical coupling, the supersaturation degree ω. To determine ω in the stress field, we first need to know the pressure jump at the interface ( p β p α ) from which it is possible to determine the displacement of the equilibrium atom fraction x B α at the interface on the α-phase side from the relation:
x B α = x B α * exp Ω B p β p α R T ,
assuming that Ω B β Ω B α = Ω B for low elastic strain deformation. It is interesting to note that the Equation (10) is identical to the one conventionally used to determine the increase in solubility in the presence of a stress field [34] since both derived from the criterion of equality of chemical potential in the presence of stress field.
To determine the pressure jump at the interface, we decided to use the Sherer’s analytical model [35] which, unlike the classical Eshelby model [36], takes into account the interaction of stress fields. So, the misfitting spherical β-precipitate of radius r is placed in a α-matrix. Purely elastic and isotropic behaviour is considered for both phases and the α/β interface is supposed to be perfect. Their Young moduli E Y α and E Y β and their Poisson coefficients ν α and ν β can, however, be different. For the sake of simplicity, the crystallographic modification associated the α β transformation of a small volume element is expressed by the following Eigenstrain tensor that corresponds to hydrostatic compression or tension:
ε =     ε * 0 0   0     ε * 0   0   0     ε * ,
where 3 ε * = Σ = Ω β Ω α Ω α . The misfittig particle characteristics will be defined in the following by the term Σ. Under these conditions, the author of [35] shows that hydrostatic stresses are uniform both in the β-precipitate and α-matrix volumes, whatever the volume fraction of the precipitate f V . Moreover, for low-volume fraction, the level of hydrostatic stress into the β-phase is higher than in the α-phase. Furthermore, the β-precipitate is under hydrostatic compression if its molar volume is higher than the one of the α-matrix. Concerning the shear stress field, it is reduced to zero in the precipitate, and it is non-uniform in the α-matrix and depends on the distance from the α/β interface. The closer the distance from the α/β interface, the higher the level of both stresses and strains.

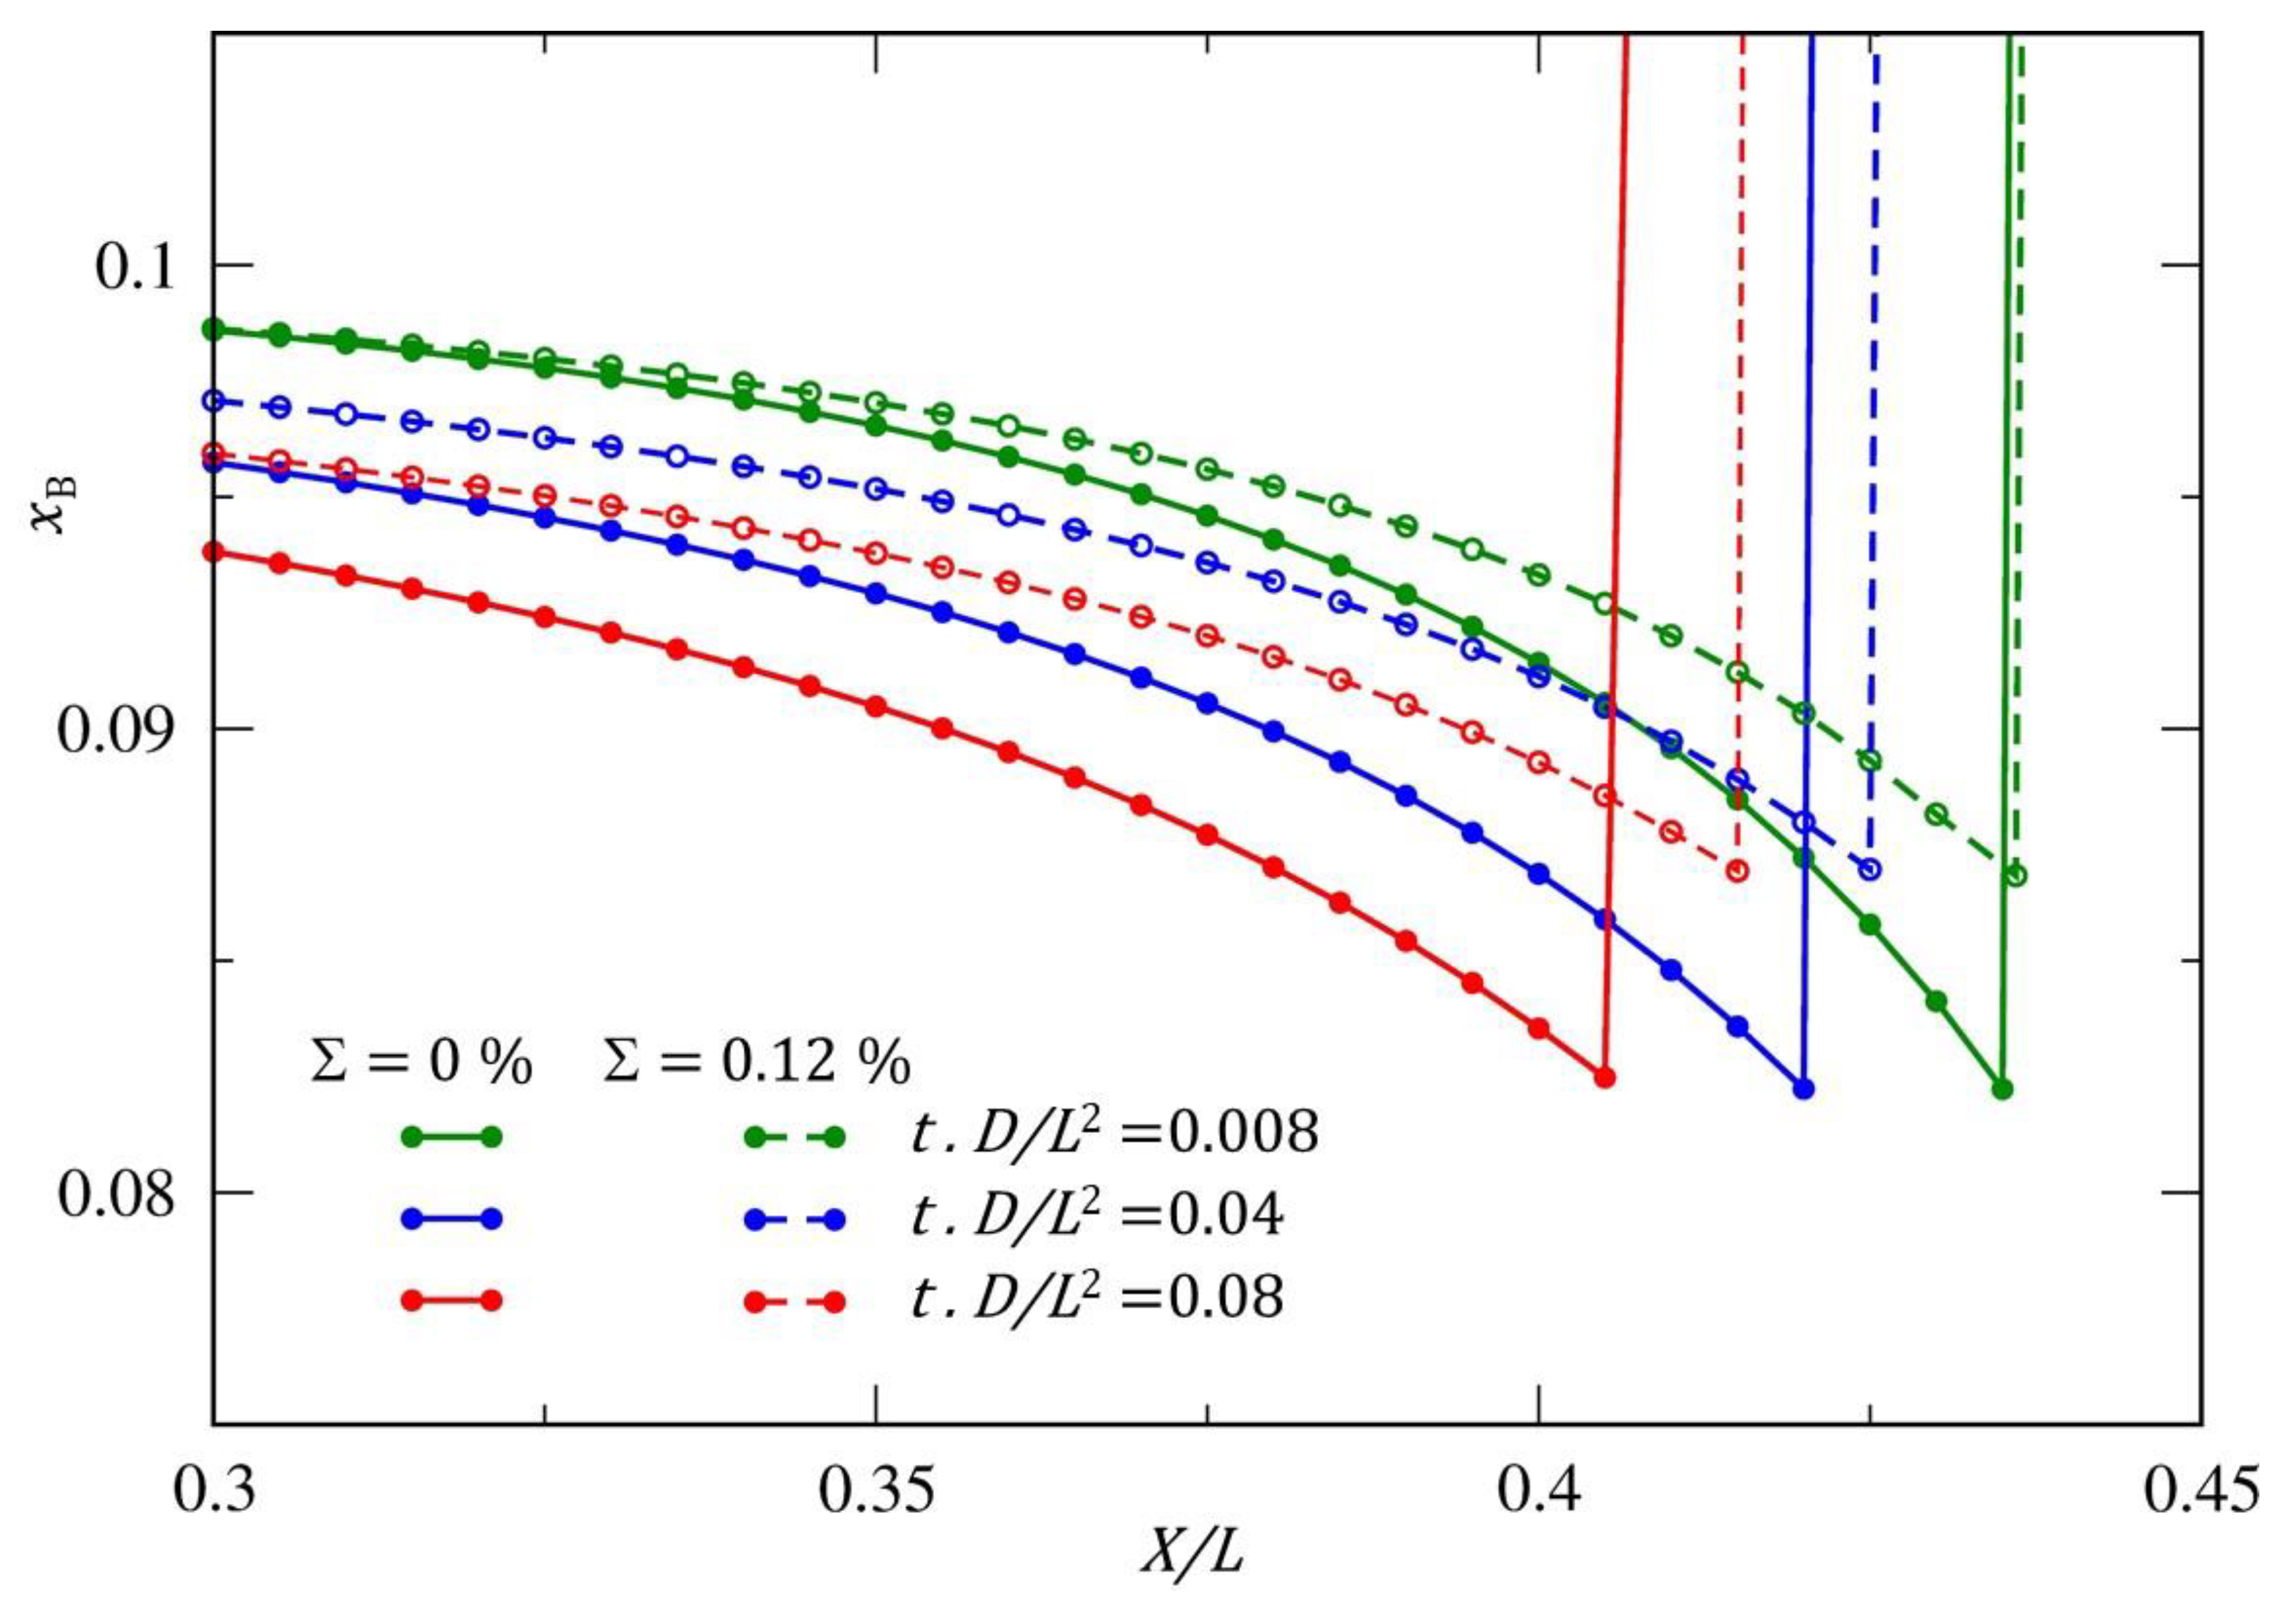
3.5.2. Simulation Results

Two comparative simulations were performed, one without any stress field and the other with the misfitting particle stress field. For both simulations, shared physical constants were considered: x B * α = 0.08 ; x B * β = 1.0 ; x B 0 α = 0.1 ; x B 0 β = 1.0 ; for low elastic strain deformation Ω B β Ω B α = Ω B = 7.087   c m 3 . m o l 1 , implying that the total phase concentration C β C α = C = 1 / Ω B can be assumed constant in the overall system; M A = M B = 55.8 g.mol−1; process temperature T = 823 K. The physical constants specific to the case of misfitting particle were Ω B β = 1.0012   Ω B α , corresponding to Σ = 0.12 % , and isotropic elastic constants E Y α = E Y β = 210   G P a and ν α = ν β = 0 corresponding to χ T α = χ T β = 1.43 × 10 11   P a 1 and μ E α = μ E β = 105   G P a .
The initial configuration for the calculations corresponded to a volume fraction of β-precipitate of ( f v = 0.052 % ) and a size defined from the dimensionless number r / L = 0.05 , where L is the simulation box length.
The 3D simulation of the misfitting particle for isotropic elastic constants shows, in Figure 3, that both the elastic stress and composition fields were isotropic during the beginning of the growth process of precipitate. In that case, both the interfacial concentration and the diffusion flux were shown to be uniform at all points along the precipitate–matrix interface and, consequently, the precipitate morphology remained almost spherical. The characteristics of the hydrostatic and shear stress fields described above were those expected by the Sherer’s model [35] and particularly the uniform pressure field in both particle and matrix volumes (see Section 3.5.1).
The evolution of hydrostatic stresses in both precipitate and matrix as a function of the particle radius matched very well with the analytical results of Sherer’s model [35], as shown in Figure 4. As expected for low-particle-volume fractions, a relatively high compressive pressure was obtained in the precipitate and a low tensile pressure in the matrix.
From this result, the pressure jump ( p β p α ) at the interface between the particle and the matrix was able to be precisely determined. It remained constant during the particle growth and was equal to 56 MPa. As shown in Equation (10), the atom fraction displacement at the interface was defined by the value x B * = 0.085 . From this value, we can calculate the supersaturation degree ω from Equation (9) to determine the κ-kinetic coefficient in Equation (8) [33]. Table 1 lists the various physical characteristics used to plot the theoretical kinetic law for both the unstressed and stressed configurations.
The simulation kinetic results for early times of the precipitation are shown in Figure 5a in the r 2 / L 2 , t . D / L 2   dimensionless coordinates.
For both unstressed and stressed systems, the precipitate growth kinetics matched well their respective theoretical slopes at the beginning of the transformation, as already highlighted in [37,38]. As expected by the theory, the growth kinetics was strongly influenced without changing the classical t1/2 temporal power law. The elastic effects decreased both the magnitude of the growth coefficient at early times and the equilibrium radius of the precipitate, as shown in Figure 5a,b, respectively. The equilibrium particle radius was able to be determined using the theoretical values of the α-matrix saturation x B α * and x B α * for the unstressed and stressed systems, respectively (Table 1). The values of r / L = 0.1745 and r / L = 0.1592 represent the asymptotes to the simulation kinetic curves for the long time of the precipitation process. As shown by the profiles of composition given in Figure 6, the elastic field shifted the interface composition closer to the far-field concentration. This tended to decrease the overall growth rate of the precipitate with respect to the unstressed case.

4. Results and Discussions

Intense precipitation was revealed on replica bright field TEM images (Figure 7). Silicon nitride nanoprecipitates were observed in Fe-1.5wt%Si and Fe-3.3wt%Si binary alloys nitrided at 570 °C. The amorphous nature of the precipitates was verified for all of the investigated nitriding durations (up to 8 h). They formed homogeneously and heterogeneously on the ferritic grain boundaries. Regions in the proximity of some grain boundaries were found to be free of precipitates. These precipitate-free zones (PFZs) can usually be explained by two possible effects. First, precipitates may nucleate first at the grain boundaries (GBs), which are prime nucleation sites, thereby depleting the solute from the adjacent matrix and drastically reducing the driving force for precipitation in this zone. Second, a grain boundary is a sink for vacancies so that regions adjacent to the boundary are unable to nucleate the precipitates, even though the matrix may be supersaturated with solute.
On a larger scale, the majority of precipitates were cuboid in shape. It is worth noting that the smallest particles adopted a more spheroidal shape (see arrows 1 and 2 in Figure 8a). This point will be detailed later in the paper. The diffraction pattern from an isolated extracted particle and the high-resolution image from a thin foil confirmed the amorphous nature of the precipitates (Figure 8b,c). This result is consistent with earlier observations [1,2,4,5]. The composition of these precipitates has also been investigated through various approaches, both direct and indirect [1,4,5]. EPMA measurements showed that the average ratio of Si/N was 0.76 ± 0.06 to be compared with the expected 0.75 of stoichiometric Si3N4 [1]. Direct electron energy loss spectroscopy (EELS) analyses of the precipitates in the TEM gave a composition of Si3N3.98±0.16 [4]. These techniques do, however, raise the question of the precise measurement of nitrogen concentration. Recently, in the same alloys studied here (Fe-3.5 wt%Si), and using 3D atom probe tomography (3D ATP), we showed that Si content in silicon nitrides was ≈42 at% and N concentration was ≈55.5 at%, yielding a Si/N ratio of 0.757 [39]. This ratio is in excellent agreement with the expected 0.75 stoichiometric ratio for Si3N4 and suggests that the precipitates deviate little from the Si3N4 stoichiometry. All experimental data converged to a Si3N4 stoichiometric precipitate in a large range of experimental conditions, which suggests a low tolerance of the phase for deviation from stoichiometry, as is expected for a covalent compound [39]. Based on these experimental pieces of evidence, it will be assumed in the following that the amorphous precipitates are stoichiometric Si3N4 silicon nitride.
By positioning the 100 directions of ferrite on a brightfield TEM image taken along the 001 α F e zone axis, it was found that all intragranular precipitates with a cuboid shape were systematically oriented with respect to the ferrite matrix (Figure 9) [6]. As it can be seen in Figure 9, the faces of the cuboidal shapes were always parallel to {100} α-Fe planes. Upon closer examination using the scanning transmission electron microscopy (STEM) method (bright field mode), it can be noticed that the shape of the precipitates evolved with their size (Figure 10). At small sizes, the precipitates had a shape that was close to a sphere, and as they grew, they turned into cubes with bulging faces. As they grew even further, the faces became concave, and the corners of the cuboid developed into lobes, resulting in an ear (or octapod)-like morphology.
We were particularly interested in the morphological instability sequence. Working exclusively on extractive replicas (see an example in the top left insert of Figure 11), the relationship between equivalent size and morphology was studied for the Fe-1.5wt%Si alloy nitrided for 8 h. Several fields covering about 1.5 µm2 were analysed, and we proceeded step by step. Firstly, the different morphologies observed were classified according to three types: spheroid, cuboid, and octapod-like morphology. Next, the average characteristic size of particles with the same morphology was measured, with the characteristic size being taken as the diameter for spheroids and the corner-to-corner distance for cuboids and octapod-like particles. Although subject to inaccuracies in shape and mean size, this method nevertheless allows a semi-quantitative study to be carried out. The morphological instability of precipitates can be further characterised by the non-dimensional length parameter d 1 / d 2 , yielding the largest length of precipitate along the <111> direction and the smallest length along the <001> direction of the matrix. In the case of spherical particles, d 1 / d 2 = 1 , for cubes, d 1 / d 2 = 3 , and d 1 / d 2 > 3 corresponds to the concave cuboid shape preceding the octapod-like shape of precipitates. This shows that there was a one-to-one link between particle size and particle morphology (Figure 11). For an average characteristic size of less than 25 nm, we found that amorphous Si3N4 particles were spheroid-shaped; for sizes between 25 and 45 nm, they were cuboid-shaped; and for sizes greater than 45 nm, they had an are octapod-like morphology characterised by the formation of lobes at the corners of the particles which can be described as a branching phenomenon (see the sequence shown schematically on the left of Figure 11). It is interesting to note that (i) the cuboid shape observed was characterised by a parameter d 1 / d 2 < 3 , which means here that the corners of the cube were smooth; (ii) for d 1 / d 2 > 3 , we observed the formation of a concave surface on the (100) faces.
To analyse the observations made, it should be noted that, on the one hand, the anisotropy of the interfacial energy between amorphous Si3N4 and ferrite was expected to be small, analogous to liquid solid interfaces, and consequently, the equilibrium shape obtained from the Wulff construction would be close to sphere. On the other hand, the formation of amorphous Si3N4 in the ferrite was accompanied by internal stresses because the two phases had different molar volumes. Consequently, we must consider that the equilibrium shape of precipitates from minimising the sum of the interfacial and the elastic energies at constant volume. The relative contributions of elastic and interfacial energy to the total energy of the system can be evaluated through the dimensionless parameter λ , defined as follows [40]:
λ = ε * 2 C 44 l γ
where ε * is the misfit strain, C 44 is an elastic constant of the matrix, l is the characteristic size of the precipitates, and γ is the surface energy. It is worth noting that the quantity ε * 2 C 44 scales the elastic energy density.
Although this approach can only be applied rigorously under specific conditions (for example, the same elastic constants for the matrix and the precipitates), it nevertheless provides a simple explanation of our observations on the morphological transition between spheroid and cuboid shapes. For small λ (i.e., small l and/or small elastic energy density), interfacial energy is the dominant factor in setting the equilibrium shape. In this case, the spheroid shape is expected to be stabilised. This corresponds perfectly to our observations, as most Si3N4 amorphous particles with a characteristic size of less than 25 nm are spheroid-shaped. Since λ scales linearly with l, it is clear that as the particle increases in size, the effects of the elastic stress on the equilibrium shape become more important. In that case, the spherical particle is no longer in equilibrium. The development of a fourfold anisotropy in the particle shape is then expected and depends on the elastically hard and soft directions of the matrix [40]. In our case, it is well known that the Young’s modulus of the α-Fe matrix phase in the <100> directions were lower than in both the <110> and <111> directions, with the <100> directions corresponding to the elastically soft directions [41]. It was shown in the 2D section that the high interfacial concentration near the <100> direction resulted in the flow of mass to the region of the interface near the <110> direction, which was low in concentration [40]. This would be expected to produce an increase in curvature along the elastically hard <110> directions and decrease in curvature along the elastically soft <100> directions of the matrix. The resulting morphology would be a cuboid shape that never develops the sharp corners of flat sides characteristic of a cube and whose faces would be always parallel to {100} α-Fe planes. This is in perfect agreement with our observations, as we have shown that all cuboid-shaped Si3N4 particles had faces parallel to {100} α-Fe planes (see Figure 9). This work also provides experimental evidence that misfitting particles with nearly isotropic interfacial energy in an elastically anisotropic medium can exhibit some degree of fourfold anisotropy and that the magnitude of the fourfold anisotropy will increase with particle size. The origin of such a phenomenon is mainly linked to the elastic strain energy. However, large λ does not necessarily mean that the misfit must be large, since λ scales linearly with the particle size l. Thus, even particles with small misfits will eventually exhibit the effects of elastic stress for sufficiently large particle sizes.
To better understand the whole sequence of morphological instability, it is now interesting to focus on the transition from cuboid to octapod-like morphology. Observations show that this transition takes place via a transformation of quasi flat-facets into concave ones (see Figure 10 and Figure 11). However, neither the elastic strain energy nor the interfacial energy favours the formation of a concave interface. It is therefore reasonable to suspect that the morphological instability resulted from kinetic effects. To verify this hypothesis, we evaluated the effects of diffusion fields alone, in the presence and absence of internal stresses, using the 3D model developed. The model system chosen corresponded to an A-B binary composed by two phases α and β. The initial state corresponded to a single particle β of cubic shape placed in a matrix α. The initial volume fraction of β was f v = 0.1   . The isotropic elastic constants used for the simulation corresponded to those of ferrite for the α phase and Si3N4 for the β phase. These data are given in Table 2.
Figure 12 gives the evolution of both the volume fraction f v and the morphology of a particle β, initially cubic in shape, as a function of the dimensionless time t · D / L 2 . Firstly, as expected, the growth kinetics was lowered when the misfit between particle and the matrix increased. This was also clearly exhibited on the 3D morphologies obtained at the same dimensionless time t · D / L 2 = 0.3 for which the volume fraction of β was higher as the misfit decreased (see points 3, 5, and 6 in Figure 12). Secondly, it was clear that the resulting morphology depended on the misfit and therefore on internal stresses. The formation of the octapod-like morphology seemed to be favoured in the absence of internal stresses.
It can be seen that when the driving force for growth was relatively high (3 and 5 in Figure 12), the lobes of the cube appeared facetted and, compared with observations, much less pointed in the <111> directions. This can be explained mainly by the fact that the interfacial and anisotropic effects of diffusion were neglected to better highlight and to decouple the effects of stress and diffusion fields on morphological evolution.
To go further, we considered two different misfit values, Σ = 0 % and Σ = 0.12 % , and a volume fraction of β of f v = 0.5 % (points 2′ and 4′ in Figure 12). The analysis of the composition and stress fields in a (110) plane of the matrix α (Figure 13) showed the following: (i) The composition gradient around the particle was less marked in the presence of internal stresses (comparison between Figure 13a,b). This was perfectly consistent with the fact that internal stresses slowed down the growth kinetics of β. (ii) Both composition and stress fields were anisotropic (see Figure 13b,c). (iii) In both cases, Σ = 0 % and Σ = 0.12 % , we observed the formation of lobes in the corners of the cube, i.e., along the <111> directions of the matrix. The latter was able to appear well before the diffusion fields overlapped (clearly visible in Figure 13a). It was therefore not mainly linked to the interaction between the concentration fields around the particle and the boundaries of the system.
These general observations provide an overview of the dynamics of the morphological instability. To refine them, both the concentration and stress profiles were plotted in the <001> and <111> directions of the matrix as a function of the misfit (Figure 14).
The concentration gradients at the α / β interface were a marker of the interface mobility and therefore of the growth rate of β into α. When there were internal stresses (for Σ = 0.12 % and Σ = 0.25 % ), particle β was in compression, and matrix α in tension. The greater the misfit, the greater the level of stress in the particle β. We clearly show in Figure 14 that the concentration gradient in the matrix at the α / β interface was steeper in the <111> direction than in the <001> direction. This explains why the corners of the cuboid grew faster than the faces.
This process had two consequences. Firstly, accelerated growth of the β phase in the <111> directions at the expense of growth in the <001> directions. Secondly, the formation of a concave surface on the faces of the cube. Consequently, the cuboid/octapod-like morphology instability was indeed the result of a kinetic effect induced by the diffusion fields. However, internal stresses played an important role in this instability, and then on morphological evolution. Indeed, we can suspect that the relative growth of β in the <111> and <001> directions depended on the misfit. To confirm this, the evolution of the dimensionless parameter d 1 / d 2 yielding the largest length of precipitate along the <111> direction and the smallest length along the <100> direction was plotted as a function of Σ and dimensionless time (Figure 15a). The morphological evolution in the (001) plane of the matrix was given for three dimensionless times, namely, 0.1, 0.2, and 0.3 (Figure 15b). Remember that d 1 / d 2 = 1 and d 1 / d 2 = 3 correspond to the spherical and cubic shapes, respectively, with it being clear that the diffusion field alone destabilised the cube to octapod-like shape (the green curve in Figure 15a and green outline in Figure 15b) because the d 1 / d 2 ratio increased as the β particle grew. When the internal stresses increased (i.e., the misfit), we were able to have two different situations. In one, the d 1 / d 2 ratio increased as the particle grew for a misfit of 0.12% (blue curve in Figure 15a). In this case, lobes in the corners of the cube and concavity of the faces of the cube would develop, leading to the formation of an octapod-like morphology (blue outline in Figure 15b). However, this process will be kinetically less pronounced than in the absence of internal stresses. The other was where the d 1 / d 2 ratio decreased as the particle grew for a misfit of 0.25% (yellow curve in Figure 15a). In that case, the octapod-like morphology was no longer observed. The internal stresses tended to stabilise the cuboid or even to destabilise cuboid to spheroid shape (yellow outline in Figure 15b). The origin of such a phenomenon can be explained from the mechano-chemical potential gradient, which tends to cause the B atoms to diffuse from the most stressed areas (i.e., the regions located in the immediate vicinity of the cuboid corners in the matrix; see Figure 13c) towards the least stressed ones (close to the faces (001); see the white zones in Figure 13c). These results were recently confirmed by observations and analysis relating to the morphological transition from cube to petal of the iron-rich particle in the Cu-Fe-Co system formation [15]. Furthermore, it was shown that one of the conditions for branching instability to occur is that elastic driving force should be smaller than the chemical driving to permit growth of the particle corners [42]. This is perfectly consistent with our work.
As a consequence, the morphological instability from cuboid to octapod-like morphology observed was linked to the interaction between the diffusion fields and the stress fields and the result of two antagonistic effects. On the one hand, a stabilising effect linked to the internal stresses and, on the other, a destabilising effect linked to the anisotropy of the diffusion fields.
It is interesting to note that the co-formation of crystalline Si3N4 and octapod-shaped nanosized amorphous Si3N4 precipitates in a ferrite matrix was observed upon the nitriding of a Fe–4.5 at.% Si alloy for 48h at 650 °C [3]. The octapod morphology was attributed to the highly anisotropic stress field around the developing precipitates, which would favour the development of lobes in the <111> directions of the matrix. Our findings show instead that the elastic stress field favoured the growth of a cuboid precipitate to the detriment of an octapod one. However, this raises questions regarding the presence of an octapod-like morphology in a system where high internal stresses are expected. In this work, it was established that the octapod-like morphology formation was the result of a balance between chemical driving force and elastic driving force. In our experiments, this was observed when the characteristic size of amorphous Si3N4 was around 45 nm. This would mean that for particle sizes greater than 45nm, the elastic driving force should be smaller than the chemical driving force. In the case of nitriding, this hypothesis is very realistic for two main reasons. Firstly, the system can be considered as open due to the steady supply of nitrogen atoms from the atmosphere, which enables a large chemical driving force throughout the process. Secondly, in these systems, many mechanisms of stress relaxation operate. For example, a local redistribution of nitrogen in specific sites that accommodate stress is possible. This mechanism has already been observed in Fe–N–Si sputtered films [43]. Interestingly, it was suggested that the presence of the amorphous Si3N4 precipitates requires such a stress relaxation mechanism to be operating. Indeed, experimentally, it has been shown that amorphous Si3N4 can be destabilised in favour of crystalline α-Si3N4 [5] in a low-nitrogen-activity atmosphere.

5. Conclusions

In this article, we present a detailed analysis on both experimental and 3D modelling approaches of the unique Si3N4 precipitation observed in ferritic Fe-Si alloys upon nitriding at 570 °C. During growth, the amorphous Si3N4 experienced shape instability. First, at the early stage of growth, when the characteristic size of Si3N4 was larger than 25 nm, a transition between spheroid and cuboid morphology took place. Using TEM, we showed that it resulted from competition between interfacial energy and elastic energy. Second, for a critical size of around 45 nm, a transition from the cuboid shape to an octapod-like shape was observed. This was characterised by a transformation of quasi-flat facets into concave ones and the development of lobes in the <111> directions of the bcc crystal. Using a 3D original model that explicitly coupled phase transformations and mechanical fields, we provided some clarifications regarding the role of both diffusional and stress fields on the cuboid to octapod-like morphology instability. The latter was shown to be linked to the interaction between the diffusion fields and the stress fields and resulted from two antagonistic effects. On the one hand, internal stresses stabilised cuboids, while on the other, the anisotropy of the diffusion field promoted an octapod-like shape. The obtained results were in agreement with the experimental observations.

Author Contributions

Conceptualisation—S.B., M.G. and H.-P.V.L.; software—S.B.; methodology—S.B., H.-P.V.L. and M.G.; validation—S.B., H.-P.V.L. and M.G.; formal analysis—S.B., H.-P.V.L. and M.G.; investigation H.-P.V.L. and A.R.; data curation—H.-P.V.L. and A.R.; writing—original draft preparation—M.G. and S.B.; writing, review, and editing—M.G. and S.B.; supervision—A.R. and M.G.; project administration—A.R. and M.G. All authors have read and agreed to the published version of the manuscript.

Funding

This work was supported by the French State through the program “Investment in the future” operated by the National Research Agency (ANR) and referenced by ANR-11-LABX0008-01 (LabEx DAMAS).

Data Availability Statement

The original contributions presented in the study are included in the article, further inquiries can be directed to the corresponding author.

Acknowledgments

The authors gratefully acknowledge support from the METSA network under reference numbers METSA 11 A27 and METSA 11 A44. The authors wish to thank the CC-MEM of the Institut Jean Lamour for their assistance in the electron microscopy work.

Conflicts of Interest

The authors declare no conflict of interest.

References

  1. Mittemeijer, E.; Biglari, M.; Böttger, A.; Van der Pers, N.; Sloof, W.; Tichelaar, F. Precipitation of amorphous Si3N4 in α-Fe. Scripta Mater. 1999, 41, 625–630. [Google Scholar] [CrossRef]
  2. Meka, S.R.; Jung, K.S.; Bischoff, E.; Mittemeijer, E.J. Unusual precipitation of amorphous silicon nitride upon nitriding Fe–2at.%Si alloy. Philos. Mag. 2012, 92, 1435–1455. [Google Scholar] [CrossRef]
  3. Meka, S.R.; Bischoff, E.; Rheingans, B.; Mittemeijer, E.J. Octapod-shaped, nanosized, amorphous precipitates in a crystalline ferrite matrix. Philos. Mag. Lett. 2013, 93, 238–245. [Google Scholar] [CrossRef]
  4. Van Landeghem, H.P.; Gouné, M.; Epicier, T.; Redjaïmia, A. Unexpected low-temperature crystallization of amorphous silicon nitride into α-Si3N4 in a ferritic Fe–Si matrix. Scr. Mater. 2013, 68, 187–190. [Google Scholar] [CrossRef]
  5. Van Landeghem, H.P.; Gouné, M.; Bordère, S.; Danoix, F.; Redjaïmia, A. Competitive precipitation of amorphous and crystalline silicon nitride in ferrite: Interaction between structure, morphology, and stress relaxation. Acta Mater. 2015, 93, 218–234. [Google Scholar] [CrossRef]
  6. Van Landeghem, H.P.; Gouné, M.; Redjaïmia, A. Investigation of a Ferrite/Silicon Nitride Composite Concept Aimed at Automotive Applications. Steel Res. Int. 2012, 83, 590–593. [Google Scholar] [CrossRef]
  7. Van Landeghem, H.P. Métallurgie à L’azote: Nanoprecipitation Amorphe et Cristalline de Nitrure de Silicium Dans le Système Fe-Si-N. Ph.D. Thesis, Université de Lorraine, Lorraine, France, 2012. [Google Scholar]
  8. Böhm, H.J.; Rasool, A. Effects of particle shape on the thermoelastoplastic behavior of particle reinforced composites. Int. J. Solid Struct. 2016, 87, 90–101. [Google Scholar] [CrossRef]
  9. Makineni, S.K.; Sugathan, S.; Meher, S.; Banerjee, R.; Bhattacharya, S.; Kumar, S.; Chattopadhyay, K. Enhancing elevated temperature strength of copper containing aluminium alloys by forming L12 Al3Zr precipitates and nucleating θ″ precipitates on them. Sci. Rep. 2017, 7, 11154. [Google Scholar] [CrossRef]
  10. Jokisaari, A.M.; Naghavi, S.S.; Wolverton, C.; Voorhees, P.W.; Heinonen, O.G. Predicting the morphologies of γ′ precipitates in cobalt-based superalloys. Acta Mater. 2017, 141, 273–284. [Google Scholar] [CrossRef]
  11. Miyazaki, T.; Imamura, H.; Kozakai, T. The formation of γ′ precipitate doublets in NiAl alloys and their energetic stability. Mater. Sci. Eng. 1982, 54, 9–15. [Google Scholar] [CrossRef]
  12. Doi, M.; Miyazaki, T.; Wakatsuki, T. The effect of elastic interaction energy on the morphology of γ′ precipitates in nickel-based alloys. Mater. Sci. Eng. 1984, 67, 247–253. [Google Scholar] [CrossRef]
  13. Dhanish, S.; Daniel, B.S.S. Elastic Field Evolution in Al–X (X = Sc, Zr, Er) Alloy during Heat Treatment, Insights from 3D-Multiphase Field Study. J. Eng. Mater. Technol. 2024, 146, 606–626. [Google Scholar] [CrossRef]
  14. Hazote, A.; Grosdidier, T.; Denis, S. γ′ precipitate splitting in Nickel-based superalloys: A 3D finite element analysis. Scripta Mater. 1996, 34, 601–608. [Google Scholar] [CrossRef]
  15. Chen, K.X.; Korzhavyi, P.A.; Demange, G.; Zapolsky, H.; Patte, R.; Boisse, J. Morphological instability of iron-rich precipitates in Cu–Fe–Co alloys. Acta Mater. 2019, 163, 55–67. [Google Scholar] [CrossRef]
  16. Lebbad, H.; Appolaire, B.; Le Bouar, Y.; Finel, A. Insights into the selection mechanism of Widmanstätten growth by phase-field calculations. Acta Mater. 2021, 217, 117148. [Google Scholar] [CrossRef]
  17. Le Bouar, Y.; Finel, A.; Appolaire, B.; Cottura, M. Phase field models for modeling microstructure evolution in single-crystal Ni-base superalloys. In Nickel Base Single Crystals Across Length Scales; Elsevier: Amsterdam, The Netherlands, 2022; pp. 379–399. [Google Scholar] [CrossRef]
  18. Gennari, G.; Jefferson-Loveday, R.; Pickering, S.J. A phase-change model for diffusion-driven mass transfer problems in incompressible two-phase flows. Chem. Eng. Sci. 2022, 259, 117791. [Google Scholar] [CrossRef]
  19. Schulz, A.; Wecker, C.; Inguva, V.; Lopatin, A.S.; Kenig, E.Y. A PLIC-based method for species mass transfer at free fluid interfaces. Chem. Eng. Sci. 2022, 251, 117357. [Google Scholar] [CrossRef]
  20. Zanutto, C.P.; Paladino, E.E.; Evrard, F.; van Wachem, B.; Denner, F. Modeling of interfacial mass transfer based on a single-field formulation and an algebraic VOF method considering non-isothermal systems and large volume changes. Chem. Eng. Sci. 2022, 247, 116855. [Google Scholar] [CrossRef]
  21. Bordère, S.; Glockner, S. Numerical modelling of diffusion-controlled phase transformation using the Darken method: Application to the dissolution/precipitation processes in materials. Comput. Mater. Sci. 2021, 186, 109944. [Google Scholar] [CrossRef]
  22. Zhao, Y. Understanding and design of metallic alloys guided by phase-field simulations. npj Comput. Mater. 2023, 9, 94. [Google Scholar] [CrossRef]
  23. Yamanaka, A. Phase-field modelling and simulation of solid state phase transformations in steel. ISIJ. Inter. 2023, 63, 395–406. [Google Scholar] [CrossRef]
  24. Cheng, T.-L.; Wen, Y.-H. Phase-field model of precipitation processes with coherency loss. NPJ Comput. Mater. 2021, 7, 36. [Google Scholar] [CrossRef]
  25. Hirsch, C. Numerical Computation of Internal and External Flows Volume 2: Computational Methods for Inviscid and Viscous Flows, 1st ed.; John Wiley & Sons: Chichester, UK, 1990; pp. 536–552. [Google Scholar]
  26. Alabi-Babalola, O.; Zhong, J.; Moggridge, G.D.; D’Agostino, G. Rationalizing the use of mutual diffusion prediction models in non-ideal binary mixtures. Chem. Eng. Sci. 2024, 291, 119930. [Google Scholar] [CrossRef]
  27. Sridhar, S. A Commentary on “Diffusion, Mobility and Their Interrelation through Free Energy in Binary Metallic Systems” L.S. Darken: Trans. AIME, 1948, vol. 175, p. 184ff. Metall. Mater. Trans. A 2010, 41, 543–562. [Google Scholar] [CrossRef]
  28. Herrnring, J.; Sundman, B.; Klusemann, B. Diffusion-driven microstructure evolution in OpenCalphad. Comput. Mater. Sci. 2020, 175, 109236. [Google Scholar] [CrossRef]
  29. Bordère, S.; Caltagirone, J.-P. A unifying model for fluid flow and elastic solid deformation: A novel approach for fluid–structure interaction. J. Fluids. Struct. 2014, 51, 344–353. [Google Scholar] [CrossRef]
  30. Bordère, S.; Caltagirone, J.-P. A multi-physics and multi-time scale approach for modeling fluid–solid interaction and heat transfer. Comput. Struct. 2016, 164, 38–52. [Google Scholar] [CrossRef]
  31. Notus CFD Code. Available online: https://notus-cfd.org (accessed on 2 January 2016).
  32. Glockner, S.; Jost, A.M.D.; Erriguible, A. Advanced petascale simulations of the scaling up of mixing limited flow processes for materials synthesis. Chem. Eng. J. 2022, 431, 133647. [Google Scholar] [CrossRef]
  33. Zener, C. Theory of Growth of Spherical Precipitates from Solid Solution. J. Appl. Phys. 1949, 20, 950–953. [Google Scholar] [CrossRef]
  34. Li, J.C.-M. Physical chemistry of some microstructural phenomena. Met. Trans. A 1978, 9, 1353–1380. [Google Scholar] [CrossRef]
  35. Scherer, G.W. Relaxation in Glass and Composites, 1st ed.; Wiley: New York, NY, USA, 1986; 331p. [Google Scholar]
  36. Kazemi-Lari, M.A.; Shaw, J.A.; Wineman, A.S.; Shimkunas, B.; Jian, Z.; Hegyi, B.; Hegyi, B.; Izu, L.; Chen-Izu, Y. A viscoelastic Eshelby inclusion model and analysis of the Cell-in-Gel system. Int. J. Eng. Sci. 2021, 165, 103489. [Google Scholar] [CrossRef] [PubMed]
  37. Ammar, K.; Appolaire, B.; Cailletaud, G.; Feyel, F.; Forest, S. Finite element formulation of a phase field model based on the concept of generalized stresses. Comput. Mater. Sci. 2009, 45, 800–805. [Google Scholar] [CrossRef]
  38. Laraia, V.J.; Johnson, W.C. Growth of a coherent precipitate from a supersaturated solution. J. Mater. Res. 1988, 3, 257–266. [Google Scholar] [CrossRef]
  39. Martinavicius, A.; Van Landeghem, H.P.; Danoix, R.; Redjaïmia, A.; Gouné, M.; Danoix, F. Mechanism of Si3N4 precipitation in nitrided Fe-Si alloys: A novel example of particle-stimulated-nucleation. Mater. Lett. 2017, 189, 25–27. [Google Scholar] [CrossRef]
  40. Voorhess, P.W.; Mc Fadden, G.B.; Johnsson, W.C. On the morphological development of second-phase particles in elastically-stressed solid. Acta Metal. Mater. 1992, 40, 2979–2992. [Google Scholar] [CrossRef]
  41. Souissi, M.; Numakura, H. Elastic properties of Fe-C and Fe-N martensites. ISIJ Int. 2015, 55, 1512–1521. [Google Scholar] [CrossRef]
  42. Wang, Y.; Khachaturyan, A.G. Shape instability during precipitate growth in coherent solids. Acta Metall. Mater. 1995, 43, 1837–1857. [Google Scholar] [CrossRef]
  43. Uchiyama, K.; O’Handley, R.C. Lattice strain in sputterdeposited Fe–N–Si films: Effects of interstitial mobility. IEEE Trans. Magn. 1999, 35, 2024–2028. [Google Scholar] [CrossRef]
Figure 1. (a) Cross-section micrograph obtained after nitriding of the Fe-1.5wt%Si sample at 570 °C for 8 h; (b) X-ray diffraction pattern associated. The compound layer on the surface is composed of γ’-Fe4N and ε-Fe2-3N, and the diffusion zone underneath by α-Fe.
Metals 14 00442 g001
Figure 2. (a) Three-dimensional representation of a particle/matrix system into the simulation box of length L and 2D visualisation of the mesh grid in the (100)-plane; (b) 2D visualisation of the phase function ϕ discriminating the matrix ϕ = 0 (blue color) from the particle ϕ = 1 (red color). At the interface, the ϕ-function varies continuously. The location of the interface is defined for ϕ = 0.5 with the full line in black color.
Metals 14 00442 g002
Figure 3. Maps within the three equivalent middle planes X = 0.5 , Y = 0.5 , and Z = 0.5 at dimensionless time t · D / L 2 = 0.15 of (a) molar fraction of B-atoms; (b) pressure. Note that the positive value of pressure corresponds to compressive pressure, whereas negative value corresponds to tensile pressure.; (c) Normalized shear stress.
Metals 14 00442 g003
Figure 4. Evolution of the pressure characteristics in the system as a function of the dimensionless particle radius r/L at (a) the X = 0.5 ,   Y = 0.5 , Z = 0.5 -point located in the β-precipitate; (b) the X = 0.15 ,   Y = 0.5 ,   Z = 0.5 -point located in the α-matrix. This evolution was compared for some volume fractions (red dots) to that obtained analytically from Scherer’s model, adapted from Ref. [35].
Metals 14 00442 g004
Figure 5. Comparison of the particle growth kinetics. The blue curve and the red curve correspond, respectively, to the unstressed and stressed cases: (a) Evolution of the square of the dimensionless particle radius as a function of dimensionless time. (b) Evolution of the dimensionless particle radius.The dashed line corresponds to the final equilibrium values.
Metals 14 00442 g005
Figure 6. Comparison of the atom fraction profiles of B-atoms within the α-phase along the three equivalent middle lines, the (X/L, Y/L = 0.5, Z/L = 0.5)-line, (X/L = 0.5, Y/L = 0.5, Z/L)-line, and (X/L = 0.5, Y/L, Z/L = 0.5)-line during the particle growth. The solid lines and the dashed lines correspond to the unstressed and stressed cases, respectively.
Metals 14 00442 g006
Figure 7. Bright field TEM images of a replica extracted around 50 μm below the surface of the Fe-1.5wt%Si sample nitrided for 8 h. The micrographs show the intense precipitation of silicon nitride particles. It is of interest to note the thin depleted area along the grain boundary, as shown in the dotted area.
Metals 14 00442 g007
Figure 8. (a) Bright field TEM image at 200 kV of a sample of Fe-1.5wt% Si nitrided for 2 h at 570 °C. The arrows numbered 1, 2, and 3 show that the particles can have a quasi-spherical and/or cuboid morphology. (b) Electron diffraction pattern on isolated particle extracted. (c) The contrast observed using high-resolution TEM support the amorphous nature of Si3N4.
Metals 14 00442 g008
Figure 9. Bright field TEM images of a sample of Fe–1.5wt% Si nitrided for 4 h at 570 °C in the 001 α F e zone axis. The images were rotated in such a way that the 100 of the ferrite were represented in an orthogonal reference frame. The faces of these cuboids were all systematically parallel to {100} planes of the matrix, as indicated by the arrows.
Metals 14 00442 g009
Figure 10. Bright field image of a thin foil prepared using FIB on Fe-3.3wt%Si nitrided for 4 h at 570 °C. There was a correlation between particle size and morphology. The smallest particles were spheroid-shaped (shown in red), those of intermediate size were cuboid-shaped (shown in green), and the largest had a concave cuboid shape with lobes formation at the corners (shown in blue).
Metals 14 00442 g010
Figure 11. Relationship between the measured characteristic sizes of amorphous Si3N4 precipitates, the dimensionless parameter d 1 / d 2 , and their observed morphologies in the Fe-1.5wt% nitride for 8 h. d 1 / d 2 = 1   for a sphere, d 1 / d 2 = 3 for a cube, and d 1 / d 2 > 3 corresponds to the concave cuboid shape preceding the formation of lobes at the corners of the particles. The inserts at the top-left and in the figure correspond to TEM images obtained on replicas. Morphological instabilities and the corresponding critical sizes are shown schematically on the right of the figure.
Metals 14 00442 g011
Figure 12. Effect of misfit on the growth kinetics and morphological evolution of the β particle as a function of dimensionless time. Three misfit values, Σ, were considered: 0.25%, 0.12%, and 0%. Points 2, 4, and 6 and 3, 5, and 6 were located on volume iso-fraction f v = 0.3 % and iso-dimensionless time t . D / L 2 = 0.3 , respectively. Points 2′ and 4′ corresponded to a volume fraction of 0.5% and misfits of 0.12% and 0.25%, respectively.
Metals 14 00442 g012
Figure 13. Distribution of both the composition and stress fields in the (110) plane of the matrix α for the two points 2′ and 4′ shown in Figure 12 for f v = 0.5 % . The particle β is located inside the red outline. (a) Concentration map of B atoms in the absence of internal stresses ( Σ = 0). (b) Concentration map of B atoms for the misfit Σ = 0.12 % . (c) Stress field for Σ = 0.12 % .
Metals 14 00442 g013
Figure 14. Evolution of the concentration and stress profiles along the <001> and <111> directions of the matrix as a function of misfit ( Σ = 0 , Σ = 0.12 % , and Σ = 0.25 % ). Obviously, the stress profile for Σ = 0 was not plotted because there are no internal stresses in this case.
Metals 14 00442 g014
Figure 15. Evolution of (a) the dimensionless parameter d 1 / d 2 yielding the largest length of precipitate along the <111> direction and the smallest length along the <001> direction as a function of misfit and dimensionless time; (b) the morphology of precipitate β as a function of misfit and at three given dimensionless times, namely, 0.1, 0.2, and 0.3 in the (001)-plane.
Metals 14 00442 g015
Table 1. Parameters for the calculation of the kinetic coefficients κ for unstressed and stressed configurations.
x B β * x B α * x B α 0 D / L 2 (s−1)ωκ
Without stress1.00.080.011.0 × 10−60.0217390.1151359
With stress1.00.080.011.0 × 10−60.016630.0994093
Table 2. Data used for modelling.
Symbolα-Phaseβ-Phase
Initial molar fraction x B 0 0.11
Equilibrium molar fraction x B * 0.081
Young’s modulus (GPa)EY178320
Poisson coefficientν0.300.26
Compressibility coefficient (Pa−1) χ T 6.7 ×   10 12 4.5 ×   10 12
First Lamé’s coefficient (GPa) μ E 68130
Disclaimer/Publisher’s Note: The statements, opinions and data contained in all publications are solely those of the individual author(s) and contributor(s) and not of MDPI and/or the editor(s). MDPI and/or the editor(s) disclaim responsibility for any injury to people or property resulting from any ideas, methods, instructions or products referred to in the content.

