Article

High-Entropy Alloy Al0.2Co1.5CrFeNi1.5Ti0.5 Prepared from High-Entropy Oxide (Al0.2Co1.5CrFeNi1.5Ti0.5)3O4 by a Deoxidation Process via a CaH2-Assisted Molten Salt Method

1
Renewable Energy Research Centre, National Institute of Advanced Industrial Science and Technology, 2-2-9 Machiikedai, Koriyama 963-0298, Japan
2
Department of Chemical Science and Engineering, National Institute of Technology, Tokyo College, 1220-2 Kunugida, Hachioji 193-0997, Japan
*
Author to whom correspondence should be addressed.
Metals 2024, 14(4), 443; https://doi.org/10.3390/met14040443
Submission received: 13 March 2024 / Revised: 5 April 2024 / Accepted: 8 April 2024 / Published: 10 April 2024

Abstract

:
High-entropy alloys (HEAs) have attracted a great deal of research interest these days because of their attractive properties. Low-temperature chemical synthesis methods are being developed to obtain nanoscale HEAs with low energy consumption. In this study, we prepared HEA Al0.2Co1.5CrFeNi1.5Ti0.5 nanoparticles from high-entropy oxide (HEO) (Al0.2Co1.5CrFeNi1.5Ti0.5)3O4 by a deoxidation process via a CaH2-assisted molten salt method at 600 °C. X-ray diffraction measurements demonstrated that the oxide precursor and the reduced product have single-phases of spinel structure and face-centered cubic structures, indicating the formation of HEO and HEA, respectively. The HEA nanoparticles exhibited superior catalytic performance in the liquid-phase hydrogenation of p-nitrophenol at room temperature with little leaching of the component elements. Scanning electron microscopy (SEM) with energy-dispersive X-ray spectrometry (EDX) exhibited a good distribution of constituent elements over the HEA nanoparticles in a micro-sized range. However, transmission electron microscopy (TEM) with EDX revealed a slight deviation of elemental distributions of Al and Ti from those of Co, Cr, Fe, and Ni in a nano-sized range, probably due to the incomplete reduction of aluminum and titanium oxides. The elemental homogeneity in the HEA nanoparticles could be improved by taking advantage of the HEO precursor with homogeneous elemental distributions, but the experimental results suggested the importance of the total reduction of oxide precursors to prepare homogeneous HEAs from HEOs.

1. Introduction

High-entropy alloys (HEAs) are solid-solution alloys composed of five or more elements. Such multicomponent solid-solution alloys were first reported in 2004 [1,2] and have since attracted much interest owing to their high corrosion and oxidation resistance, high-temperature strength, strong wear resistance, and other excellent properties [3,4,5,6]. Powder metallurgy with starting materials of pure metals composed of HEAs is a major physical method to prepare HEA materials [7,8]. Recently, HEA materials have been successfully synthesized by more challenging chemical methods, such as carbothermal shock synthesis, which uses metal salts as the starting materials [9,10,11]. Other approaches, such as wet chemical synthesis [12], sol–gel autocombustion synthesis [13], electrosynthesis [14], solvothermal synthesis [15], organic compound-assisted synthesis [16], aerosol synthesis [17], continuous droplet synthesis [18], one-pot polyol synthesis [19], fast-moving bed pyrolysis synthesis [20], and so on, have also been proposed as superior chemical methods. Chemical methods are potentially more suitable than physical methods for large-scale production. In addition, preparation temperatures of HEA materials by chemical methods are generally lower than those by physical methods, leading to energy savings. It was demonstrated that it was feasible to prepare bulk samples of HEAs, such as CuCoFeNi [21,22] and CoCrFeMnNi [23], from the constituent oxides by hydrogen reduction performed below 1200 °C, and the products showed good mechanical properties. However, it is still an issue to obtain HEAs containing a good mixture of constituent elements by the deoxidation of oxides.
In previous works, we reported the preparation of HEA powders from the constituent oxides via a novel CaH2-assisted molten salt method at 550–800 °C [24,25,26,27,28]. A calcium hydride is known to work as a very strong reduction agent because it contains hydride ions (H) with a low reduction potential of −2.2 V (vs. standard hydrogen electrode). Since the potential is lower than those of Al (−1.6 V), Ti (−1.4 V), Cr (−0.9 V), Mn (−1.2 V), Fe (−0.9 V), Co (−0.3 V), and Ni (−0.3 V), the metal oxides are theoretically reduced by H. Molten LiCl and molten LiCl-CaCl2 assisted the reduction as well as the well-crystallized formation of single-phase HEAs, such as the typical HEAs of CrMnFeCoNi at 800 °C [26] and AlCoCrFeNi at 550 °C [25]. In the previous reports, a life cycle assessment (LCA) was conducted to evaluate the environmental performance of the proposed molten salt reduction synthesis method and to compare the said performance to that of a conventional chemical etching method for the preparation of high surface area alloys. For HEA CrMnFeCoNi, the LCA results showed that the molten salt method accounted for greenhouse gas emissions of 121 kg CO2e/kg in the production process, which was 20% lower than that for the common etching method. For HEA AlCoCrFeNi, the LCA of the proposed method indicated that AlCoCrFeNi production was associated with greenhouse gas emissions of 125 kg CO2e/kg-product, whose main contributors were the CaH2 and citric acid used during the precursor’s reduction and formation, respectively. On the other hand, the etching method produced 277 kg CO2e/kg-product. Thus, a minimum of 54% greenhouse gas emission reduction compared to the conventional etching method was achievable in the proposed molten salt method. The previous results indicated the possible environmentally friendly production of high surface area HEA powders suitable for industrial applications. In catalytic applications, it was found that the HEA Al0.2Co1.5CrFeNi1.5Ti0.5 nanoparticles exhibited the highest catalytic performance in the liquid-phase hydrogenation of p-nitrophenol (4-NP) at 50 °C among several HEAs prepared by the molten salt method [27,28]. It has been demonstrated that HEA AlxCo1.5CrFeNi1.5Tiy [29] and Al0.2Co1.5CrFeNi1.5Ti0.5 [30,31,32,33] show superior wear-resistant properties. Thus, HEA Al0.2Co1.5CrFeNi1.5Ti0.5 nanoparticles can be a promising stable catalyst in liquid-phase hydrogenation reactions without the leaching of component elements. In this study, we conducted the microscopic elemental analysis of HEA Al0.2Co1.5CrFeNi1.5Ti0.5 nanoparticles via scanning and transmission electron microscopies with energy dispersive X-ray spectrometry (SEM-/TEM-EDX), so as to confirm the elemental homogeneities more carefully in the HEA nanoparticles prepared from single-phase oxide. Since the oxide precursor had a single-phase spinel structure, it was expected to obtain HEA Al0.2Co1.5CrFeNi1.5Ti0.5 with a homogeneous distribution of constituent elements by deoxidizing the oxide of high-entropy oxide (Al0.2Co1.5CrFeNi1.5Ti0.5)3O4. In addition, the catalytic test was again conducted in the 4-NP hydrogenation at room temperature to compare the activity with the reported results.

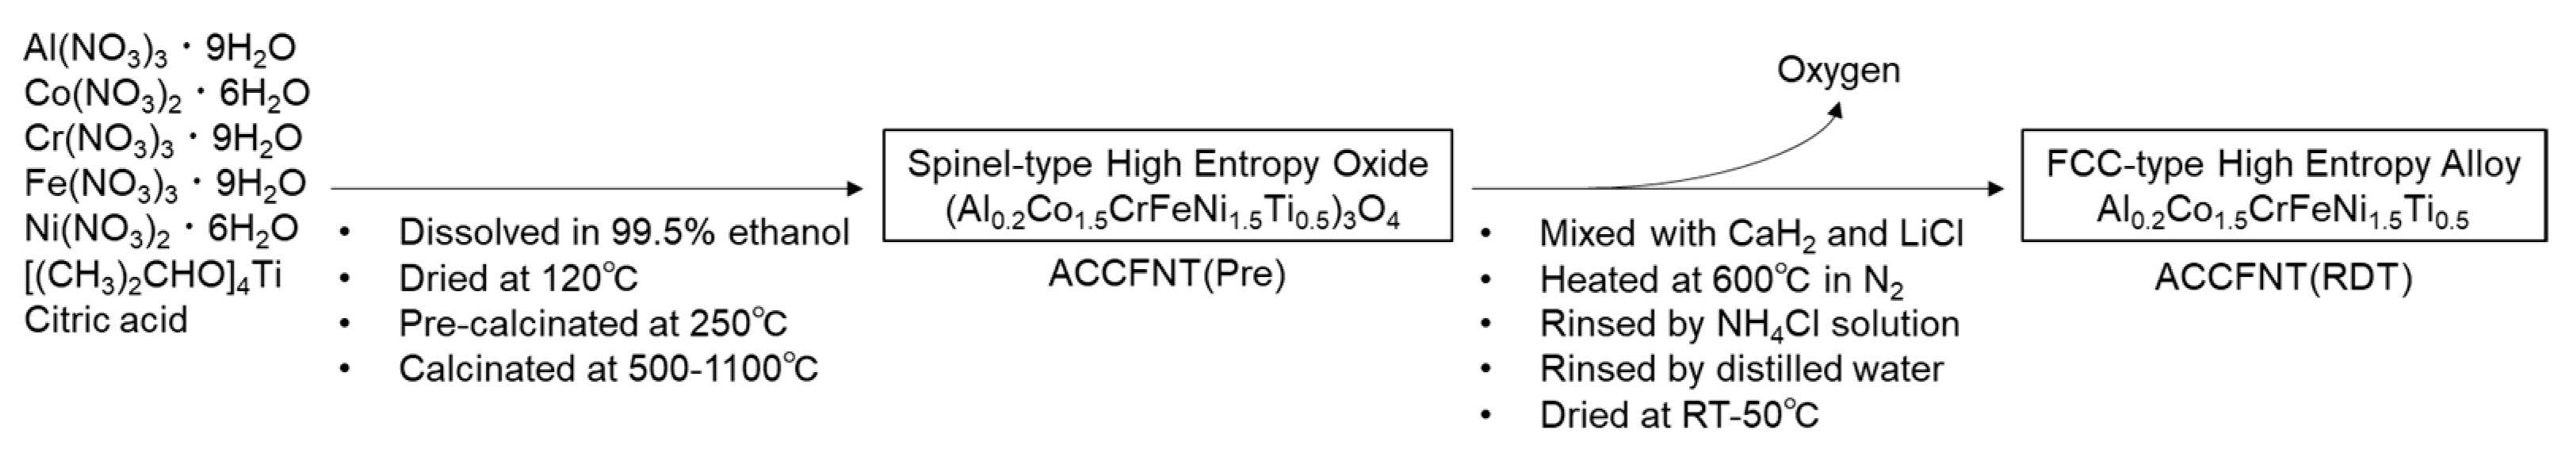
2. Materials and Methods

High-entropy alloy powder of Al0.2Co1.5CrFeNi1.5Ti0.5 was prepared by reducing an oxide precursor in a molten LiCl–CaH2 mixture at 600 °C [34]. Figure 1 describes the preparation procedures. The oxide precursor was prepared using the following sol–gel method with citric acid [35]. First, Al(NO3)3•9H2O (98%, FUJIFILM Wako Pure Chem. Corp., Osaka, Japan), Co(NO3)2•6H2O (98%, FUJIFILM Wako Pure Chem. Corp., Osaka, Japan), Cr(NO3)3•9H2O (98%, Nacalai Tesque, Inc., Kyoto, Japan), Fe(NO3)3•9H2O (99%, FUJIFILM Wako Pure Chem. Corp., Osaka, Japan), Ni(NO3)2•6H2O (99.9%, FUJIFILM Wako Pure Chem. Corp., Osaka, Japan), and [(CH3)2CHO]4Ti (95%, FUJIFILM Wako Pure Chem. Corp., Osaka, Japan) were dissolved in ethanol (99.5%, FUJIFILM Wako Pure Chem. Corp., Osaka, Japan) at the stoichiometric molar ratio for Al0.2Co1.5CrFeNi1.5Ti0.5. Citric acid (98%, FUJIFILM Wako Pure Chem. Corp., Osaka, Japan) was then added to the solution at a salt/citric acid molar ratio of 1.0/1.2. The components were sufficiently mixed and dried at 120 °C overnight. The dried powder was preliminarily heated at 250 °C in air for 2 h and then homogenized by gentle mixing in a mortar. Finally, the powder was heated at 500 °C, 800 °C, or 1100 °C in air for 2 h to obtain the oxide precursor, referred to as ACCFNT(Pre500), ACCFNT(Pre800), and ACCFNT(Pre1100), respectively. Next, ACCFNT(Pre800), CaH2 (JUNSEI Chem. Co., Ltd., Tokyo, Japan), and LiCl (FUJIFILM Wako Pure Chem. Corp., Osaka, Japan) were mixed in a mortar at a Pre/CaH2/LiCl weight ratio of 2/6/3. The mixed powder was placed in a stainless-steel container filled with N2 gas and heated at 600 °C for 2 h. Finally, the reduced precursor was crushed in a mortar and rinsed several times with 0.1 M NH4Cl (FUJIFILM Wako Pure Chem. Corp., Osaka, Japan) aqueous solution and distilled water. The dried final product was named ACCFNT(RDT).
The crystal structure of the prepared samples was examined at room temperature using X-ray diffraction (XRD, MiniFlex 600, Rigaku, Tokyo, Japan) with CuKα radiation at 40 kV and 15 mA. The measurements with a step interval of 0.01° and a scan speed of 10°/min were conducted with ranges of 20°–80° and 30°–100° for the oxide precursors and the reduced sample, respectively. The Brunauer, Emmet, and Teller (BET) surface area was examined using N2 adsorption at −196 °C (BELLSORP mini-II, MicrotracBEL Corp., Osaka, Japan). The samples were pretreated at 150 °C for 60 min under a vacuum in order to remove the water contained in the samples before the measurement. Scanning electron microscopy (SEM, JSM-7400F, JEOL Ltd., Tokyo, Japan) and transmission electron microscopy (TEM, a Tecnai Osiris, FEI system) were used to examine the morphology, and elemental analysis was performed using energy dispersive X-ray spectrometry (EDX).
The catalytic reactions were conducted in 20 mL glass bottles following the previously reported procedures [36]. In the catalytic tests, 1 mL of 4-NP solution (14 mM) was added to a bottle containing 10 mg of catalyst powder, 1 mL of NaBH4 solution (0.42 M), and 7 mL of distilled water as the solvent. To satisfy first-order reaction kinetics, the initial concentration of NaBH4 (0.047 M) was 30 times higher than that of 4-NP (1.6 mM). The reactions were stirred at room temperature until the concentrations reached zero. An aluminum heat sink mounted on a hotplate was used to maintain a constant solution temperature. A small aliquot (100 μL) solution was taken to determine the concentration changes at reaction times of 0.5–50 min. The conversion of 4-NP to p-aminophenol (4-AP) was monitored using an ultraviolet–visible spectrometer (Shimadzu, UV-1280, Kyoto, Japan) using the respective absorbance changes at 401 and 315 nm. The experimental procedures have been routinized to obtain reproducible data. The leaching amounts of constituent elements in the used catalysts after the reactions were analyzed by inductively coupled plasma–atomic emission spectroscopy (ICP–AES) (PS7800, Hitachi Ltd., Tokyo, Japan).

3. Results and Discussion

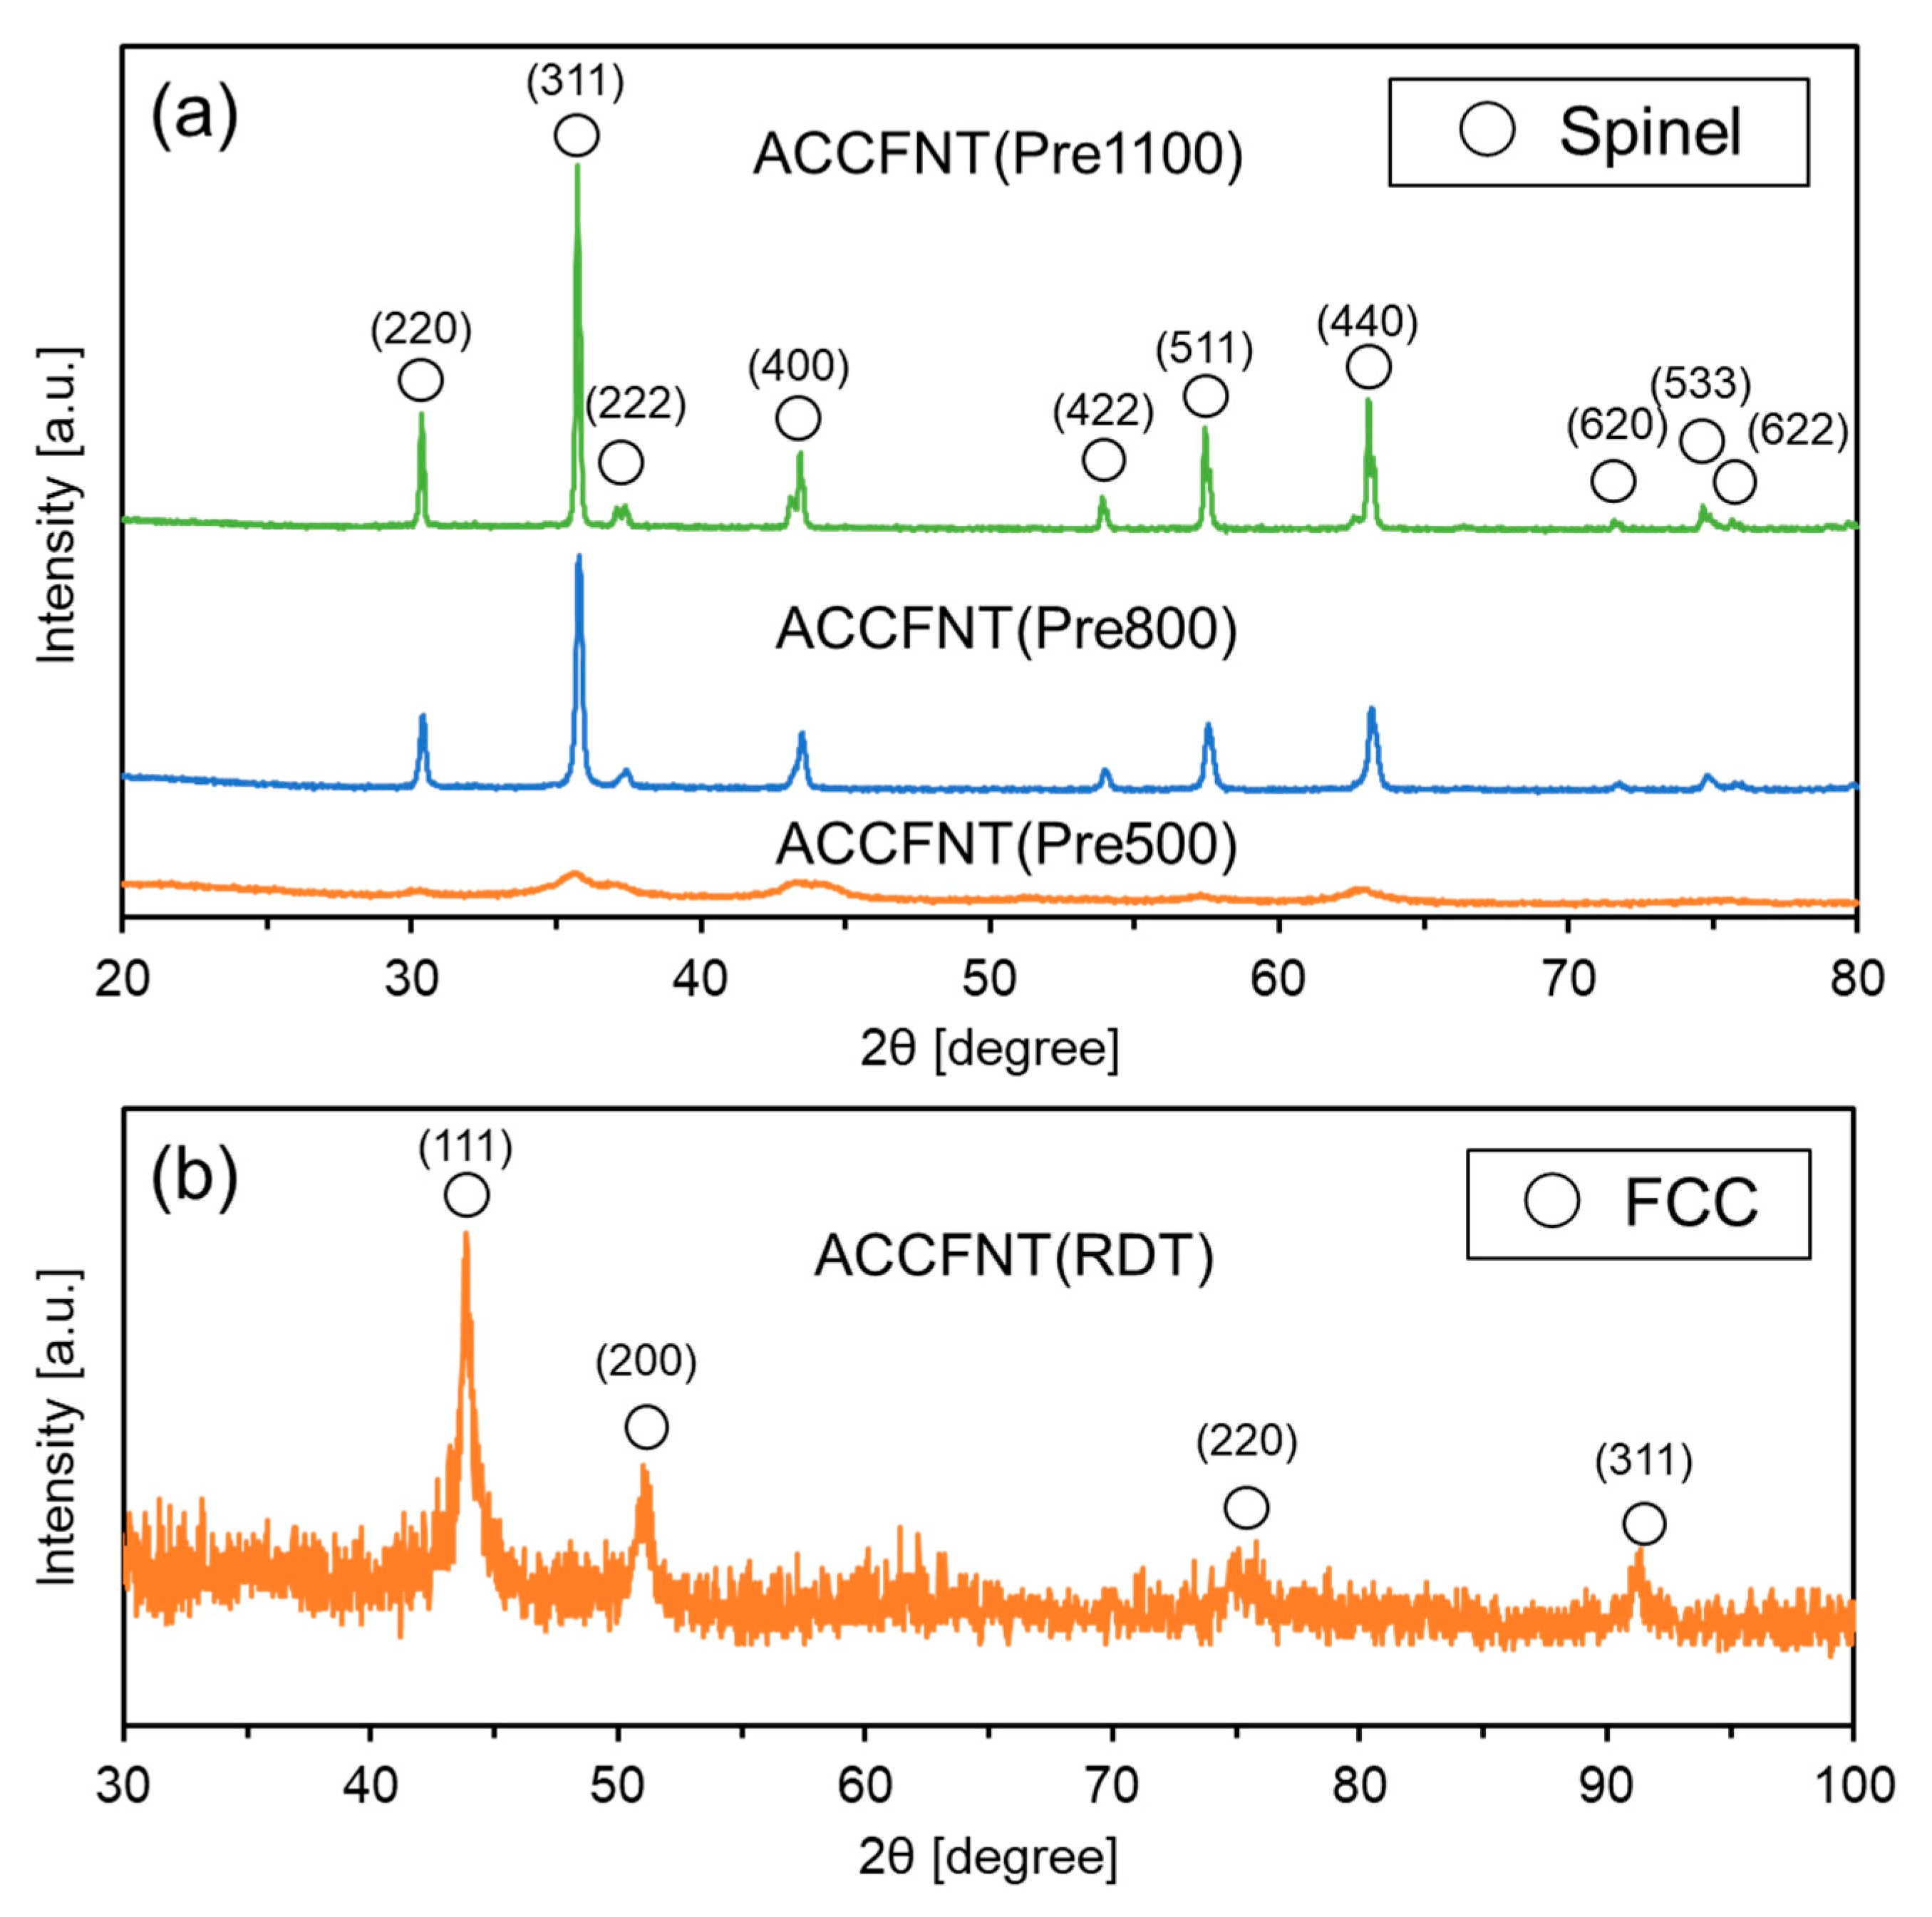
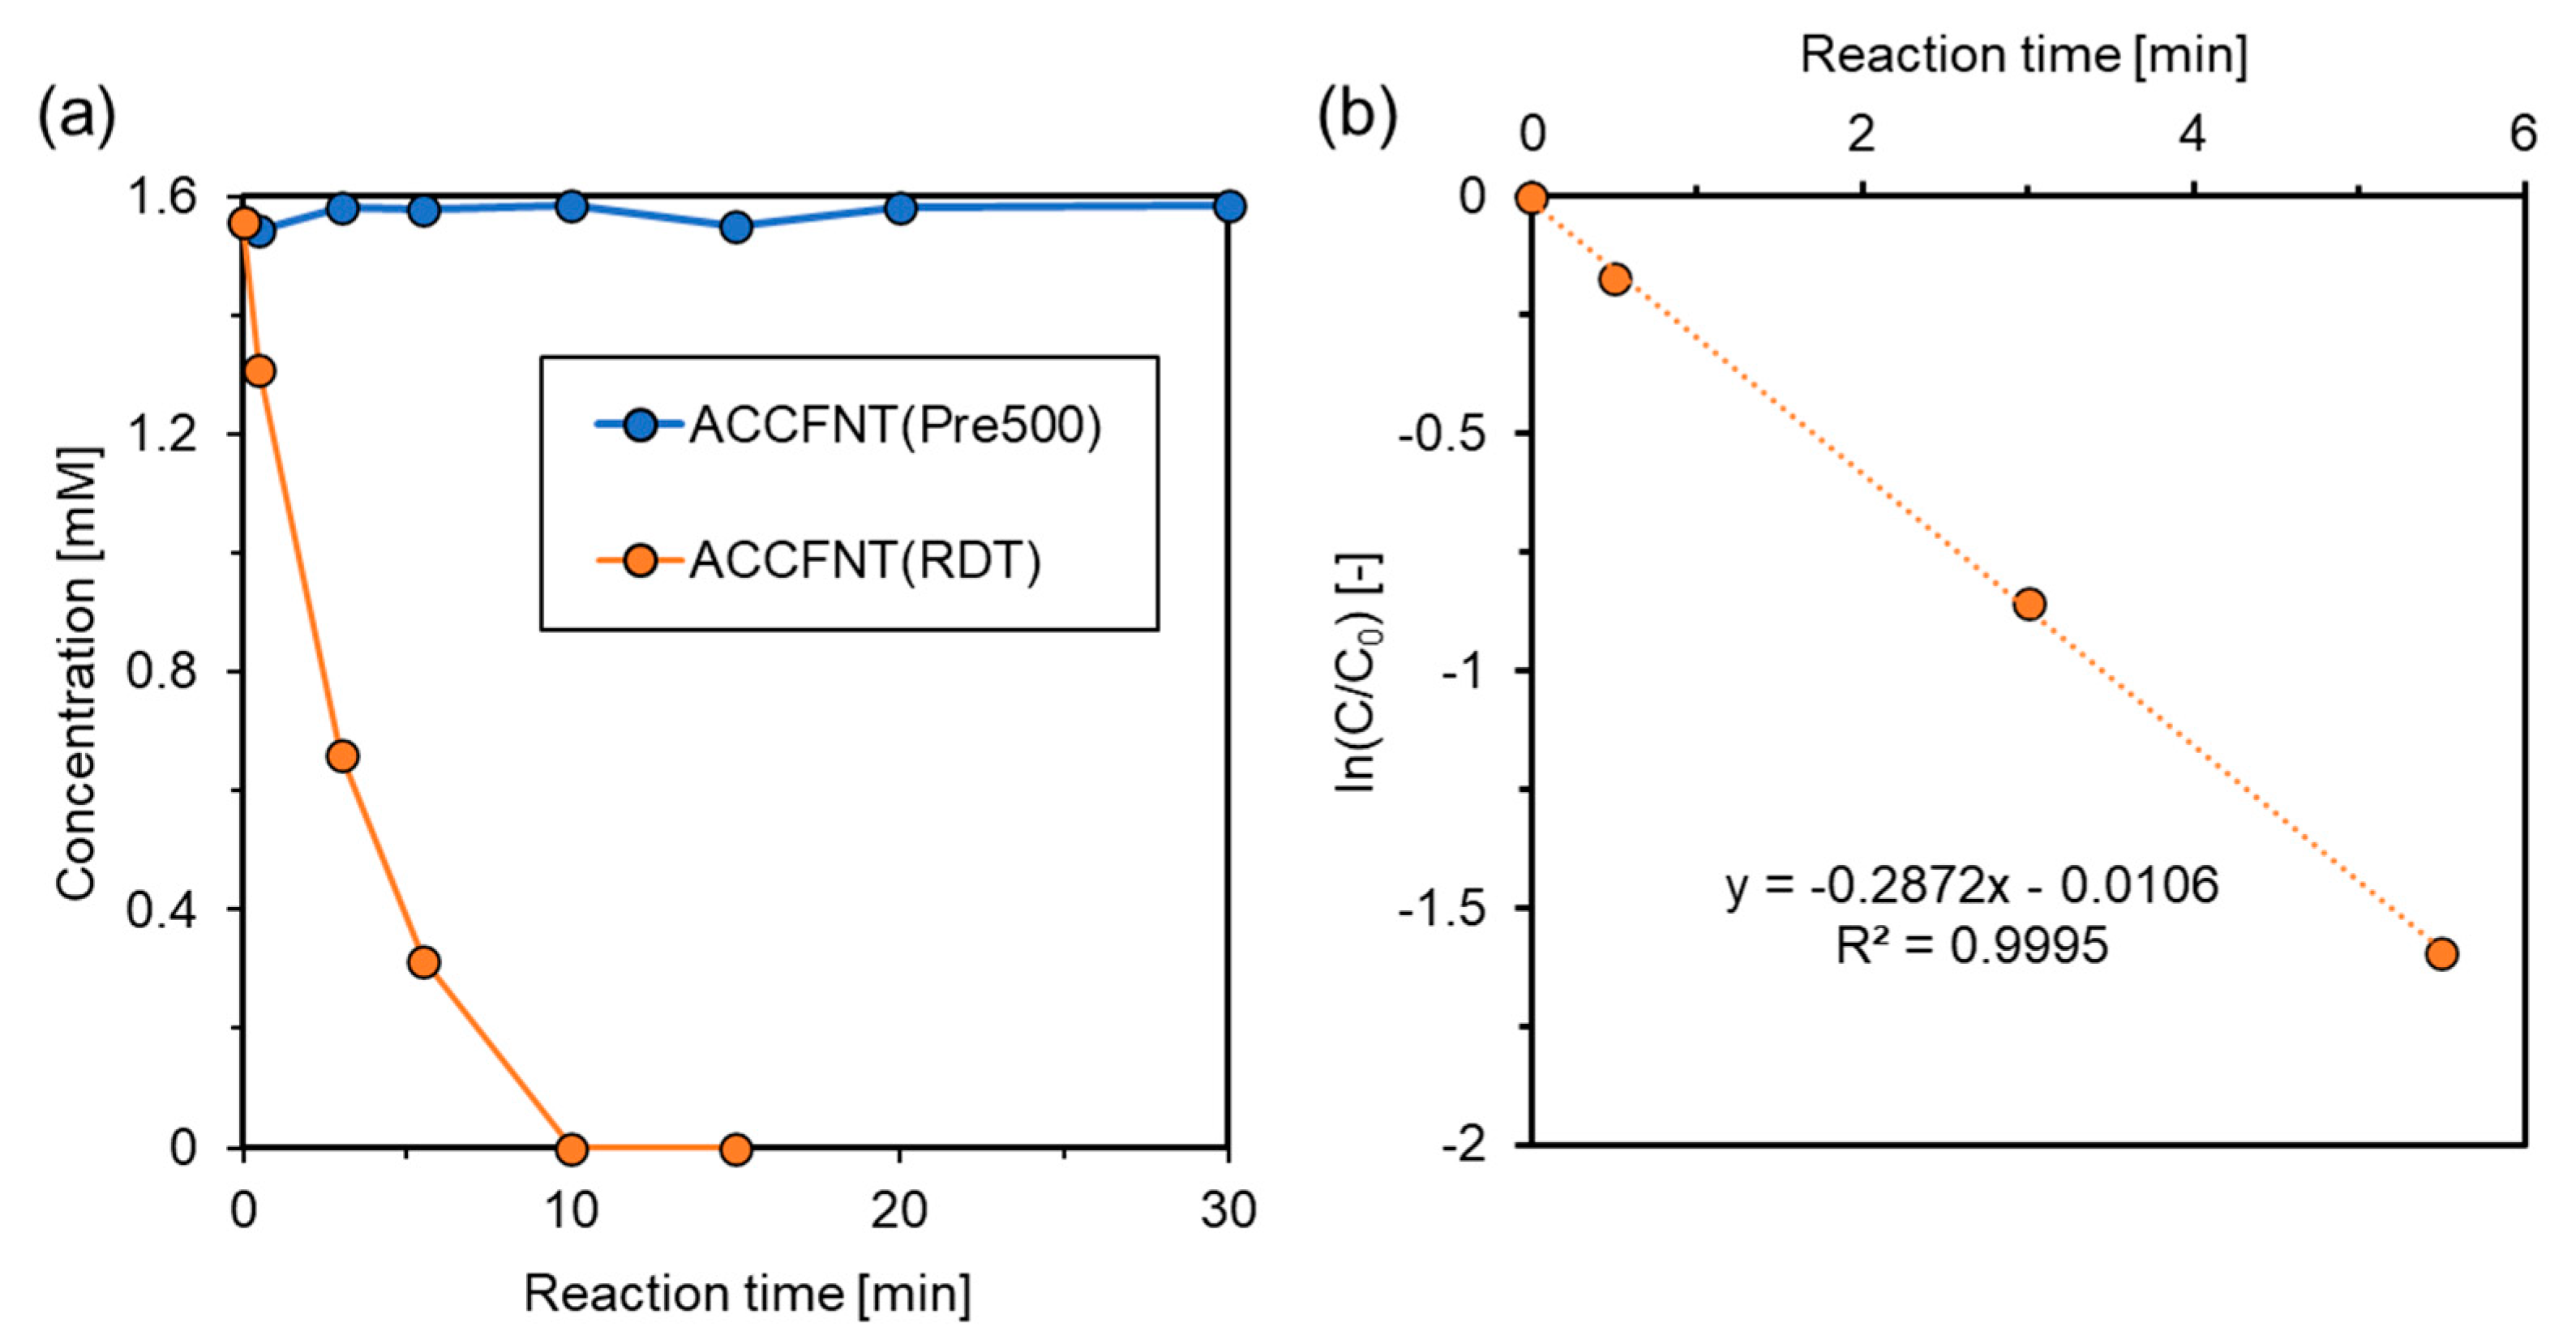
3.1. Sample Preparation and Catalytic Tests

Figure 2a shows XRD patterns of ACCFNT(Pre500), ACCFNT(Pre800), and ACCFNT(Pre1100). Clear peaks were not observed for ACCFNT(Pre500), but very sharp peaks were obtained for ACCFNT(Pre800) and ACCFNT(Pre1100). The peaks were assigned to a single phase of spinel structure, such as Fe3O4. Although the absence of clear peaks was observed for ACCFNT(Pre500), the observed broad peaks were roughly located at the same positions assigned to the spinel structure. The result suggested the formation of poorly crystalline phases in ACCFNT(Pre500). In a previous report, spinel-type HEOs of (Cr0.2Fe0.2Mn0.2Ni0.2Zn0.2)3O4 and (Cr0.2Fe0.2Mn0.2Co0.2Zn0.2)3O4 were prepared by solution combustion synthesis, which is a kind of sol–gel technique using glycine [37]. The sol–gel techniques are a very effective approach to obtain oxides with a good mixture of constituent elements. In this study, we used the same sol–gel technique with citric acid, and thus, the XRD results suggested the formation of a spinel-type HEO (Al0.2Co1.5CrFeNi1.5Ti0.5)3O4. Several spinel-type HEOs have been previously reported [38], but as far as we searched for, the HEO (Al0.2Co1.5CrFeNi1.5Ti0.5)3O4 could be reported for the first time in this work. Figure 2b shows XRD patterns of ACCFNT(RDT) obtained by deoxidizing ACCFNT(Pre800) at 600 °C. The peaks observed in ACCFNT(Pre800) disappeared, and instead, peaks assigned to an FCC structure were newly observed for ACCFNT(RDT). No other peaks were visible, thus indicating the formation of HEA Al0.2Co1.5CrFeNi1.5Ti0.5.
Next, catalytic tests were performed with ACCFNT(Pre500) and ACCFNT(RDT) to evaluate the catalytic performances in the hydrogenation of 4-NP to 4-AP with NaBH4 at room temperature. Figure 3a shows the concentration (C) changes of 4-NP as functions of reaction times with ACCFNT(Pre500) and ACCFNT(RDT). For ACCFNT(Pre500), the concentration changed little during the reaction time, indicating that ACCFNT(Pre500) showed no catalytic activity. For ACCFNT(RDT), the concentration quickly decreased and reached zero after 10 min. Figure 3b is a plot of ln(C/C0) as a function of reaction time for ACCFNT(RDT). A good linearity was obtained from the plot in order to acquire a reaction rate constant of 0.2872 min−1. Table 1 shows the leached amounts of constituent elements into the reaction solutions after the reactions for ACCFNT(Pre500) and ACCFNT(RDT). As the results of the ICP measurements show, the leached amounts were very small. The maximum leached amount of 1.163 ppm Cr was observed for ACCFNT(Pre500), whereas the amounts were below 0.03 ppm of any metals for ACCFNT(RDT). Thus, the results indicated that ACCFNT(RDT) was a very stable alloy catalyst available in the liquid-phase hydrogenation reaction. Table 2 summarizes the rate constants (k) of this work and previous works for comparison. Because the reaction conditions used are different for each research group, quantitative comparison is difficult. For comparison between our previous works where the same reaction conditions were employed as the condition of this study, ACCFNT(RDT) gave the highest rate constant of 0.2872 min−1. One of the main reasons for the high catalytic performance of ACCFNT(RDT) was due to its high BET surface area of 92 m2/g. Since ACCFNT(Pre500) with 20 m2/g showed no catalytic activity, the superior catalytic performance observed in ACCFNT(RDT) could not result only from the high surface area but also from the chemical states of surface elements. Since it was considered from the XRD results that ACCFNT(Pre500) and ACCFNT(RDT) had oxide and alloy states, respectively, the surface alloy species composed of Al, Co, Cr, Fe, Ni, and Ti could be active species in ACCFNT(RDT).

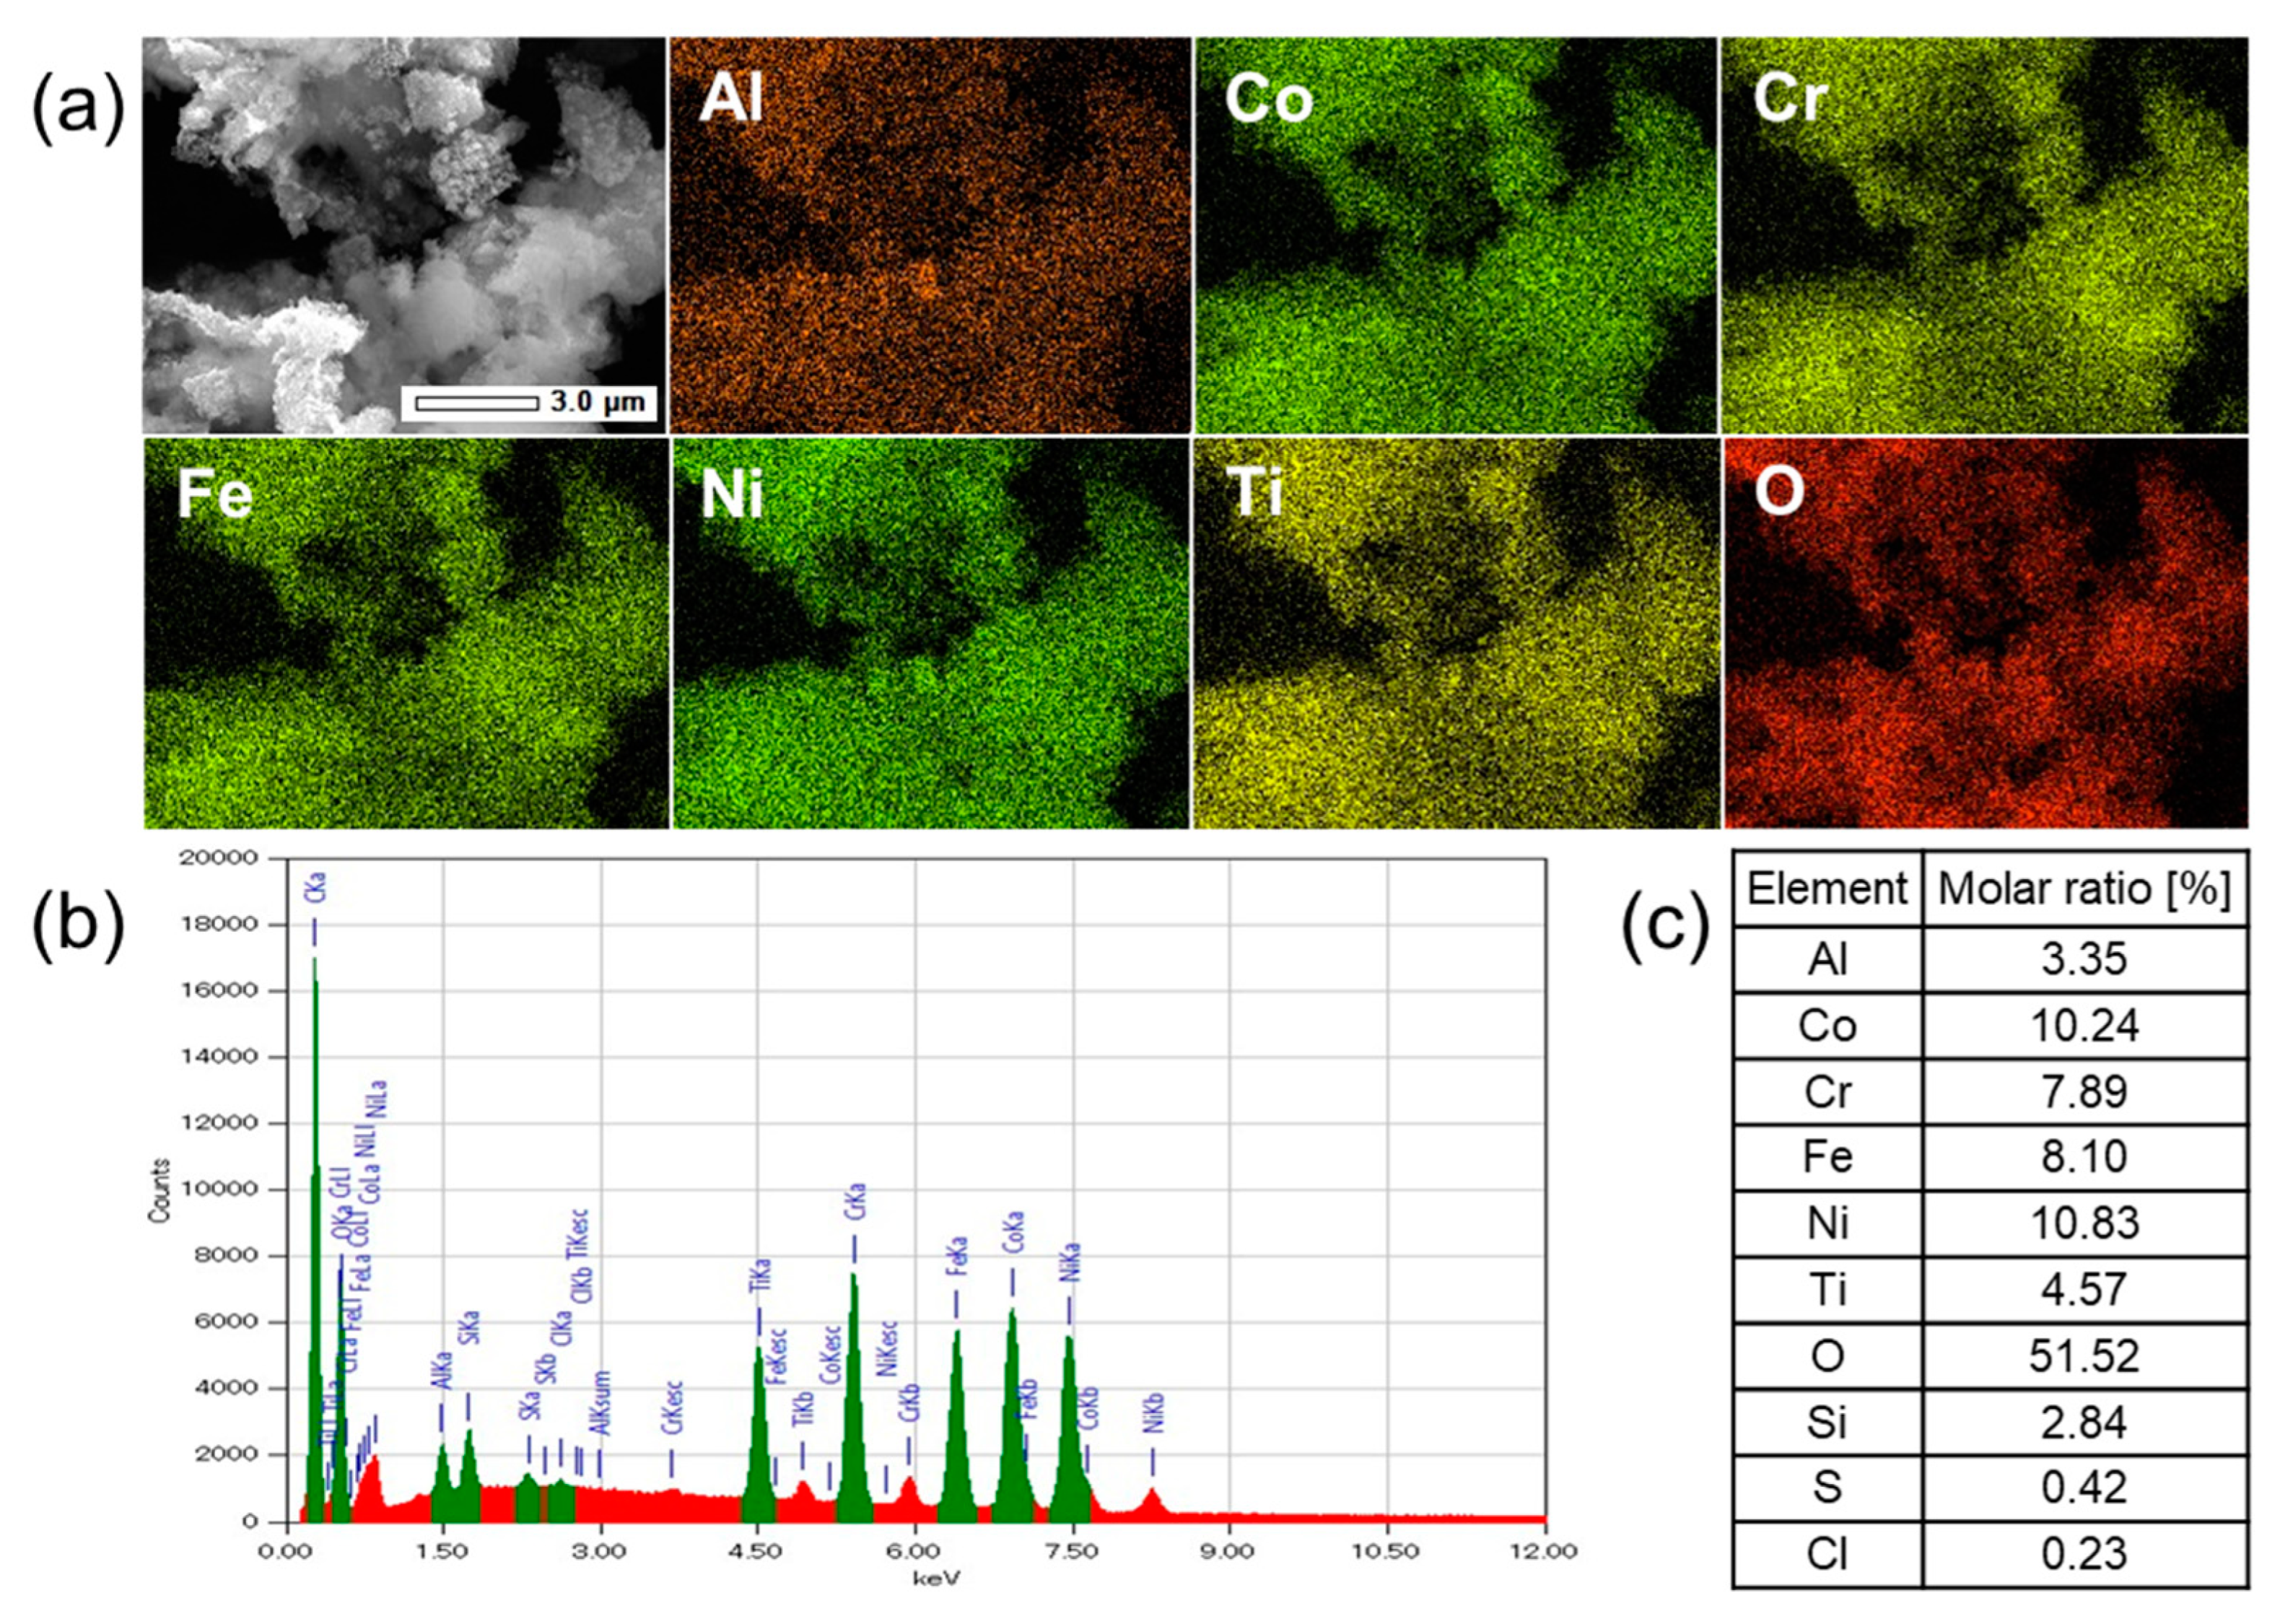
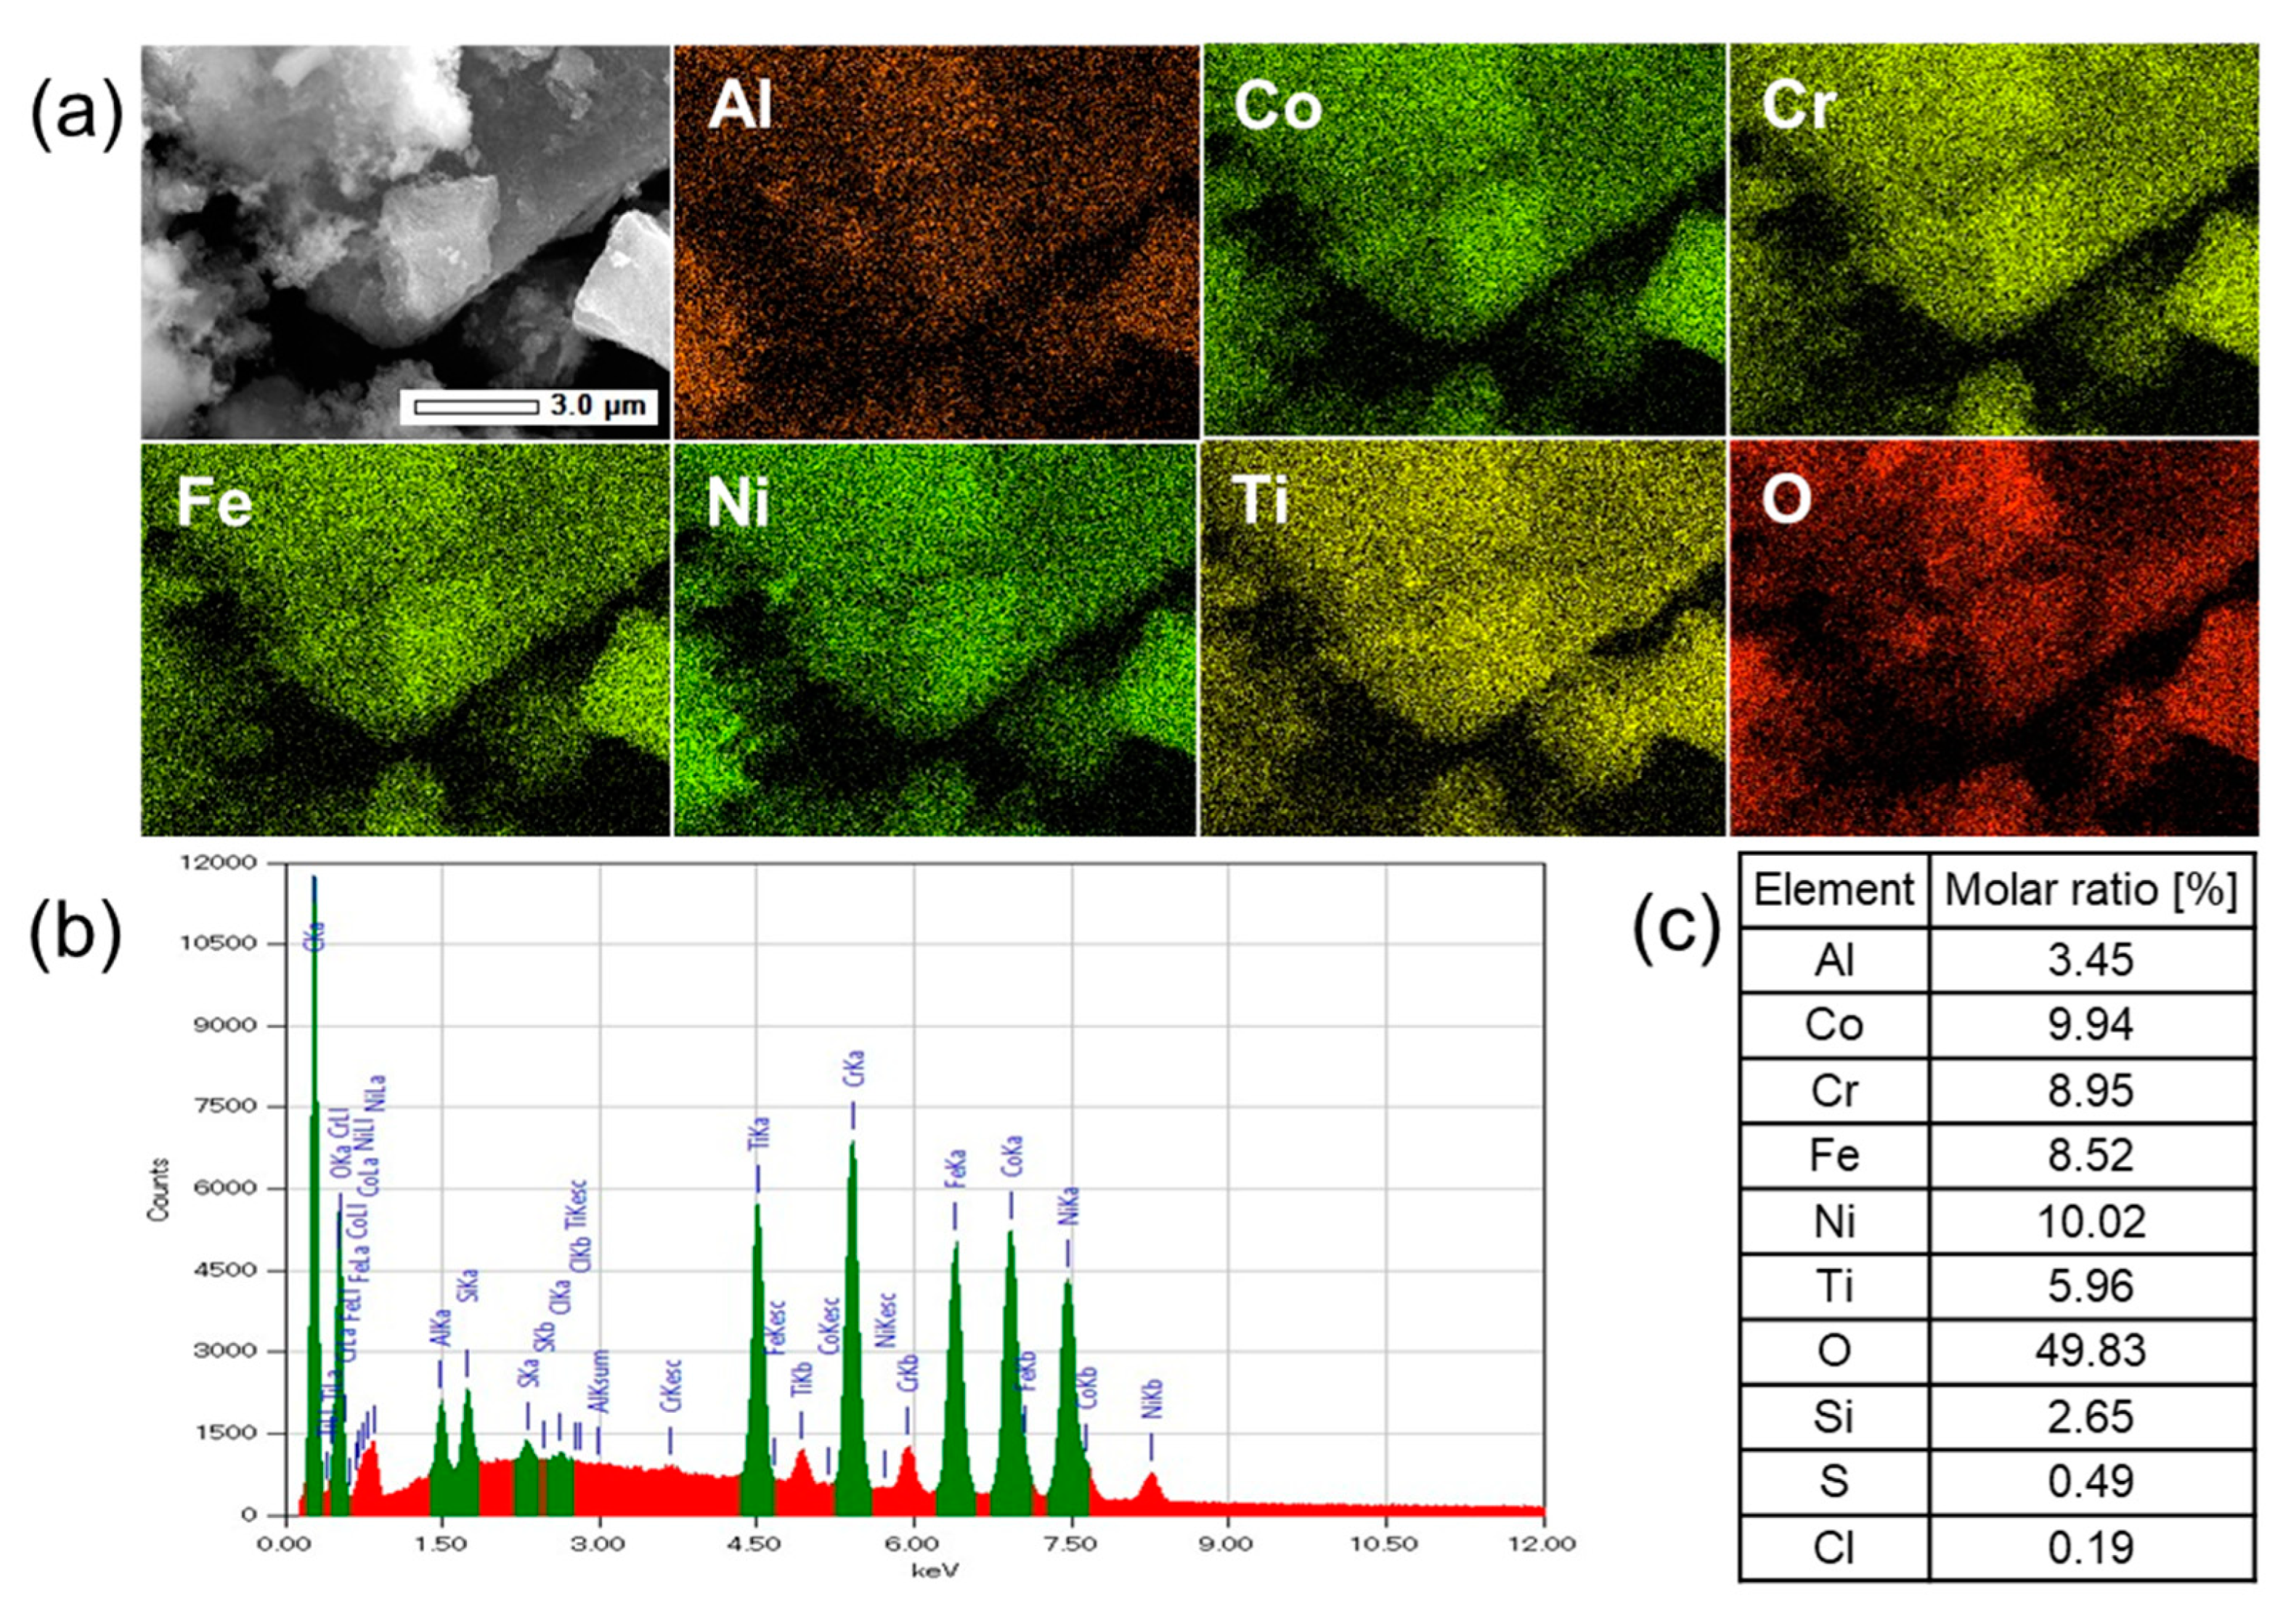
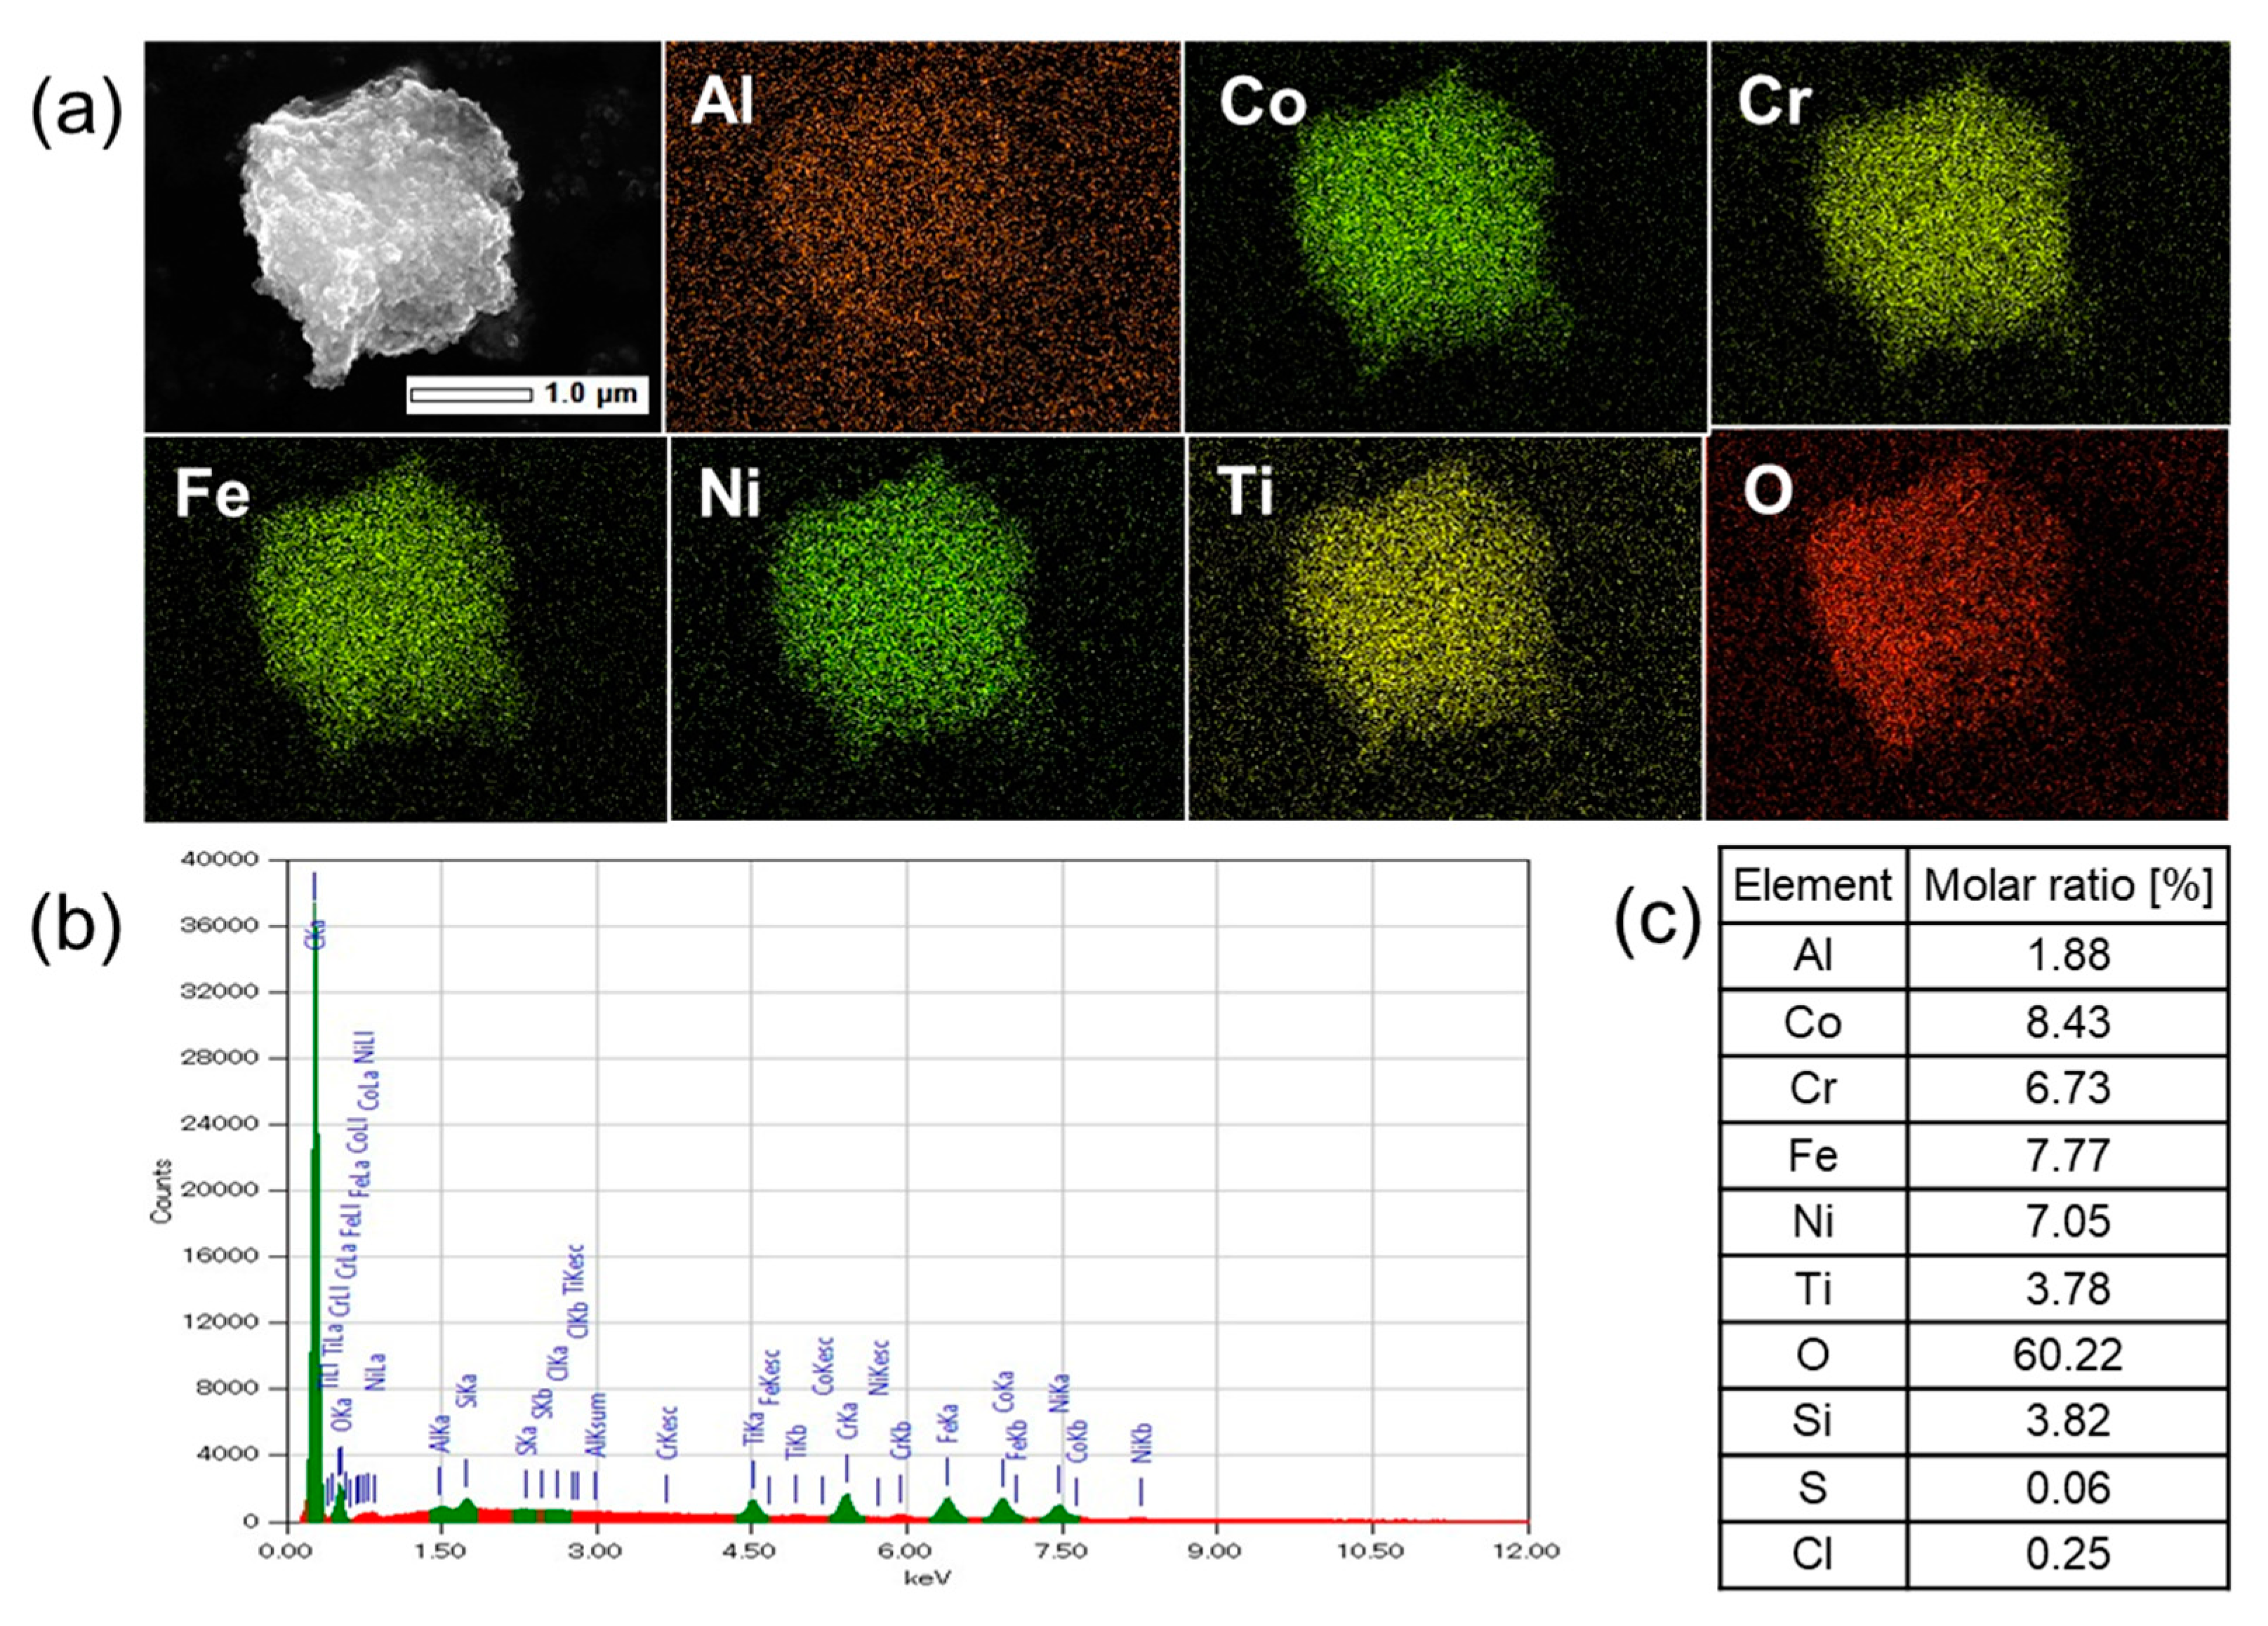
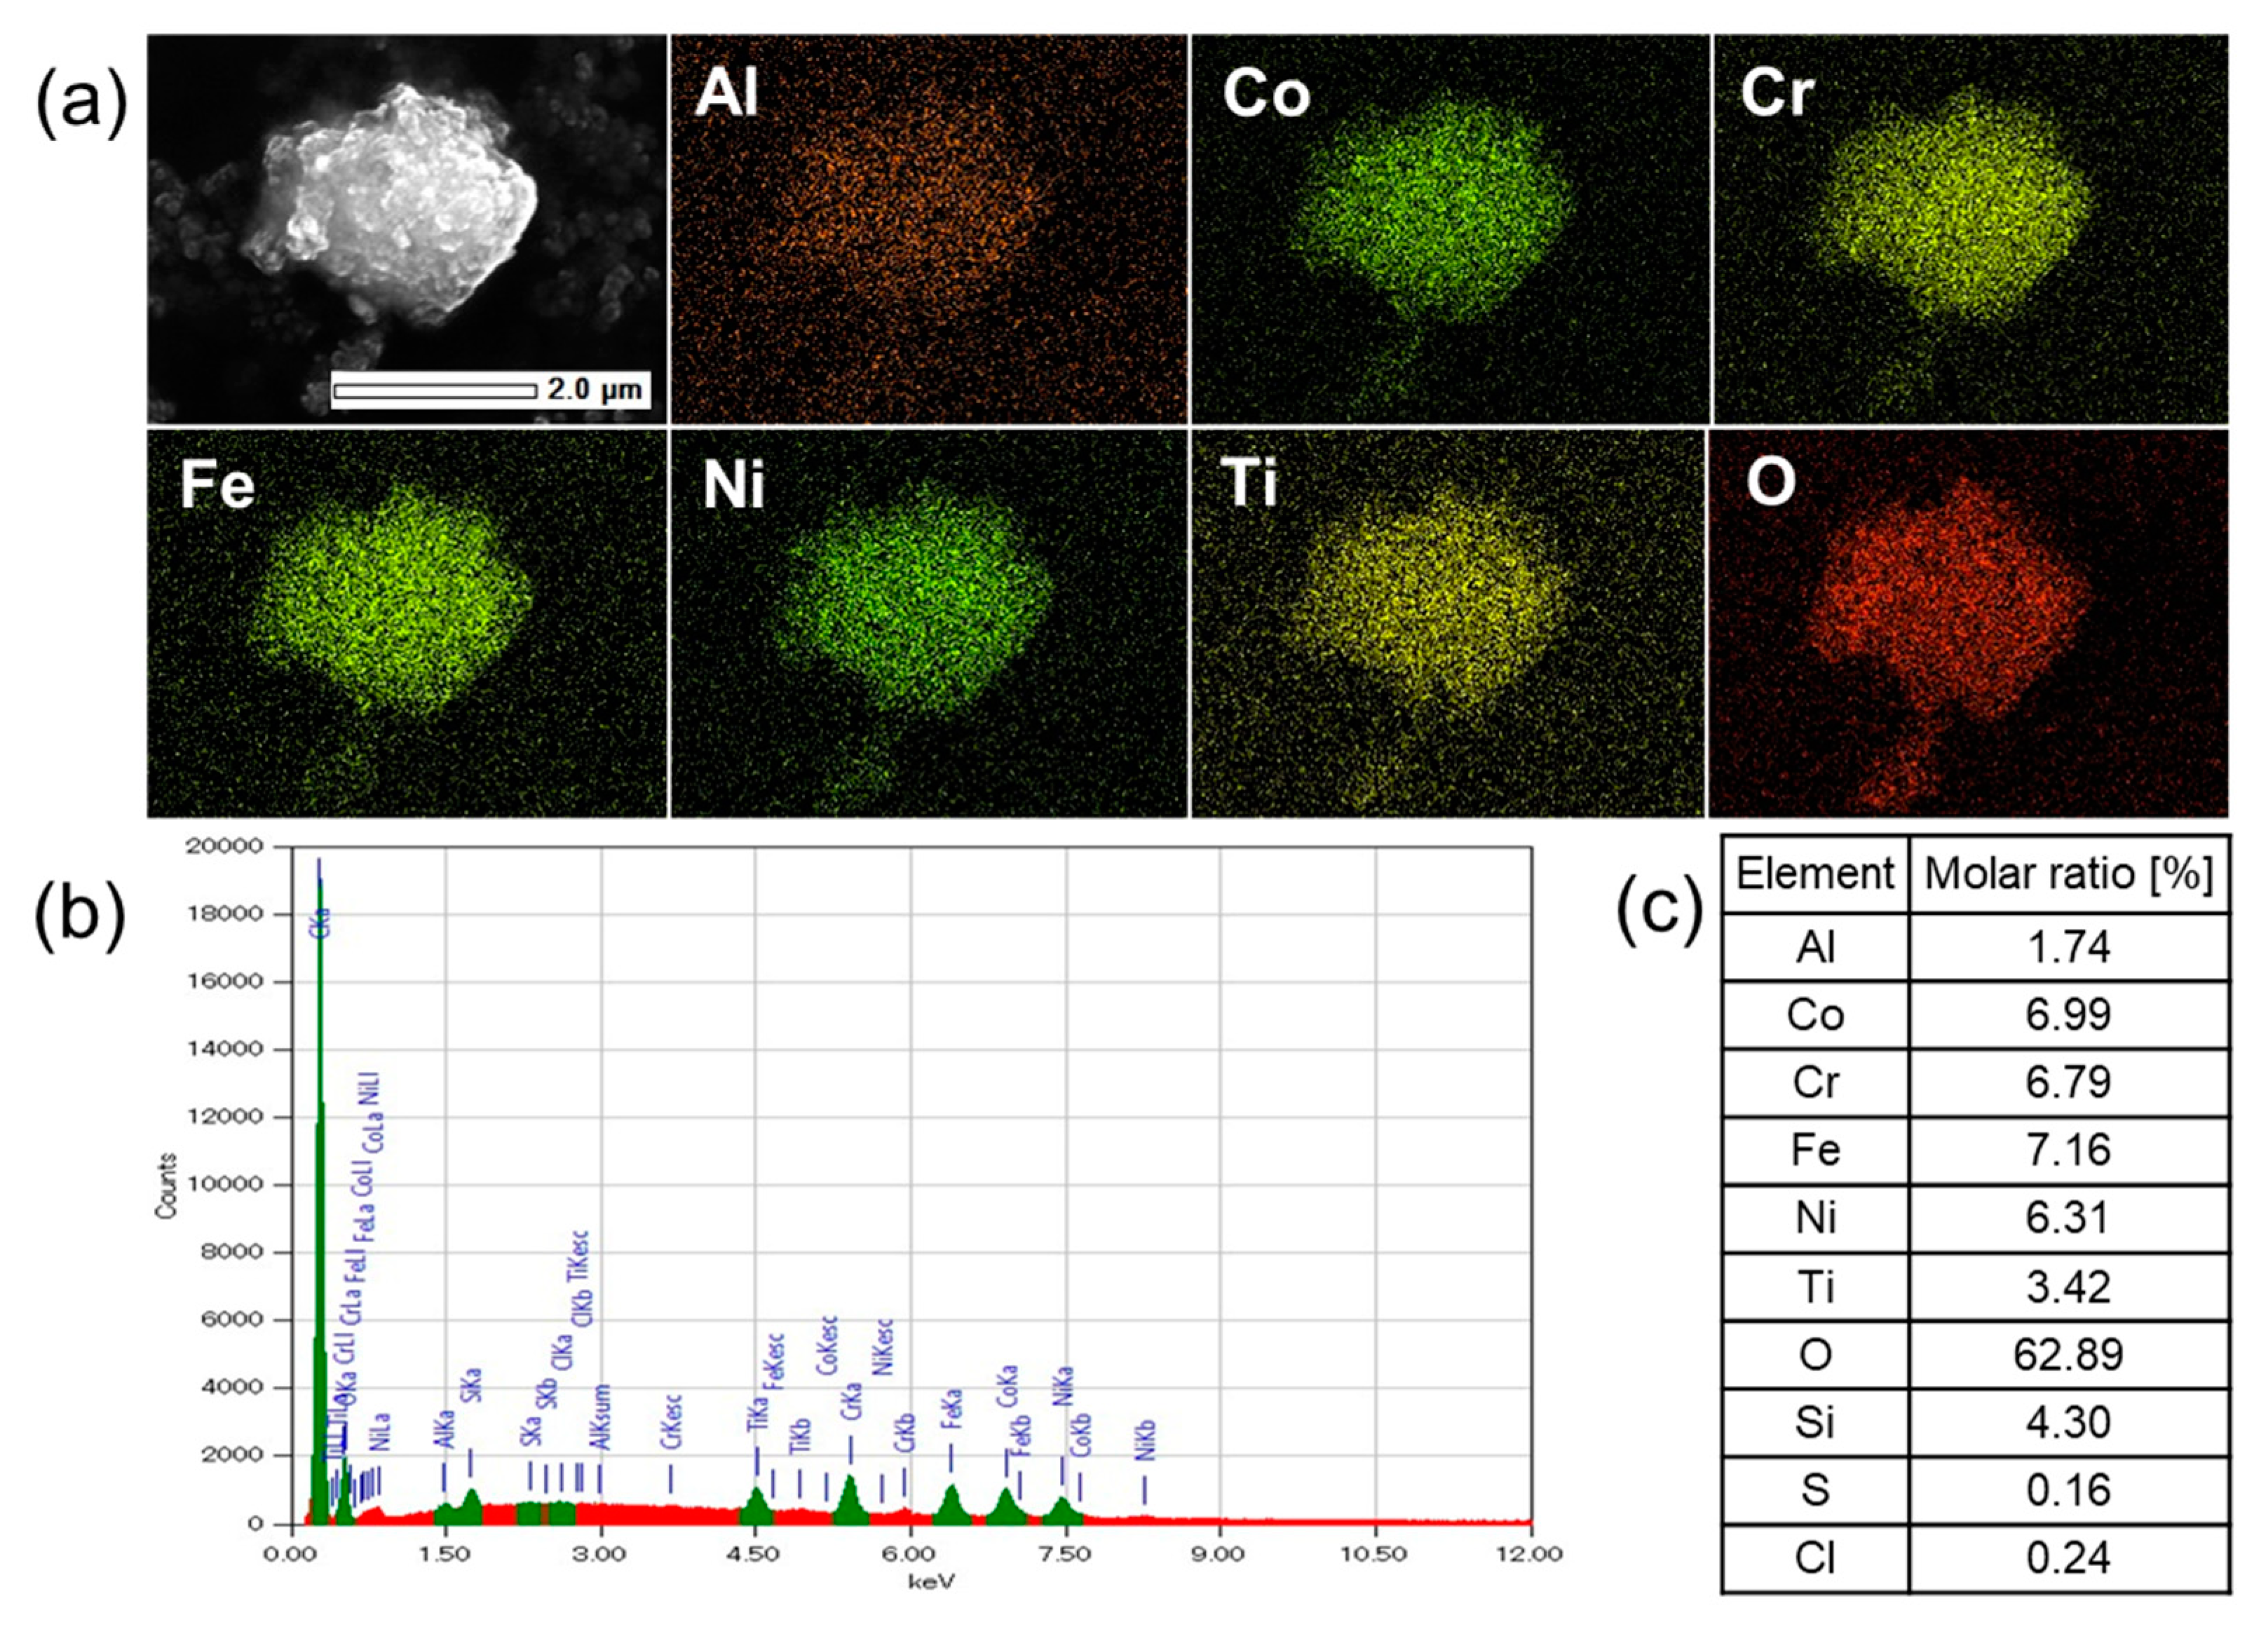
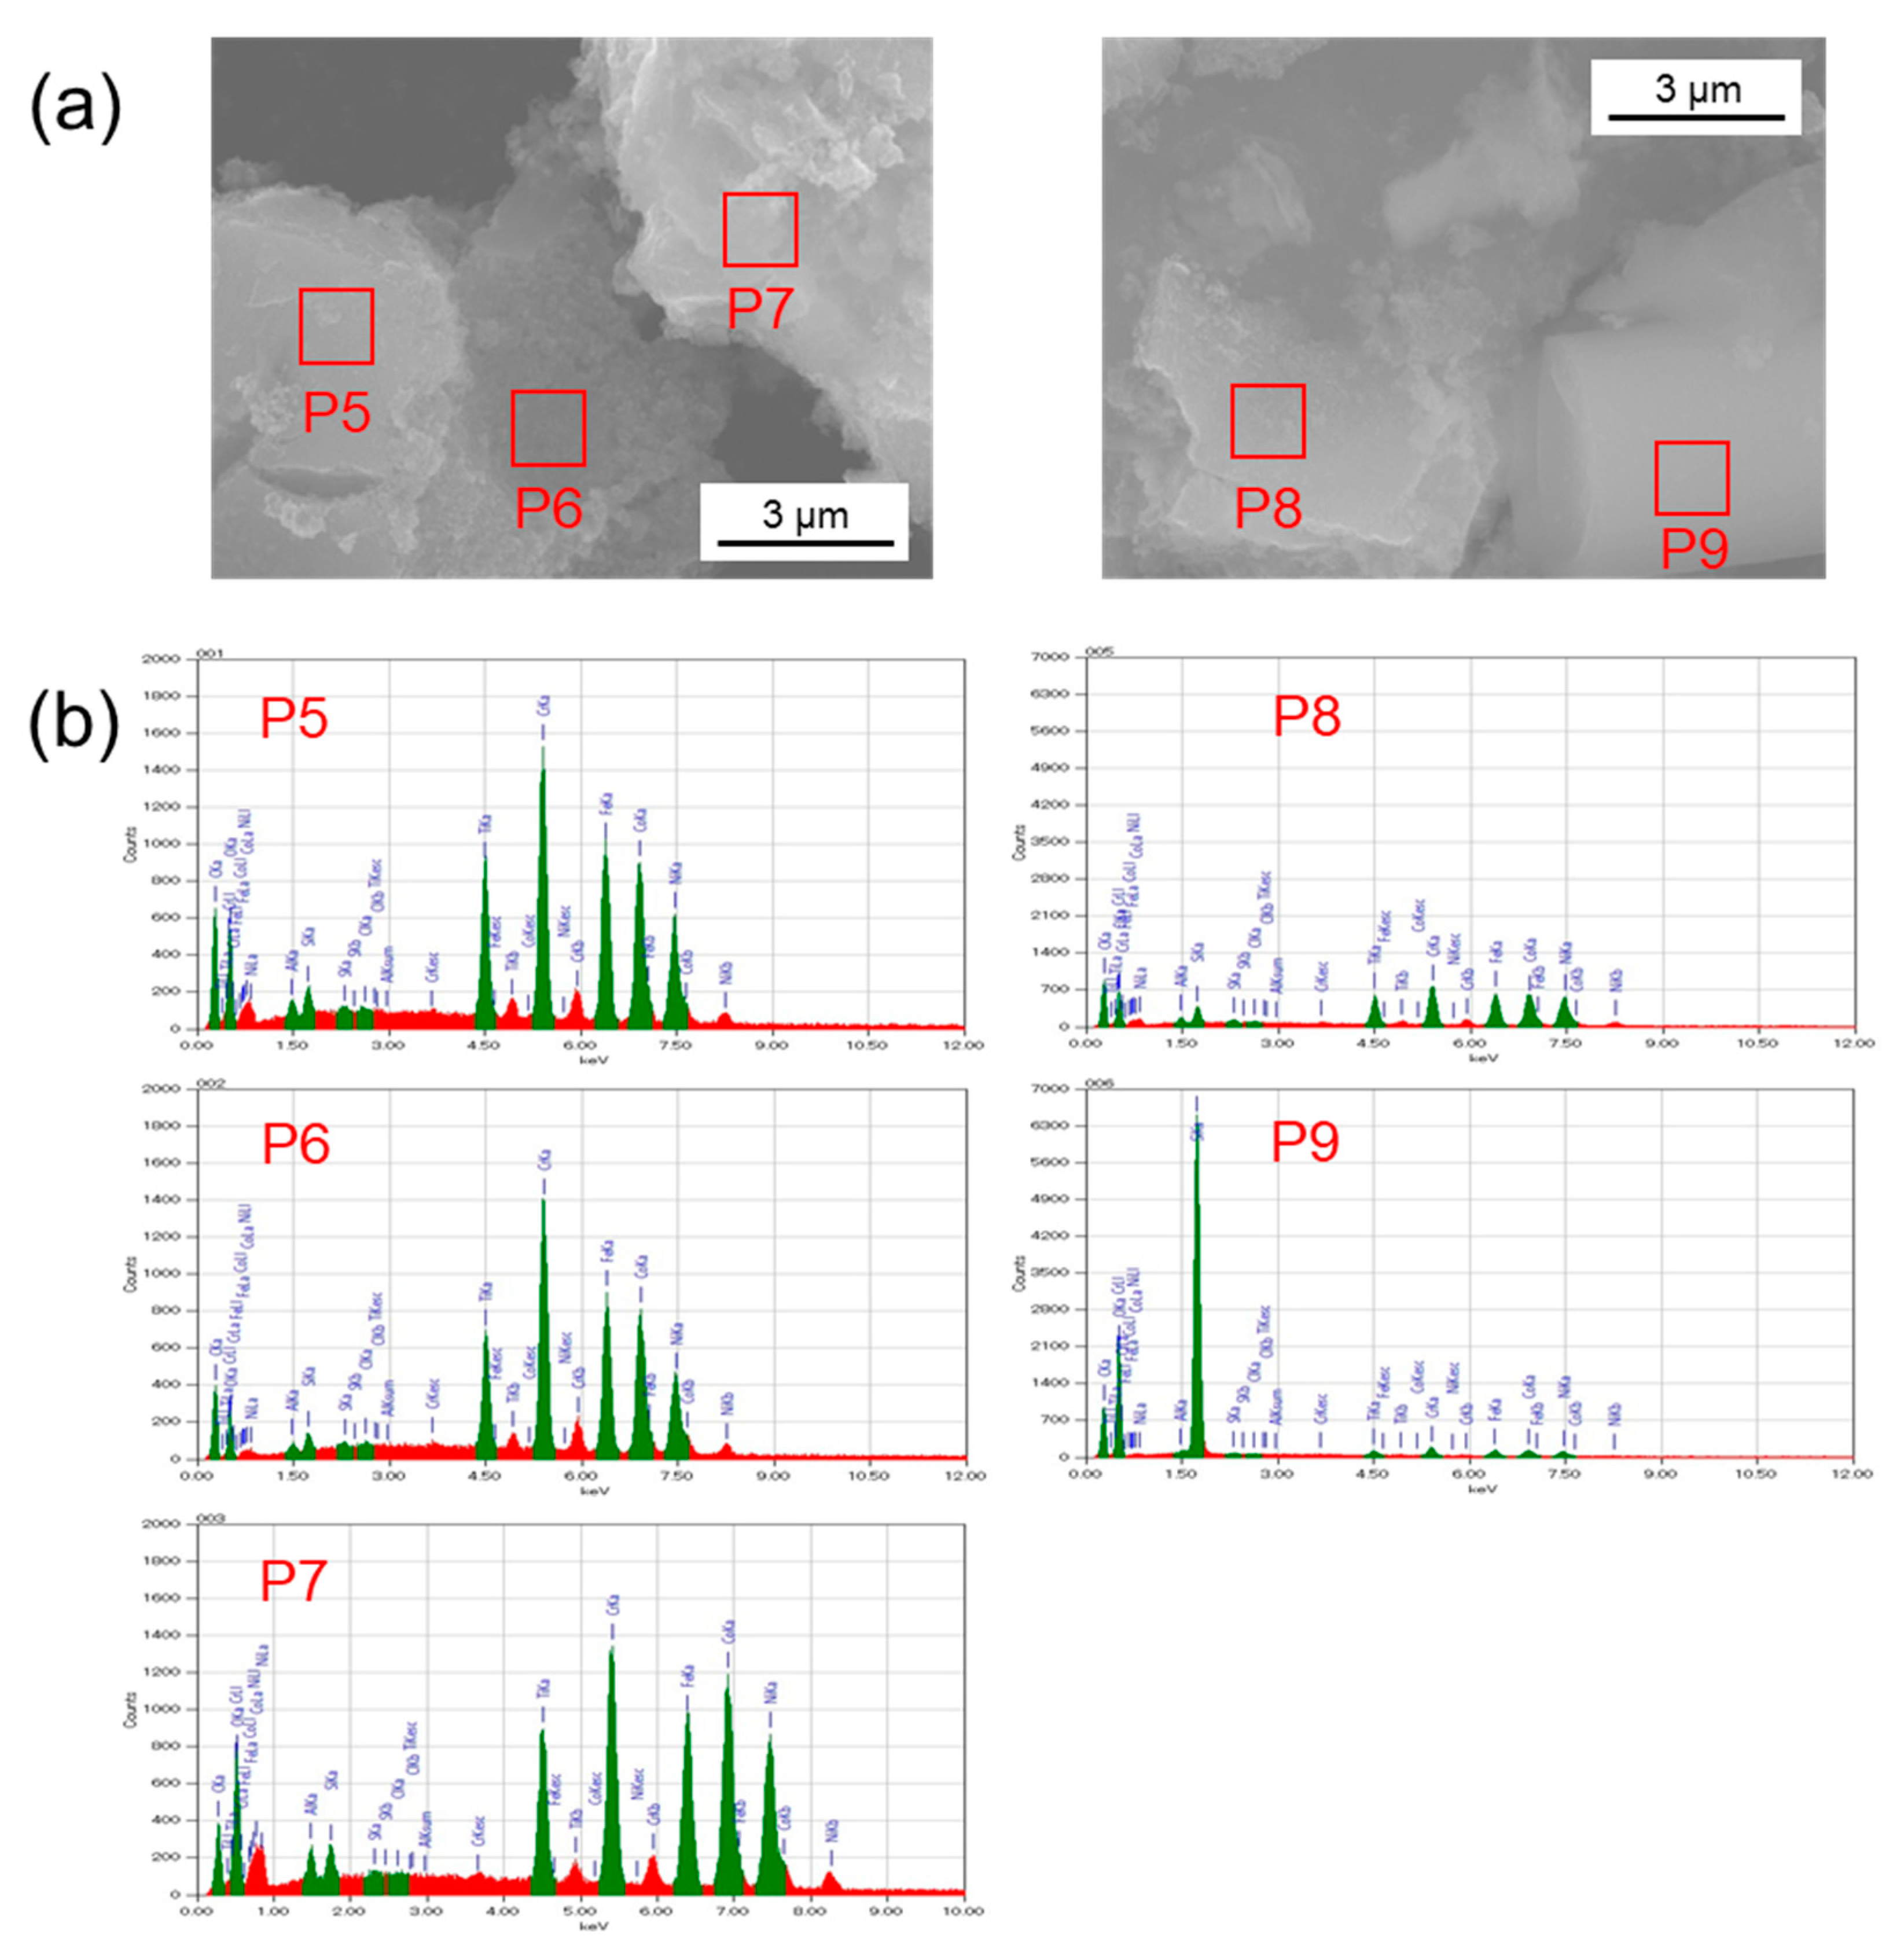
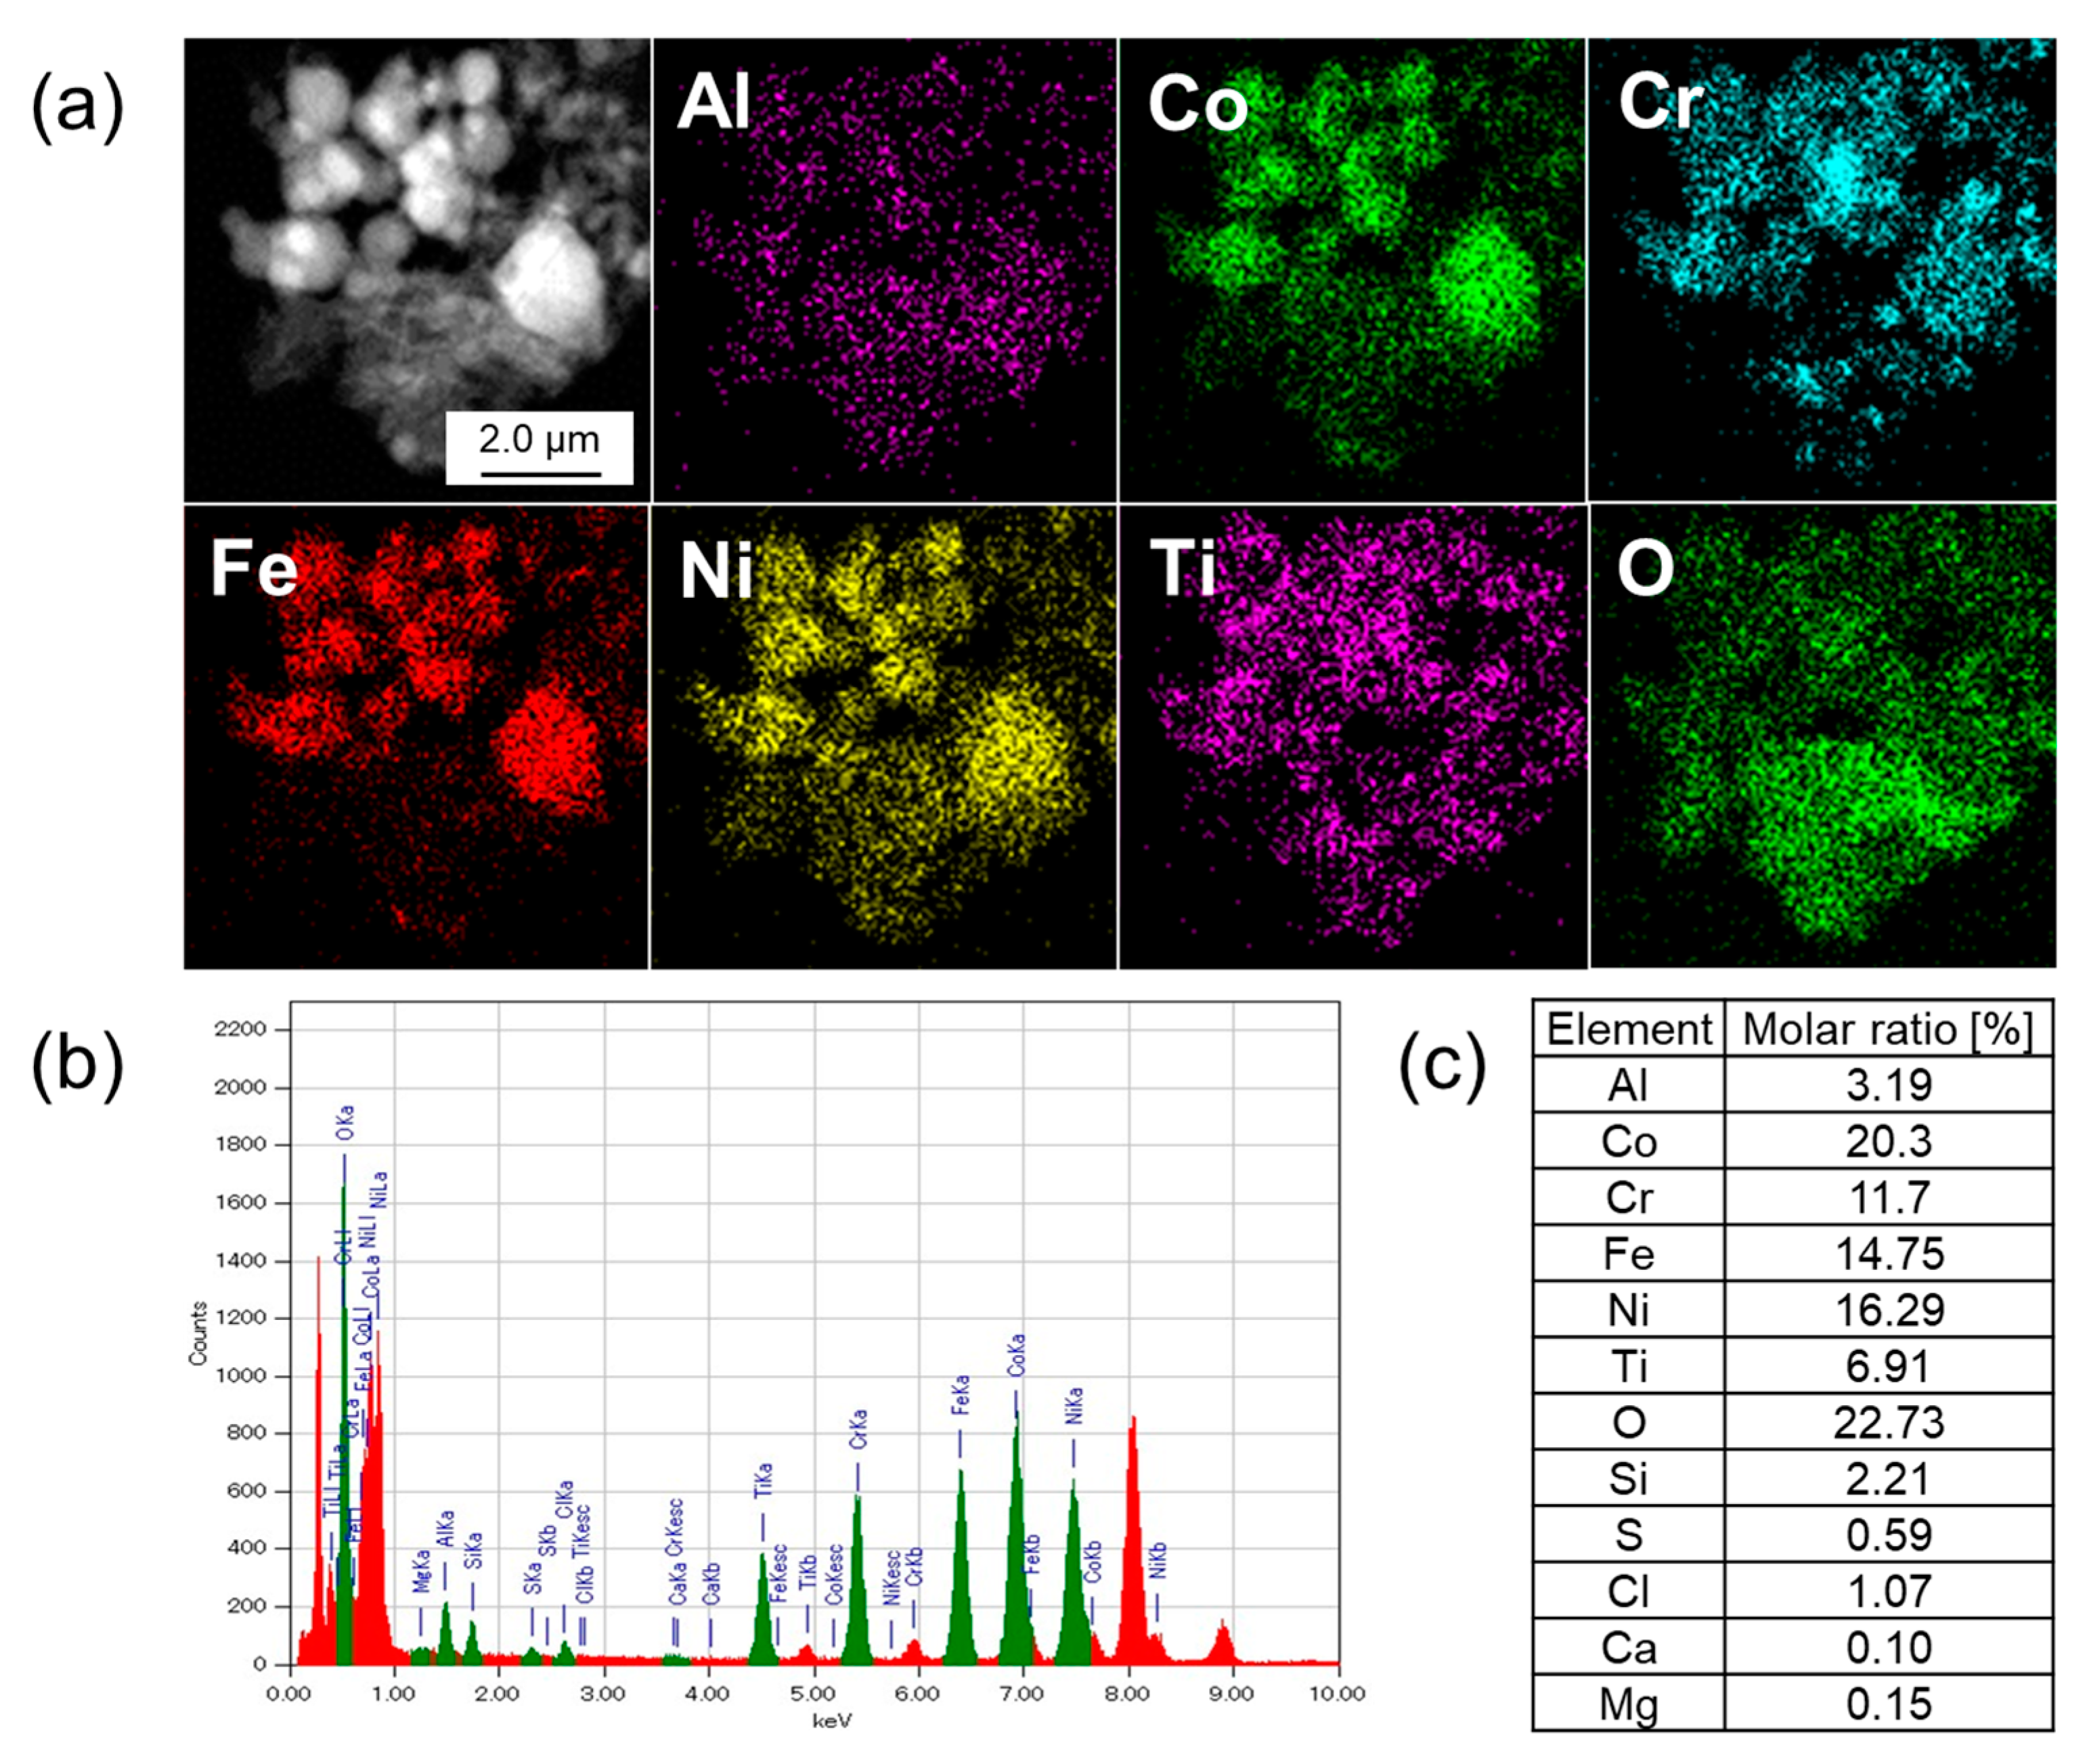
3.2. Elemental Analysis by SEM-EDX

According to the results of XRD measurements, ACCFNT(RDT) had a single-phase spinel structure, and so it was suggested that ACCFNT(RDT) had a good mixture of constituent elements of Al, Co, Cr, Fe, Ni, and Ti. In order to confirm the homogeneity in micron-sized and nano-sized ranges, elemental analyses were performed for ACCFNT(RDT) by SEM-EDX and TEM-EDX, respectively. Figure 4 shows the SEM images of ACCFNT(RDT). The images indicated that ACCFNT(RDT) was composed of bulky pieces of uneven size. Figure 5, Figure 6, Figure 7, Figure 8 and Figure 9 show the results of elemental analyses conducted on nine different positions for ACCFNT(RDT). Figure 10 is a figure summarizing the elemental distributions measured at nine positions. Table 3 summarizes the detected molar ratios of Al, Co, Cr, Fe, Ni, and Ti at nine positions, with average and stoichiometric ratios. For all the positions, oxygen molar ratios were quite large and ranged over 20–60 mol%. Since any peaks assigned to oxides, especially to the spinel structure, were not observed by XRD for ACCFNT(RDT), it was suggested that ACCFNT(RDT) would contain amorphous oxide due to an incomplete deoxidation, resulting in a mixture of oxide and alloy in ACCFNT(RDT). According to the oxygen distributions in the elemental mappings in Figure 5, Figure 6, Figure 7 and Figure 8, oxygen was distributed evenly over the samples, so the oxide and alloy were not separated but coexisted in the micron-sized range. The constituent elements of Al, Co, Cr, Fe, Ni, and Ti were vastly distributed over the samples in the elemental mappings in Figure 5, Figure 6, Figure 7 and Figure 8. In addition, a good overlap of the elements was clearly observed. Figure 10 indicated that the differences in molar ratios of each element of Al, Co, Cr, Fe, Ni, and Ti were small over the different positions and a good homogeneous distribution of the constituent elements close to the stoichiometric molar ratio of HEA Al0.2Co1.5CrFeNi1.5Ti0.5 was obtained in the micron-sized range by SEM-EDX. Except for oxygen and the constituent elements of Al, Co, Cr, Fe, Ni, and Ti, the detected elements were Si, S, and Cl. The amounts of S and Cl were very scarce. The amount of Si was relatively large and may have been unintentionally incorporated from the reactor in the deoxidation process.

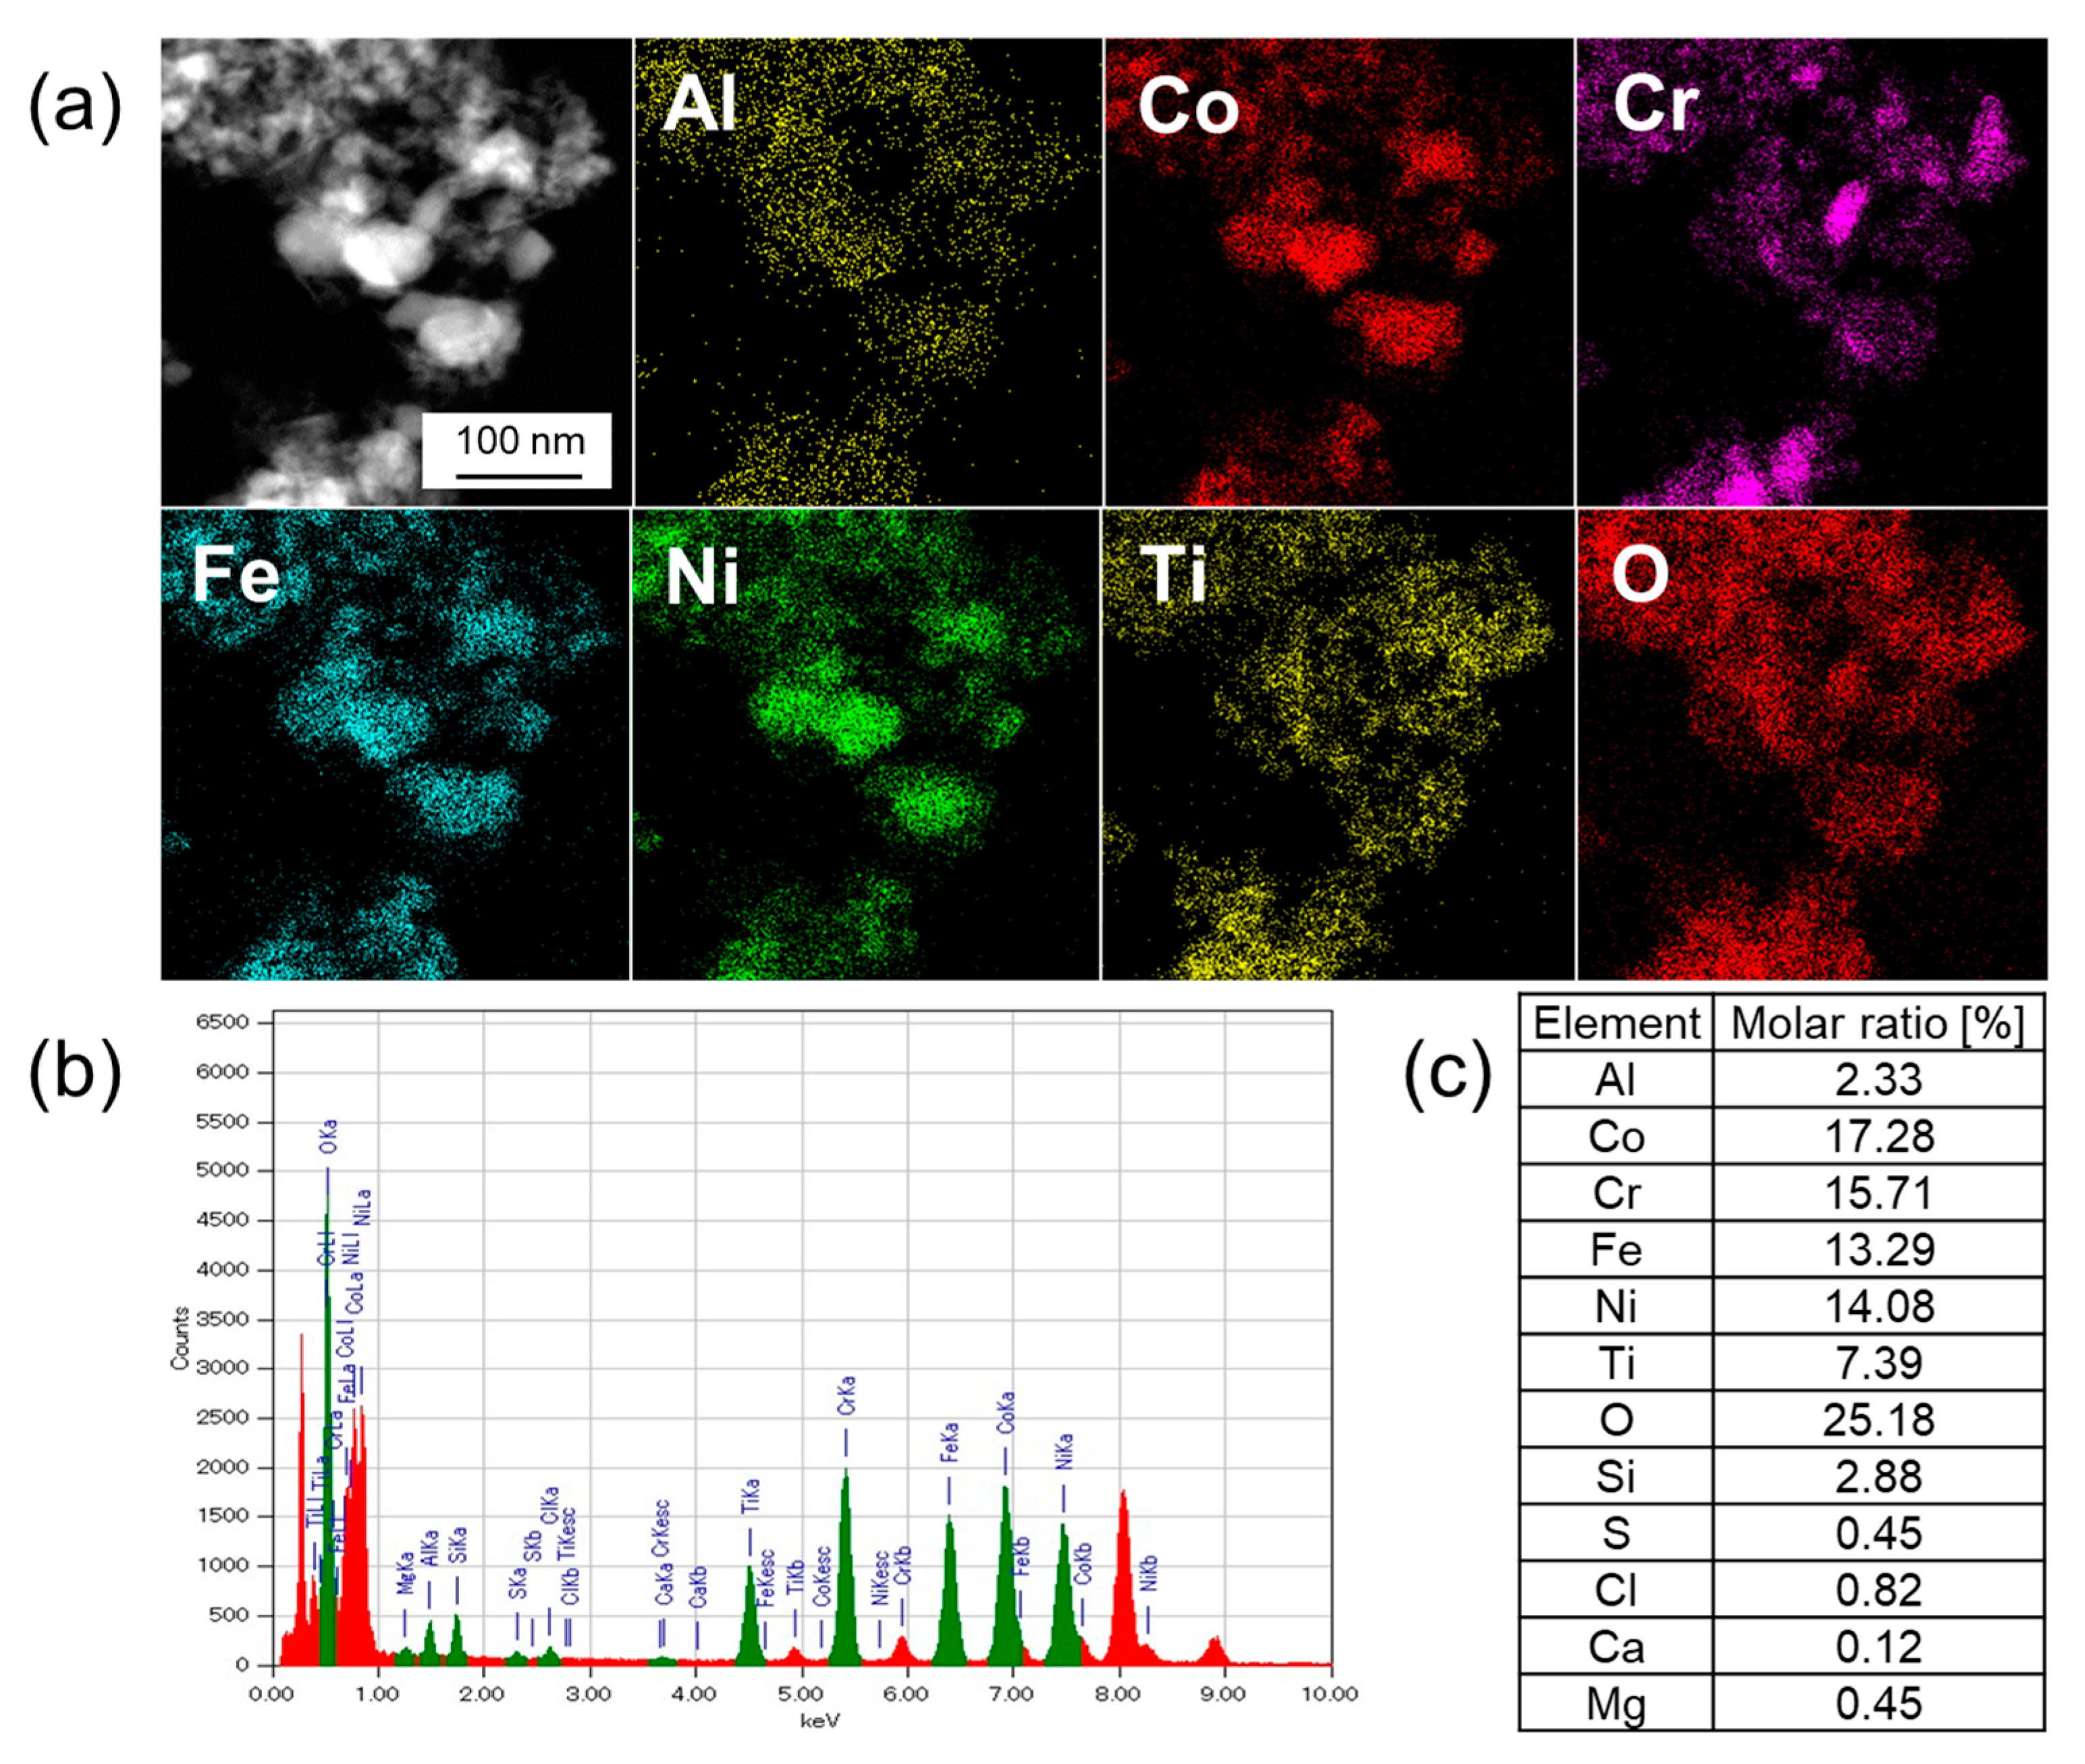
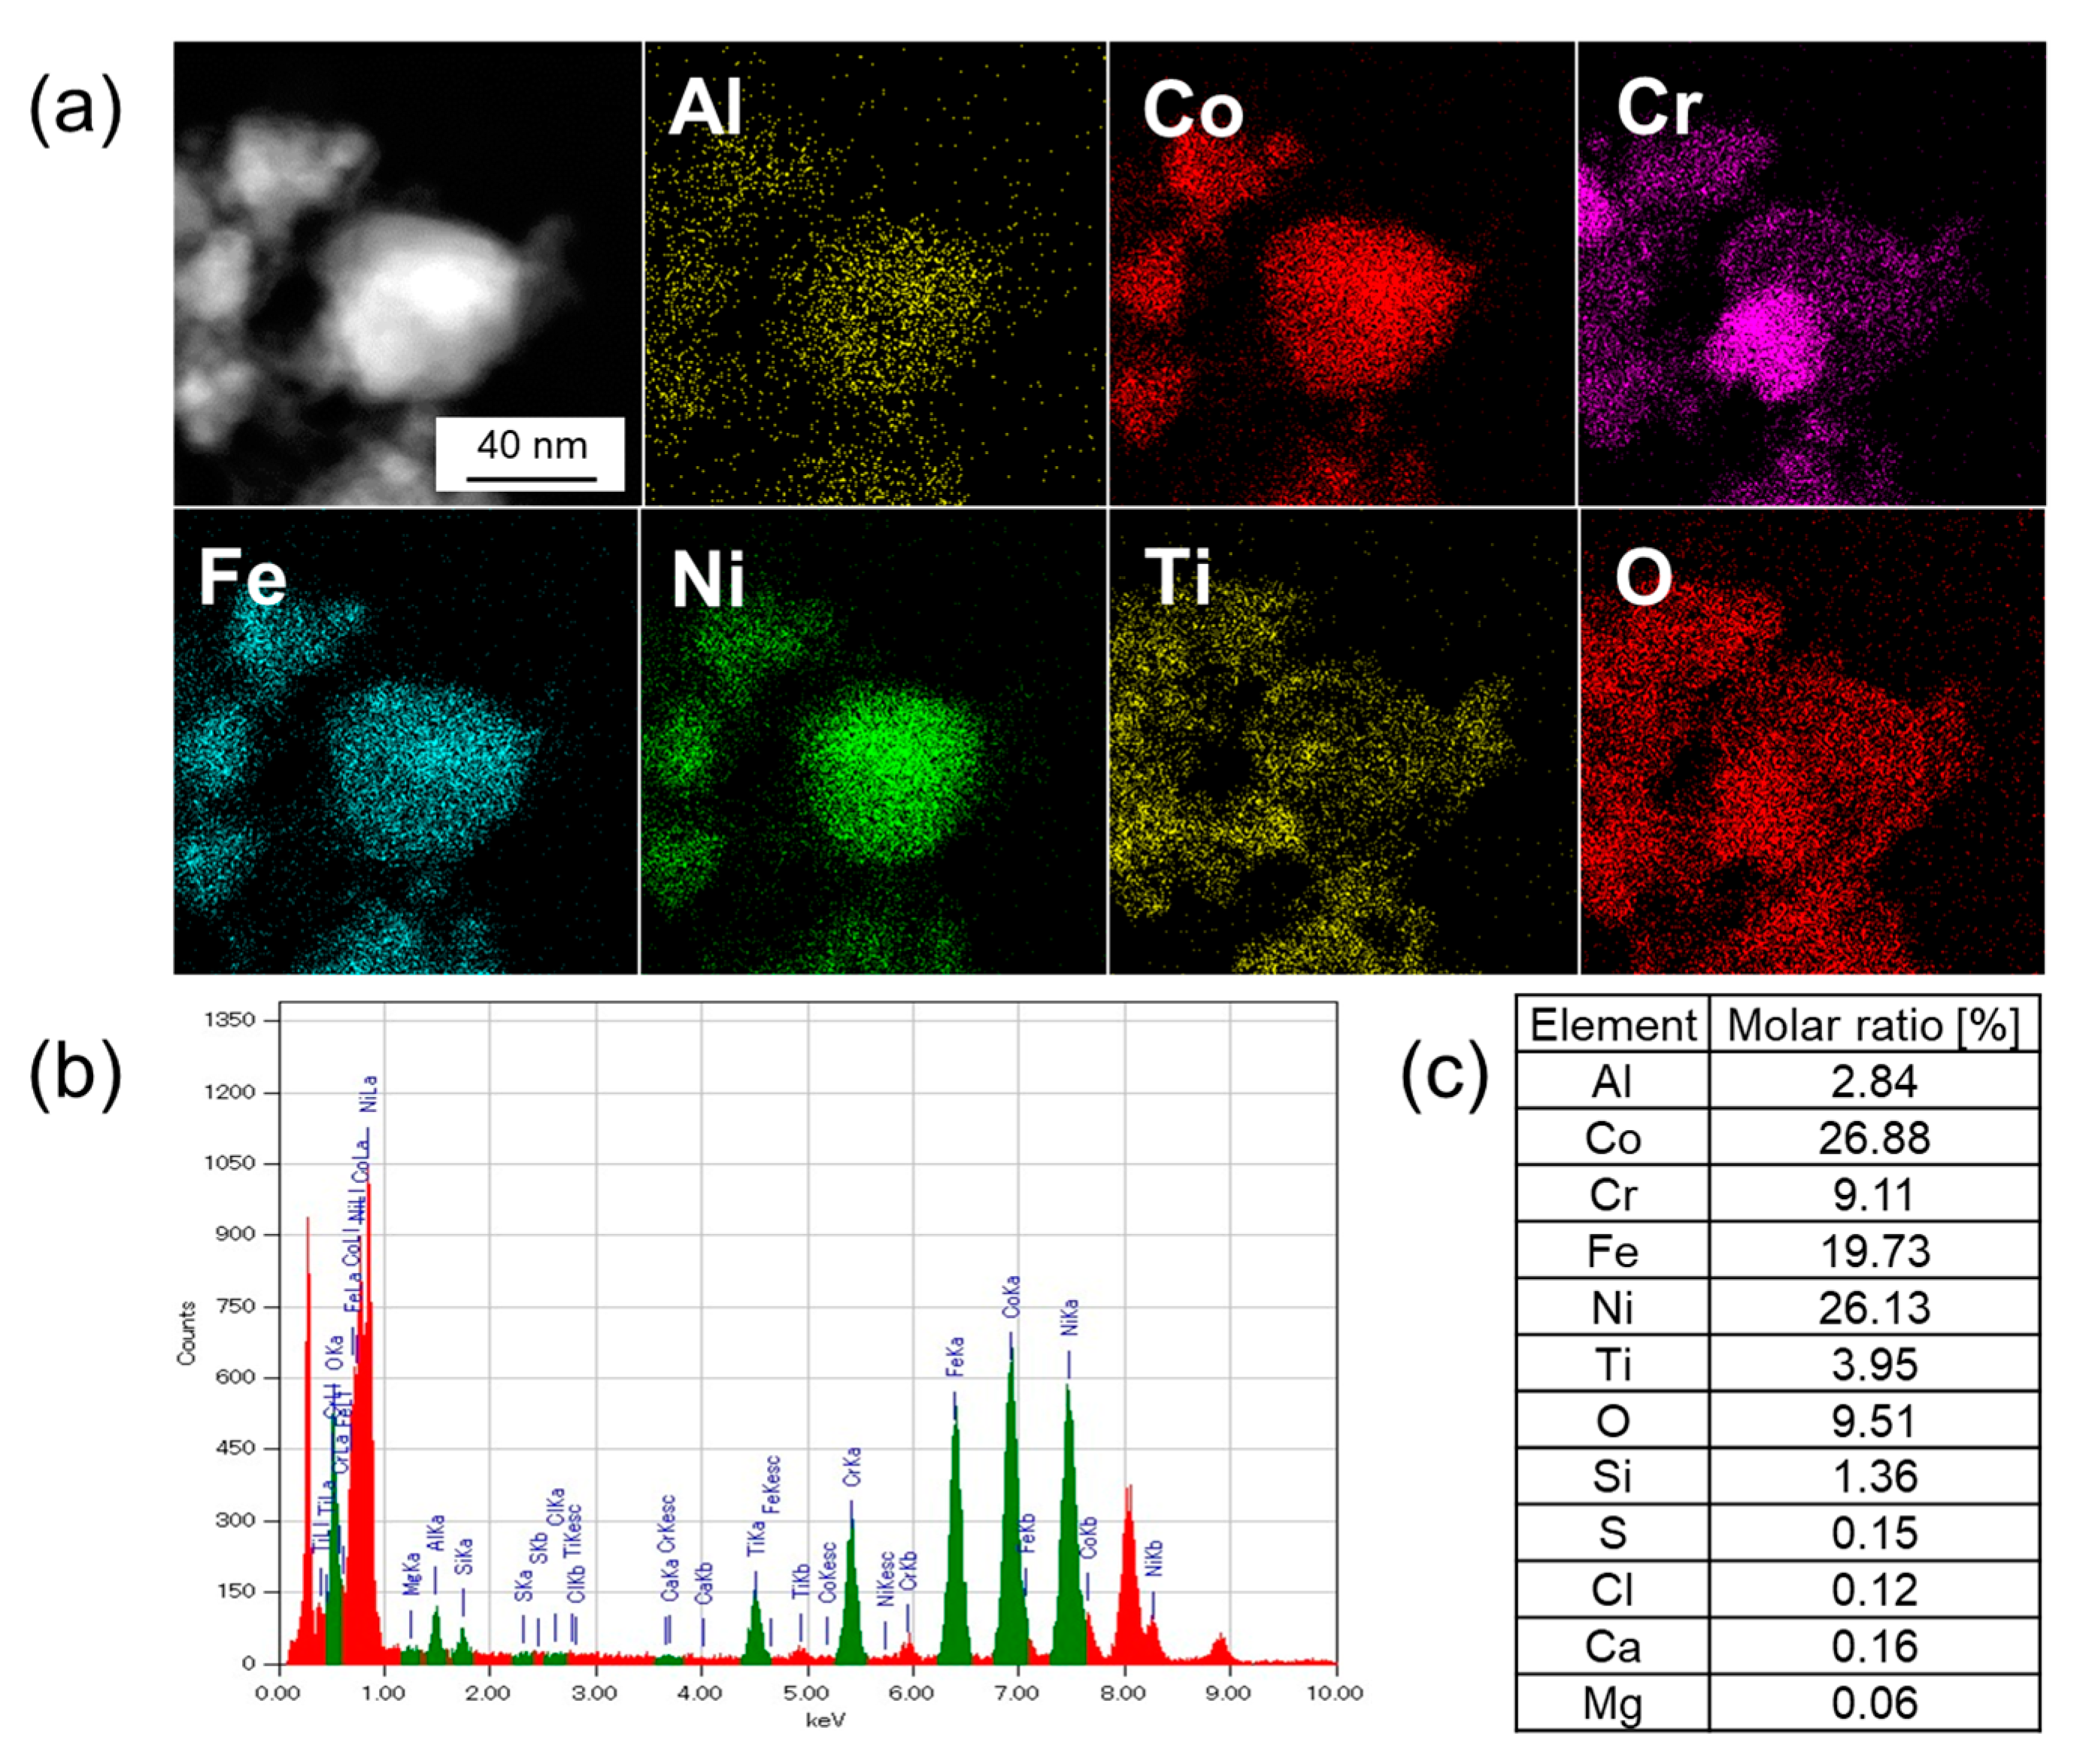
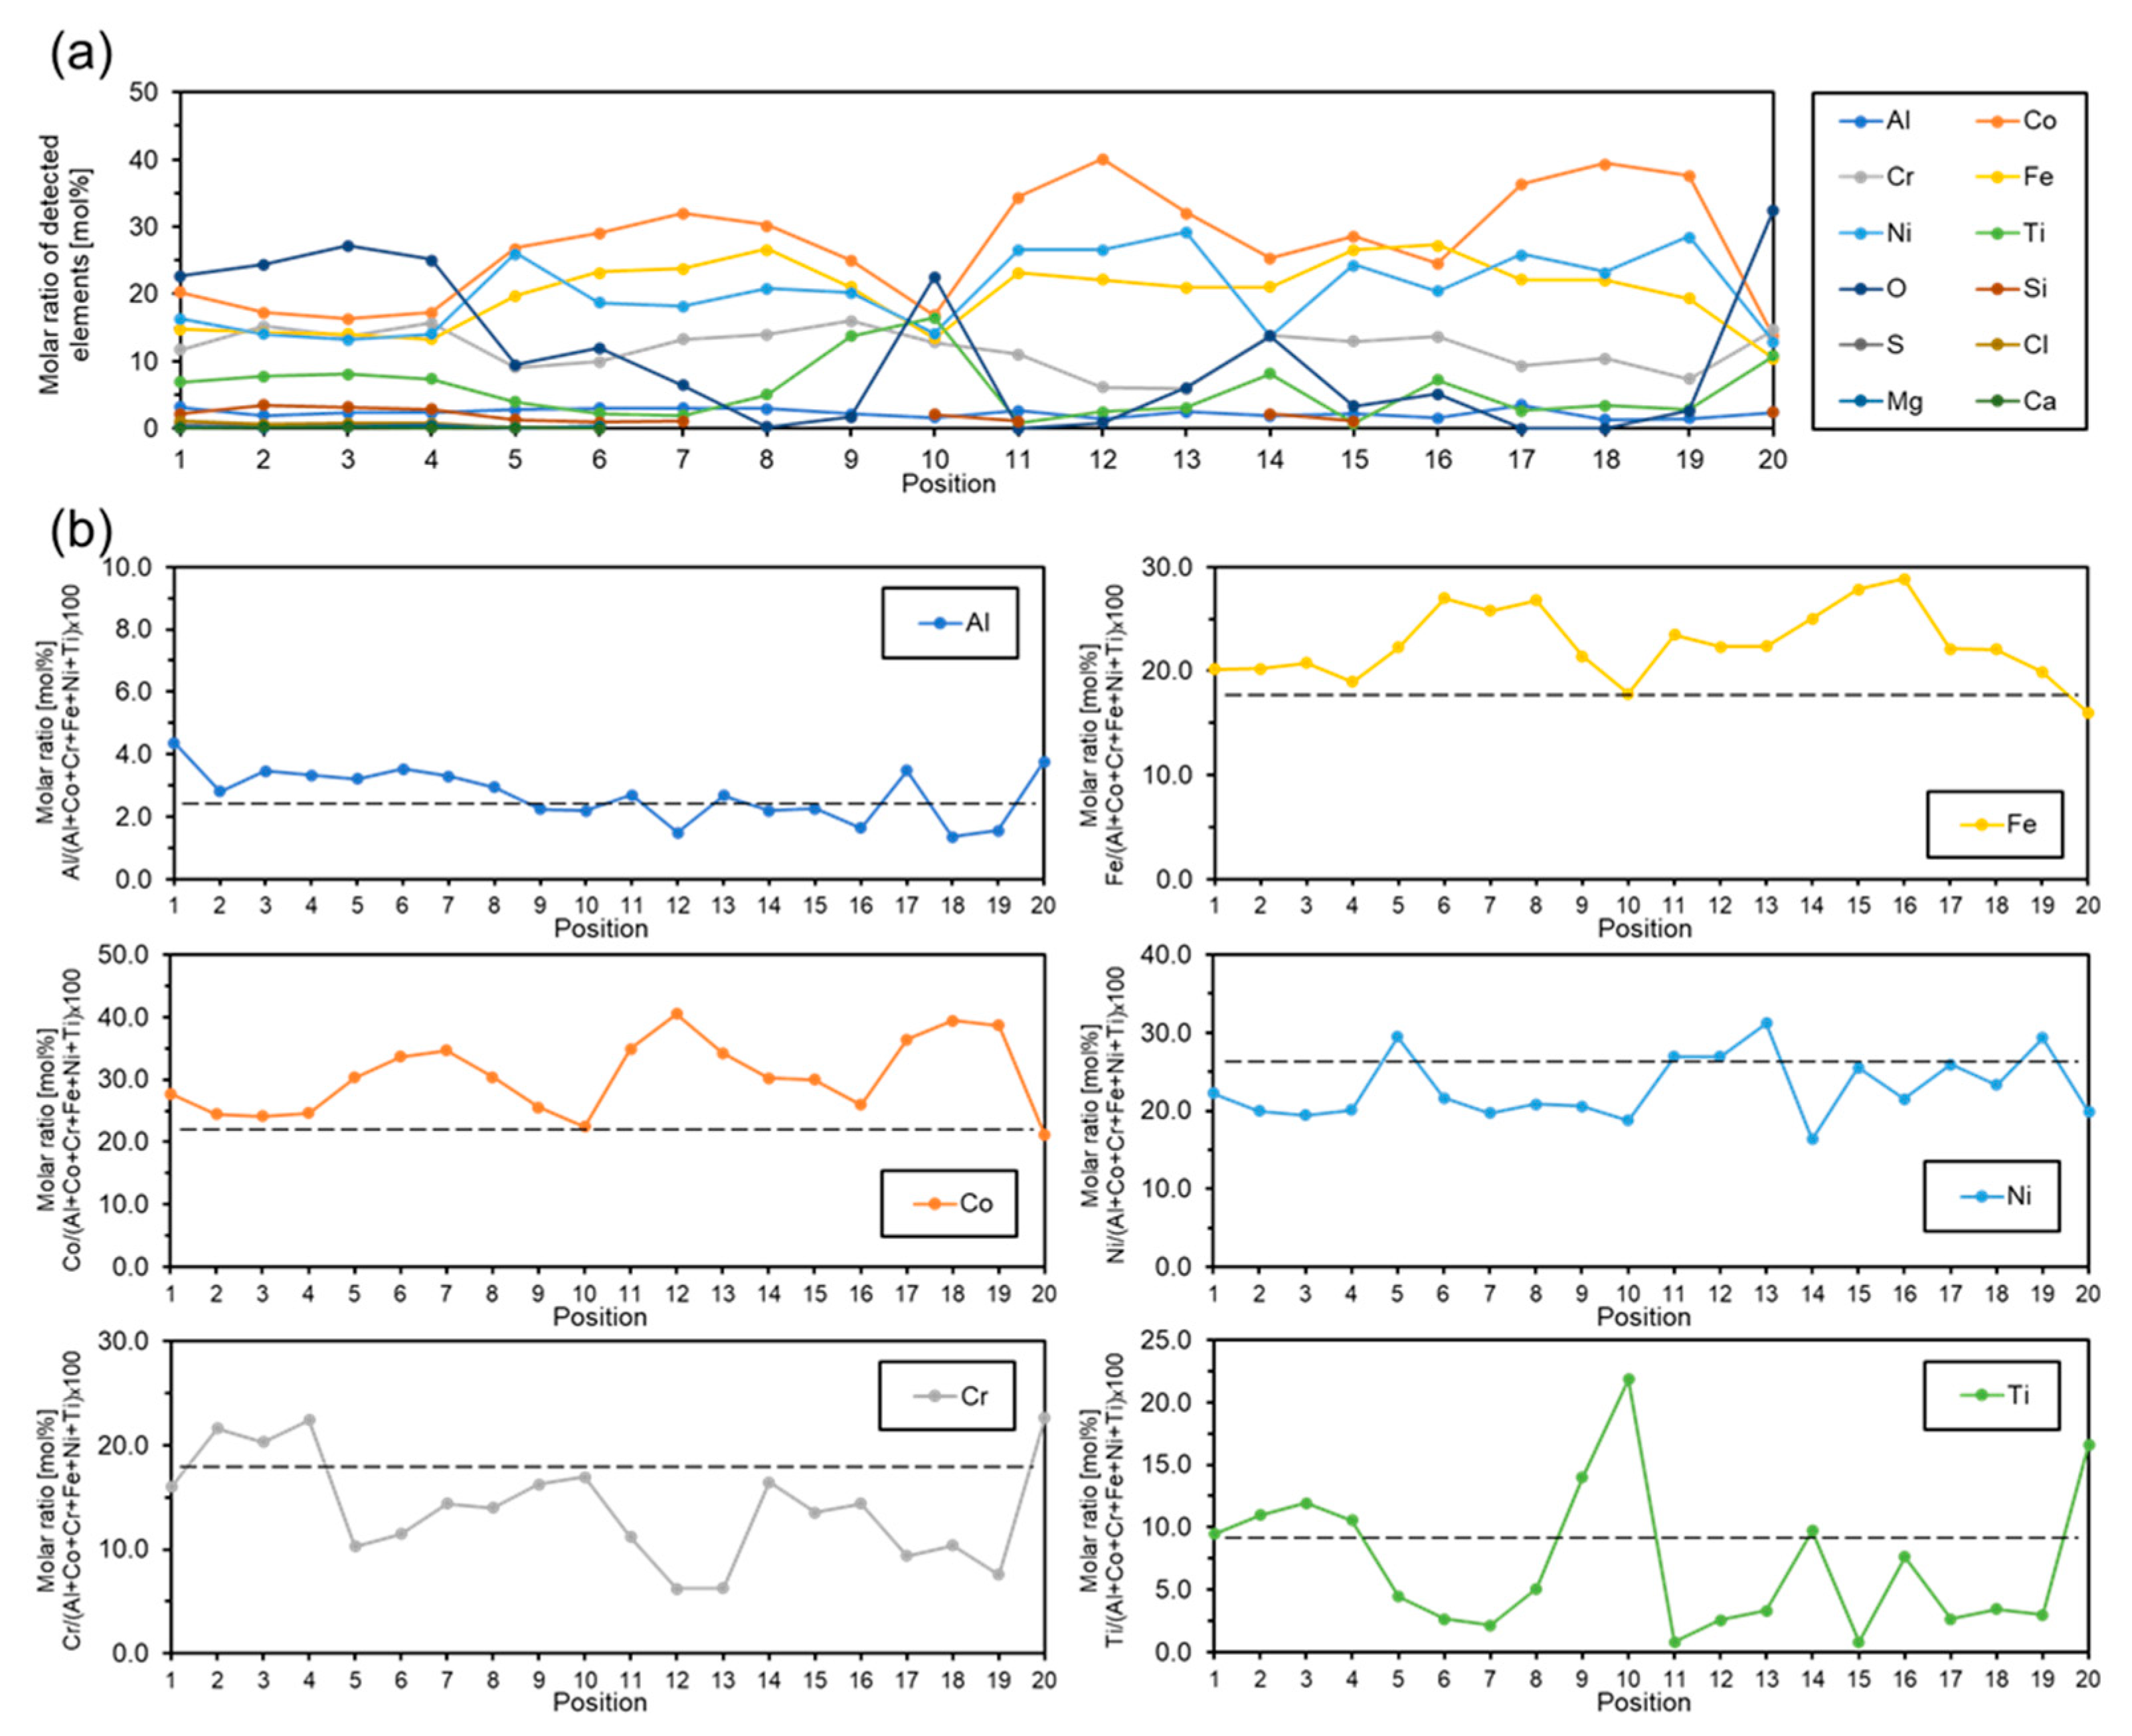
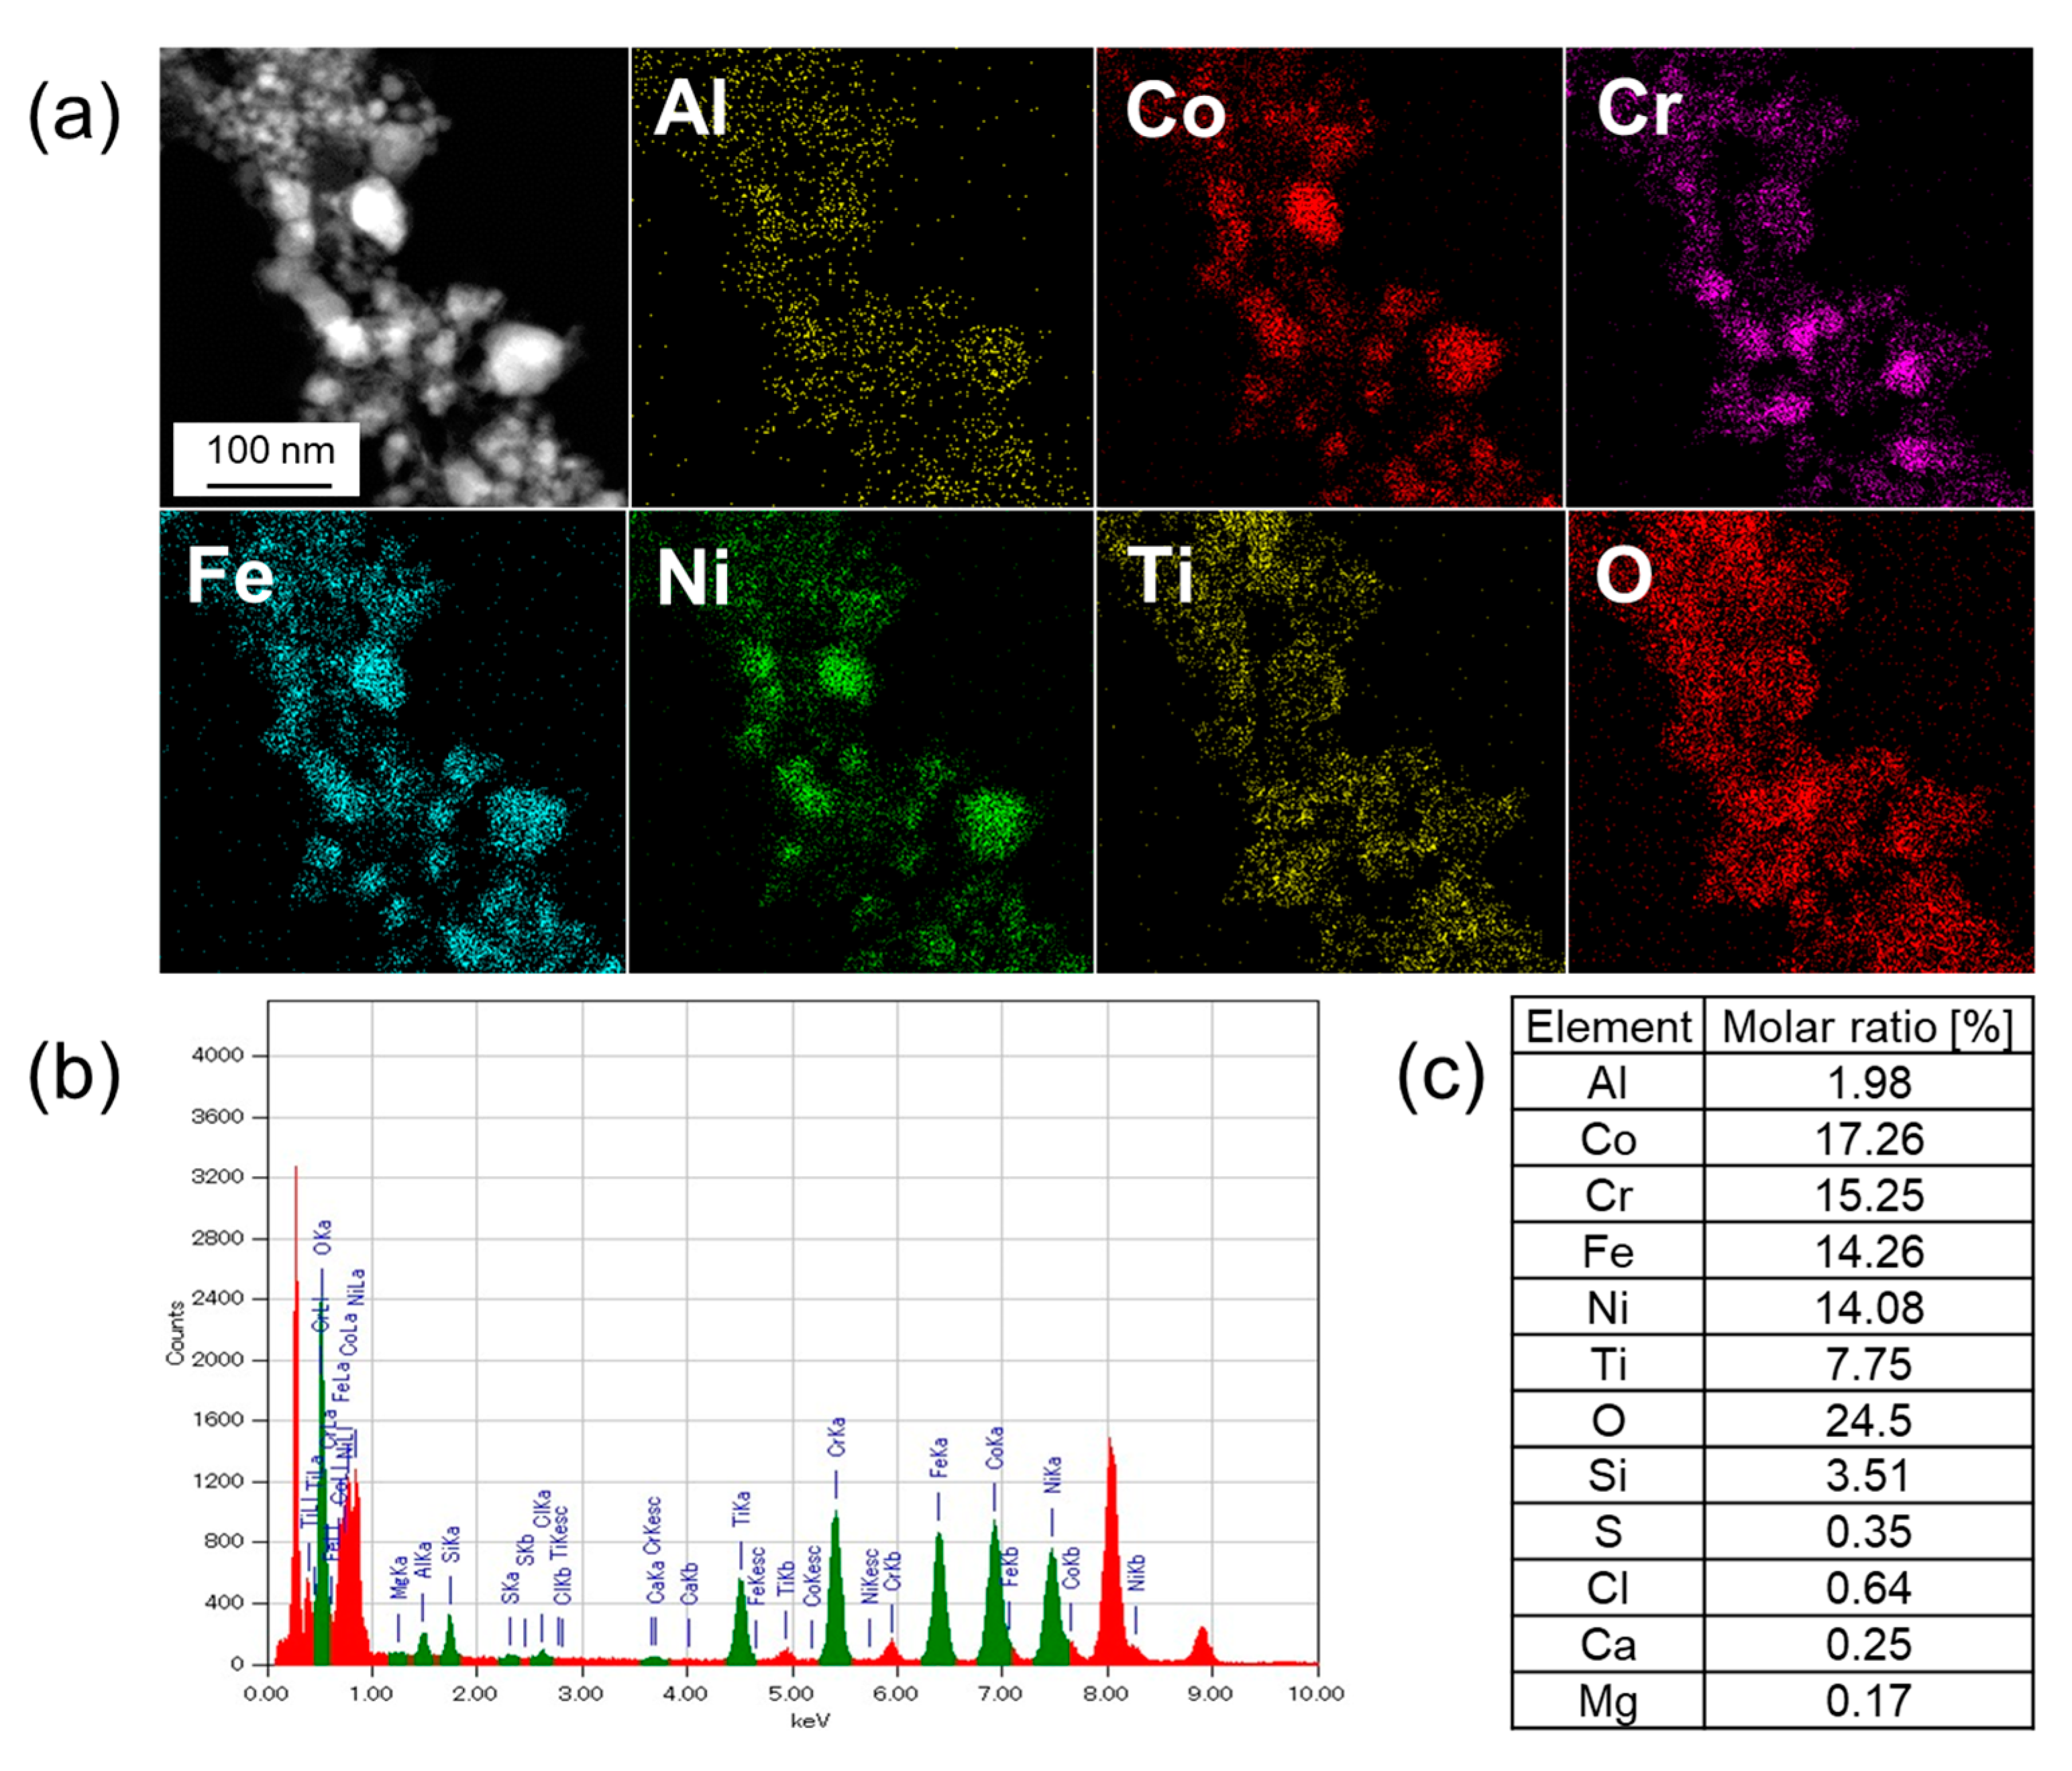
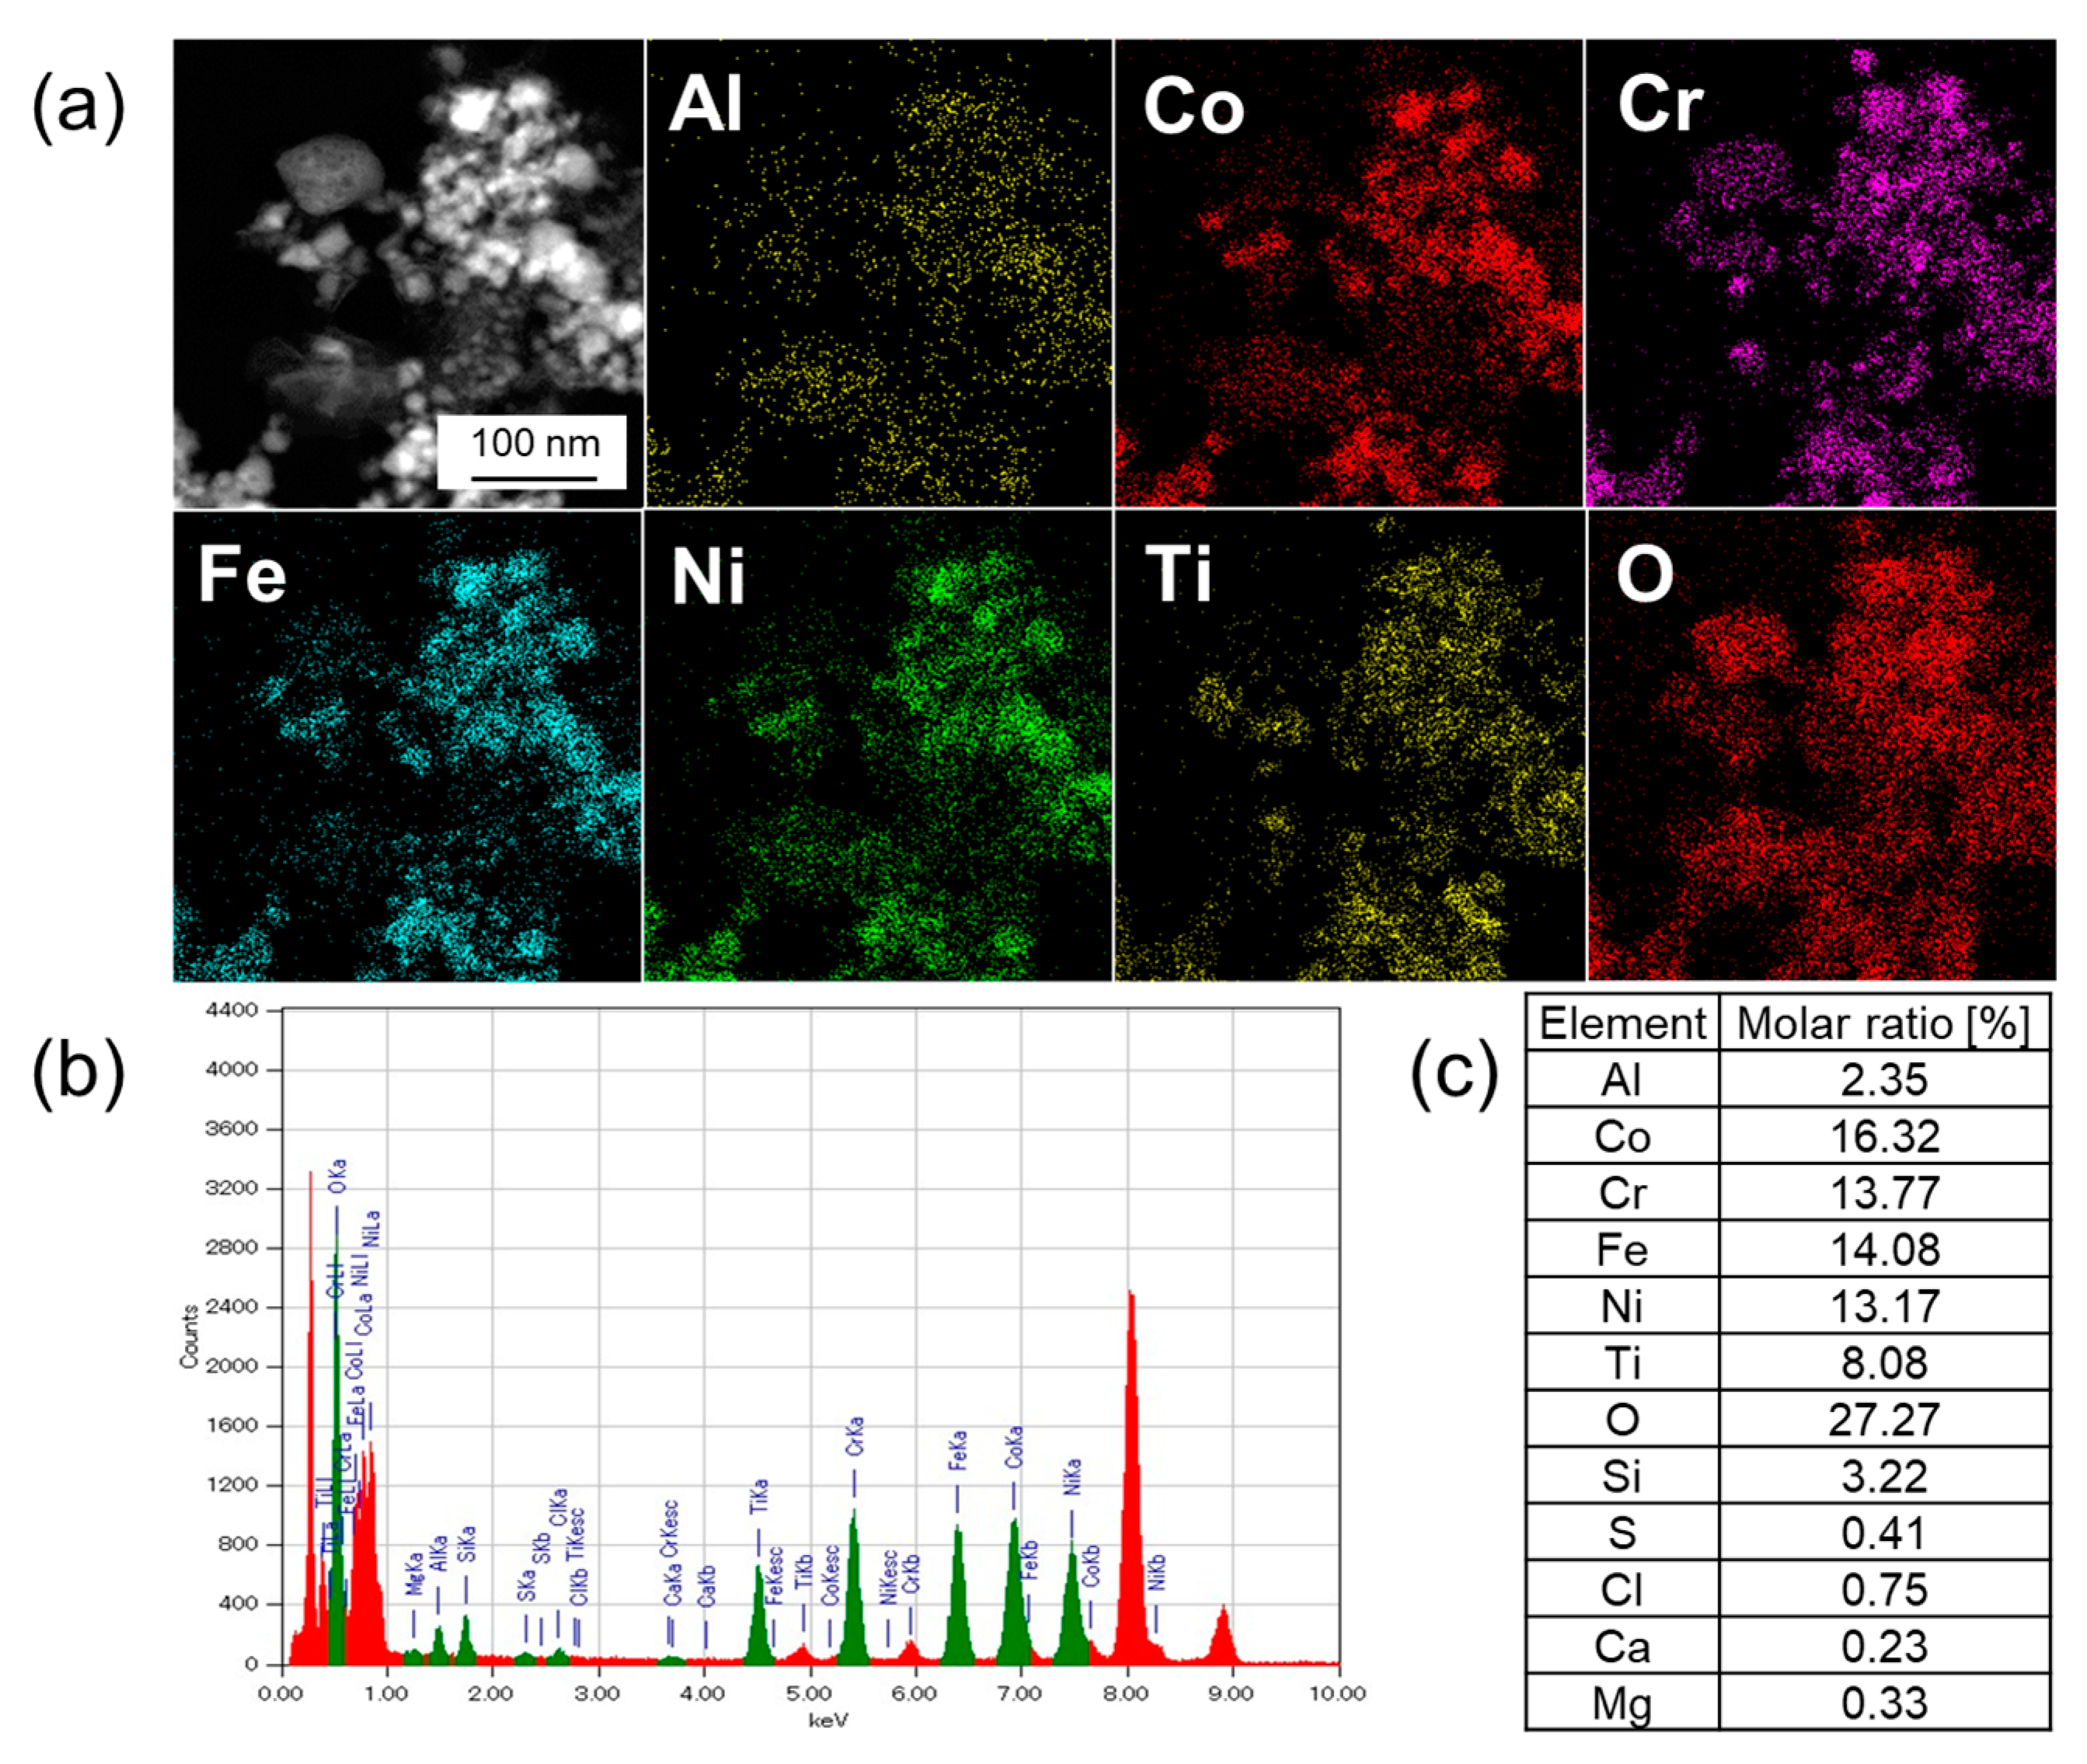
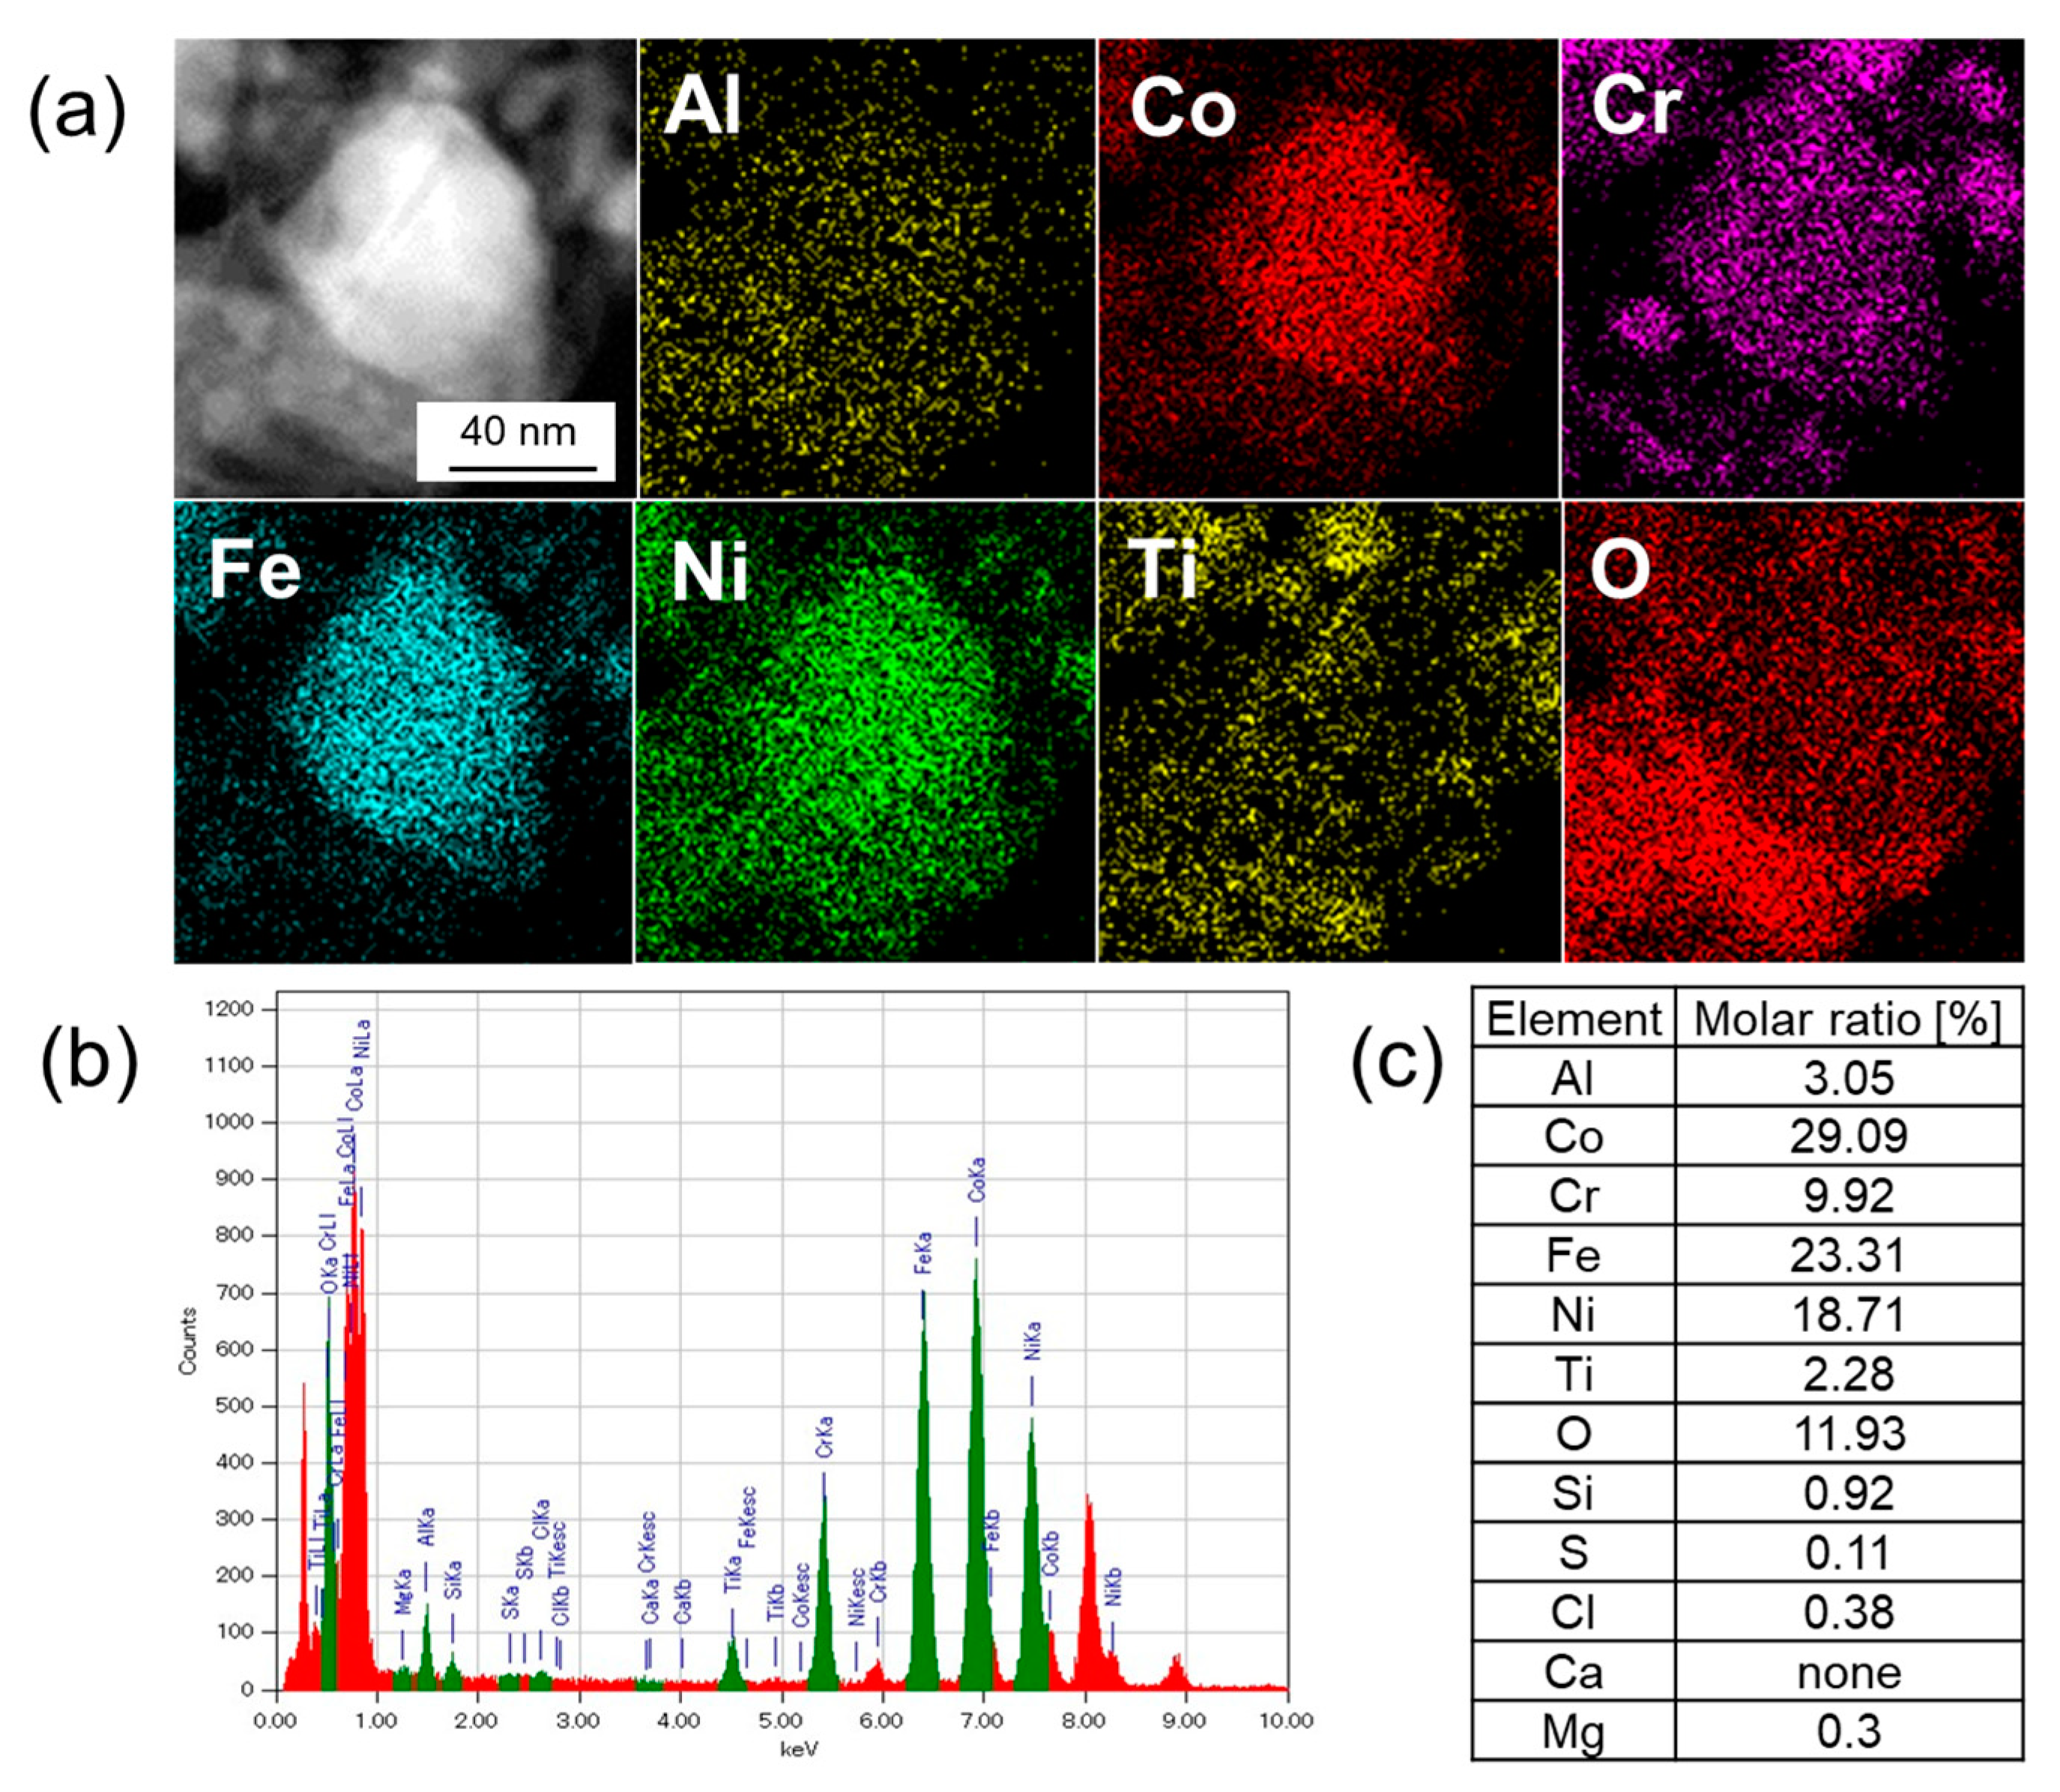
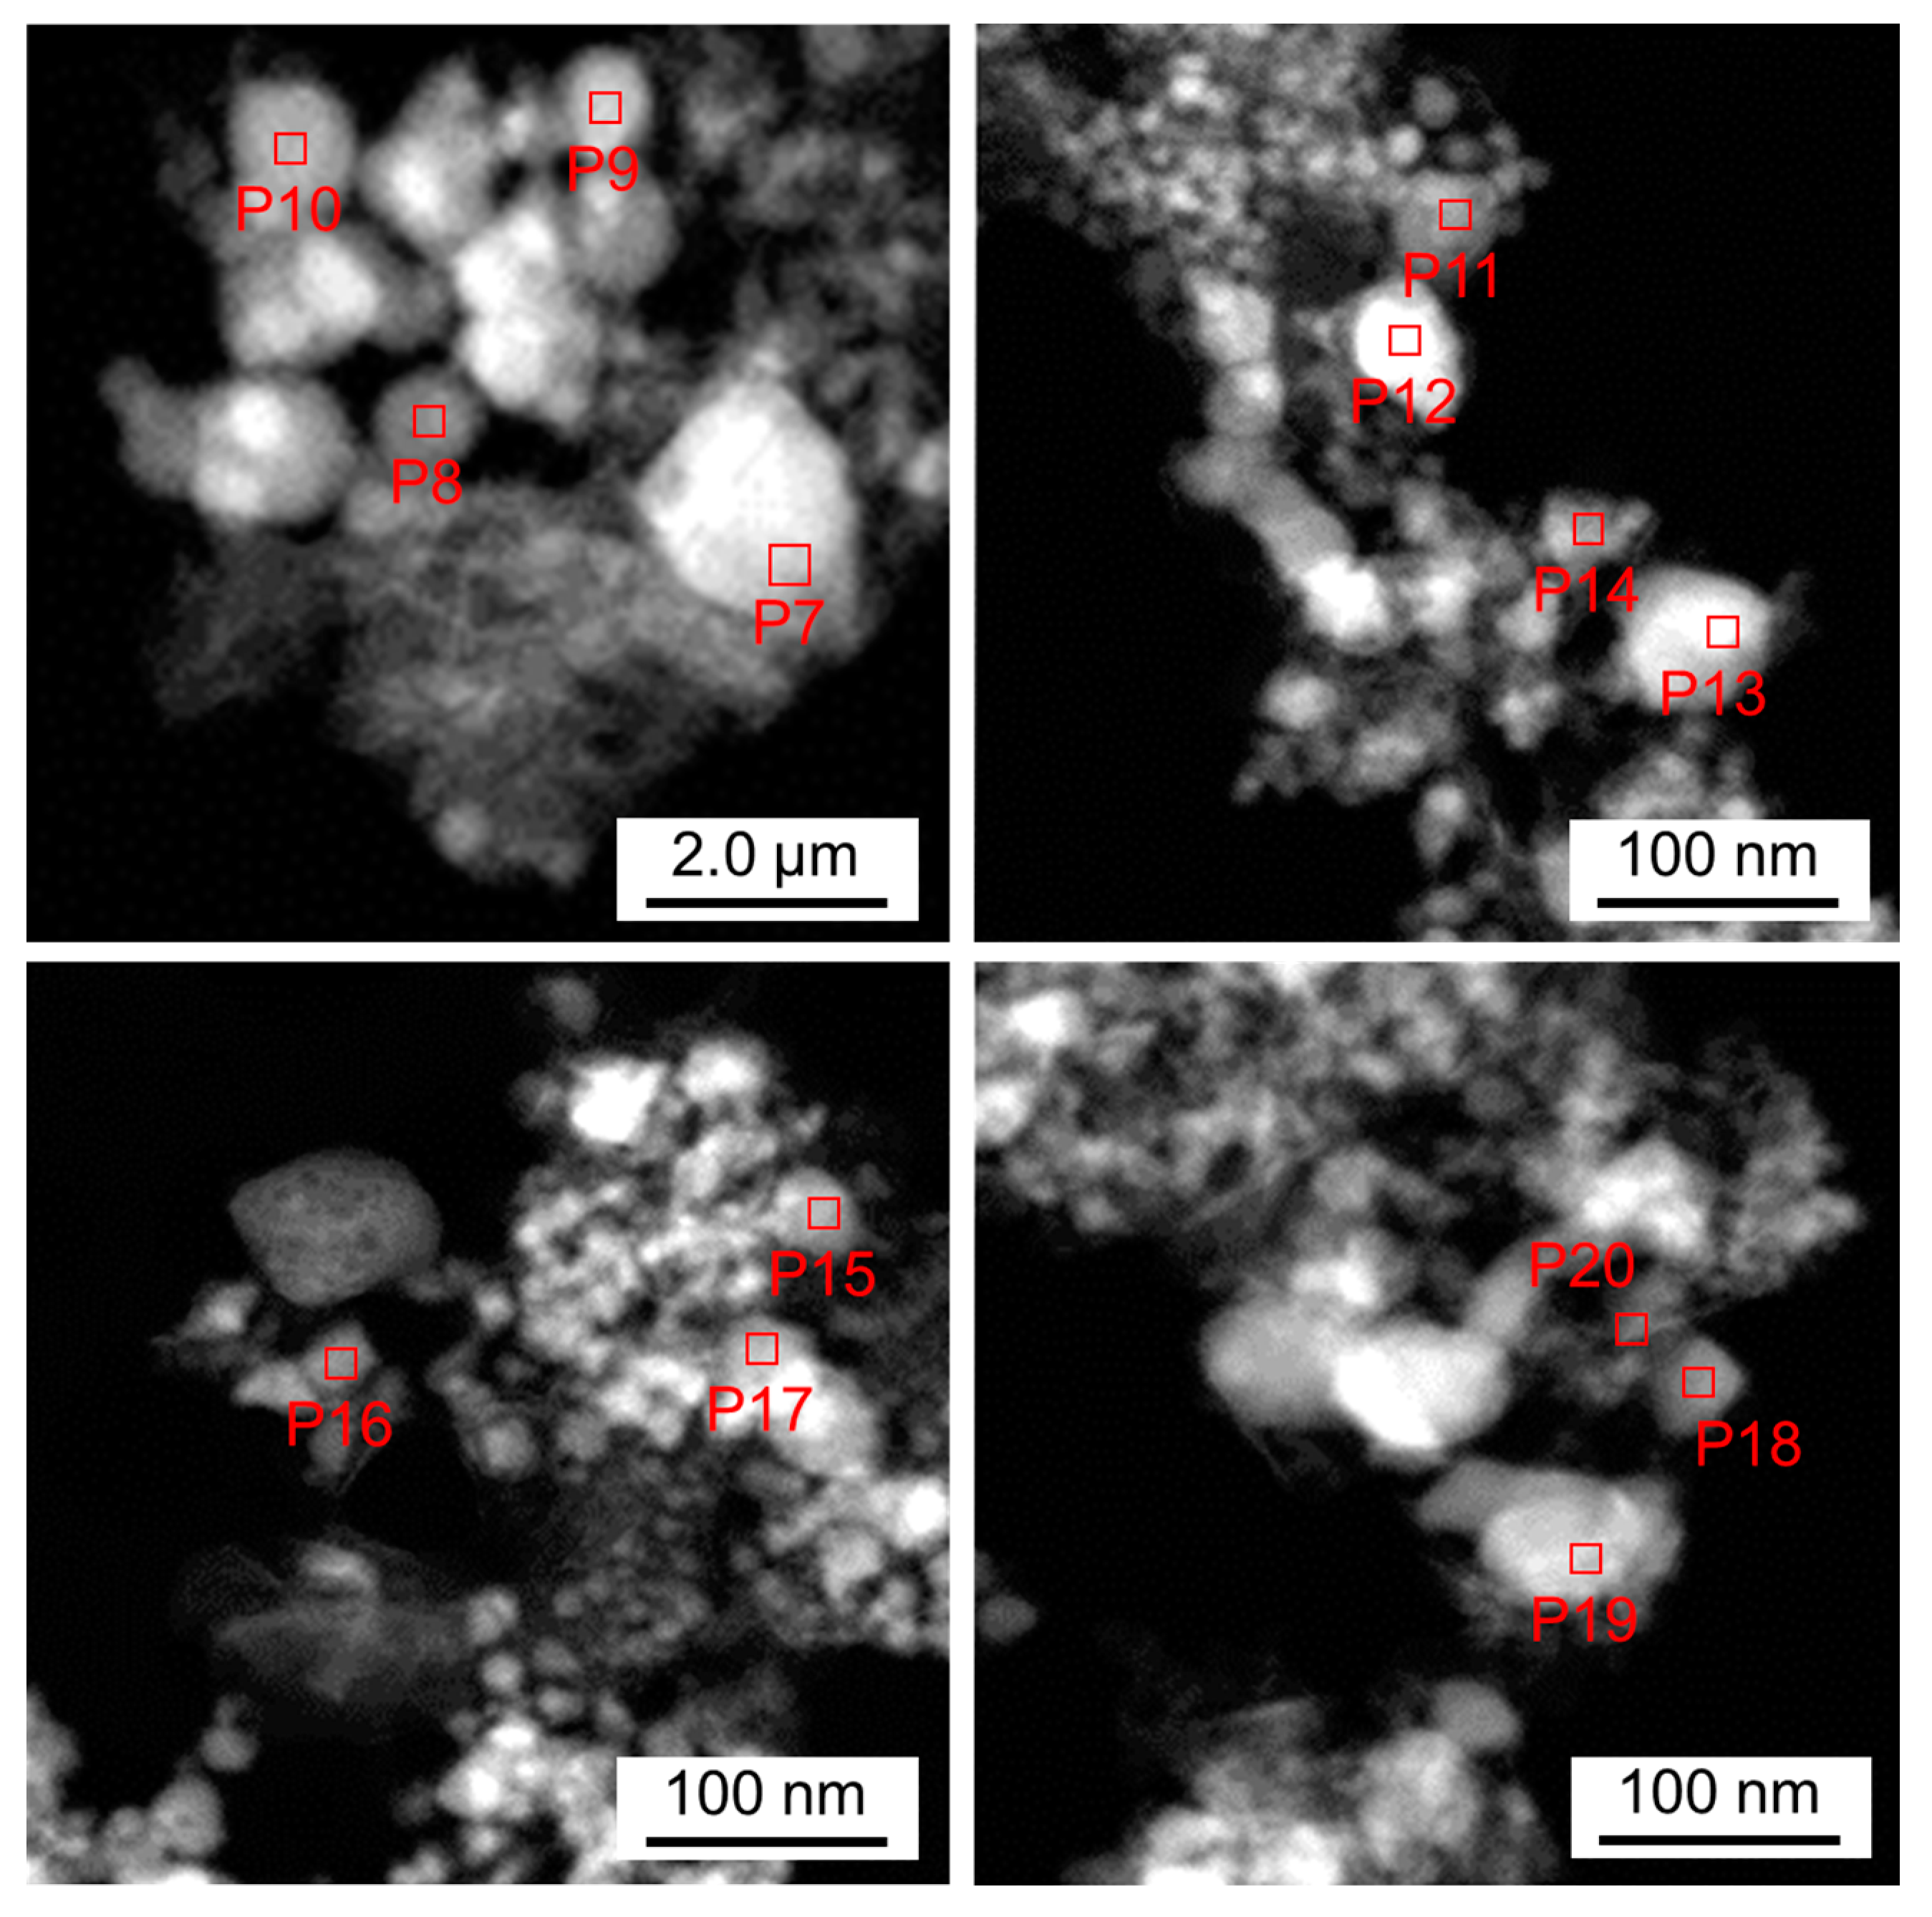
3.3. Elemental Analysis by TEM-EDX

Elemental analyses in the nano-sized range were performed by TEM-EDX. Figure 11, Figure 12, Figure 13, Figure 14, Figure 15, Figure 16 and Figure 17 show the results of elemental analyses conducted on 20 different positions for ACCFNT(RDT). Figure 18 summarizes the elemental distributions measured at 20 positions. Table 4 summarizes the detected molar ratios of Al, Co, Cr, Fe, Ni, and Ti on 20 positions, with average and stoichiometric ratios. For all the positions, oxygen was detected, but the molar ratios of <30 mol% were smaller than those by SEM-EDX. According to the elemental mappings in Figure 11, Figure 12, Figure 13, Figure 14, Figure 15 and Figure 16, oxygen was distributed evenly over the samples, but the distributions seemed mostly overlapped with those of Al and Ti. Since aluminum and titanium oxides are very stable due to the very low reduction potentials of Al (−1.6 V) and Ti (−1.4 V), the detected oxygen could originate from the oxygen strongly bonding with Al and Ti in the spinel structure of ACCFNT(Pre800). For the constituent elements of Al, Co, Cr, Fe, Ni, and Ti, the distributions of Co, Cr, Fe, and Ni overlapped relatively well with each other in Figure 11, Figure 12, Figure 13, Figure 14, Figure 15 and Figure 16, whereas the distributions of Al and Ti were broadly distributed over the samples and slightly deviated from those of Co, Cr, Fe, and Ni. Thus, TEM-EDX showed that aluminum and titanium oxides remained partially in ACCFNT(RDT) due to the incomplete reduction of ACCFNT(Pre800). Figure 18 indicated that the differences in molar ratios by TEM-EDX of each element of Al, Co, Cr, Fe, Ni, and Ti were larger than those by SEM-EDX (Figure 10) over the different positions. Especially, molar ratios of Ti were significantly dependent upon the observed positions. The inhomogeneity of Ti may be due to the incomplete reduction of titanium oxides. Except for oxygen and the constituent elements of Al, Co, Cr, Fe, Ni, and Ti, the detected elements were Si, S, Cl, Ca, and Mg. The amounts of S, Cl, Ca, and Mg were very scarce and ignorable. The amount of Si was relatively large, as similarly detected by SEM-EDX, and it was suggested that it could be unintentionally incorporated from the reactor used in the deoxidation process. In comparison with average and stoichiometric ratios described in Table 4, they were relatively good matches with each other. However, as described above, incomplete reductions of aluminum and titanium oxides were indicated on a nanoscale range by TEM-EDX, so the corresponding portion of partially reduced samples had inhomogeneous distributions of constituent elements, especially Ti. These results suggested the importance of the total reduction of oxide precursors to obtain homogeneous HEAs.
In the reduction process, the physical mixture of the oxide precursor, CaH2, and LiCl was heated in nitrogen at 600 °C for 2 h. The CaH2 is a very strong reducing agent, whereas LiCl is melted at 600 °C to be in the form of molten salt. Thus, the reduction process is a kind of solution process where the oxide powder is reduced by CaH2 powder in liquid molten salt. The molten salt could assist in the reduction of the oxide precursor, but the main reducing agent is the CaH2 powder. Thus, it is very important for the oxide powder and CaH2 powder to be in close contact to achieve the total reduction of the oxide. In addition, a long enough time is required to complete the reduction. However, 2 h may be too short to obtain the total reduction. In sum, the experimental results gave us a good lesson that the incomplete reduction was completed in the reduction conditions, suggesting the importance of the total reduction of oxide precursors that could be achieved by selecting appropriate conditions, such as close contact between the oxide powder and the CaH2 powder, and a long enough time to complete the reduction to obtain homogeneous HEAs from HEOs.
Elemental analyses were performed for ACCFNT(RDT) to confirm the homogeneity in micron-sized and nano-sized ranges by SEM-EDX and TEM-EDX, respectively. Elemental analyses of Al, Co, Cr, Fe, Ni, and Ti at nine different positions were carried out by SEM-EDX (Figure 10). The differences in molar ratios of each element were fairly small over the different positions, and it could be concluded that a good homogeneous distribution of the constituent elements close to the stoichiometric molar ratio of HEA Al0.2Co1.5CrFeNi1.5Ti0.5 was obtained. On the other hand, elemental analyses at 20 different positions by TEM-EDX showed different conclusions (Figure 18). The differences in molar ratios of each element were large, and molar ratios of Ti were especially significantly dependent upon the observed positions. The inconsistency of the results by SEM-EDX and TEM-EDX raises a serious issue in assessing elemental homogeneity on nanomaterials. It is impossible to analyze the elemental composition at all the nanoscale positions of nanoparticles in reality, and so it remains a data interpretation challenge in nanoscale characterization.

4. Conclusions

HEA Al0.2Co1.5CrFeNi1.5Ti0.5 nanoparticles were prepared from spinel-type HEO (Al0.2Co1.5CrFeNi1.5Ti0.5)3O4 by a deoxidation process via a CaH2-assisted molten salt method at 600 °C. The elemental analyses were performed for the HEA nanoparticles by SEM-EDX and TEM-EDX in micron-sized and nano-sized ranges, respectively. SEM-EDX exhibited a good distribution of constituent elements of Al, Co, Cr, Fe, Ni, and Ti over the HEA nanoparticles, but TEM-EDX revealed a slight deviation of elemental distributions of Al and Ti from those of Co, Cr, Fe, and Ni in a nano-sized range, probably due to the incomplete reduction of aluminum and titanium oxides. Thus, a careful nanoscale observation was required to discuss the elemental homogeneity of HEA nanoparticles. In addition, the importance of the total reduction of oxide precursors, especially with the low reduction potentials of Al and Ti was indicated when preparing HEAs from HEOs.

Author Contributions

Conceptualization, Y.K.; methodology, Y.K. and S.Y.; validation, Y.K.; formal analysis, Y.K.; investigation, Y.K. and R.S.; resources, Y.K. and R.S.; data curation, Y.K. and S.Y.; writing—original draft preparation, Y.K.; writing—review and editing, Y.K., S.Y. and R.S.; visualization, Y.K.; supervision, Y.K.; project administration, Y.K.; funding acquisition, Y.K. and R.S. All authors have read and agreed to the published version of the manuscript.

Funding

This research was funded by the Japan Society for the Promotion of Science (JSPS), grant number 24K08591.

Data Availability Statement

The original contributions presented in the study are included in the article, further inquiries can be directed to the corresponding author.

Conflicts of Interest

The authors declare no conflicts of interest.

References

  1. Yeh, J.-W.; Chen, S.-K.; Lin, S.-J.; Gan, J.-Y.; Chin, T.-S.; Shun, T.-T.; Tsau, C.-H.; Chang, S.-Y. Nanostructured high-entropy alloys with multiple principal elements: Novel alloy design concepts and outcomes. Adv. Eng. Mater. 2004, 6, 299–303. [Google Scholar] [CrossRef]
  2. Cantor, B.; Chang, I.T.H.; Knight, P.; Vincent, J.B. Microstructural development in equiatomic multicomponent alloys. Mater. Sci. Eng. A 2004, 375–377, 213–218. [Google Scholar] [CrossRef]
  3. Tsai, M.-H.; Yeh, J.-W. High-entropy alloys: A critical review. Mater. Res. Lett. 2014, 2, 107–123. [Google Scholar] [CrossRef]
  4. Ye, Y.F.; Wang, Q.; Lu, J.; Liu, C.T.; Yang, Y. High-entropy alloy: Challenges and prospects. Mater. Today 2016, 19, 349–362. [Google Scholar] [CrossRef]
  5. Miracle, D.B.; Senkov, O.N. A critical review of high entropy alloys and related concepts. Acta Mater. 2017, 122, 448–511. [Google Scholar] [CrossRef]
  6. George, E.P.; Raabe, D.; Ritchie, R.O. High-entropy alloys. Nat. Rev. 2019, 4, 515–534. [Google Scholar] [CrossRef]
  7. Torralba, J.M.; Alvaredo, P.; García-Junceda, A. High-entropy alloys fabricated via powder metallurgy. A critical review. Powder Metall. 2019, 62, 84–114. [Google Scholar] [CrossRef]
  8. Ke, B.; Sun, Y.; Zhang, Y.; Wang, W.; Wang, W.; Ma, P.; Ji, W.; Fu, Z. Powder metallurgy of high-entropy alloys and related composites: A short review. Int. J. Miner. Metall. Mater. 2021, 28, 931–943. [Google Scholar] [CrossRef]
  9. Yao, Y.; Huang, Z.; Xie, P.; Lacey, S.D.; Jacob, R.J.; Xie, H.; Chen, F.; Nie, A.; Pu, T.; Rehwoldt, M.; et al. Carbothermal shock synthesis of high-entropy-alloy nanoparticles. Science 2018, 359, 1489–1494. [Google Scholar] [CrossRef] [PubMed]
  10. Xie, P.; Yao, Y.; Huang, Z.; Liu, Z.; Zhang, J.; Li, T.; Wang, G.; Shahbazian-Yassar, R.; Hu, L.; Wang, C. Highly efficient decomposition of ammonia using high-entropy alloy catalysts. Nat. Commun. 2019, 10, 4011. [Google Scholar] [CrossRef] [PubMed]
  11. Xu, X.; Du, Y.; Wang, C.; Guo, Y.; Zou, J.; Zhou, K.; Zeng, Z.; Liu, Y.; Li, L. High-entropy alloy nanoparticles on aligned electronspun carbon nanofibers for supercapacitors. J. Alloys Compd. 2020, 822, 153642. [Google Scholar] [CrossRef]
  12. Singh, M.P.; Srivastava, C. Synthesis and electron microscopy of high entropy alloy nanoparticles. Mater. Lett. 2015, 160, 419–422. [Google Scholar] [CrossRef]
  13. Niu, B.; Zhang, F.; Ping, H.; Li, N.; Zhou, J.; Lei, L.; Xie, J.; Zhang, J.; Wang, W.; Fu, Z. Sol-gel autocombustion synthesis of nanocrystalline high-entropy alloys. Sci. Rep. 2017, 7, 3421. [Google Scholar] [CrossRef] [PubMed]
  14. Glasscott, M.W.; Pendergast, A.D.; Goines, S.; Bishop, A.R.; Hoang, A.T.; Renault, C.; Dick, J.E. Electrosynthesis of high-entropy metallic glass nanoparticles for designer, multi-functional electrocatalysis. Nat. Commun. 2019, 10, 2650. [Google Scholar] [CrossRef] [PubMed]
  15. Bondesgaard, M.; Broge, N.L.N.; Mamakhel, A.; Bremholm, M.; Iversen, B.B. General solvothermal synthesis method for complete solubility range bimetallic and high-entropy alloy nanocatalysts. Adv. Funct. Mater. 2019, 29, 1905933. [Google Scholar] [CrossRef]
  16. Wu, D.; Kusada, K.; Yamamoto, T.; Toriyama, T.; Matsumura, S.; Kawaguchi, S.; Kubota, Y.; Kitagawa, H. Platinum-group-metal high-entropy-alloy nanoparticles. J. Am. Chem. Soc. 2020, 142, 13833–13838. [Google Scholar] [CrossRef] [PubMed]
  17. Yang, Y.; Song, B.; Ke, X.; Xu, F.; Bozhilov, K.N.; Hu, L.; Shahbazian-Yassar, R.; Zachariah, M.R. Aerosol synthesis of high entropy alloy nanoparticles. Langmuir 2020, 36, 1985–1992. [Google Scholar] [CrossRef] [PubMed]
  18. Wang, X.; Dong, Q.; Qiao, H.; Huang, Z.; Saray, M.T.; Zhong, G.; Lin, Z.; Cui, M.; Brozena, A.; Hong, M.; et al. Continuous synthesis of hollow high-entropy nanoparticles for energy and catalysis applications. Adv. Mater. 2020, 32, 2002853. [Google Scholar] [CrossRef] [PubMed]
  19. Wu, D.; Kusada, K.; Yamamoto, T.; Toriyama, T.; Matsumura, S.; Gueye, I.; Seo, O.; Kim, J.; Hiroi, S.; Sakata, O.; et al. On the electronic structure and hydrogen evolution reaction activity of platinum group metal-based high-entropy-alloy nanoparticles. Chem. Sci. 2020, 11, 12731–12736. [Google Scholar] [CrossRef] [PubMed]
  20. Gao, S.; Hao, S.; Huang, Z.; Yuan, Y.; Han, S.; Lei, L.; Zhang, X.; Shahbazian-Yassar, R.; Lu, J. Synthesis of high-entropy alloy nanoparticles on supports by the fast moving bed pyrolysis. Nat. Commun. 2020, 11, 2016. [Google Scholar] [CrossRef] [PubMed]
  21. Gianelle, M.; Kundu, A.; Anderson, K.P.; Roy, A.; Balasubramanian, G.; Chan, H.M. A novel ceramic derived processing route for Multi-Principal Element Alloys. Mater. Sci. Eng. A 2020, 793, 139892. [Google Scholar] [CrossRef]
  22. Guo, X.; Liu, P.; Xia, Y.; Dong, Z.; Liu, H.; Chen, Y. Two-step hydrogen reduction of oxides for making FeCoNiCu high entropy alloy: Part I—Process and mechanical properties. Mater. Charact. 2020, 193, 112271. [Google Scholar] [CrossRef]
  23. Gianelle, M.A.; Clapp, C.; Kundu, A.; Chan, H.M. Solid state processing of the cantor derived alloy CoCrFeMnNi by oxide reduction. Results Mater. 2022, 14, 100286. [Google Scholar] [CrossRef]
  24. Kobayashi, Y.; Suzuki, D.; Yokoyama, S.; Shoji, R. Molten salt synthesis of high-entropy alloy AlCoCrFeNiV nanoparticles for the catalytic hydrogenation of p-nitrophenol by NaBH4. Int. J. Hydrogen Energy 2022, 47, 3722–3732. [Google Scholar] [CrossRef]
  25. Kobayashi, Y.; Teah, H.Y.; Yokoyama, S.; Shoji, R. Nobuko Hanada, Environmentally friendly molten salt synthesis of high-entropy AlCoCrFeNi alloy powder with high catalytic hydrogenation activity. Int. J. Hydrogen Energy 2023, 48, 30963–30973. [Google Scholar] [CrossRef]
  26. Kobayashi, Y.; Teah, H.Y.; Yokoyama, S.; Shoji, R.; Hanada, N. A Molten Salt Synthesis Method of the High-Entropy Alloy CrMnFeCoNi for High Catalytic Performance and Low Life Cycle GHG Emissions. ACS Sustain. Chem. Eng. 2022, 10, 15046–15057. [Google Scholar] [CrossRef]
  27. Kobayashi, Y.; Yokoyama, S.; Shoji, R. Core–Shell Multicomponent Alloys with High Specific Surface Areas Prepared by Molten Salt Synthesis for Catalytic Hydrogenation of p-Nitrophenol by NaBH4. ACS Appl. Eng. Mater. 2023, 1, 152–164. [Google Scholar] [CrossRef]
  28. Yokoyama, S.; Kobayashi, Y.; Shoji, R. Catalytic Hydrogenation of Methyl Orange and Acid Orange 7 Using NaBH4 over Core-shell Multicomponent Alloys. J. Water Environ. Technol. 2023, 21, 249–257. [Google Scholar] [CrossRef]
  29. Chuang, M.-H.; Tsai, M.-H.; Wang, W.-R.; Lin, S.-J.; Yeh, J.-W. Microstructure and wear behavior of AlxCo1.5CrFeNi1.5Tiy high-entropy alloys. Acta Mater. 2011, 59, 6308–6317. [Google Scholar] [CrossRef]
  30. Xin, B.; Zhang, A.; Han, J.; Su, B.; Meng, J. Tuning composition and microstructure by doping Ti and C for enhancing mechanical property and wear resistance of Al0.2Co1.5CrFeNi1.5Ti0.5 high entropy alloy matrix composites. J. Alloys Compd. 2020, 836, 155273. [Google Scholar] [CrossRef]
  31. Xin, B.; Zhang, A.; Han, J.; Meng, J. Improving mechanical properties and tribological performance of Al0.2Co1.5CrFeNi1.5Ti0.5 high entropy alloys via doping Si. J. Alloys Compd. 2021, 869, 159122. [Google Scholar] [CrossRef]
  32. Xin, B.; Zhang, A.; Han, J.; Meng, J. The tribological properties of carbon doped Al0.2Co1.5CrFeNi1.5Ti0.5 high entropy alloys. Wear 2021, 484–485, 204045. [Google Scholar] [CrossRef]
  33. Xin, B.; Zhang, A.; Han, J.; Zhang, J.; Meng, J. Enhancing mechanical properties of the boron doped Al0.2Co1.5CrFeNi1.5Ti0.5 high entropy alloy via tuning composition and microstructure. J. Alloys Compd. 2022, 896, 162852. [Google Scholar] [CrossRef]
  34. Kobayashi, Y. Synthesis of porous Ni3Al Intermetallic nano-compounds in a molten LiCl with an assistance of CaH2 as a structure-controlling agent. Chem. Lett. 2019, 48, 1496–1499. [Google Scholar] [CrossRef]
  35. Kobayashi, Y.; Iwasaki, Y. Fabrication of macroporous Co3O4–MgO composite catalysts for methylene blue degradation using oxone as an oxidant. J. Chem. Eng. Jpn. 2017, 50, 821–826. [Google Scholar] [CrossRef]
  36. Wang, B.; Huang, J.; Fan, J.; Dou, Y.; Zhu, H.; Wang, D. Preparation of FeCoNiCrMn high entropy alloy by electrochemical reduction of solid oxides in molten salt and its corrosion behavior in aqueous solution. J. Electrochem. Soc. 2017, 164, E575–E579. [Google Scholar] [CrossRef]
  37. Mao, A.; Xiang, H.-Z.; Zhang, Z.-G.; Koji, K.; Zhang, H.; Jia, Y. A new class of spinel high-entropy oxides with controllable magnetic properties. J. Magn. Magn. Mater. 2020, 497, 165884. [Google Scholar] [CrossRef]
  38. Akrami, S.; Edalati, P.; Fuji, M.; Edalati, K. High-entropy ceramics: Review of principles, production and applications. Mater. Sci. Eng. R Rep. 2021, 146, 100644. [Google Scholar] [CrossRef]
  39. Kobayashi, Y.; Yamamoto, K.; Shoji, R. A CaH2-Assisted Reduction Method to Prepare Nanoscale Zero-Valent Iron (nZVI) from Fe2O3 for Water Remediation Application. Minerals 2023, 13, 1385. [Google Scholar] [CrossRef]
  40. Kobayashi, Y.; Yokoyama, S.; Shoji, R. Molten salt synthesis of CrMnFeNi alloy nanopowder passivated by TiOx–ZrOy shell used as a superior catalyst support in liquid-phase hydrogenation. RSC Adv. 2023, 13, 10790. [Google Scholar] [CrossRef]
  41. Qiu, H.; Qiu, F.; Han, X.; Li, J.; Yang, J. Microwave-irradiated preparation of reduced graphene oxide-Ninanostructures and their enhanced performance for catalyticreduction of 4-nitrophenol. Appl. Surf. Sci. 2017, 407, 509–517. [Google Scholar] [CrossRef]
  42. Li, H.; Liao, J.; Du, Y.; You, T.; Liao, W.; Wen, L. Magnetic-field-induced deposition to fabricate multifunctional nanostructured Co, Ni, and CoNi alloy films as catalysts, ferromagnetic and superhydrophobic materials. Chem. Commun. 2013, 49, 1768–1770. [Google Scholar] [CrossRef] [PubMed]
  43. Yang, X.; Wang, Z.; Shang, Y.; Zhang, Y.; Lou, Q.; Li, B.; Xu, J. Well dispersive Ni nanoparticles embedded in core-shell supports as efficient catalysts for 4-nitrophenol reduction. J. Nanopart. Res. 2019, 21, 120. [Google Scholar] [CrossRef]
  44. Bae, S.; Gim, S.; Kim, H.; Hanna, K. Effect of NaBH4 on properties of nanoscale zero-valent iron and its catalytic activity for reduction of p-nitrophenol. Appl. Catal. B Environ. 2016, 182, 541–549. [Google Scholar] [CrossRef]
  45. Sravanthi, K.; Ayodhya, D.; Swamy, P.Y. Green synthesis, characterization and catalytic activity of 4-nitrophenol reduction and formation of benzimidazoles using bentonite supported zero valent iron nanoparticles. Mater. Sci. Energy Technol. 2019, 2, 298–307. [Google Scholar] [CrossRef]
  46. Lu, H.; Qiao, X.; Wang, W.; Tan, F.; Xiao, Z.; Chen, J. Chitosan stabilised nanozero-valent iron for the catalytic reduction of p-nitrophenol. Micro Nano Lett. 2014, 9, 446–450. [Google Scholar] [CrossRef]
  47. Wu, K.; Yu, R.; Wei, X. Monodispersed FeNi2 alloy nanostructures: Solvothermal synthesis, magnetic properties and size-dependent catalytic activity. CrystEngComm 2012, 14, 7626–7632. [Google Scholar] [CrossRef]
  48. Malik, M.A.; Alshehri, A.A.; Patel, R. Facile one-pot green synthesis of Ag-Fe bimetallic nanoparticles and their catalytic capability for 4-nitrophenol reduction. J. Mater. Res. Technol. 2021, 12, 455–470. [Google Scholar] [CrossRef]
Figure 1. Preparation procedures of ACCFNT(Pre) and ACCFNT(RDT) from chemicals.
Metals 14 00443 g001
Figure 2. X-ray diffraction (XRD) patterns of (a) ACCFNT(Pre500), ACCFNT(Pre800), ACCFNT(Pre1100), and (b) ACCFNT(RDT). The measurements were conducted at room temperature.
Metals 14 00443 g002
Figure 3. (a) Changes in 4-NP concentration (C) versus time for ACCFNT(Pre500) and ACCFNT(RDT) at 25 °C and (b) ln(C/C0) versus reaction time to acquire rate constant (k) for ACCFNT(RDT).
Metals 14 00443 g003
Figure 4. Scanning electron microscopy (SEM) images for ACCFNT(RDT).
Metals 14 00443 g004
Figure 5. (a) Elemental mappings, (b) the energy-dispersive X-ray (EDX) spectrum, and (c) the detected elemental molar ratios for ACCFNT(RDT) at position 1 by scanning electron microscopy (SEM)-EDX.
Metals 14 00443 g005
Figure 6. (a) Elemental mappings, (b) the energy-dispersive X-ray (EDX) spectrum, and (c) the detected elemental molar ratios for ACCFNT(RDT) at position 2 by scanning electron microscopy (SEM)-EDX.
Metals 14 00443 g006
Figure 7. (a) Elemental mappings, (b) the energy-dispersive X-ray (EDX) spectrum, and (c) the detected elemental molar ratios for ACCFNT(RDT) at position 3 by scanning electron microscopy (SEM)-EDX.
Metals 14 00443 g007
Figure 8. (a) Elemental mappings, (b) the energy-dispersive X-ray (EDX) spectrum, and (c) the detected elemental molar ratios for ACCFNT(RDT) at position 4 by scanning electron microscopy (SEM)-EDX.
Metals 14 00443 g008
Figure 9. (a) Scanning electron microscopy (SEM) images and (b) energy-dispersive X-ray (EDX) spectra for ACCFNT(RDT) at position 5–10 by SEM-EDX.
Metals 14 00443 g009
Figure 10. Molar ratios of (a) all detected elements for ACCFNT(RDT) and (b) the corresponding separate metals composed of ACCFNT(RDT) over 9 positions by scanning electron microscopy–energy-dispersive X-ray (SEM-EDX). Dotted lines indicate the stoichiometric molar ratios of high-entropy alloy (HEA) Al0.2Co1.5CrFeNi1.5Ti0.5.
Metals 14 00443 g010
Figure 11. (a) Elemental mappings, (b) the EDX spectrum, and (c) the detected elemental molar ratios for ACCFNT(RDT) at position 1 by transmission electron microscopy–energy-dispersive X-ray (TEM-EDX).
Metals 14 00443 g011
Figure 12. (a) Elemental mappings, (b) the EDX spectrum, and (c) the detected elemental molar ratios for ACCFNT(RDT) at position 2 by transmission electron microscopy–energy-dispersive X-ray (TEM-EDX).
Metals 14 00443 g012
Figure 13. (a) Elemental mappings, (b) the EDX spectrum, and (c) the detected elemental molar ratios for ACCFNT(RDT) at position 3 by transmission electron microscopy–energy-dispersive X-ray (TEM-EDX).
Metals 14 00443 g013
Figure 14. (a) Elemental mappings, (b) the EDX spectrum, and (c) the detected elemental molar ratios for ACCFNT(RDT) at position 4 by transmission electron microscopy–energy-dispersive X-ray (TEM-EDX).
Metals 14 00443 g014
Figure 15. (a) Elemental mappings, (b) the EDX spectrum, and (c) the detected elemental molar ratios for ACCFNT(RDT) at position 5 by transmission electron microscopy–energy-dispersive X-ray (TEM-EDX).
Metals 14 00443 g015
Figure 16. (a) Elemental mappings, (b) the EDX spectrum, and (c) the detected elemental molar ratios for ACCFNT(RDT) at position 6 by transmission electron microscopy–energy-dispersive X-ray (TEM-EDX).
Metals 14 00443 g016
Figure 17. TEM images and the positions for elemental molar ratios for ACCFNT(RDT) at position 7–20 by transmission electron microscopy–energy-dispersive X-ray (TEM-EDX).
Metals 14 00443 g017
Figure 18. Molar ratios of (a) all detected elements for ACCFNT(RDT) and (b) the corresponding separate metals composing of ACCFNT(RDT) over 20 positions by transmission electron microscopy–energy-dispersive X-ray (TEM-EDX). Dotted lines indicate the stoichiometric molar ratios of High-entropy alloy (HEA) Al0.2Co1.5CrFeNi1.5Ti0.5.
Metals 14 00443 g018
Table 1. Leached amounts of constituent elements after the reactions by the inductively coupled plasma measurements.
SampleLeached Amounts after Reactions [ppm]
AlCoCrFeNiTi
ACCFNT(Pre500)0.0240.0171.1630.0130.0240.002
ACCFNT(RDT)0.0210.0170.0150.0130.0260.001
Table 2. Comparison of rate constants (k) for 4-NP reduction operated at room temperature.
Catalystk [min−1]Reaction ConditionsRefs.
Al0.2Co1.5CrFeNi1.5Ti0.50.28724-NP (1.6 mM)
NaBH4 (47 mM)
10 mg-cat/9 mL
This study
CrMnFeCoNi0.040–0.108[26]
AlCoCrFeNi0.0324[25]
AlCoCrFeNiV0.0258[24]
Nanoscale zero-valent iron0.040–0.048[39]
10wt%Ni/TiZrCrMnFeNi0.046[40]
10wt%Ni/TiO20.015
10wt%Ni/ZrO20.0003
Ni-RGO0.074-NP (0.1 mM)
NaBH4 (30 mM)
10 mg-cat/104 mL
[41]
Ni NP0.02
Ni film0.094-NP (0.1 mM)
NaBH4 (10 mM)
15 cm2-cat/16 mL
[42]
Co50Ni50 film0.15
Co25Ni75 film0.14
SiO2@C/Ni2.19–3.064-NP (0.2 mM)
NaBH4 (65 mM)
3 mg-cat/3.1 mL
[43]
Nanoscale zero-valent iron0.314-NP (0.1 mM)
NaBH4 (50 mM)
3.5 mg-cat/L
[44]
Bentonite clay-supported Fe nanoparticles0.1414-NP (0.2 mM)
NaBH4 (200 mM)
10 mg-cat/L
[45]
Chitosan-stabilized nanozero-valent iron0.1474-NP (0.2 mM)
NaBH4 (20 mM)
1000 mg-cat/L
[46]
Monodispersed FeNi2 alloy nanostructures0.0574-NP (0.03 mM)
NaBH4 (20 mM)
33 mg-cat/L
[47]
FeAg bimetallic nanoparticles0.0654-NP (0.07 mM)
NaBH4 (3 mM)
5 mg-cat/3 mL
[48]
Table 3. Elemental molar ratios with standard deviations (SDs) measured by scanning electron microscopy–energy-dispersive X-ray (SEM-EDX) for ACCFNT(RDT).
PositionMolar Ratios of Detected Elements [mol%]
AlCoCrFeNiTi
17.422.817.518.024.110.2
27.421.219.118.221.412.7
35.323.718.921.819.810.6
45.421.621.022.119.510.6
53.021.824.122.316.312.4
61.522.726.622.515.910.8
75.025.119.218.621.510.6
85.822.018.519.123.411.2
95.121.521.519.521.211.0
Average (SD)5.1 (1.8)22.5 (1.2)20.7 (2.8)20.2 (1.8)20.3 (2.6)11.1 (0.8)
Stoichiometric
ratio
3.526.317.517.526.38.8
Table 4. Elemental molar ratios with standard deviations (SDs) measured by transmission electron microscopy–energy-dispersive X-ray (TEM-EDX) for ACCFNT(RDT).
PositionMolar Ratios of Detected Elements [mol%]
AlCoCrFeNiTi
14.427.816.020.222.39.4
22.824.521.620.219.911.0
33.524.120.320.819.411.9
43.324.722.419.020.110.5
53.230.310.322.329.54.5
63.533.711.527.021.72.6
73.334.714.425.819.72.1
82.930.414.026.820.85.1
92.225.516.321.420.614.0
102.222.417.017.818.821.8
112.734.911.223.526.90.8
121.540.56.222.326.92.6
132.734.26.322.431.23.3
142.230.216.425.016.49.7
152.330.013.627.925.50.8
161.626.014.428.821.57.6
173.536.59.422.125.92.7
181.439.510.422.123.33.4
191.638.77.619.929.33.0
203.821.122.616.019.916.6
Average (SD)2.7 (0.8)30.5 (5.7)14.1 (5.0)22.6 (3.3)23.0 (4.0)7.2 (5.6)
Stoichiometric
ratio
3.526.317.517.526.38.8
Disclaimer/Publisher’s Note: The statements, opinions and data contained in all publications are solely those of the individual author(s) and contributor(s) and not of MDPI and/or the editor(s). MDPI and/or the editor(s) disclaim responsibility for any injury to people or property resulting from any ideas, methods, instructions or products referred to in the content.

