Article

Evaluation of 3D Printing Orientation on Volume Parameters and Mechanical Properties of As-Build TI64ELI

1
Department of Mechanical and Mechatronic Engineering, Central University of Technology, Free State, Bloemfontein 9300, South Africa
2
Department of Mechanical and Mechatronic Engineering, Tshwane University of Technology, Pretoria 0183, South Africa
3
Department of Mechanical Engineering, University of South Africa, Florida Campus, Roodepoort 1709, South Africa
4
Department of Mechanical Engineering, Faculty of Engineering, and the Built Environment, Durban University of Technology, Durban 4000, South Africa
*
Author to whom correspondence should be addressed.
Metals 2024, 14(4), 447; https://doi.org/10.3390/met14040447
Submission received: 21 January 2024 / Revised: 19 March 2024 / Accepted: 3 April 2024 / Published: 11 April 2024

Abstract

:
The discovery of the utility of various titanium alloys as implant biomaterials has resulted in these materials becoming far more popular than other metals in the medical world. However, the production of these materials using additive manufacturing has its own challenges some of those being the surface finish that can be used as an implantology material. As such, the purpose of this study is to evaluate the influence of 3D-printed Ti64ELI on the as-built samples printed at 60°, 90°, and 180° orientations. Such studies are very limited, specifically in the development of the laser shock peening surface modification of dental implants. The study showed that each mechanical test that was performed contributes differently to the printing orientation, e.g., some tests yielded better properties when 180° printing orientation was used, and others had poorer properties when a 180° printing orientation was used. It was observed that 60° testing yielded a micro-hardness value of 349.6, and this value was increased by 0.37% when 90° orientation was measured. The lowest HV value was observed under a 180° orientation with 342.2 HV. The core material volume (Vmc) was 0.05266 mm3/mm2 at a 60° orientation, which increased by 11.48% for the 90° orientation. Furthermore, it was observed that the surface roughness (Sa) at 60° orientation was 43.68 μm. This was further increased by 6% when using the 90° orientation.

1. Introduction

For individuals with remaining terminal dentition or edentulism, immediate-loading full-arch implant rehabilitation is currently the recommended elective treatment method [1]. In recent times, there has been a surge in the utilization of osseointegrated dental implants for the functional and cosmetic restoration of individuals who are either partially or completely edentulous [2,3]. Various factors could impact the long-term success of implants, though. The biomechanical elements of these components are crucial to its in vivo behavior [4]. The manner in which stresses are transmitted from the implant to the bone surrounding the implant plays a crucial role in the biomechanical behavior of dental implants [5]. The clinical success rate of medical implants is related to several factors that promote the osseointegration of the implant fixation and the successful healing of the soft tissues at the interface between the implant and the abutment [6].
Dental implants are made to resist a lot of cycles under heavy loads [7], but there is still a chance that they could fail at any point throughout their lifetime [8]. Dental implants may experience biological failure even in the event that adequate stiff attachment is attained because bone resorption may cause the implant to become loose [9]. Conversely, excessive oral activity-related weariness and injury are usually blamed for mechanical failure [10]. The biological region that results from peri-implant bone loss is dependent on patient circumstances, implant abutment design and placement, and occlusal loading [11]. Dental professionals are increasingly using digital technology [12,13]. Particularly in implant dentistry, there is a growing trend toward the use of computer-aided design (CAD) and computer-aided manufacturing (CAM). Over the last 20 years, this technology has advanced quickly, and it was first used in restorative dentistry [14,15]. Compared to conventional manufacturing, additive manufacturing (AM) offers several advantages, including the ability to easily produce complicated geometries, design freedom, shorter manufacturing lead times, and raw material savings [16].
A few technical obstacles, including AM’s rough surface roughness, which is incomparable to that of traditional production techniques like machining and injection molding, are impeding the full commercialization of AM technology [17,18]. The general surface quality is addressed by the AM community, especially in the AM process field, using simple profile surface texture criteria like Ra and Rq, although actual parameters are showing to be more beneficial [19]. Arithmetic mean height (Sa and Sq) is more correlated with the surface angle than root mean square (Ra and Rq), according to a prior report [4]. In this work, different 3D printing orientations for as-built Ti64ELI samples are considered while analyzing the Sa and Sq parameters. The most common method of evaluating “roughness”, which uses the Sa and Sq parameters (which are comparable to the Ra and Rq ISO 4287 profile parameters), yields comparable results when used with coarsely located X-ray computed tomography (XCT) means, coherence scanning interferometry (CSI), and confocal microscopy (CM) [20].
There are two ways to look at how surface roughness affects osseointegration: the response of cells and molecules to surface roughness and the impact of purely mechanical stresses attributed to roughness [21]. The life of the dental implant depends critically on its early stability following implantology, and the implant’s surface roughness is a key factor in this regard [22]. Following implantation, the titanium implant’s surface comes into direct contact with the surrounding tissues and cells [23]. Surface polish is therefore essential for increasing implant life, stability, and success rate. With a vast array of characteristics at its disposal, surface topography characterization is a challenging area of metrology. Two types of pores typically impact parts produced by direct metal laser sintering (DMLS): gas pores and lack of fusion pores [24]. The generated component typically contains a random distribution of gas pores, which are spherical in shape and have a diameter varying from 1 to 100 µm. Conversely, the absence of fusion holes typically has a larger size (100–150 µm) than gas pores and tends to take on an uneven and planar shape within the layers of the produced parts, perpendicular to the direction of construction [25].
Although implantology has evolved considerably, dental implant systems continue to present problems in both the implant–abutment connection and bone–implant interface [20,26,27]. Surface roughness plays a critical role in this regard; as such, the study assesses the influence of 3D printing orientation on volume parameters and micro-hardness near and away from the fractured surface. The study’s findings will then be used to create a laser shock peening computer model for dental implants in order to forecast osseointegration during implantology.

2. Methodology

2.1. Fabrication of Material

The authors used the Abaqus CAE software (Abaqus CAE software 2020, Dassault Systemes Simulia Corp, Johnston, RI, USA) to construct a dog bone tensile specimen, which was subsequently stored in the STL file format; see Figure 1. The titanium Ti-64 ELI powder sample was prepared using the direct metal laser sintering machine (EOS M280, Electro-Optical Systems, Krailling, Germany). Preheating the build plate to 40 °C was done before beginning the sample building. The particles had an average size of 39 ± 3 μm.
A volume rate of 1.68 mm 3/s was used to maintain a fixed layer thickness of 30 μm. This volume rate, together with numerous other variables, like the exposure parameters of the contours, supports, up and down skin, recoating time, Home-In, or LPM settings, determines the overall build speed. The EOS DMLSTM system handled the build job: an EOS M280 with a 63 μm mesh is advised for use in powder sieving. The EOSINT M 280 DMLS machine (EOS, Krailing, Germany) was utilized to fabricate the samples, utilizing the specifications indicated in Table 1. The print orientations of 60, 90, and 1800 were taken into consideration. The Central University of Technology was where the specimen fabrication was done. The selection of 3D printing parameters followed ISO 14801 [28] based on the chewing load of the dental implant at 90°, 60° and 180°, with 60° as a worst-case scenario.

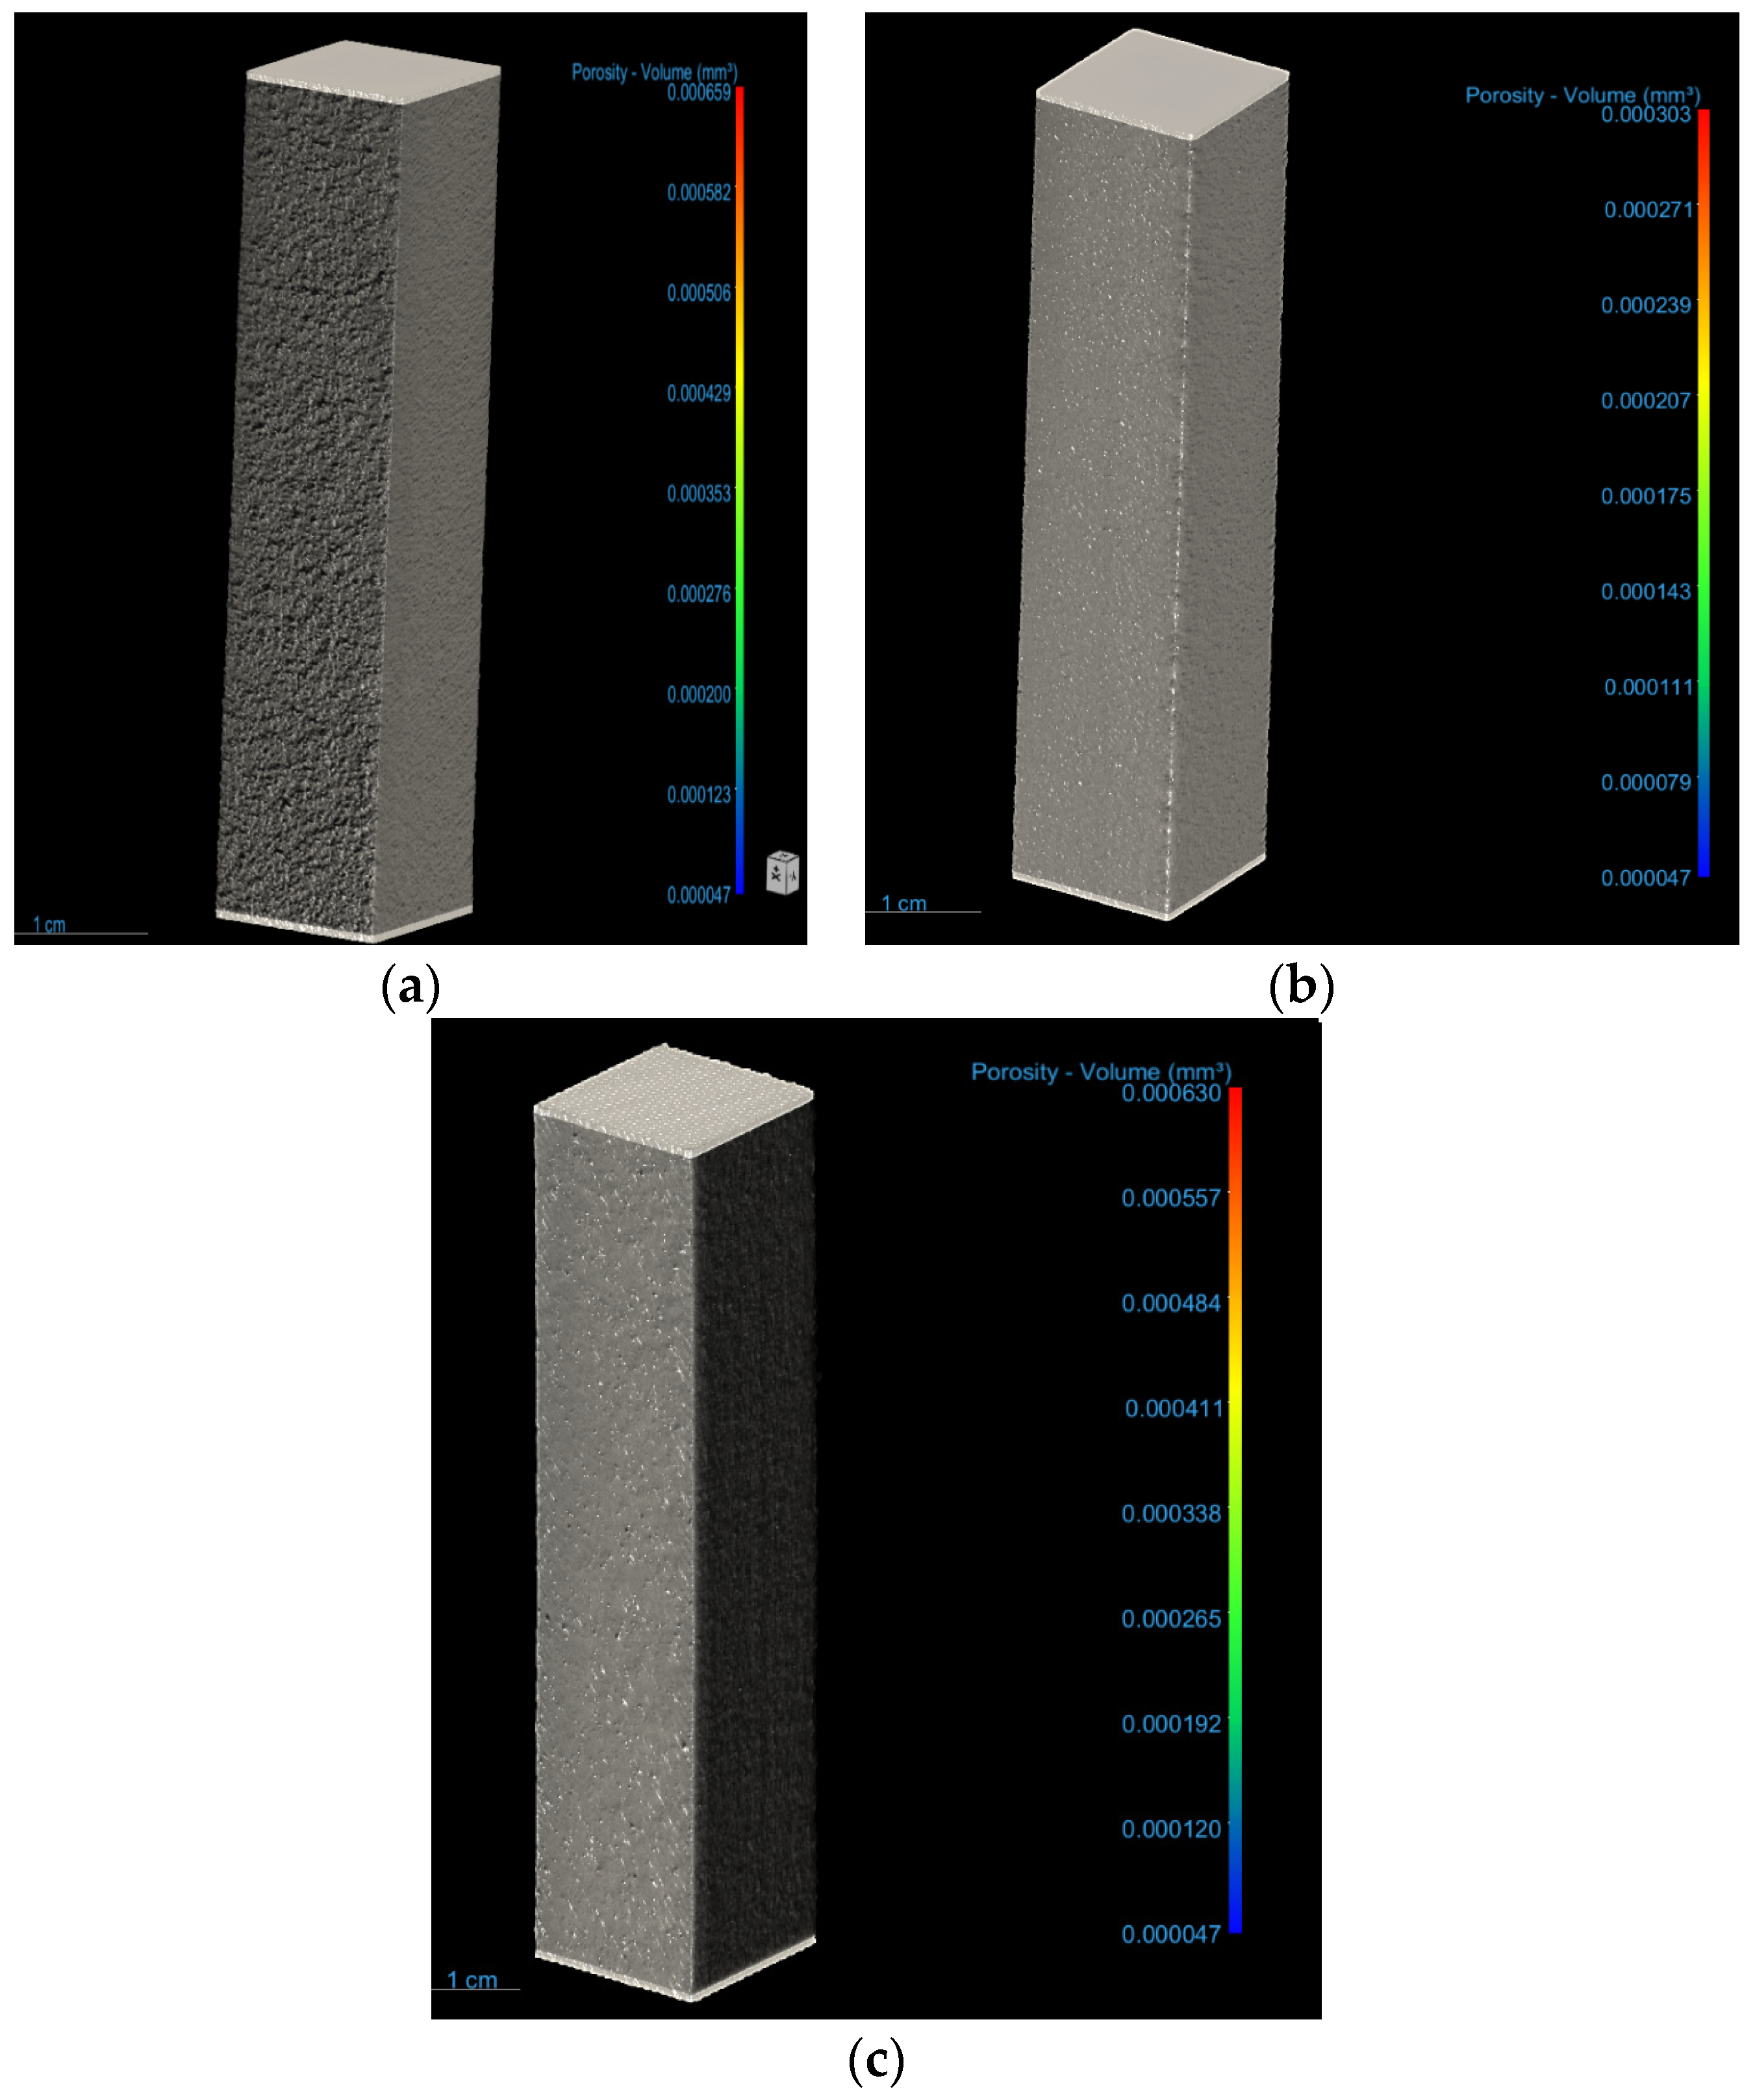
2.2. X-ray Computed Tomography to Analyse the Porosity on As-Built Ti64ELI Samples
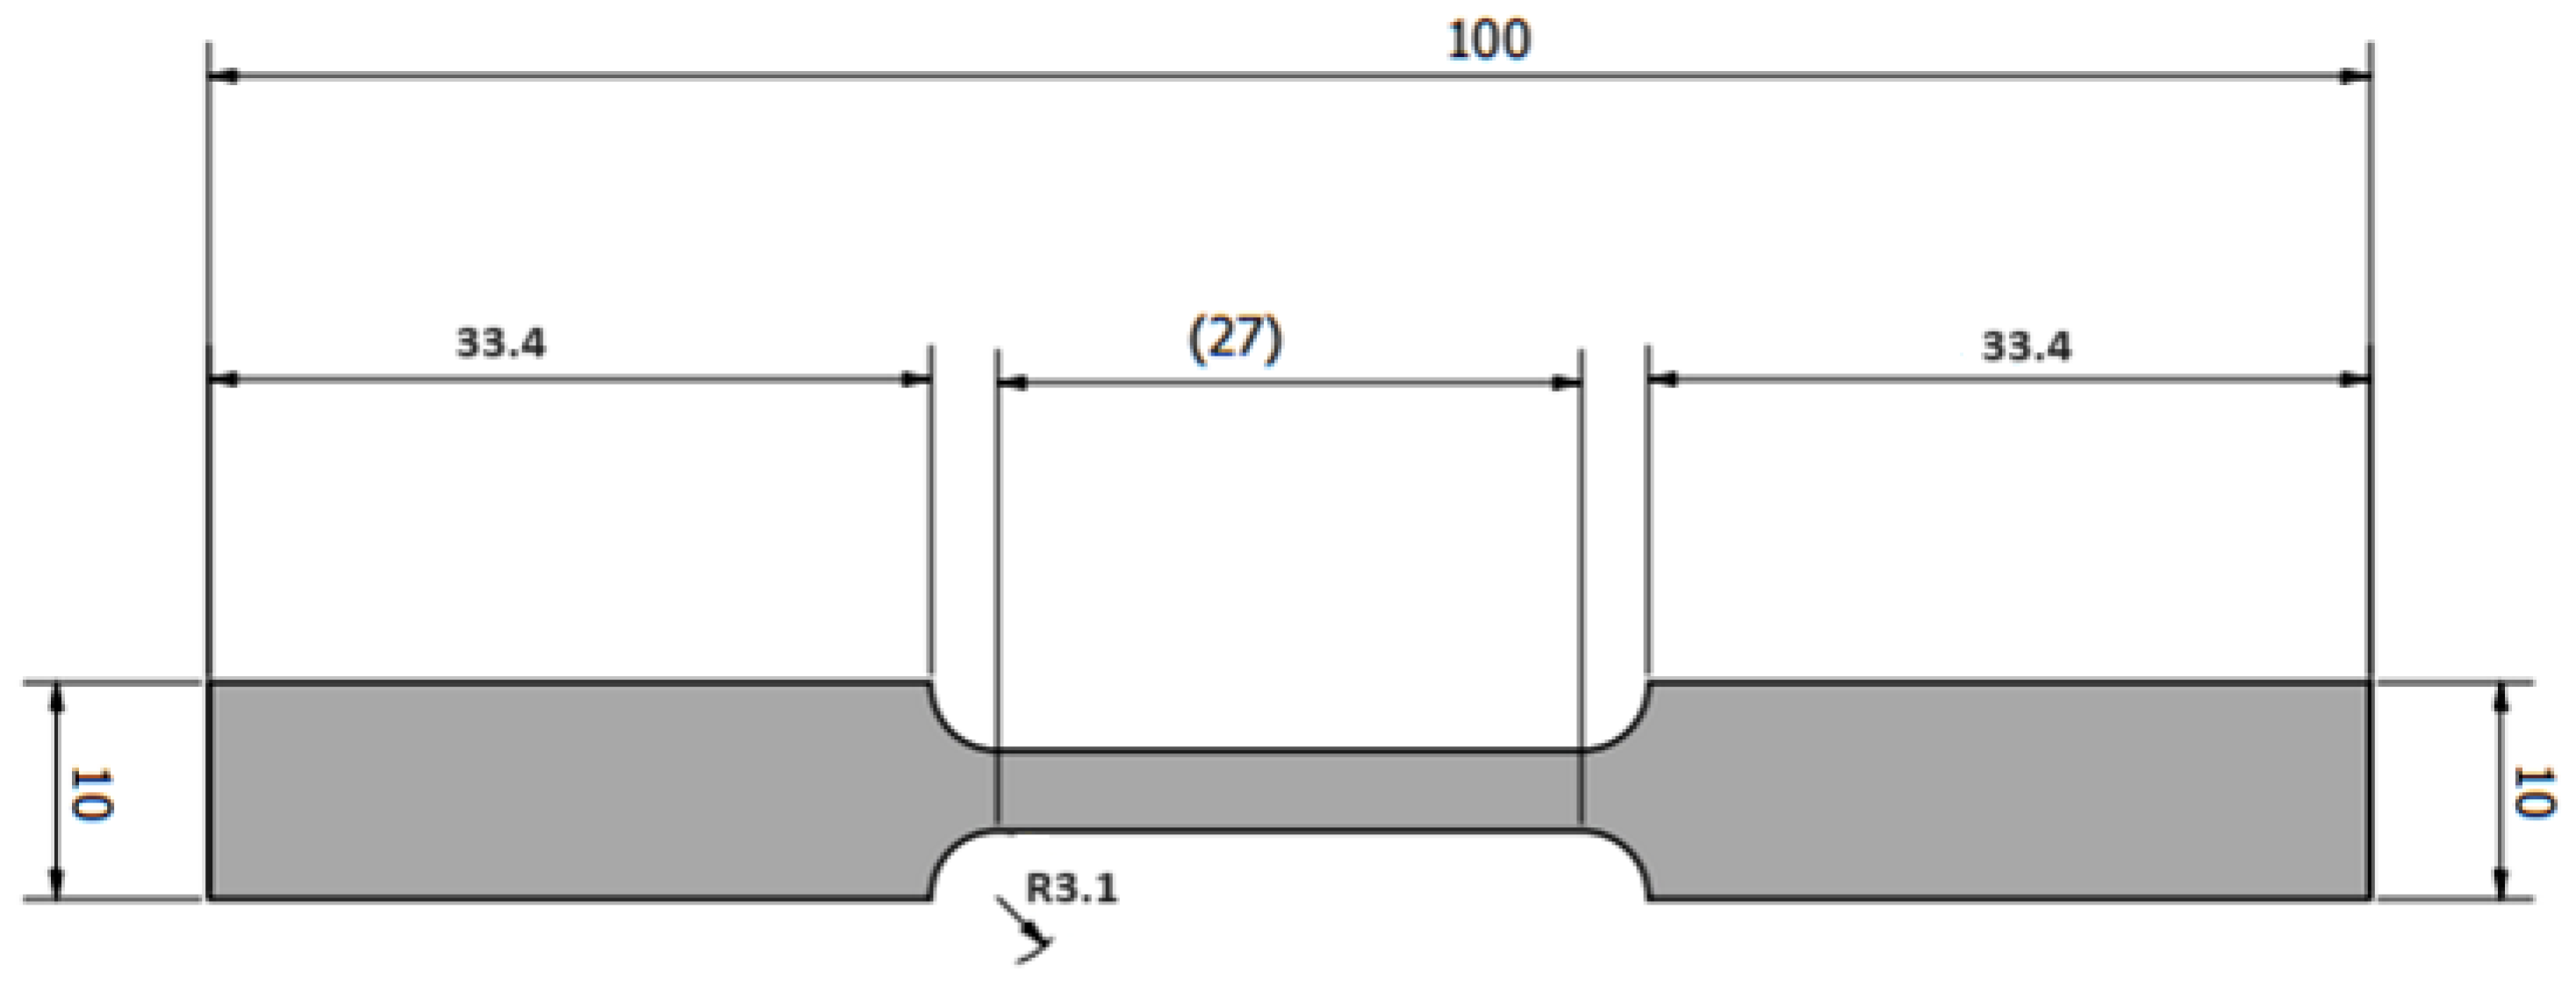
X-ray computed tomography (XCT) was employed to describe the spatial and size distribution of the residual pores in the 3D-printed as-built samples. Porosity characterization was carried out using X-ray tomography analysis, performed at the University of Stellenbosch CT facility [30]. A General Electric (GE) Nanotom S nanoCT scanner system (Wunstorff, Germany) with voltage and current set to 140 kV and 130 µA was used for the X-ray setting, using a 0.5 mm copper beam filter, with a voxel size set to 5.0 µm. Table 2 represent the experimental results acquired using the CT-scan. The image was acquired at a time of 500 ms per image and recorded in 2000 rotation steps during the full 360-degree rotation of the sample. The system-supplied Datos reconstruction software was used to reconstruct the image. GE Phoenix VTomeX L240 (Wunstorff, Germany) and Dragonfly 2022.2 were used to perform the CT scan and image analysis.

2.3. Tensile Test

An EOS 280 powder bed fusion printer was used to 3D-print the dog bone tensile specimens. The preparation of these specimens complied with ASTM standard E8/E8M-09, which specifies standard test procedures for metallic material tension testing [31]. A 100 kN Instron electro-mechanical controlled testing apparatus (Instron, Norwood, MA, USA) was used to conduct the tensile test. Three millimeters per minute was the crosshead velocity used to load the apparatus. Three (3) 3D-printed specimens were evaluated for every printing orientation in order to take statistics into account. After necking, the specimen was eventually shattered. Table 3 displays the recorded values for the highest force, tensile strain, tensile stress at yield (offset 0.2%), and E-modulus.

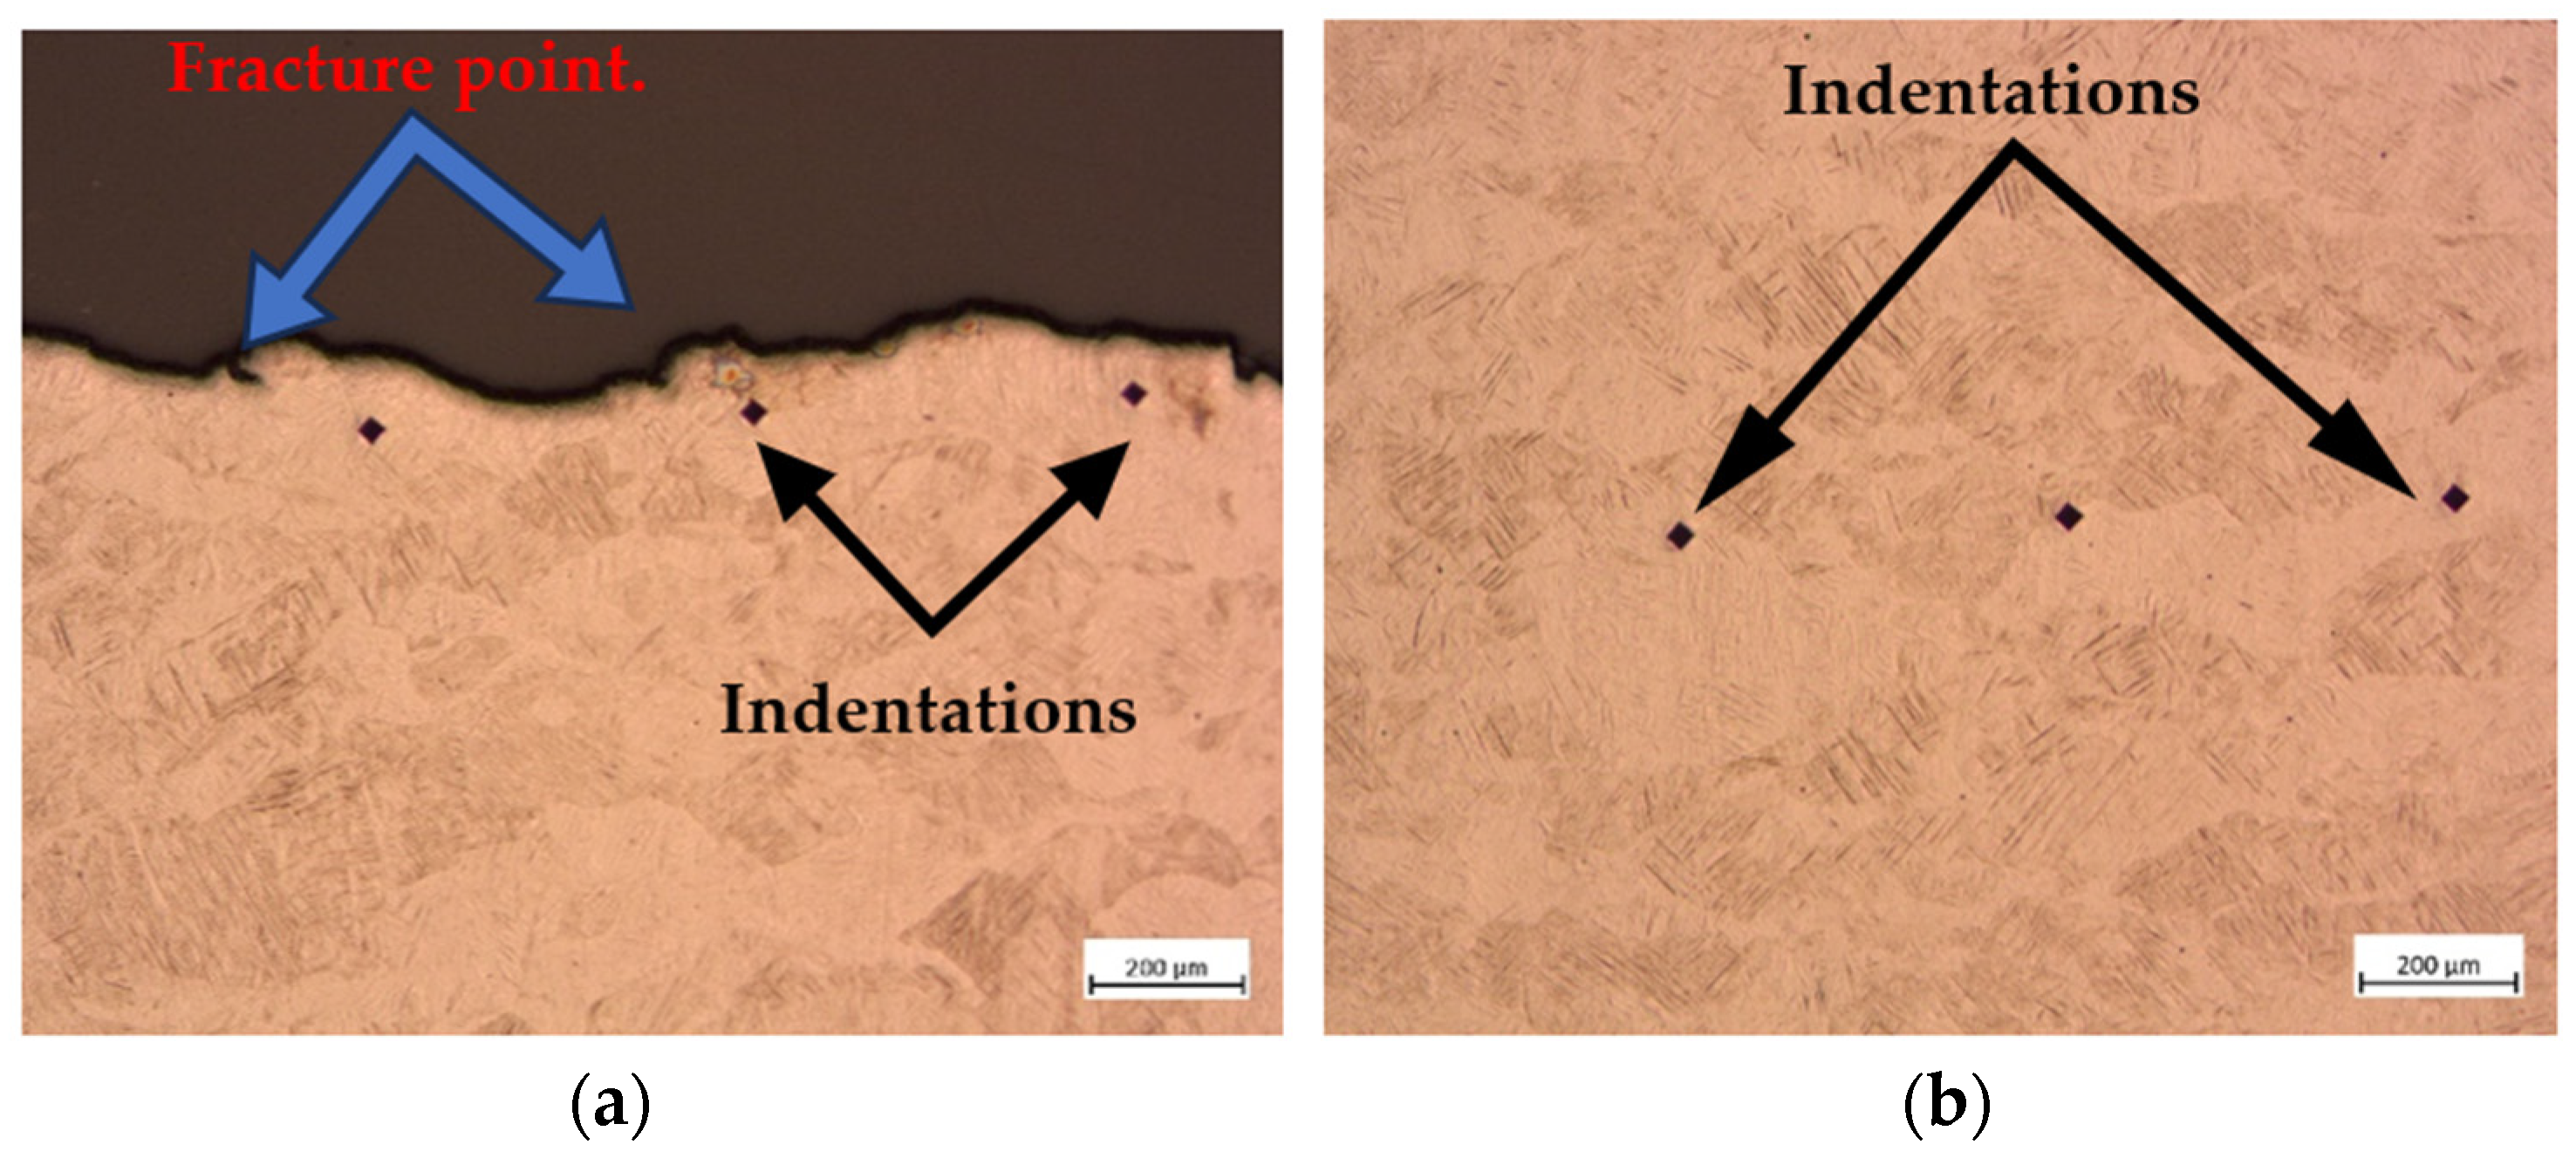
2.4. Scanning Electron Microscope (SEM) and Micro-Hardness Test on the Fractured Surface

Using an optical microscope, the ZEISS Axio Scope A1 (ZEISS, Oberkochen, Germany) was used to determine the microstructural morphologies of the titanium alloy samples both before and following the micro-hardness studies and tensile test. The mounted samples that were completed prior to micro-structuring are shown in Figure 2b. According to Struers Application Notes on the metallographic preparation of titanium [7], Kroll’s reagent was made with 100 mL of distilled water, 23 mL of hydrofluoric acid, and 46 mL of nitric acid prior to light microscope observation. After being etched for ten to fifteen seconds, the samples were dried, rinsed with clean tap water, and then sprinkled with acetone. All recorded samples’ microstructures were examined using an optical microscope, a ZEISS Axio Scope A1. The Vickers hardness micro-hardness test was carried out from the fractured point to the center of the tested tensile specimen. Two directions were considered, namely, vertical and horizontal, making three indents equally spaced on each specimen. The hardness test of the 3D-printed samples was carried out 20 μm away from the fracture point, 420 μm away from the fracture and 840 μm away from the fracture. A minimum of 7 indentations were made on the polished surfaces of each sample using a 2942 mN load with a dwell time of 10 s. The results for each indentation made on the 3D-printed samples at various orientations were then recorded in Table 4.

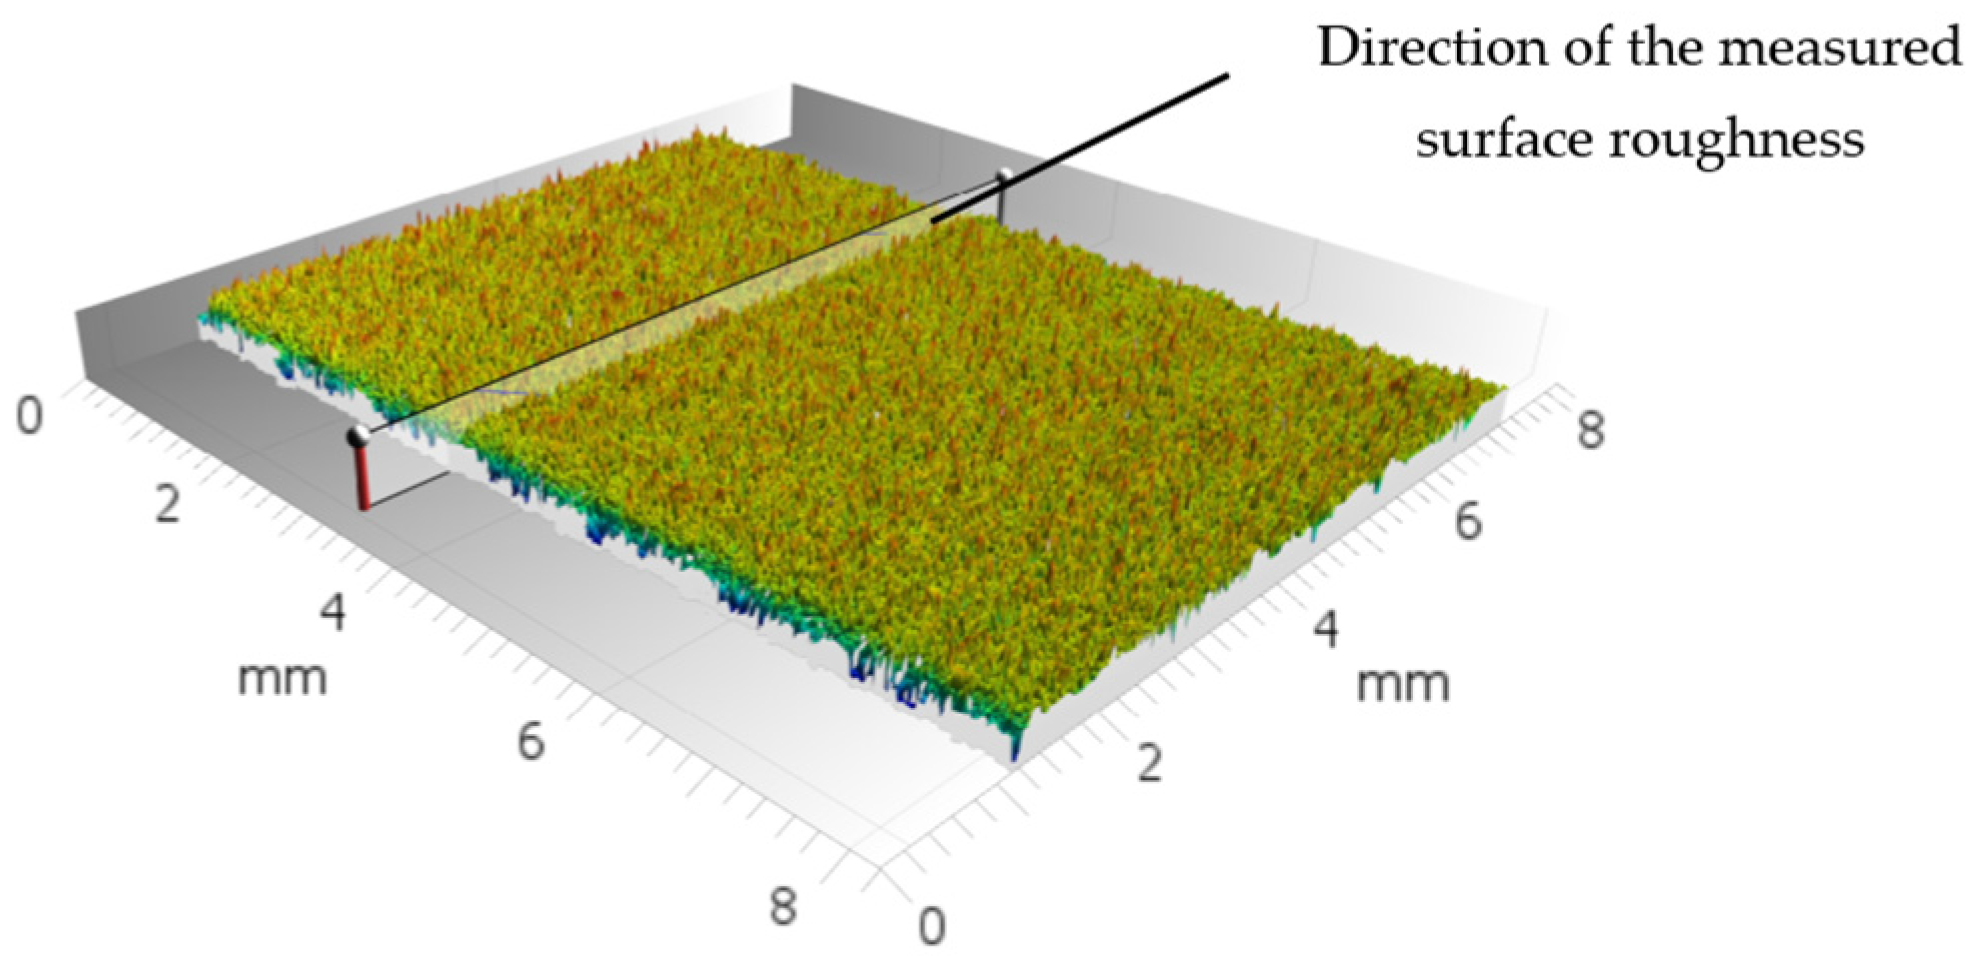
2.5. Surface Roughness Test

Through surface roughness experiments, the impact of Ti64ELI printed at different orientations on volume characteristics was investigated. The specimens were set up in a ZEISS LSM 900 materials confocal microscope specimen holder [19]. The surface roughness values of the 3D-printed dog bone tensile test specimens were measured horizontally. After selecting a 10× microscopic laser, the master grain was modified until the ideal value was attained. The average of these measurements was used to calculate the surface roughness values. Table 5 and Table 6 include the examined samples’ results.

3. Results and Discussion

3.1. Porosity Analysis
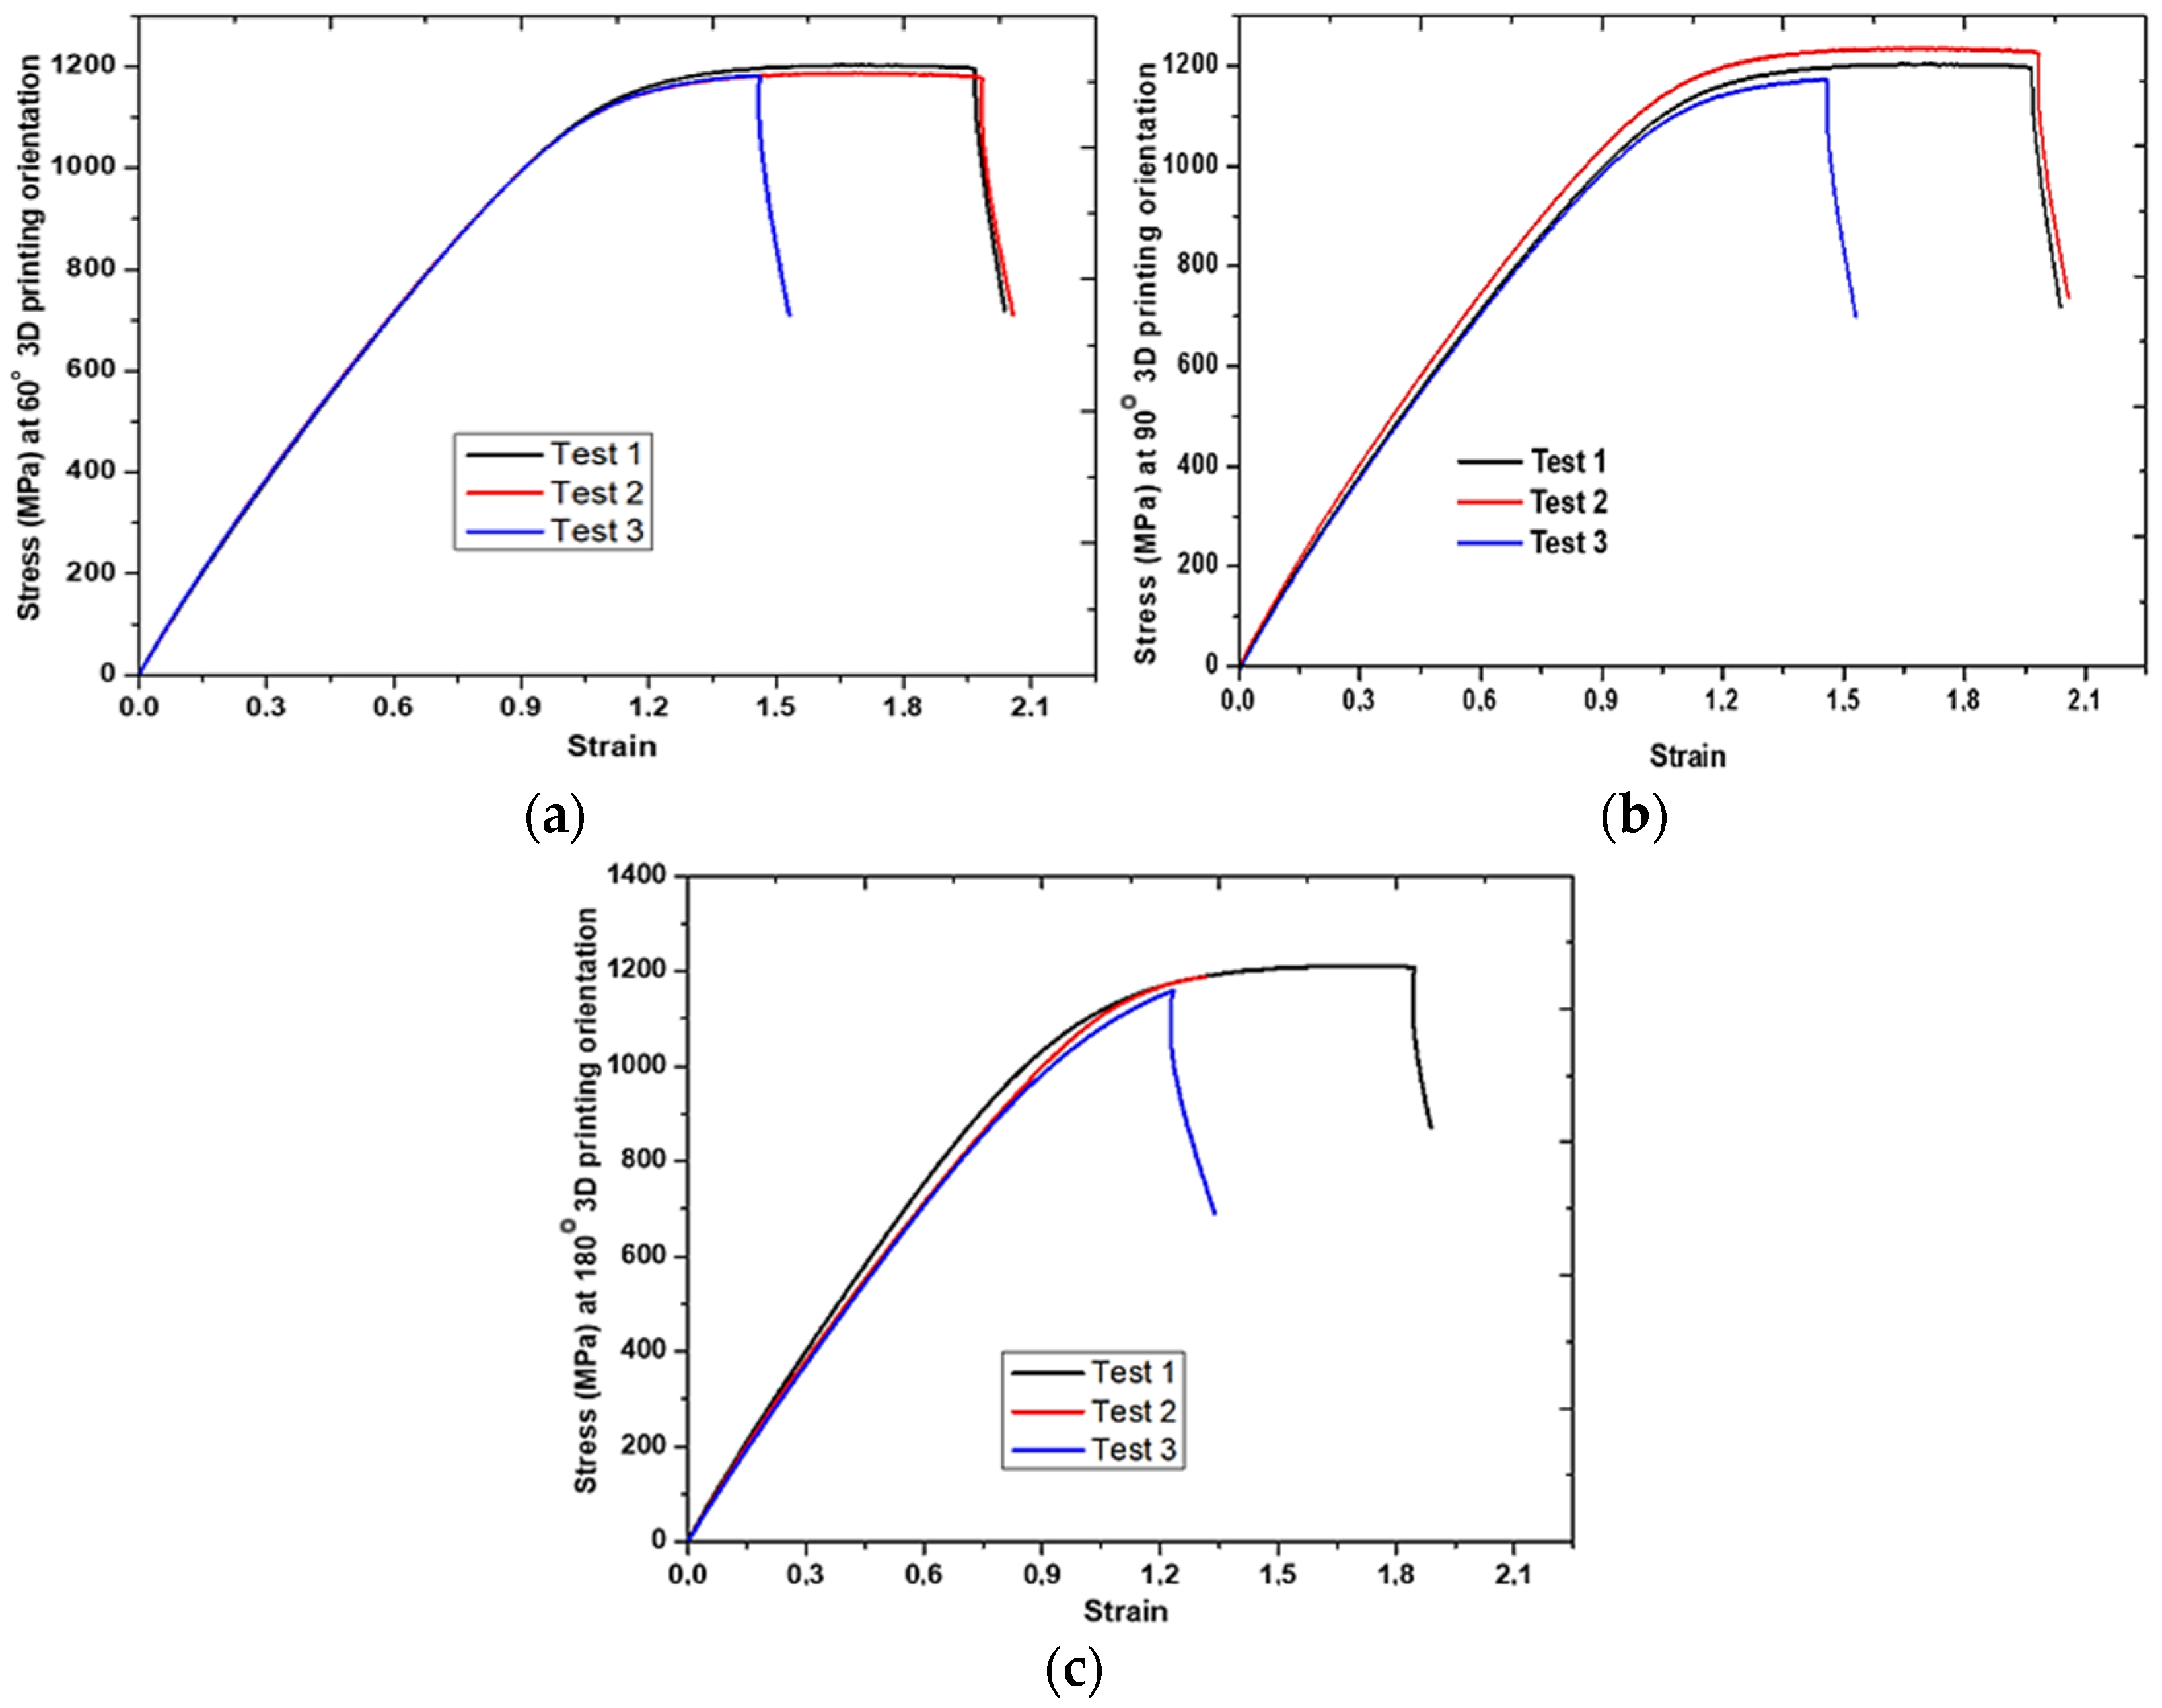
The results obtained from the CT scans of the 3D-printed builds at various printing orientations are presented in Table 2 and Figure 2. The experimental data were acquired before the tensile test was carried out. Initially the volume of material used to fabricate the samples was measured, and it was found that 60° tensile bars have 930.87 mm3; this further increased by 3.6% when using the 90° orientations. When evaluating 180° printing orientated samples, it was observed that there was an increase in material volume of 3% as compared to the 90° tensile bars. The current results demonstrate that each printing orientation has an effect on the material used for fabrication. It was previously reported that DMLS-produced parts are usually affected by two types of pores: gas pores and lack of fusion pores [25].
In this study, the pores that were formed during the manufacturing of tensile test bars printed at various orientations are being investigated. Similarly, a CT-scan was previously carried out on a lattice sample manufactured using an EOS M280 system [30,32,33]. The current study revealed that when 60° tensile bars were analyzed, it was found that the volumes of pores were 0.005383 mm3. Furthermore, when 90° tensile bars were evaluated, there was a decrease in the number of pores found in the sample of 32%. However, when 180° tensile bars were measured, there was an increase in the number of pores contained in the samples, which was reported to be 0.005826 mm3. The current results demonstrate that by using a 3D printing orientation of 90°, the number of pores in the material can be decreased, which will then contribute towards lower mechanical properties of the samples. The percentage ratio of the samples at 60°, 90° and 180° orientations were reported to be 0.000578, 0.00179 and 0.000585%, respectively.

3.2. Tensile Test

The results reported in Table 3 are graphically presented in Figure 3a–c. The tensile test samples were experimentally tested. The results are the average of each of the three specimens tested with standard deviations.
The mechanical properties of as-built 3D-printed tensile specimens were evaluated regarding yield strength, maximum force, and modulus of elasticity. The average mean yield stress of 60° tensile bars was reported to be 764.12 MPa; this was further decreased by 3.96% when 90° tensile bars were assessed. Furthermore, 180° tensile bars were tested, and it was reported that the maximum stress was 866.63 MPa. These results agree favorably with previously test samples [19,34,35]. The study has revealed that the tensile strength at yield with a 180° orientation exhibited higher mechanical properties as compared to 60° and 90° orientations. The maximum forces at 60°, 90° and 180° were reported to be 42.90, 41.85 and 43.12 kN, respectively. The modulus of elasticity values of the samples were examined, and it was found that 60° orientations had the highest modulus of 53,375.20 MPa. When 90° printing orientation was considered, we observed a lower modulus of 52,027.69 MPa, which then increased to 52,218.85 MPa when using 180° printing orientation. The outcome of this study demonstrates that the printing orientation has an influence on mechanical properties. This confirms the results that were previously discussed as part of the porosity analysis (Figure 2c), where 180° samples exhibited lower pores, which then contributed towards the higher mechanical properties at yield stress.

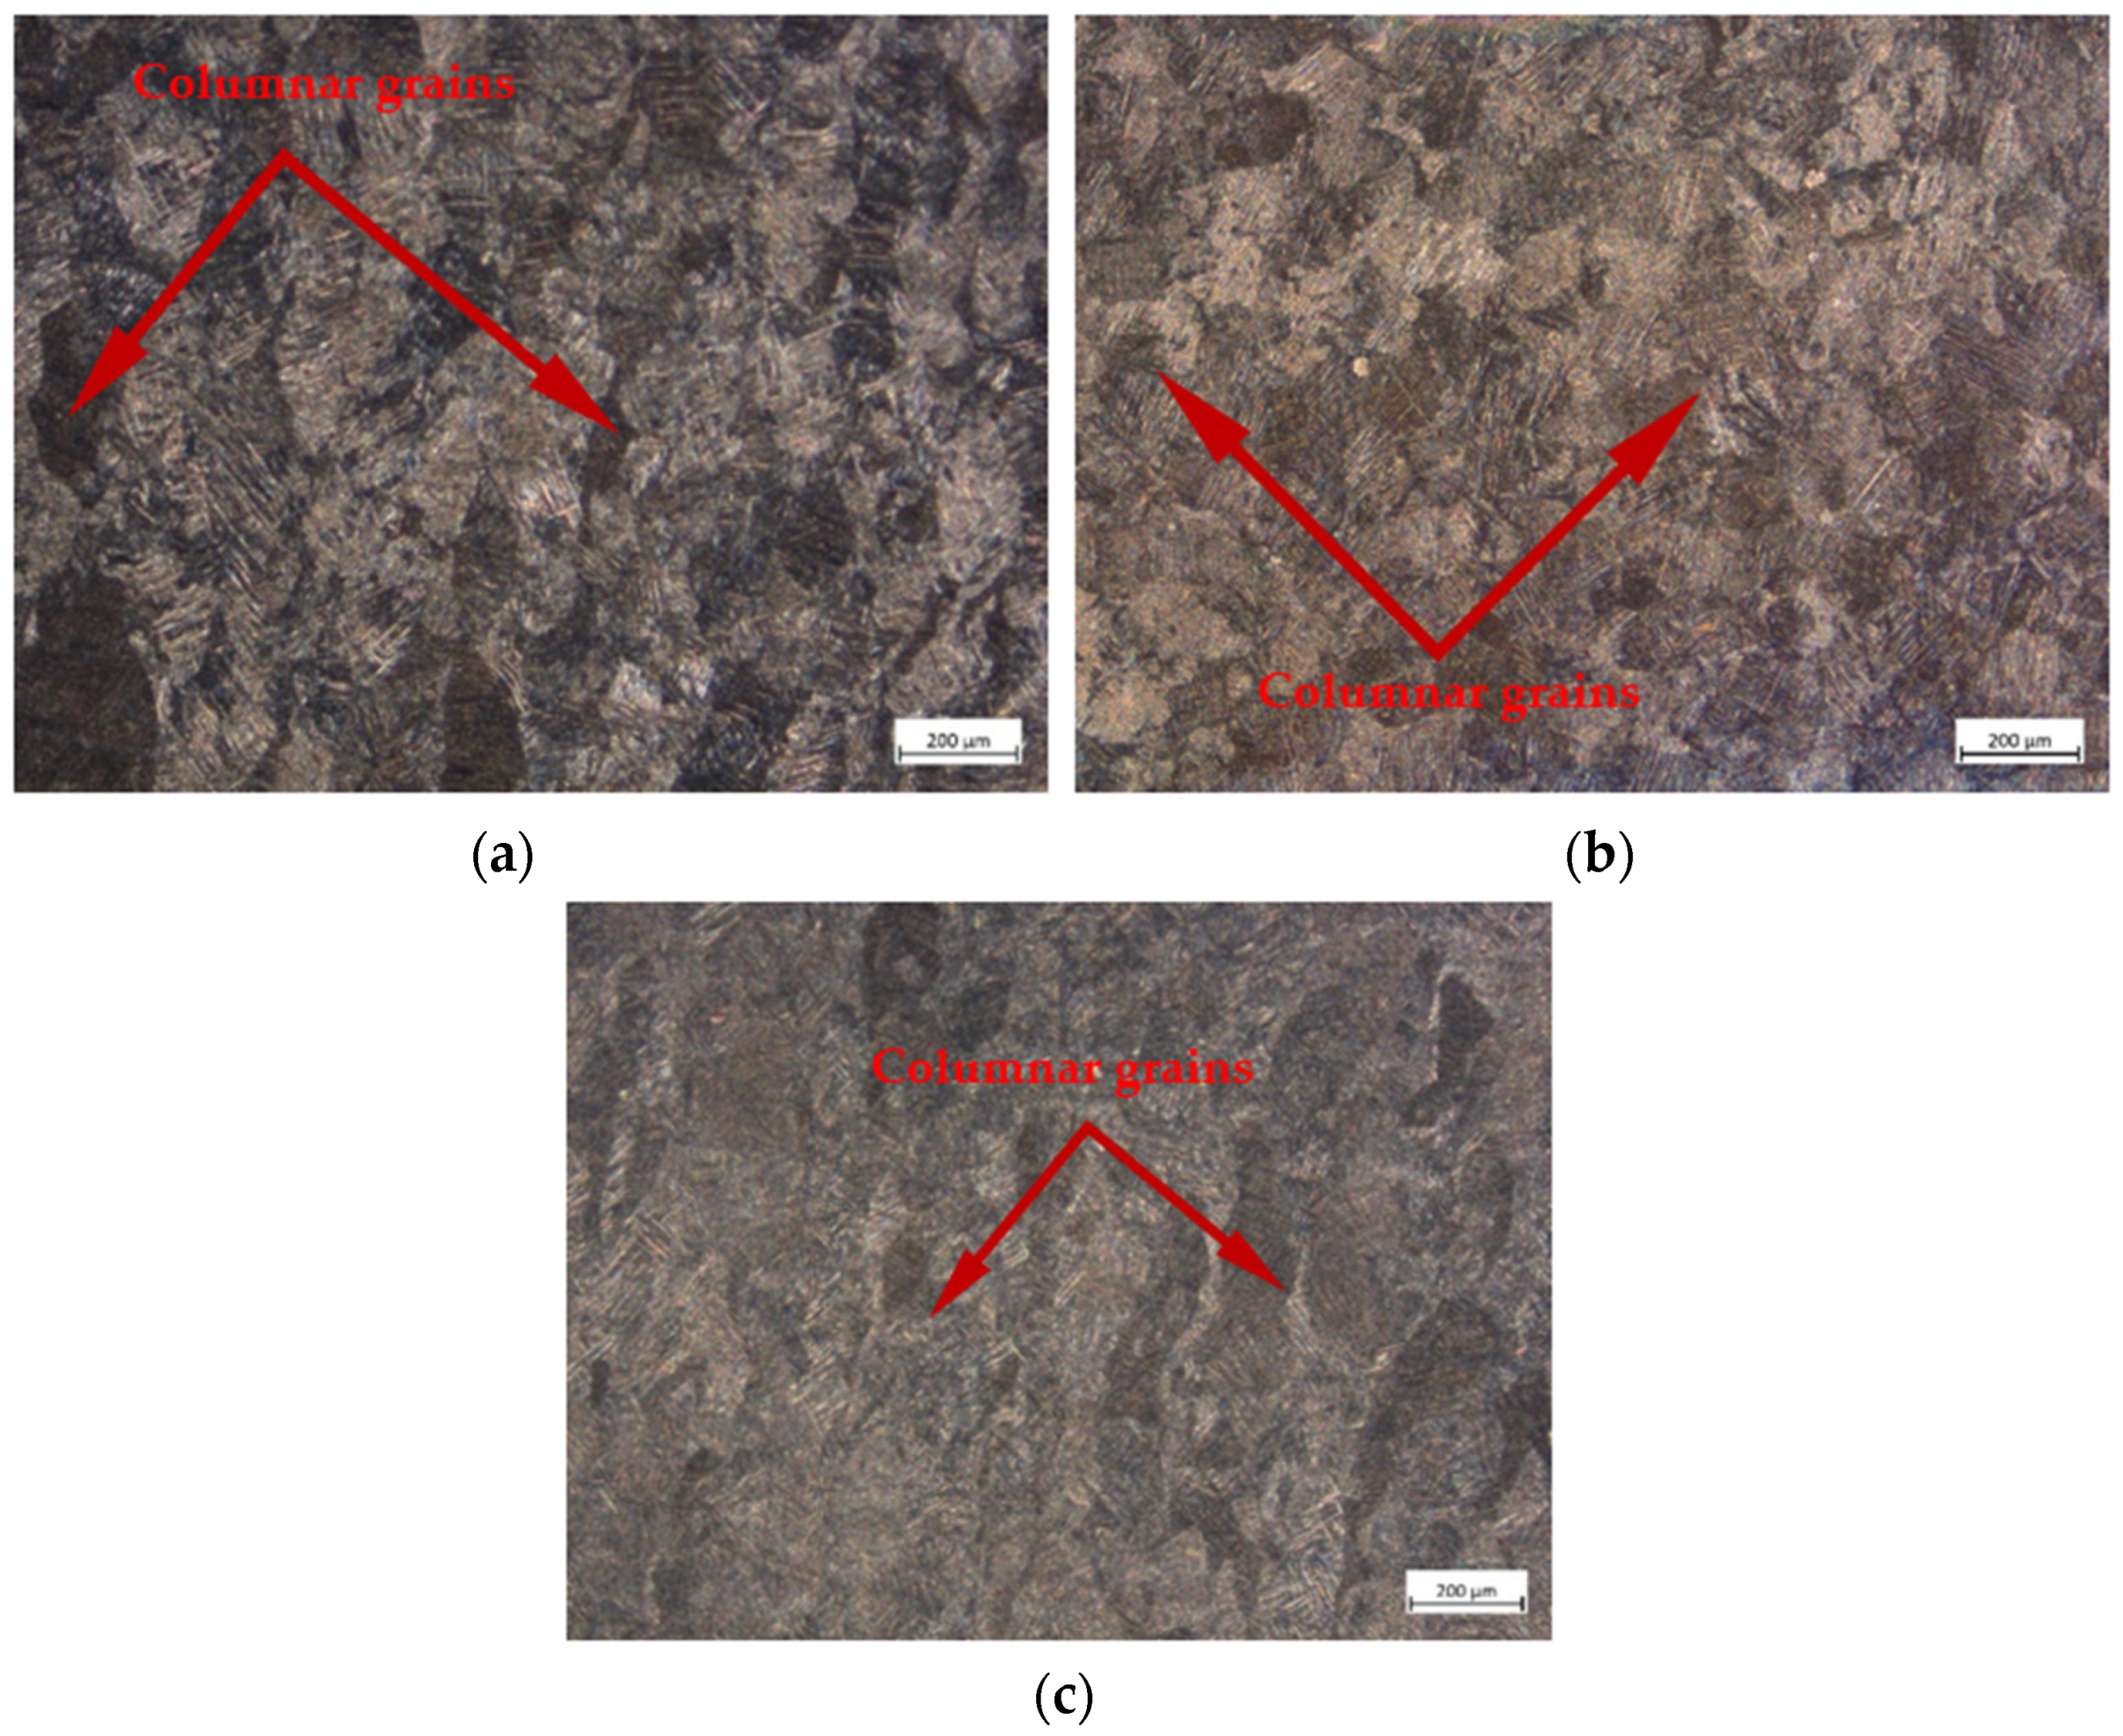
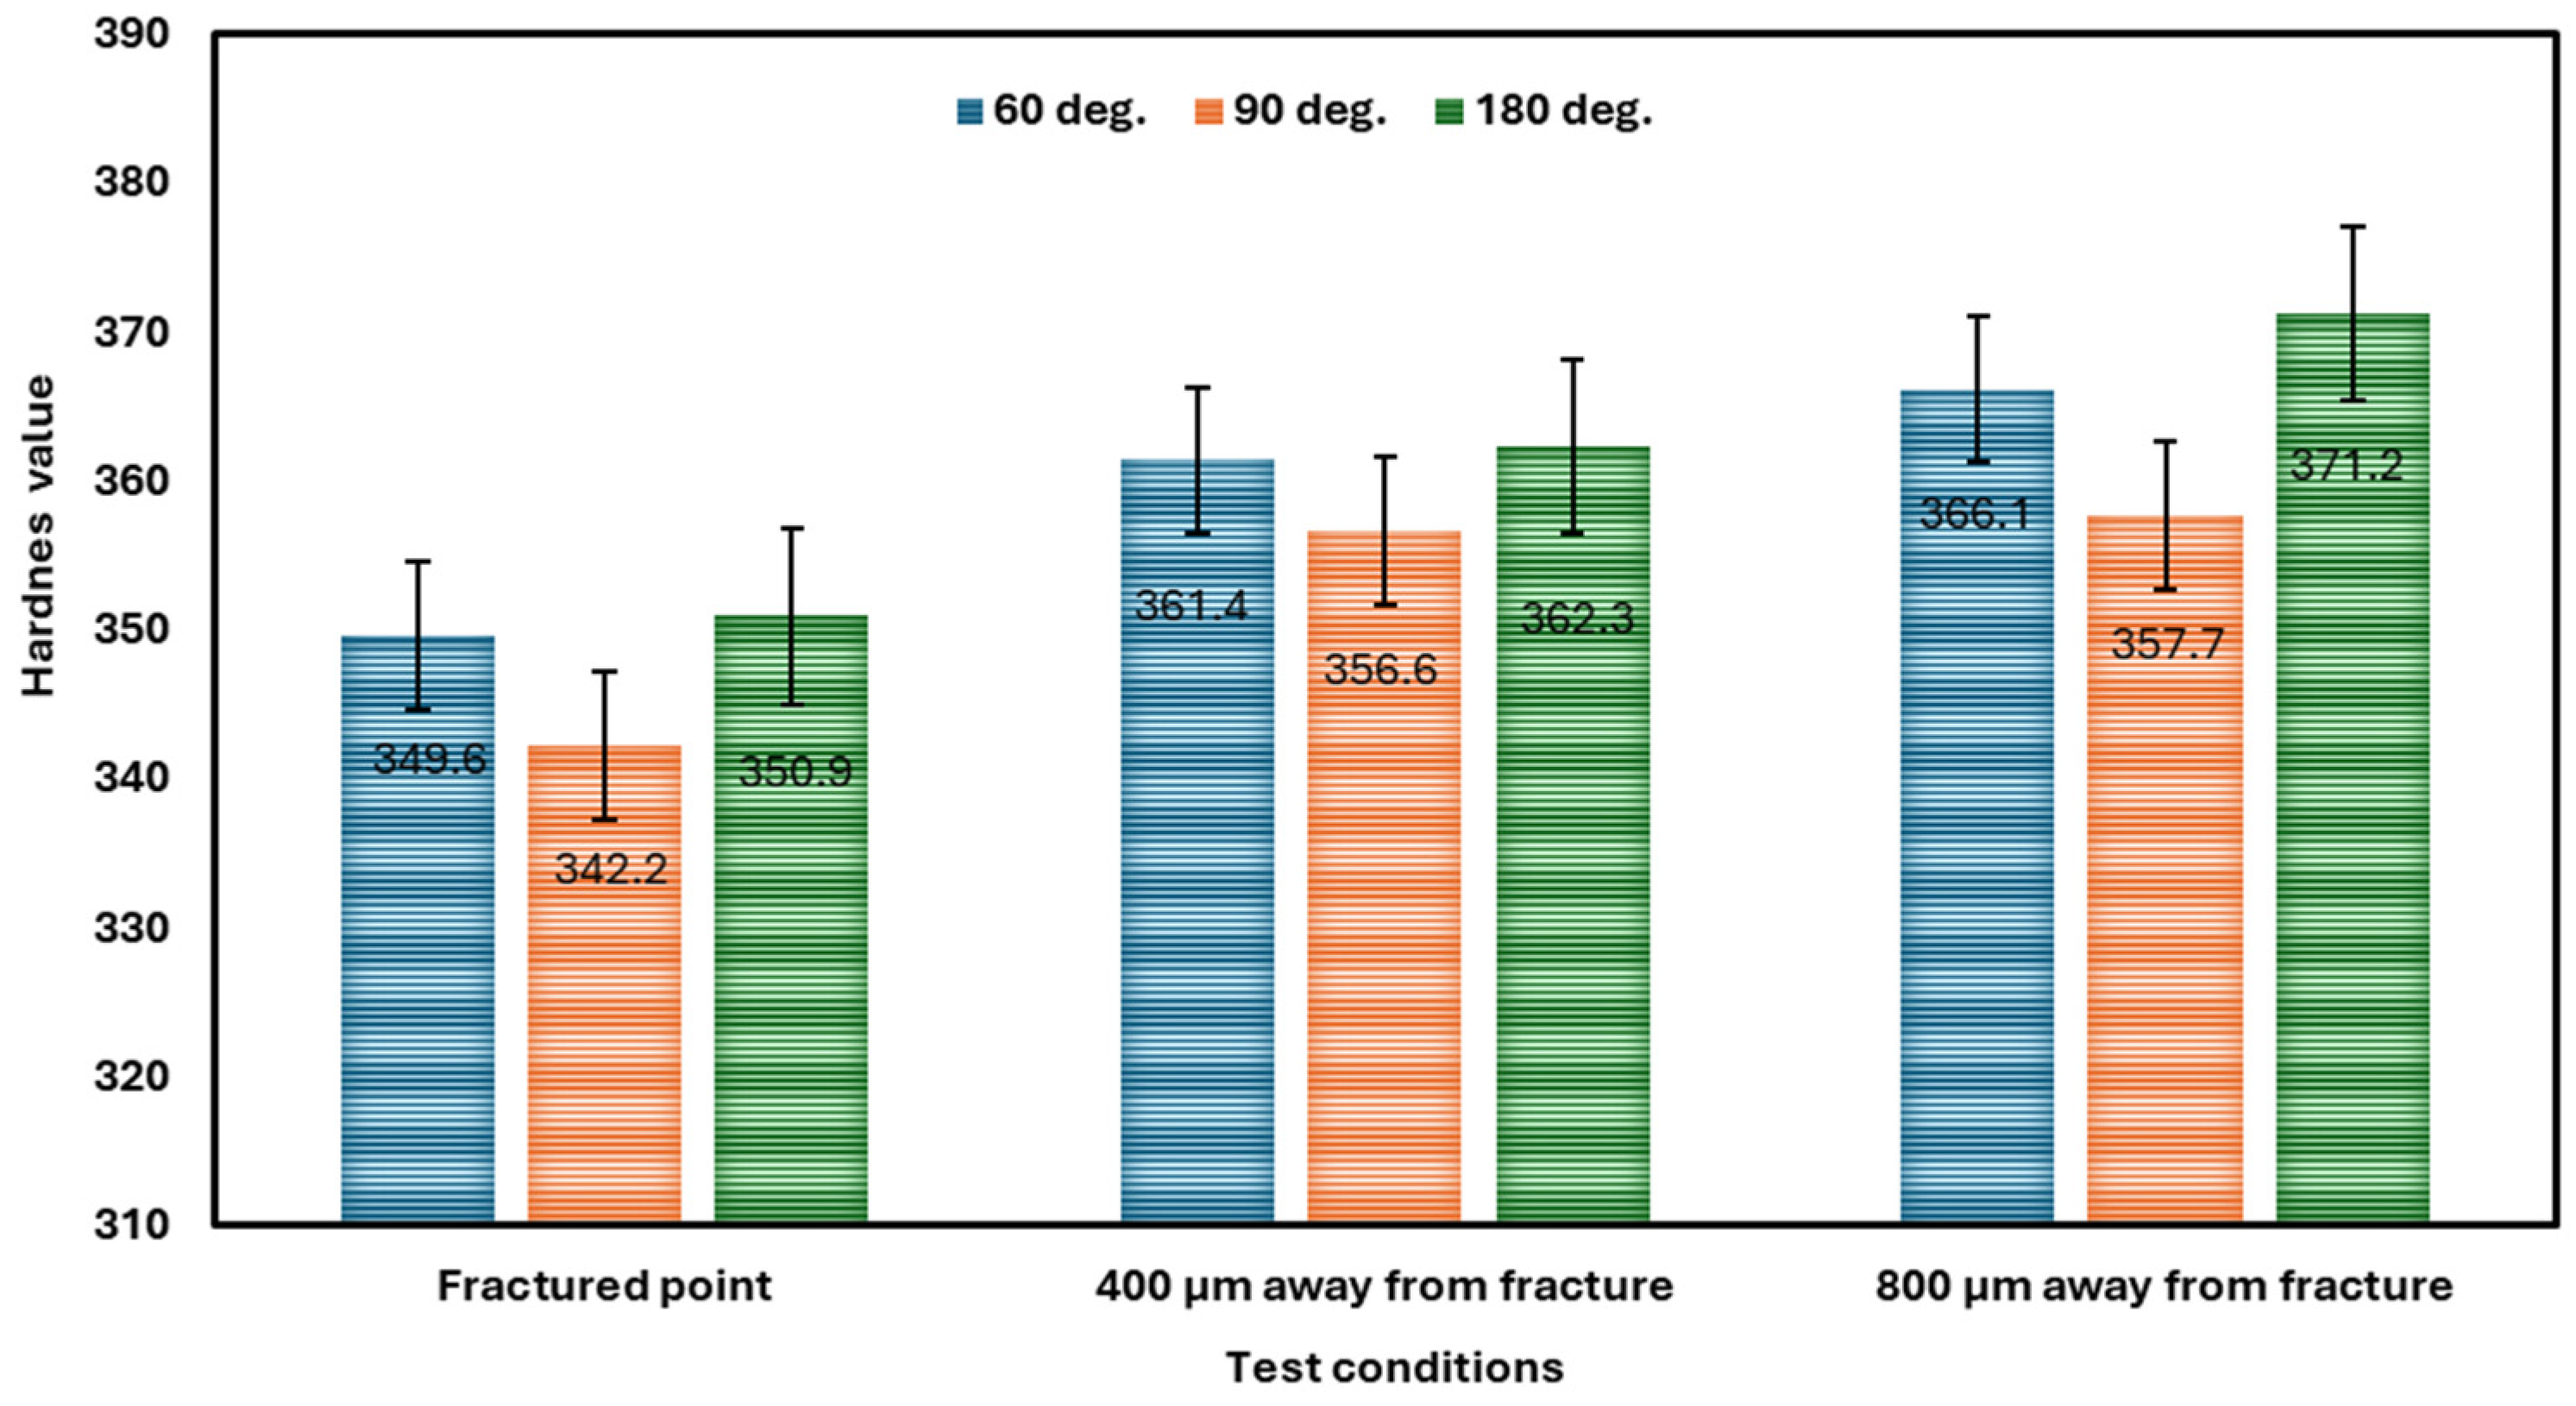
3.3. Micro-Hardness and Micro-Structure

The micro-hardness value results reported in Table 4 are graphically presented in Figure 4. Figure 5 displays the micro-hardnesses of three indentations at the fracture point and away from the fractured zone. It was observed that 60° orientations exhibited a micro-hardness value of 349.6, and this value was increased by 0.37% when a 180° orientation was measured. The lowest HV value was observed with 90° orientations to be 342.2. Furthermore, the test was carried out at 420 μm away from fracture point. It was discovered that samples with 60° orientations had 361.4 HV, which further increased to 362.3 HV when 180° orientation samples were measured. However, at 180° orientation, it was observed that samples had the lowest HV of 356.6. Due to the presence of α’-martensite, it was reported that parts made using the direct metal laser sintering technique had micro-hardness values of about 370 HV (37.7HRC) [36]. The micro-hardness was measured at 840 μm away from the fractured surface; it was discovered that 60° orientations had 366.1 HV. This value further increased to 371.2 HV when 180° printing orientation samples were tested. However, the lowest HV value was observed to be 357.7 HV at a 90° printing orientation.
The current results demonstrate that, as we move away from the fractured, point the HV increases. The samples that showed the highest HV values were 3D-printed with 90° orientations, followed by 60° and 180° orientations. The results furthermore confirm that there is an influence of printing orientation on mechanical properties, and the different mechanical tests applied to samples contribute significantly towards the application of that material. Similarly, the HV of Ti64ELI was tested previously, and the results compare favorably [7].
Figure 6a–c shows a checkerboard pattern at 200 μm magnification. Due of the high cooling rates during the LaserCUSING process, a totally acicular α’ martensitic microstructure is indicated by a needle-like shape [37]. All of the samples have large columnar grains that are aligned parallel to the layer’s growth (Figure 6a–c). The grains can be recognized as earlier beta grains that had been epitaxially consolidated [35].

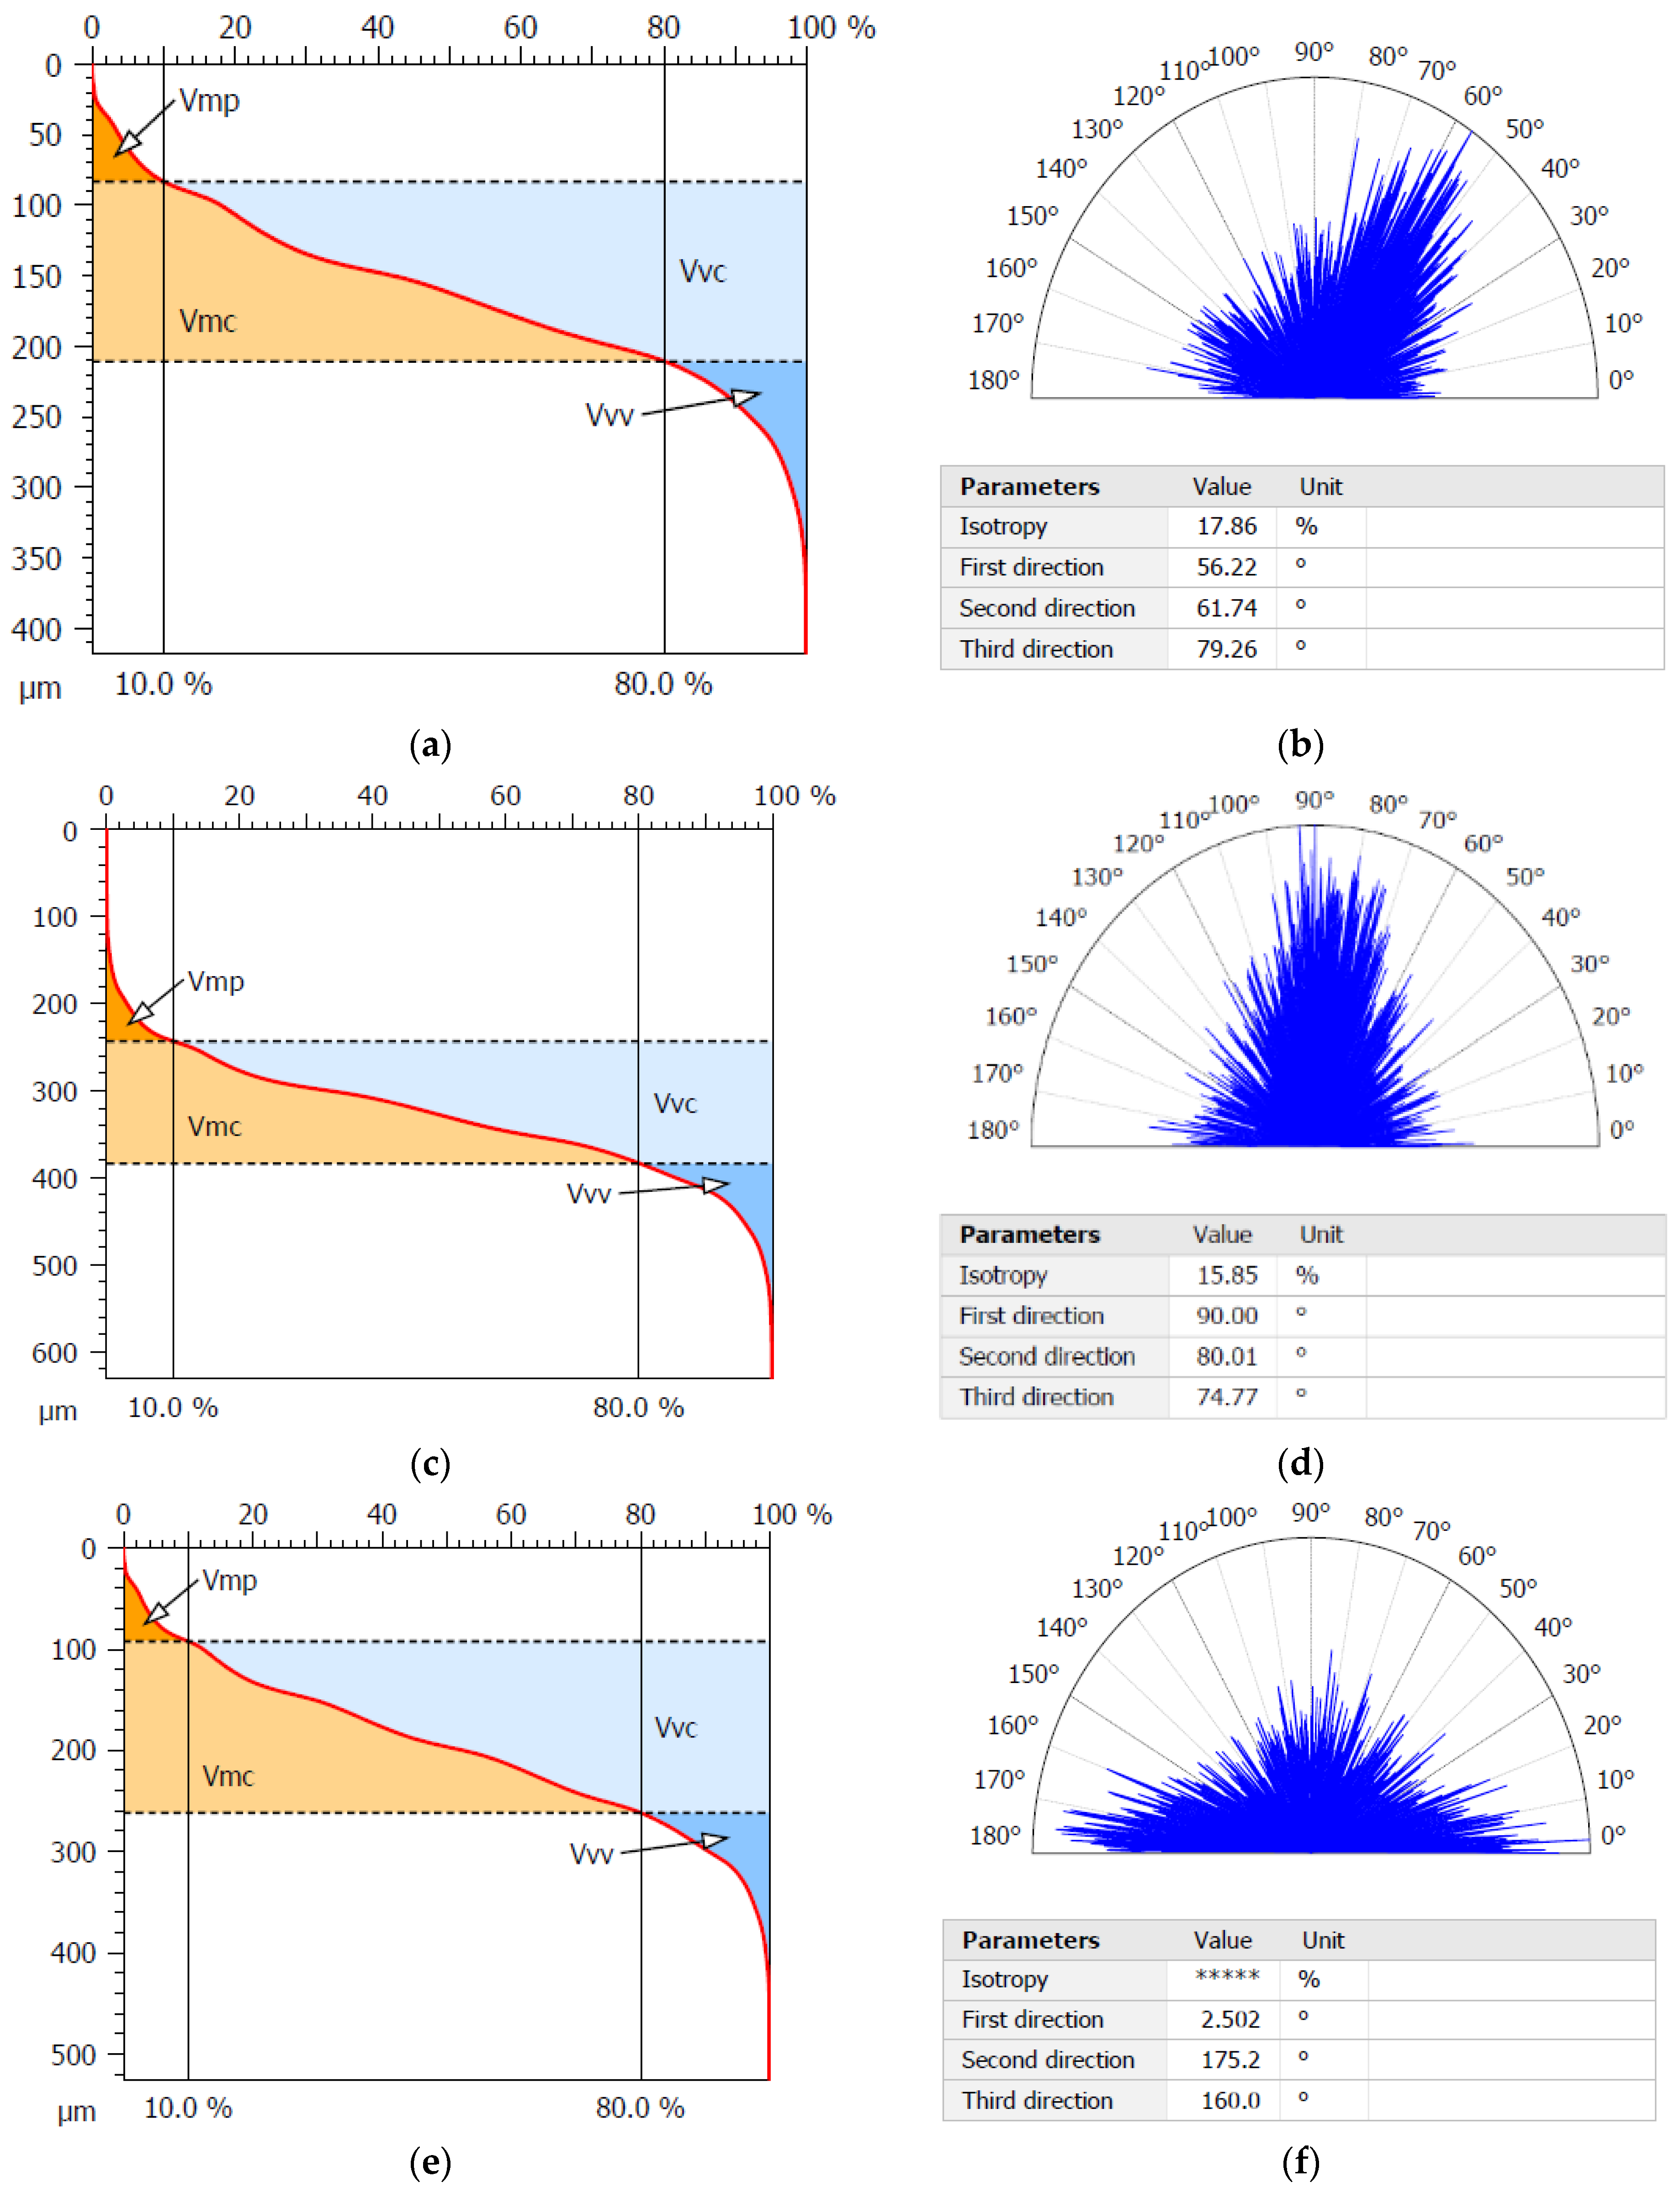
3.4. The Effect of Printing Orientation on Volume Parameters and Surface Roughness Parameters

The above-mentioned test results are an attempt to determine the geometrical texture of elements produced through powder bed fusion measured horizontally; see Figure 7. Figure 8 and Table 5 show the distributions of the volume parameters for the 60°, 90°, and 180° printing orientations. It was observed that the valley void volume (Vvv) of the material at 60° orientations was 0.007818 mm3/mm2 and increased as the 90° orientations were evaluated, to 0.008489 mm3/mm2.
Similarly, it was observed that with a 180° orientation, the Vvv was closer to 0.008815 mm3/mm2. In order to characterize open surface pores, it makes sense to utilize the valley void volume parameter, which is one of the members of the volume parameter family, and represents the void volume per unit area. The peak material volumes (Vmp) of the samples were evaluated, and it was found that with 60° orientation, a 0.002653 mm3/mm2 was observed, which increased to 0.003239 mm3/mm2 for 90° orientations. A further decrease to 0.002637 mm3/mm2 for the 180° orientation was considered. As such, the peak material volume is considered to have been greater with the 90° orientations as compared to those for the 60° and 180° orientations. The material volume difference at the real material ratio q% and real material ratio p% is represented by the core material volume (Vmc). Quantifying the size of the core surface, diminished peaks, and diminished valleys based on volume characteristics may also be done in this way.
The core material volume was estimated, and it was discovered that when applying the 60° orientation, the Vmc was 0.05266 mm3/mm2, which increased by 11.48% for the 90° orientation. When using the 180° orientation, it was observed that the Vmc was 0.07094 mm3/mm2. It is worth noting that, as regards the Vmc measurement, the samples that demonstrated higher properties were those with a 180° printed orientation. A further crucial parameter to take into account is the core void volume (Vvc), which can be used to quantify the magnitude of the reduced peaks and valleys based on volume parameters. This represents the difference between the void volume at the real material ratio p% and the void volume at the real material ratio q%.
The Vvc was observed to be 0.0747 mm3/mm2 for the 60° orientation, and this increased to 0.08053 mm3/mm2 when the 90° orientation was evaluated. Furthermore, for the 180° orientation, the Vvc was at its highest, at 0.09838 mm3/mm2.
According to earlier research, digital models can be placed on the building platform, and the printing orientation significantly affects the surface texture quality [19,38]. Furthermore, Sq parameters were evaluated, and it was found that when using the 60° orientation it was 55.99 μm, and increased by 7% when 90° orientations were considered. However, when 180° orientation was tested, the Sq parameter was found to be 57.78 μm. The extension of Ra (the arithmetical mean height of a line) to a surface is known as the arithmetical mean height (Sa). It represents the height difference between each point and the surface’s arithmetical mean as an absolute value. The general purpose of this measure is to assess surface roughness. In this study, it was observed that the Sa at 60° orientation was 43.68 μm. It was further increased by 6% for the 90° orientations, as seen in Table 6. However, when 180° orientations were evaluated, it was found there was a decrease in the surface roughness of the material to 45.28 μm.

3.5. Application of the Study, Comparison of Current Work and Experimental Results in Literature

Volume parameters and functional needs have shown a high correlation in several applications [39]. Determining the extent of surface wear and degradation involves analyzing the topography and roughness of the surface [40]. After analyzing the electron beam melting (EBM) process and characterizing surface roughness, the authors discovered that the mean roughness value (Ra) matched that in the literature on the EBM method [41]. The experimental examination of five tensile specimens fabricated from Ti-64 with varying roughness profiles revealed that Ti-64 is very sensitive to the roughness’s amplitude and direction [42]. Similarly, in this study, the as-built samples exhibited higher strength at yield at the 180° orientation, and also exhibited higher mechanical properties as compared to the 60° and 90° orientations. The 3D surface texture parameters, which enable the evaluation of 3D surface topography using XCT measurement data, were developed in addition to several surface texture characteristics depending on the map of the surface height [43]. These three-dimensional surface parameters consist of feature parameters derived from three-dimensional watershed segmentation, height parameters, hybrid parameters, and volume parameters. When high laser power and low scan speed are combined, the area of the melt pool rises, reducing the balling impact of particles surrounding the laser scan track, and, as a result, this decreases the surface roughness of the top surface [25]. Titanium and its alloys are among the materials that orthopedic and dental implants most commonly employ [23,44].
However, because of its bioinert characteristics, Ti, like the majority of other metals, is unable to osseointegrate with natural bone tissues to a significant degree. In particular, it has been shown that direct bonding between implants composed of titanium and natural bone can be challenging [23,45,46]. Moreover, despite the promised future advantages of 3D printing technology, the surface quality of the as-printed Ti part is far too insufficient to be successfully included as an implant material. As such, the current study proposed the use of laser peening to enhance the surface roughness properties. Excess Ti particles close to the energy beam scanning path will partially sinter during the melting process, which will unavoidably result in the existence of stiff residues that are stuck to the substrate after cooling. A health risk arises from any leftover powder that separates from the substrate and enters the humoral system. According to a publication, the Ti powders may cause osteolysis and bone resorption [19,47].
To encourage the process of osseointegration on the implant materials and, more crucially, to eliminate any remaining powder from the substrate, post-treatments involving surface modification are required following 3D printing. By using micro-CT analysis and histomorphometry evaluation, it was possible to identify active new bone formation and satisfactory osseointegration within the dental implants at the bone gap around them [9]. Compared to the marketed control samples, the Bio-ActiveITRI dental implants’ biomechanical metrics were much greater. Throughout the study, we have observed that each mechanical test that was performed contributes differently to the printing orientation; this is due to the printing direction or material used during manufacturing. Recent decades have seen significant advancements in implant design and surface topography, leading to high implant survival rates; yet, efforts to manage peri-implant bone loss remain.
Chemically changed implants demonstrate more removal torque and more bone-implant contact than controls, especially on surfaces strengthened with Ca and Mg, even though the Ra/Sa values were similar to the control group [20]. According to a survey [8], it is challenging to determine whether commercially pure titanium or its unique b-phased alloy is more advantageous in terms of surface roughness or corrosion resistance. Many surface modification techniques [48], such as surface abrasion, have been used to investigate the possibility of inhibiting or promoting bacterial adhesion and biofilm formation. A dental implant’s surface charge results from interactions between the implant and the aqueous environment in the mouth. It has been demonstrated that the implant’s surface charge influences the development of osteoblastic cells, which are responsible for bone production [49]. Prior research has demonstrated that implants with a somewhat rough surface show improved osseointegration via a contact–osseogenesis pathway, while the control implants’ smoother surface only integrates through distance osseogenesis [9].

4. Conclusions

The primary focus for enhancing implant performance is on producing titanium (Ti) alloys and refining their surface. An investigation was conducted on the impact of 3D printing orientation on the mechanical properties and volume parameters of the as-built TI64ELI. The outcomes of the study are as follows:
  • The study showed that each mechanical test that was performed contributes differently to the printing orientation, e.g., some test samples had better properties when 180° printing orientation was used, and others had poorer properties when 180° printing orientation was used;
  • It was discovered that a printing orientation of 60° yielded 366.1 HV. This value further increased to 371.2 HV when 180° printing orientation samples were tested. However, the lowest HV value was observed to be 357.7 HV at a 90° printing orientation;
  • The core material volume (Vmc) was 0.05266 mm3/mm2 at 60° orientations, which increased by 11.48% for the 90° orientations. Furthermore, it was observed that the surface roughness (Sa) at the 60° orientation was 43.68 μm. This was further increased by 6% when using the 90° orientations;
  • Hence, the study revealed that care should be taken when choosing a mechanical test, as it will influence the application of the tested samples.

Author Contributions

Conceptualization, L.L.; methodology, L.L.; formal analysis, L.L.; investigation, L.L.; data curation, L.L.; writing—original draft preparation, L.L.; writing—review and editing, L.L., D.D., H.N. and F.N.; visualization, L.L.; supervision, D.D., H.N. and F.N.; project administration, L.L. All authors have read and agreed to the published version of the manuscript.

Funding

The research was supported and funded through a Tshwane University of Technology scholarship, Central University of Technology and University of South Africa (Unisa) research funding.

Data Availability Statement

The raw data supporting the conclusions of this article will be made available by the authors on request.

Acknowledgments

The experiments were performed in biomechanics laboratory facilities at Unisa’s Science Campus in Johannesburg, South Africa, and Central University of Technology. We further acknowledge Tumelo Moloi, Rabelani Murwamadala Tshepo Gaonnwe and Palesa Mnanzana for assistance during the experimental work.

Conflicts of Interest

The authors declare no conflicts of interest.

References

  1. Pera, F.; Carossa, M.; Bagnasco, F.; Crupi, A.; Ambrogio, G.; Isola, G.; Menini, M.; Pesce, P. Comparison between Bone-Level and Tissue-Level Implants in Immediate-Loading Full-Arch Rehabilitations: A Retrospective Multi-Center 1-Year Follow-Up Study. Prosthesis 2023, 5, 1301–1311. [Google Scholar] [CrossRef]
  2. Robau-Porrua, A.; Pérez-Rodríguez, Y.; Soris-Rodríguez, L.M.; Pérez-Acosta, O.; González, J.E. The effect of diameter, length and elastic modulus of a dental implant on stress and strain levels in peri-implant bone: A 3D finite element analysis. Biomed. Mater. Eng. 2020, 30, 541–558. [Google Scholar] [CrossRef] [PubMed]
  3. Li, J.; Zhong, H.; Cao, B.; Ran, Z.; Tan, J.; Deng, L.; Hao, Y.; Yan, J. Comparative Study of 3D-Printed Porous Titanium Alloy with Rod Designs of Three Different Geometric Structures for Orthopaedic Implantation. Acta Metall. Sin. 2024, 37, 54–66. [Google Scholar] [CrossRef]
  4. Chowdhury, S.; Arunachalam, N. Surface functionalization of additively manufactured titanium alloy for orthopaedic implant applications. J. Manuf. Process. 2023, 102, 387–405. [Google Scholar] [CrossRef]
  5. Pérez, R.A.; Gargallo, J.; Altuna, P.; Herrero-Climent, M.; Gil, F.J. Fatigue of Narrow Dental Implants: Influence of the Hardening Method. Materials 2020, 13, 1429. [Google Scholar] [CrossRef]
  6. Li, H.; Yao, B.; Li, Z.; Peng, Y.; Fan, H. Compressive properties and deformation mechanism of selective laser melting of Ti6Al4V porous femoral implants based on topological optimization. Compos. Struct. 2023, 321, 117326. [Google Scholar] [CrossRef]
  7. Lebea, L.; Ngwangwa, H.M.; Desai, D.A.; Nemavhola, F. Corrosion Resistance of 3D-Printed Titanium Alloy Ti64-ELI Parts for Dental Application. Appl. Bionics Biomech. 2022, 2022, 1–8. [Google Scholar] [CrossRef] [PubMed]
  8. Sotniczuk, A.; Majchrowicz, K.; Kuczyn, D. Surface Properties and Mechanical Performance of Ti-Based Dental Materials: Comparative Effect of Valve Alloying Elements and Structural Defects. Metall. Mater. Trans. 2022, 53, 225–239. [Google Scholar] [CrossRef]
  9. Tu, C.C.; Tsai, P.I.; Chen, S.Y.; Kuo, M.Y.P.; Sun, J.S.; Chang, J.Z.C. 3D laser-printed porous Ti6Al4V dental implants for compromised bone support. J. Formos. Med. Assoc. 2020, 119, 420–429. [Google Scholar]
  10. Lebea, L.; Ngwangwa, H.; Desai, D.; Nemavhola, F. Investigation on 3D printed dental Titanium Ti64ELI and lifetime prediction. In Current Perspectives and New Directions in Mechanics, Modelling and Design of Structural Systems, Proceedings of the Eighth International Conference on Structural Engineering, Mechanics and Computation (SEMC 2022, Cape Town, South Africa, 5–7 September 2022); CRC Press: Boca Raton, FL, USA; Taylor & Francis: Abingdon, UK, 2022; pp. 613–617. [Google Scholar]
  11. Macedo, J.P.; Pereira, J.; Faria, J.; Souza, J.C.M.; Alves, J.L.; López-López, J.; Henriques, B. Computer Methods in Biomechanics and Biomedical Engineering Finite element analysis of peri-implant bone volume affected by stresses around Morse taper implants: Effects of implant positioning to the bone crest. Comput. Methods Biomech. Biomed. Eng. 2019, 21, 655–662. [Google Scholar] [CrossRef] [PubMed]
  12. Zhao, Y.; Li, P.; Dong, P.; Zeng, Y.; Chen, J. Investigation on 3D printing ZrO2 implant abutment and its fatigue performance simulation. Ceram. Int. 2021, 47, 1053–1062. [Google Scholar] [CrossRef]
  13. Yu, T.; Gao, H.; Liu, T.; Huang, Y.; Wang, C. Effects of immediately static loading on osteointegration and osteogenesis around 3D-printed porous implant: A histological and biomechanical study. Mater. Sci. Eng. C 2020, 108, 2019. [Google Scholar] [CrossRef]
  14. He, S.; Zhu, J.; Jing, Y.; Long, S.; Tang, L.; Cheng, L.; Shi, Z. Effect of 3D-Printed Porous Titanium Alloy Pore Structure on Bone Regeneration: A Review. Coatings 2024, 14, 253. [Google Scholar] [CrossRef]
  15. Peng, K.; Cai, G.; Hu, B.; Huang, X. Investigation on effect of pillar size on the comprehensive properties of Ti6Al4V lattice fabricated by selective laser melting. Mater. Sci. Eng. A 2022, 860, 144281. [Google Scholar] [CrossRef]
  16. Dzogbewu, T.C.; de Beer, D.J. Additive manufacturing of NiTi shape memory alloy and its industrial applications. Heliyon 2024, 10, e23369. [Google Scholar] [CrossRef] [PubMed]
  17. Li, Z.; Zhang, Z.; Zhang, S.; Bai, Z.; Qin, R.; Huang, J.; Wang, J.; Huang, K.; Zhang, Q.; Wen, G. A novel approach of online monitoring for laser powder bed fusion defects: Air-borne Acoustic Emission and Deep Transfer Learning. J. Manuf. Process. 2023, 102, 579–592. [Google Scholar] [CrossRef]
  18. Wang, J.; Huang, J.; Xiong, C.; Gong, H.; Liang, C.; Zhang, Q.; Zhang, J.; Zhao, P.; Yang, Y.; Zhou, J.; et al. Actuation waveform auto-design of drop-on-demand inkjet for ejection droplet without satellite. J. Manuf. Process. 2023, 102, 910–920. [Google Scholar] [CrossRef]
  19. Lebea, L.; Ngwangwa, H.M.; Desai, D.; Nemavhola, F. Experimental Investigation into the Effect of Surface Roughness and Mechanical Properties of 3D-Printed Titanium Ti-64 ELI after Heat Treatment. Int. J. Mech. Mater. Eng. 2021, 16, 16. [Google Scholar] [CrossRef]
  20. Araújo, B.; Da, N.; Leguizamón, P.; Chokyu, Y.; Rey, D.; Fernandes, L. Bacterial response to Ti-35Nb-7Zr-5Ta alloy incorporated with calcium, phosphate and magnesium. J. Mater. Sci. Mater. Med. 2023, 34, 21. [Google Scholar] [CrossRef]
  21. Bernhardt, A.; Schneider, J.; Schroeder, A.; Papadopoulous, K.; Lopez, E.; Brückner, F.; Botzenhart, U. Surface conditioning of additively manufactured titanium implants and its influence on materials properties and in vitro biocompatibility. Mater. Sci. Eng. C 2021, 119, 111631. [Google Scholar] [CrossRef] [PubMed]
  22. Tamayo, J.A.; Riascos, M.; Vargas, C.A.; Baena, L.M. Additive manufacturing of Ti6Al4V alloy via electron beam melting for the development of implants for the biomedical industry. Heliyon 2021, 7, e06892. [Google Scholar] [CrossRef] [PubMed]
  23. Ren, B.; Wan, Y.; Liu, C.; Wang, H.; Yu, M.; Zhang, X.; Huang, Y. Improved osseointegration of 3D printed Ti-6Al-4V implant with a hierarchical micro/nano surface topography: An in vitro and in vivo study. Mater. Sci. Eng. C 2021, 118, 111505. [Google Scholar] [CrossRef] [PubMed]
  24. Haar, G.M.T.; Becker, T.H. Selective laser melting produced Ti-6Al-4V: Post-process heat treatments to achieve superior tensile properties. Materials 2018, 11, 146. [Google Scholar] [CrossRef] [PubMed]
  25. Ramosena, L.A.; Dzogbewu, T.C.; Preez, W.D. Direct Metal Laser Sintering of the Ti6Al4V Alloy from a Powder Blend. Materials 2022, 15, 8193. [Google Scholar] [CrossRef] [PubMed]
  26. Pirmoradian, M.; Naeeni, H.A.; Firouzbakht, M.; Toghraie, D.; Khabaz, M.K.; Darabi, R. Finite element analysis and experimental evaluation on stress distribution and sensitivity of dental implants to assess optimum length and thread pitch. Comput. Methods Programs Biomed. 2020, 187, 105258. [Google Scholar] [CrossRef] [PubMed]
  27. Xie, H.; Liu, Y.; An, H.; Yi, J.; Li, C.; Wang, X.; Chai, W. Recent advances in prevention, detection and treatment in prosthetic joint infections of bioactive materials. Front. Bioeng. Biotechnol. 2022, 10, 1053399. [Google Scholar] [CrossRef] [PubMed]
  28. BS EN ISO 14801:2016; BSI Standards Publication Dentistry—Implants—Dynamic Loading Test for Endosseous Dental Implants. BSI: London, UK, 2016.
  29. Muiruri, A.; Maringa, M.; Preez, W.D. Development of VUMAT and VUHARD Subroutines for Simulating the Dynamic Mechanical Properties of Additively Manufactured Parts. Materials 2022, 15, 372. [Google Scholar] [CrossRef]
  30. Plessis, A.D.; Boshoff, W.P. A review of X-ray computed tomography of concrete and asphalt construction materials. Constr. Build. Mater. 2019, 199, 637–651. [Google Scholar] [CrossRef]
  31. ASTM D638-22; Standard Test Method for Tensile Properties of Plastics. ASTM: West Conshohocken, PA, USA, 2003; Volume 8, pp. 46–58.
  32. Plessis, A.D.; le Roux, S.G.; Guelpa, A. The CT Scanner Facility at Stellenbosch University: An open access X-ray computed tomography laboratory. Nucl. Instrum. Methods Phys. Res. Sect. B Beam Interact. Mater. At. 2016, 384, 42–49. [Google Scholar] [CrossRef]
  33. Plessis, A.D.; Yadroitsava, I.; Kouprianoff, D.; Yadroitsev, I. Numerical and experimental study of the effect of artificial porosity in a lattice structure manufactured by laser based powder bed fusion. In Proceedings of the 2018 International Solid Freeform Fabrication Symposium, Austin, TX, USA, 13–15 August 2018; pp. 808–820. [Google Scholar] [CrossRef]
  34. Monaheng, L.F.; Preez, W.B.D.; Polese, C. Towards qualification in the aviation industry: Impact toughness of ti6al4v(eli) specimens produced through laser powder bed fusion followed by two-stage heat treatment. Metals 2021, 11, 1736. [Google Scholar] [CrossRef]
  35. Becker, T.; van Rooyen, M.; Dimitrov, D. Heat treatment of TI-6AL-4V produced by lasercusing. S. Afr. J. Ind. Eng. 2015, 26, 93–103. [Google Scholar] [CrossRef]
  36. Erinosho, M.F.; Akinlabi, E.T.; Pityana, S. Microstructure and Corrosion Behaviour of Laser Metal Deposited Ti6Al4V/Cu Composites in 3.5% Sea Water. Mater. Today Proc. 2015, 2, 1166–1174. [Google Scholar] [CrossRef]
  37. Ndou, N.; Akinlabi, E.T.; Pityana, S.; Shongwe, M.B. Micro structure of Ti6A14V reinforced by coating W particles through laser metal deposition. Lect. Notes Eng. Comput. Sci. 2016, 2226, 870–873. [Google Scholar]
  38. Kozior, T.; Bochnia, J. The influence of printing orientation on surface texture parameters in powder bed fusion technology with 316L steel. Micromachines 2020, 11, 639. [Google Scholar] [CrossRef] [PubMed]
  39. Leach, R. Characterisation of Areal Surface Texture; Springer: Berlin/Heidelberg, Germany, 2013; Volume 9783642364. [Google Scholar]
  40. Suh, A.Y.; Polycarpou, A.A.; Conry, T.F. Detailed surface roughness characterization of engineering surfaces undergoing tribological testing leading to scuffing. Wear 2003, 255, 556–568. [Google Scholar] [CrossRef]
  41. Galati, M.; Minetola, P.; Rizza, G. Surface roughness characterisation and analysis of the Electron Beam Melting (EBM) process. Materials 2019, 12, 2211. [Google Scholar] [CrossRef] [PubMed]
  42. Sneddon, S.; Xu, Y.; Dixon, M.; Rugg, D.; Li, P.; Mulvihill, D.M. Sensitivity of material failure to surface roughness: A study on titanium alloys Ti64 and Ti407. Mater. Des. 2020, 200, 109438. [Google Scholar] [CrossRef]
  43. Kelly, C.N.; Evans, N.T.; Irvin, C.W.; Chapman, S.C.; Gall, K.; Safranski, D.L. The effect of surface topography and porosity on the tensile fatigue of 3D printed Ti-6Al-4V fabricated by selective laser melting. Mater. Sci. Eng. C 2019, 98, 726–736. [Google Scholar] [CrossRef] [PubMed]
  44. Ahsan, M. 3D Printing and Titanium Alloys: A Paper Review. Eur. Acad. Res. 2016, 3, 11144–11154. [Google Scholar]
  45. Singh, S.; Prakash, C.; Ramakrishna, S. 3D printing of polyether-ether-ketone for biomedical applications. Eur. Polym. J. 2019, 114, 234–248. [Google Scholar] [CrossRef]
  46. Edith, F.; Yong, J.; Shyan, M.; Nian, P.; Goh, F.; Wen, C. Printing of Titanium implant prototype. Mater. Des. 2010, 31, S101–S105. [Google Scholar]
  47. Brunski, J.B.; Lemons, J.E. Biomedical-Engineering Analyses of Mini Dental Implants; Elsevier: Amsterdam, The Netherlands, 2013. [Google Scholar]
  48. Li, D.; Wang, Y.L. Mechanobiology, Tissue Development, and Tissue Engineering; Academic Press: Cambridge, MA, USA, 2020. [Google Scholar] [CrossRef]
  49. York, R.; Doumit, M.; Nganbe, M.; Helal, A. Study of mechanical properties of micromachined dental implants. Can. Met. Q. 2019, 58, 56–68. [Google Scholar] [CrossRef]
Figure 1. Representative dimensions of the 3D-printed sample drawn according to ASTM standard E8/E8M-09.
Metals 14 00447 g001
Figure 2. Image acquired during the CT scan of the tensile test bar, (a) 60° printing orientation, (b) 90° printing orientation and (c) 180° printing orientation.
Metals 14 00447 g002
Figure 3. Tensile results, tested using a strain rate of 3 mm/min: (a) printing orientation of 60°, (b) printing orientation of 90° and (c) printing orientation of 180°.
Metals 14 00447 g003
Figure 4. Micro-hardness results of 3D-printed Ti64ELI at various printing orientations.
Metals 14 00447 g004
Figure 5. Micro-hardnesses of three indentations depicted (a) 20 μm from the fracture point and (b) 420 μm away from the fracture point.
Metals 14 00447 g005
Figure 6. Microstructure of as-built Ti64ELI at various printing orientations, (a) a printing orientation of 60°, (b) a printing orientation of 90° and (c) a printing orientation of 180°.
Metals 14 00447 g006
Figure 7. 3D representation of surface roughness measurement.
Metals 14 00447 g007
Figure 8. Volume parameters with the distributed orientation at (a,b) 60° printing, (c,d) 90° printing, and (e,f) 180° printing.
Metals 14 00447 g008
Table 1. 3D printing processing parameters used during the fabrication of the tensile test dog bone [19,29].
Processing VariableValue
Laser power setting175 W
Laser diameter80 μm
Hatch spacing100 μm
Layer thickness30 μm
Scanning speed1400 mm/s
Table 2. Experimental results acquired during porosity analysis test for 3D printed tensile bar at various printing orientations.
Tensile Bar 60° Tensile Bar 90°Tensile Bar 180°
Volume of material (mm3)930.870755966.001907996.227442
Volume of pores (mm3)0.0053830.0017260.005826
% Ratio0.0005780.0001790.000585
Table 3. Tensile test experimental results tested at various printing orientation.
60°
Tensile Stress at Yield (MPa)Tensile StrainMaximum Force (kN)Modulus E (MPa)
1789.164.9143.3252,673.25
2757.144.9542.7853,686.05
3746.063.6542.6153,766.29
Mean764.124.542.953,375.2
Standard deviation22.380.740.37609.22
90°
Tensile stress at Yield (MPa)Tensile strainMaximum Force (kN)Modulus E (MPa)
1746.845.6543.5852,950.08
2733.033.0141.0750,033.14
3721.572.8440.8953,099.86
Mean733.813.8341.8552,027.69
Standard deviation12.661.581.51728.95
180°
Tensile stress at Yield (MPa)Tensile strainMaximum Force (kN)Modulus E (MPa)
1871.884.6143.5954,669.77
2850.453.0941.7150,998.64
3877.584.0844.0850,988.15
Mean866.633.9343.1352,218.85
Standard deviation14.300.771.252122.56
Table 4. Micro-hardness results of 3D-printed tensile bar at various printing orientations.
60° 90° 180°
Point123123123
1368.6367.7372.4336.5353.2363.1353.3369.3378.3
2363.3355.7359.5334.5358.6365.2356.9371.5360.4
3342347.9374.7353.9378.7360.2349.3361.3388.1
4342.9368360.2344.4347363.9325.5352.4371.5
5345.8376.1350.3346348.6365.8346.8367.5378.3
6347.5360.1368.4339.3361.3349.4363.9354.2361.5
7336.8354377.2340.8349336.2360.9359.6360.6
Average349.6361.4366.1342.2356.6357.7350.9362.3371.2
Table 5. Functional parameters of 3D-printed as-built samples at various orientations.
Parameters (mm3/mm2)60°90°180°
Peak material volume (Vmp)0.0026530.0032390.002637
Core material volume (Vmc)0.052660.059490.07094
Core void volume (Vvc)0.07470.080530.09838
Valley void volume (Vvv)0.0078180.0084890.008815
Table 6. Height parameters in micrometers at various printing orientations.
Parameters (μm)60°90°180°
Sq55.9960.2657.78
Sa43.6846.4445.28
Disclaimer/Publisher’s Note: The statements, opinions and data contained in all publications are solely those of the individual author(s) and contributor(s) and not of MDPI and/or the editor(s). MDPI and/or the editor(s) disclaim responsibility for any injury to people or property resulting from any ideas, methods, instructions or products referred to in the content.

