Article

Atomistic Simulation Study of Grain Boundary Segregation and Grain Boundary Migration in Ni-Cr Alloys

College of Materials Science and Engineering, Hunan University, Changsha 410082, China
*
Author to whom correspondence should be addressed.
Metals 2024, 14(4), 454; https://doi.org/10.3390/met14040454
Submission received: 7 March 2024 / Revised: 3 April 2024 / Accepted: 10 April 2024 / Published: 12 April 2024
(This article belongs to the Section Computation and Simulation on Metals)

Abstract

:
Using Molecular Dynamics (MD) and Monte Carlo (MC) simulations, we studied the grain boundary (GB) segregation under different temperatures and Cr concentrations in Ni-Cr alloys with two distinct grain-boundary structures, i.e., Σ5(310)[010] and Σ101(200)[100]. Temperature plays a minor influence on Cr segregation for Σ5(310)[010] GB, but Cr segregation rapidly diminishes with elevating temperatures for Σ101(200)[100] GB. We also used the synthetic driving force and corresponding identification methods to investigate the effect of Cr solute segregation on grain boundary stability. All Σ5(310)[010] models have multi-stage grain boundary migration at 800 K. In the first stage, the grain boundary’s slow acceleration time is related to solute concentration. The migration temperature can influence this phenomenon. As temperatures rise, the duration of this slow acceleration phase diminishes. No similar phenomenon was observed in the process of the grain boundary movement of Σ101(200)[100]. The influence of solute concentration on grain boundary migration is complicated. The segregation concentration at the grain boundary cannot be regarded as the only factor affecting the migration of the grain boundary because the Cr atom on the grain boundary does not move with the grain boundary. This work will also discuss the grain boundary migration‘s relationship with lattice distortion and grain boundary atom diffusion. The results and findings of this study provide further insights into the segregation-increase GB stabilization of NC Ni-Cr alloys.

1. Introduction

Ni-Cr alloys exhibit significant oxidation and corrosion resistance at moderately high temperatures and possess commendable mechanical strength [1,2,3]. They are widely used in applications related to harsh environments, such as corrosion and oxidation-resistant coatings or turbine disks [4,5]. Notably, Cr can bolster many characteristics of Ni-based alloys, such as oxidation, corrosion resistance, and tensile properties [6,7]. Previous experimental and simulation studies demonstrate that Cr segregation towards the Ni grain boundaries can modify the thermodynamic and kinetic properties of grain boundaries (GB) in nanocrystalline (NC) Ni-Cr alloy [8,9,10]. Current studies have substantiated that factors, such as GB character and alloy concentration, significantly influence grain size in NC metal materials [11,12,13]. As is known, the crystallographic texture of polycrystalline solids is intrinsically linked to the characteristics of grain boundaries (GBs), which play a pivotal role in defining the material’s physical properties [14,15]. At the same time, the motion of the grain boundaries inevitably causes grain structure changes and the microstructural evolution of NC alloys. Therefore, a deeper understanding of the grain boundary migration is essential in designing advanced Ni-Cr alloys.
It is generally believed that the segregation of solute atoms to the grain boundary can alter the local atomic structure and energy of the grain boundary [16,17]. So, grain boundary segregation plays an essential role in the stability of GB [18,19]. The segregation of solute atoms is the result of both physical and chemical energy minimization, which is induced by lattice distortion and atomic bonding, respectively [20]. The high-density dislocation caused by lattice distortion may hinder the grain boundary movement, and the solute may also have a drag effect on the grain boundary movement [21,22]. Additionally, it is crucial to accentuate that the diffusion of pinned segregated states should be fast enough to enable the segregated state aggregates to travel with the grain boundary. Suppose the diffusion of solute atoms is too slow or the grain boundary moves too quickly. In that case, the boundaries will detach from the segregated groups, causing a sudden drop in the resistance of the segregated solute atoms for GB motion [22,23]. For instance, the Mg-segregation morphology depends on the grain boundary types in the Al-Mg alloy. The Mg atoms tend to form clusters in the high-angle tilt GB and segregate into low-angle GBs composed of dislocations. Mg segregation slows down the Al diffusion in high-angle and low-angle GBs due to the significant increase in the activation energy of GB diffusion [24]. Therefore, diffusion-induced grain boundary migration (DIGM) under the influence of solute migration is a common phenomenon in NC alloys [25,26,27]. Therefore, it is important to reveal the influence of segregation on grain boundary migration in NC alloys.
To truly comprehend what drives this composite behavior, a deeper understanding of how grain boundary alloying and grain boundary segregation influence the grain boundary migration rate is needed. Koju and Mishin investigated the effect of grain boundary segregation on GB diffusion in Cu-Ag and Al-Mg alloys [24,28]. In the Cu-Ag system, they found that the disordering of the GB structure caused by segregation can drastically alter the GB diffusion mechanisms, and the GB diffusivities of the solute (Ag)and solvent (Cu) atoms can exhibit quite different and nontrivial composition and temperature dependencies [28]. For instance, under low concentrations of Ag (around 1% or lower), Ag decelerates the transport. However, when the concentration nears 2%, it can induce a higher migration rate than in non-alloy systems under certain conditions. For Co-Ni alloy [29], at low Co content, solute atoms affect the dislocation movement mainly by regulating lattice mismatch and elastic mismatch, which is consistent with the solid-solution strengthening theory. Solute atoms also affect dislocation movement at high Co content by changing lattice vibration. Therefore, the solute concentration significantly influences the grain boundary deflection diffusion and the grain boundary morphology, which then influences the grain boundary migration.
The temperature dependence of the grain boundary migration rate can be described by the Arrhenius equation [30]: M(T) = M0exp[−QM/(kBT)], where kB is the Boltzmann constant and T is the temperature. The pre-factor M and the activation energy QM can be fitting parameters for the temperature-dependent migration rate. A common outcome of various types of molecular dynamics (MD) simulations is that different types of motions may occur depending on the temperature and the size of the force driving the GB, and a critical temperature exists, known as the roughening temperature [14]. Above the roughening temperature, GB consistently exhibits continuous movement, and the GB speed linearly depends on the size of the applied driving force. Below this critical temperature, the type of GB movement depends on the size of the applied driving force. Under high force, continuous or linear GB motion can be enforced. However, GB exhibits discontinuous motion under lower forces. In this case, significant jumps of the entire GB over a specific distance (several atomic layers) can be distinctly separated from the waiting time between individual jumps [14,31]. Additionally, the atomic fraction and distribution of segregated solute atoms at GBs are closely related to the temperature [24]. Therefore, temperature inevitably has a significant effect on the migration behavior of grain boundaries. Therefore, the Ni-Cr alloy must study the influence of Cr concentration and temperature on grain boundary movement.
As mentioned above, a smaller grain size for nanocrystalline nickel-based alloys will increase the grain boundary ratio and the Gibbs free energy. These will reduce the stability of grain boundaries, such as spontaneous grain growth. Solute segregation can effectively stabilize grain boundaries [32,33,34]. The grain boundary type, temperature, and solute concentration are the key. Therefore, it is necessary to investigate the grain boundary segregation of the solute in the Ni-Cr system and understand the influence of the grain boundary segregation of the solute and temperature on the grain boundary mobility. This paper has carried out a comprehensive atomic computer simulation of the grain boundary segregation, grain boundary atom diffusion, and grain boundary migration in the Ni-Cr system. For segregation, models with more kinds of solute concentrations were selected for segregation simulation, which was rarely seen in previous studies. We chose two iconic grain boundaries. They are high-angle grain boundaries, the symmetric tilt Σ5(310)[010] GB, consisting of closely spaced structural units, and the low-angle twist grain boundaries Σ101(200)[100], consisting of discrete dislocations. In addition to calculating some key characteristics of the grain boundary segregation in the Ni-Cr system at a specific temperature, we also focus on the influence of Cr concentration, temperature, and different grain boundaries on the diffusion rate and grain boundary migration rate, then discuss the relationship between the grain boundary atom diffusion and grain boundary migration.

2. Methods and Models

2.1. Methods

The 2NN MEAM (Many-Body Embedded Atom Method) interatomic potential developed by Wu et al. describes the Ni-Cr alloy [35]. Molecular statics, molecular dynamics (MD), and Monte Carlo (MC) simulations are conducted using the LAMMPS (Large-scale Atomic/Molecular Massively Parallel Simulator code [36]. Visualization and structural analyses are carried out using OVITO software (https://www.ovito.org/) [37]. The construction of the grain boundary models utilized ATOMSK [38], and these GB models are based on the Coincident Site Lattice (CSL) grain boundary data provided by Olmsted et al. [14], contributing to the acquisition of a stable grain boundary structure.
To study the segregation behaviors of Cr on the grain boundaries of Ni-Cr alloys, we employed the Semi-Grand Canonical Monte Carlo (SGCMC) [36] technique. We utilized a hybrid MC/MD algorithm to achieve the desired segregation. Every MC step was followed by 100 MD steps. The MC step completes an atom-type replacement, while the MD step completes relaxation after the atom replacement. At a specific temperature, a pair of Cr and Ni atoms are randomly chosen and exchanged based on the probabilities specified by the Metropolis criterion. Under periodic boundary conditions with zero normal pressure, MD thermal equilibrium is achieved using the NPT ensemble. The entire system is then relaxed at the same temperature. The integration time step is set at 2.5 fs to ensure the system remains fully relaxed. The imposed chemical potential difference (Δμ) between Ni and Cr was adjusted to produce the desired chemical composition inside the grains. The simulation temperature varied between 300 K and 1200 K. The chemical potential difference (Δμ) between Ni and Cr changes with the simulation temperature in the SGCMC method. Table 1 presents the selected values of this chemical potential difference in the current study for different temperatures and solute concentrations. These chemical potential differences serve as simulation parameters in the subsequent segregation simulations.
To investigate the impact of grain boundary segregation on the grain boundary motion in Ni-Cr alloys, the comprehensive driving force method proposed by Janssens [26] is employed to achieve grain boundary migration. Under the NPT ensemble (fixed total number of atoms N, fixed temperature T, and zero pressure P), the grain boundary models are relaxed for 20 ps at temperatures of 800 K, 1000 K,1200 K,1400 K, and 1600 K, respectively. Subsequently, an additional synthetic driving force of 0.08 to 0.32 eV/atom was applied at 20 ps. This synthetic driving force (Δe) facilitated the grain boundary migration. The difference in the potential energy (driving force) on both sides of the grain boundary is artificially introduced to make the grain boundary gradually migrate to the non-dominant grains with lower potential energy, to reduce the total free energy of the double crystal system [26]. It is important to note that in all grain boundary migration simulations, the grain boundaries will come close to each other and eventually merge and melt. In addition, grain boundaries are too close to each other to determine the specific position of the grain boundary plane, which is also the reason for the different migration time of the grain boundaries in Section 3.2. We adopt a more efficient grain identification method proposed by Schratt et al. [39], which allows two grains with different grain boundaries and orientations to be imaged by OVITO [37], as shown in Figure 1. Then, the trajectory of grain boundary migration can be obtained. Given the necessity to minimize the driving force at the grain boundary, we matched each model with the minimum suitable force that could facilitate the grain boundary migration. This implies that multiple attempts will be made to apply the minimal grain boundary driving force that permits normal grain boundary migration.
An enhanced understanding of this process can enable more precise control over the microstructural evolution in materials science investigation. At low temperatures (i.e., 800 K), for high-angle grain boundaries Σ5(310)[010], the driving force is up to 0.32 eV/atom due to the substantial hindrance effect of Cr atom segregation on the grain boundary migration, which is significantly higher than those considered in other studies [14,39]. However, during the MD run, the grain boundary extent may vary slightly due to thermal fluctuations. To account for such variations, the instantaneous GB extent was tracked by finding the peak of the potential energy (averaged over a thin layer parallel to the GB plane) as a function of the x-coordinate, normal to the boundary. The potential energy diagram of 300 K is shown in Figure 1. At 300 K, the width δ of the GB was estimated from the width of the peak. Based on these estimates, the GB core region was defined as the layer centered on the peak, with a width δ = 0.8 nm for the high-angle GB (Σ5(310)[010]) and a width δ = 1.6 nm for the low-angle GB (Σ101(200)[100]). The migration rate (M) was determined using the equation M = V × Ω/Δe, where V represents the grain boundary migration velocity, and Ω is the atomic volume [26].

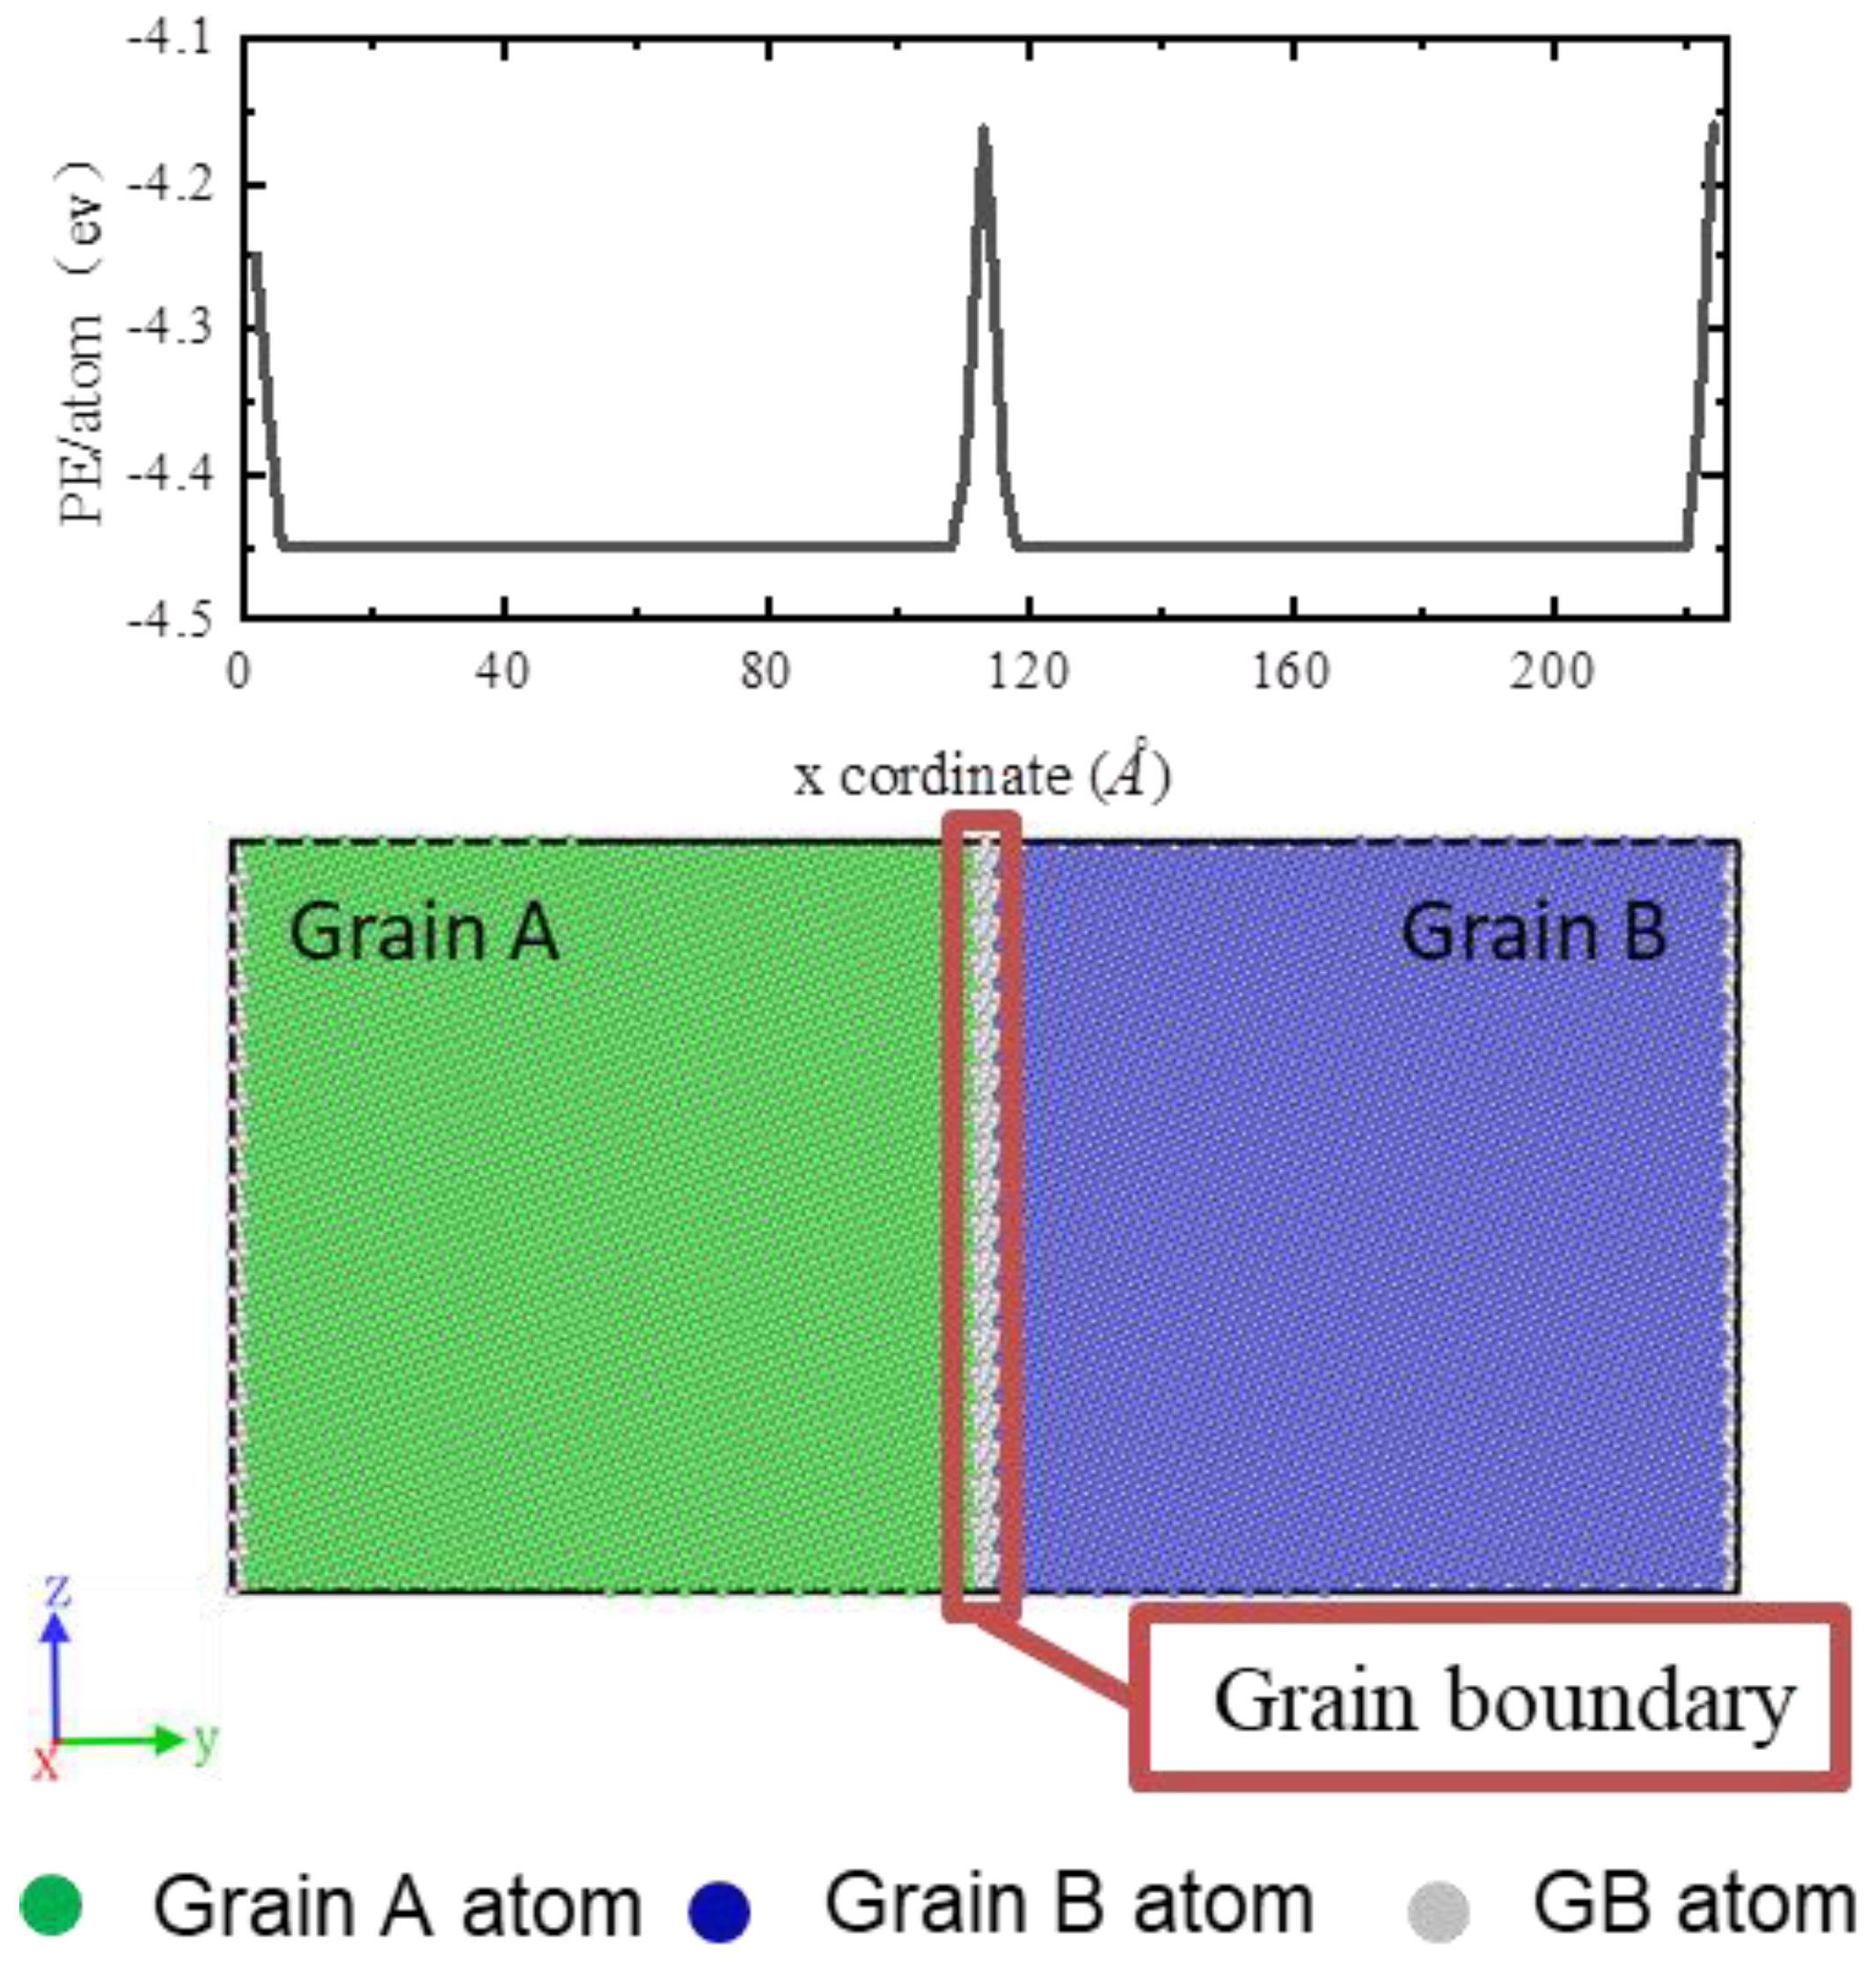
2.2. Grain Boundaries

To investigate the influence of grain boundary types on segregation behavior, we selected two types of grain boundaries, i.e., high-angle boundaries (HAGB) and low-angle boundaries (LAGB). The high-angle grain boundary (GB) is the symmetric tilt GB Σ5(310)[010] with a misorientation angle of 36.87°, which [010] indicates the tilt axis, and (310) is the GB plane. The structure of this GB is illustrated in Figure 2a. The grain boundary is composed of structural units with six atoms from two parallel atomic layers, and the structural units are kite-shaped. The Σ5(310)[010] grain boundary in FCC (Face-Centered Cubic) crystals is often the subject of research because of its unique properties and relevance in material science and engineering [40,41]. We utilized the MEAM potential to calculate the grain boundary energy of Σ5(310)[010] and Σ101(200)[100], which were found to be 1.405 J/m2 and 0.946 J/m2, respectively. Olmsted [14] reported grain boundary energies of 1.218 J/m2 and 0.701 J/m2 for these same boundaries. Although there is a discrepancy in the absolute values between our results and theirs, this is primarily due to using different potential functions. The relative differences in the grain boundary energy for the two types of boundaries are similar, indicating that our prediction of the energy trend of these two types of grain boundaries is accurate. The twist grain boundary of Σ101(200)[100] is considered as the low-angle GB, with a misorientation angle of 11.42° which [010] indicates the tilt axis, and (200) is the GB plane. The atomic structures of the Σ101(200)[100] grain boundary equilibrated at 300 K are shown in Figure 3a, characterized by a square network composed of atoms colored gray.
The dimensions of the Σ5(310)[010] GB block in the x, y, and z directions are 22.26× 5.27 ×11.13 nm3 (comprising 119,400 atoms), while those of the Σ101(200)[100] GB block are 14.08 × 10.00 × 10.00 nm3 (containing 129,280 atoms). Periodic boundary conditions were applied in all three directions.

3. Results and Discussion

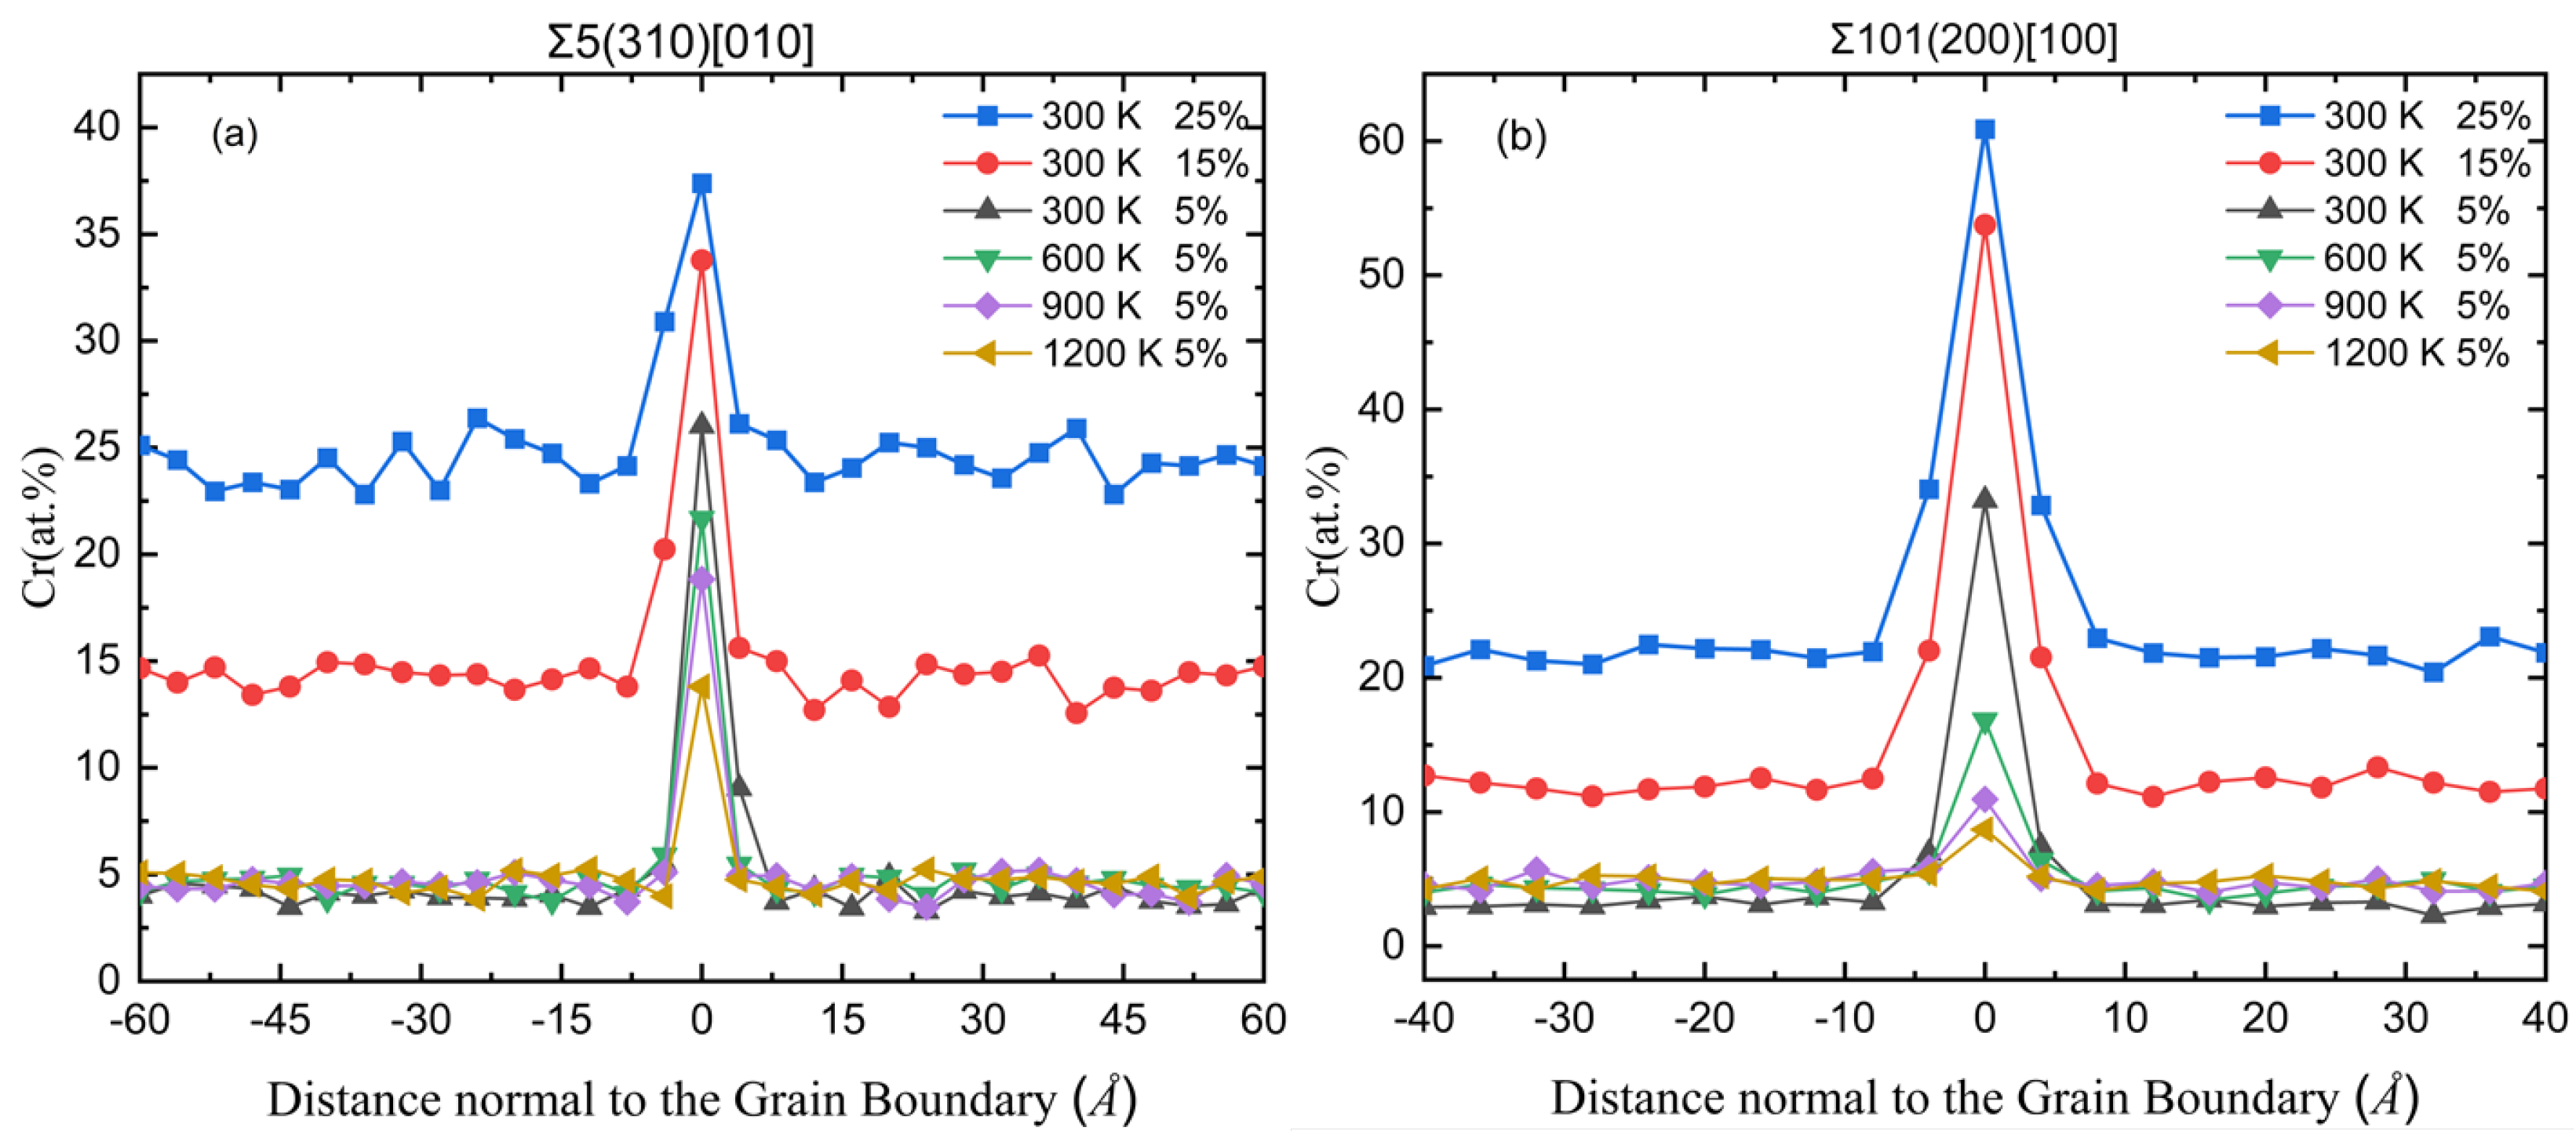
3.1. Temperature and Composition-Dependent Cr Segregation at Ni Grain Boundary

In the case of the nickel-chromium alloy with the two types of grain boundaries mentioned above, we performed hybrid MC/MD simulations to reveal the temperature- and composition-dependent segregation behavior of the Cr solute atoms at two GBs. It is found that a different grain boundary morphology will affect the segregation energy and segregation concentration of Cr atoms. In the high-angle grain boundary Σ5(310)[010], Cr atoms experience segregation, preferring to gather at the low-angle kite head positions within the kite-shaped structural units comprising six atoms (see Figure 2b). The segregation of Cr atoms at the high-angle kite tail positions proves to be energetically unfavorable. Specifically, the segregation energy ranges from −0.617 eV to 0.147 eV, as shown in Figure 2c. For the low-angle grain boundary Σ101(200)[100], the segregation of Cr atoms is more accessible to occur with the segregation energy varying between −1.486 eV and 0.537 eV, which inclines to cluster into the square network structure(see Figure 3b). Although Cr can segregate to both high-angle and low-angle grain boundaries with significantly negative segregation energies, there are more locations for Cr segregation with low segregation energy on the low-angle twisted grain boundary Σ101(200)[100], which is different from the Cr segregation behavior occurring on the high-angle Σ5(310)[010] tilted grain boundary (see Figure 2c and Figure 3c).
Figure 4 shows the Cr segregation distribution depending on alloy components and the temperatures for Σ5(310)[010] tilted and Σ101(200)[100] twisted GB. The segregation distribution of Cr is determined by calculating the atomic fraction of Cr in the GB. The calculated model is segmented into thin layers parallel to the GB, and the atomic fraction of Cr in each layer is calculated and averaged over multiple repeat simulations during the thermodynamic equilibrium MD/MC simulation process. As shown in Figure 4, the segregation concentration of Cr can be enhanced at low temperatures, e.g., 300 K. This temperature-dependent segregation behavior was reported in Ni-Bi and Al-Mg polycrystals [24,42], which can be described by Langmuir–McLean’s equation [43]. Due to the less negative segregation energy of Cr at the Σ5(310)[010] tilted grain boundary, Cr has a relatively low segregation atomic fraction (26.2%) at 300 K, compared to the Cr segregation atomic fraction of 32.7% at Σ101(200)[100] GB. Moreover, temperature plays a minor influence on Cr segregation for the Σ5(310)[010] tilted grain boundary. The Cr segregation atomic fraction also remains at 13.80% at 1200 K (see Figure 4a). However, Cr segregation occurring at the Σ101(200)[100] low-angle grain boundary rapidly diminishes with rising temperature. The atomic fraction of Cr at the Σ101(200)[100] GB of Ni-5 at%.Cr alloy can reach 32.7% at 300 K. In comparison, the Cr segregation atomic fraction is only 8.69% at 1200 K (see Figure 4b). This difference in temperature-dependent segregation behavior between tilted Σ5(310)[010] and twisted Σ101(200)[100] grain boundaries can be understood by the ability of atomic diffusion at GBs. Generally, the high-angle grain boundaries are densely packed, while low-angle grain boundaries form a network structure. Therefore, high-angle grain boundaries are more easily diffused at the same temperature than low-angle grain boundaries [24]. Additionally, with the increase in total Cr concentration, the ability of Cr segregation will decay, as shown in Figure 4. For instance, the Cr segregation atomic fraction is only about 1.5 times the total Cr concentration for Ni-25 at%.Cr alloy at 300 K, lower than five times the Cr concentration for Ni-5 at%.Cr alloy.
In this part, we discussed the effect of grain boundary types, segregation temperature, and solute concentration on grain boundary segregation. In the following part, we will focus on the significant influence of grain boundary segregation on the mobility of grain boundaries, aiming to unravel how the interplay between these two phenomena impacts the thermodynamic properties and dynamic behavior of grain boundaries in Ni-Cr alloys.

3.2. Effect of Segregation on Grain Boundary Migration

Based on the above discussion in this study regarding solute atom segregation in Ni-Cr at two different grain boundaries, it is necessary to further elucidate the impact of Cr segregation on grain boundary migration. Therefore, we investigated the behavior of Ni grain boundary migration driven by grain boundary driving force in segregation bicrystal models alloying with various concentrations of Cr. This aims to contribute a deeper understanding of the interactions between solute segregation and grain boundary migration.
Figure 5a,b illustrates the variation in the GB position over time during grain boundary (GB) migration induced by the synthetic driving force for Ni Σ5(310)[010] GB segregation samples with different Cr concentrations at 800 K and 1200 K. The migration rate is indicated by the slope of the figure. At 800 K, we found that the Σ5(310)[010] grain boundary does not move uniformly within the first few picoseconds after receiving the synthetic driving force, and then it slowly accelerates. A detailed atomic characterization of this can be found in Figure 6. The extent of the grain boundaries gradually widens during this slow acceleration interval. This phenomenon of slowly accelerated motion is due to the discontinuous grain boundary motion, often referred to as roughening [31]. Furthermore, it can be seen that the 5 at%.Cr sample leaves Cr atoms in the initial grain boundary and does not move with the grain boundary. Moreover, the presence of Cr prolongs the roughening period at 800 K. The roughening period of all models with Cr added was extended compared to pure nickel samples (see Figure 5a). The Cr concentrations have a significant influence on the roughening period. The extension time of the Ni-5 at%.Cr and Ni-15 at%.Cr models is more than the Ni-25 at%.Cr model. After applying the driving for a few picoseconds (ca. 6 ps), the grain boundary width almost remains stable, and the grain boundaries start moving steadily. All the Σ5(310)[010] grain boundaries have similar roughening behavior at 800 K. However, a different roughening and accelerating behavior of the Σ5(310)[010] grain boundary is found at 1200 K, shown in Figure 5b. Compared to the GB motion at 800 K, the roughening period (ca. 2 ps) is relatively shorter, and the uniform migration of the grain boundaries starts earlier. Cr segregation in different Cr concentrations GBs cannot significantly prolong the roughening period of the Σ5(310)[010] grain boundary.
From Figure 5c,d, it can be seen that all the Σ101(200)[100] grain boundaries with or without Cr segregation migrate at an approximately constant velocity after applying a driving force. The phenomenon that occurs here is what we need to discuss. It has been mentioned before that the Cr atom segregated on the grain boundary may impact the microstructure and energy of the grain boundary and the diffusion rate. The excessive migration speed of the grain boundary may cause the segregated atoms on the grain boundary to not move with the grain boundary and stay in the original position, which has been observed in all migration processes.
In addition, the factors affecting grain boundary migration may change in the Ni-Cr alloy with a higher Cr concentration, which also contains more Cr in the bulk, because not all Cr can be segregated into the grain boundary, as can be verified from Figure 4. Therefore, the concentration of Cr in the bulk increases with the total concentration due to chromium’s weaker segregation tendency. Then, we simulated the migration of all samples at more temperatures, as shown in Figure 7. For example, at 1200 K, the pure Ni Σ5(310)[010] grain boundary system has a grain boundary mobility of M = 9.39 × 10⁻⁸ m4/Js, while grain boundary mobility is 6.10 × 10⁻⁸ m4/Js at 800 K. A slightly fast mobility of pure Ni Σ101(200)[100] GB is found, and the grain boundary mobility is 2.43 × 10⁻⁷ m4/Js at 800 K and 2.89 × 10⁻⁷ m4/Js at 1200 K. Our results are consistent with the findings of the study of the grain boundary mobility in Ni by Olmsted and Simonnin et al. in order of magnitude [14,44]. Figure 7 provides a more comprehensive comparison of the grain boundary mobility at various temperatures for each model of the two kinds of grain boundary alongside their respective Arrhenius fitting curves. Each sample demonstrates pronounced Arrhenius behavior with significantly different activation energies, as indicated by the Arrhenius plots’ slopes.
The temperature dependence of the GB mobility can be described by an Arrhenius equation: M T = M 0 e x p ( Q M k B T ) [27]. The pre-exponential factor (M0) and the energy for activated GB migration (QM) can be obtained as fit parameters from the temperature-dependent mobility. In Figure 7, comparing the slopes affords an evaluation of the relative activation energy magnitudes. Figure 5a,b illustrate the Arrhenius plots corresponding to the high-angle and low-angle grain boundaries. The mobility of low-angle grain boundaries is faster than that of high-angle grain boundaries at all temperatures. Table 2 summarizes the activation energy QM and pre-exponential factor M0 obtained by fitting the Arrhenius equation to the simulation data.
In all temperatures except 800 K, the migration rate of the model doped with 25 at%.Cr is the fastest in both HAGB and low-angle grain boundaries LAGB. The migration rate of HAGB is approximately half that of LAGB. Due to the non-uniform movement phase present in HAGB, it is necessary to fit the uniform phase of grain boundary migration for both types of grain boundaries, leading to new fit parameters, as shown in Table 2. The migration activation energy of pure nickel HAGB is nearly 1.5 times that of LAGB, while the pre-exponential factor M0 is close to half that of LAGB. For HAGB, the grain boundary migration barrier decreases with increasing Cr concentration in the bulk; for LAGB, it does not fit Arrhenius well, and the grain boundary migration barrier increases with the rise in Cr concentration in the bulk. Both show a strong correlation with the Cr concentration doped in the bulk.
Interestingly, within the same grain boundary model, the pre-exponential factor M0 increases with the increase in QM. The impact of solute doping on activation energy is controlled by various factors, such as the differences in grain boundary microstructure, grain boundary energy, segregation energy, etc. Between the two types of grain boundaries, solute concentration may have opposite effects on grain boundary migration activation energy [45,46]. This variability in the influence of the solute on the activation energy even extends to different effects within the grain boundary and bulk. The solute concentration in the bulk also affects the grain boundary mobility and is complex. The migration activation energy (Qm) and pre-exponential factor (M0) increase and decrease with the increase in the solute concentration in the high-angle grain boundaries. Moreover, the behavior of the two kinds of grain boundary is opposite.
As mentioned, there is already a significant slow migration phase in the absence of Cr doping and segregation in the high-angle grain boundaries. Chromium segregation to the grain boundary can prolong the coarsening phase of grain boundary migration, with an optimal level of 5 at%. This is because a limited number of sites on the grain boundaries can segregate, so higher Cr doping concentrations will increase the Cr concentrations in the grain boundaries and bulk regions. However, a higher concentration of Cr doping will increase the concentration in the grain boundary and bulk regions. Excessive Cr makes the high-angle grain boundary relatively easy to migrate, so the plateau period for the 25 at% Cr sample is shorter than at 5%. The higher the Cr content doped in the bulk, the faster the grain boundary migration rate. These findings indicate that the influence of solute doping on activation energy is complex.

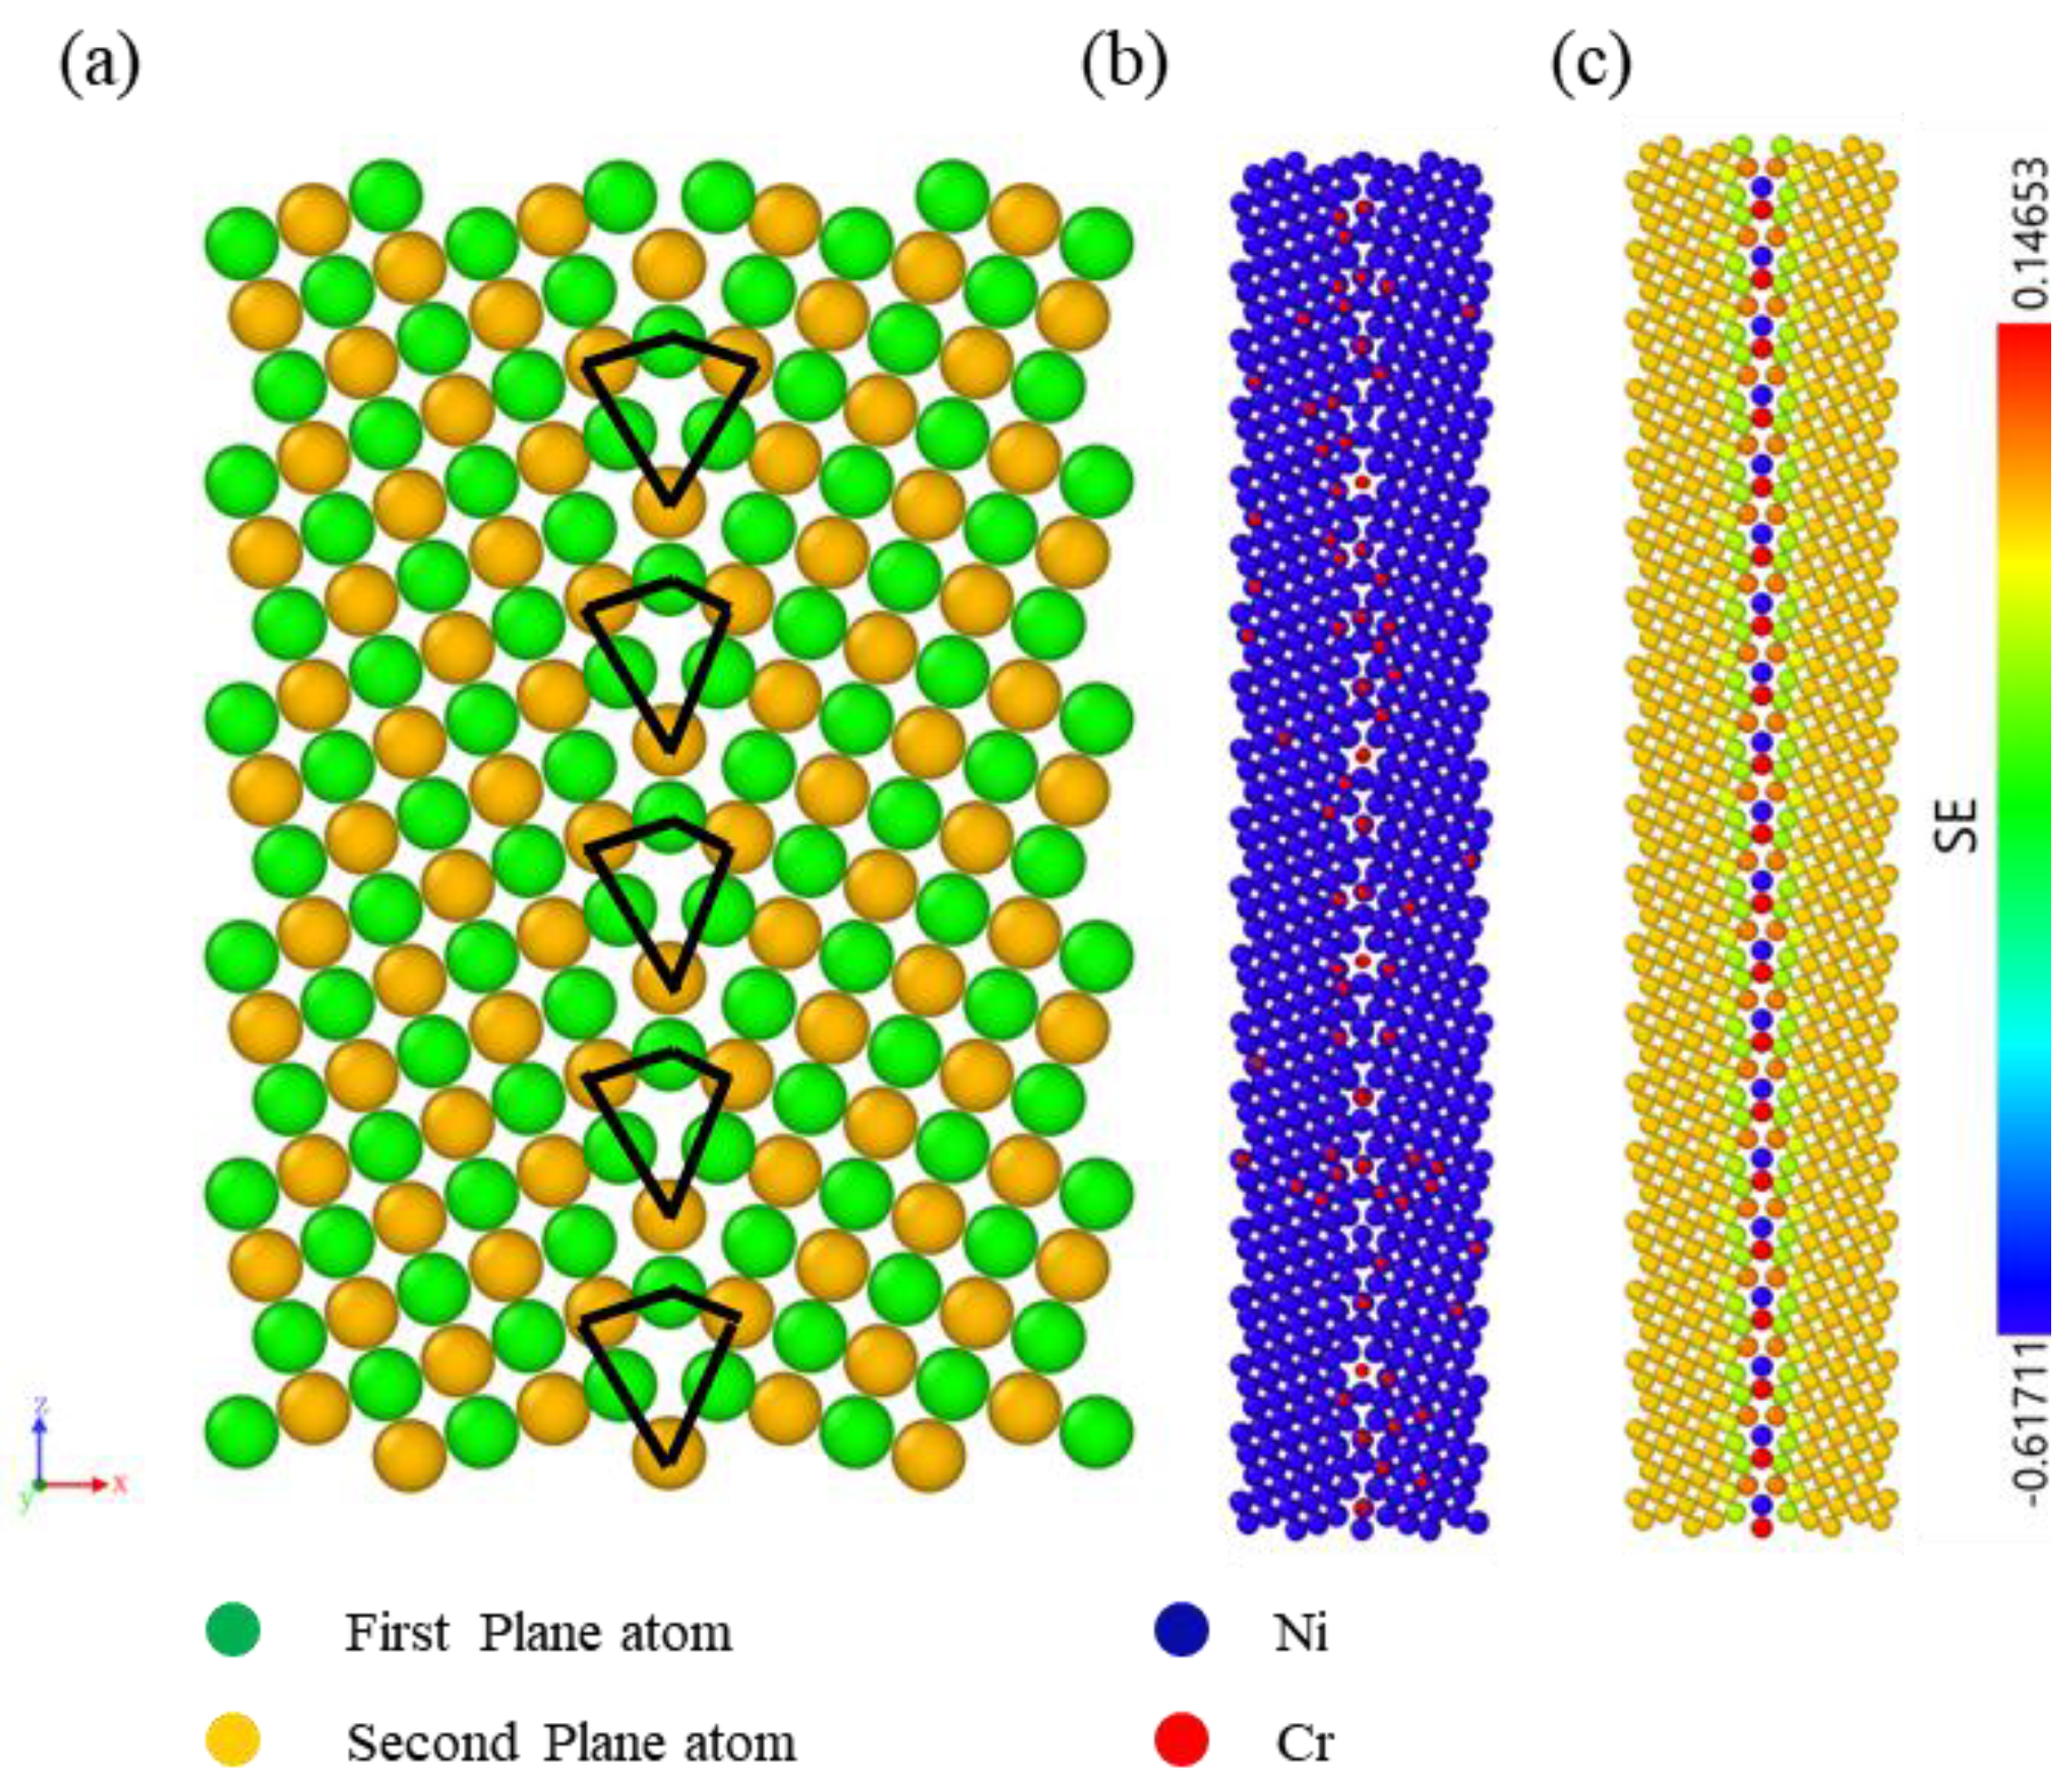
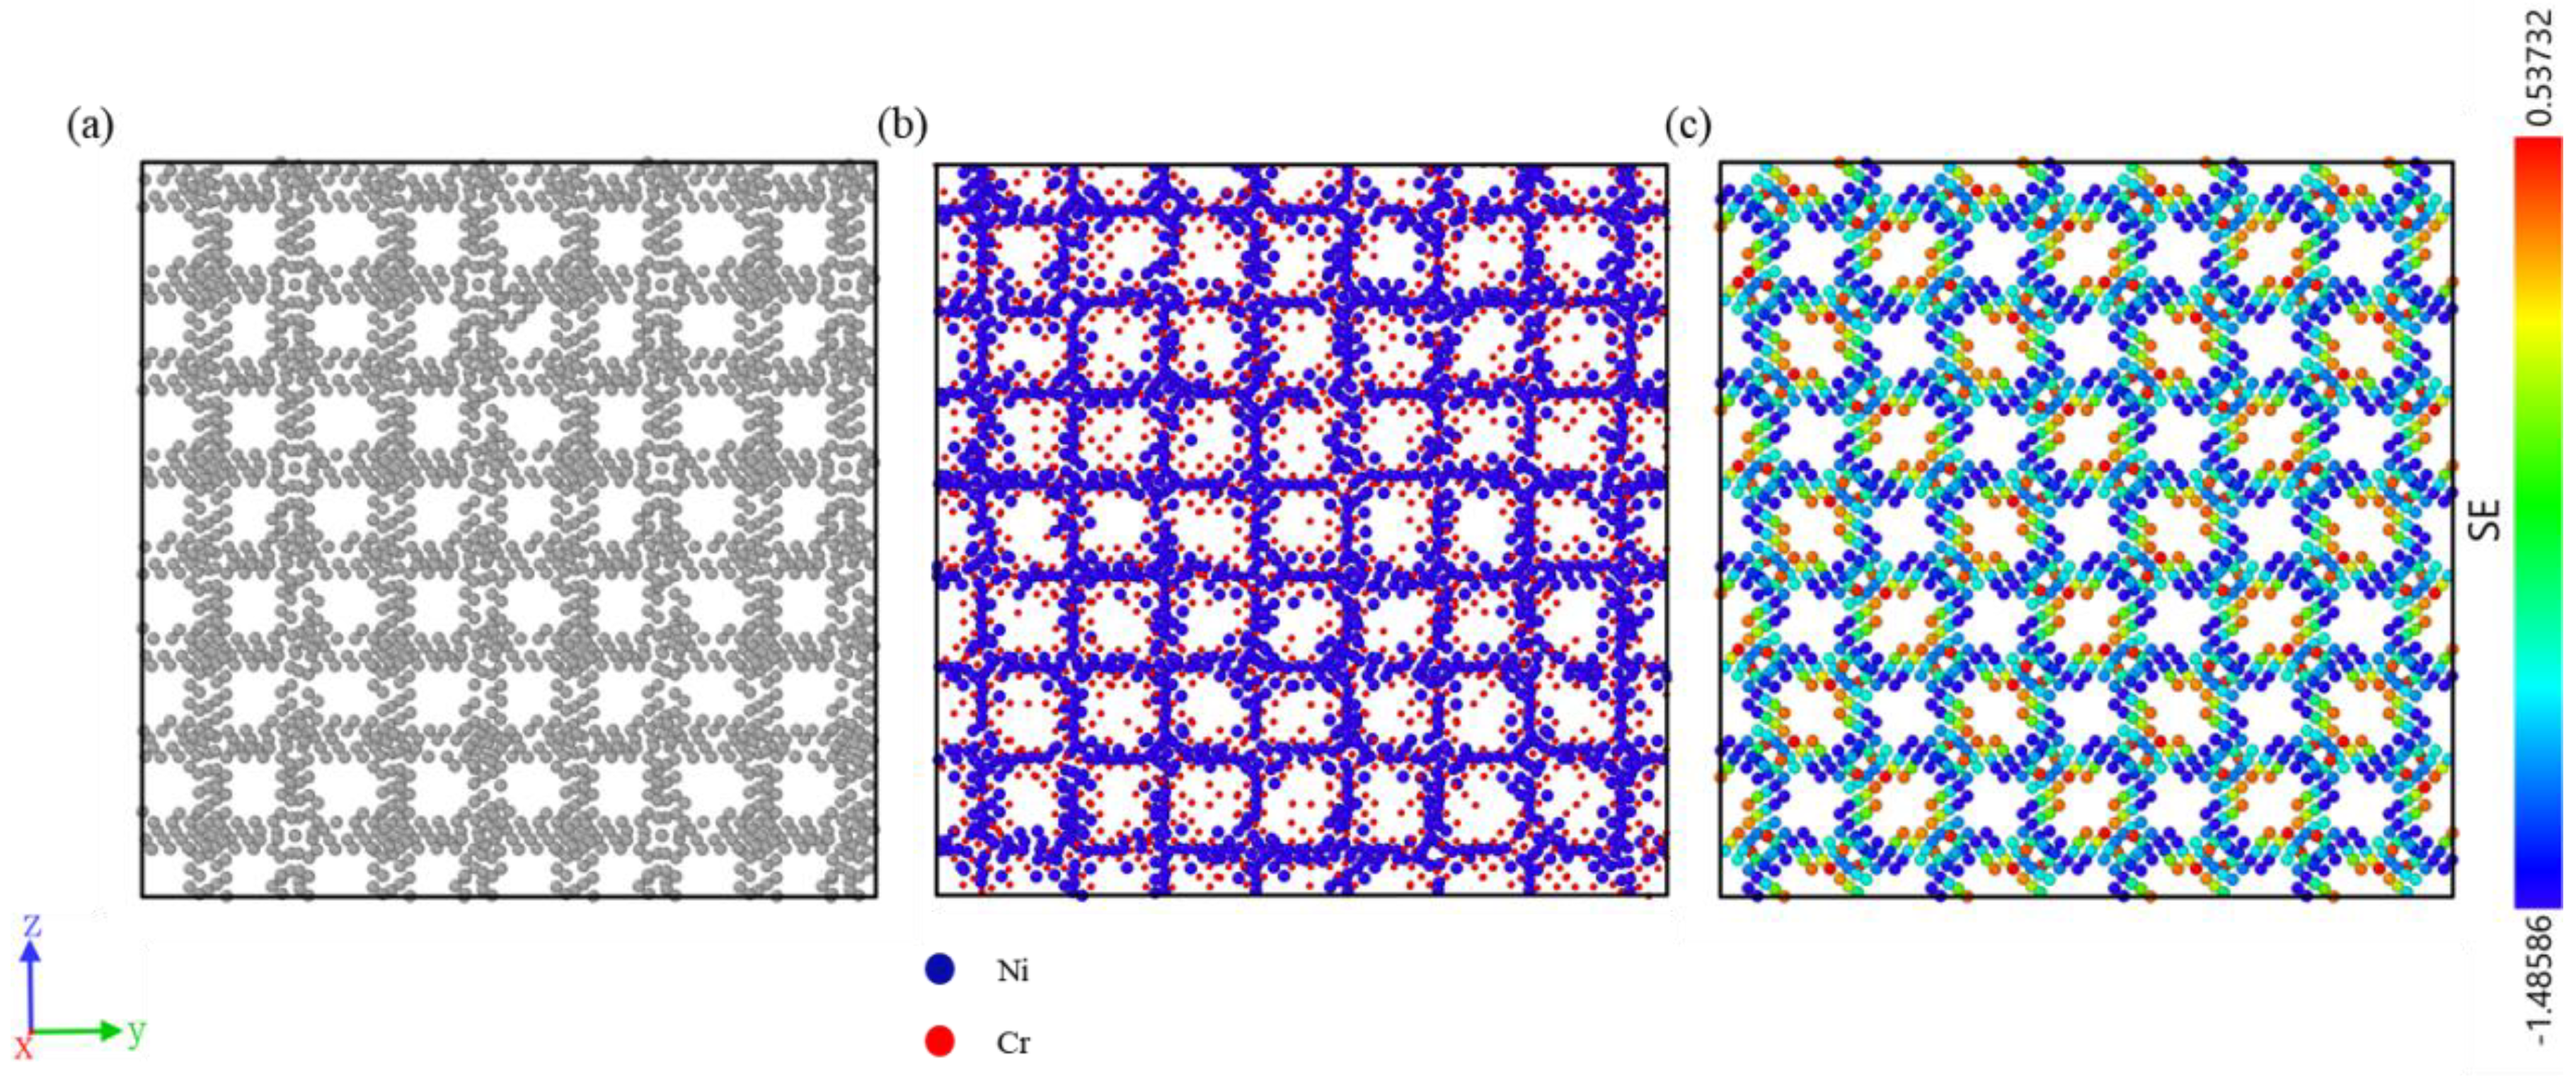
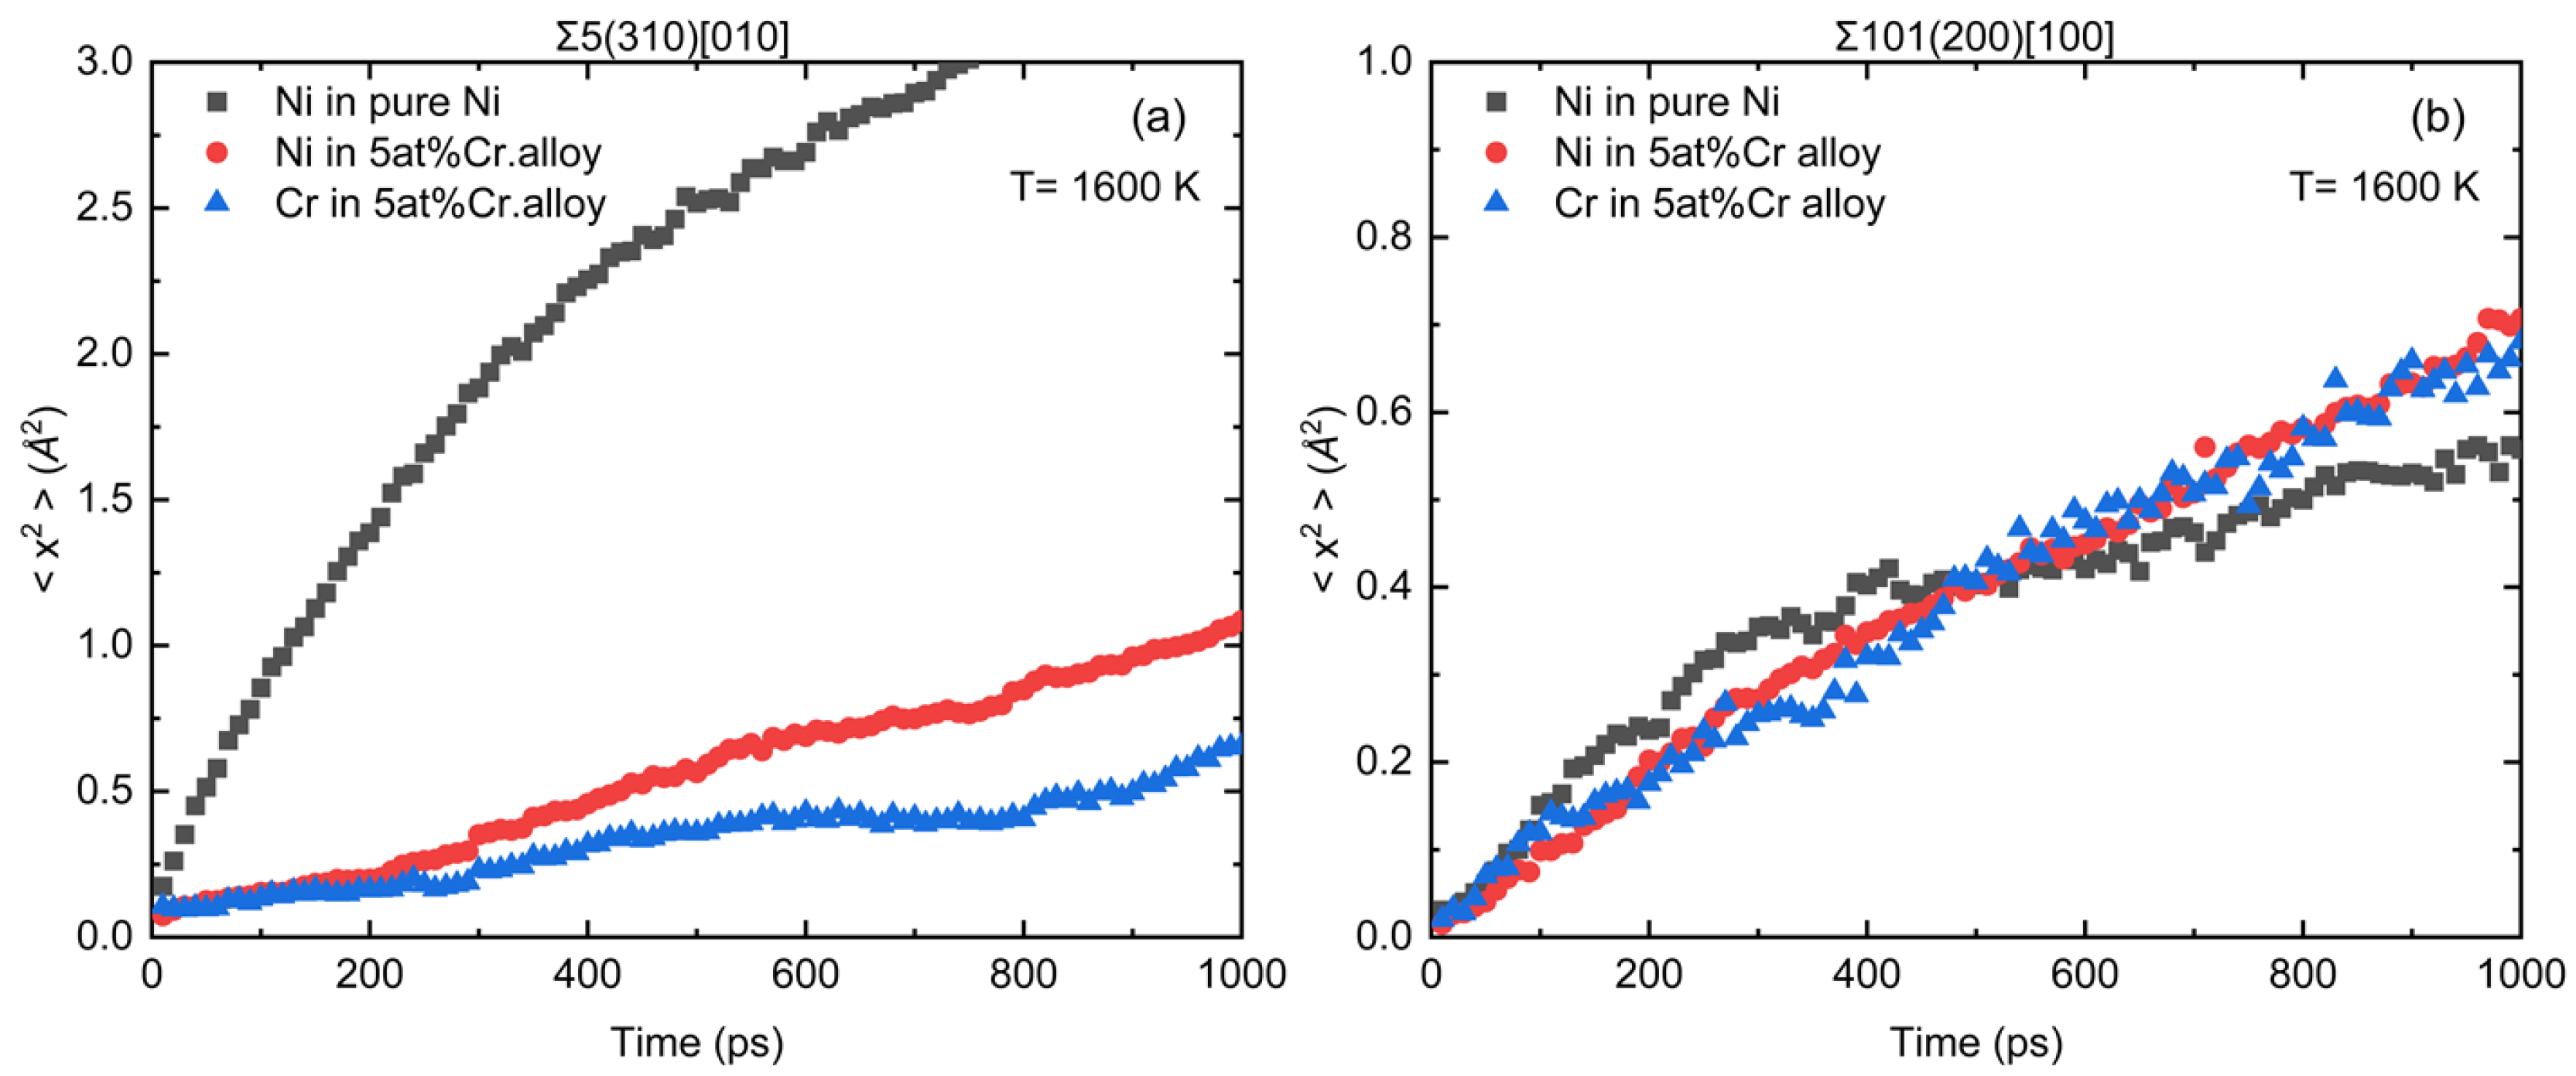
3.3. Analyzing the Effects of Grain Boundary Atom Diffusion and Lattice Distortion on Grain Boundary Migration

Given that the impact of the grain boundary solute segregation differences on grain boundary migration behavior appears to still have areas of uncertainty, we have calculated the Radial Distribution Function (RDF) at various temperatures and used the full width at half maximum (FWHM) of the first nearest neighbor peak from RDF to represent lattice distortion [47]. Additionally, to better understand the mechanism of grain boundary migration and the influence that segregation brings to this mechanism, we calculated atomic diffusion at the grain boundary under the solid-liquid temperatures.
Upon the examination of Figure 8a–d, it is evident that the concentration of the segregation on the grain boundaries and the width of the first nearest neighbor peak increase with the rise in Cr concentration, indicating an increase in lattice distortion. Due to Cr segregation typically replacing the original nickel atoms of the FCC lattice, Cr atoms segregate onto the nickel grain boundaries. This results in a higher relative density of Cr and a lower relative density of nickel in the grain boundary region, altering the g(r) function plot. However, the ordering of nickel on the grain boundaries remains largely unchanged under the influence of Cr segregation. The ordering of nickel is primarily determined by the morphology of the grain boundaries, with nickel atoms in the grain boundary maintaining a distribution pattern akin to that of pure nickel bicrystals.
Furthermore, with increasing temperature, atoms vibrating near their equilibrium positions broaden the peaks of g(r) as thermal vibrations and intrinsic lattice distortions overlap. Similar behavior can be observed in Σ101(200)[100] samples. As interfacial regions, grain boundaries possess unique structural and energetic characteristics that may impact the distribution of Cr and Ni atoms. Lattice distortions at grain boundaries are generally believed to reduce grain growth [21]. By comparison of Figure 8e,f, it is hard to observe significant differences in lattice distortion between two kinds of grain boundary with the same Cr doping concentration at different temperatures. This proves from the side that the effect of lattice distortion is small.
The mean-square displacements at 1600 K were calculated to further explore the relationship between GB atom diffusion coefficients and temperature. The GB atom diffusion coefficients were all obtained from Einstein’s relations: Dx = (x2)/2δt, Dy = (y2)/2δt, and Dz = (z2)/2δt. Due to our modeling method and grain boundary diffusion method, the mean azimuth shift in the X-axis direction is more representative. Figure 9 illustrates plots from selected representative 5 at%.Cr models at a temperature of 1600 K, displaying the relationship between < x2 > and time. The slopes of these plots can be utilized to compute the grain boundary (GB) atom diffusion coefficients. As anticipated from the Einstein relation, these plots exhibit a high degree of linearity. The slope of the curve shows that the GB atom diffusion coefficient of nickel in the pure nickel model is larger than that in the 5 at%.Cr model. This trend is consistent across all temperatures studied for high-angle GB. Also, the diffusion rate is higher in high-angle GB than in low-angle GB. The segregation of Cr in high-angle grain boundaries can decelerate the diffusion rate of Ni at the grain boundaries while in low-angle grain boundaries. Moreover, the diffusion rates of those above three are roughly equivalent. This suggests that the effect of grain boundary segregation on the grain boundaries is primarily concerned with the diffusion rate of the atoms on the grain boundaries due to the variance in types of grain boundaries. The Cr atoms segregated on the high-angel grain boundaries lower the diffusion rate of the Ni atoms and cause a roughening phenomenon.

4. Conclusions

To investigate the effect of solute segregation on the grain boundary stability of Ni-Cr alloys with different Cr concentrations two typical grain boundaries are chosen as models using MD/ MC methods to simulate the solute segregation of Cr with different concentrations, then using the synthetic driving force method to simulate the (spontaneous) motion of grain boundaries. The key conclusions drawn from this investigation are summarized as follows:
  • Grain boundary segregation increases at decreased temperatures, with a more substantial segregation of Cr to the grain boundaries at lower temperatures. However, not all Cr segregates to the grain boundaries due to the high mutual solubility of Cr in the Ni-base, leading to a smaller tendency towards Cr segregation. This effect is more significant for LAGB.
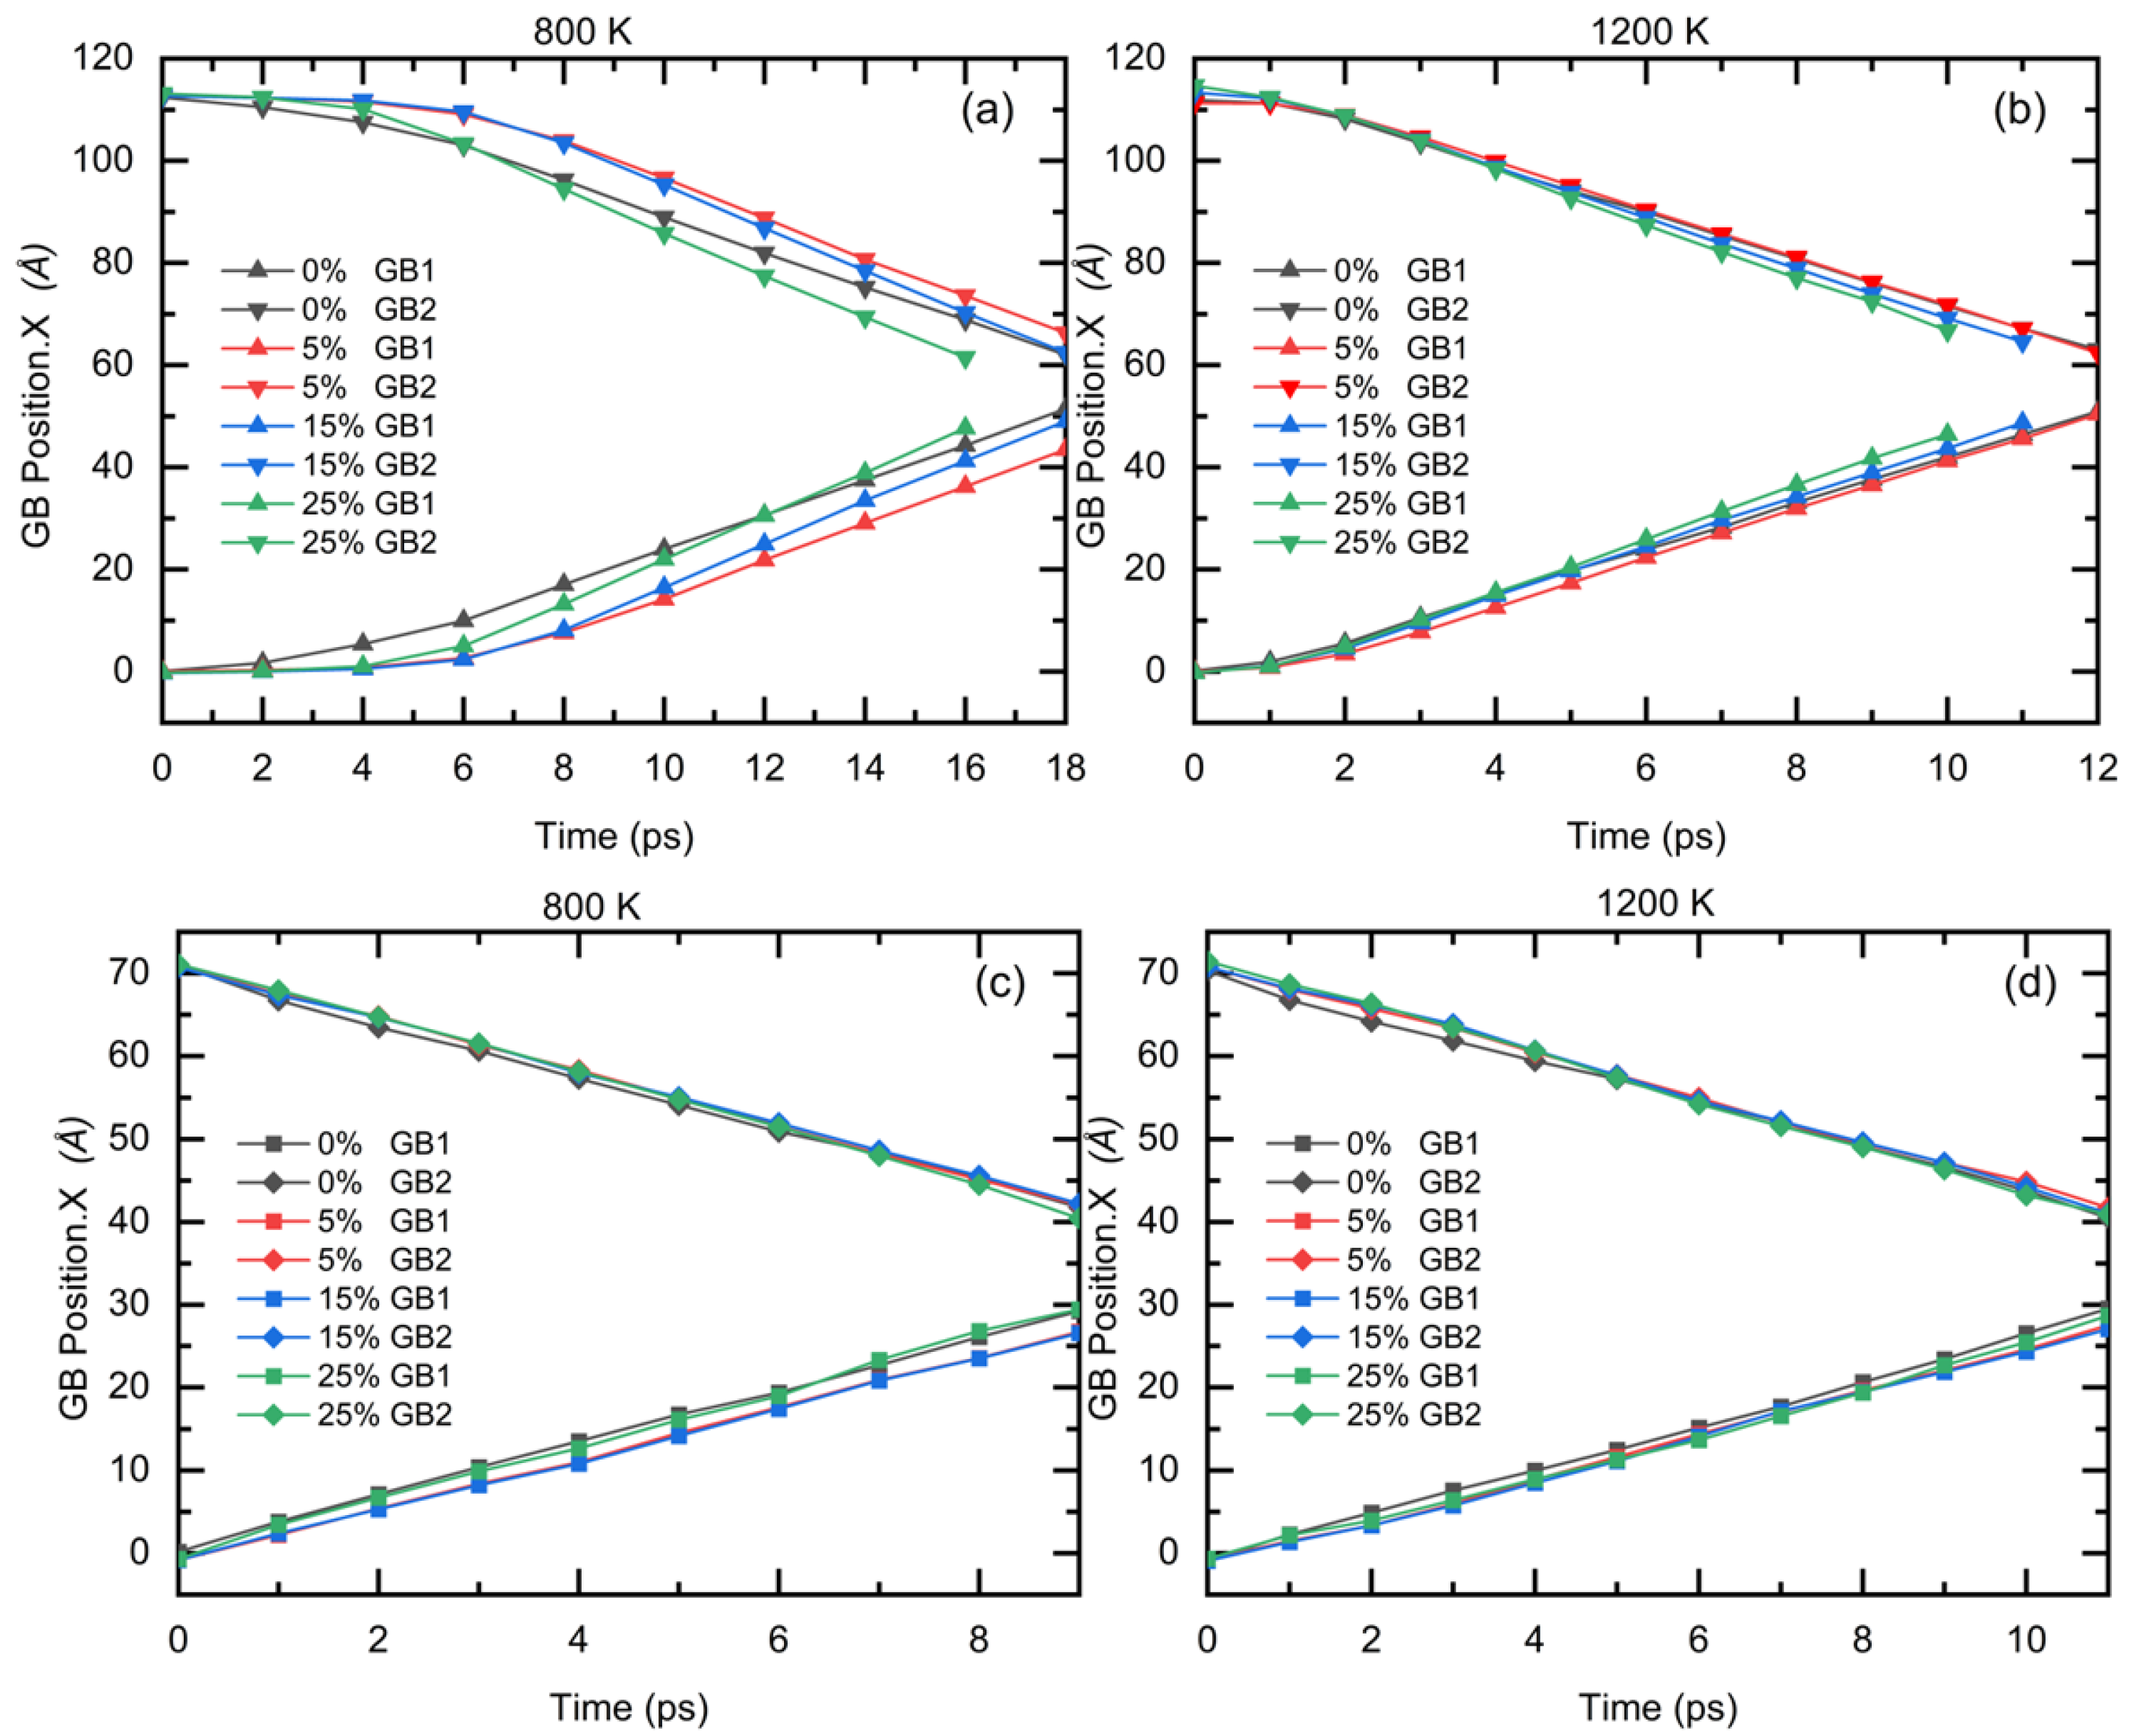
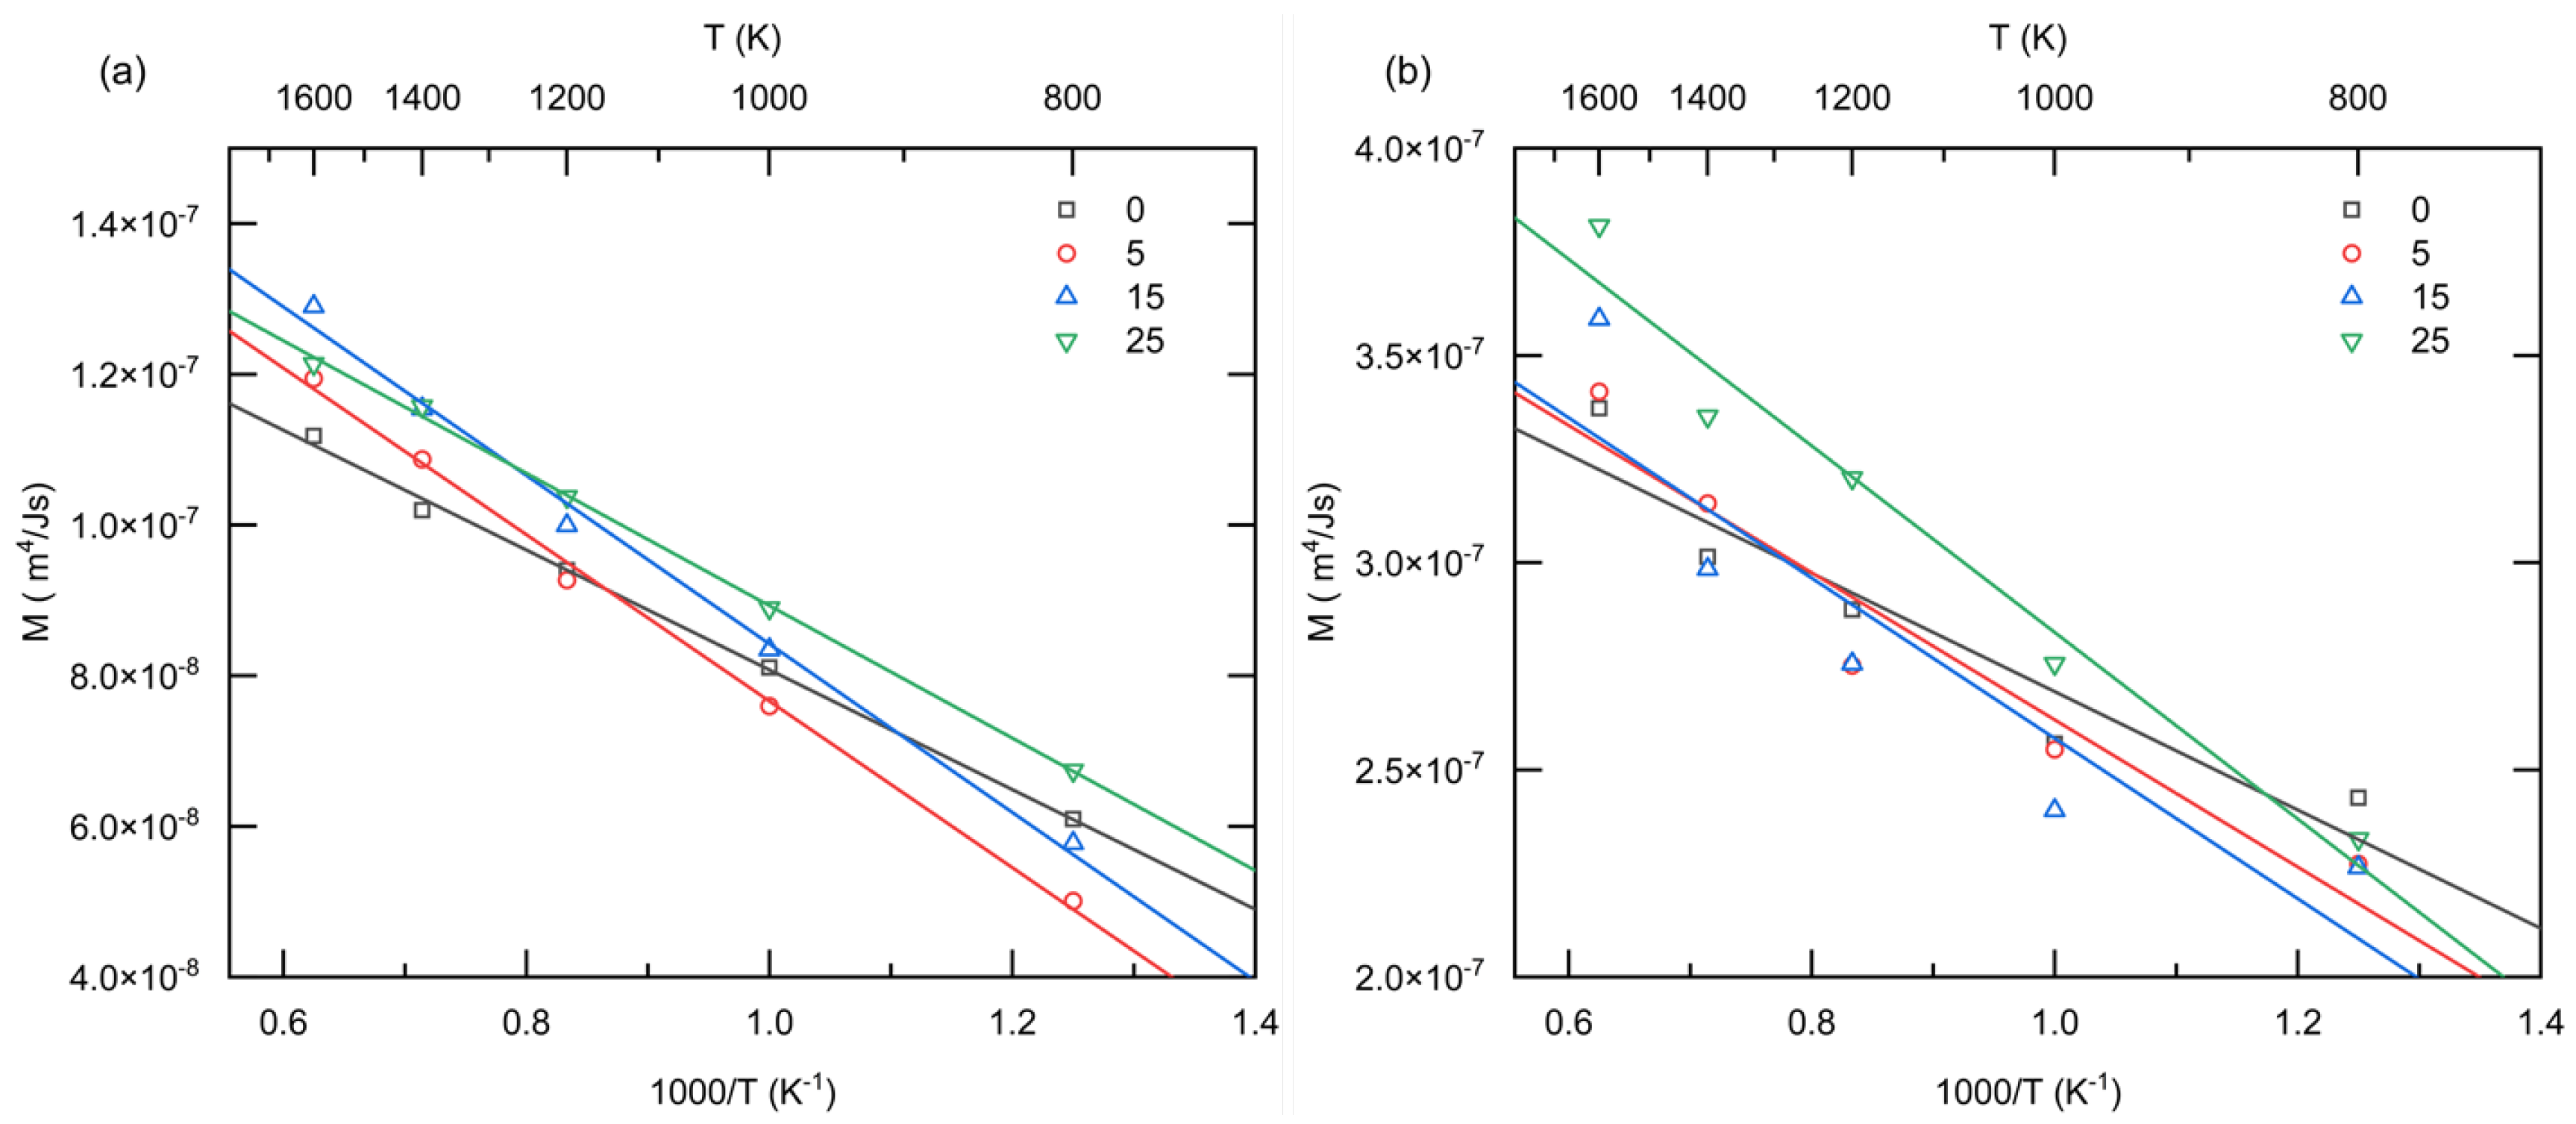
  • For the Σ5(310)[010] grain boundary, at a low temperature (800 K), the roughing period of the grain boundary migration is longer, and the grain boundary undergoes a long slow acceleration movement. Compared with pure nickel, all alloys have a longer roughing time, but this increase decreases with the upper Cr concentration of the alloy. At a higher temperature (1200 K), the coarsening period is shorter, the grain boundary migration starts earlier, and the influence of solute concentration is small. For all Σ101(200)[100] GB models, the roughening process of grain boundary is not found. The solute concentration in the bulk also affects the grain boundary mobility and is complex. And the behavior of the two kinds of grain boundaries is opposite.
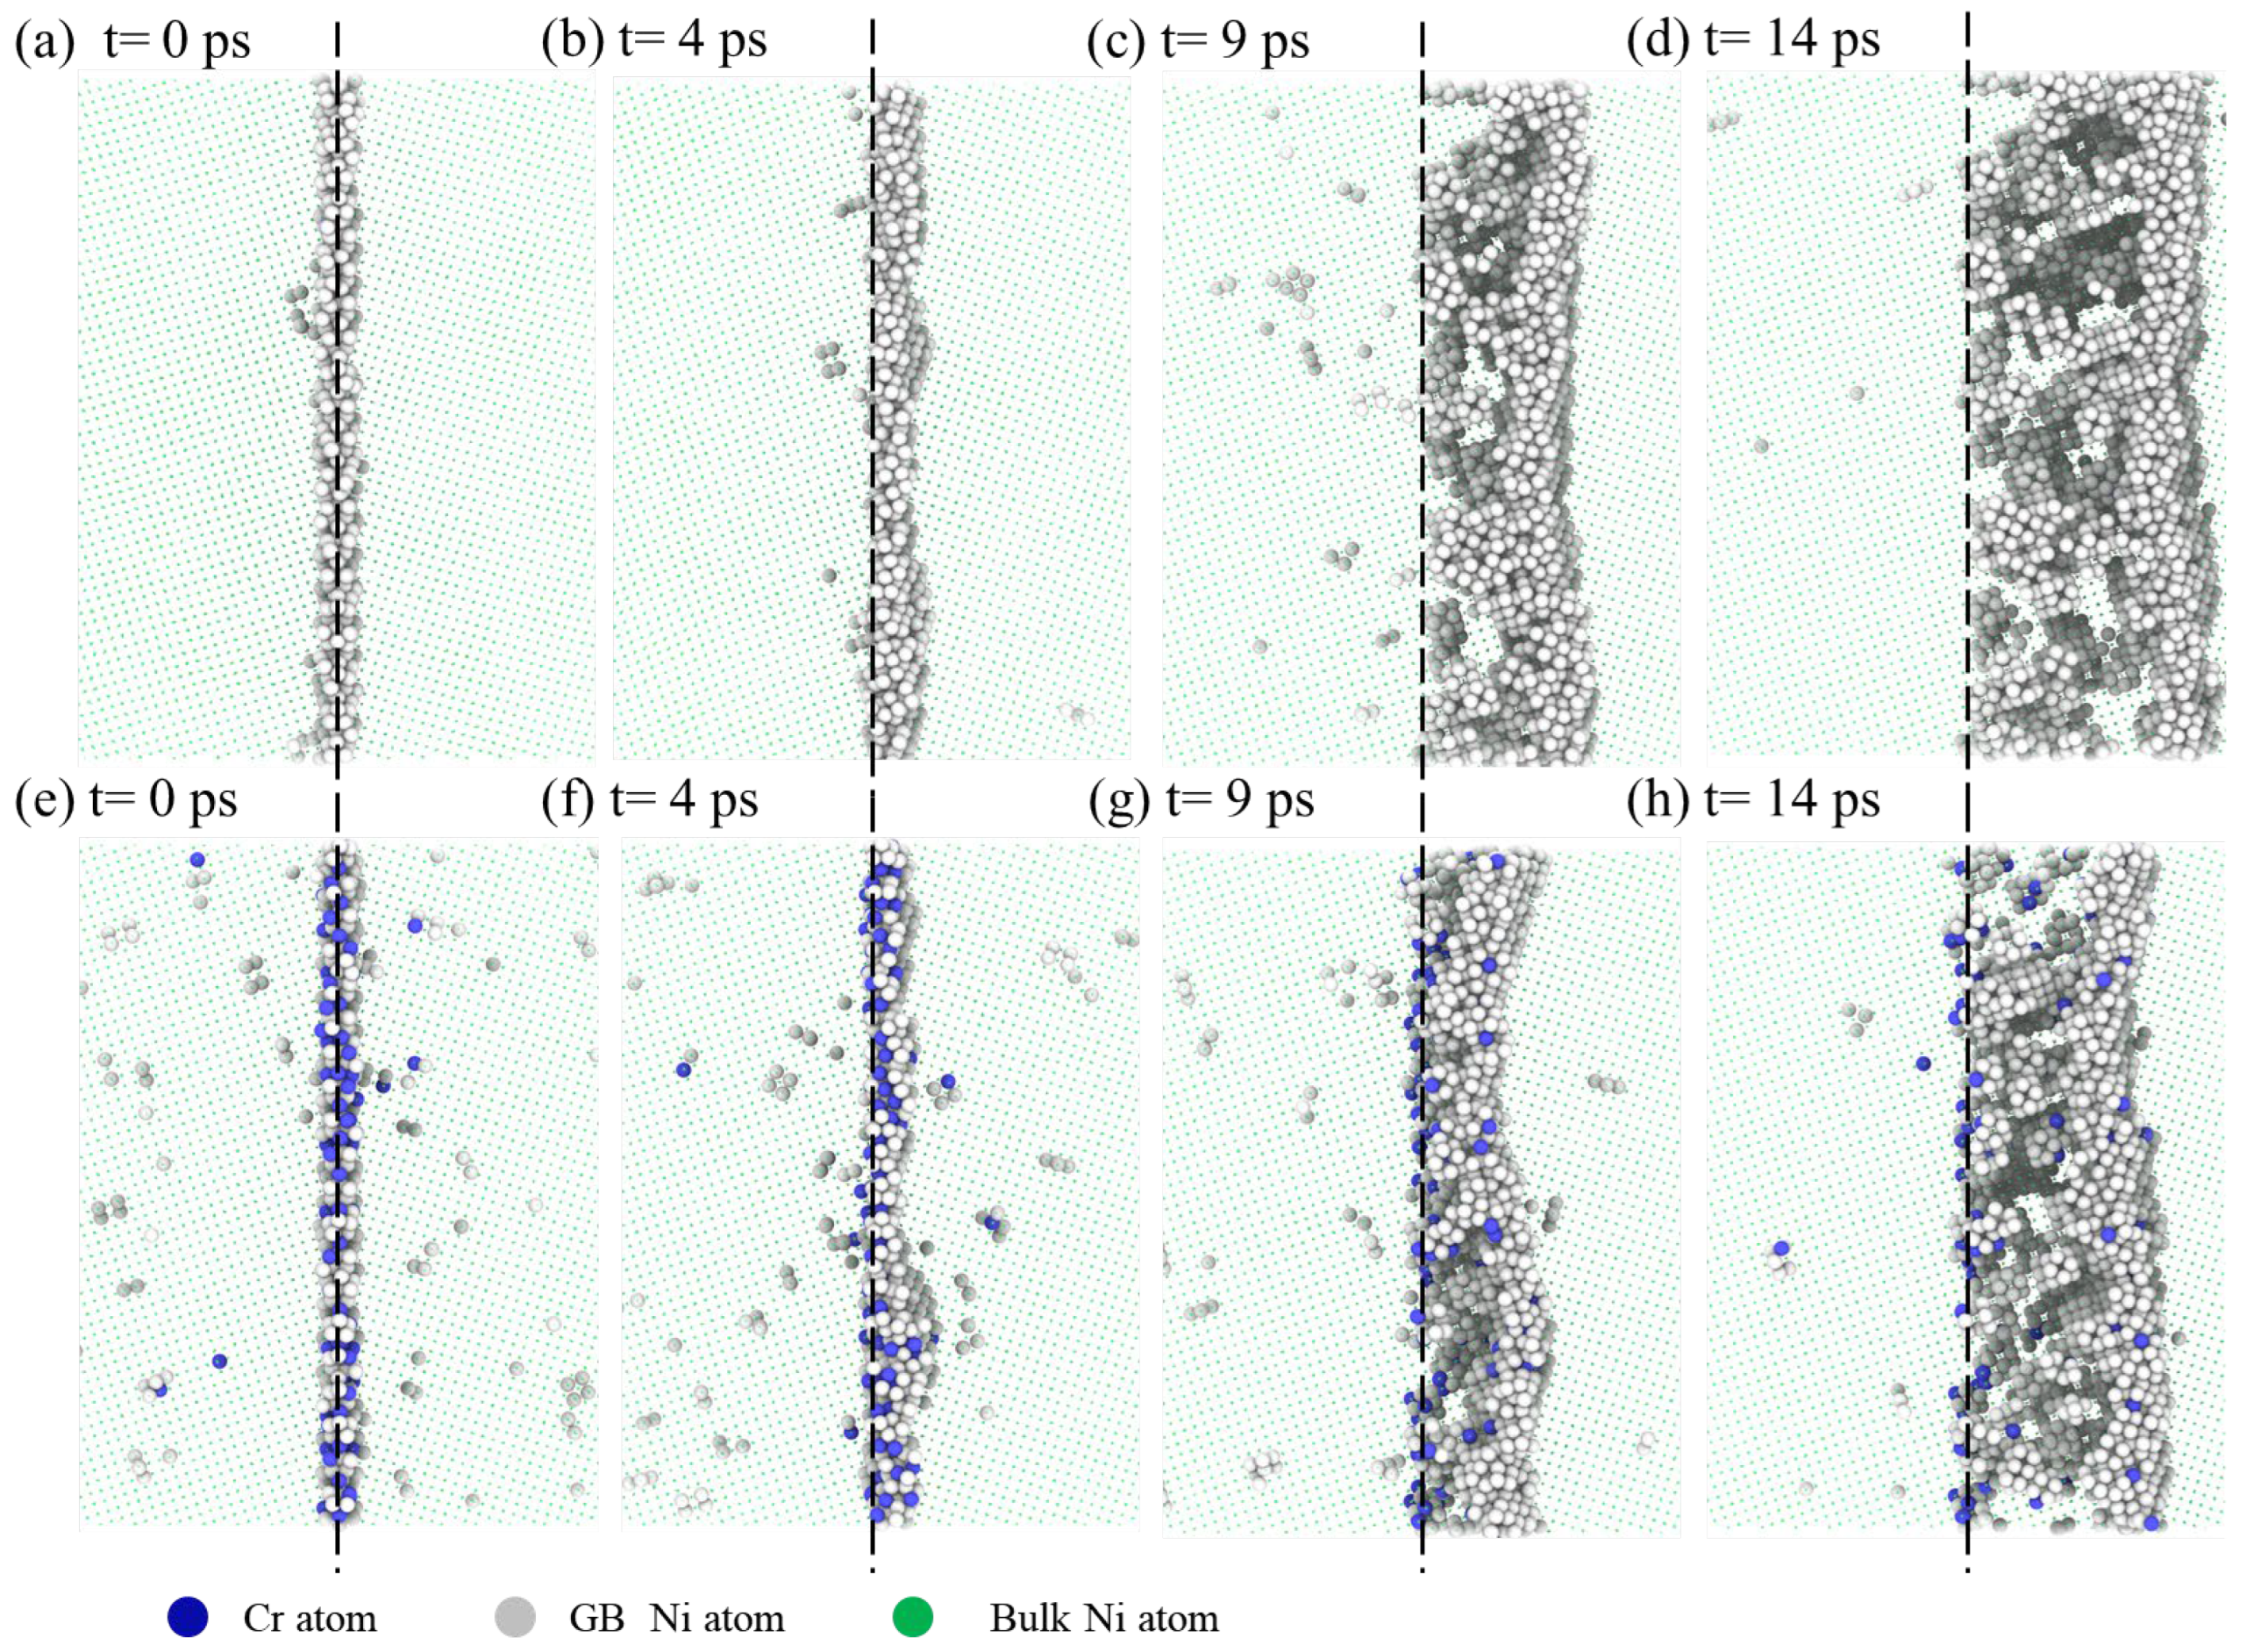
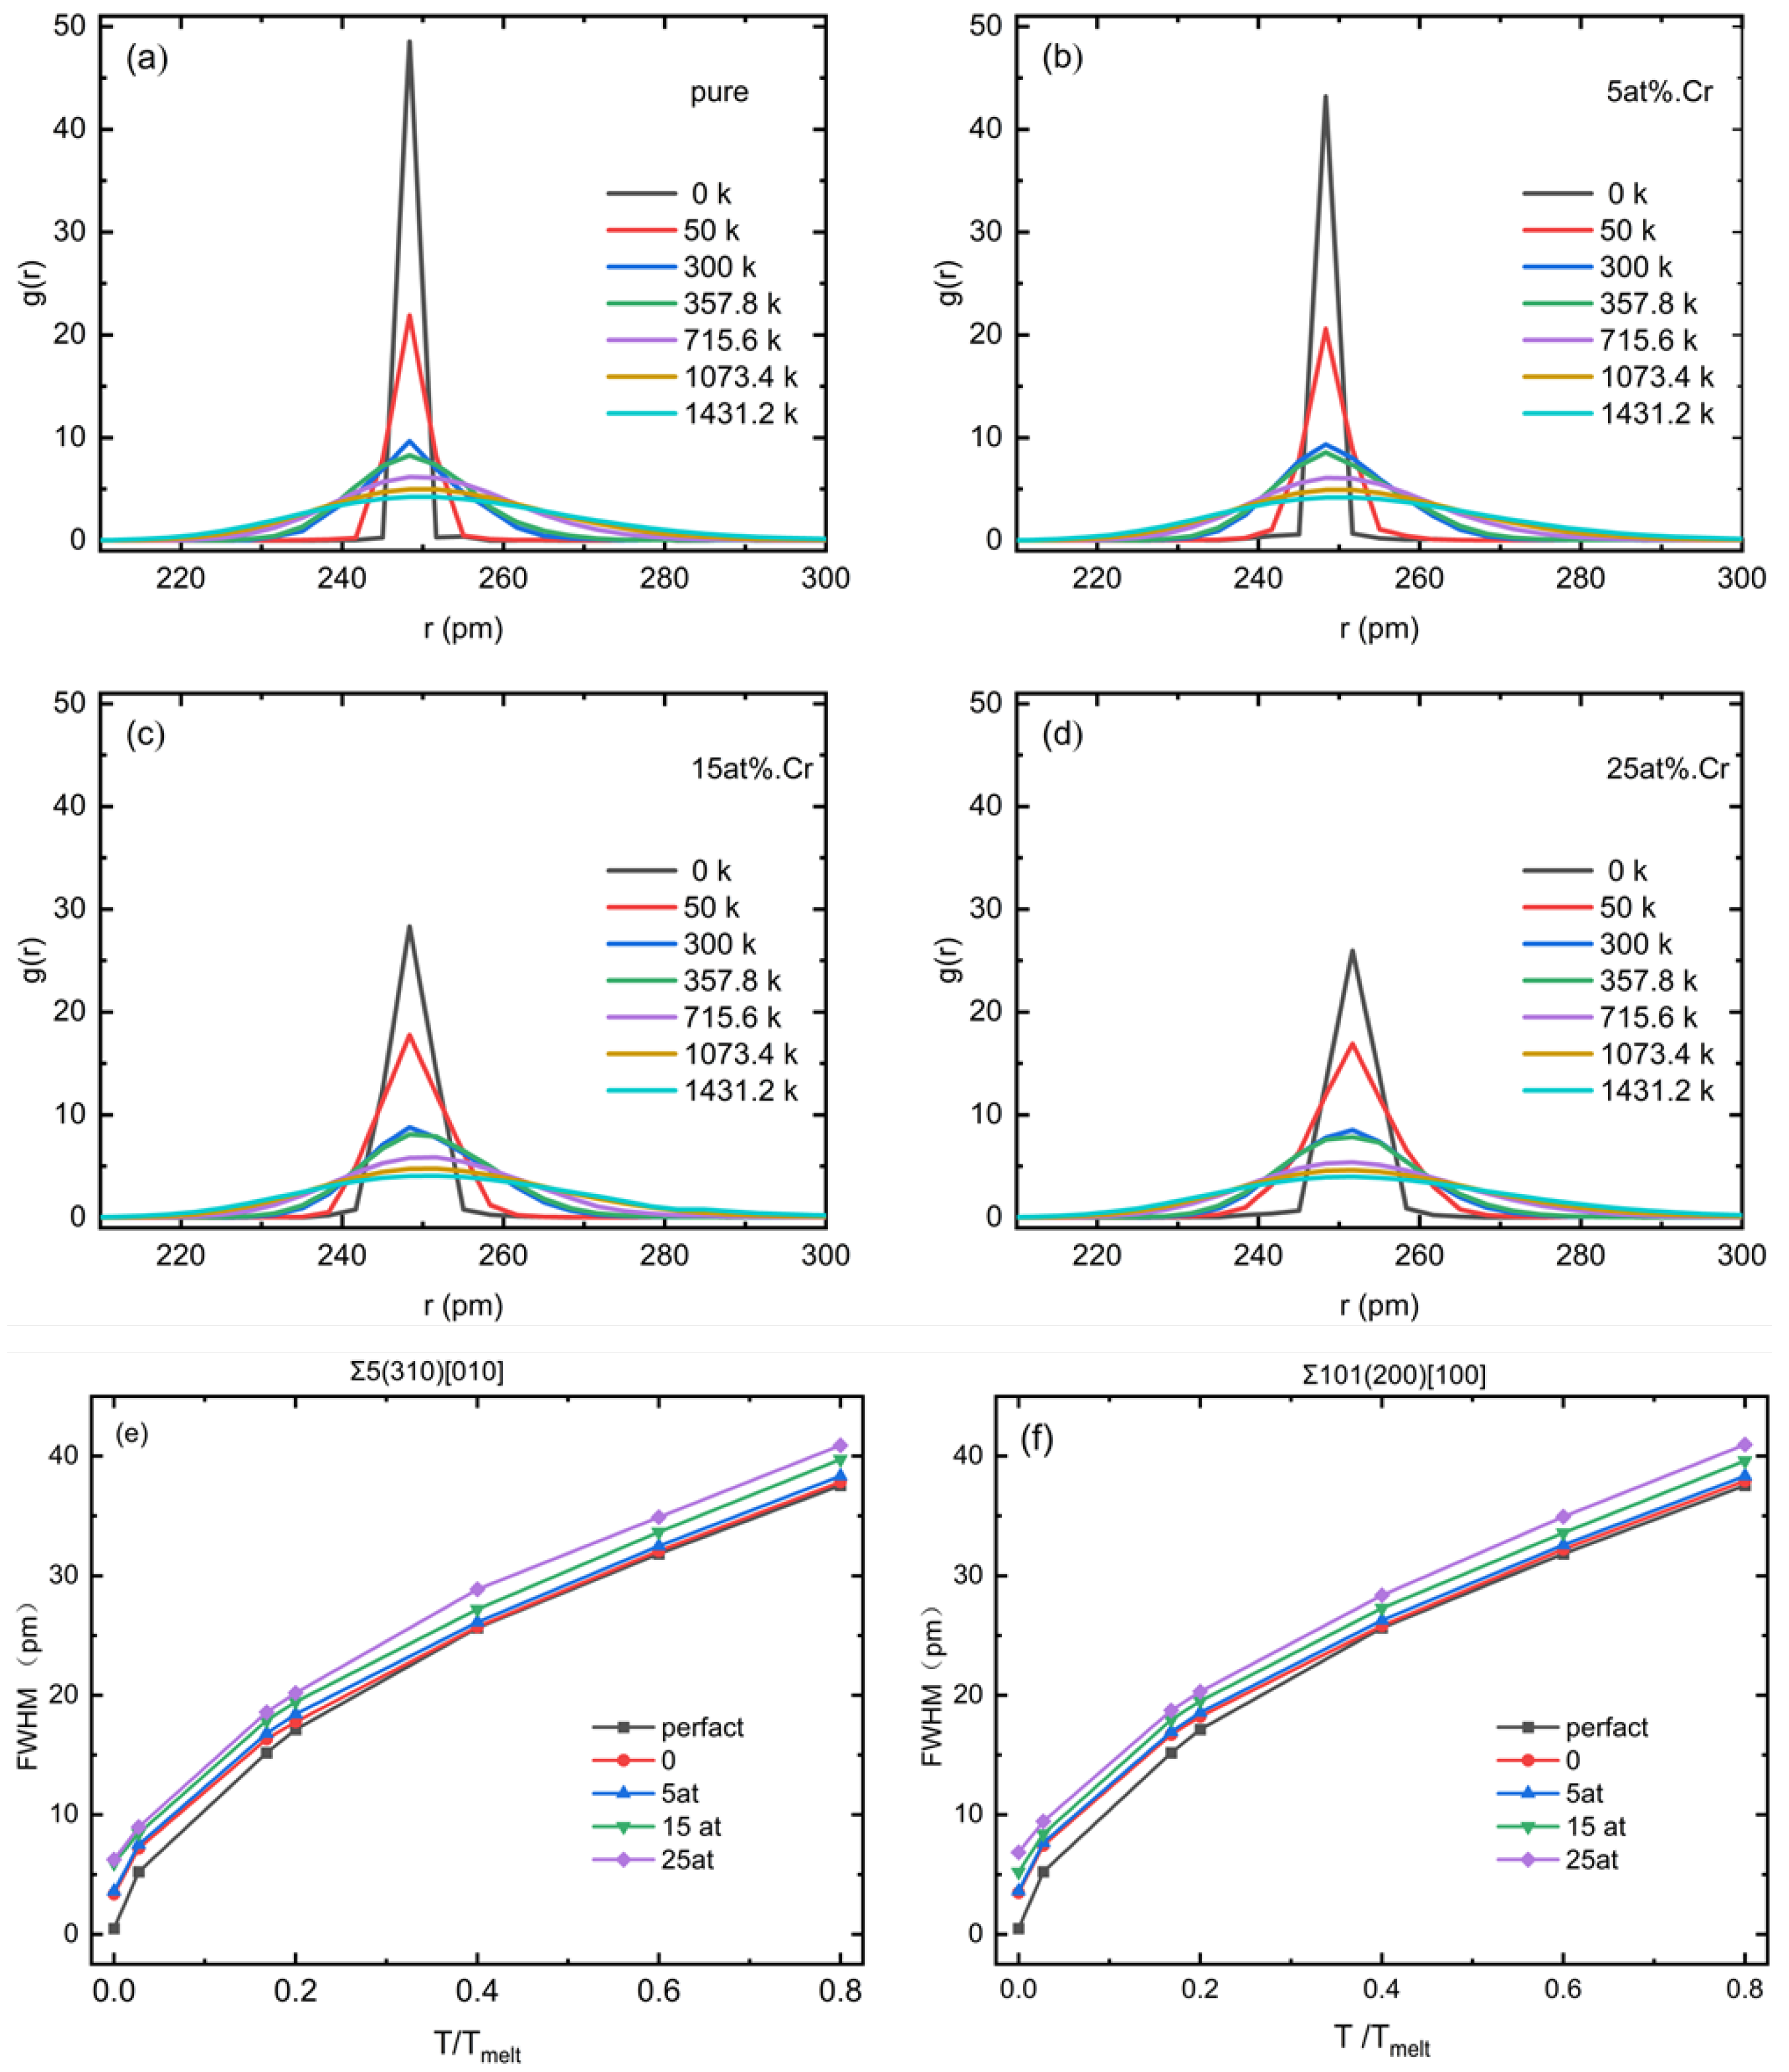
  • For Σ5(310)[010] grain boundary, Cr segregation can decrease Ni self-propagation to impede grain boundary movement, while there is no such phenomenon at small angle grain boundaries. The distribution of segregated Cr atoms on grain boundaries is relatively uniform, and the lattice distortion increases with the total Cr concentration in the system.
To summarize, grain boundary segregation of Cr has a complex effect on grain boundary migration. The mechanism of grain boundary migration can be understood more carefully and comprehensively by considering factors such as solute concentration, grain boundary type, and temperature. Thus, our results revealed some important factors in the segregation-increased GB stabilization of NC Ni-Cr alloys.

Author Contributions

Conceptualization, P.H. and Q.X.; methodology, P.H.; software, B.H.; validation, P.H., Q.X. and D.Y.; formal analysis, W.H.; investigation, P.H.; resources, B.H.; data curation, Q.X.; writing-original draft preparation, P.H.; writing—review and editing, D.Y.; visualization, P.H.; supervision, W.H.; project administration, D.Y.; funding acquisition, D.Y. All authors have read and agreed to the published version of the manuscript.

Funding

This work was supported by the National Natural Science Foundation of China (Grant 12074113, 51871095), and the Ministry of Science and Technology of the People’s Republic of China (National Key Research Project of China, Grant 2018YFB0704000).

Data Availability Statement

The raw data supporting the conclusions of this article will be made available by the authors on request.

Conflicts of Interest

The authors declare no conflicts of interest. The funders had no role in the design of the study; in the collection, analyses, or interpretation of data; in the writing of the manuscript, or in the decision to publish the results.

References

  1. Ghaffari, Y.; Daub, K.; Long, F.; Persaud, S.Y. Intergranular oxidation behaviour of Ni-Cr-Al model alloys in 480 °C hydrogenated steam. Corros. Sci. 2024, 226, 111678. [Google Scholar] [CrossRef]
  2. Wang, X.; Liu, Z.; Cheng, K.; Kong, Y. Chlorine-induced high-temperature corrosion characteristics of Ni-Cr alloy cladding layer and Ni-Cr-Mo alloy cladding layer. Corros. Sci. 2023, 216, 111102. [Google Scholar] [CrossRef]
  3. Keskar, N.; Krishna, K.V.M.; Gupta, C.; Singh, J.B.; Tewari, R. The effect of Cr content on the microstructural and textural evolution and the mechanical properties of Ni-Cr binary alloys. Mater. Today Commun. 2022, 33, 104831. [Google Scholar] [CrossRef]
  4. Li, X.Z.; Li, H.C.; Wang, Y.T.; Li, B. Investigations on the behavior of laser cladding Ni-Cr-Mo alloy coating on TP347H stainless steel tube in HCl rich environment. Surf. Coat. Technol. 2013, 232, 627–639. [Google Scholar] [CrossRef]
  5. Theska, F.; Stanojevic, A.; Oberwinkler, B.; Primig, S. Microstructure-property relationships in directly aged Alloy 718 turbine disks. Mater. Sci. Eng. A 2020, 776, 138967. [Google Scholar] [CrossRef]
  6. Dong, H.; Yang, J.; Xia, Y.; Xu, X.; Li, P.; Dong, C.; Zheng, L. Effect of Cr content in Ni-based amorphous filler on microstructure and shear strength of K4169 nickel-based alloy brazed joint. J. Mater. Process. Technol. 2021, 290, 116975. [Google Scholar] [CrossRef]
  7. Meng, F.; Qiu, J.; Baker, I. The effects of chromium on the microstructure and tensile behavior of Fe30Ni20Mn35Al15. Mater. Sci. Eng. A 2013, 586, 45–52. [Google Scholar] [CrossRef]
  8. Xue, F.; Marquis, E.A. Role of diffusion-induced grain boundary migration in the oxidation response of a Ni-30 Cr alloy. Acta Mater. 2022, 240, 118343. [Google Scholar] [CrossRef]
  9. Ebner, A.S.; Jakob, S.; Clemens, H.; Pippan, R.; Maier-Kiener, V.; He, S.; Razumovskiy, V.I. Grain boundary segregation in Ni-base alloys: A combined atom probe tomography and first principles study. Acta Mater. 2021, 221, 117354. [Google Scholar] [CrossRef]
  10. Shi, Y.; Xue, H.; Tang, F.; Lu, X.; Ren, J.; Li, J. Effects of transition metal segregation on the thermodynamic stability and strength of Ni Σ11 [110](113) symmetrical tilt grain boundary. Vacuum 2023, 212, 112036. [Google Scholar] [CrossRef]
  11. Srivastav, A.K.; Chawake, N.; Murty, B.S. Grain-size-dependent non-monotonic lattice parameter variation in nanocrystalline W: The role of non-equilibrium grain boundary structure. Scr. Mater. 2015, 98, 20–23. [Google Scholar] [CrossRef]
  12. Al-Zuhairi, O.; Anuar, A.; Makinudin, A.H.A.; Bakar, A.S.A.; Azlan, M.N.; Supangat, A. Magnesium doped semipolar (11–22) p-type gallium nitride: Impact of dopant concentration variants towards grain size distributions and crystalline quality. Thin Solid Film. 2022, 741, 139003. [Google Scholar] [CrossRef]
  13. Yadav, N.; Parker, S.C.; Tewari, A. Genetic algorithm assisted multiscale modeling of grain boundary segregation of Al in ZnO and its correlation with nominal dopant concentration. J. Eur. Ceram. Soc. 2024, 4, 944–953. [Google Scholar] [CrossRef]
  14. Olmsted, D.L.; Holm, E.A.; Foiles, S.M. Survey of computed grain boundary properties in face-centered cubic metals-II: Grain boundary mobility. Acta Mater. 2009, 57, 3704–3713. [Google Scholar] [CrossRef]
  15. Brandon, D. 25 Year Perspective Defining grain boundaries: An historical perspective the development and limitations of coincident site lattice models. Mater. Sci. Technol. 2010, 26, 762–773. [Google Scholar] [CrossRef]
  16. Hu, C.; Dingreville, R.; Boyce, B.L. Computational modeling of grain boundary segregation: A review. Comput. Mater. Sci. 2024, 32, 112596. [Google Scholar] [CrossRef]
  17. Zhang, X.; Zhang, L.; Zhang, Z.; Huang, X. Effect of solute atoms segregation on Al grain boundary energy and mechanical properties by first-principles study. Mech. Mater. 2023, 185, 104775. [Google Scholar] [CrossRef]
  18. Lu, P.; Abdeljawad, F.; Rodriguez, M.; Chandross, M.; Adams, D.P.; Boyce, B.L.; Clark, B.G.; Argibay, N. On the thermal stability and grain boundary segregation in nanocrystalline PtAu alloys. Materialia 2019, 6, 100298. [Google Scholar] [CrossRef]
  19. Wu, C.; Zhan, L.; Liu, Q.; Liu, H.; Wang, J.; Liu, W.; Yao, S.; Ma, Y. Grain boundary segregation for enhancing the thermal stability of alumina-mullite diphasic fibers by La2O3 addition. J. Eur. Ceram. Soc. 2023, 43, 7012–7022. [Google Scholar] [CrossRef]
  20. Yang, M.; Zhou, J.; Huang, H.; Cao, S.; Hu, Q.-M.; Li, W.; Chen, Q.; Qiao, Y.; Wang, H. High-throughput first-principles investigation on grain boundary segregation of alloying elements in ferritic steel. J. Mater. Res. Technol. 2023, 26, 2140–2150. [Google Scholar] [CrossRef]
  21. Sathiaraj, G.D.; Bhattacharjee, P.P.; Tsai, C.-W.; Yeh, J.-W. Effect of heavy cryo-rolling on the evolution of microstructure and texture during annealing of equiatomic CoCrFeMnNi high entropy alloy. Intermetallics 2016, 69, 1–9. [Google Scholar] [CrossRef]
  22. Mishin, Y. Solute drag and dynamic phase transformations in moving grain boundaries. Acta Mater. 2019, 179, 383–395. [Google Scholar] [CrossRef]
  23. John, C.W. The Impurity-Drag Effect in Grain Boundary Motion. Acta Metall. 1962, 10, 789–798. [Google Scholar] [CrossRef]
  24. Koju, R.K.; Mishin, Y. Atomistic study of grain-boundary segregation and grain-boundary diffusion in Al-Mg alloys. Acta Mater. 2020, 201, 596–603. [Google Scholar] [CrossRef]
  25. Suzuki, A.; Mishin, Y. Interaction of Point Defects with Grain Boundaries in fcc Metals. Interface Sci. 2003, 11, 425–437. [Google Scholar] [CrossRef]
  26. Janssens, K.G.; Olmsted, D.; Holm, E.A.; Foiles, S.M.; Plimpton, S.J.; Derlet, P.M. Computing the mobility of grain boundaries. Nat. Mater. 2006, 5, 124–127. [Google Scholar] [CrossRef]
  27. Gottstein, G.; Molodov, D.A.; Shvindlerman, L.S. Grain Boundary Migration in Metals: Recent Developments. Interface Sci. 1998, 6, 7–22. [Google Scholar] [CrossRef]
  28. Koju, R.K.; Mishin, Y. Relationship between grain boundary segregation and grain boundary diffusion in Cu-Ag alloys. Phys. Rev. Mater. 2020, 4, 073403. [Google Scholar] [CrossRef]
  29. Liu, R.; Li, S.; Chen, L.; Li, J.; Kong, L. Investigation of edge dislocation mobility in Ni-Co solid solutions by molecular dynamics simulation. Mater. Today Commun. 2024, 38, 107779. [Google Scholar] [CrossRef]
  30. Baruffi, C.; Curtin, W.A. Theory of spontaneous grain boundary roughening in high entropy alloys. Acta Mater. 2022, 234, 118011. [Google Scholar] [CrossRef]
  31. Olmsted, D.L.; Foiles, S.M.; Holm, E.A. Grain boundary interface roughening transition and its effect on grain boundary mobility for non-faceting boundaries. Scr. Mater. 2007, 57, 1161–1164. [Google Scholar] [CrossRef]
  32. Utt, D.; Stukowski, A.; Albe, K. Grain boundary structure and mobility in high-entropy alloys: A comparative molecular dynamics study on a Σ11 symmetrical tilt grain boundary in face-centered cubic CuNiCoFe. Acta Mater. 2020, 186, 11–19. [Google Scholar] [CrossRef]
  33. Detor, A.J.; Schuh, C.A. Grain boundary segregation, chemical ordering and stability of nanocrystalline alloys: Atomistic computer simulations in the Ni–W system. Acta Mater. 2007, 55, 4221–4232. [Google Scholar] [CrossRef]
  34. Kirchheim, R. Reducing grain boundary, dislocation line and vacancy formation energies by solute segregation. Acta Mater. 2007, 55, 5129–5138. [Google Scholar] [CrossRef]
  35. Wu, C.; Lee, B.; Su, X. Modified embedded-atom interatomic potential for Fe-Ni, Cr-Ni and Fe-Cr-Ni systems. Calphad 2017, 57, 98–106. [Google Scholar] [CrossRef]
  36. Plimpton, S. Fast Parallel Algorithms for Short-Range Molecular Dynamics. J. Comput. Phys. 1995, 117, 1–19. [Google Scholar] [CrossRef]
  37. Stukowski, A. Visualization and Analysis Strategies for Atomistic Simulations. In Multiscale Materials Modeling for Nanomechanics; Weinberger, C., Tucker, G., Eds.; Springer Series in Materials Science; Springer: Cham, Switzerland, 2016; Volume 245. [Google Scholar] [CrossRef]
  38. Hirel, P. Atomsk: A tool for manipulating and converting atomic data files. Comput. Phys. Commun. 2015, 197, 212–219. [Google Scholar] [CrossRef]
  39. Schratt, A.; Mohles, V. Efficient calculation of the ECO driving force for atomistic simulations of grain boundary motion. Comput. Mater. Sci. 2020, 182, 109774. [Google Scholar] [CrossRef]
  40. Suzuki, A.; Mishin, Y. Atomic mechanisms of grain boundary diffusion: Low versus high temperatures. J. Mater. Sci. 2005, 40, 3155–3161. [Google Scholar] [CrossRef]
  41. Sun, H.; Singh, C.V. Temperature dependence of grain boundary excess free volume. Scr. Mater. 2020, 178, 71–76. [Google Scholar] [CrossRef]
  42. Chang, L.-S.; Huang, K.-B. Temperature dependence of the grain boundary segregation of Bi in Ni polycrystals. Scr. Mater. 2004, 51, 551–555. [Google Scholar] [CrossRef]
  43. Frank, F. Grain Boundaries in Metals. Nature 1958, 181, 976–977. [Google Scholar] [CrossRef]
  44. Simonnin, P.; Schreiber, D.K.; Uberuaga, B.P.; Rosso, K.M. Atomic diffusion, segregation, and grain boundary migration in nickel-based alloys from molecular dynamics simulations. Mater. Today Commun. 2023, 35, 105768. [Google Scholar] [CrossRef]
  45. Nazrin, S.N.; Da Silva, M.P.; Li, M.S.; Marega, E., Jr. Activation energy and its fluctuations at grain boundaries of Er3+: BaTiO3 perovskite thin films: Effect of doping concentration and annealing temperature. Vacuum 2021, 194, 110562. [Google Scholar] [CrossRef]
  46. Chen, Q.; Wang, J.; Zhang, Y. Activation energy study of phosphorus-doped microcrystalline silicon thin films. Optik 2016, 127, 10437–10441. [Google Scholar] [CrossRef]
  47. Owen, L.R.; Jones, N.G. Quantifying local lattice distortions in alloys. Scr. Mater. 2020, 187, 428–433. [Google Scholar] [CrossRef]
Figure 1. The schematic diagram of our grain boundary migration simulation system, where green atoms belong to grain a, blue atoms belong to grain b, and white atoms represent grain boundary atoms.
Metals 14 00454 g001
Figure 2. A front view of the Σ5(530)[010] crystalline grain boundary area. The GB plane (530) is perpendicular to the page. (a) The grain boundary is composed of kite-shaped structural units. These structural units are delineated with solid black lines. (b) The description of atomic segregation in the Σ5(530)[010] grain boundary and its adjacent regions, doped with 5 at%.Cr, at a temperature of 300 K, extending up to a distance of 10 Å from the grain boundary plane. (c) The segregation energy spectrum at a temperature of 300 K within a range of 10 Å from the position of the grain boundary plane.
Metals 14 00454 g002
Figure 3. A right view of the Σ101(200)[100] crystalline grain boundary area. The GB plane (200) is parallel to the page. The perfect-lattice atoms are removed for clarity. (a) The grain boundary structure, represented by gray atoms, forms a net-like configuration. (b) The description of atomic segregation in the Σ101(200)[100] grain boundary at a temperature of 300 K. (c)The segregation energy spectrum at a temperature of 300 K, on the grain boundary at the plane (200).
Metals 14 00454 g003
Figure 4. This caption illustrates the distribution of Cr composition bias across various alloy composition models in (a) Σ5(310)[010] tilt GB and (b) Σ101(200)[100] twist GB at distinct temperatures.
Metals 14 00454 g004
Figure 5. Plot of grain boundary position and time after the influence of a combined driving force. (a,b), respectively, depict the variation of the grain boundary position over time for samples with varying alloy concentrations at the Σ5(310)[010] temperatures of 800 K and 1200 K, (c,d), respectively, depict the variation of the grain boundary position over time for samples with varying alloy concentrations at the Σ101(200)[100] grain boundary at temperatures of (a) 800 K and (b) 1200 K.
Metals 14 00454 g005
Figure 6. Growth mechanism of the Σ5(310)[010]GB shown for the pure-Ni sample (ad) and Ni-5 at %.Cr sample (eh) at 800 K. (a,e) show the initial configuration, (b,f) show the configuration was slowly moved, (c,d) GB migrated at a constant rate, at the same time, leaving clusters on the migration path. (g,h) GB migrates constantly, and Cr atoms do not move with grain boundaries. The initial GB position is marked by a dashed line. The atomic size of nickel in bulk is reduced.
Metals 14 00454 g006
Figure 7. (a) The mobility of the Σ5(310)[010] grain boundary for alloy systems with varying concentrations at different temperatures in the context of tilted grain boundaries. (b) The mobility of the Σ101(200)[100] grain boundary at various temperatures for alloy systems with different concentrations within the framework of twisted grain boundaries.
Metals 14 00454 g007
Figure 8. Radial distribution function g(r) over interatomic distance r at different temperatures for (a) pure Ni grain boundary samples, (b) 5 at%.Cr samples, (c) 15 at%.Crsamples, and (d) 25 at%.Cr samples. The FWHM of (e) Σ5(310)[010] grain boundaries and (f) Σ101(200)[100] grain boundaries as a function of homology temperature (normalized by the melting temperature TMelt).
Metals 14 00454 g008
Figure 9. Mean-square atomic displacements perpendicular to the tilt axis in (a) Σ5(310)[010] grain boundaries and (b) Σ101(200)[100] grain boundaries versus time at 1600 k. The lines represent GB atom diffusion in pure Ni and GB diffusion of Ni and Cr in the Ni-5 at%.Cr alloy.
Metals 14 00454 g009
Table 1. Temperature (K), solute atomic concentration (at%), and chemical potential difference.
TemperatureCr ConcentrationΔμ
30050.32
150.36
250.38
60050.215
150.287
250.3225
90050.115
150.22
250.275
120050.01
150.145
250.22
Table 2. The activation energy QM, the concentration of chromium in the bulk C, and pre-exponential factor M0 for GB Mobility in 0 at%.Cr (pure Ni), 5 at%.Cr alloy, 15 at%.Cr alloy, and 25 at%.Cr alloy.
0 at%.Cr (Pure)5 at%.Cr15 at%.Cr25 at%.Cr
Σ5(310)[010]
QM(meV)64.7661.2649.8642.43
M0(10−7 m4/Js)1.911.901.801.76
C(at%.)04.0313.9624.11
Σ101(200)[100]
QM(meV)43.5355.1859.5865.36
M0(10−7 m4/Js)4.434.925.095.96
C(at%.)03.0212.0621.80
Disclaimer/Publisher’s Note: The statements, opinions and data contained in all publications are solely those of the individual author(s) and contributor(s) and not of MDPI and/or the editor(s). MDPI and/or the editor(s) disclaim responsibility for any injury to people or property resulting from any ideas, methods, instructions or products referred to in the content.

