


Optimizing Tensile Properties and Hardness of Inconel 718 by Cold Rolling


Abstract
1. Introduction
2. Experimental Methods
2.1. The Materials
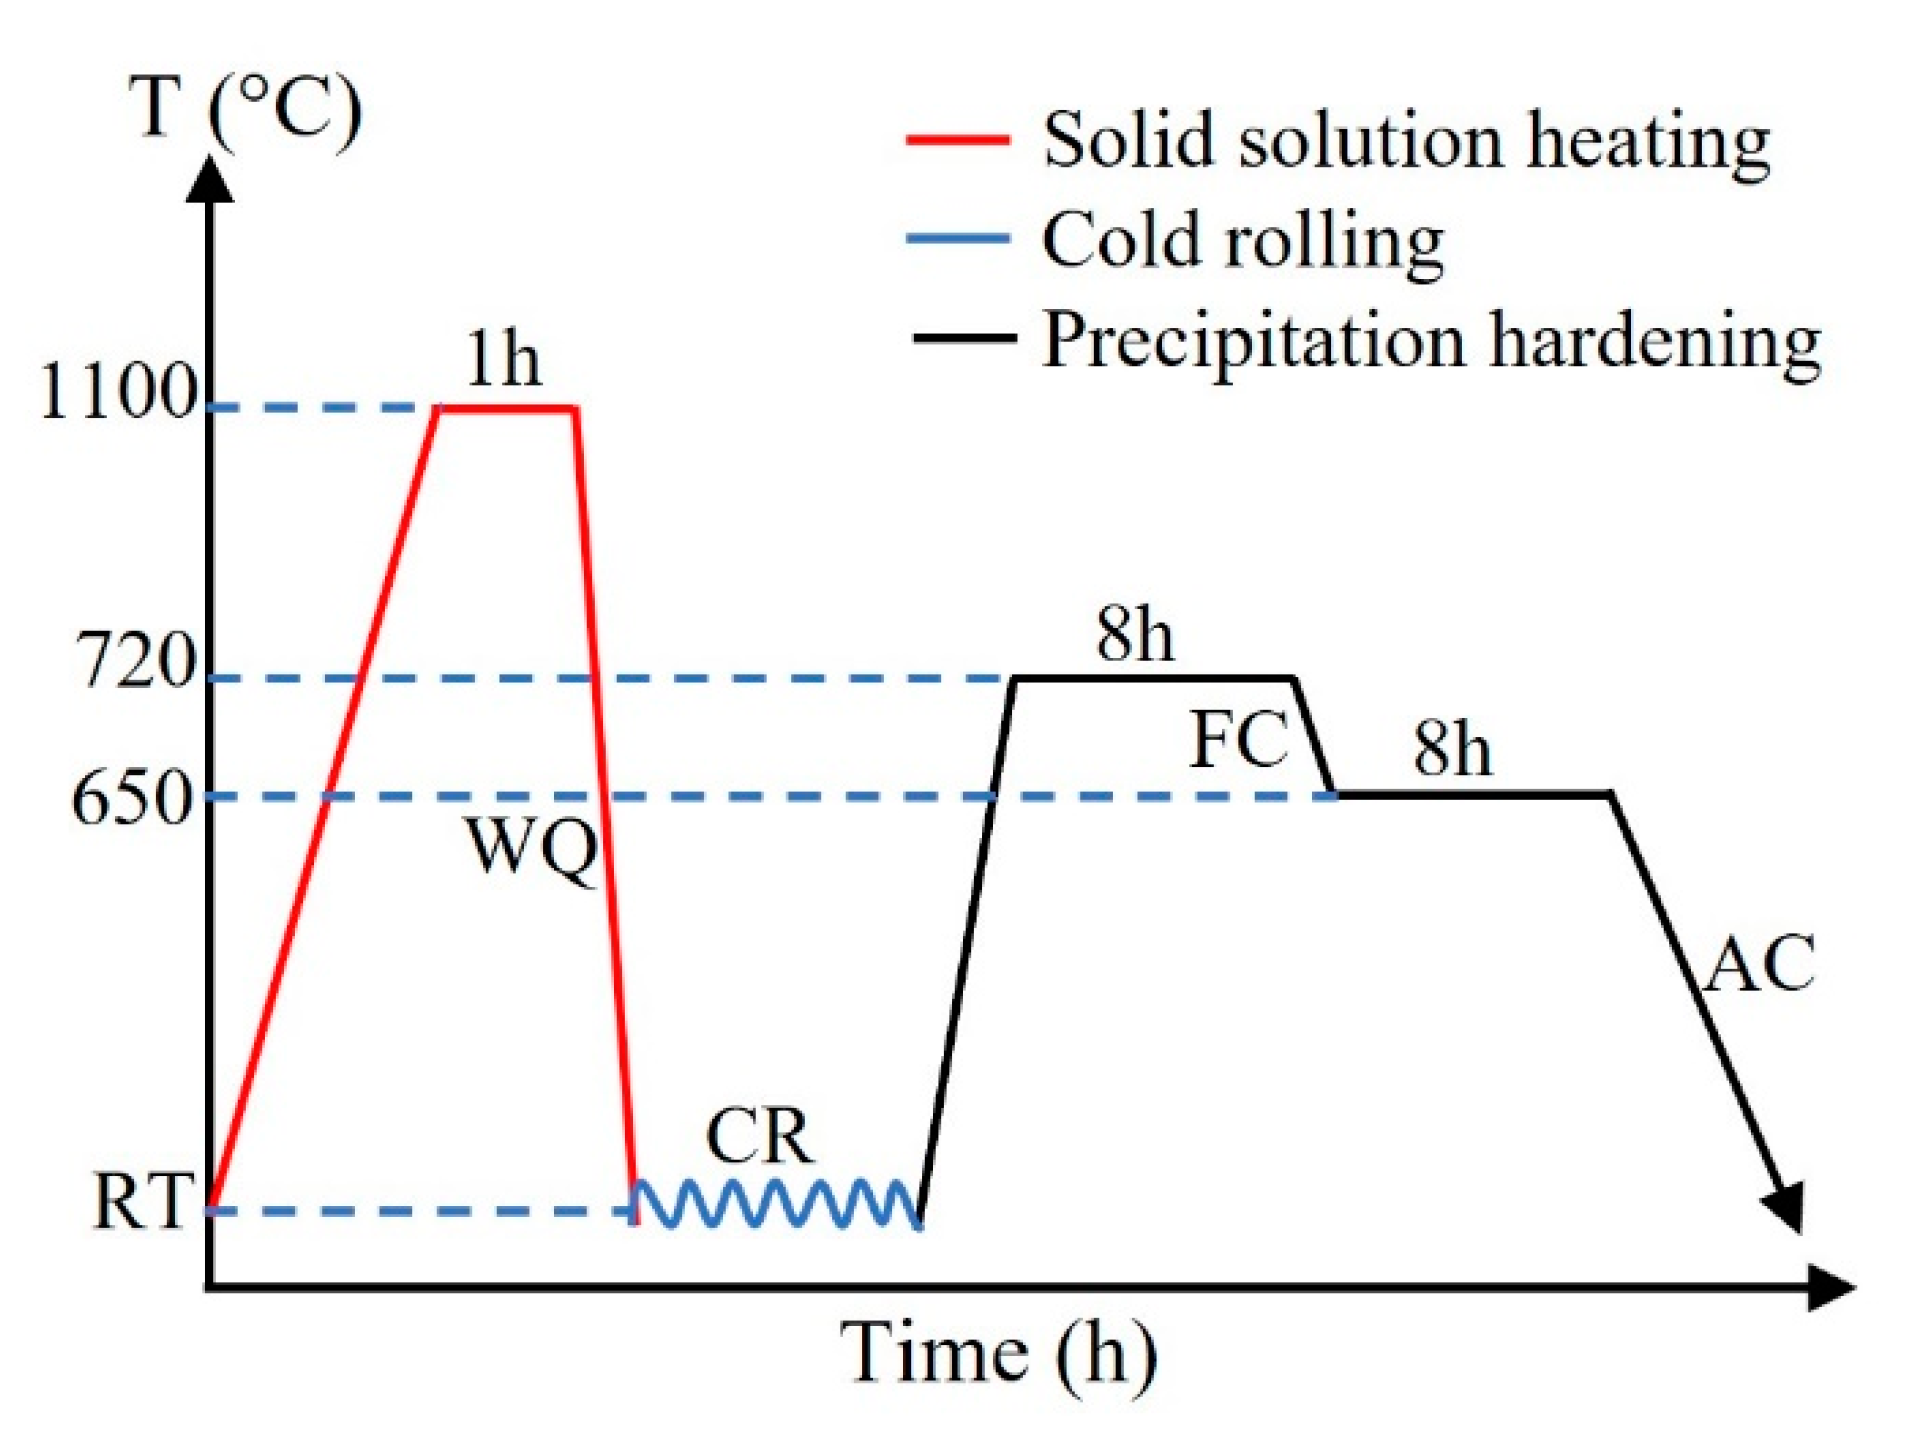
2.2. Heat Treatment and Cold Rolling
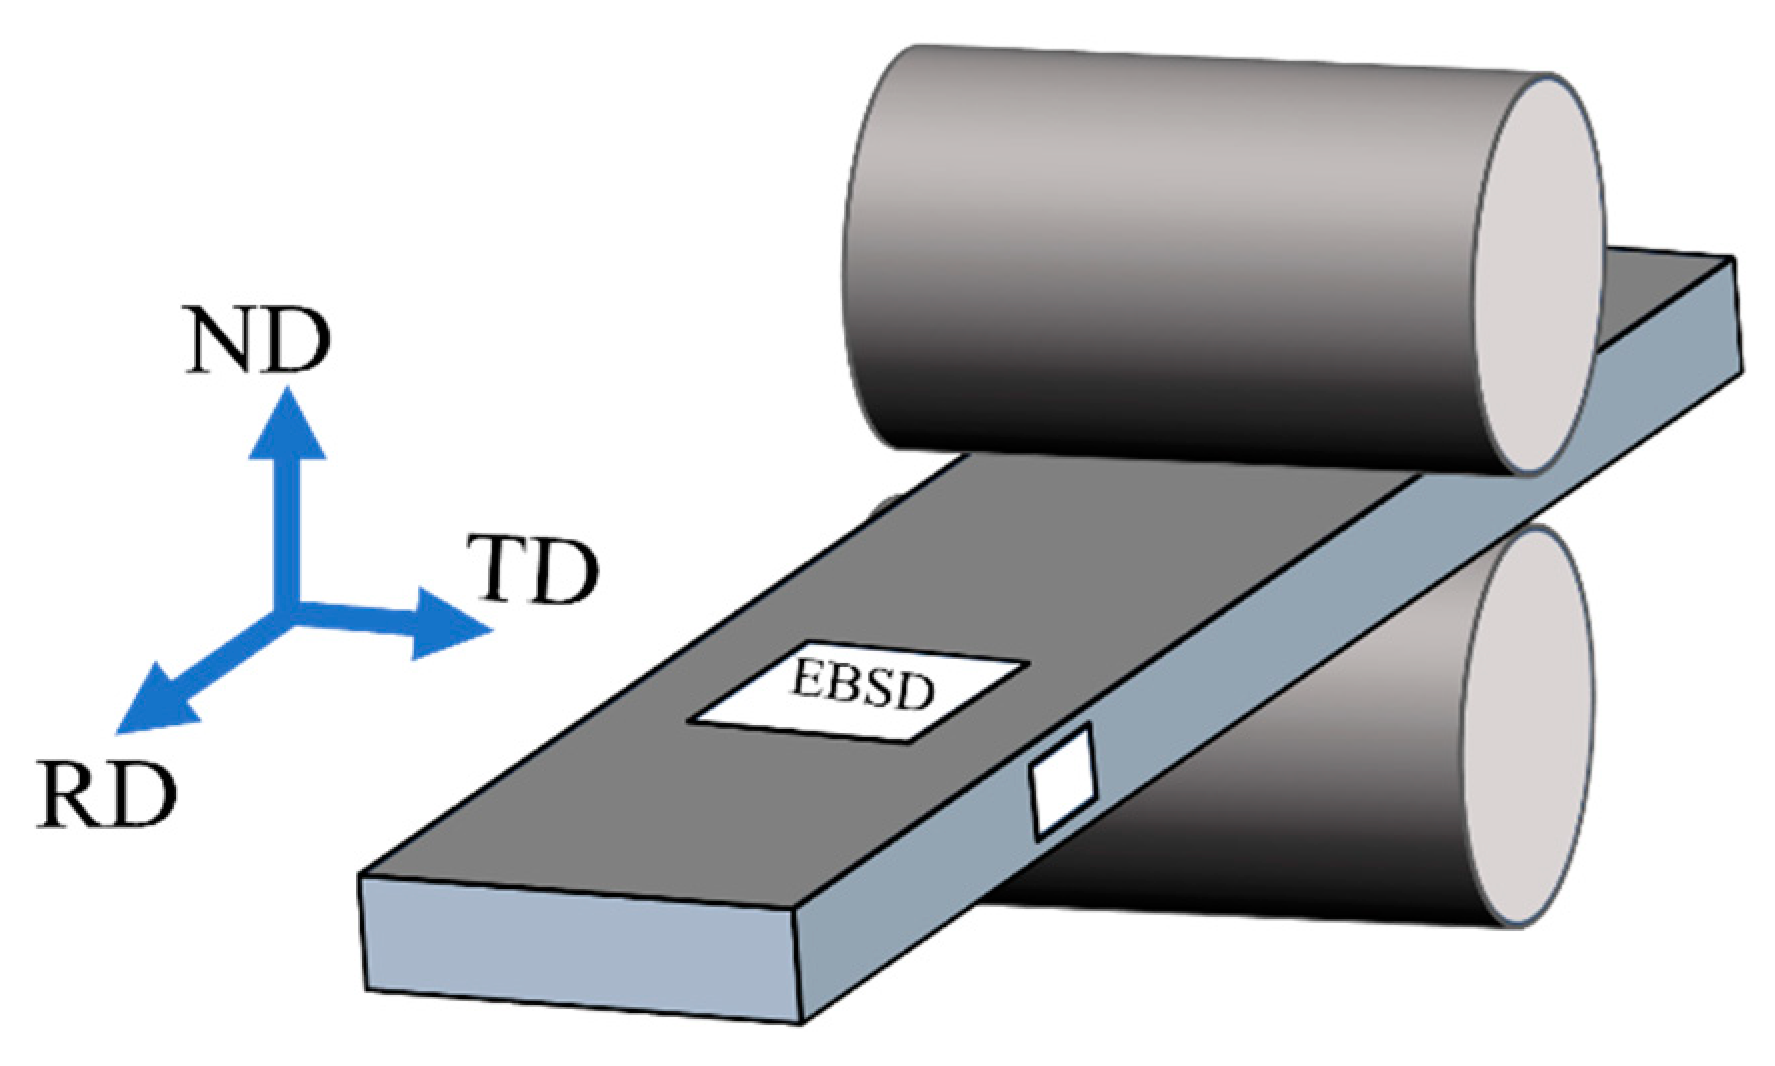
2.3. Characterization of Microstructure, Texture, and Phases
2.4. Hardness Test
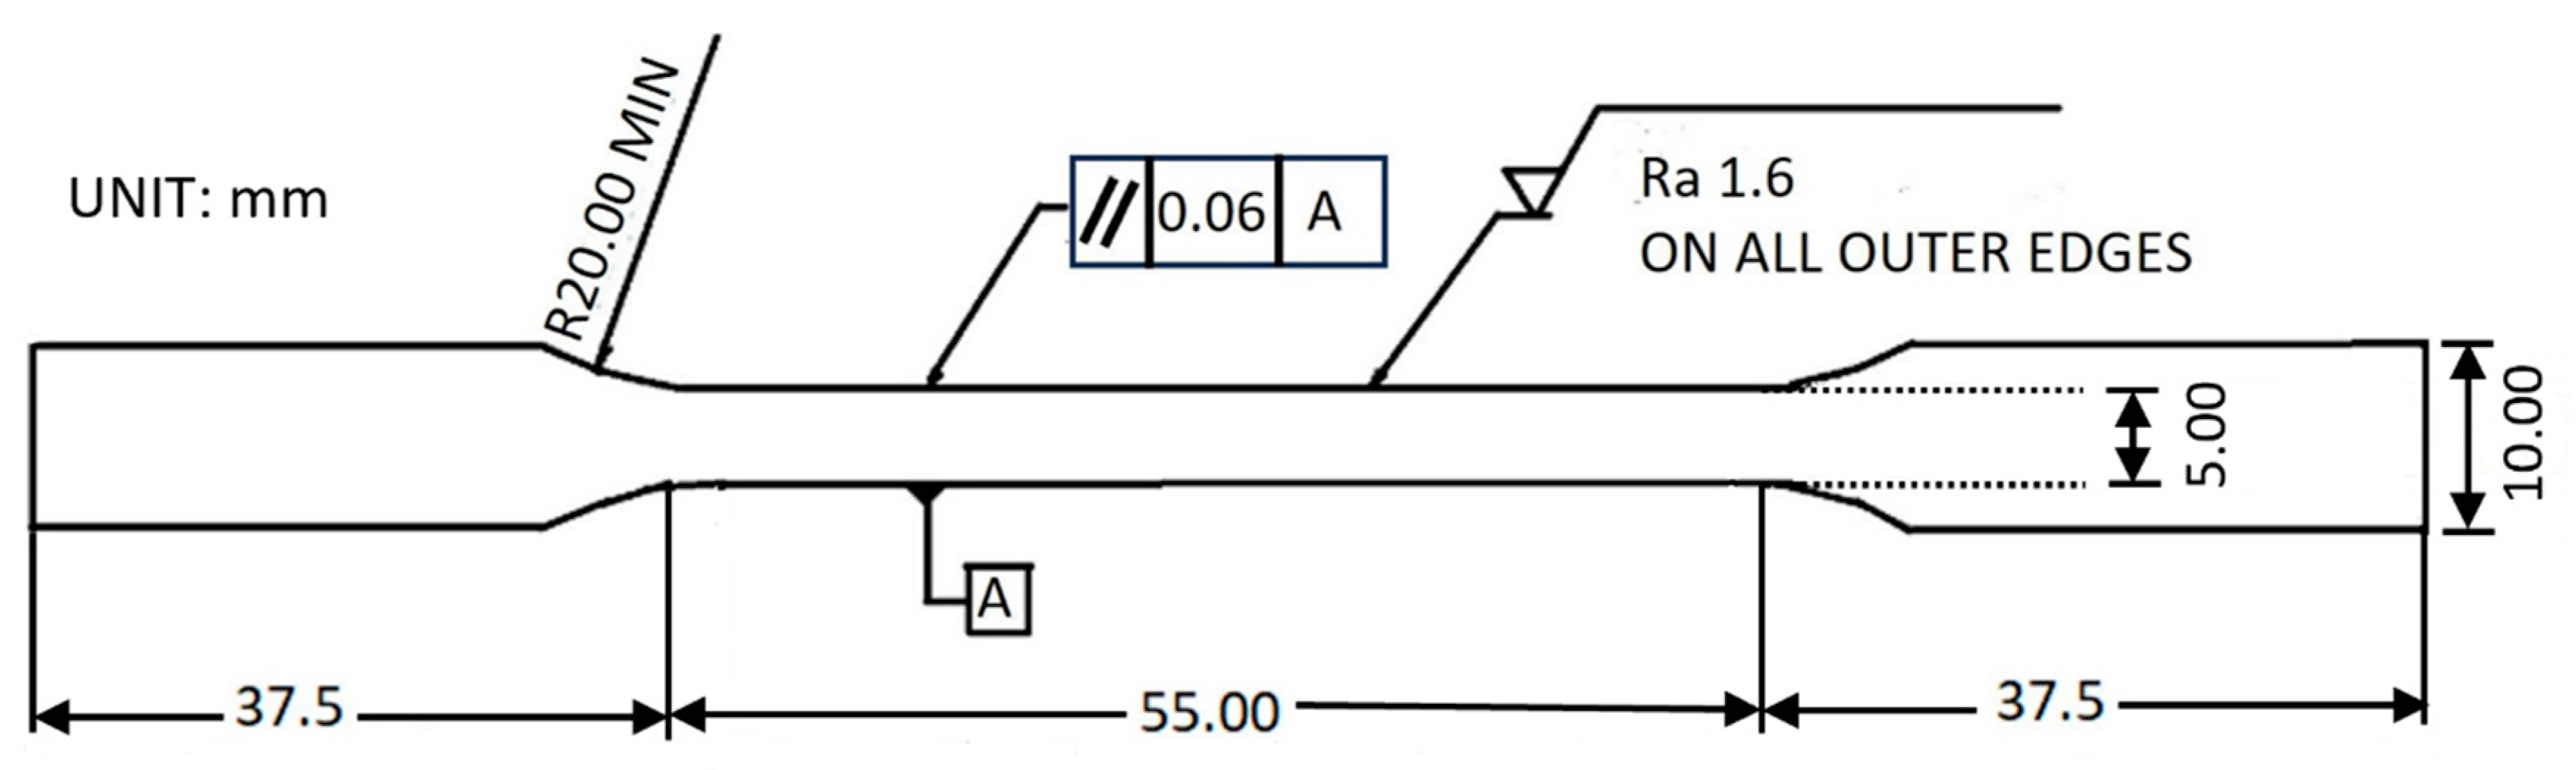
2.5. Tensile Test
3. Results
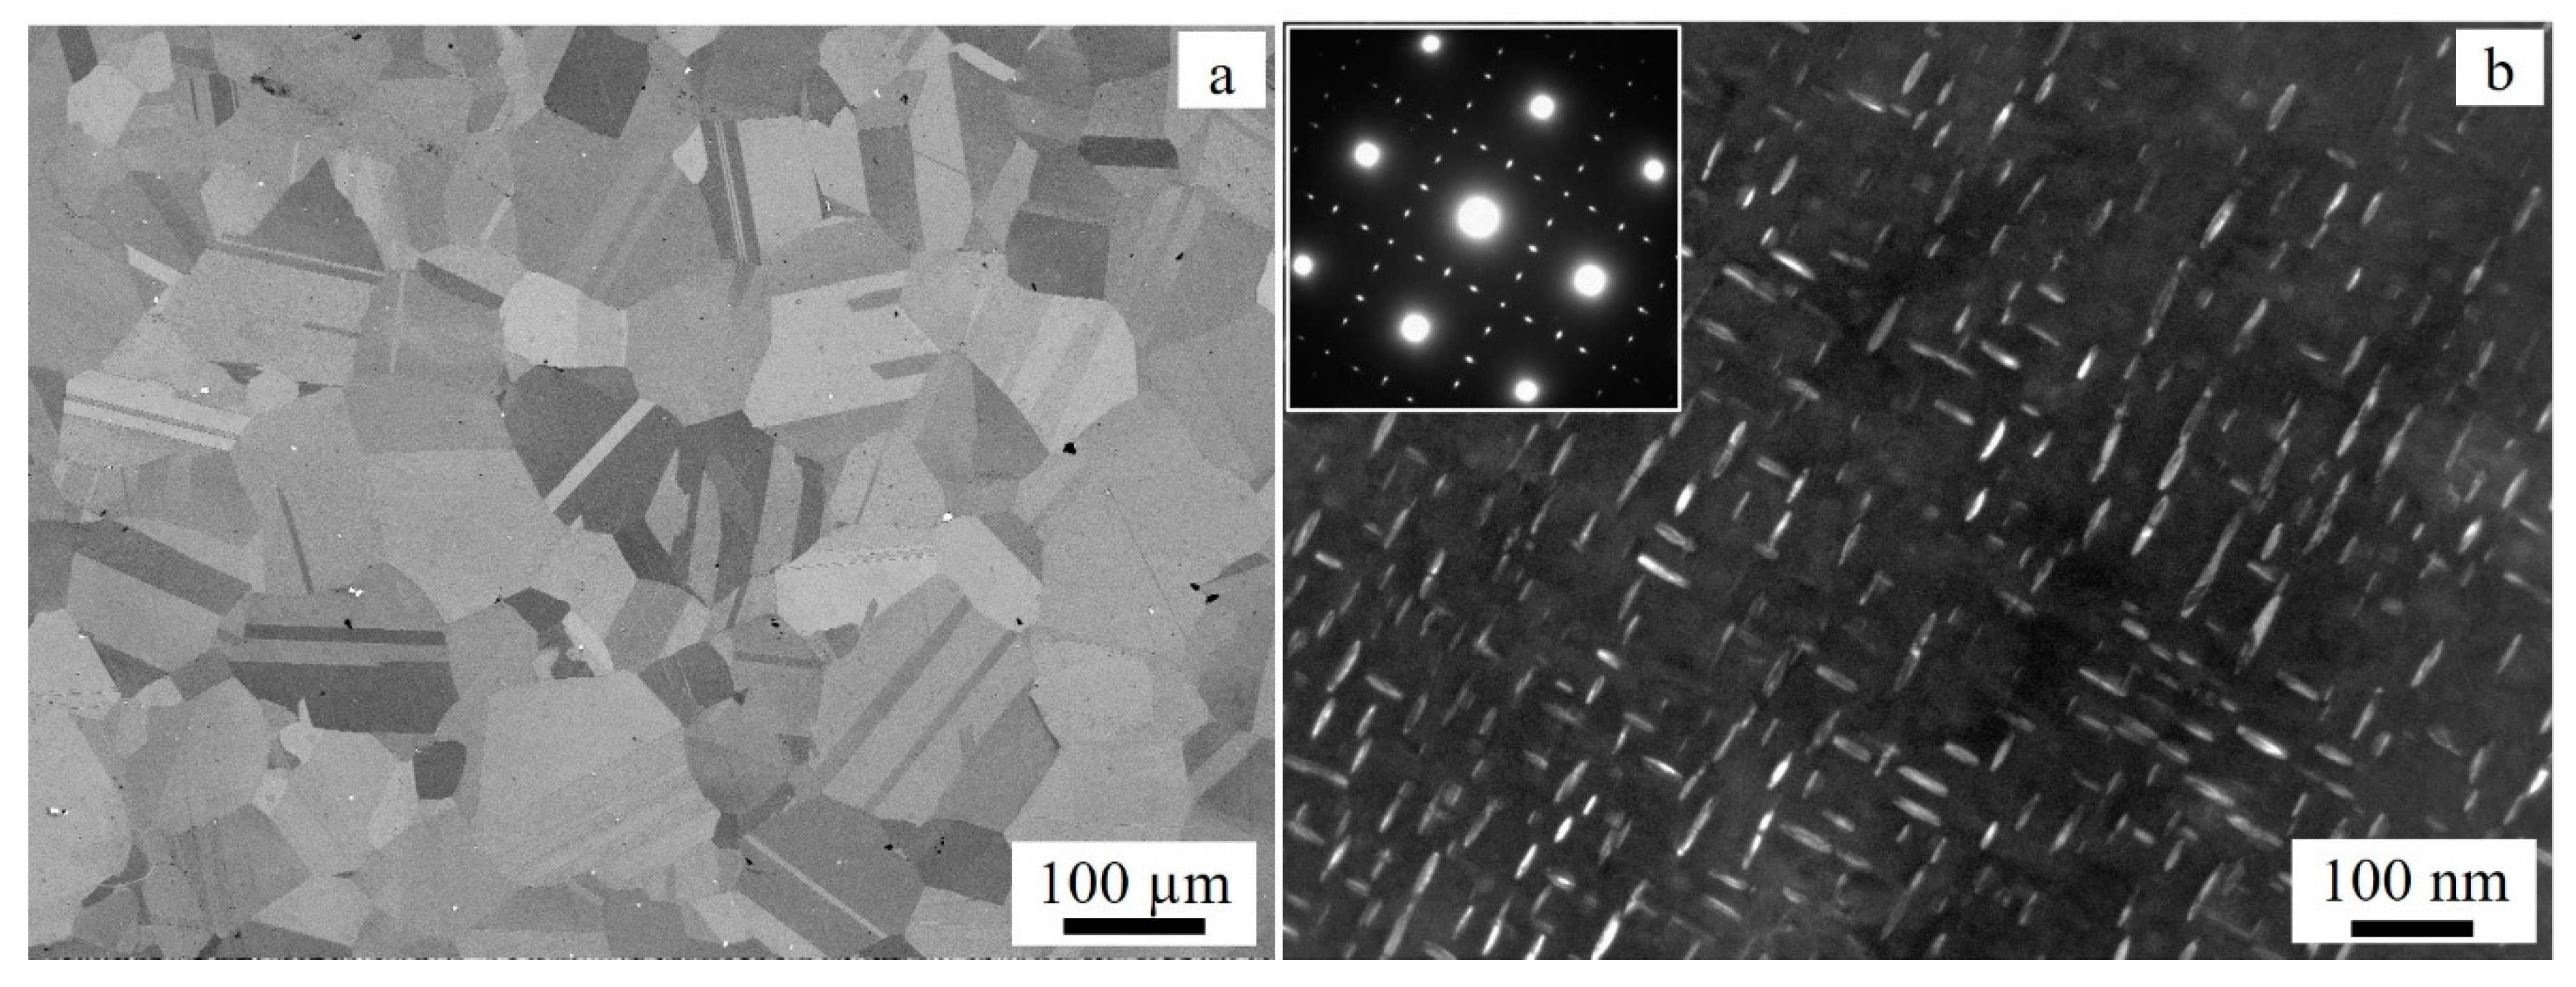
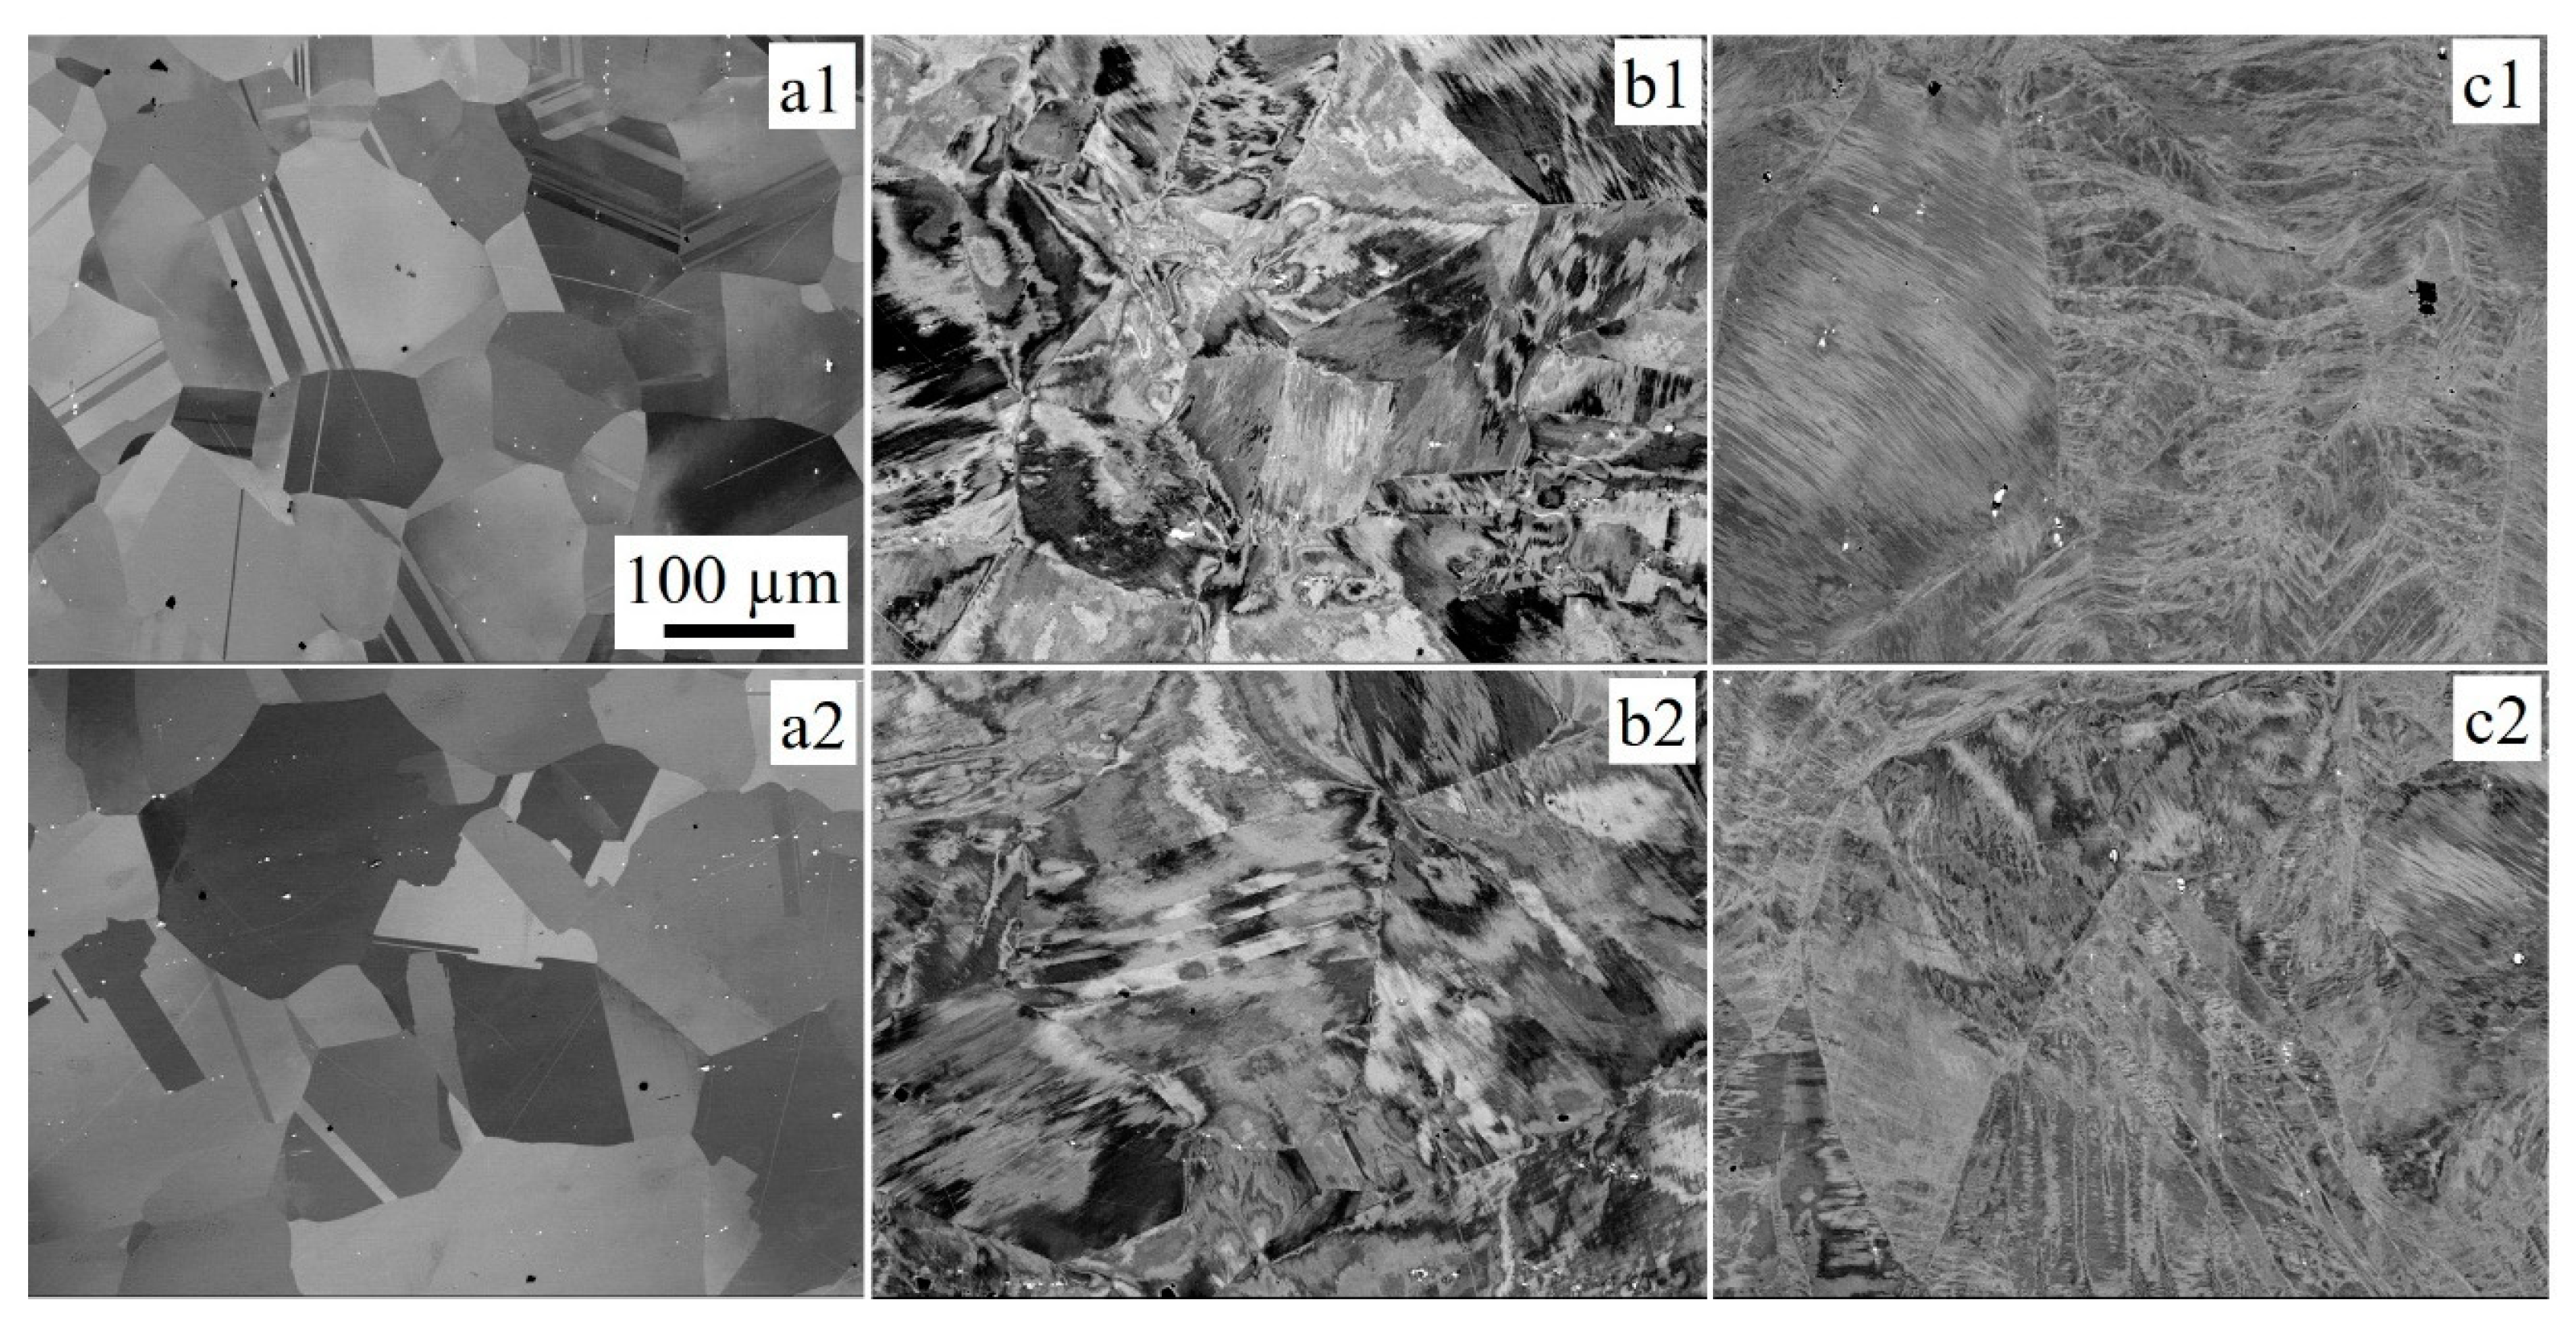
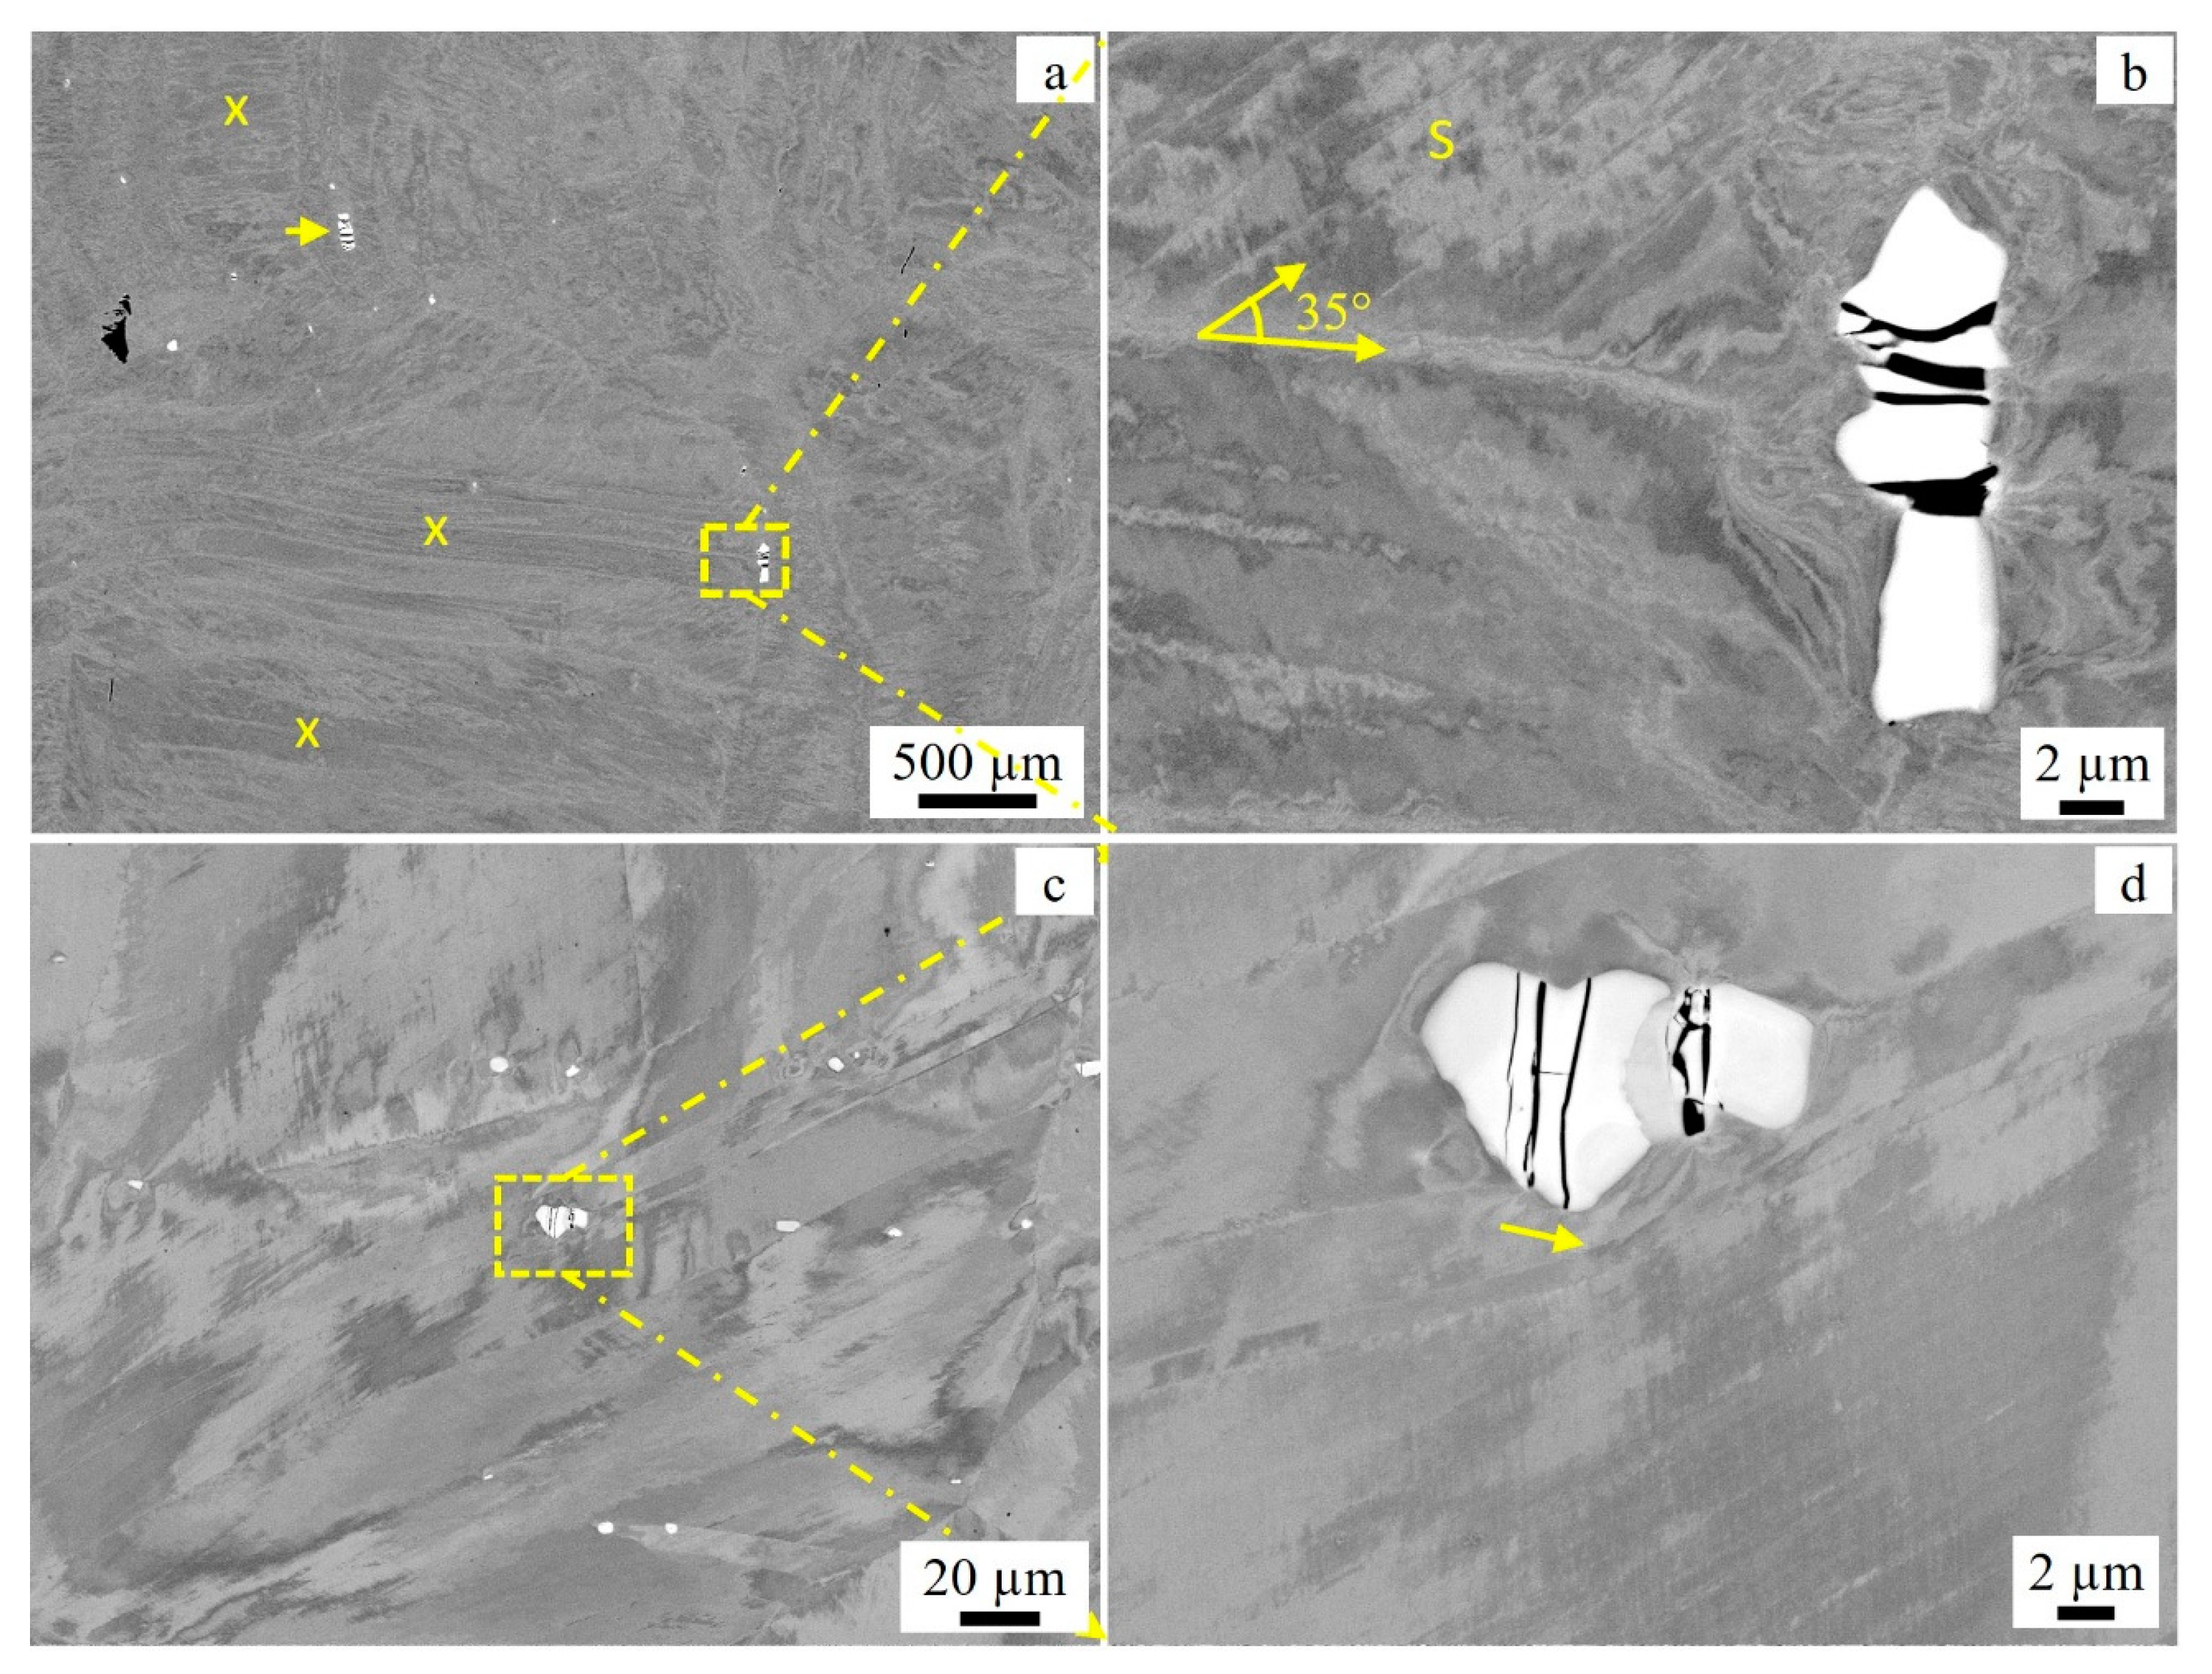
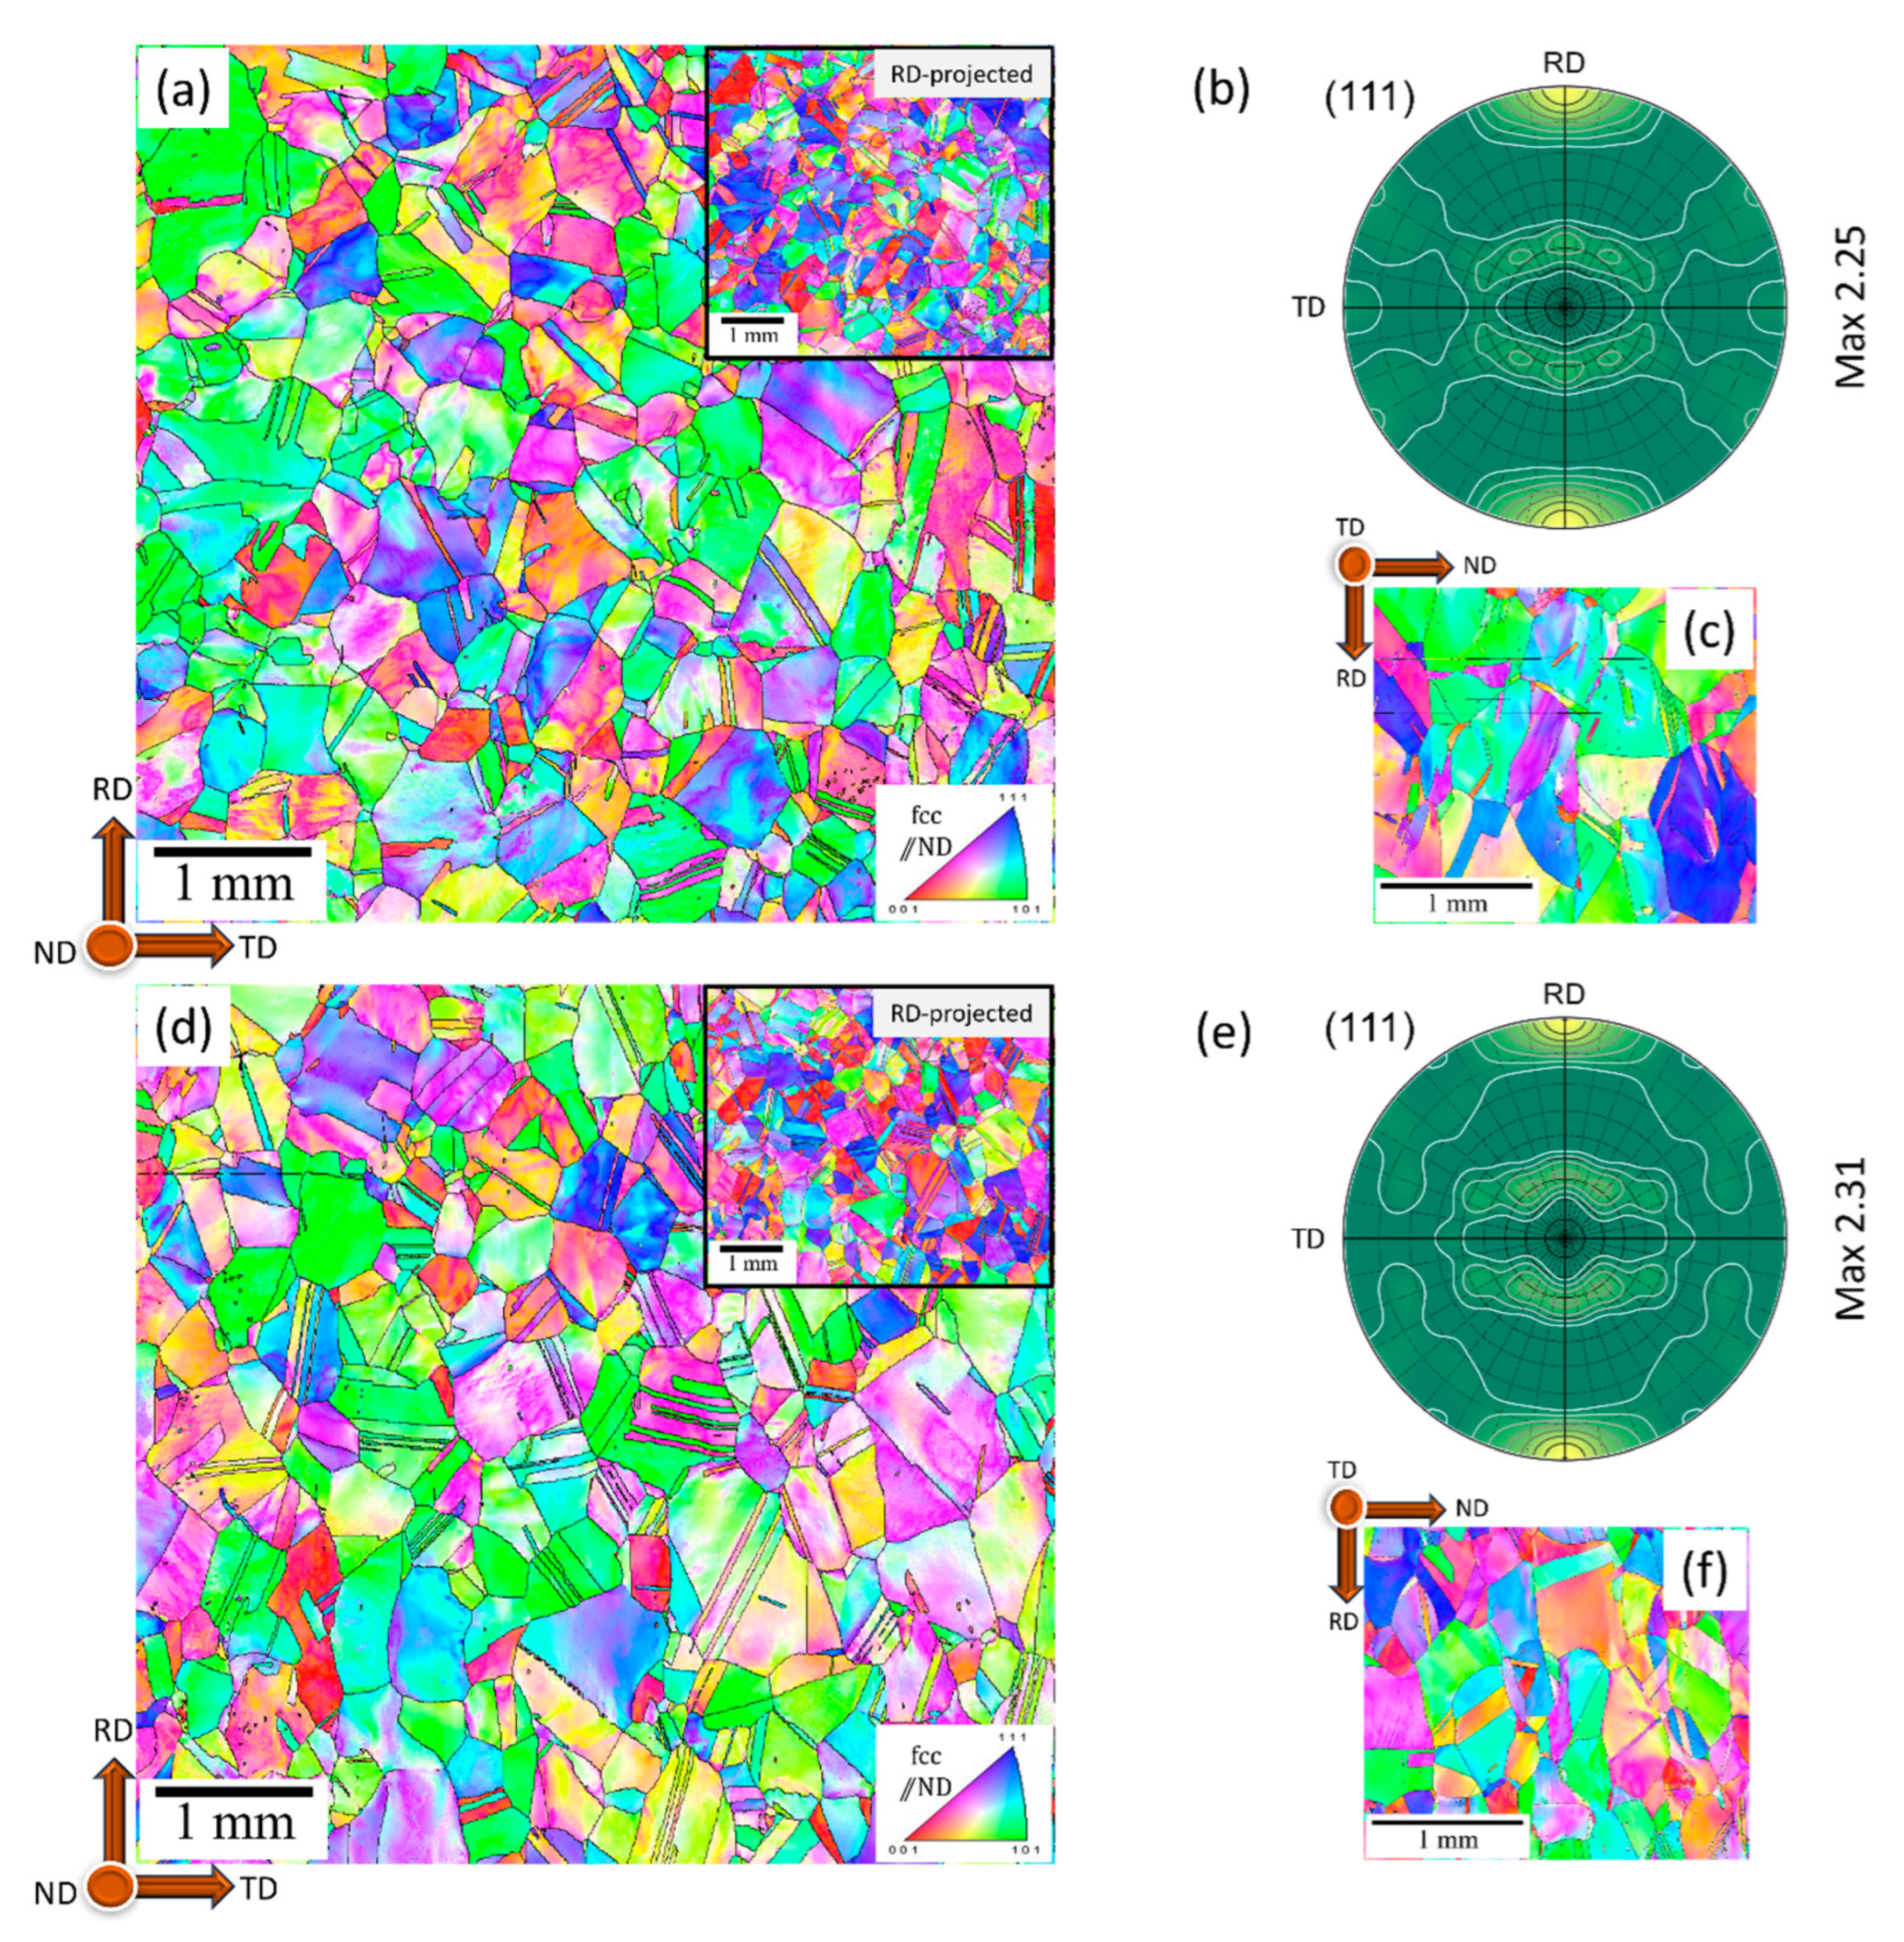
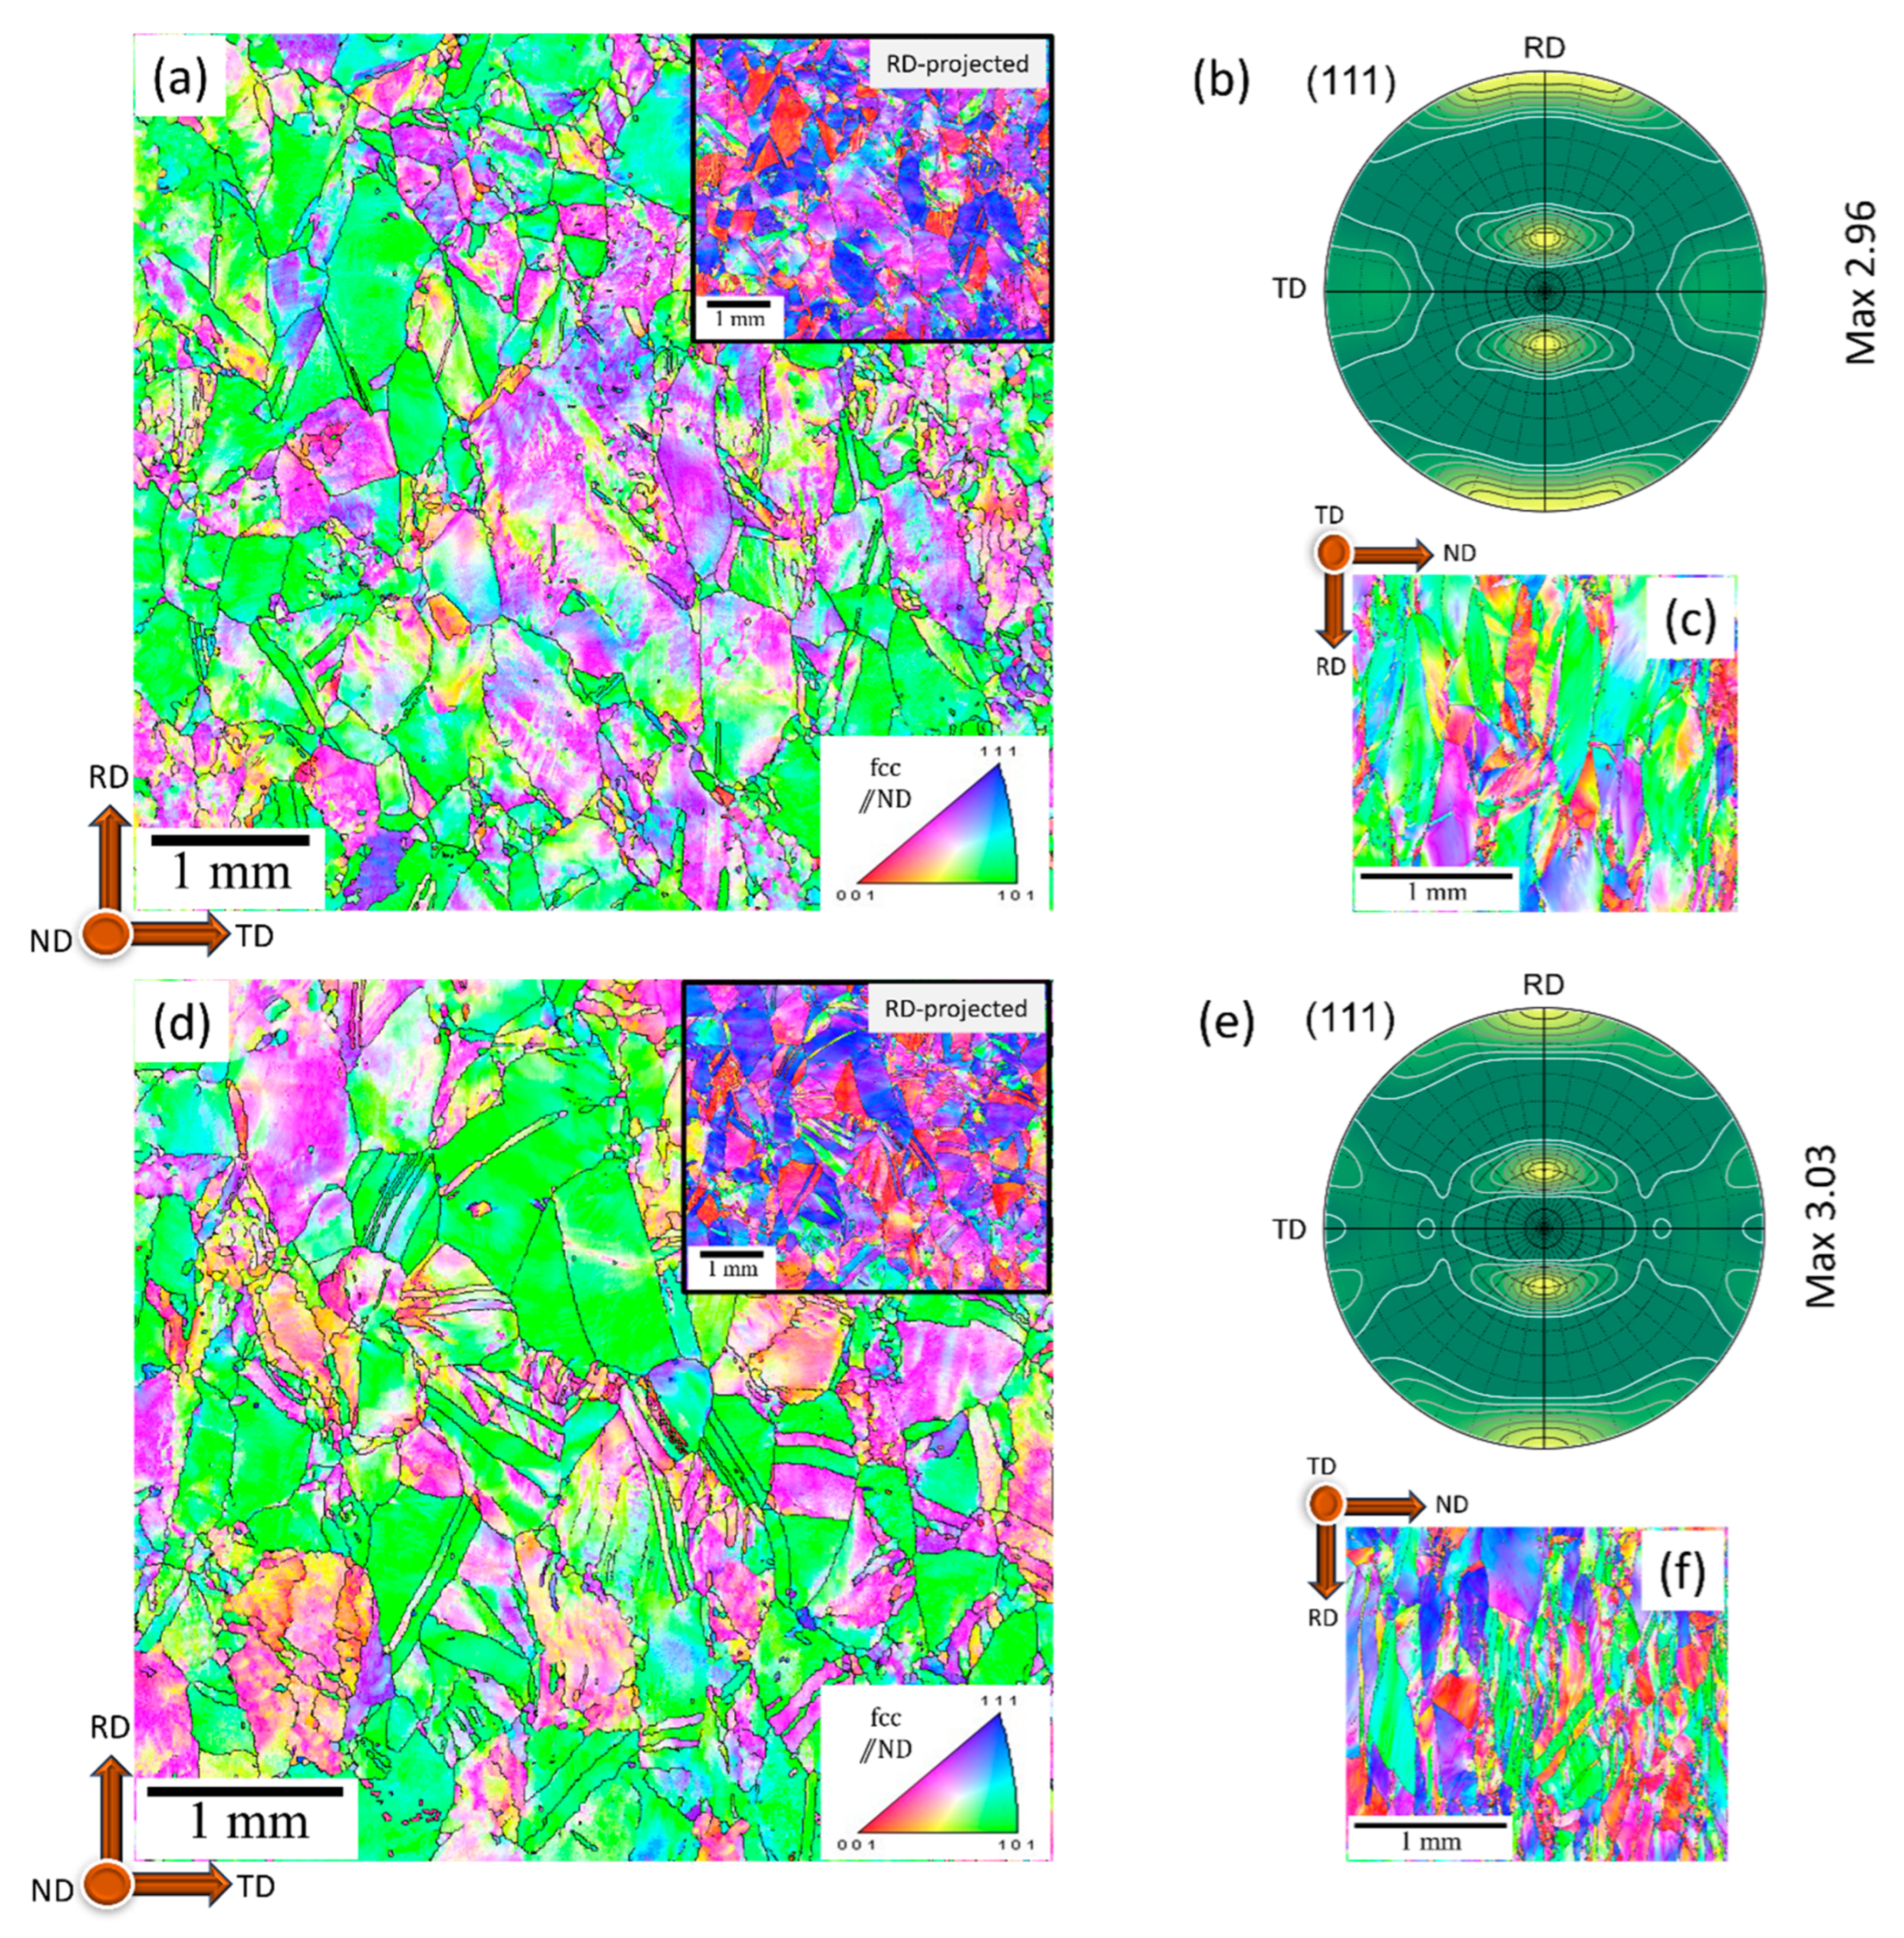
3.1. Microstructure
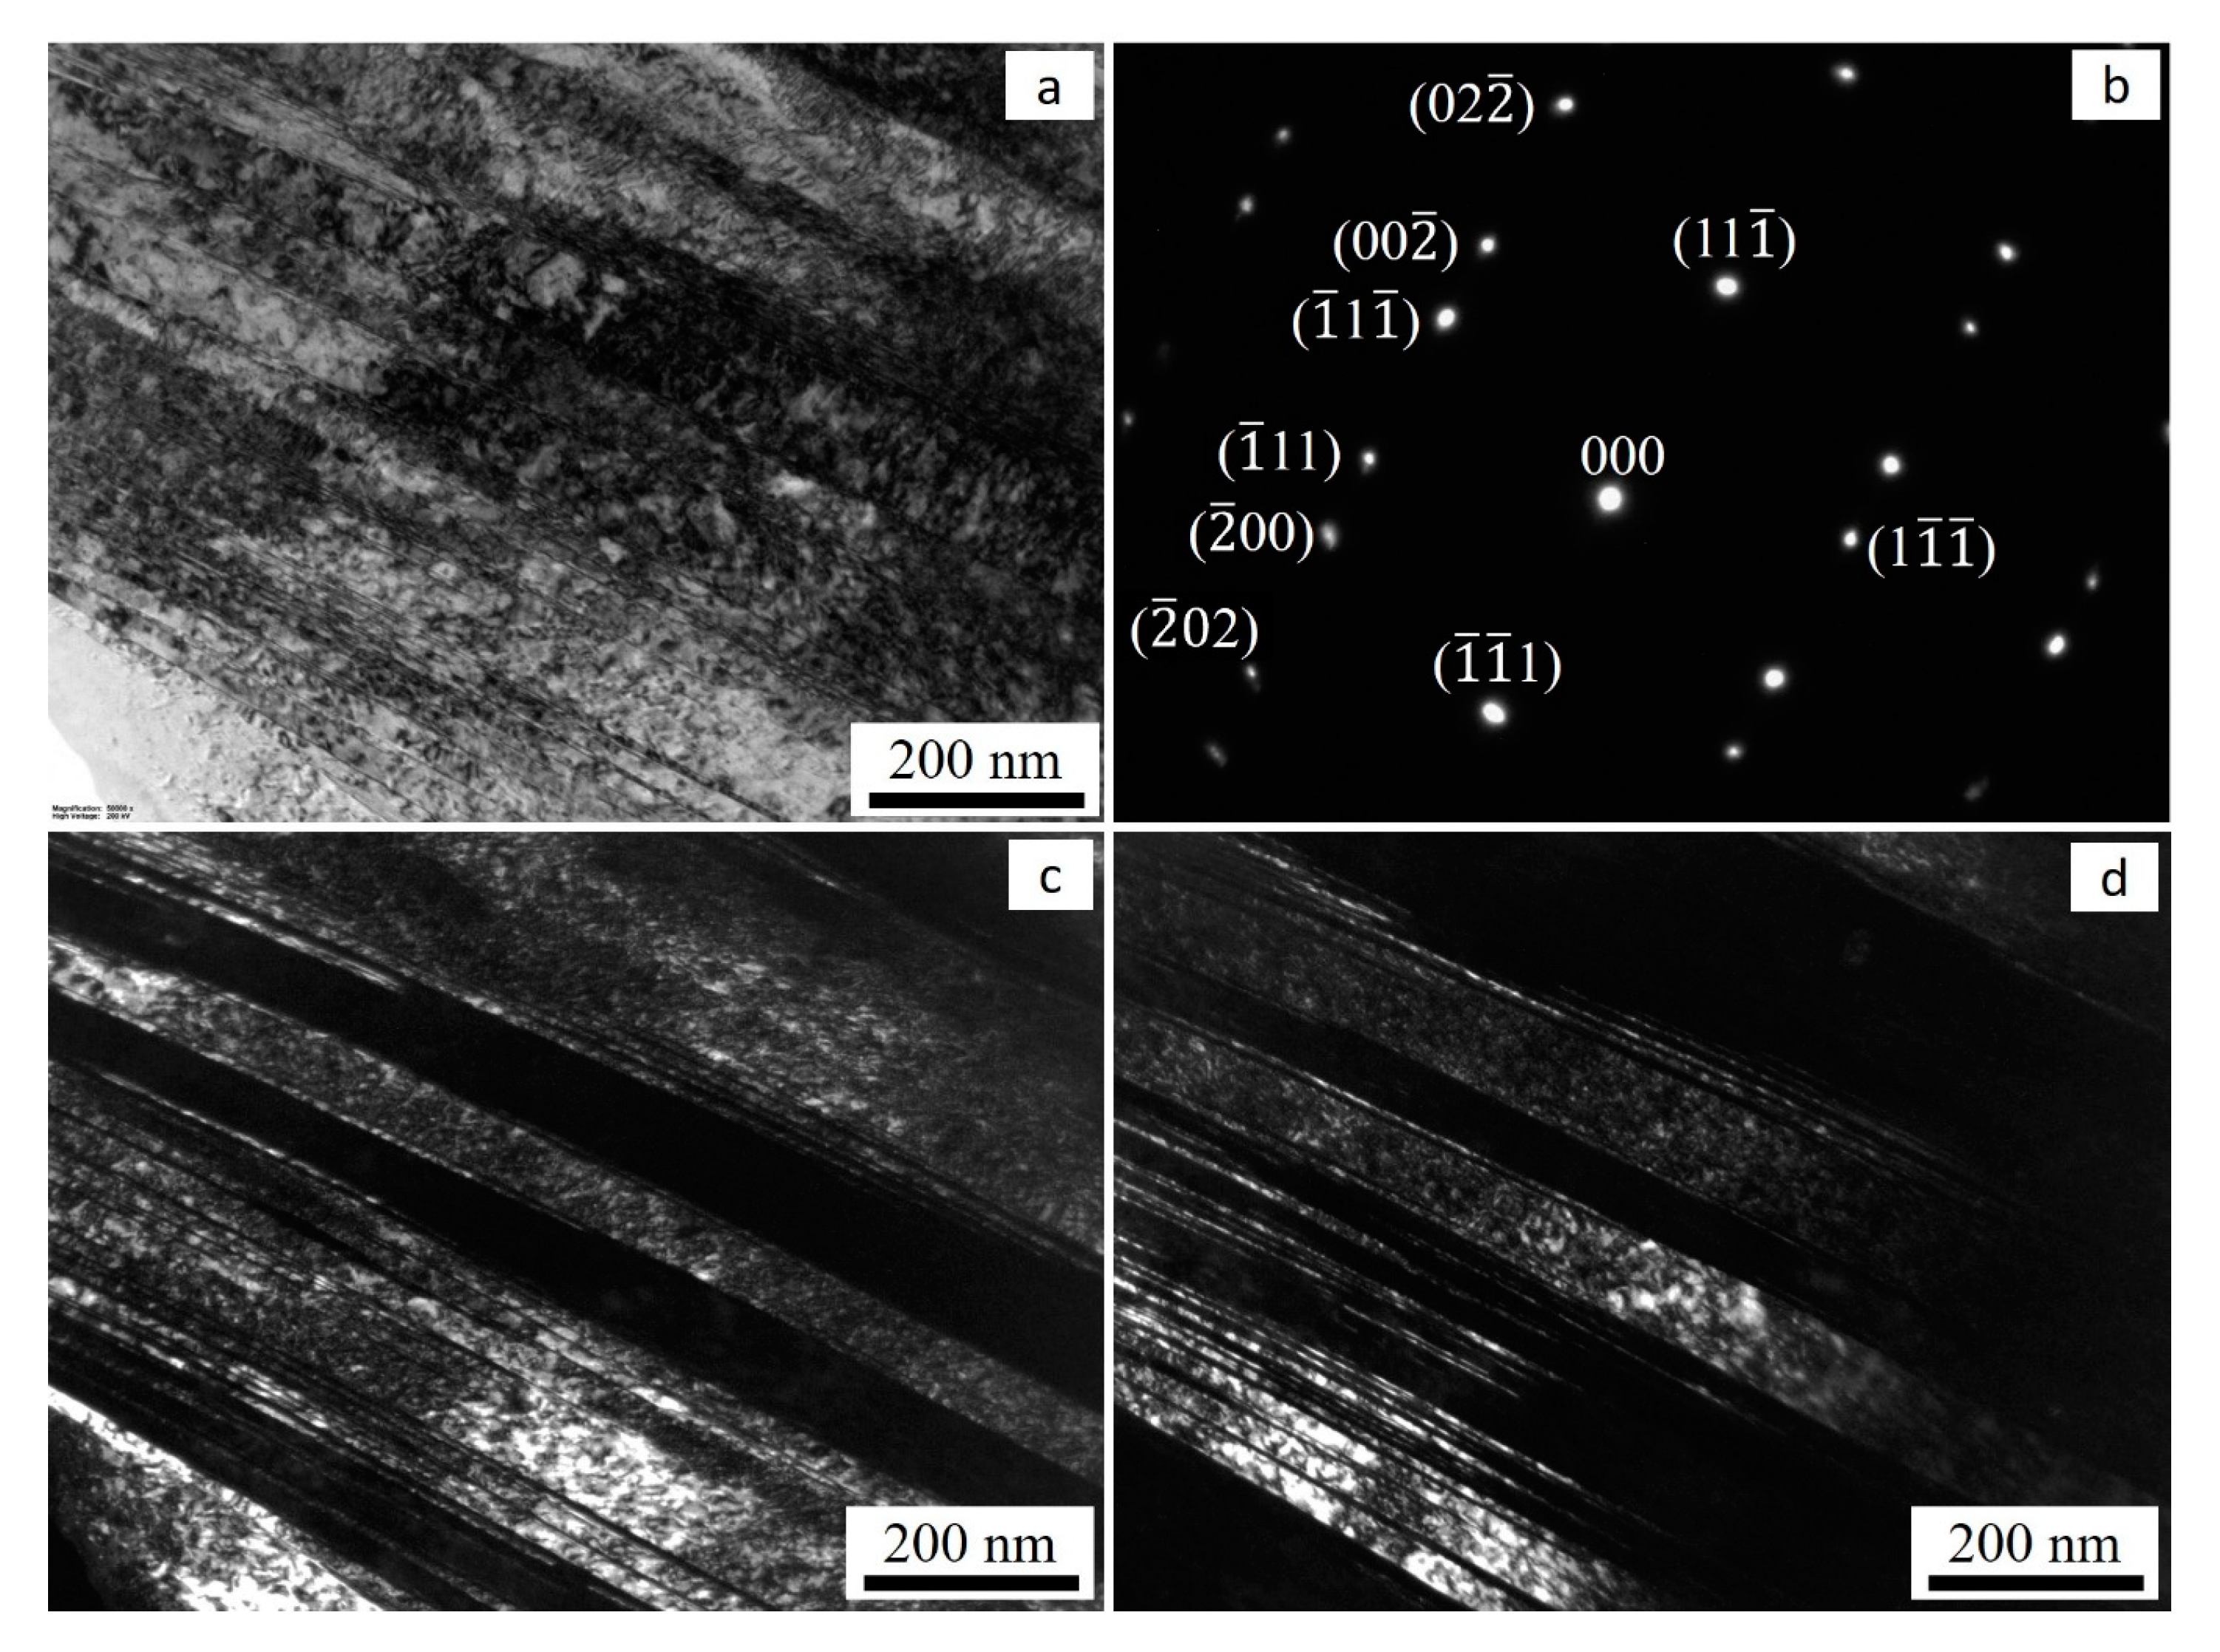
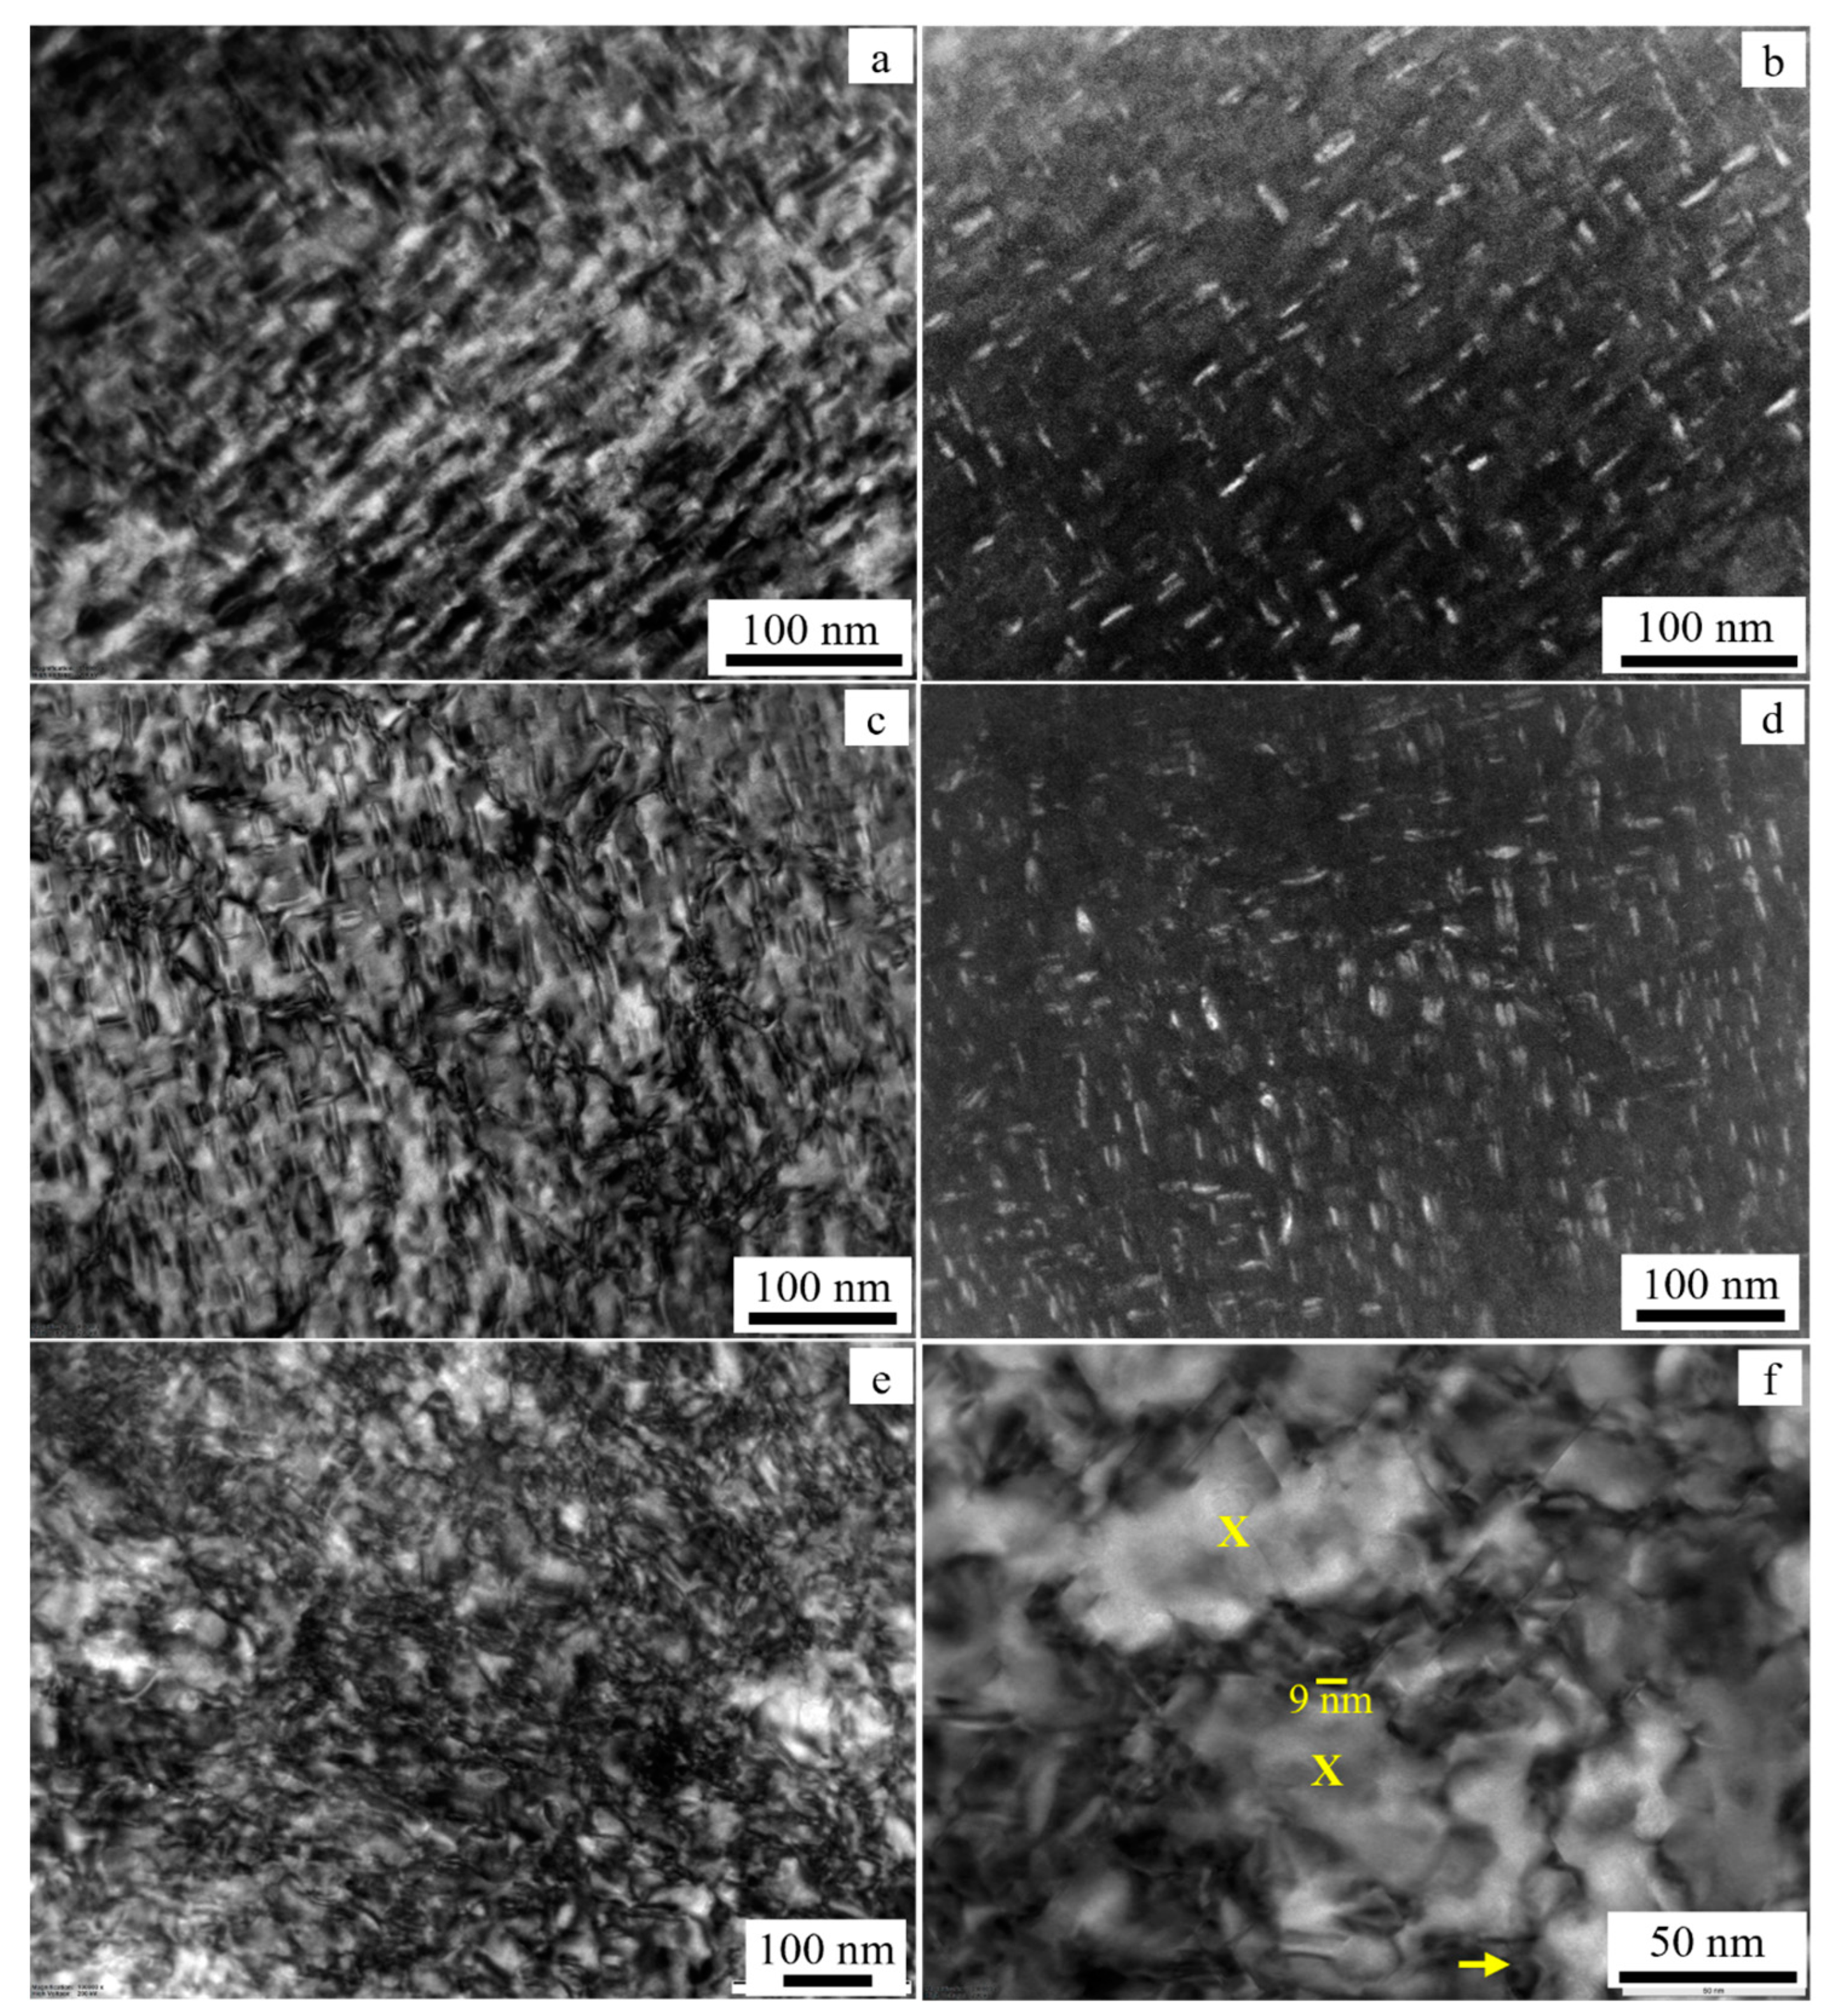
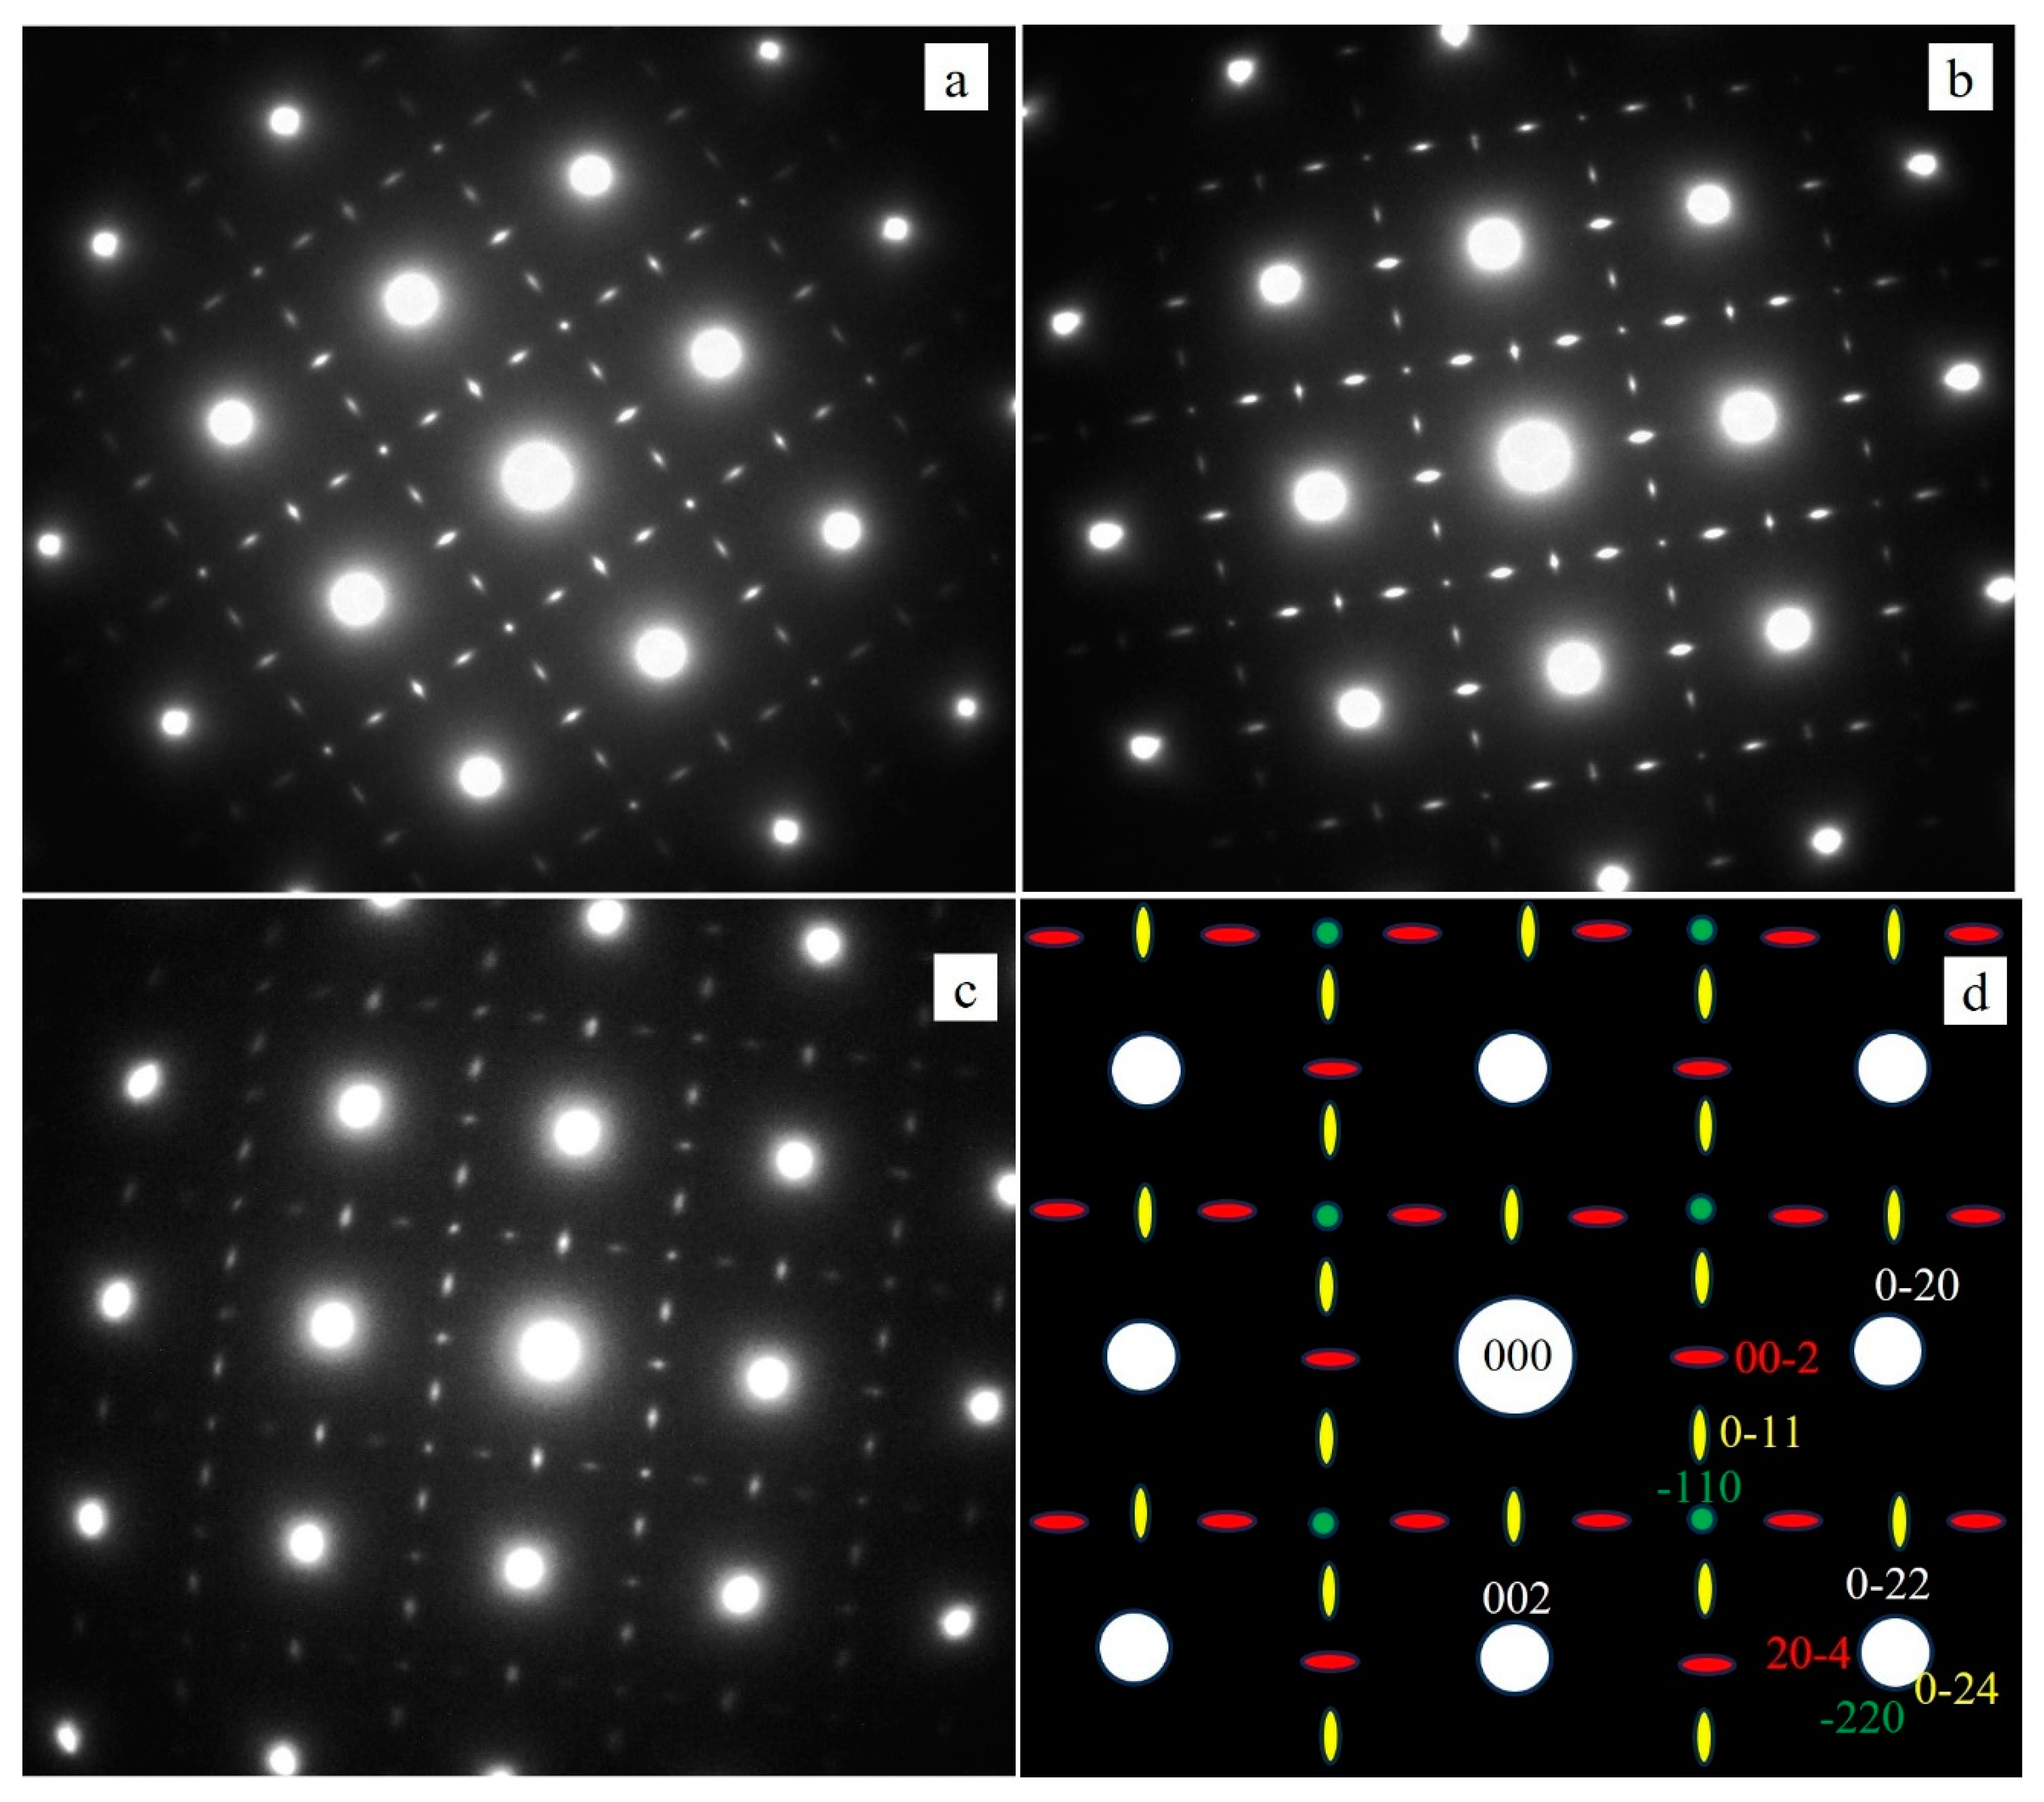
3.2. Hardening Precipitates
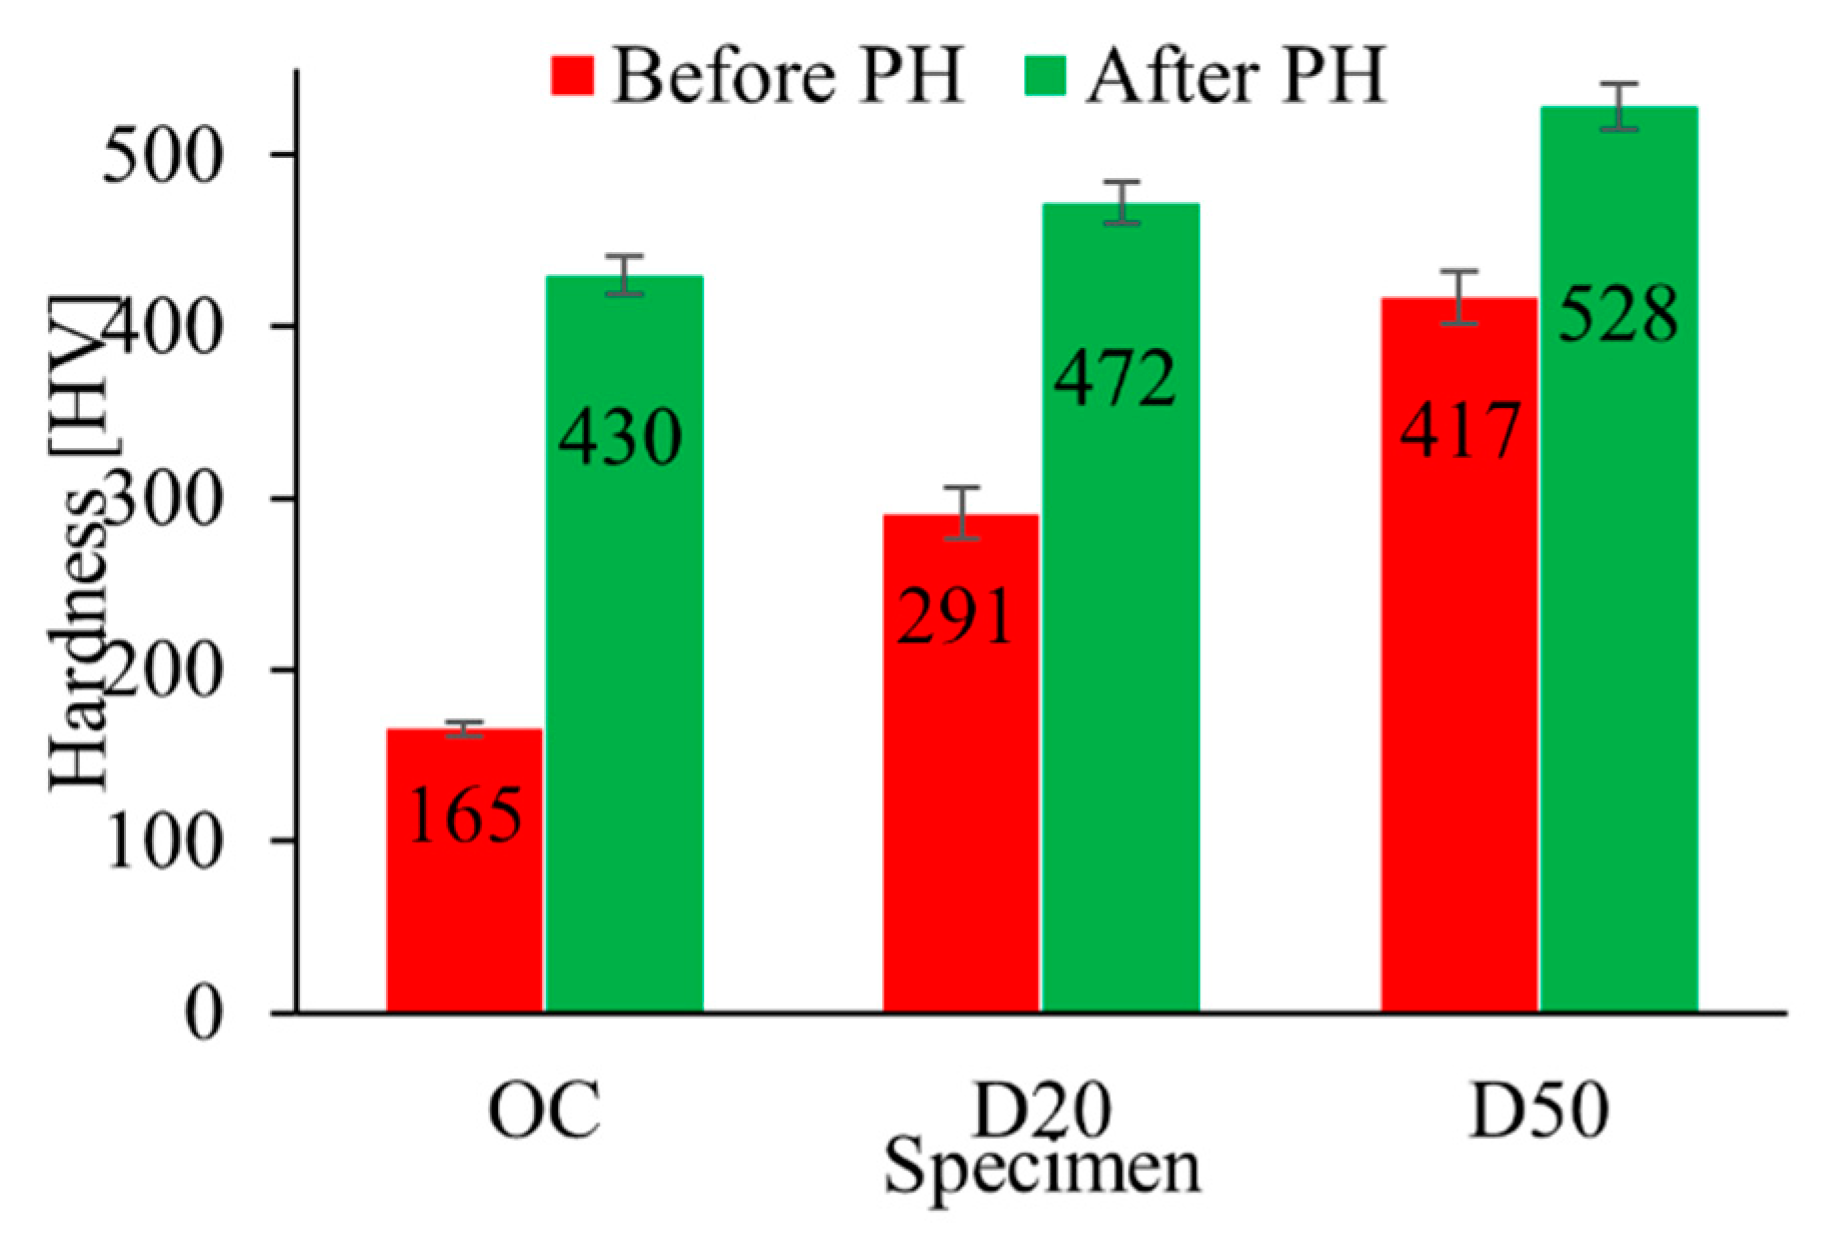
3.3. Hardness
3.4. Tensile Properties
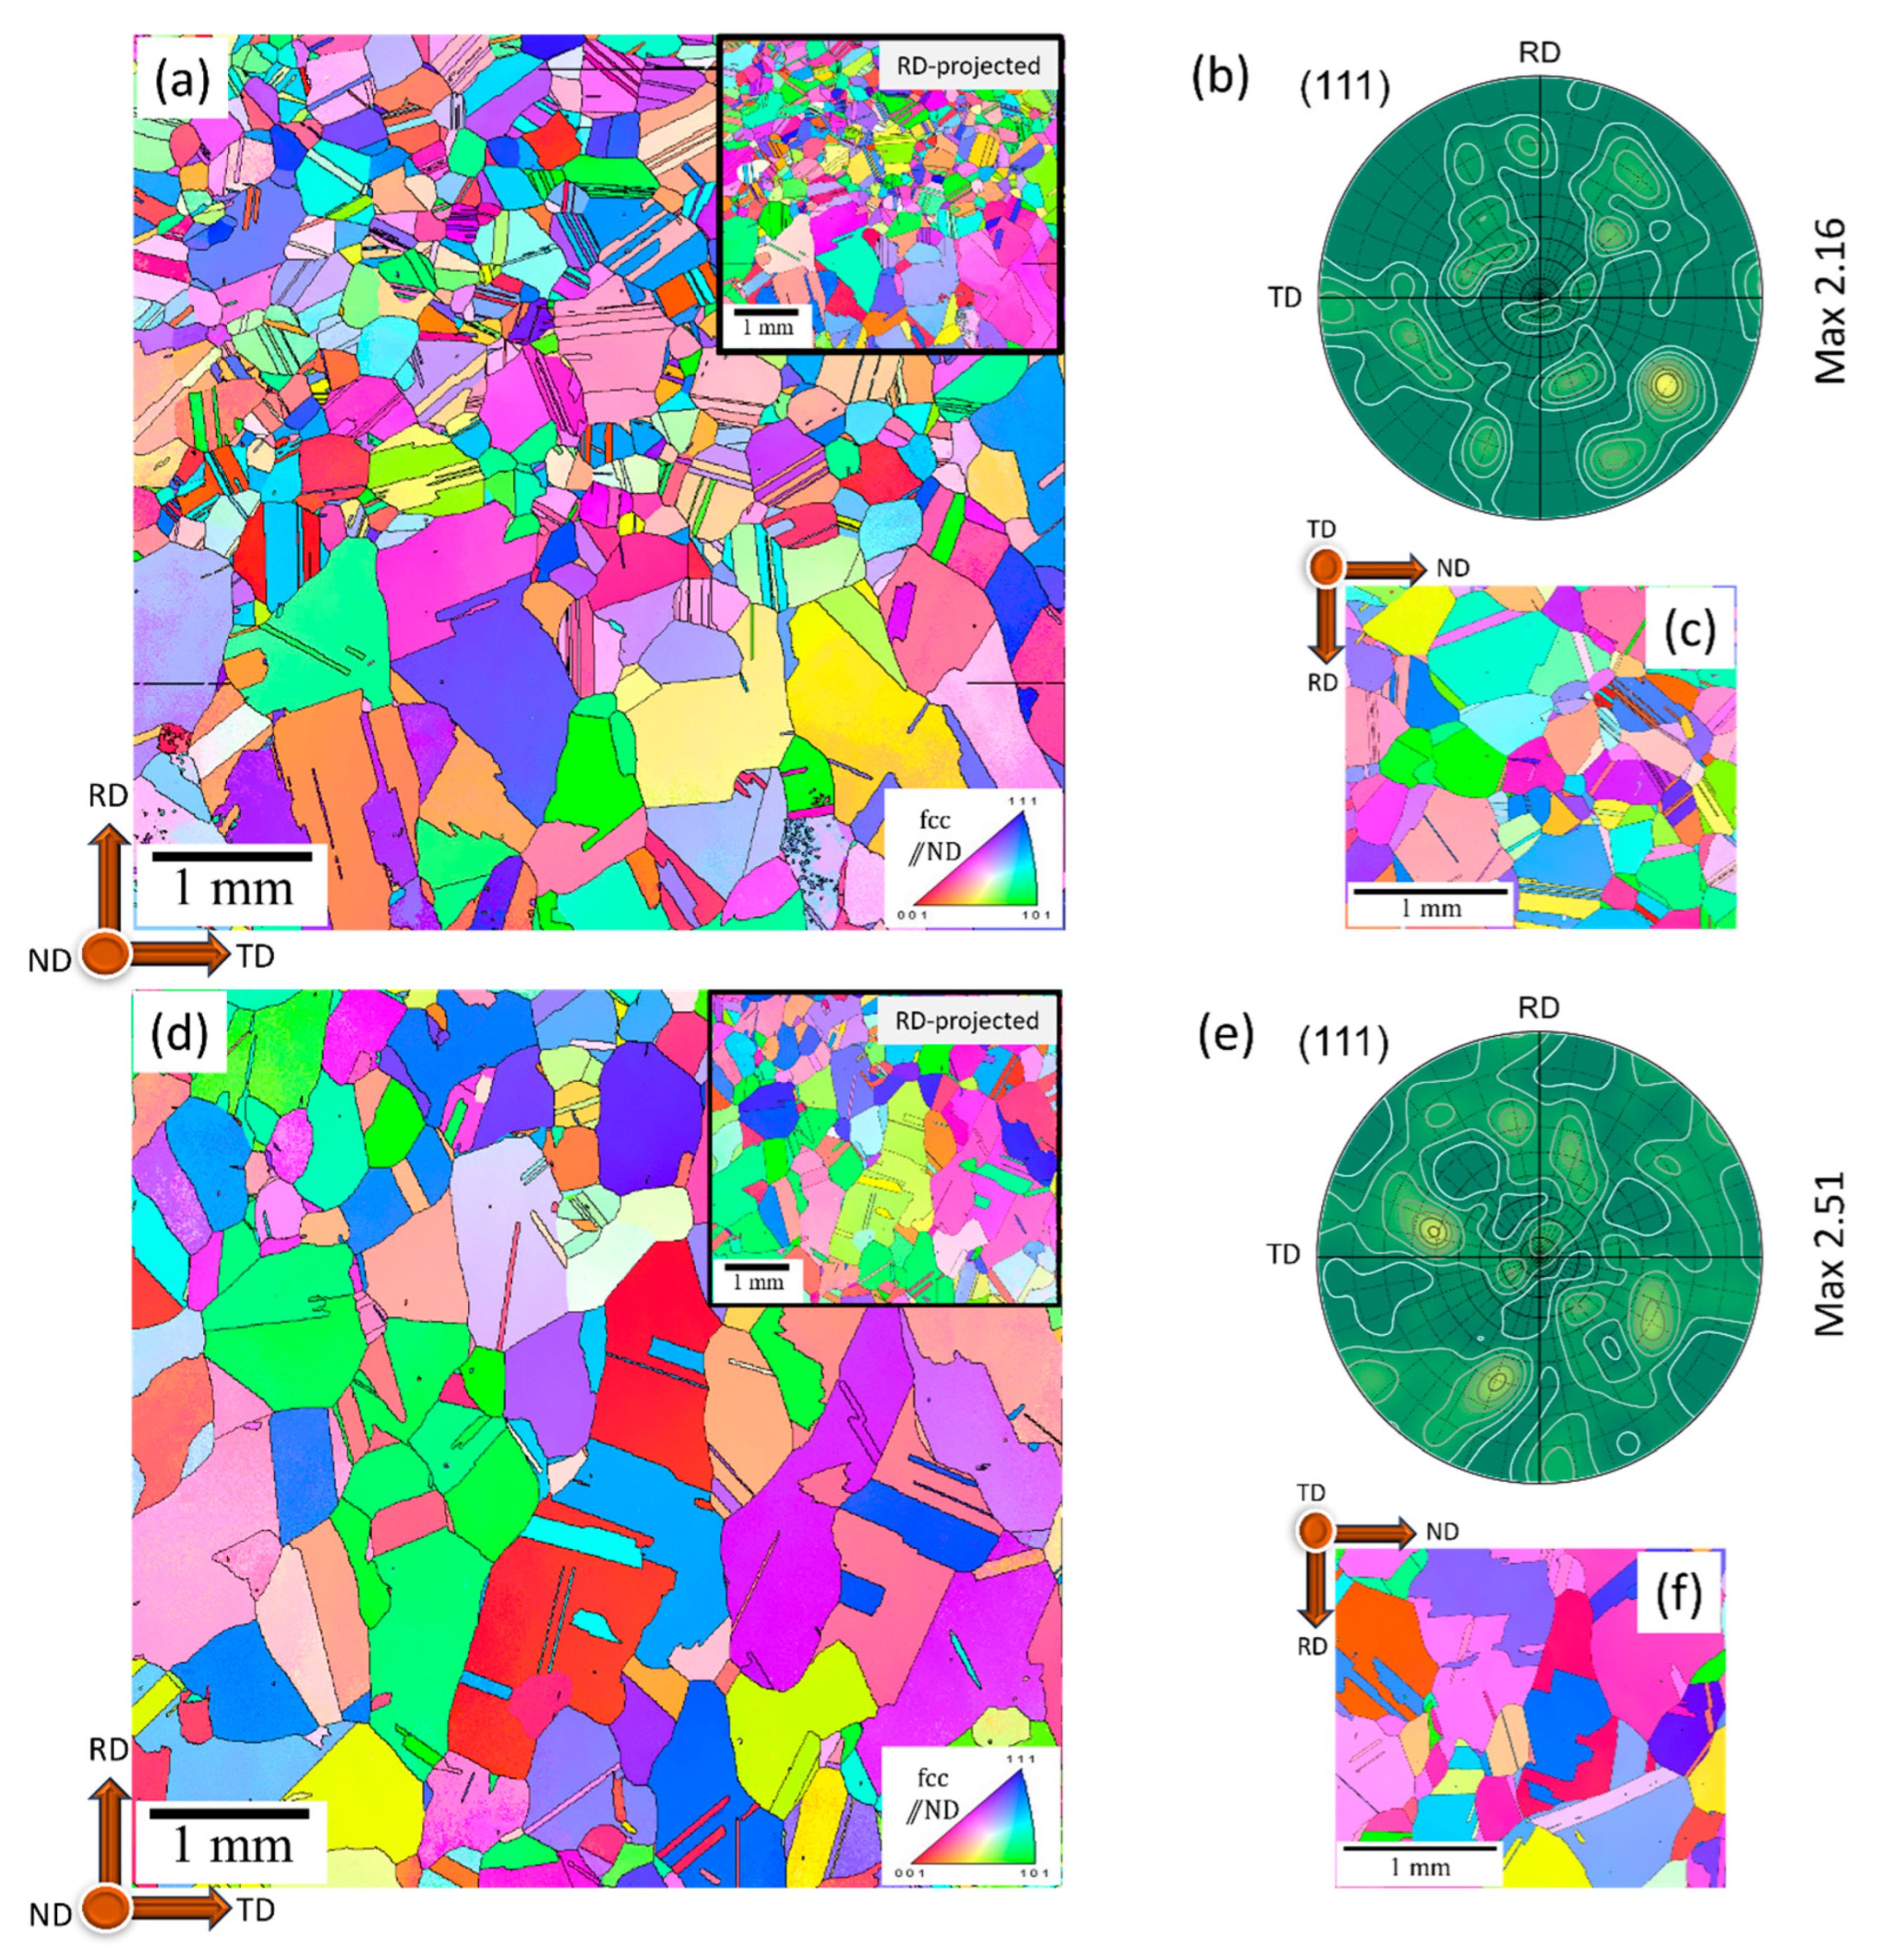
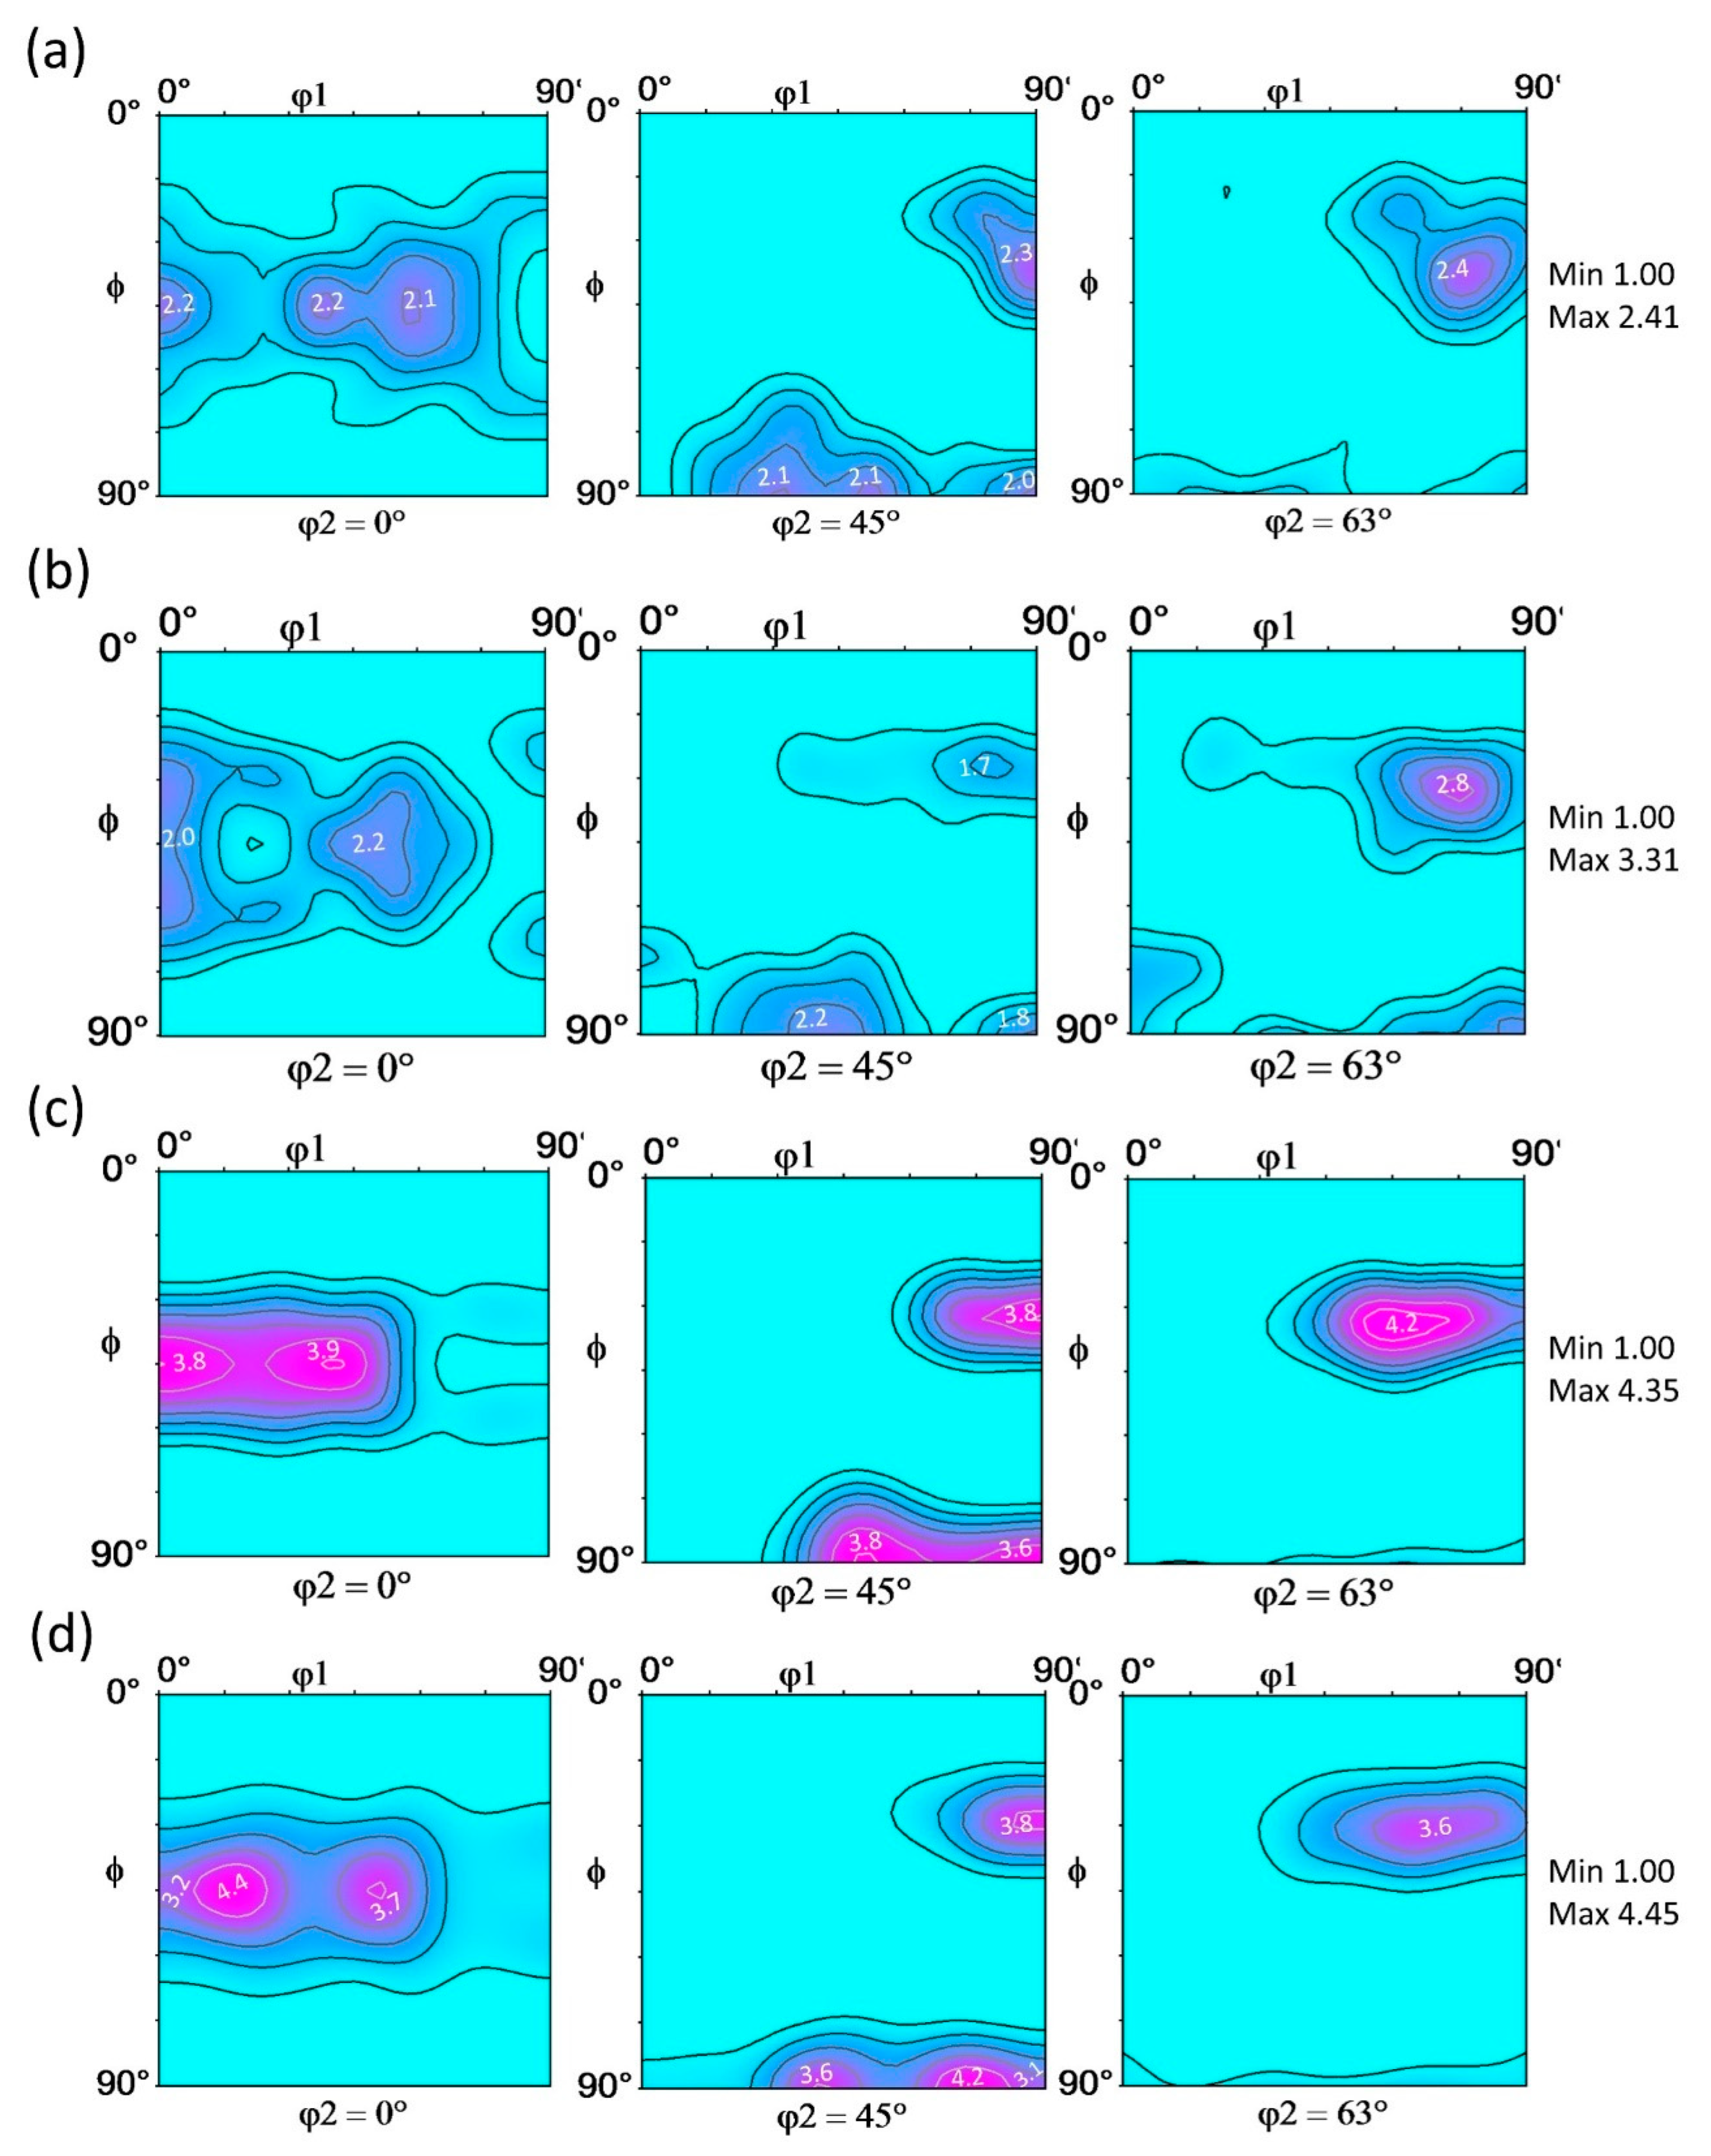
3.5. Deformation Texture Analysis
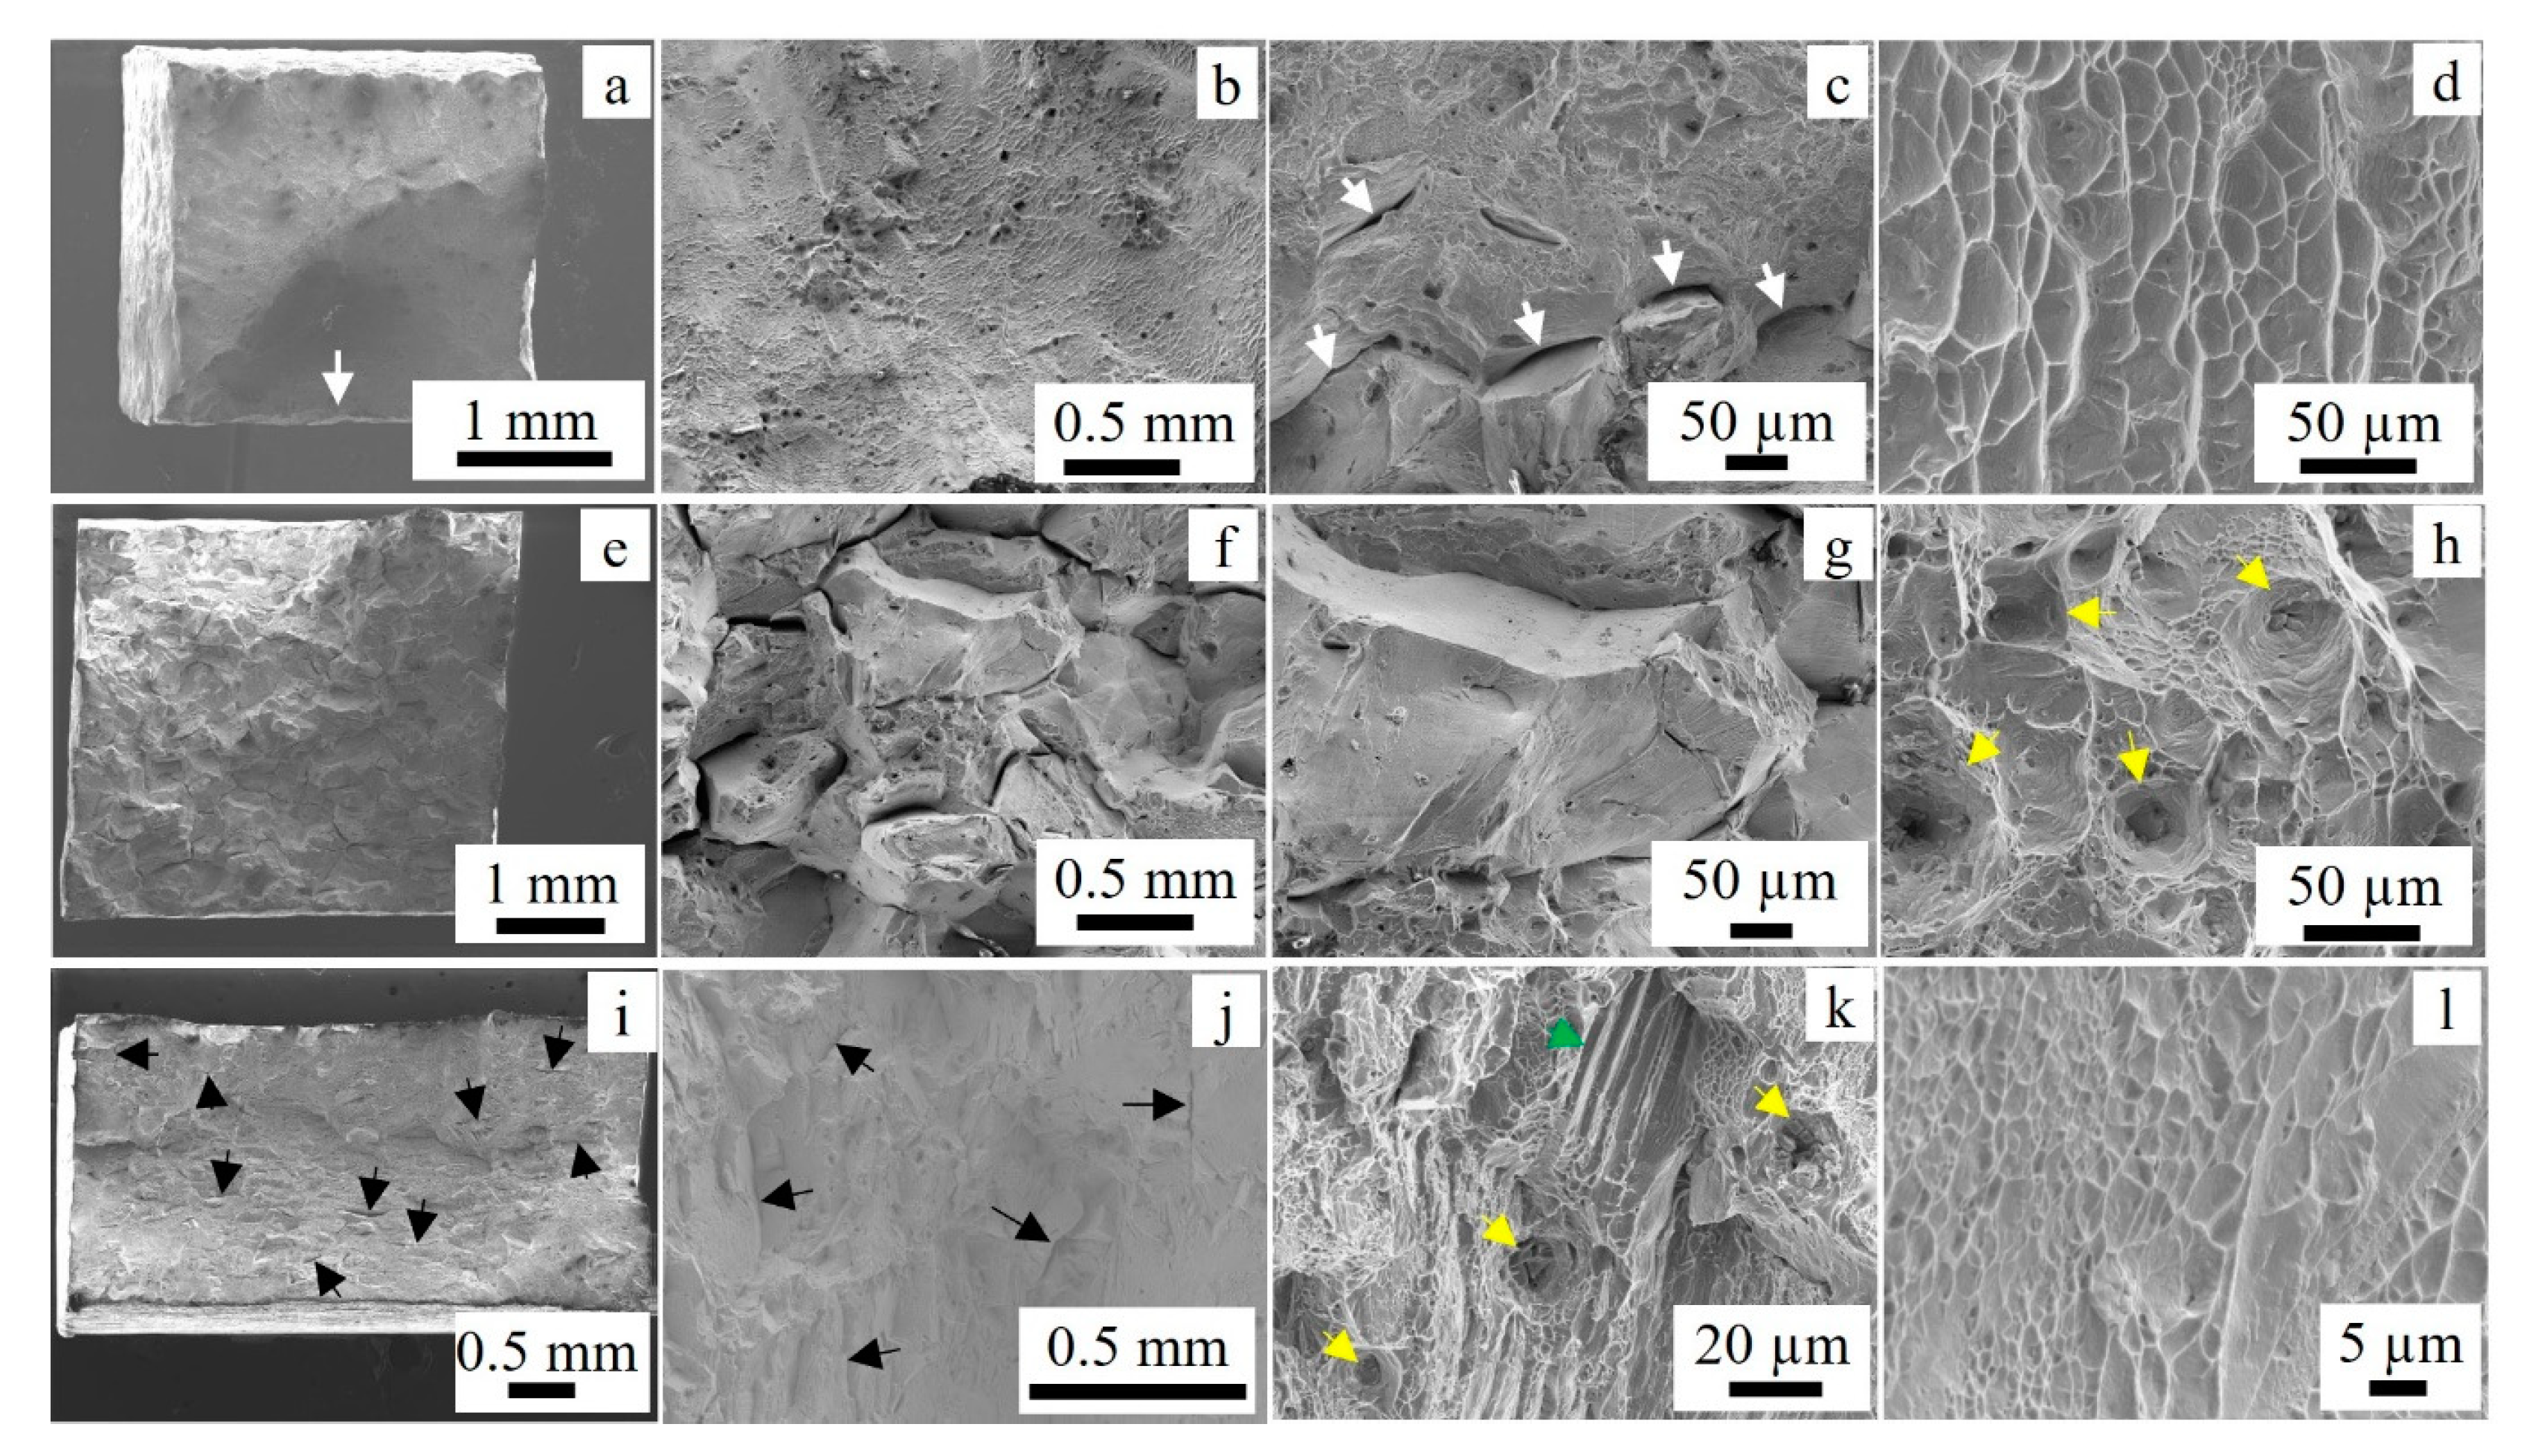
3.6. Fracture Surface Analysis
4. Discussions
4.1. Effect of Cold Rolling on Hardening Precipitates
4.2. Effects of Cold Rolling on Hardness and Tensile Properties
4.3. Effects of Cold Rolling on Texture
5. Conclusions
- The size of the γ″ precipitate, which is the main PH phase, increased when subjected to 20% deformation but decreased after 50% deformation and took on a pin/rod-like shape.
- The cold rolling process increased the hardness of the 20% deformed specimens (D20A) by approximately 42 HV (10%), and for the 50% deformed specimens (D50A), the hardness increased by 98 HV (23%).
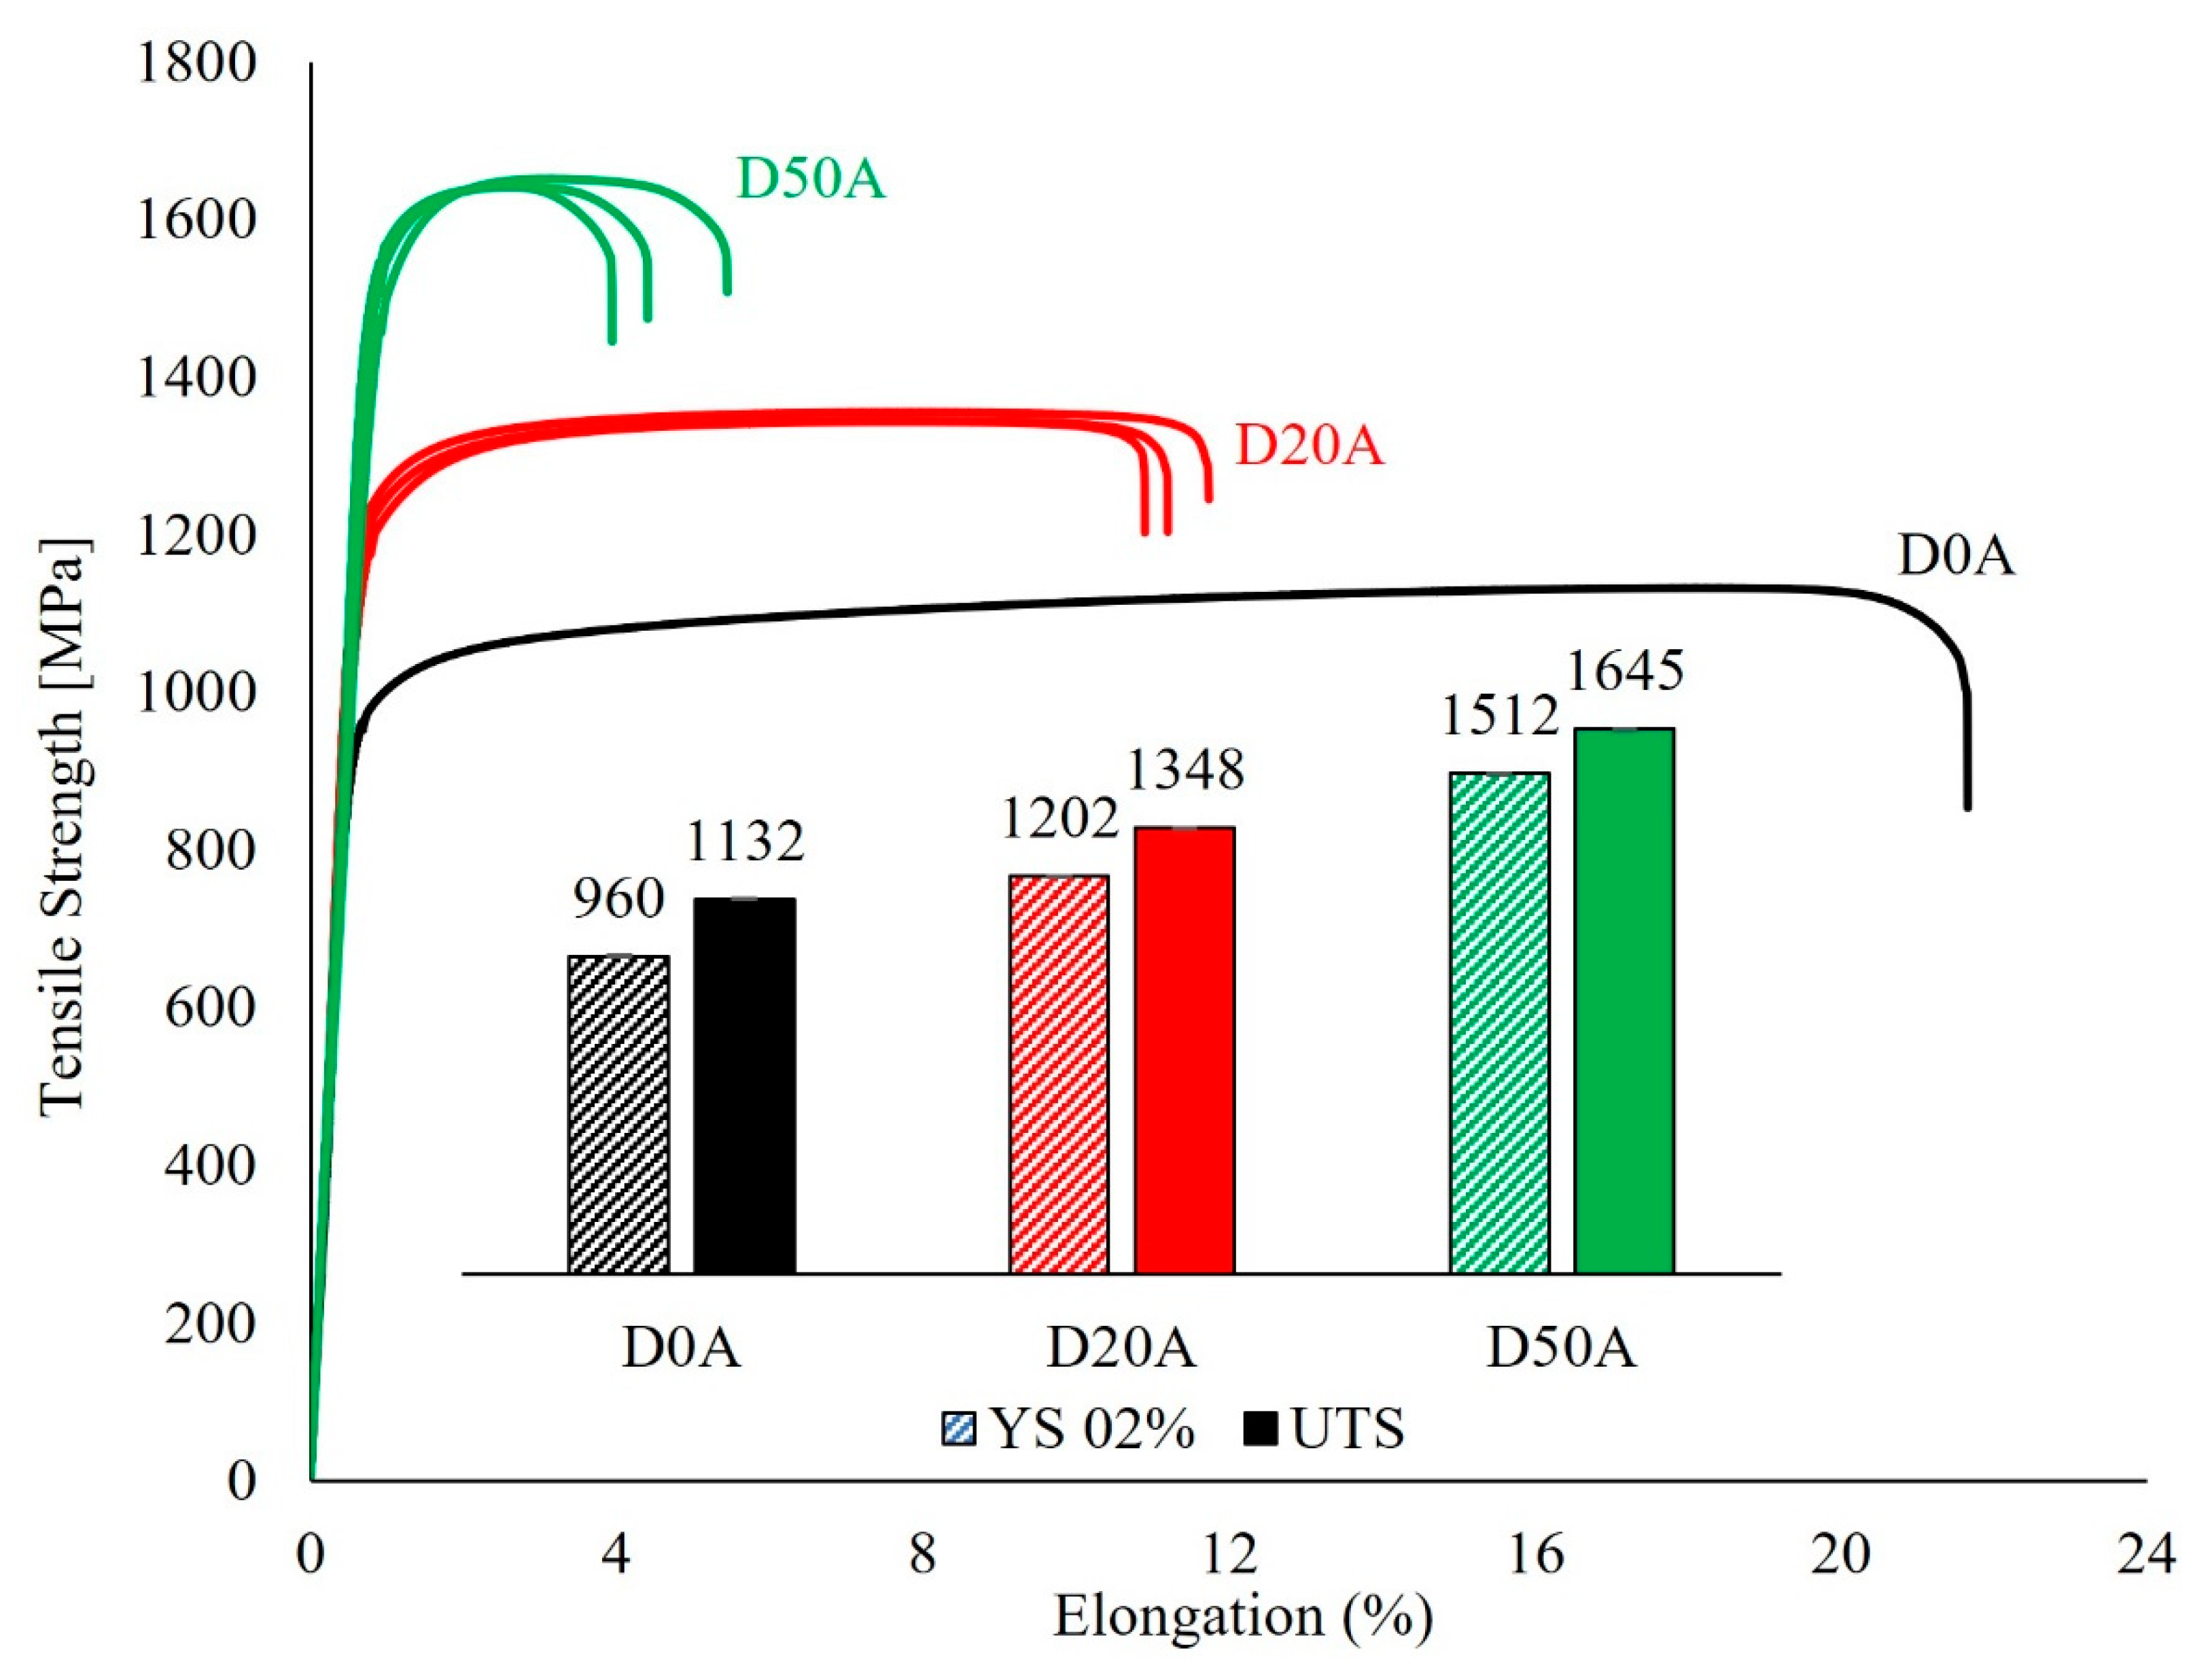
- The UTS also increased after deformation, with a 19% (216 MPa) increment for the 20% deformed specimens (D20A) and a 45% (513 MPa) increment in the UTS for the 50% deformed specimens (D50A).
- The material strength increases with an increasing percentage of deformation, where the contribution of precipitation hardening decreases while that of work hardening increases. These changes can be attributed to the further strained microstructure due to the formation of dislocations and micro-twinning.
- When a 50% deformation is applied, the tensile strength (UTS and YS) is significantly high, but the elongation at failure is very low and requires modification. To achieve a balanced tensile property, a moderate deformation level of 20% is recommended.
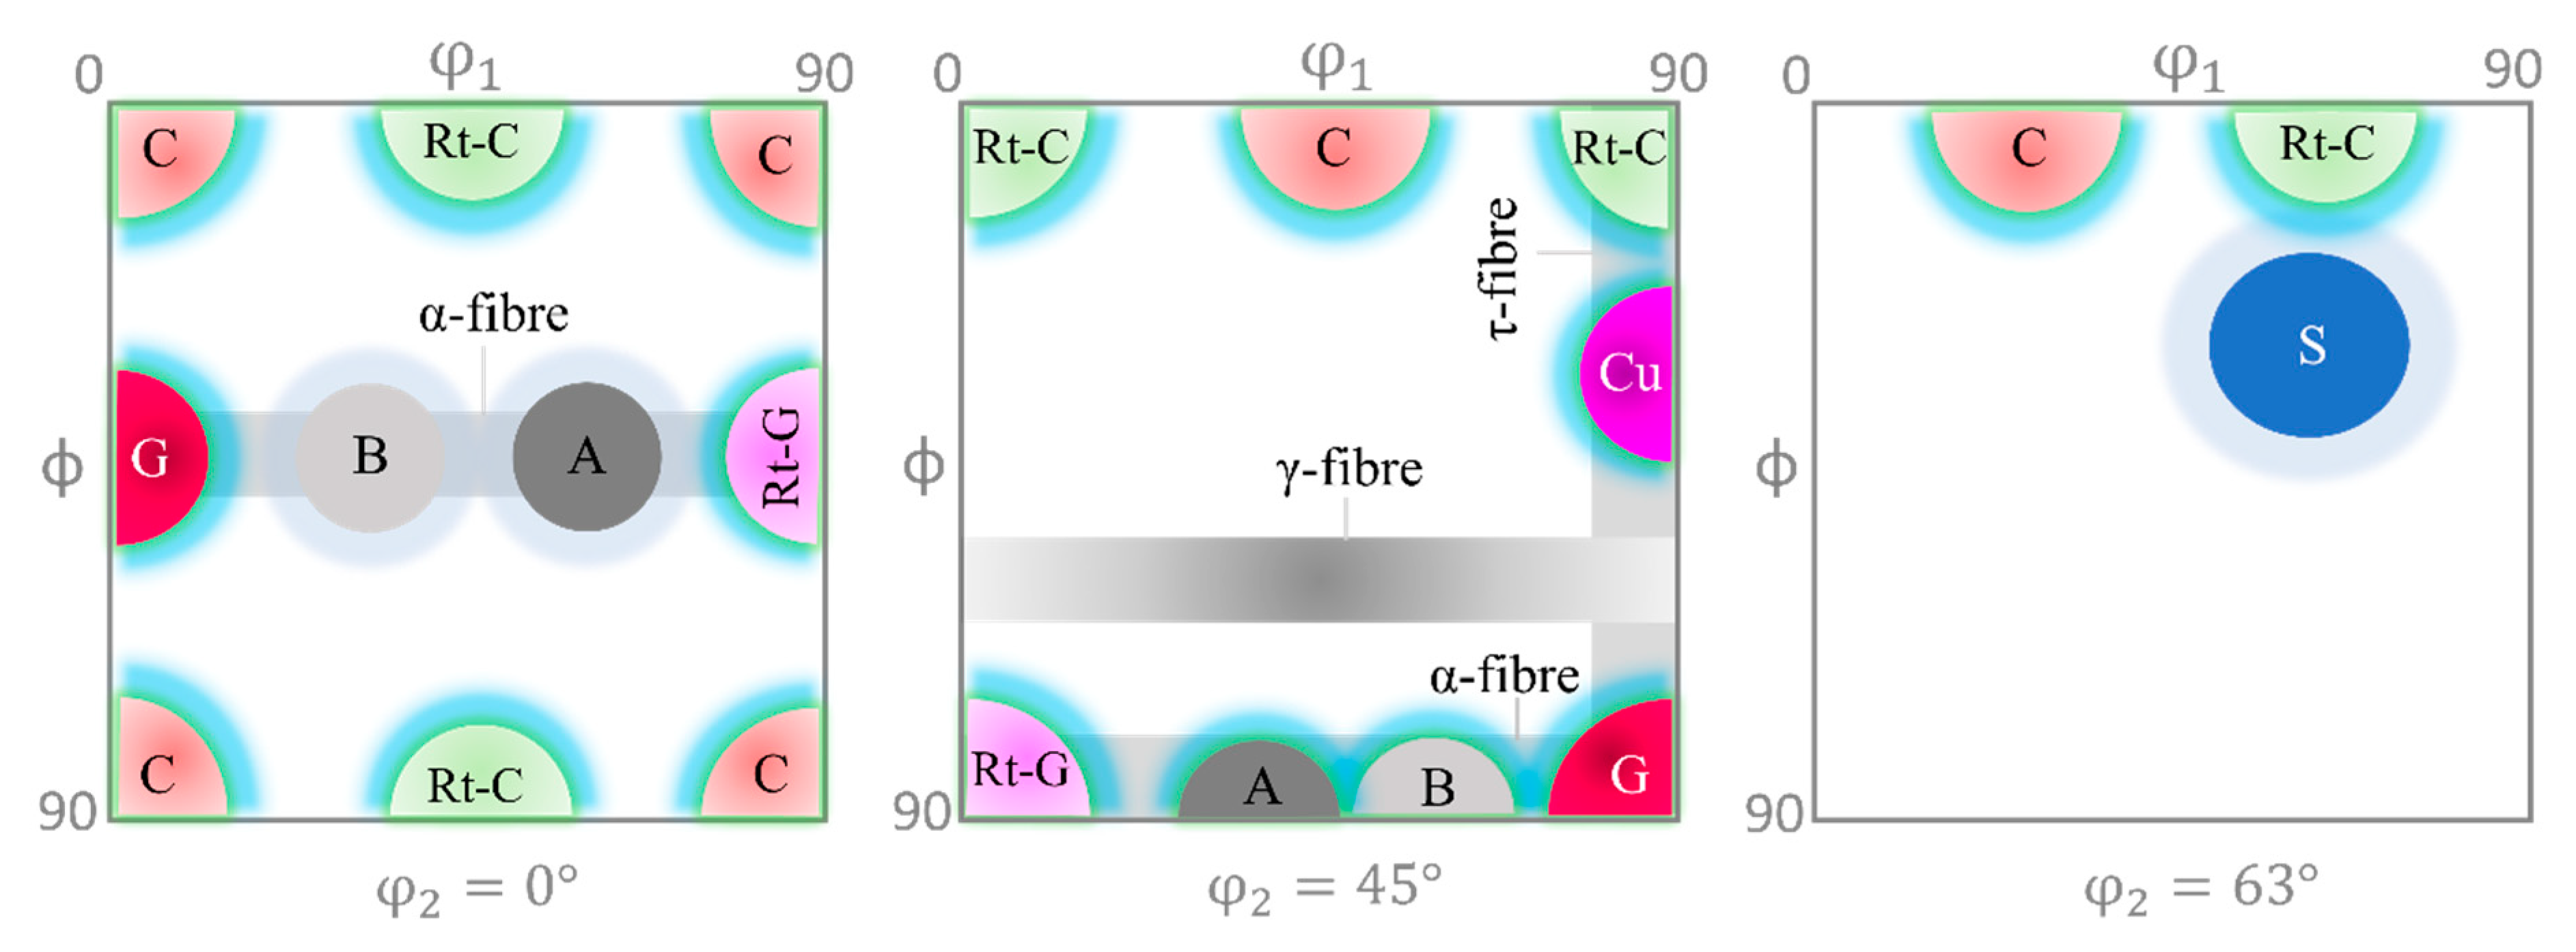
- Both pure-metal-type and alloy-type textures started to form under cold rolling, and their magnitudes were further enhanced at a higher deformation. The former generated the β-fiber, consisting of {110}<112>, {112}<111>, and {123}<634>, which are induced by the cross-slip mechanism of dislocations. The latter was shown to be developed by the reduction in the stacking fault energy and led to the twining-induced orientation emerged by a predominant <110>//ND, so-called α-fiber.
- After the aging treatment, no significant changes were observed in the crystallographic nature of the material, except for minor variations in the intensities.
Author Contributions
Funding
Data Availability Statement
Acknowledgments
Conflicts of Interest
References
- Ran, R.; Wang, Y.; Zhang, Y.-X.; Fang, F.; Wang, H.-S.; Yuan, G.; Wang, G.-D. Microstructure, precipitates and mechanical properties of Inconel 718 alloy produced by two-stage cold rolling method. Mater. Sci. Eng. A 2020, 793, 139860. [Google Scholar] [CrossRef]
- Ran, R.; Wang, Y.; Zhang, Y.-X.; Fang, F.; Xia, Y.-K.; Zhang, W.-N.; Yuan, G.; Wang, G.-D. Two-stage annealing treatment to uniformly refine the microstructure, tailor δ precipitates and improve tensile properties of Inconel 718 alloy. J. Alloys Compd. 2022, 927, 166820. [Google Scholar] [CrossRef]
- Donachie, M.J.; Donachie, S.J. Superalloys: A Technical Guide; ASM International: Almere, The Netherlands, 2002. [Google Scholar]
- Qi, H.; Azer, M.; Ritter, A. Studies of Standard Heat Treatment Effects on Microstructure and Mechanical Properties of Laser Net Shape Manufactured INCONEL 718. Metall. Mater. Trans. A 2009, 40, 2410–2422. [Google Scholar] [CrossRef]
- Cozar, R.; Pineau, A. Morphology of y’ and y” precipitates and thermal stability of inconel 718 type alloys. Metall. Trans. 1973, 4, 47–59. [Google Scholar] [CrossRef]
- Sundararaman, M.; Mukhopadhyay, P.; Banerjee, S. Some aspects of the precipitation of metastable intermetallic phases in INCONEL 718. Metall. Trans. A 1992, 23, 2015–2028. [Google Scholar] [CrossRef]
- Paulonis, D.; Oblak, J.; Duvall, D. Precipitation in Nickel-Base Alloy 718; Defense Technical Information Center: Fort Belvoir, VA, USA, 1969.
- Tucho, W.M.; Hansen, V. Characterization of SLM-fabricated Inconel 718 after solid solution and precipitation hardening heat treatments. J. Mater. Sci. 2019, 54, 823–839. [Google Scholar] [CrossRef]
- Gao, Y.; Zhang, D.; Cao, M.; Chen, R.; Feng, Z.; Poprawe, R.; Schleifenbaum, J.H.; Ziegler, S. Effect of δ phase on high temperature mechanical performances of Inconel 718 fabricated with SLM process. Mater. Sci. Eng. A 2019, 767, 138327. [Google Scholar] [CrossRef]
- API Standard 6A718; Nickel Base Alloy 718 (UNS N07718) for Oil and Gas Drilling Production Equipment. API Publishing Services: Washington, DC, USA, 2009.
- Chen, Y.-T.; Yeh, A.-C.; Li, M.-Y.; Kuo, S.-M. Effects of processing routes on room temperature tensile strength and elongation for Inconel 718. Mater. Des. 2017, 119, 235–243. [Google Scholar] [CrossRef]
- Ye, N.-y.; Zhang, G.-l.; Huang, T.Y.; Cheng, M.; Zhang, S.-H.; Wang, W. Orientational growth behavior and mechanism of delta (δ) phase precipitation in cold-rolled Inconel 718 alloy during heat treatment. J. Iron Steel Res. Int. 2023, 31, 264–274. [Google Scholar] [CrossRef]
- Dai, X.; Zhuang, K.; Pu, D.; Zhang, W.; Ding, H. An Investigation of the Work Hardening Behavior in Interrupted Cutting Inconel 718 under Cryogenic Conditions. Materials 2020, 13, 2202. [Google Scholar] [CrossRef] [PubMed]
- Wang, J.; Cheng, S.; Wu, Y.; Wang, T.; Qin, X.; Zhou, L. Effect of cold rolling on microstructure, texture, and tensile properties of a Ni-Fe-based superalloy. J. Alloys Compd. 2023, 937, 168383. [Google Scholar] [CrossRef]
- Yang, X.; Chen, S.-n.; Wang, B.; Li, X.; Wang, B.; Tian, Y. Superplastic deformation behavior of cold-rolled Inconel 718 alloy at high strain rates. J. Mater. Process. Technol. 2022, 308, 117696. [Google Scholar] [CrossRef]
- Zhang, J.-L.; Guo, Q.-Y.; Liu, Y.-C.; Li, C.; Yu, L.-M.; Li, H.-J. Effect of cold rolling and first precipitates on the coarsening behavior of γ″-phases in Inconel 718 alloy. Int. J. Miner. Metall. Mater. 2016, 23, 1087–1096. [Google Scholar] [CrossRef]
- Liu, W.C.; Yao, M.; Chen, Z.L. Effect of cold rolling on the precipitation behavior of δ phase in INCONEL 718. Metall. Mater. Trans. A 1999, 30, 31–40. [Google Scholar] [CrossRef]
- Liu, W.C.; Xiao, F.R.; Yao, M.; Chen, Z.L.; Jiang, Z.Q.; Wang, S.G. The influence of cold rolling on the precipitation of delta phase in inconel 718 alloy. Scr. Mater. 1997, 37, 53–57. [Google Scholar] [CrossRef]
- Ran, R.; Wang, Y.; Zhang, Y.-X.; Fang, F.; Xia, Y.-K.; Zhang, W.-N.; Yuan, G.; Wang, G.-D. Alleviating segregation and enhancing tensile properties of Inconel 718 superalloy by twin-roll casting and two-stage cold rolling. J. Mater. Res. Technol. 2022, 20, 1216–1225. [Google Scholar] [CrossRef]
- Mei, Y.; Liu, C.; Liu, Y.; Zhou, X.; Yu, L.; Li, C.; Ma, Z.; Huang, Y. Effects of cold rolling on the precipitation and the morphology of δ-phase in Inconel 718 alloy. J. Mater. Res. 2016, 31, 443–454. [Google Scholar] [CrossRef]
- Mei, Y.; Liu, Y.; Liu, C.; Li, C.; Yu, L.; Guo, Q.; Li, H. Effects of cold rolling on the precipitation kinetics and the morphology evolution of intermediate phases in Inconel 718 alloy. J. Alloys Compd. 2015, 649, 949–960. [Google Scholar] [CrossRef]
- Chen, S.-N.; Yang, X.; Wang, B.; Li, Z.; Gao, X.; Wang, B.; Tian, Y. Effect of deformation and annealing process on microstructure and properties of Inconel 718 foil. Mater. Charact. 2023, 205, 113322. [Google Scholar] [CrossRef]
- Azadian, S.; Wei, L.-Y.; Warren, R. Delta phase precipitation in Inconel 718. Mater. Charact. 2004, 53, 7–16. [Google Scholar] [CrossRef]
- Rongbin, L.; Xianchang, H.; Mei, Y.; Wenchang, L. Effects of cold rolling on precipitates in inconel 718 alloy. J. Mater. Eng. Perform. 2002, 11, 504–508. [Google Scholar] [CrossRef]
- Zhang, Y.; Lan, L.; Zhao, Y. Effect of precipitated phases on the mechanical properties and fracture mechanisms of Inconel 718 alloy. Mater. Sci. Eng. A 2023, 864, 144598. [Google Scholar] [CrossRef]
- Anderson, M.; Thielin, A.L.; Bridier, F.; Bocher, P.; Savoie, J. δ Phase precipitation in Inconel 718 and associated mechanical properties. Mater. Sci. Eng. A 2017, 679, 48–55. [Google Scholar] [CrossRef]
- Desvallees, Y.; Bouzidi, M.; Bois, F.; Beaude, N. Delta Phase in INCONEL 718: Mechanical Properties and Forging Process Requirements. Superalloys 1994, 281–291. [Google Scholar]
- deBarbadillo, J.J.; Mannan, S.K. Alloy 718 for Oilfield Applications. JOM 2012, 64, 265–270. [Google Scholar] [CrossRef]
- Wang, Y.-Q.; Yuan, C.; Wei, J.-X.; Gao, X.-Y.; Chen, Y.-P.; Kong, W.-W.; Zhang, B.; Wen, X.; Liu, X.; Liu, S. Texture evolution and twinnability prediction of the most compliant orientation in GH3536 superalloy during cold rolling. J. Mater. Res. Technol. 2023, 24, 2743–2756. [Google Scholar] [CrossRef]
- Zeng, M.T.; Yang, Y.; Tan, Y.B.; Zhang, W.W.; Xiang, S.; Ma, M.; Zhao, F. Recrystallization behavior and texture evolution of cryo-rolled GH159 superalloy with an ultra-high strength. Mater. Charact. 2023, 197, 112656. [Google Scholar] [CrossRef]
- Zhang, W.W.; Yang, Y.; Tan, Y.B.; Zeng, M.T.; Ma, M.; Xiang, S.; Zhao, F. Microstructure evolution and strengthening mechanisms of MP159 superalloy during room temperature rolling and cryorolling. J. Alloys Compd. 2022, 908, 164667. [Google Scholar] [CrossRef]
- Kestens, L.A.I.; Pirgazi, H. Texture formation in metal alloys with cubic crystal structures. Mater. Sci. Technol. 2016, 32, 1303–1315. [Google Scholar] [CrossRef]
- Sletsjøe, A.T. Effects of Cold Rolling on the Mechanical Properties and Grain Structure of Inconel 718 Alloy. Master’s Thesis, University of Stavanger, Stavanger, Norway, 2023. [Google Scholar]
- Tucho, W.M.; Hansen, V. Studies of Post-Fabrication Heat Treatment of L-PBF-Inconel 718: Effects of Hold Time on Microstructure, Annealing Twins, and Hardness. Metals 2021, 11, 266. [Google Scholar] [CrossRef]
- Beausir, B.; Fundenberger, J. Analysis Tools for Electron and X-ray Diffraction, ATEX-Software; Université de Lorraine-Metz: Metz, France, 2017. [Google Scholar]
- AMS5662; Alloy, Bars, Forgings, and Rings, Corrosion and Heat Resistant Nickel Base-19Cr-3.1Mo-5.1(Cb+Ta)-0.90Ti-0.50Al Consumable Electrode or Vacuum Induction Melted, Solution Treated. SAE International: Warrendale, PA, USA, 2022.
- ISO 6507-1:2018; Metallic Materials Vickers Hardness Test Part 1: Test Method. ISO: Geneva, Switzerland, 2018; p. 6.
- ISO 6892-1:2009; Metallic Materials—Tensile Testing—Part 1: Method of Test at Room Temperature. ISO: Geneva, Switzerland, 2019.
- Hong, S.; Chen, W.; Wang, T. A diffraction study of the γ″ phase in INCONEL 718 superalloy. Metall. Mater. Trans. A 2001, 32, 1887–1901. [Google Scholar] [CrossRef]
- Robinson, J.M.; Shaw, M.P. Microstructural and mechanical influences on dynamic strain aging phenomena. Int. Mater. Rev. 1994, 39, 113–122. [Google Scholar] [CrossRef]
- Bracke, L.; Verbeken, K.; Kestens, L.; Penning, J. Microstructure and texture evolution during cold rolling and annealing of a high Mn TWIP steel. Acta Mater. 2009, 57, 1512–1524. [Google Scholar] [CrossRef]
- Suwas, S.; Ray, R.K. Experimental Determination of Texture. In Crystallographic Texture of Materials; Suwas, S., Ray, R.K., Eds.; Springer: London, UK, 2014; pp. 39–71. [Google Scholar] [CrossRef]
- Xie, X.S.; Chen, G.L.; McHugh, P.J.; Tien, J.K. Including stacking fault energy into the resisting stress model for creep of particle strengthened alloys. Scr. Metall. 1982, 16, 483–488. [Google Scholar] [CrossRef]


| Sample ID | ST | Def. (%) | PH | |
|---|---|---|---|---|
| 1100 °C /1 h | 720 °C /8 h | 650 °C /8 h | ||
| D0 | Yes | 0 | No | No |
| D0A | Yes | 0 | Yes | Yes |
| D20 | Yes | 20 | No | No |
| D20A | Yes | 20 | Yes | Yes |
| D50 | Yes | 50 | No | No |
| D50A | Yes | 50 | Yes | Yes |
| OC | ||||
| Type | Miller Indices | Euler Angles | Fiber | ||
|---|---|---|---|---|---|
| ϕ1 | φ | ϕ2 | |||
| Brass (B) | {110}<112> | 55 | 90 | 45 | α/β |
| Copper (Cu) | {112}<111> | 90 | 35 | 45 | β |
| S | {123}<634> | 59 | 37 | 63 | β |
| Goss | {110}<001> | 90 | 90 | 45 | α |
| A | {110}<111> | 35 | 90 | 45 | α |
| G/B | {110}<114> | 20 | 45 | 0 | α |
Disclaimer/Publisher’s Note: The statements, opinions and data contained in all publications are solely those of the individual author(s) and contributor(s) and not of MDPI and/or the editor(s). MDPI and/or the editor(s) disclaim responsibility for any injury to people or property resulting from any ideas, methods, instructions or products referred to in the content. |
© 2024 by the authors. Licensee MDPI, Basel, Switzerland. This article is an open access article distributed under the terms and conditions of the Creative Commons Attribution (CC BY) license (https://creativecommons.org/licenses/by/4.0/).
Share and Cite
Tucho, W.M.; Sletsjøe, A.T.; Sayyar, N.; Hansen, V. Optimizing Tensile Properties and Hardness of Inconel 718 by Cold Rolling. Metals 2024, 14, 455. https://doi.org/10.3390/met14040455
Tucho WM, Sletsjøe AT, Sayyar N, Hansen V. Optimizing Tensile Properties and Hardness of Inconel 718 by Cold Rolling. Metals. 2024; 14(4):455. https://doi.org/10.3390/met14040455
Chicago/Turabian StyleTucho, Wakshum Mekonnen, Anders Thon Sletsjøe, Navid Sayyar, and Vidar Hansen. 2024. "Optimizing Tensile Properties and Hardness of Inconel 718 by Cold Rolling" Metals 14, no. 4: 455. https://doi.org/10.3390/met14040455
APA StyleTucho, W. M., Sletsjøe, A. T., Sayyar, N., & Hansen, V. (2024). Optimizing Tensile Properties and Hardness of Inconel 718 by Cold Rolling. Metals, 14(4), 455. https://doi.org/10.3390/met14040455