Article

Additive Manufacturing for Rapid Sand Casting: Mechanical and Microstructural Investigation of Aluminum Alloy Automotive Prototypes

by
Silvia Cecchel
1,* and
Giovanna Cornacchia
2
1
Streparava SpA, Via Zocco 13, Adro, 25030 Brescia, Italy
2
Department of Mechanical and Industrial Engineering, University of Brescia, Via Branze 38, 25123 Brescia, Italy
*
Author to whom correspondence should be addressed.
Metals 2024, 14(4), 459; https://doi.org/10.3390/met14040459
Submission received: 11 March 2024 / Revised: 10 April 2024 / Accepted: 11 April 2024 / Published: 13 April 2024
(This article belongs to the Special Issue Light Alloy and Its Application II)

Abstract

:
The automotive industry is undergoing a rapid evolution to meet today’s challenges; therefore, continuous innovation and product development are needed. Validation tests on prototypes play a crucial role in moving new components into industrial production. There is also a pressing need for faster prototyping processes. In this context, rapid sand casting (RSC), based on additive manufacturing technology, offers a promising solution for a quick production of sand molds. While this technology is already employed in the industry, the need to deepen the general understanding of its impact on the casting properties is still a relevant item. In this study, different geometries of automotive prototypes made of aluminum EN AC 42100-T6 alloy were experimentally analyzed. Microstructural examinations, tensile tests, and fractography and porosity analyses were conducted. The findings demonstrate the considerable potential of RSC, giving, in general, high mechanical properties. A comparative analysis with prototypes produced through traditional sand casting revealed similar results, with RSC exhibiting superior yield strength and stress at brake. However, both technologies revealed a reduced elongation percentage, as expected. Future efforts will focus on standardizing the RSC process to enhance ductility levels.

1. Introduction

The ongoing revolution in the automotive industry has intensified the demand for innovations, comprising lighter components [1], new designs [2], and smarter parts. Consequently, there is a growing emphasis on the rapid development of new products. Prototypes play a key role in vehicle manufacturing, allowing for the assessment of design safety and technological advancements during the pre-production and validation phases, as well as the identification of potential failures during the vehicle’s actual use [3]. Aluminum alloy castings are widely employed in this field, thanks to their favorable strength-to-weight ratio. In particular, the rapid sand casting (RSC) process, that employs additive manufacturing (AM) to produce sand molds, is gaining prominence in the domain of aluminum prototypes. The sand casting process stands out as one of the preferred and widely adopted methods for metal fabrication. Integrating AM technology into sand casting processes holds the potential to enhance overall efficiency and effectiveness. The process involves the deposition of layers of sand and activator, followed by the spraying of binder in selected areas. At the end of the process, a sand mold is obtained. The 3D printing of sand molds eliminates the need for traditional tools such as patterns, cores, core boxes, and flasks. Furthermore, the capability to fabricate intricately shaped cores and molds via 3D sand printing offers high design flexibility [4]. Ongoing studies in this field have shown that some rapid sand-cast molds have a superior quality compared to the traditionally manufactured ones [5].
Rapid sand casting proves to be a cost-effective and rapid method with respect to the traditional technology. Moreover, RSC can serve as an alternative to traditional sand casting (SC) production, which is one of the most diffused processes for aluminum alloy automotive components. In this case, RSC enables the production of very complex-shaped molds, that are not feasible with the traditional technology, leading to lighter parts [6]. All these features could make the RSC process of interest not only for prototypes but also for potential future serial applications of small batches.
On the other hand, this technique can be affected by inconsistency and variability in certain properties observed after different production batches [7]. To the best of the authors’ knowledge, the literature on the properties encountered in components made via RSC is limited. Some of the variability documented in the existing literature pertains to properties such as density, strength, elastic modulus, dimensional accuracy, roughness, etc. [7]. The thermophysical behavior of sand molds is a relevant property to be evaluated, both in traditional SC and RSC processes, due to its relevant impact on the microstructural evolution and defect formation (mainly related to gas release) [7,8]. Looking at RSC, Toth et al. [9] studied the thermophysical parameters and heat distribution kinetics of two different 3D-printed sand blends based on phenolic and furan binders. They found that the latter binder absorbed 30% more heat compared to the former. This entails a better cooling capacity for the furan mixture. Martinez et al. [10] studied the effect of furan binder content (i.e., 1–3%) on 3D-printed sand molds and found that thermal conductivity, diffusivity, and heat capacity increase with increasing binder content at room temperature. Binder degradation affects thermal properties, particularly at higher binder levels. Indeed, an important consideration regarding the RSC process with resin-bonded molds is the presence of binder. While a high binder content can enhance mold resistance, it may also have a negative effect on the mechanical properties due to gas formation, necessitating improved air evacuation systems and filling techniques [7]. For instance, P. Rodriguez-Gonzalez et al. [11] analyzed the surface porosity of sand casting and 3D-printed (3DP) mold parts, finding a porosity of 0.95% for the former and 1.63% for the latter. Porosities measured on samples produced with different RSC mold materials were also analyzed by D. Snelling et al. [12], revealing mean values ranging from 0.65% to 1.59%. The same authors measured the secondary dendrite arm spacing (SDAS), finding variable values from 41.2 to 72.9 µm.
Analyzing the literature within a broader context, which encompasses traditional cast aluminum technologies, it is known that defects such as porosities, along with microstructure, exert significant influence on the tensile properties of these alloys [13]. This relationship has been extensively studied for cast Al-Si alloys, produced using conventional technologies such as sand casting, low-pressure die casting (LPDC), and gravity casting. Huang et al. demonstrated that a reduction in porosities, obtained through the addition of local squeeze in LPDC, led to enhanced tensile properties [14].
Another relevant aspect is the shape of silicon in the eutectic. Please note that coarser AlSi platelets greatly reduces ductility [15,16]. It is also common knowledge that the match between refined eutectic Si and smaller SDAS implies a substantial improvement in the strength of the Al-Si alloy [17]. As regards the influence of component shape, it is important to note that reducing wall thickness leads to higher cooling rates, resulting in a decrease in SDAS [18]. An additional consequence of this reduction in SDAS could be an improved casting integrity [18]. Furthermore, component shape can affect silicon modification. For instance, Shao-chun et al. [19] observed that a higher wall thickness in aluminum sand casting significantly reduces the Sr modification effect, thereby increasing SDAS and subsequently diminishing mechanical properties. Other researchers highlighted that increasing the cooling rate results in a decrease in SDAS and improves eutectic silicon modification at the same time [18,20,21,22].
Despite research carried out up to now, there remains a need to further extend the current literature to evaluate additional aspects. For instance, there is a critical need to delve deeper into the effect of this new process on the elongation at failure, which is a highly relevant parameter in the field of automotive parts. Additionally, to the best of the authors’ knowledge, the current literature lacks an accurate comparison between RSC and traditional SC technology. This activity is essential to gain a comprehensive understanding of the potential benefits or deficiencies of the new RSC process and to properly evaluate its implementation prospects in industrial applications. In this context, the purpose of the present research is to empirically address these shortcomings in the literature. Thus, the present research focuses on an experimental microstructural and mechanical characterization of aluminum EN 42100-T6 automotive components with different geometries produced through rapid sand casting. A comparative analysis was performed with sand-cast parts of the same geometry as the RSC products. Properties were comprehensively analyzed using techniques including X-ray analysis, microstructural observations, image analysis (SDAS and porosity% calculation), tensile tests, and fractography.

2. Materials and Methods

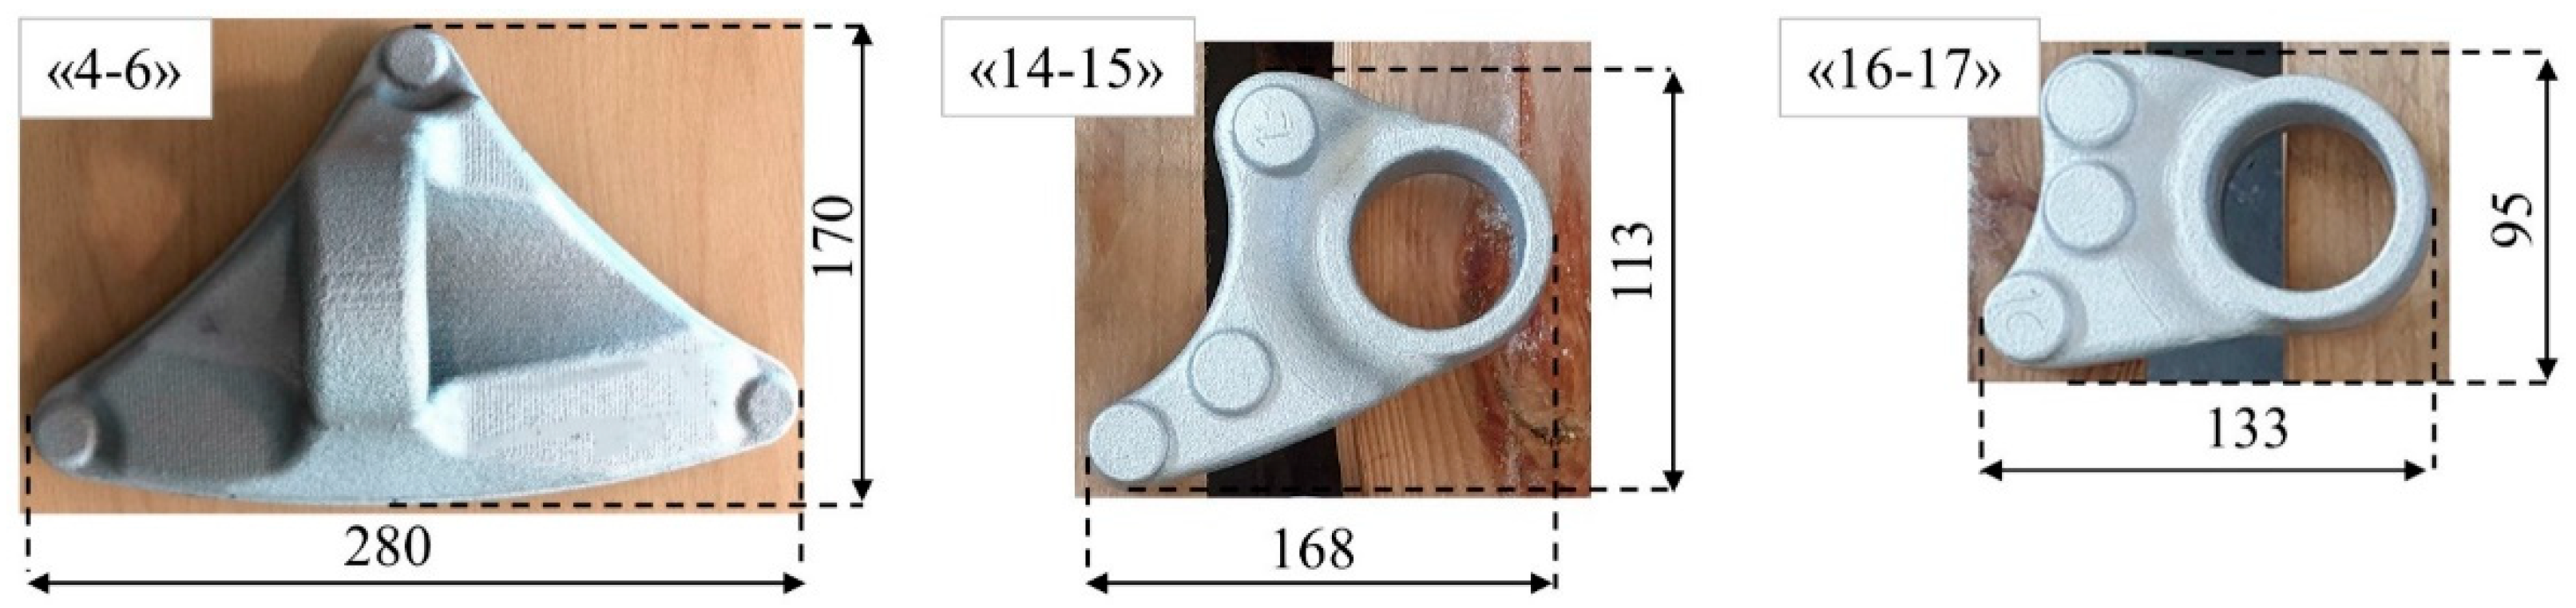
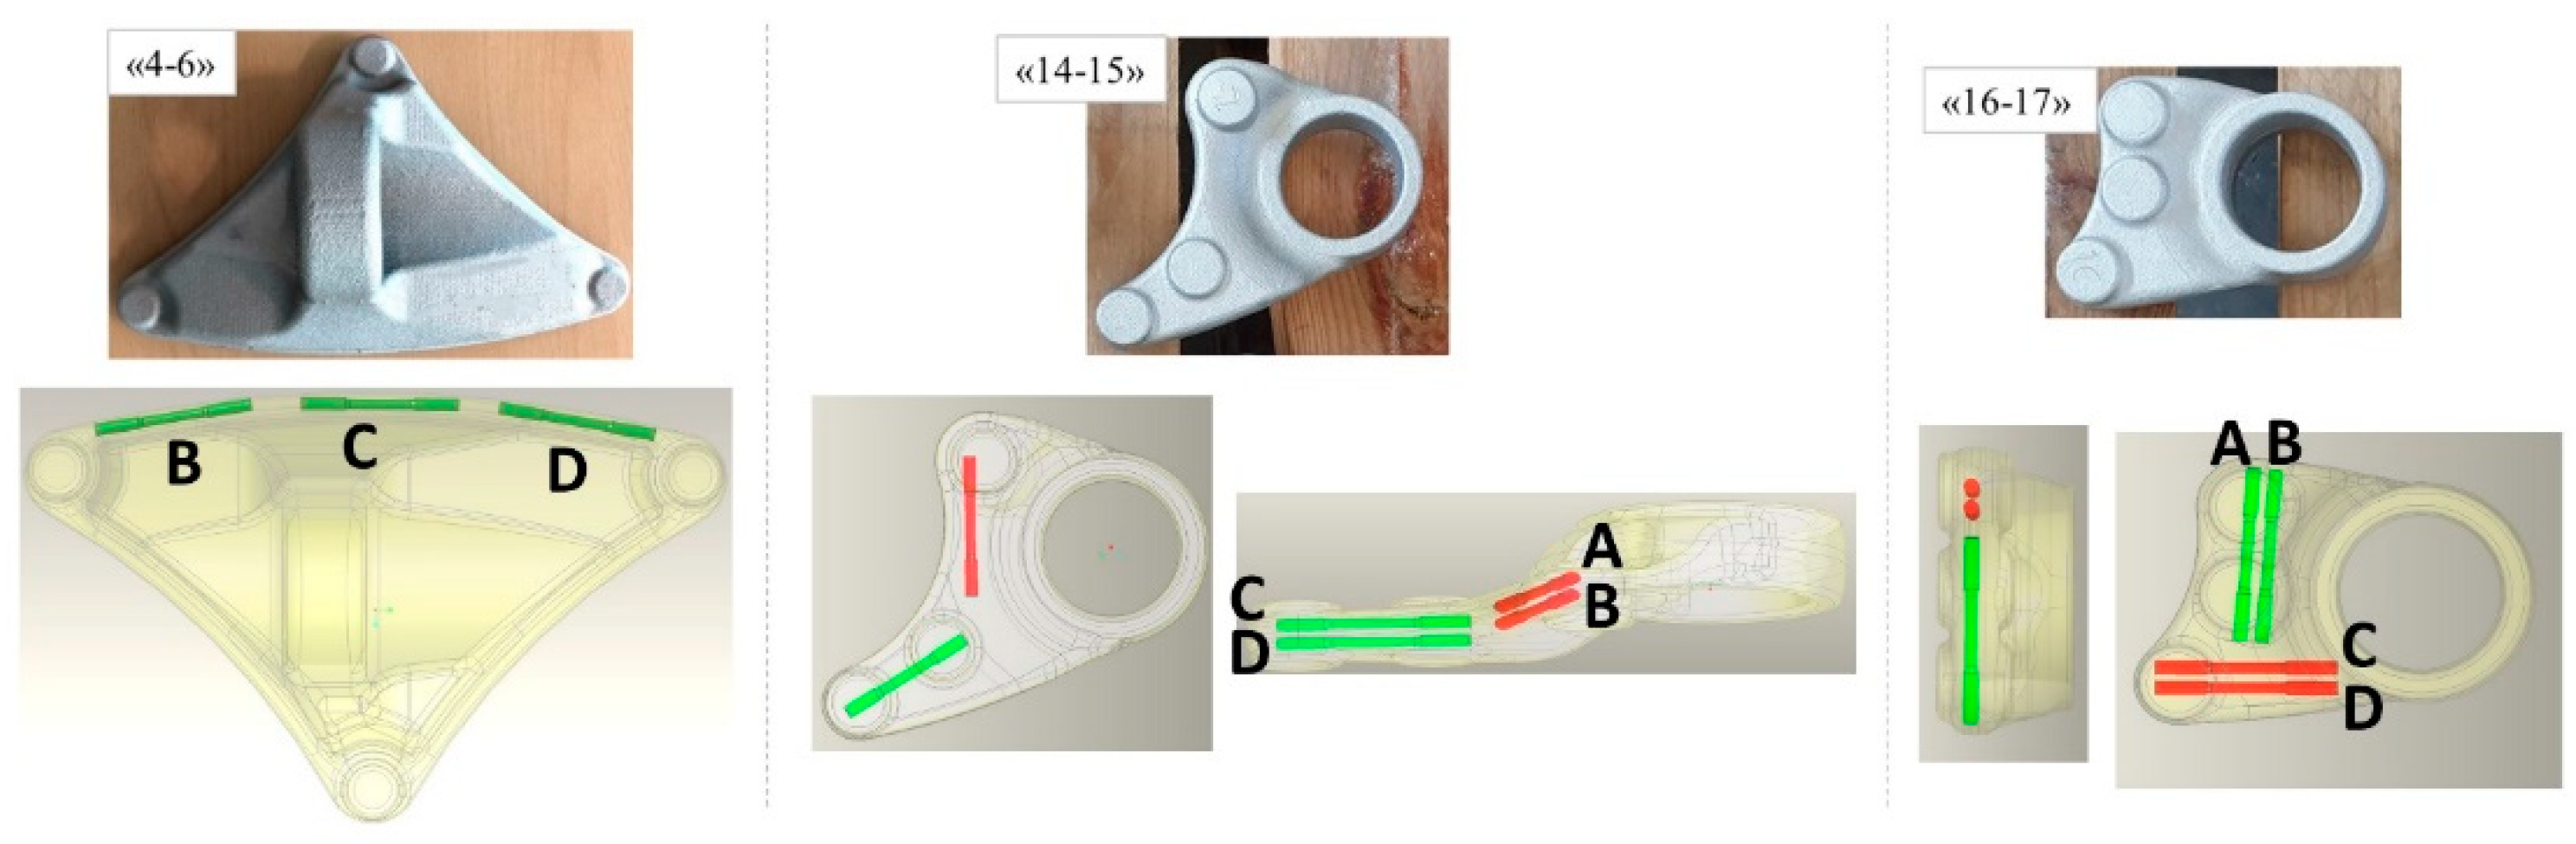
2.1. Sample Description

Approximately 10 automotive components, featuring 3 distinct designs, as illustrated in Figure 1, were subjected to analysis. These components were fabricated from aluminum EN AC 42100-T6 alloy. Following the prescription for the alloy [23], T6 heat treatment was composed of solubilization in the temperature range of 520–535 °C, with a duration of 4–10 h, followed by aging approximately at a temperature between 155 and 165 °C and a duration of about 6–8 h. For reference, these parts will be named “4 and 6” (depicted in the left image of Figure 1); “14 and 15” (shown in the middle image of Figure 1); “16–17” (illustrated in the right image of Figure 1). It is worth noting that each model includes two variations, identified by different numerical identifiers, representing symmetrical designs with identical configurations.
The production process employed was the same for all designs, namely, RSC. The machine used for rapid tooling production was ExOne S-max, employing a cold hardening binder system based on furan binder and silica sand. Then, the aluminum alloy was poured into the 3D-printed mold to obtain the technological prototype. The pouring temperature was 725 °C ± 5 °C.
In addition, components “4 and 6” were replicated using traditional SC for the mold production, facilitating a comparative analysis between the two manufacturing technologies for the same design. The average dimensions of each part are outlined in Figure 1.
The average chemical composition of the alloy, determined by means of quantometer measurements, is reported in Table 1. It can be noted that the only difference between the RSC and SC processes is a slight variation in the Mg content.

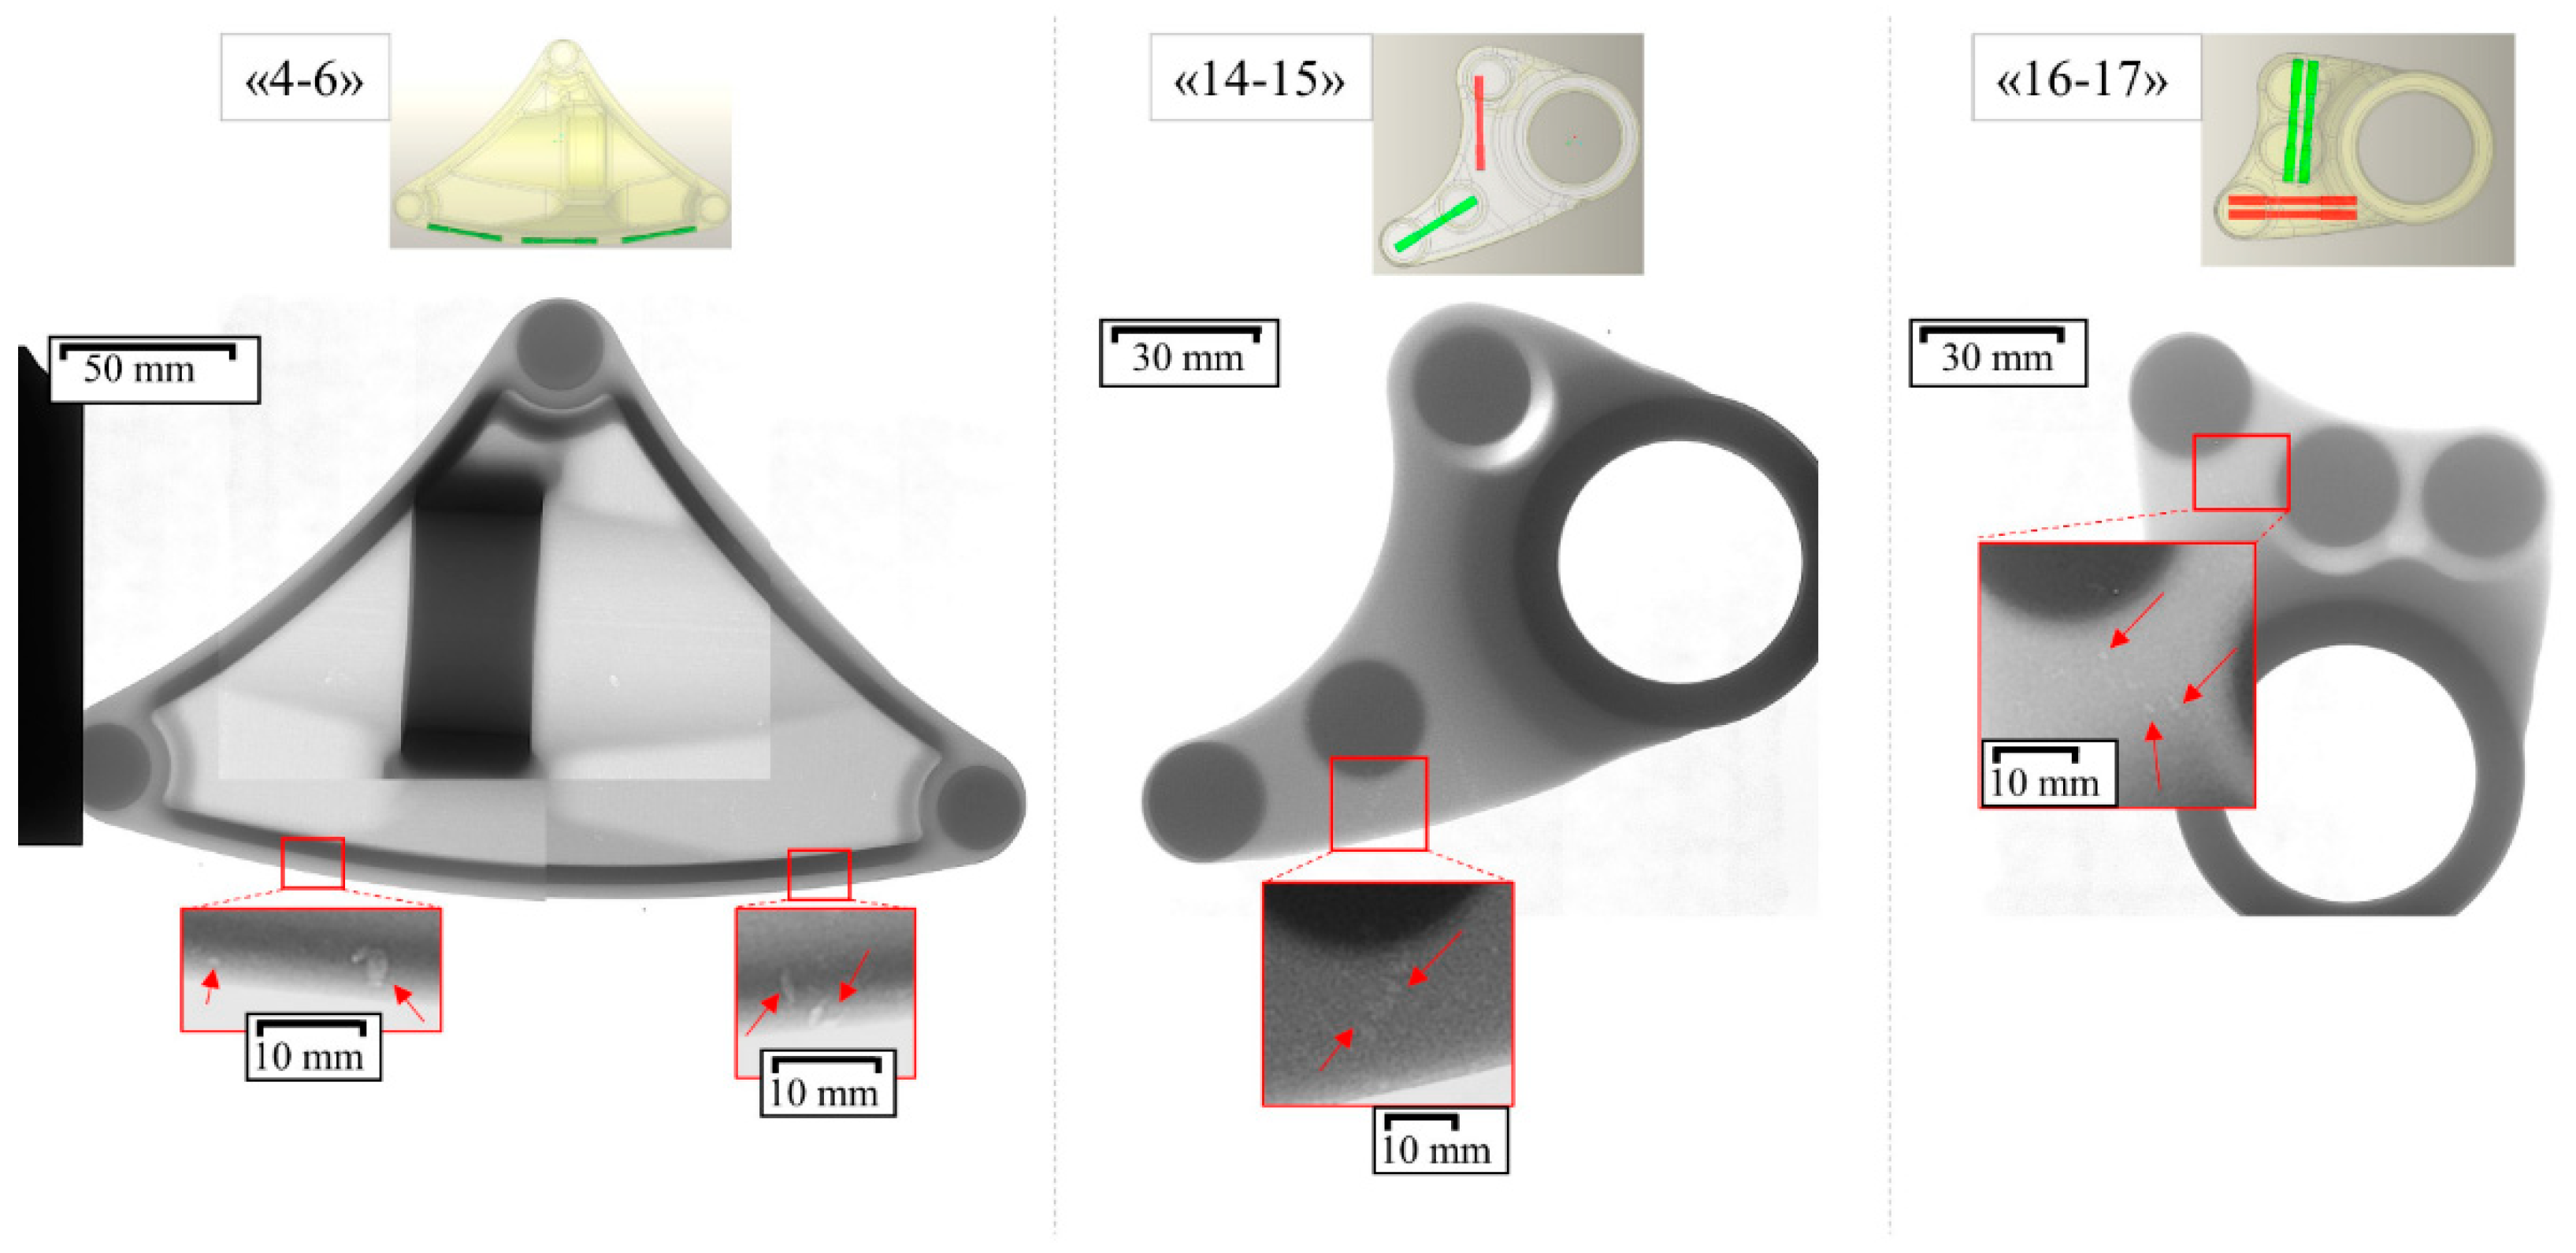
2.2. X-ray and Metallographical Analysis

A conventional X-ray radiographic technique was employed on all components to conduct a preliminary analysis of product quality. This involved confirming the sampling plan, checking the extent and location of porosity, and performing an initial non-destructive technological evaluation of the object. The radiographic analysis was conducted using the Zeiss Bosello Sre-Max instrument equipped with an X-ray tube.
For metallographic observations, the samples in the different conditions were sectioned orthogonally from the shoulders of the tensile specimens located in the sample end closest to the fracture surface. The samples were prepared with standard metallographic techniques (ground up to 4000 grit SiC paper and polished until 1 μm diamond paste) and examined using a Leica DMI 5000M optical microscope (OM). The entire sample area was reconstructed from a collage of about 15 images taken at 40× magnification using LAS 4.12 software. Starting from this collage, an image analysis of secondary dendritic arm spacing (SDAS) and porosity% was performed, using the same software integrated with the optical microscope. These measurements were performed for each sample and the average value of each component is reported in the Results section. SDAS was measured according to the following equation [24]:
S D A S = L N 1
where N represents the number of secondary arms counted along one side of the primary arm and L is the length parallel to the primary arm measured from center to center of the counted secondary arms. Manual SDAS measurements were performed using optical micrography, facilitated by image analysis software, which enabled direct length readings standardized to a microscope calibration slide, as reported in Figure 2. The average SDAS of each sample was calculated using at least 5 readings.
Optical micrographs at higher magnifications, up to 500×, were also analyzed to better evaluate the microstructural features, such as eutectic and intermetallic morphology and distributions. The highlighted microstructure was also observed using a LEO EVO 40 Scanning Electron Microscope (SEM). Semi-quantitative chemical analyses were obtained by means of an EDS (Energy Dispersive Spectroscopy–Link Analytical eXL) probe, with a spatial resolution of a few microns, in order to evaluate the nature of precipitates.

2.3. Tensile Tests and Fractography

For the tensile tests, cylindrical samples with a total length of 62 mm, a gauge length of 20 mm, and a gauge diameter of 4 mm were machined from the components, according to DIN 50125-2016, in the areas shown in Figure 3 and named from A to D. Thus, at least three samples for each component were considered. The components had different average thicknesses, which in the sample areas were equal to 8, 25, and 30 mm, respectively, for parts 4–6, 14–15, and 16–17.
To perform the tensile tests, an electromechanical testing machine Instron 3369 with a 50 kN load cell was used at a strain rate of 1 mm/min. The tests were performed at room temperature following UNI EN ISO 6892–1: 2020 [25]. Yield strength (σy), ultimate tensile strength (σm), and elongation after fracture (A%) were calculated. The strain was measured using a 12.5 mm extensometer.
The fracture surfaces of failed specimens were investigated by means of SEM analyses with a LEO EVO-40 XVP SEM (Zeiss, Milan, Italy) to evaluate the failure mechanisms.

3. Results and Discussion

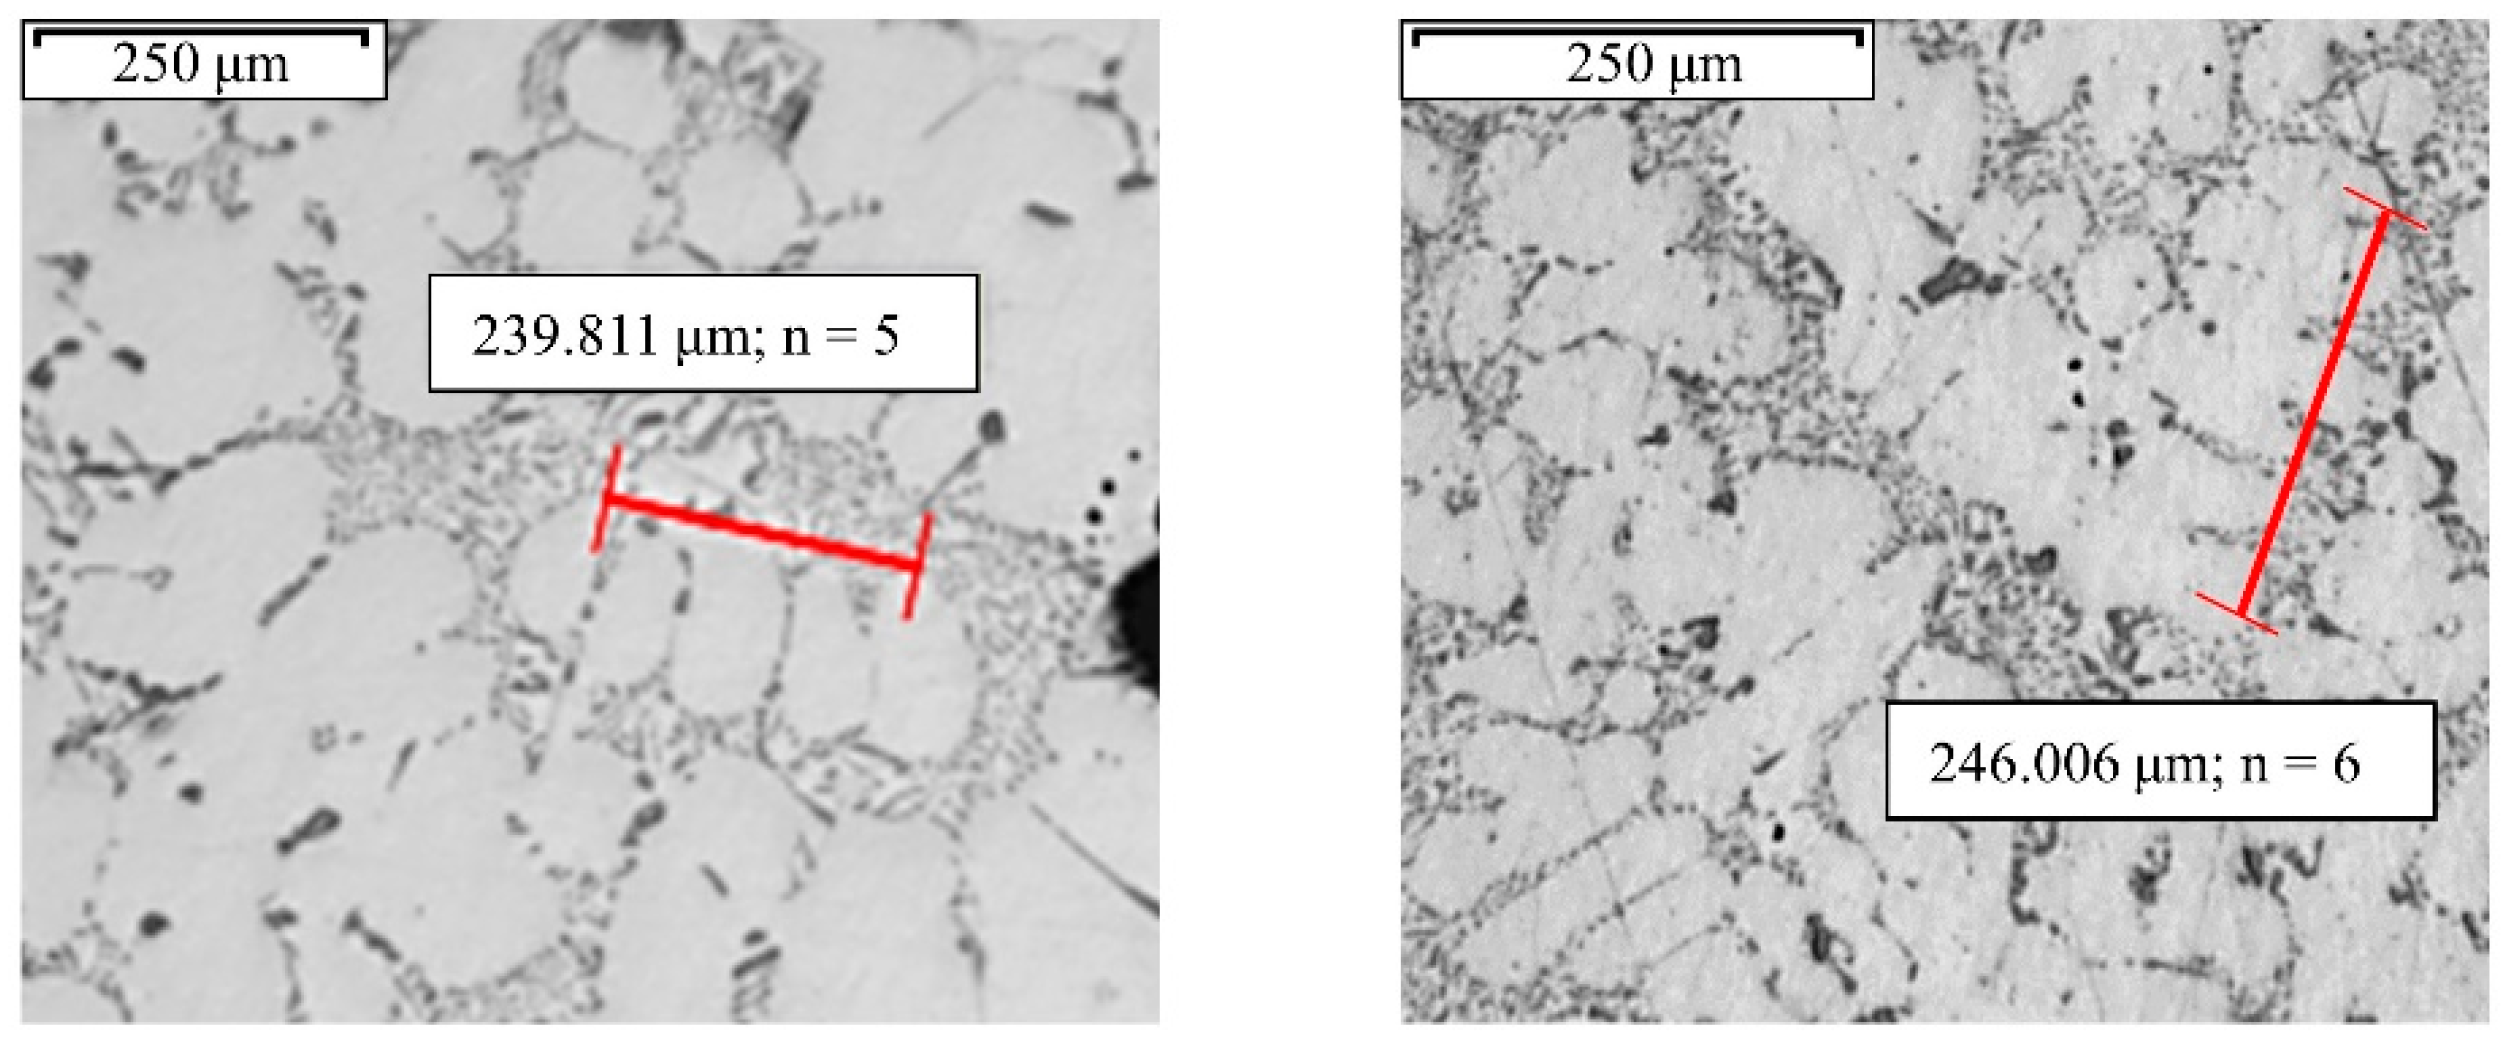
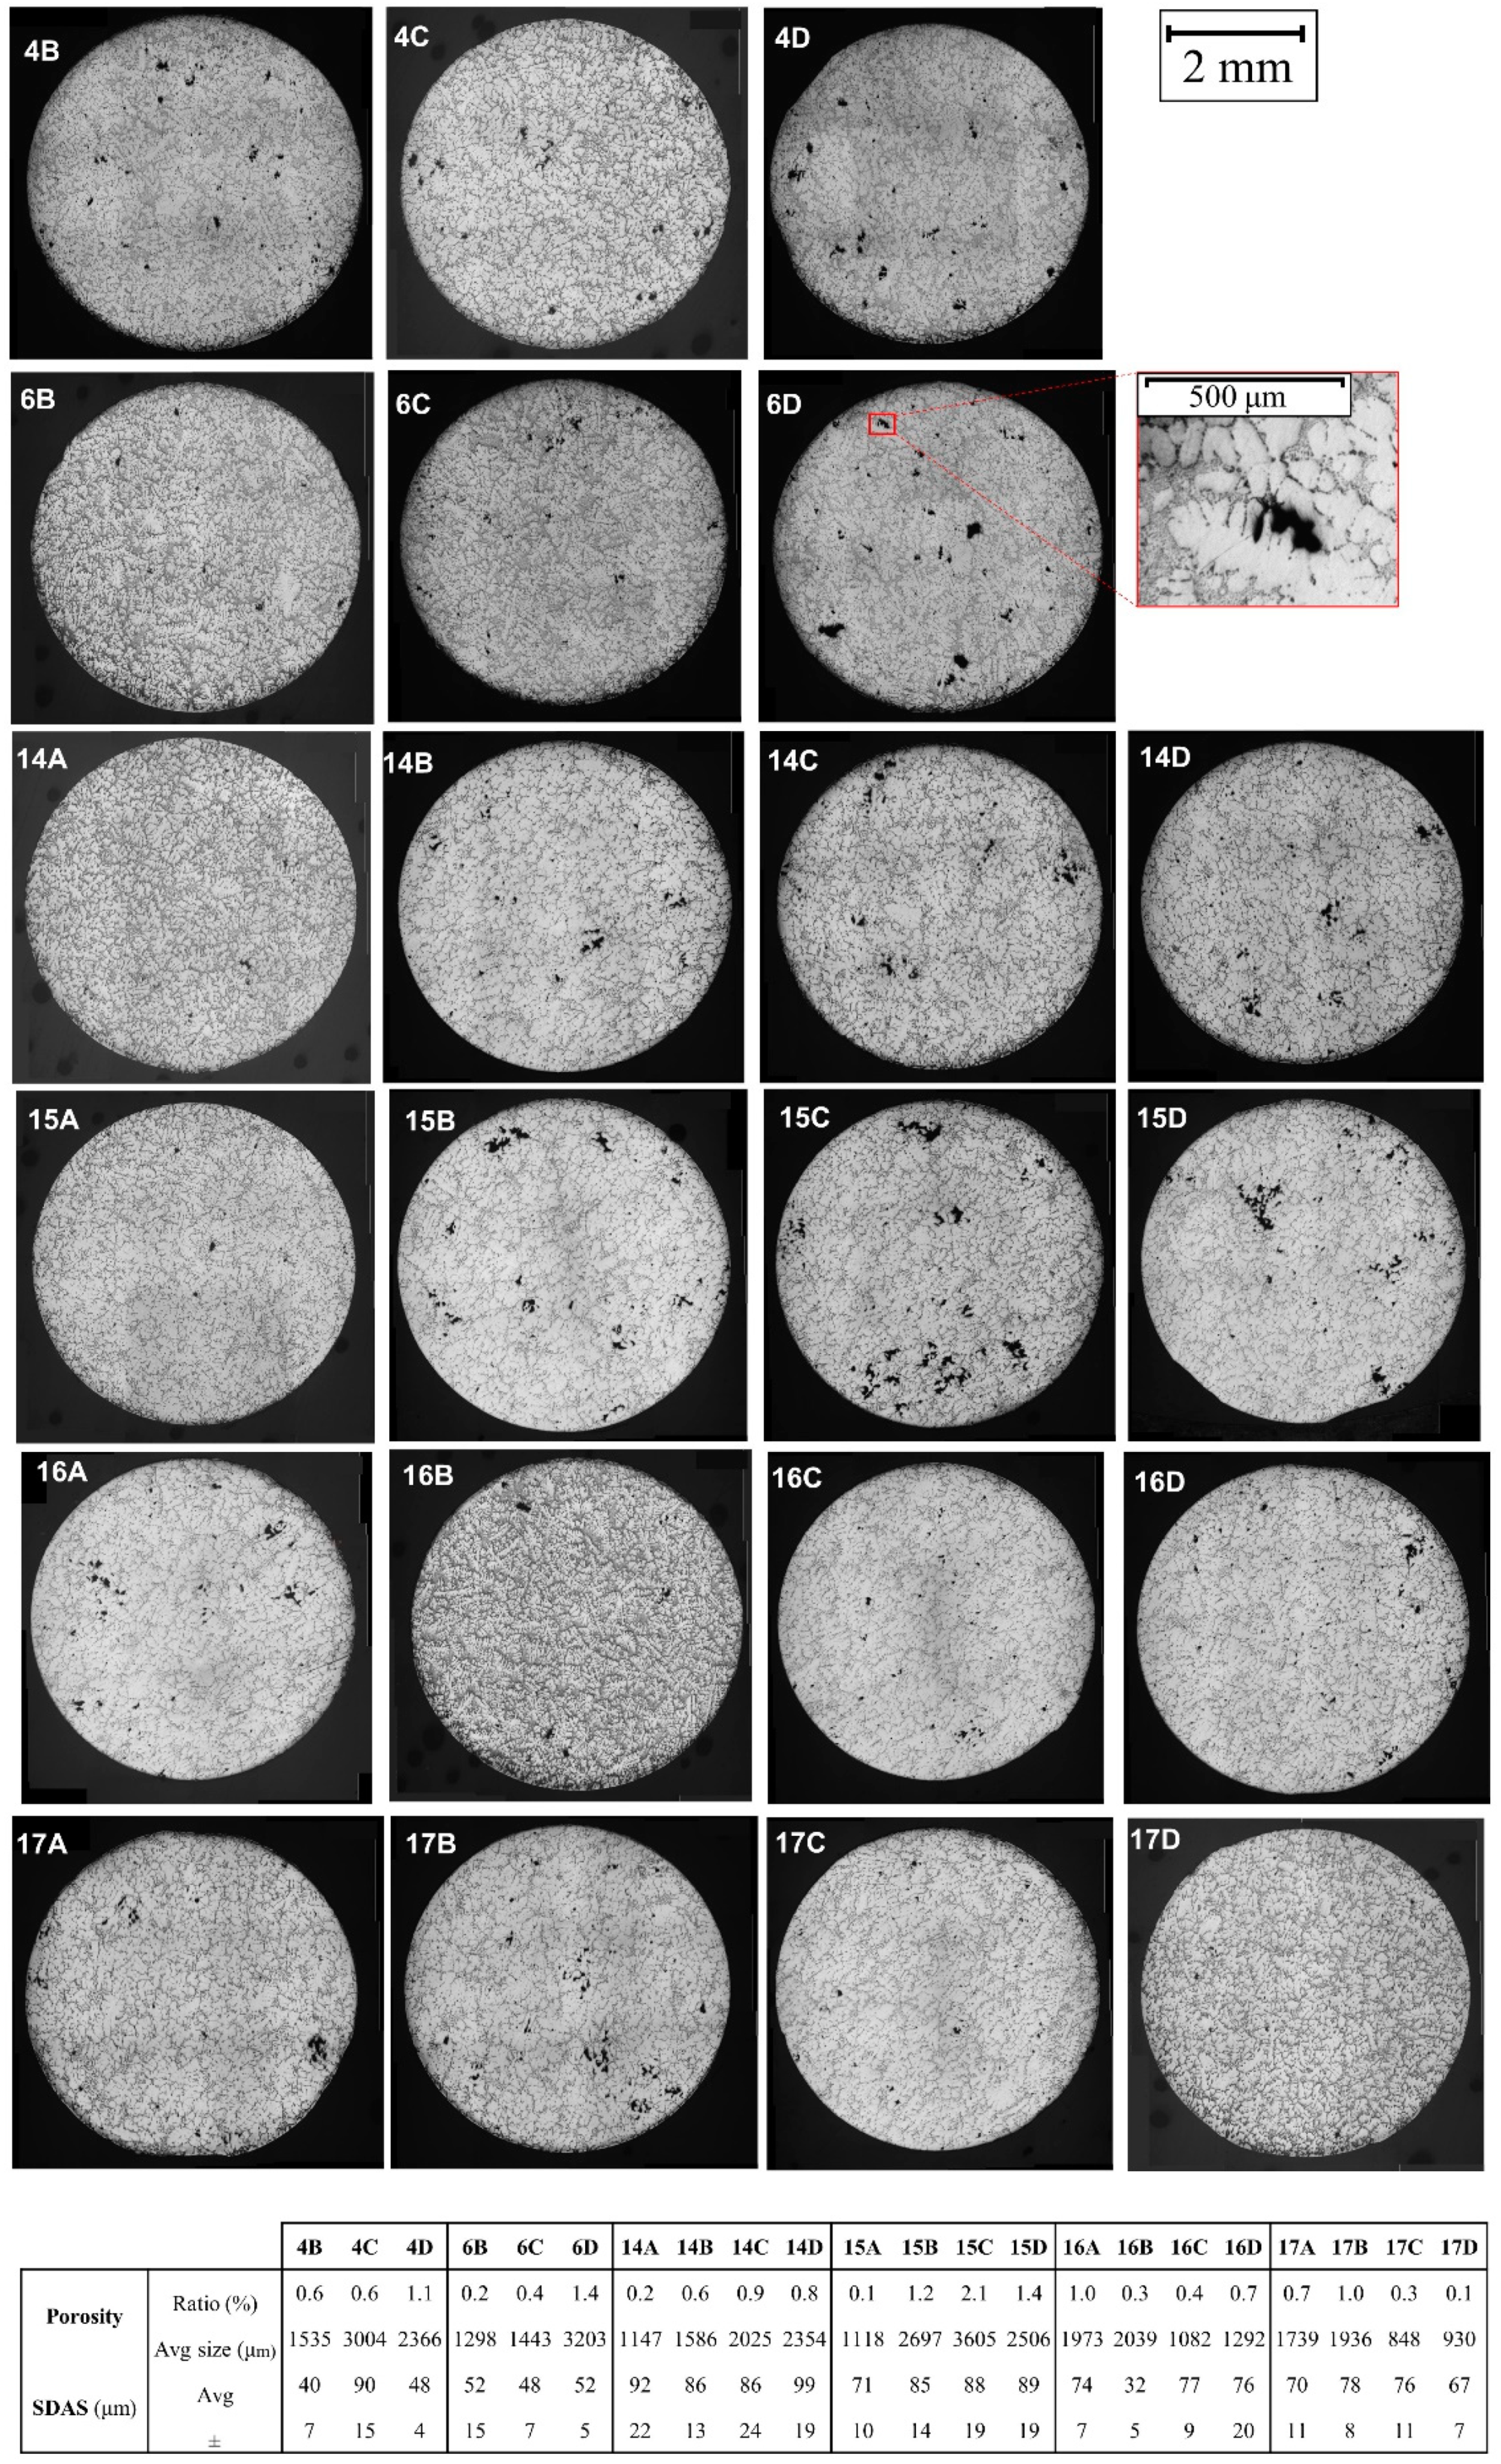
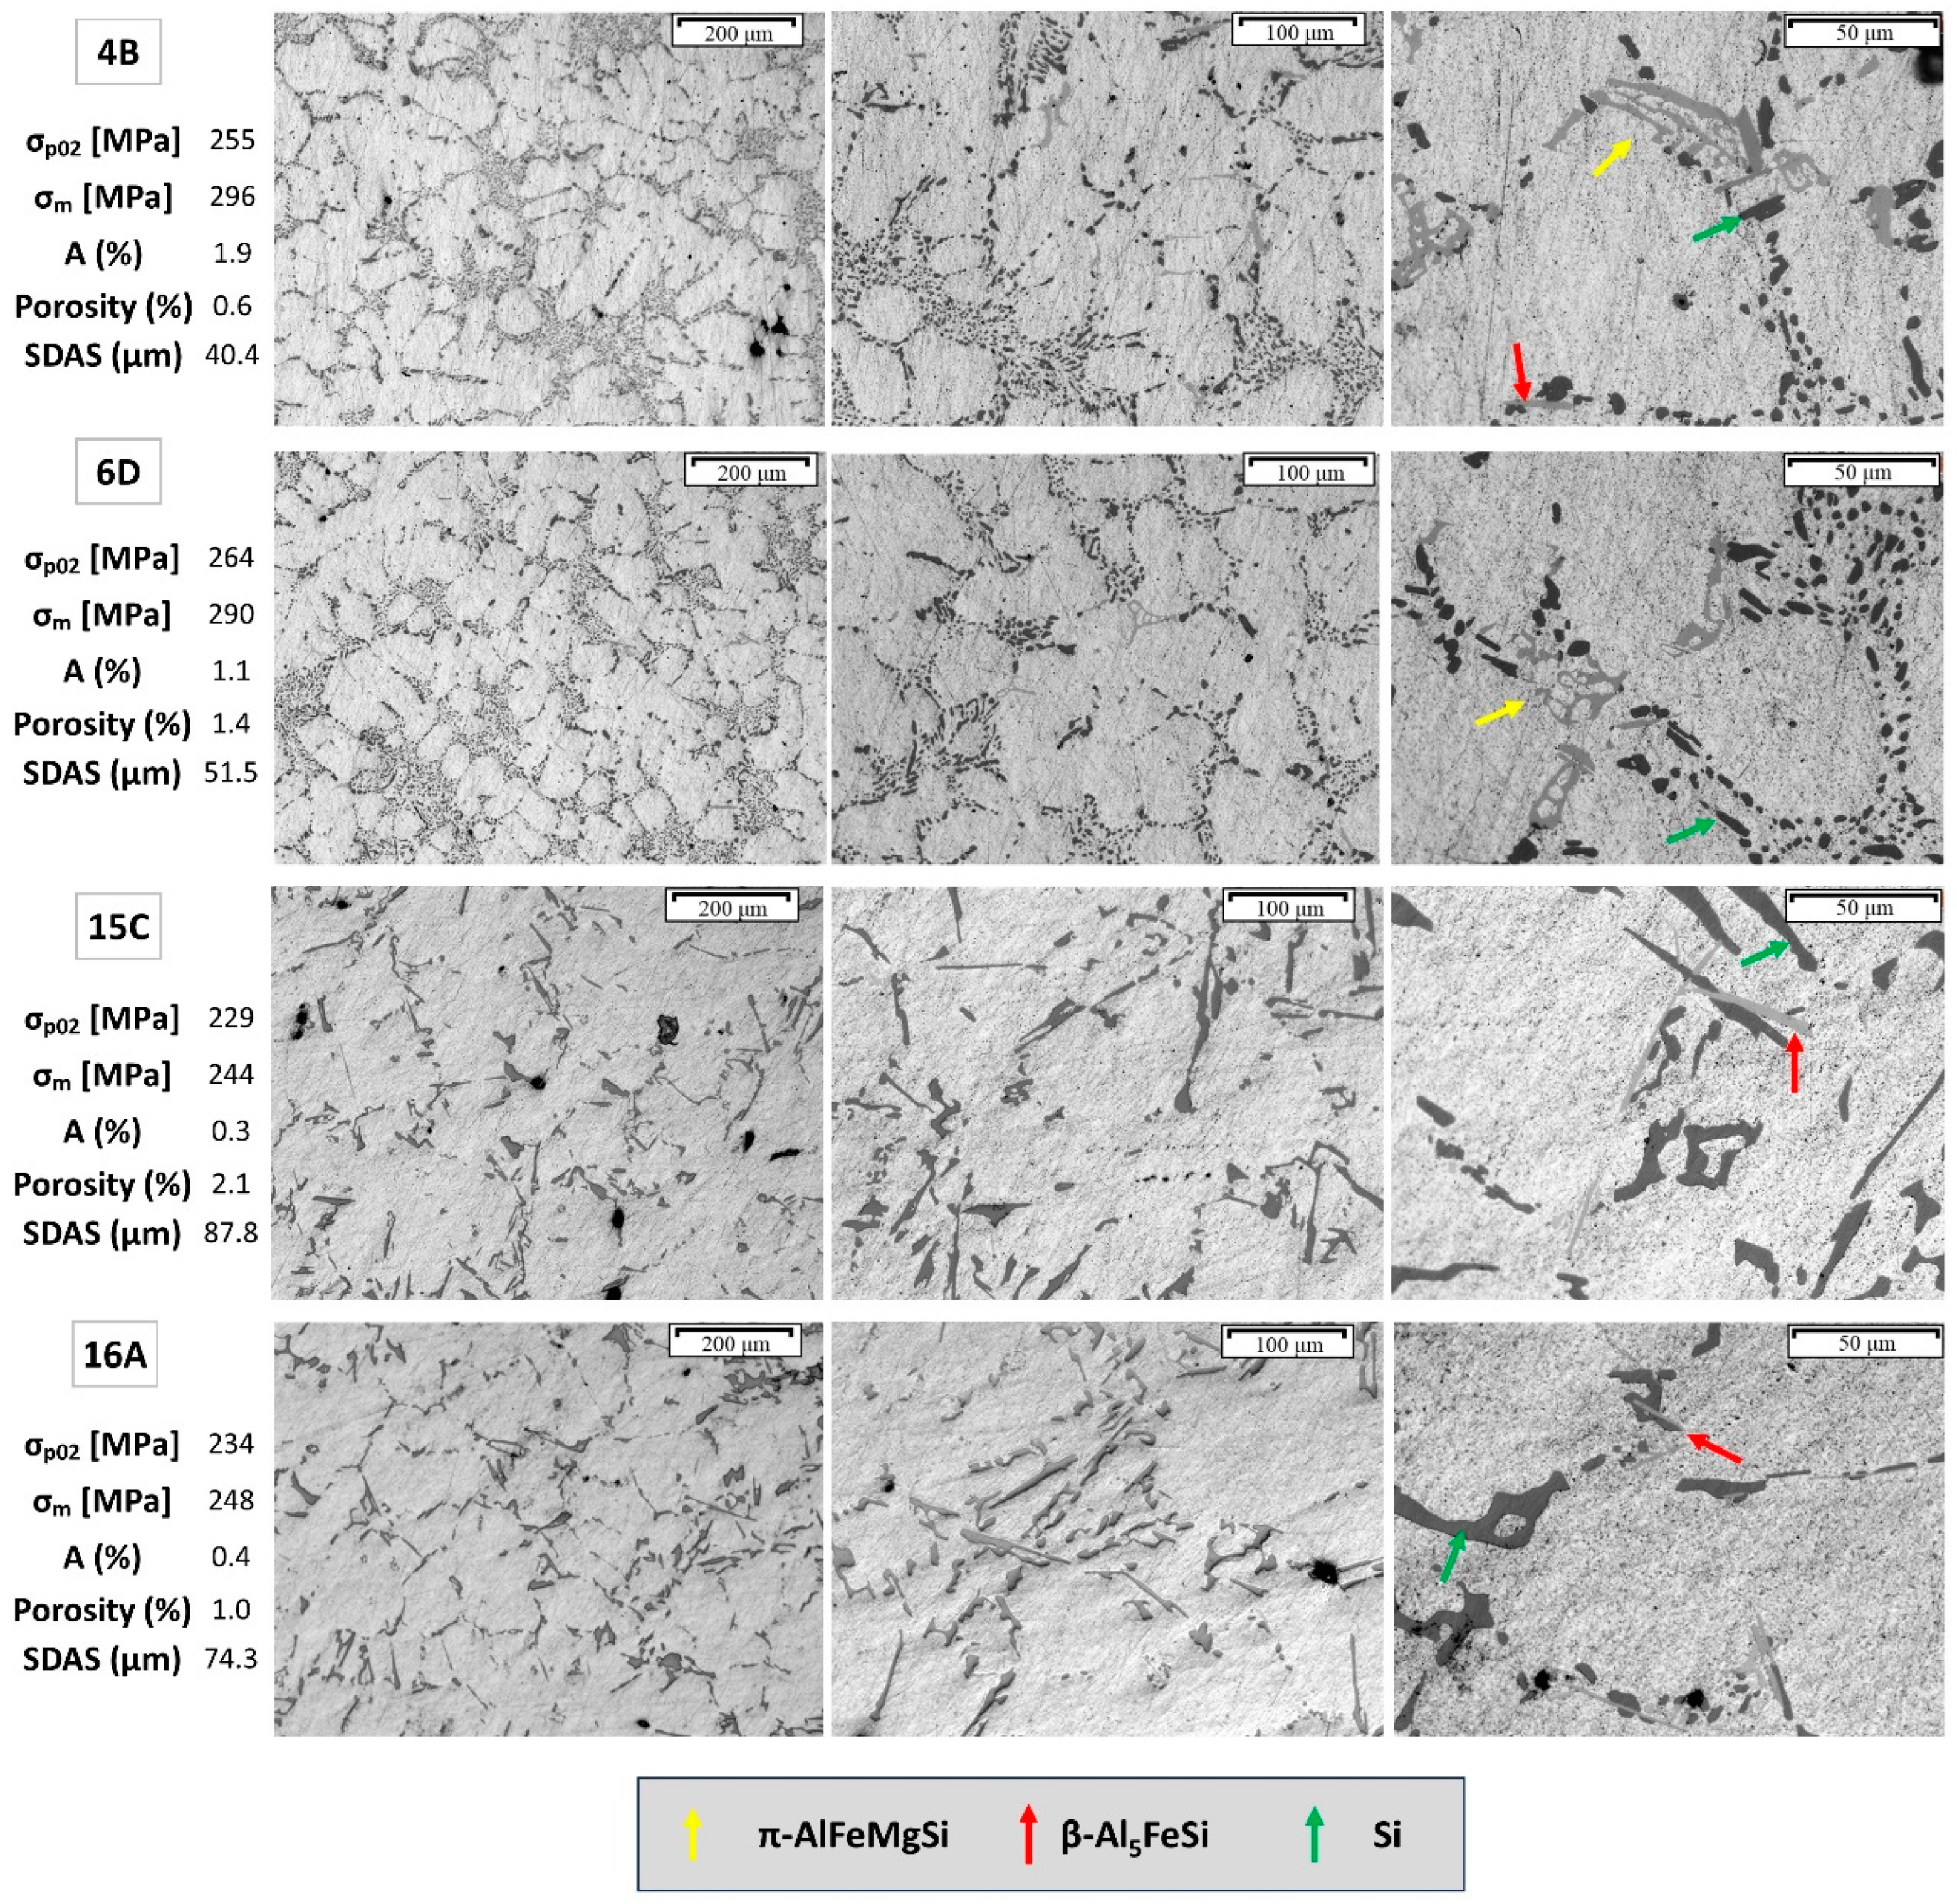
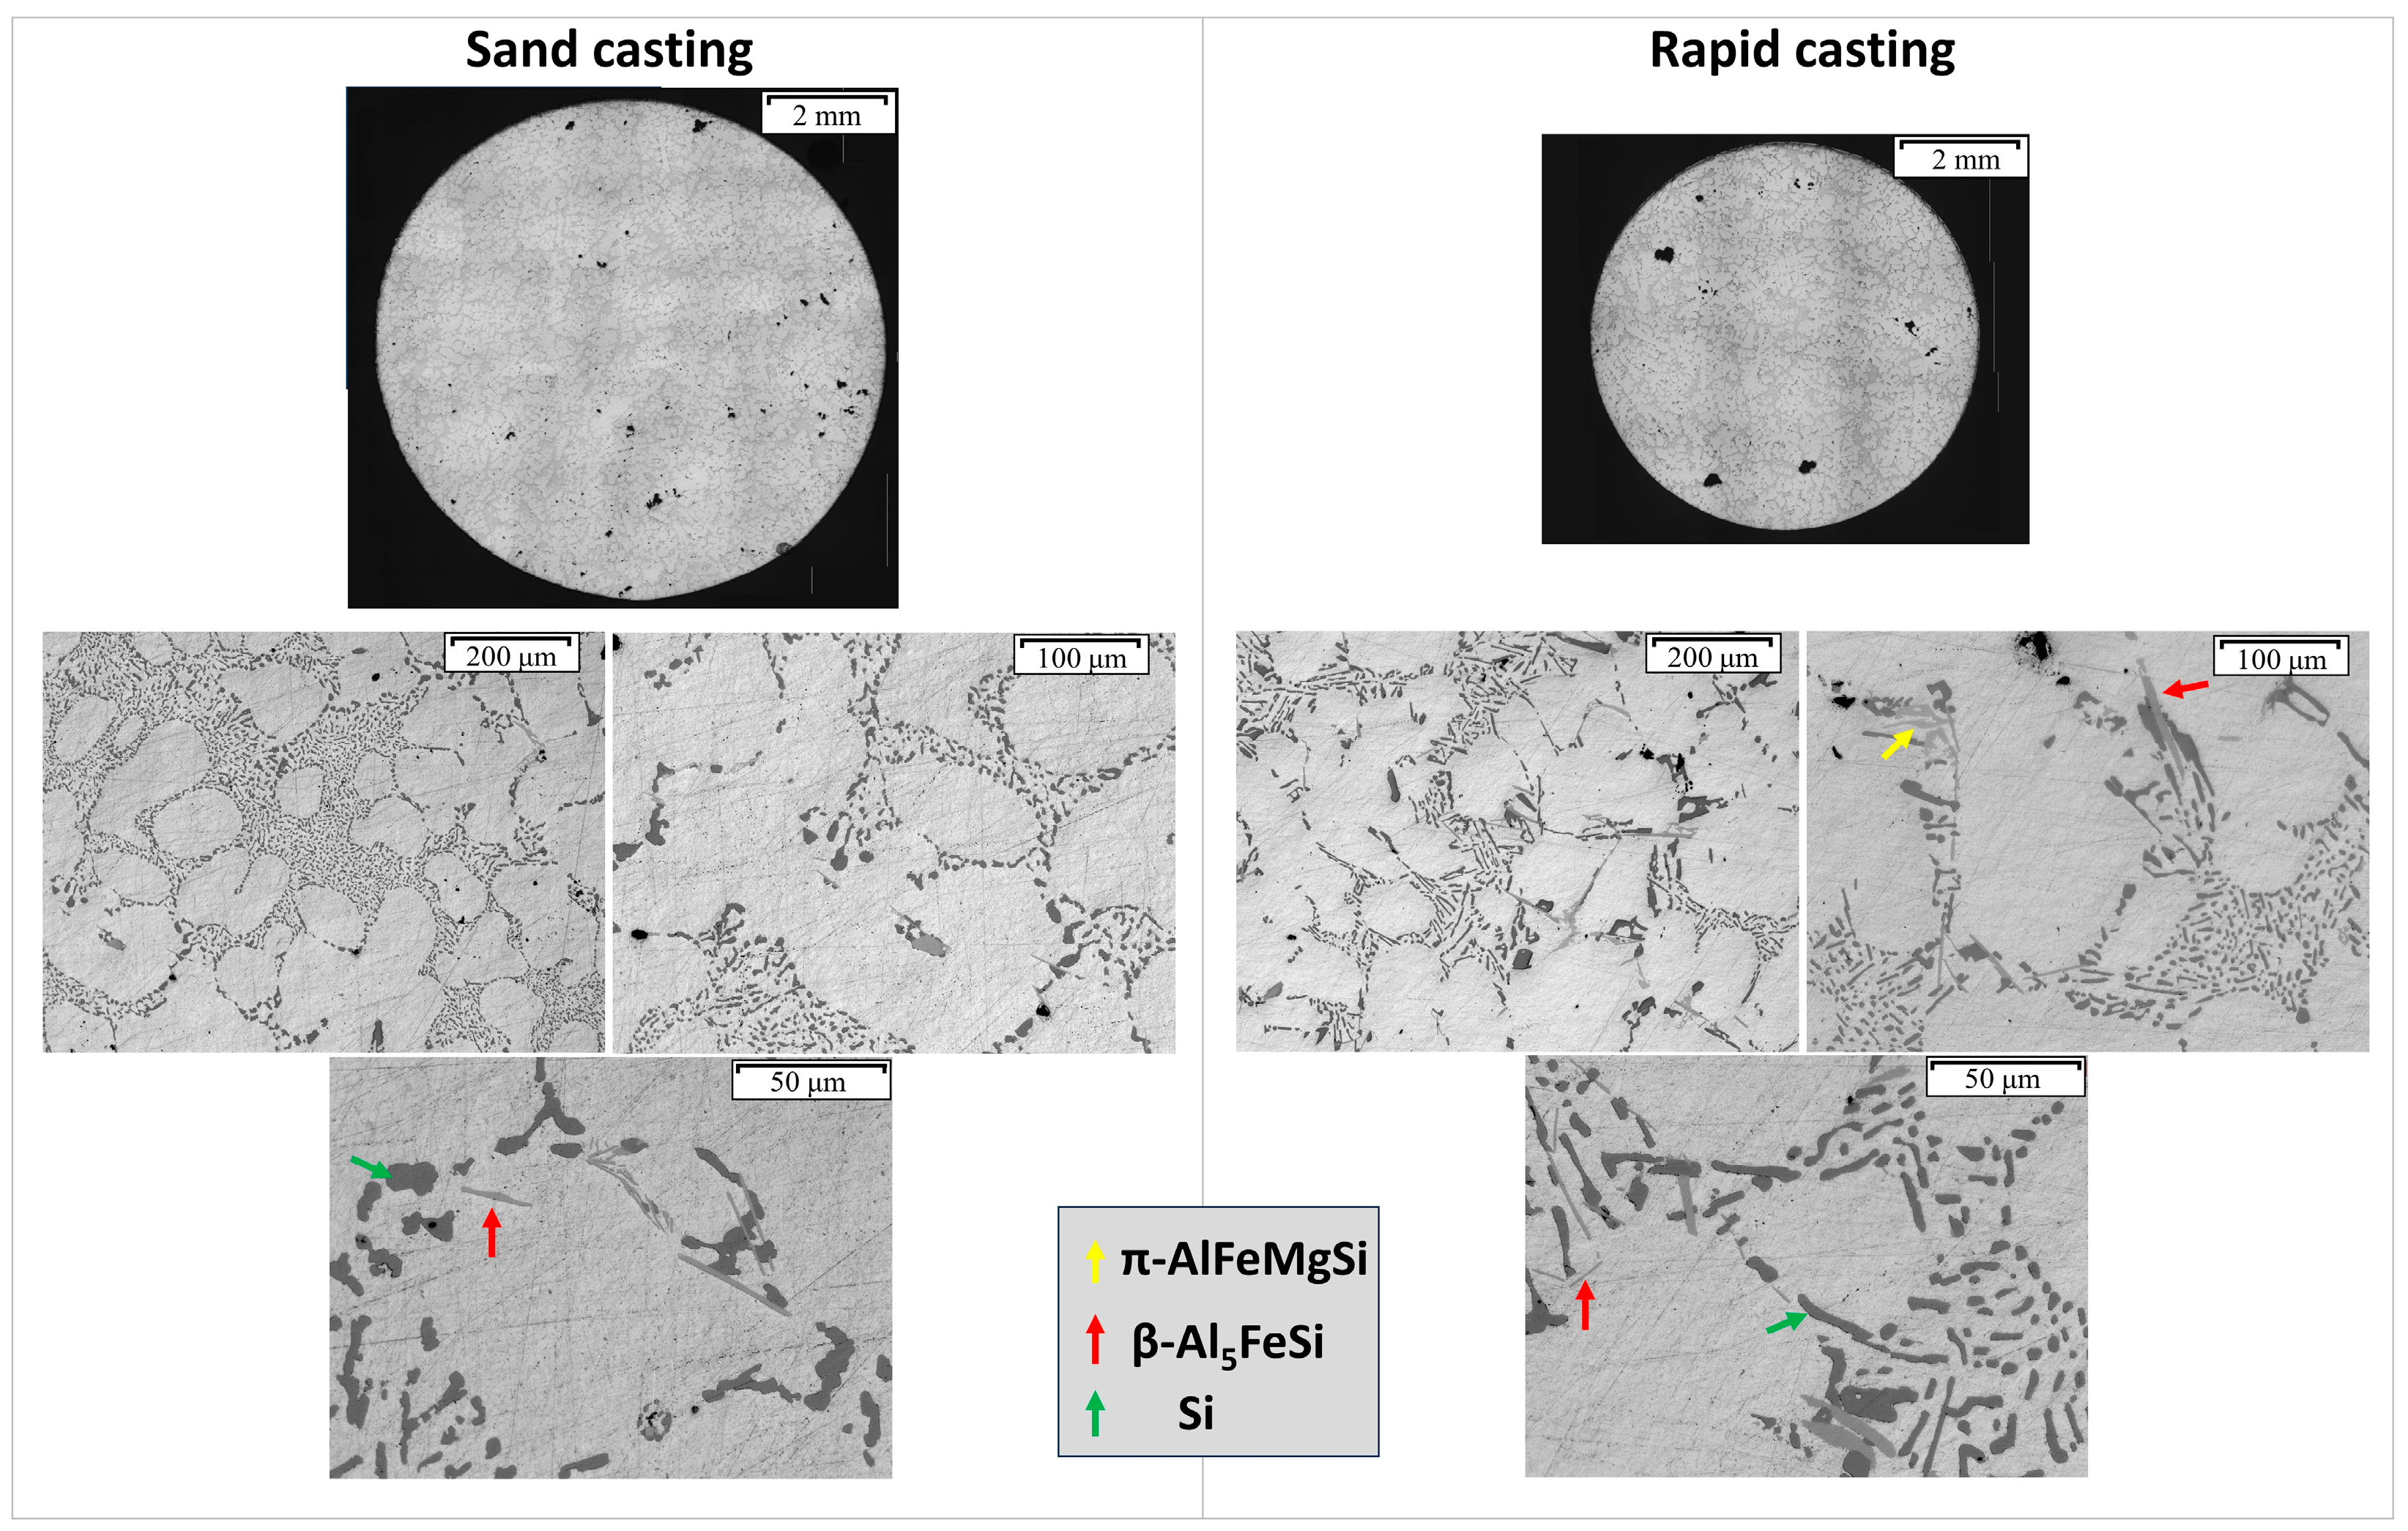
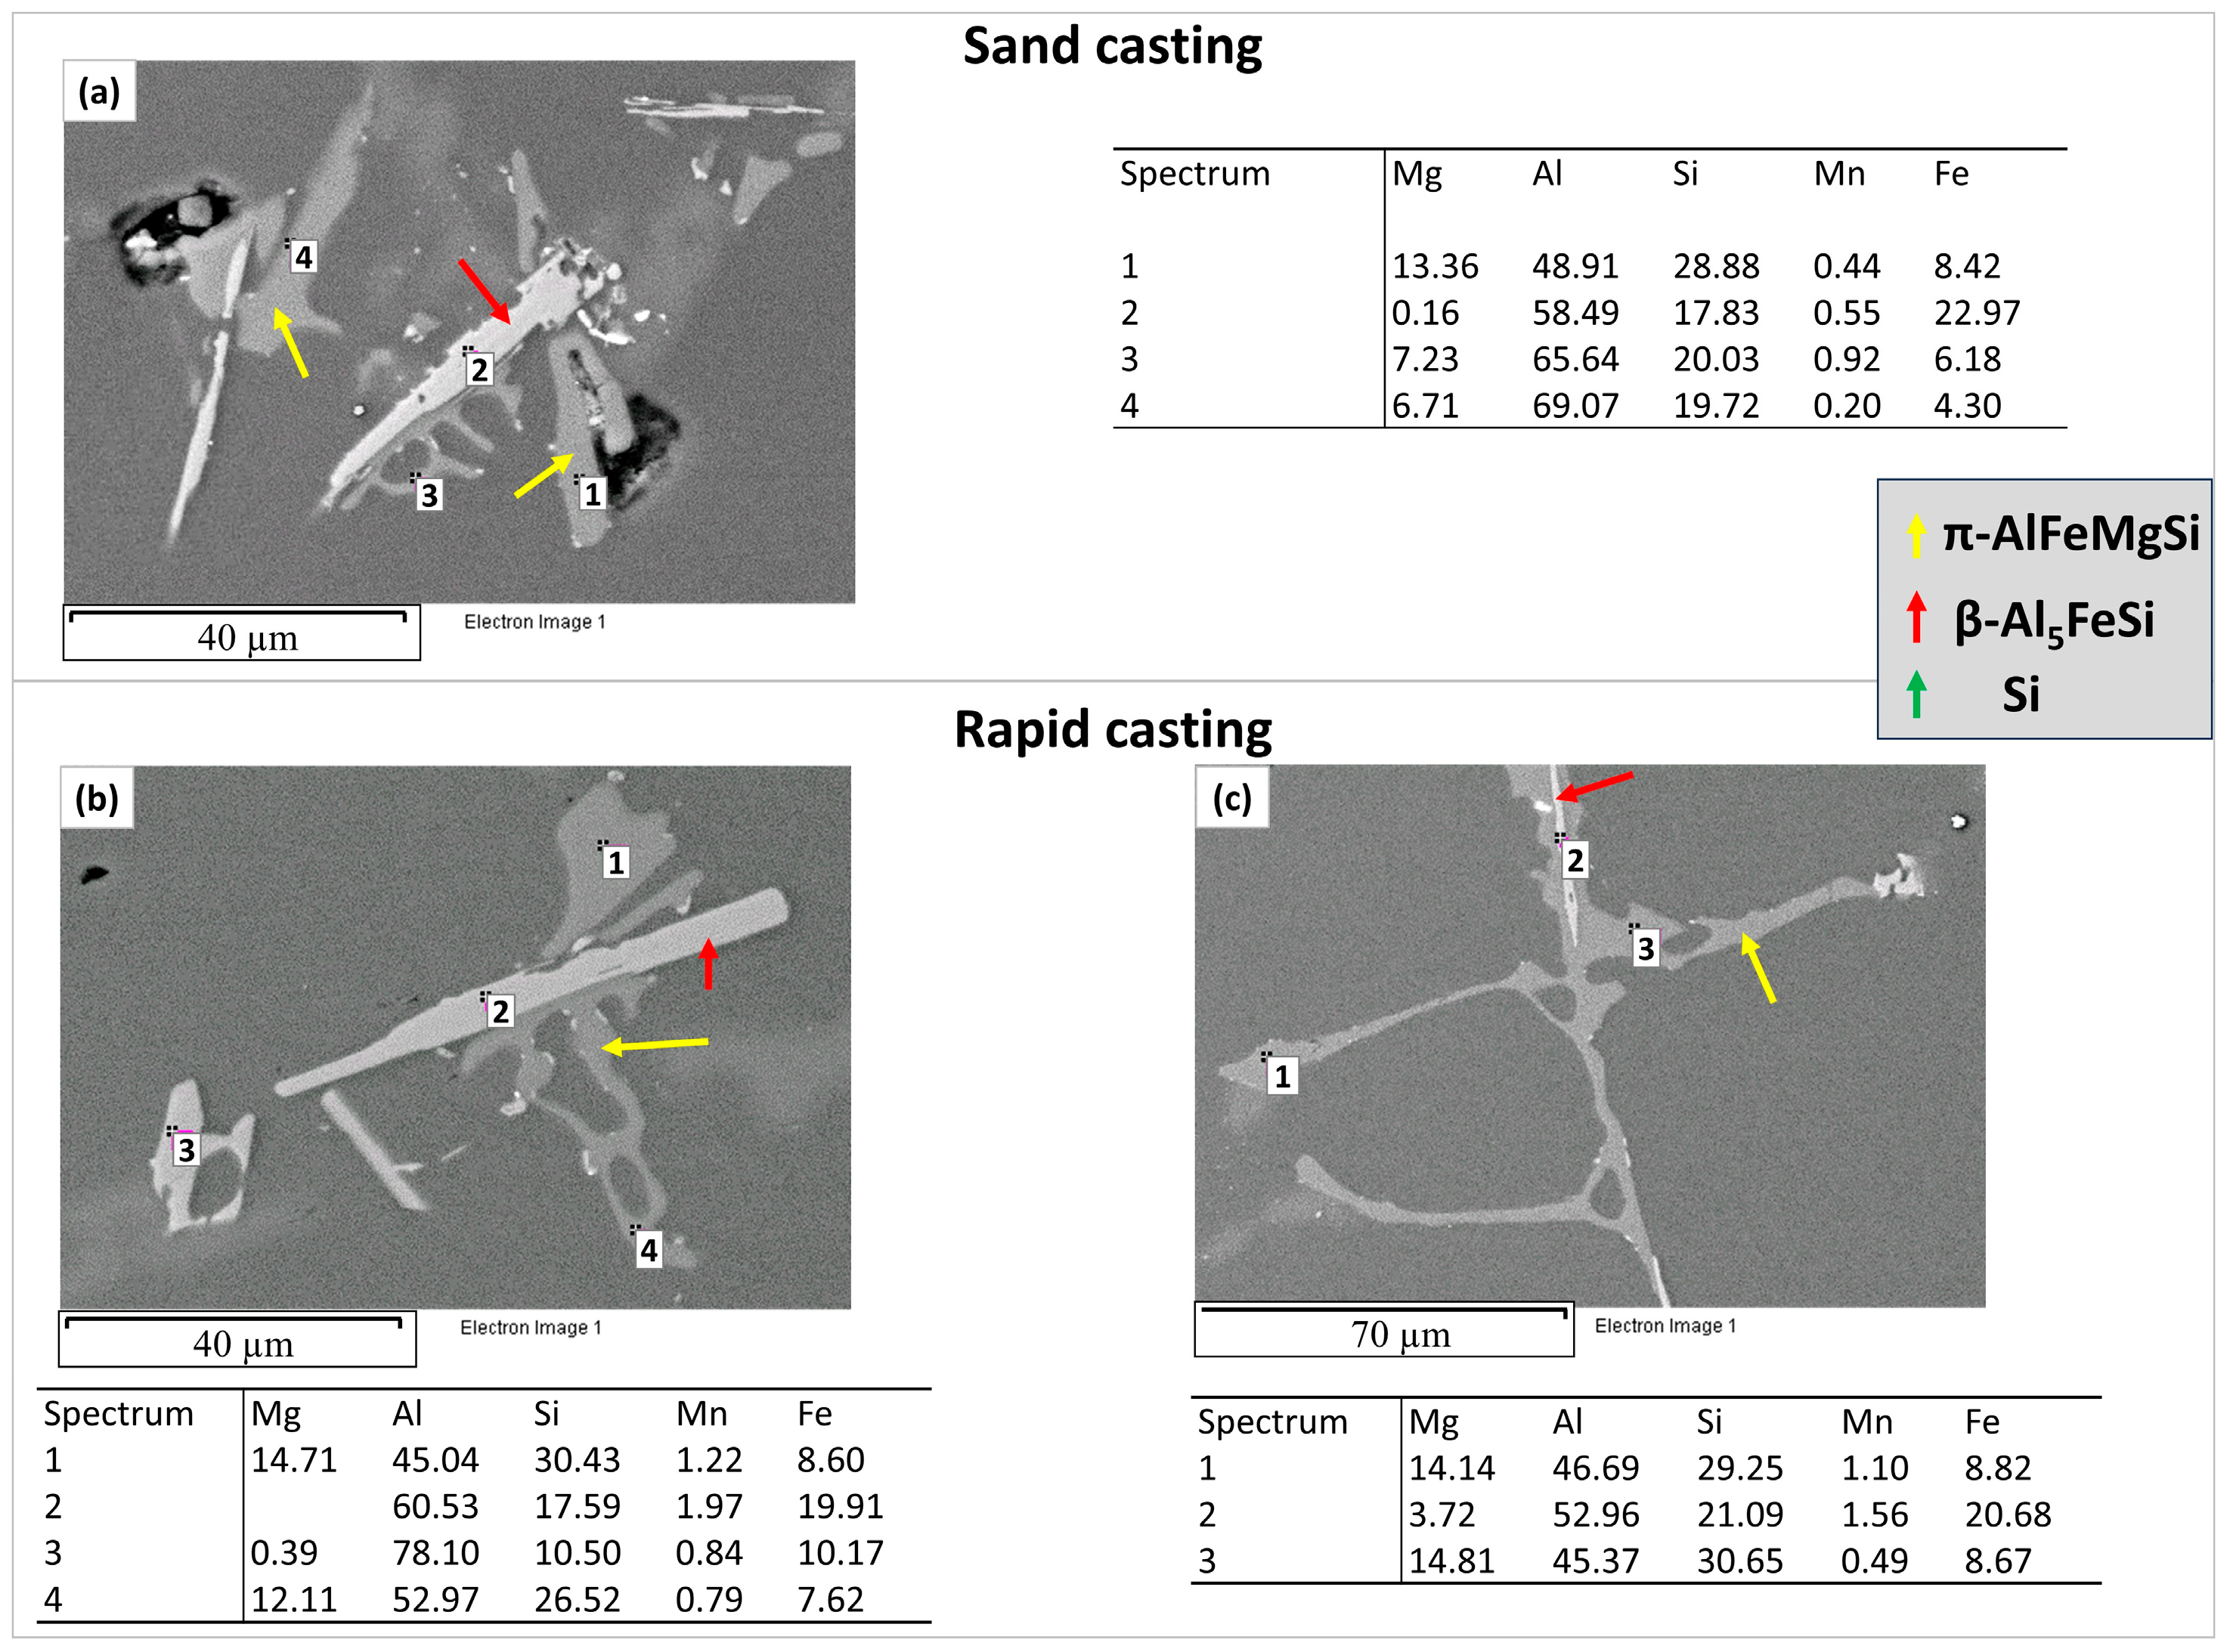
3.1. Metallographical Analysis
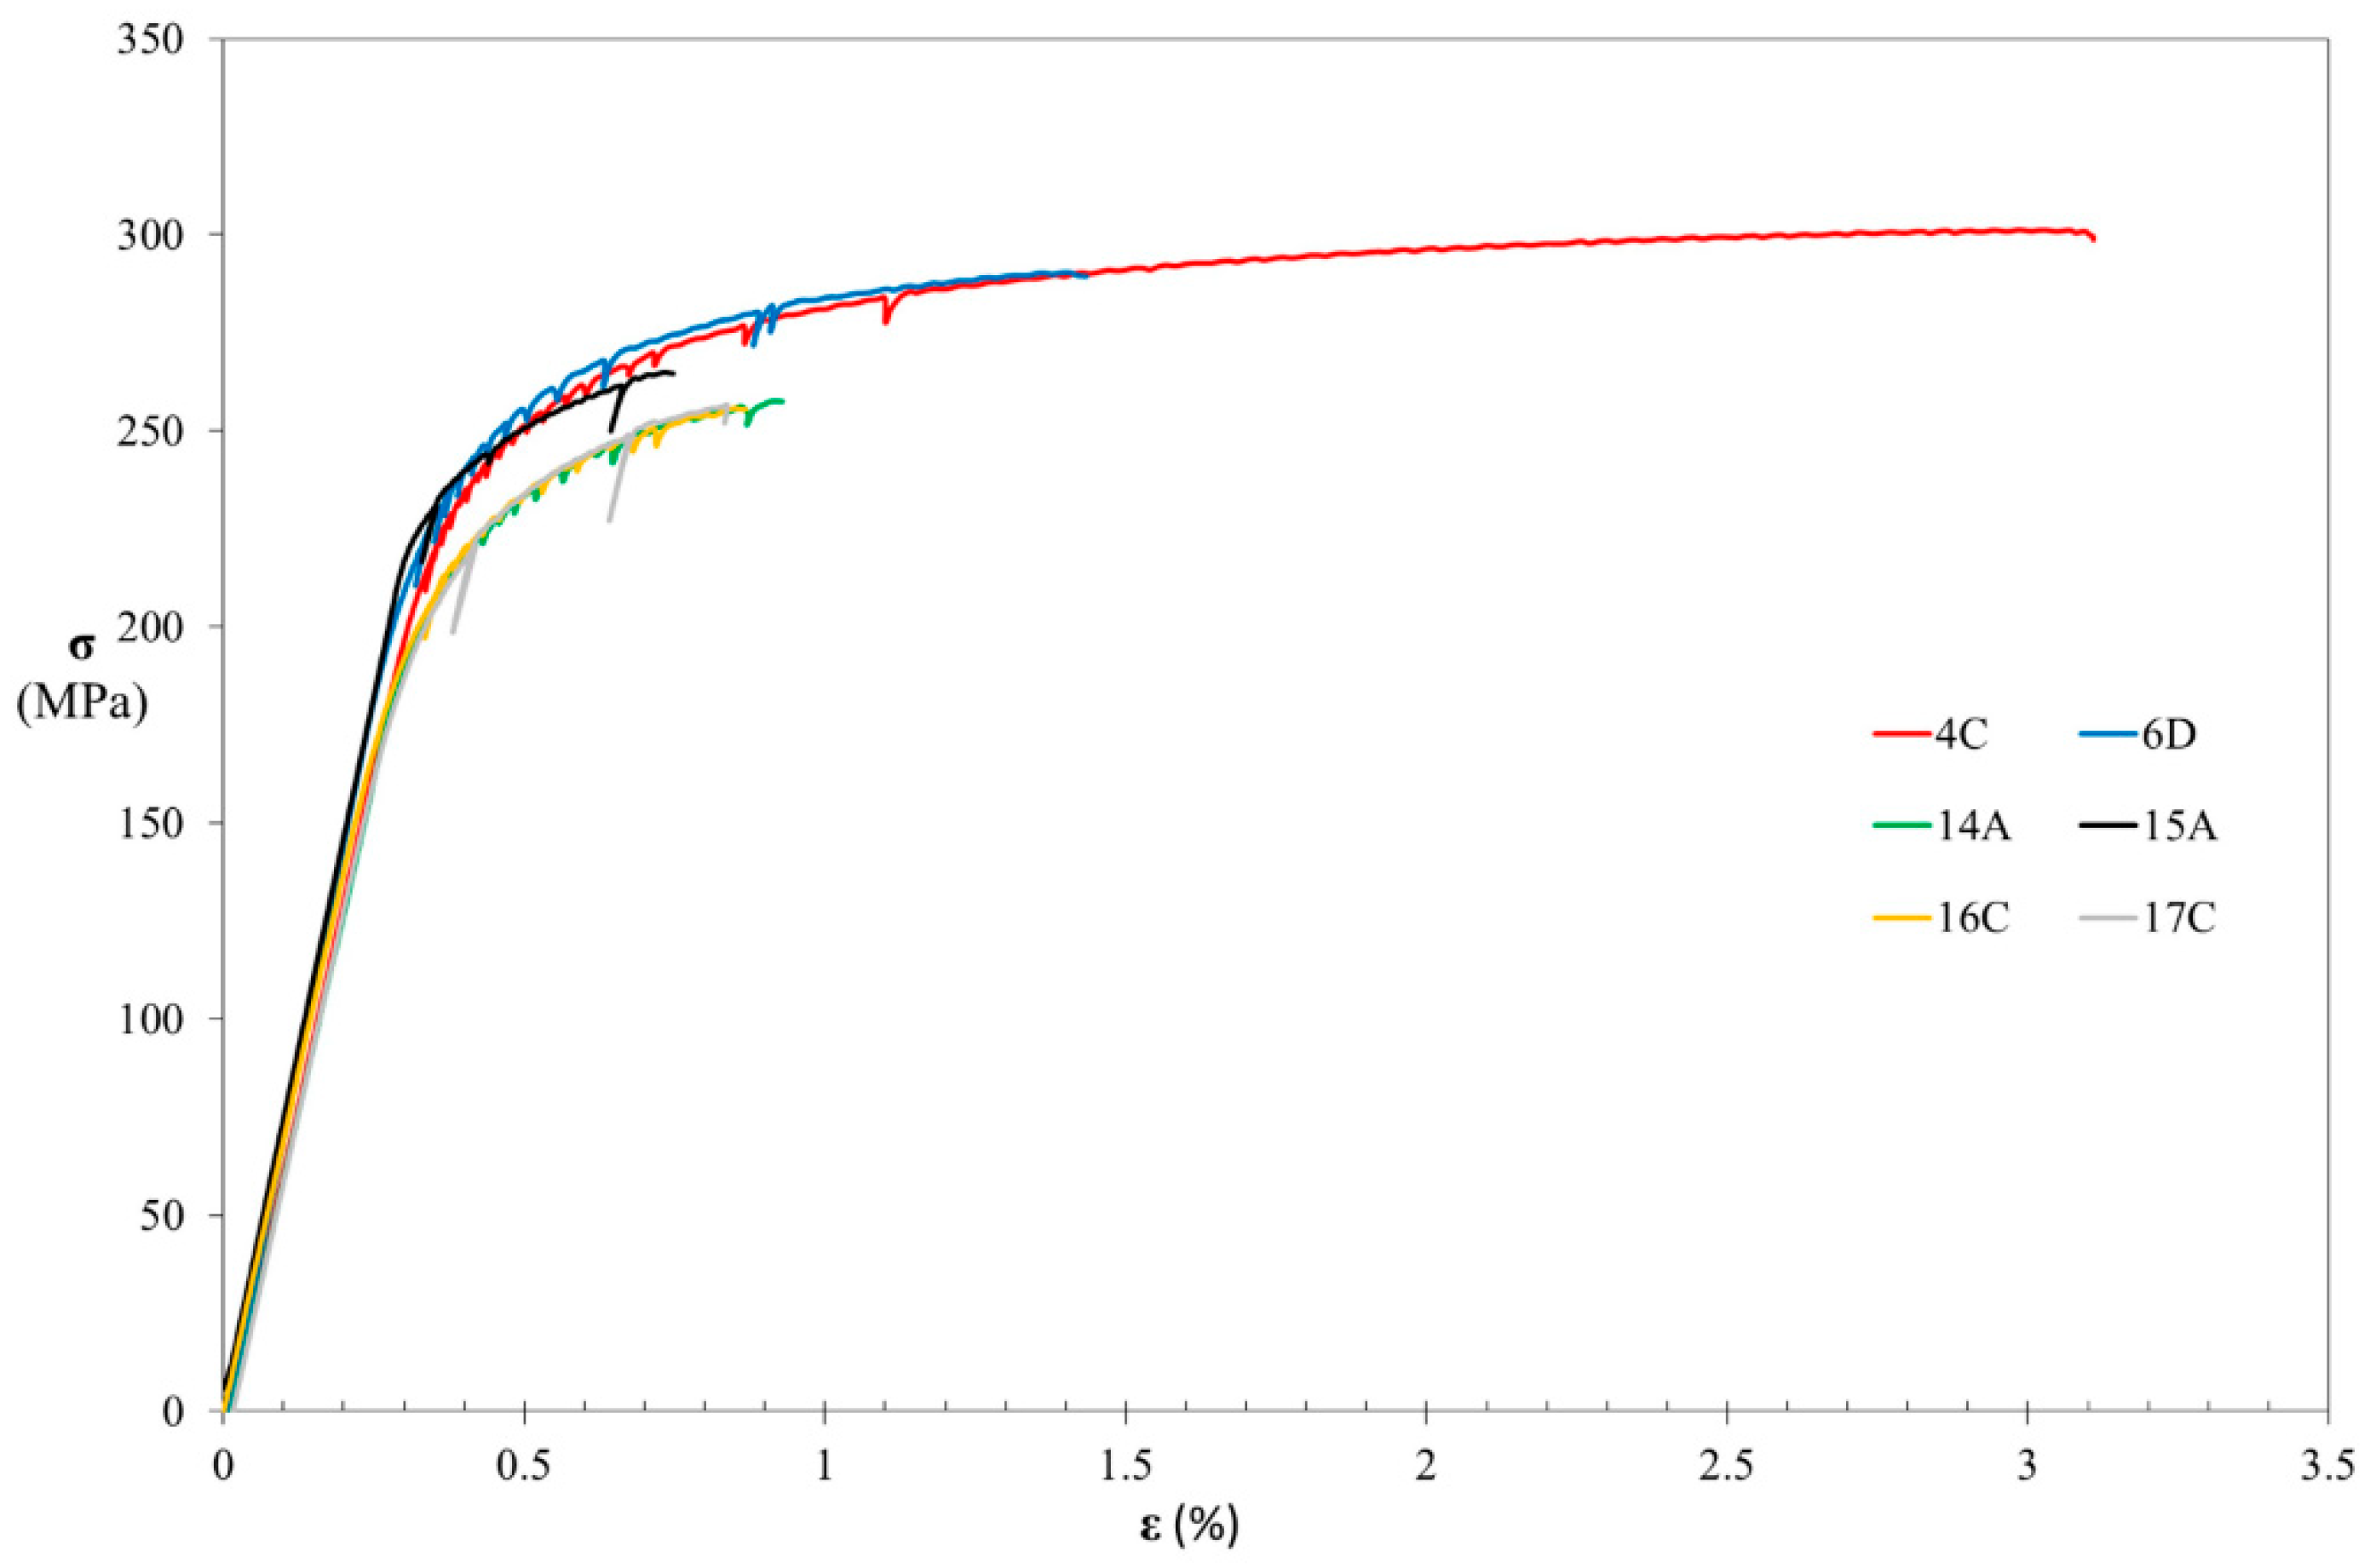
A representative X-ray radiographic image for each design of the components studied in the present research is presented in Figure 4. A focus on the areas identified for the extraction of the tensile tests is also reported, highlighting a slight presence of porosities (red arrows).
An illustrative compilation of optical micrographs, derived from approximately 15 images captured at a magnification of 40× for each RSC sample, is presented in Figure 5 to facilitate comparative analysis. The corresponding porosity ratio, porosity average size, and SDAS values, obtained from these micrographs analysis, are summarized in Figure 5. The Leica LAS 4.12 software tool was utilized to perform the following operations: the stabilization of image brightness and contrast, the isolation of cavity contours, and the application of a threshold filter. These operations facilitated the calculation of the percentage of area occupied by pores, which was then compared to the total surface area to obtain the surface porosity percentage. All specimens exhibit the characteristic microstructure of Al-Si casting, consisting of an α-aluminum dendrite matrix with eutectic silicon occupying the interdendritic regions. SDAS measurements are between 32 µm and 99 µm; these values are aligned with Snelling et al. [12], who found a SDAS range from 41.2 µm to 72.9 µm. Of particular interest is the observation that dendritic features are notably more pronounced, while SDAS values are comparatively lower in components labeled 4 and 6. This variation is attributed to reduced thicknesses, especially in the sample areas, in contrast to the other parts. Moreover, a variable range of porosity rate and sizes, from 0.1% to 2.1% and from 848 μm to 3605 μm, respectively, was discerned across the samples without any apparent correlation with component geometry or sampling position. The porosity rate found in the present work was coherent with the few studies retrieved: Gonzalez et al. [11] found a surface porosity of 1.63%, while Snelling et al. [12] revealed a mean value of 1.59%. Shrinkage is the most common type of porosity detected in the cross sections analyzed during the present research. A representative example of the morphology observed is reported in Figure 5 (please see the red area focused on 6D sample). A rough and irregular shape, branching within the interdentritic space, is revealed, confirming the typical features of shrinkage porosity. Both macro- and microporosity were observed. It is relevant to remember that macroporosity refers to pores with a diameter in the millimeter to centimeter scale, while microporosity refers to porosity with a radius less than 500 µm [26]. These defects are very common in aluminum castings. Their formation occurs during mushy zone solidification when the liquid melt can no longer feed the volume contraction of the metal alloy [27,28]. For aluminum silicon alloys, this mechanism is usually found in the interdendritic space.
Figure 6 reports the optical microstructure of EN AC 42100-T6 RSC at higher magnifications, showcasing both representative thinnest (4–6) and thickest (15–16) components. The microstructure is composed of α-aluminum matrix, Al-Si eutectic (indicated by green arrows), β-Al5FeSi platelets (highlighted by red arrows), and π-AlFeMgSi Chinese script precipitates (denoted by yellow arrows). These microstructural observations accentuate the finer microstructural characteristics of the thinnest RSC samples. Notably, it is evident that both dendrites and silicon exhibit finer features in samples 4B and 6D. Conversely, the presence of coarser Al-Si platelets in the thickest components (15C-16A) are likely attributed to a reduction in the modification effect as the SDAS decreases due to the cooling rate decrease. The same consideration was also observed in other studies reported in the literature [19,20,21,22]. The β-Al5FeSi platelets and π-AlFeMgSi Chinese script precipitates exhibit similar morphology, amount, and dimensions across all samples, suggesting that they are unlikely to significantly contribute to variations in mechanical behavior.
Furthermore, Figure 7 presents a comparison of the optical microstructure of EN AC 42100-T6 SC and RSC. Specifically, a representative specimen for each manufacturing technology, extracted from components with identical geometries, is included for comparative analysis. Overall, there is an evident similarity in the observed characteristics, including SDAS, the percentage of porosity, and microstructural constituents between the two techniques. The precipitates identified, such as β-Al5FeSi and π-AlFeMgSi, exhibit consistent morphology and distribution regardless of the manufacturing method. From the highest magnifications of Figure 7, only a slight qualitative difference can be observed in the aspect of Al-Si eutectic phase, which visually appears more rounded in SC specimens compared to those produced via RSC.
Figure 8 reports a comparison of SEM micrographs conducted on the same EN AC 42100-T6 SC and RSC specimens analyzed in Figure 7 optical microstructures. SEM investigations and EDS analysis confirmed the previously described microstructure, identifying the intermetallics, coherently with the literature [29,30], as β-Al5FeSi phase (red arrow) and π-AlFeMgSi Chinese script (yellow arrow). Please note that even if π-AlFeMgSi is a Fe-rich intermetallic that may cause the embrittlement of the alloy, the conversion of the needle-like β-AlFeSi phase into the Chinese script π-AlFeMgSi reduces the deleterious effects of the former on mechanical properties [30]. This mechanism is known to occur with the increase in Mg content in the presence of Fe [31]. During the present investigations, a π-AlFeMgSi phase growing from β-Al5FeSi can be clearly distinguished, as can be observed in all the micrographs reported in Figure 8. These analyses confirmed the previous comments gathered from OM.

3.2. Tensile Tests

Table 2 presents comprehensive data derived from tensile tests conducted on all EN AC 42100-T6 RSC specimens. These include detailed values of yield strength (σy), ultimate tensile strength (σm), and elongation at break (A%). Additionally, to provide a complete comparison of the mechanical response related to different designs and the associated microstructural features, porosity (P) rate and average size and SDAS, determined through the metallurgical examinations described in Section 3.1, are reported in Table 2. Table 3 summarizes the properties extracted from Table 2, presenting average values for the three distinct designs of the EN AC 42100-T6 RSC components (referred to as “4–6”, “14–15”, and “16–17”, consistently with their description in Figure 1). Figure 9 illustrates a tensile curve for each characterized component. To enhance clarity, only one curve per component is included, selected based on the highest yield strength as the criterion for selection. The tensile test results revealed higher mechanical properties for all the samples machined from the thinnest design (4–6 series) compared to both 14–15 and 16–17 designs. This relation is consistent with the SDAS measurements, which were lower for all the thinnest samples. It is worthwhile to note that this relationship between SDAS and mechanical properties has been established in traditional casting processes and is confirmed here for RSC [18]. The lower elongation at failure observed for the thicker parts (named 14 to 17) compared to the thinnest (named 4–6) can be attributed to a decrease in the effect of silicon modification for higher wall thicknesses, due to the cooling rate decrease. This is in line with the theories pertaining to traditional casting processes [19,20,21,22]. Indeed, microstructural observations confirmed the presence of coarser Al-Si needles for the thickest components. The mechanical properties values found during the present work could not be compared with the literature, due to the absence of specific bibliography on this specific process and alloy. Furthermore, a significant presence of porosity was confirmed in almost all the samples related to the RSC process under investigation. These porosities, along with other factors previously discussed, play a fundamental role in reducing elongation at fracture. It is worthwhile to note that the highest elongation at fracture values are achieved in conditions with relatively low levels of porosity (e.g., 4B, 4C, and 6B). The variation in the average size of porosity, in the range of values under considerations, seems not to affect the mechanical properties.
Table 4 provides a summary of average σy, σm, and A% values for EN AC 42100-T6, comparing results from both RSC and SC processes. Specifically, the table presents average values for RSC specimens, including both the 4–6 components individually and the overall tested samples, for the purpose of comparison. It is important to note that the design used for the sand-cast components corresponds to that of the 4–6 RSC parts. Observing the table, it becomes evident that RSC exhibits higher yield strength and stress at brake compared to SC. Conversely, elongation at fracture and porosity levels are comparable between the two methods. It is worthwhile to note that RSC shows a higher Mg content (as indicated in Table 1) that may contribute to the observed increase in yield strength. Moreover, the results reaffirm that the lower elongation at fracture is generally associated with processes utilizing sand molds, regardless of the technology employed for their realization. Consequently, from a mechanical characterization perspective, RSC demonstrates potential utility in the prototyping phase.

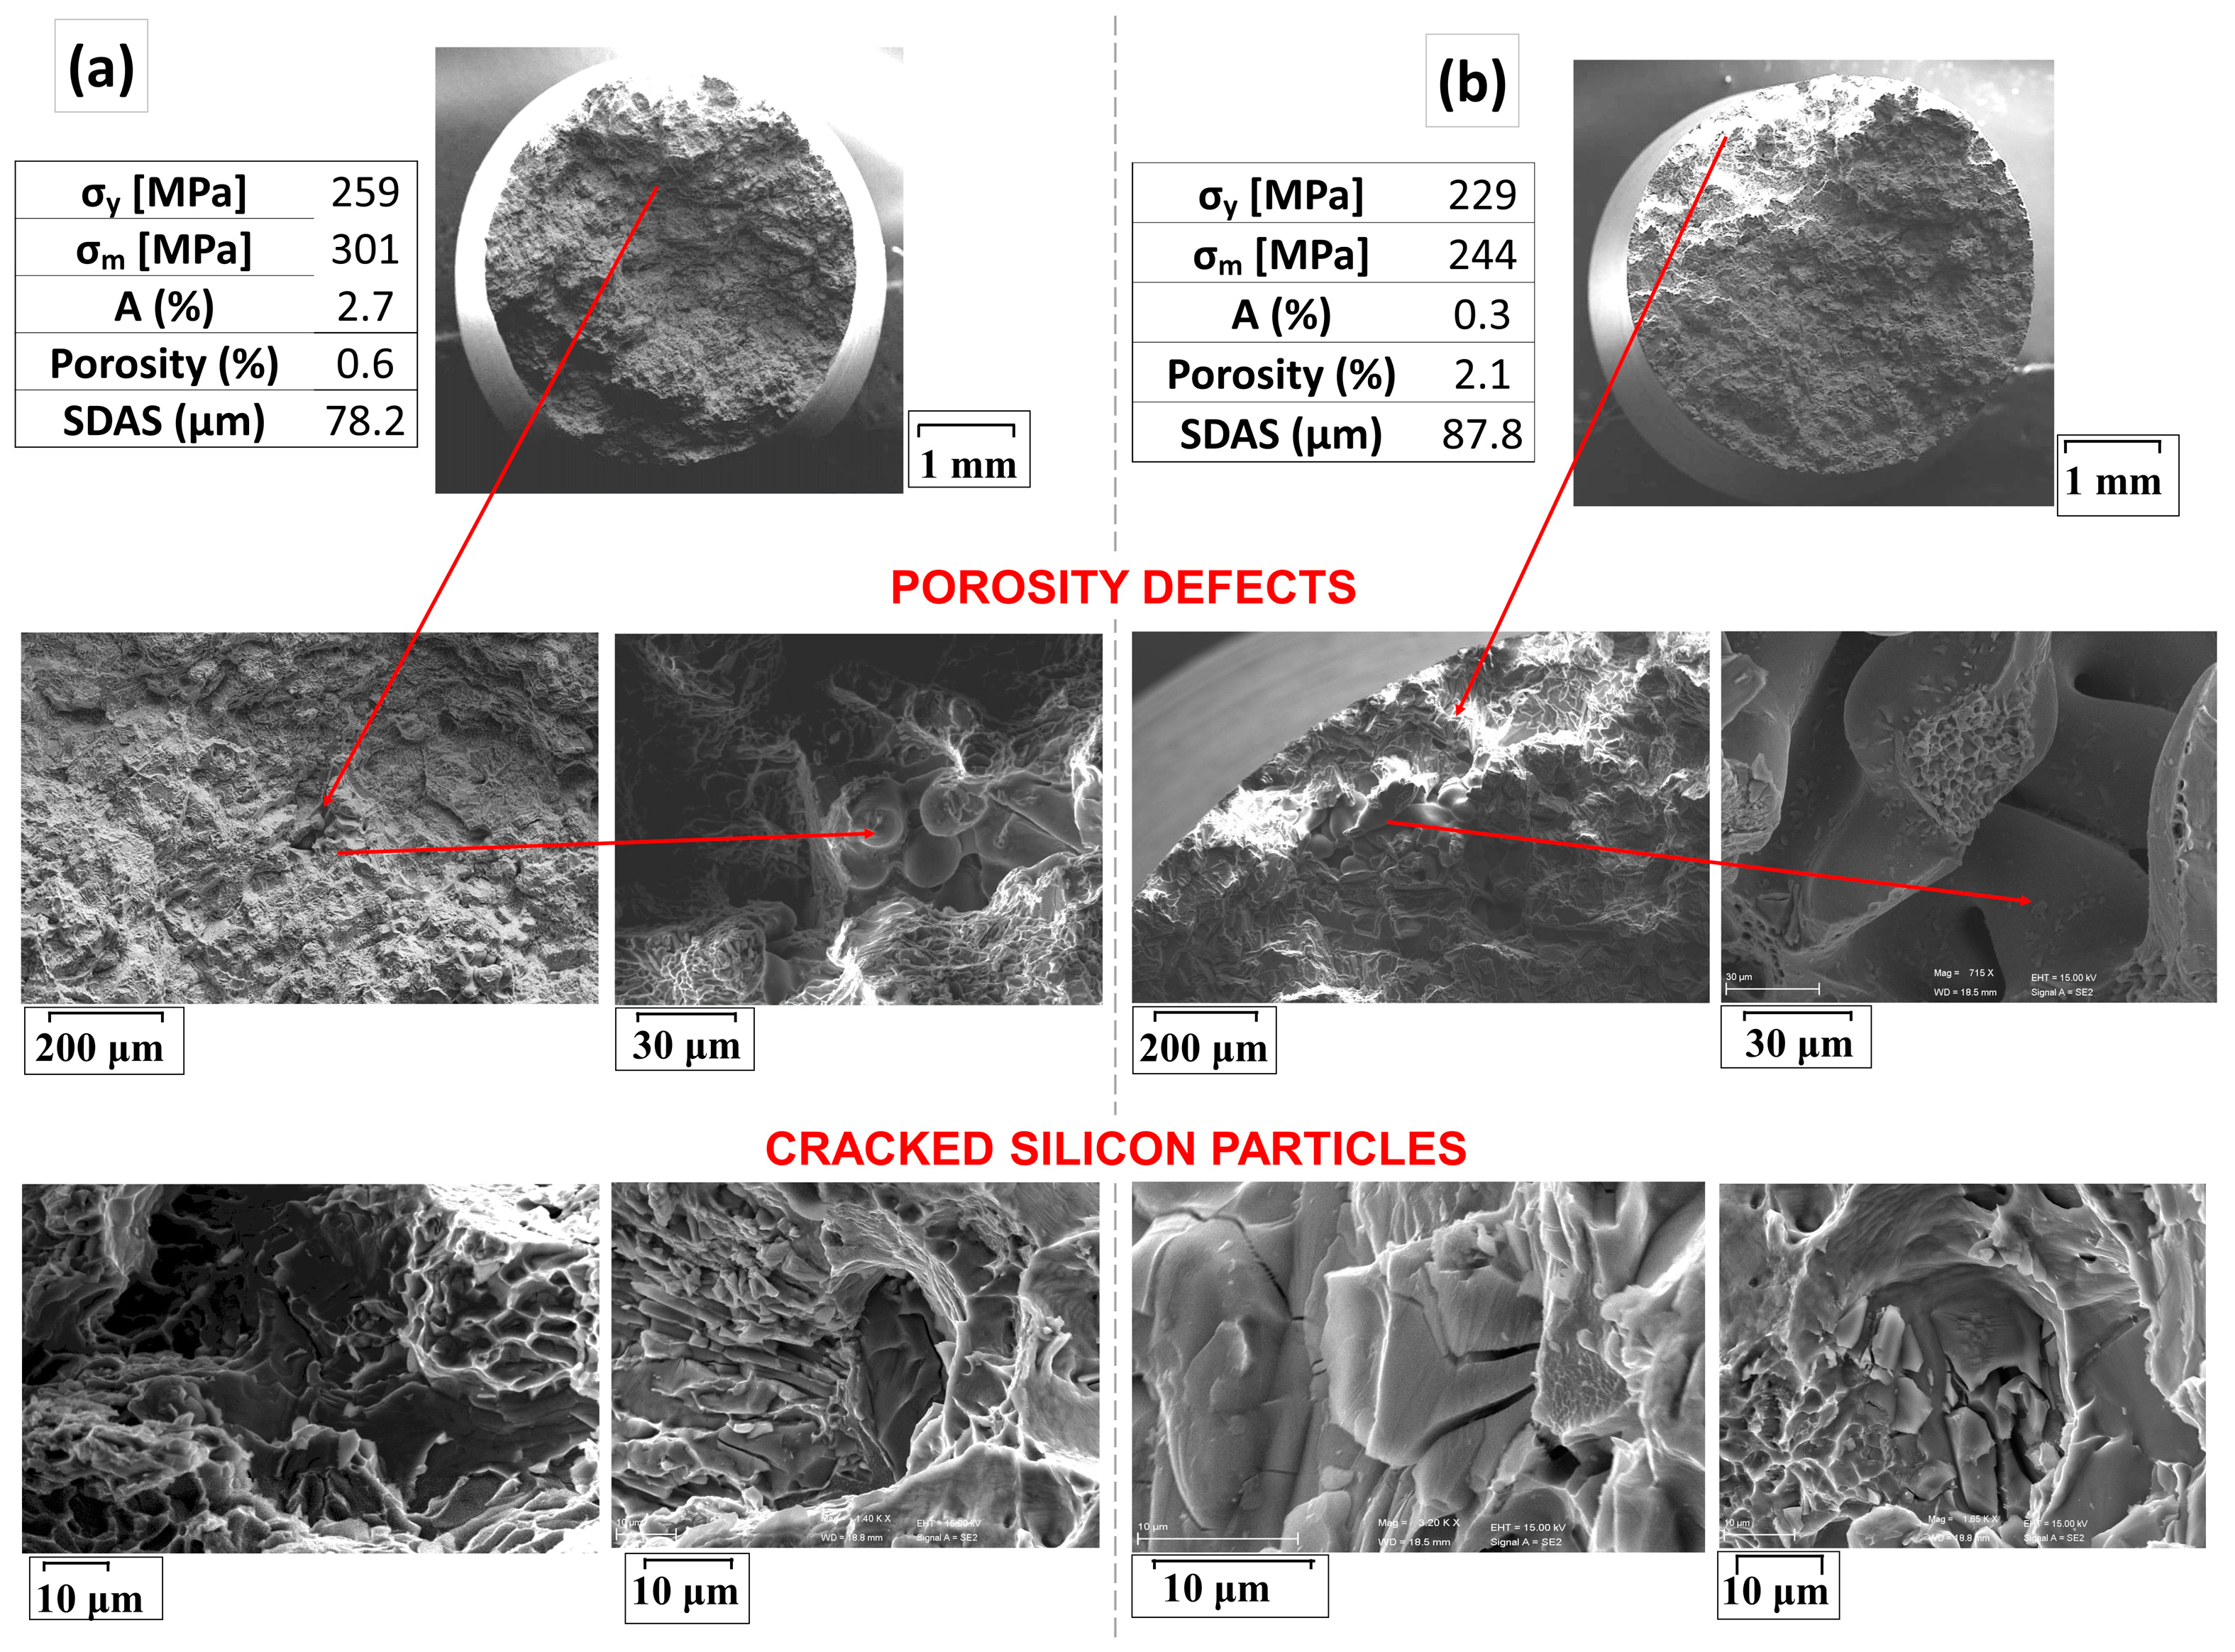
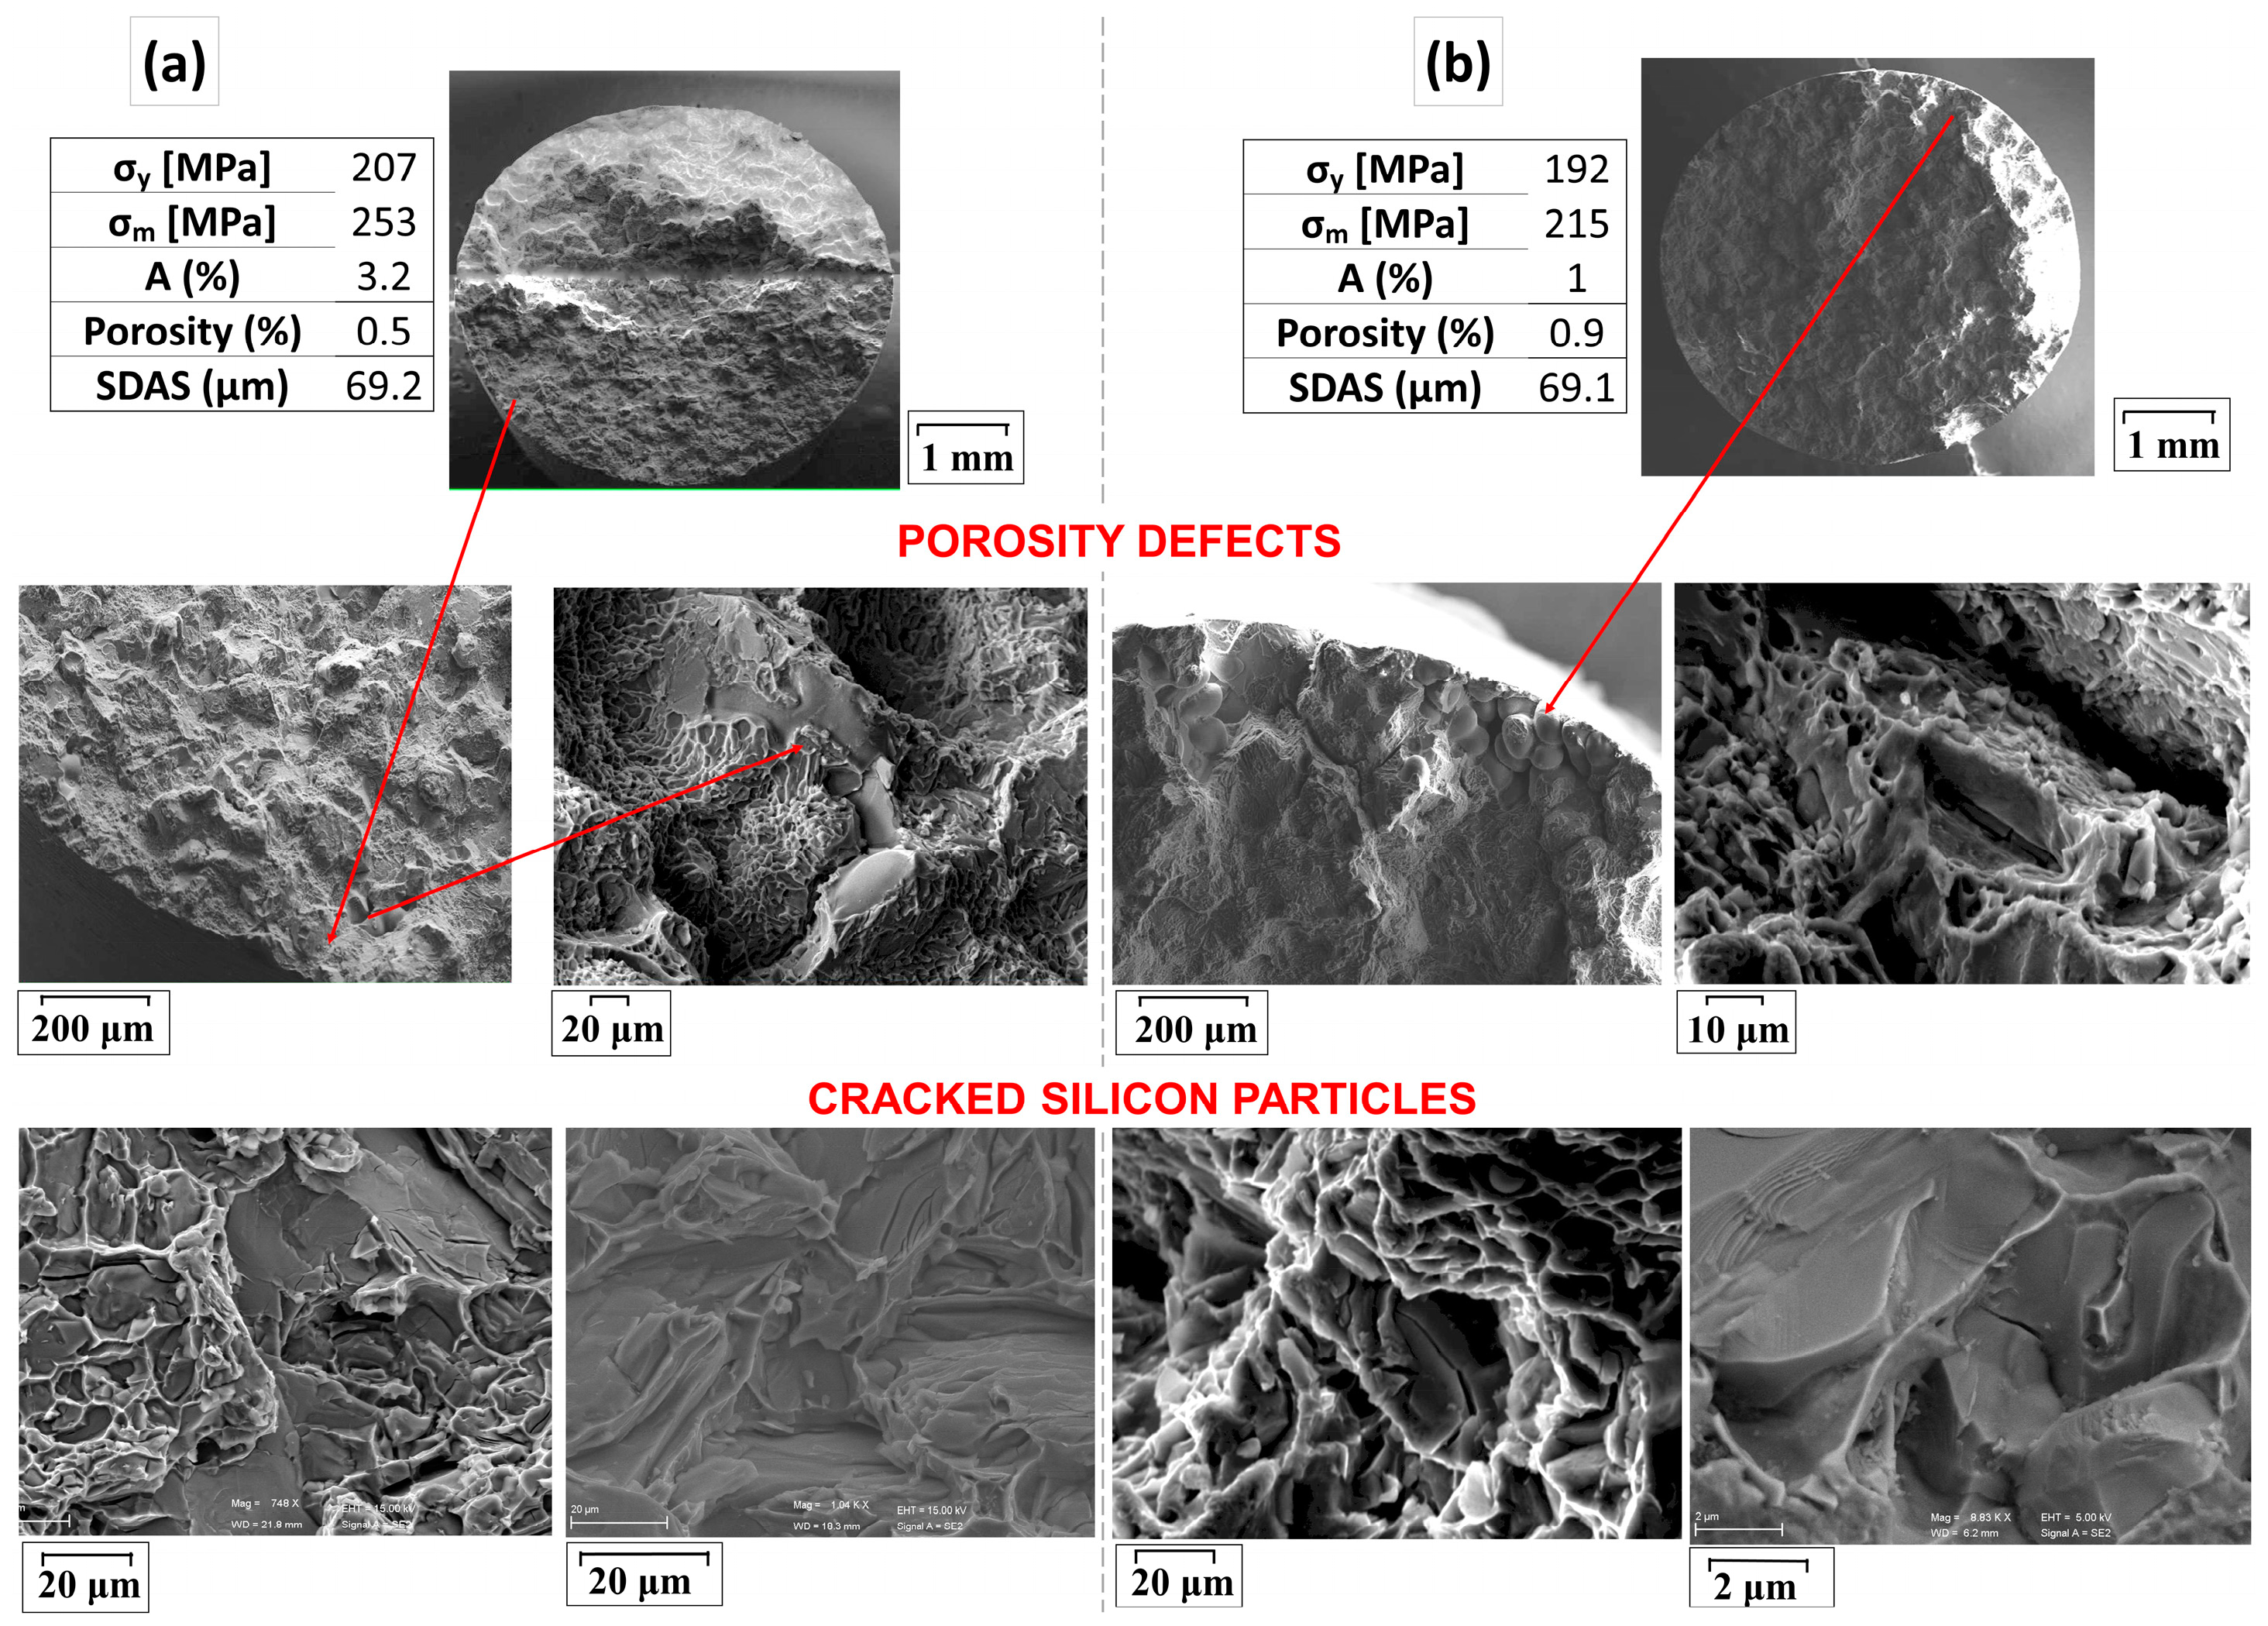
3.3. Fracture Surface

The fracture surfaces of tensile specimens were examined using SEM to elucidate their behavior. Figure 10 and Figure 11 depict the analysis of RSC and SC samples, respectively. The criteria for specimen selection were based on the highest (Figure 10a and Figure 11a) and lowest (Figure 10b and Figure 11b) elongation percentages. The fracture surfaces display numerous smooth, flat regions interspersed with bright ridges. These flat areas correspond to cleaved silicon particles. Research has shown that the fracture of cast aluminum alloys often commences with the cracking of silicon particles, as demonstrated in studies by Dighe et al. [32] and Wang [33]. The occurrence of the bright ridges indicates that voids/microcracks could connect through matrix necking, facilitated by the presence of the multiple porosity. The higher porosity percentage, as determined through the image analysis of the cross-sectional surface reported in Figure 10b, was confirmed by this analysis. It reveals a higher concentration of shrinkage porosities along the fracture surface compared to Figure 10a. This aspect may have influenced the material’s behavior, resulting in the higher fragility of the specimens, evident in both the fracture surface aspect and the elongation at fracture. In fact, during tensile testing for both tested samples, fracture initially occurred at large silicon particles via cleavage mechanisms. Subsequently, cracks propagated along grain boundaries, culminating in the complete failure of the samples. The fracture surfaces also exhibited a number of small dimples.
Analyzing the fracture surfaces of the SC tested specimens, a fracture mechanism similar to that of the RSC specimens is revealed. It involved a combination of brittle failure, with transcrystalline failure and cleavage behavior, resulting in relatively smooth fracture surfaces. Additionally, a number of small dimples, characteristic of ductile fracture, were also observed in this case (Figure 11a,b). Similarly to the observations on RSC samples, the SC specimens exhibited a higher porosity percentage on the fracture surface of the more fragile specimens. The variation in elongation at fracture can again be ascribed to these factors. In conclusion, the comparison between RSC and SC samples reveals similar fracture behaviors, with both exhibiting transcrystalline and cleavage fracture modes, alongside some areas showing the presence of small dimples. Additionally, the presence of higher porosity percentages on the fracture surfaces of the more fragile specimens suggests a correlation between porosity and material fragility, regardless of the casting method employed.

4. Conclusions

The present work aimed at improving the knowledge about the impact on the overall component properties related to the adoption of a recent process, aluminum rapid sand casting, involving the use of sand molds made via additive manufacturing. In this study, the microstructural features, defect extension, and mechanical properties of aluminum EN AC 42100-T6 RSC components were compared with those of analogous parts cast using conventional sand casting technology. Below are the principal findings:
  • Microstructural Similarities: Both RSC and SC components exhibited the typical microstructure of Al-Si casting, consisting of an α-aluminum dendrite matrix, eutectic silicon in the interdendritic regions, β-Al5FeSi platelets, and Chinese script π-AlFeMgSi precipitates. The only notable difference were the slightly coarser Al-Si eutectic plates in the thicker RSC components due to a decreased silicon modification effect (due to a decrease in the cooling rate).
  • Porosity Levels: Comparable levels of significant porosity content were observed in components produced using both RSC and SC processes, with no significant difference between the two technologies.
  • Mechanical Properties:
    • Tensile tests revealed that RSC samples machined from the thinnest design (named 4–6) exhibited higher mechanical properties, consistent with their SDAS measurements, compared to thicker parts.
    • Conversely, RSC components (14–15 and 16–17 designs) displayed lower elongation at failure, attributed to a decrease in the silicon modification effect at higher wall thicknesses.
    • The highest elongation at fracture values were achieved in conditions with relatively low porosity levels, suggesting a significant role of this defect in reducing ductility for both RSC and SC.
    • While the elongation at fracture and porosity levels were comparable between the two technologies, RSC exhibited higher yield strength and ultimate tensile strength primarily due to the higher Mg content in the RSC alloy rather than process-specific factors.
  • Fracture Behavior: the fracture behavior was also highly similar for all the examined samples belonging to both technologies. Fracture was primarily brittle in nature, governed by silicon particles cracking and intergranular fracture, with porosity levels playing a crucial role in determining the degree of embrittlement observed in both RSC and SC components. Higher porosity percentages on fracture surfaces correlated with lower elongation at fracture, regardless of the casting process employed. Additionally, regions with characteristic dimples of ductile fracture were observed.
In summary, this study provides preliminary confirmations that the adoption of additive manufacturing sand molds in RSC does not adversely affect the properties of aluminum automotive components compared to traditional SC. However, efforts are needed to enhance ductility levels in both processes during the prototyping phase. Prospects for future research could involve a further exploration of ways to refine the manufacturing processes to optimize ductility while maintaining or improving other mechanical properties. Investigating innovative alloy compositions, and developing affordable and faster methods to optimize the foundry systems of prototypes and new advanced manufacturing techniques may offer avenues to enhance the overall performance and reliability of aluminum automotive components. Additionally, studying the effects of additive manufacturing sand molds on component properties and durability could provide valuable insights for future development in this field.

Author Contributions

Conceptualization, S.C.; methodology, S.C.; validation, S.C. and G.C.; formal analysis, S.C.; investigation, S.C.; resources, S.C. and G.C.; data curation, S.C.; writing—original draft preparation, S.C.; writing—review and editing, G.C.; visualization, S.C.; supervision, G.C.; project administration, S.C. and G.C.; funding acquisition, S.C. and G.C. All authors have read and agreed to the published version of the manuscript.

Funding

This research received no external funding.

Data Availability Statement

The data presented in this study are available on request from the corresponding author (privacy).

Conflicts of Interest

Author Silvia Cecchel was employed by the company Streparava SpA. The remaining authors declare that the re-search was conducted in the absence of any commercial or financial relationships that could be construed as a potential conflict of interest.

References

  1. Cecchel, S. Materials and technologies for lightweighting of structural parts for automotive applications: A review. SAE Int. J. Mater. Manuf. 2020, 14, 81–98. [Google Scholar] [CrossRef]
  2. Cecchel, S.; Ferrario, D.; Mega, F.; Cornacchia, G. Numerical, Mechanical, and Metallurgical Investigation of an Innovative Near Net Shape Titanium Selective Laser Melting Engine Component and Comparison with the Conventional Forged One. Adv. Eng. Mater. 2021, 23, 2100036. [Google Scholar] [CrossRef]
  3. Cecchel, S.; Ferraresi, R.; Magni, M.; Guerini, L.; Cornacchia, G. Evolution of prototyping in automotive engineering: A Comprehensive Study on the reliability of Additive Manufacturing for advanced powertrain components. Frat. Ed Integrità Strutt. 2024, 68, 109–126. [Google Scholar] [CrossRef]
  4. Gagpalliwar, P.; Vyawhare, R.; Dhatrak, P. Implementation of additive manufacturing in sand casting process. In Proceedings of the 3rd International Conference on Manufacturing, Material Science and Engineering (ICMMSE 2021) AIP Conference, Telangana, India, 24–25 September 2021; Volume 2548, p. 020013. [Google Scholar] [CrossRef]
  5. Upadhyay, M.; Sivarupan, T.; El Mansori, M. 3D printing for rapid sand casting—A review. J. Manuf. Process. 2017, 29, 211–220. [Google Scholar] [CrossRef]
  6. Sivarupan, T.; Balasubramani, N.; Saxena, P.; Nagarajan, D.; Mansori, M.E.; Salonitis, K.; Jolly, M.; Dargusch, M.S. A review on the progress and challenges of binder jet 3D printing of sand moulds for advanced casting. Addit. Manuf. 2021, 40, 101889. [Google Scholar] [CrossRef]
  7. Oguntuyi, S.D.; Nyembwe, K.; Shongwe, M.B.; Mojisola, T. Challenges and recent progress on the application of rapid sand casting for part production: A review. Int. J. Adv. Manuf. Technol. 2023, 126, 891–906. [Google Scholar] [CrossRef]
  8. Wang, X. Thermal Physical and Mechanical Properties of Raw Sands and Sand Cores for Aluminum Casting. Master’s Thesis, Montanuniversität Leoben University, Leoben, Austria, 2014. Available online: https://pure.unileoben.ac.at/en/publications/thermal-physical-and-mechanical-properties-of-raw-sands-and-sand- (accessed on 12 April 2024).
  9. Toth, J.; Svidro, J.T.; Dioszegi, A.; Stevenson, D. Heat absorption capacity and binder degradation characteristics of 3D printed cores investigated by inverse Fourier thermal analysis. Int. J. Met. 2016, 10, 306–314. [Google Scholar] [CrossRef]
  10. Martinez, D.; Bate, C.; Manogharan, G. Towards Functionally Graded Sand Molds for Metal Casting: Engineering Thermo-mechanical Properties Using 3D Sand Printing. JOM 2020, 72, 1340–1354. [Google Scholar] [CrossRef]
  11. Rodríguez-González, P.; Fernández-Abia, A.I.; Castro-Sastre, M.A.; Robles, P.E.; Barreiro, J.; Leo, P. Comparative Study of Aluminum Alloy Casting obtained by Sand Casting Method and Additive Manufacturing Technology. Procedia Manuf. 2019, 41, 682–689. [Google Scholar] [CrossRef]
  12. Snelling, D.; Blount, H.; Forman, C.; Ramsburg, K.; Wentzel, A.; Williams, C.; Druschitz, A. The effects on 3D printed molds on metal castings. In Proceedings of the 2013 International Solid Freeform Fabrication Symposium, Austin, TX, USA, 12–14 August 2013. [Google Scholar] [CrossRef]
  13. Li, Y.; Liu, J.X.; Huang, W.Q.; Zhang, S. Microstructure related analysis of tensile and fatigue properties for sand casting aluminum alloy cylinder head. Eng. Fail. Anal. 2022, 136, 106210. [Google Scholar] [CrossRef]
  14. Huang, J.; Zhao, H.; Chen, Z. Microstructure and properties of A356 alloy wheels fabricated by lowpressure die casting with local squeeze. J. Mater. Eng. Perform. 2019, 28, 2137–2146. [Google Scholar] [CrossRef]
  15. Duygun, İ.K.; Ağaoğlu, G.H.; Dispinar, D.; Orhan, G. Time-dependent corrosion properties of Sr-modified AlSi9 alloy analyzed by electrochemical techniques. J. Alloys Compd. 2019, 803, 786–794. [Google Scholar] [CrossRef]
  16. Neuser, M.; Grydin, O.; Andreiev, A.; Schaper, M. Effect of Solidification Rates at Sand Casting on the Mechanical Joinability of a Cast Aluminium Alloy. Metals 2021, 11, 1304. [Google Scholar] [CrossRef]
  17. Vasudevan, G.; Anbukkarasi, R.; Sanil, H.; Ravi, M. Combined effect of Sr-addition and pressure induced solidification on eutectic-Si morphology and mechanical properties of squeeze cast Al-Si binary alloy. Mater. Today Commun. 2023, 34, 105104. [Google Scholar] [CrossRef]
  18. Arabpour, M.; Boutorabi, S.M.A.; Saghafian, H. Effect of Casting Thickness on the Solidification Characteristics and Microstructural Parameters of Near-Eutectic Al-Si Alloy Produced by Ablation Casting Process. Metallogr. Microstruct. Anal. 2022, 11, 212–224. [Google Scholar] [CrossRef]
  19. Sun, S.C.; Yuan, B.; Liu, M.-P. Effects of moulding sands and wall thickness on microstructure and mechanical properties of Sr-modified A356 aluminum casting alloy. Trans. Nonferrous Met. Soc. China 2012, 22, 18841890. [Google Scholar] [CrossRef]
  20. Samuel, A.; Doty, H.; Valtierra, S.; Samuel, F. Effect of Sr-P interaction on the microstructure and tensile properties of A413.0 type alloys. Adv. Mater. Sci. Eng. 2016, 2016, 7691535. [Google Scholar] [CrossRef]
  21. Shabestari, S.; Ghodrat, S. Assessment of modification and formation of intermetallic compounds in aluminum alloy using thermal analysis. Mater. Sci. Eng. A 2007, 467, 150–158. [Google Scholar] [CrossRef]
  22. Farahany, S.; Ourdjini, A.; Idris, M.H.; Shabestari, S. Computer aided cooling curve thermal analysis of near eutectic Al–Si–Cu–Fe alloy. J. Therm. Anal. Calorim. 2013, 114, 705–717. [Google Scholar] [CrossRef]
  23. “Leghe di Alluminio in Colata Continua. Continuos Casting Alluminium Alloys”, EN AC 42100 Raffmetal Datasheet. Available online: https://www.fonderiasala.com/wp-content/uploads/2021/07/EN42200.pdf (accessed on 9 April 2024).
  24. Vandersluis, E.; Ravindran, C. Comparison of Measurement Methods for Secondary Dendrite Arm Spacing. Metallogr. Microstruct. Anal. 2017, 6, 89–94. [Google Scholar] [CrossRef]
  25. UNI EN ISO 6892–1: 2020; Metallic Materials—Tensile Testing—Part 1: Method of Test at Room Temperature. ISO: Geneva, Switzerland, 2020.
  26. Rathod, H.; Dhulia, J.K.; Maniar, N.P. Prediction of Shrinkage Porosity Defect in Sand Casting Process of LM25. IOP Conf. Ser. Mater. Sci. Eng. 2017, 225, 012237. [Google Scholar] [CrossRef]
  27. Moldovan, P.; Popescu, G.; Dobra, G.; Stanica, C. Microstructure evaluation and microporosity formation in AlSi7Mg 0.3 alloys. In Proceedings of the Light Metals 2003—132nd TMS annual meeting, San Diego, CA, USA, 2–6 March 2003; Crepeau, P.N., Ed.; TMS (The Minerals, Metals & Materials Society): Warrendale, PA, USA, 2003; pp. 937–944. [Google Scholar]
  28. Khalajzadeh, V.; Beckermann, C. Simulation of Shrinkage Porosity Formation During Alloy Solidification. Metall. Mater. Trans. A 2020, 51, 2239–2254. [Google Scholar] [CrossRef]
  29. Sajedi, Z.; Casati, R.; Poletti, M.C.; Wang, R.; Iranshahi, F.; Vedani, M. Comparative thermal fatigue behavior of AlSi7Mg alloy produced by L-PBF and sand casting. Int. J. Fatigue 2021, 152, 106424. [Google Scholar] [CrossRef]
  30. Callegari, B.; Lima, T.N.; Coelho, R.S. The Influence of Alloying Elements on the Microstructure and Properties of Al-Si-Based Casting Alloys: A Review. Metals 2023, 13, 1174. [Google Scholar] [CrossRef]
  31. Liu, X.; Wang, C.; Zhang, S.; Song, J.; Zhou, X.; Zha, M.; Wang, H. Fe-Bearing Phase Formation, Microstructure Evolution, and Mechanical Properties of Al-Mg-Si-Fe Alloy Fabricated by the Twin-Roll Casting Process. J. Alloys Compd. 2021, 886, 161202. [Google Scholar] [CrossRef]
  32. Dighe, M.D.; Gokhale, A.M.; Horstemeyer, M.F. Effect of loading condition and stress state on damage evolution of silicon particles in an Al–Si–Mg-base cast alloy. Metall. Mater. Trans. A 2002, 33, 555–565. [Google Scholar] [CrossRef]
  33. Wang, Q.G. Microstructural effects on the tensile and fracture behavior of aluminum casting alloys A356/357. Metall. Mater. Trans. A 2003, 34, 2887–2899. [Google Scholar] [CrossRef]
Figure 1. Component geometry and overall dimensions.
Metals 14 00459 g001
Figure 2. Examples of SDAS measurements. Red line represents L length.
Metals 14 00459 g002
Figure 3. Tensile sample location and nomenclature. The areas of extraction are identified by the highlighted red and green specimens, named from A to D.
Metals 14 00459 g003
Figure 4. X-ray image of the analyzed components. Porosities are indicated by red arrows. Tensile specimens location is identified by red and green colors.
Metals 14 00459 g004
Figure 5. Macrostructures of EN AC 42100-T6 RSC components, with porosity ratio percentage, porosity average (avg) size, and SDAS values for each section from the shoulders of the tensile specimens analyzed.
Metals 14 00459 g005
Figure 6. Microstructure at different magnifications of EN AC 42100-T6 RSC samples.
Metals 14 00459 g006
Figure 7. Microstructure at different magnifications of EN AC 42100-T6 samples produced using SC and RSC technology.
Metals 14 00459 g007
Figure 8. SEM images and EDS analysis of EN AC 42100-T6 samples produced using SC (a) and RSC technology (b,c).
Metals 14 00459 g008
Figure 9. Tensile test curve for EN AC 42100-T6 for the different RSC components analyzed. Only the curve with the highest yield strength for each component was reported for comparison purposes.
Metals 14 00459 g009
Figure 10. SEM on the fracture surfaces of the tensile samples made of EN AC 42100-T6 using RSC, at different magnifications. Red arrows indicate the location of the subsequent magnifications. (a) highest elongation percentage and (b) lowest elongation percentage.
Metals 14 00459 g010
Figure 11. SEM on the fracture surfaces of the tensile samples made of EN AC 42100-T6 using sand casting, at different magnifications. Red arrows indicate the location of the subsequent magnifications. (a) highest elongation percentage and (b) lowest elongation percentage.
Metals 14 00459 g011
Table 1. Chemical composition of the EN AC 42100 components made using RSC and SC. All elements are expressed in wt%.
SiFeCuMnMgZnTiAl
RSC7.820.120.020.010.470.040.16rest
SC7.120.110.010.010.310.010.14rest
Table 2. Tensile test results for EN AC 42100-T6 samples taken in different zones (from A to D) of the RSC components.
4B4C4D6B6C6D14A14B14C14D15A15B15C15D16A16B16C16D17A17B17C17D
σy [MPa]255259258255256264236232219228255239229240234230238238229232238235
σm [MPa]296301289290289290258245220245265253244242248239256248247239256257
A (%)1.92.70.91.20.91.10.50.30.20.40.40.40.30.20.40.50.50.30.40.30.50.5
P (%)0.60.61.10.20.41.40.20.60.90.80.11.22.11.41.00.30.40.70.71.00.30.1
P size (μm) 15353004236612981443320311471586202523541118269736052506197320391082129217391936848930
SDAS (μm)40904852485292868699718588897432777670787667
Table 3. Tensile test results for EN AC 42100-T6 samples averaged between the different tests conducted on each design of the RSC components (named 4–6, 14–15, and 16–17).
Rapid Sand Casting
4–614–1516–17All Components
Avg. ±Avg. ±Avg. ±Avg. ±
σy [MPa]258323510234324113
σm [MPa]292524612249726022
A (%)1.40.70.40.10.40.10.70.6
Porosity (%)0.70.40.90.60.60.30.70.5
Porosity size (μm)2142835213084414804971897768
SDAS (μm)551687769147119
Table 4. Tensile test results for EN AC 42100-T6 samples averaged between samples from components 4–6 RSC, all the components made of RSC (4–6, 14–15, 16–17) and SC parts (with 4–6 designs).
RSC (Avg 4–6)RSC (Global Avg)SC (Avg 4–6)
Avg±Avg±Avg±
σy [MPa]2583241132038
σm [MPa]29252602223417
A (%)1.40.660.70.61.60.7
Porosity (%)0.70.40.70.50.70.3
SDAS (μm)55167119698
Disclaimer/Publisher’s Note: The statements, opinions and data contained in all publications are solely those of the individual author(s) and contributor(s) and not of MDPI and/or the editor(s). MDPI and/or the editor(s) disclaim responsibility for any injury to people or property resulting from any ideas, methods, instructions or products referred to in the content.

