Article

Evaluation of Energy Utilization Efficiency and Optimal Energy Matching Model of EAF Steelmaking Based on Association Rule Mining

School of Minerals Processing and Bioengineering, Central South University, Changsha 410083, China
*
Authors to whom correspondence should be addressed.
Metals 2024, 14(4), 458; https://doi.org/10.3390/met14040458
Submission received: 1 March 2024 / Revised: 8 April 2024 / Accepted: 9 April 2024 / Published: 12 April 2024

Abstract

:
In the iron and steel industry, evaluating the energy utilization efficiency (EUE) and determining the optimal energy matching mode play an important role in addressing increasing energy depletion and environmental problems. Electric Arc Furnace (EAF) steelmaking is a typical short crude steel production route, which is characterized by an energy-intensive fast smelting rhythm and diversified raw charge structure. In this paper, the energy model of the EAF steelmaking process is established to conduct an energy analysis and EUE evaluation. An association rule mining (ARM) strategy for guiding the EAF production process based on data cleaning, feature selection, and an association rule (AR) algorithm was proposed, and the effectiveness of this strategy was verified. The unsupervised algorithm Auto-Encoder (AE) was adopted to detect and eliminate abnormal data, complete data cleaning, and ensure data quality and accuracy. The AE model performs best when the number of nodes in the hidden layer is 18. The feature selection determines 10 factors such as the hot metal (HM) ratio and HM temperature as important data features to simplify the model structure. According to different ratios and temperatures of the HM, combined with k-means clustering and an AR algorithm, the optimal operation process for the EUE in the EAF steelmaking under different smelting modes is proposed. The results indicated that under the conditions of a low HM ratio and low HM temperature, the EUE is best when the power consumption in the second stage ranges between 4853 kWh and 7520 kWh, the oxygen consumption in the second stage ranges between 1816 m3 and 1961 m3, and the natural gas consumption ranges between 156 m3 and 196 m3. Conversely, under the conditions of a high HM ratio and high HM temperature, the EUE tends to decrease, and the EUE is best when the furnace wall oxygen consumption ranges between 4732 m3 and 5670 m3, and the oxygen consumption in the second stage ranges between 1561 m3 and 1871 m3. By comparison, under different smelting modes, the smelting scheme obtained by the ARM has an obvious effect on the improvement of the EUE. With a high EUE, the improvement of the A2B1 smelting mode is the most obvious, from 24.7% to 53%. This study is expected to provide technical ideas for energy conservation and emission reduction in the EAF steelmaking process in the future.

1. Introduction

The iron and steel industry is a vital foundational industry for the national economy and an important indicator of the national economic level and strength. As the largest steel production country in the world, China has experienced rapid development in the production level and quality of steel products [1]. However, behind the rapid development of the iron and steel industry, environmental issues caused by the consumption of resources and energy have become increasingly prominent [2,3]. Adhering to the strategy of energy conservation and emission reduction [4], enhancing energy efficiency through technological innovation [5], and promoting green and low-carbon development in the iron and steel industry are critical issues that urgently need to be addressed.
Electric arc furnace (EAF) steelmaking is a significant pathway for steel production and the realization of resource recycling [6,7]. This process achieves rapid and efficient metal smelting, producing high-quality steel and alloys that meet compositional and temperature requirements [8,9]. Short process steelmaking centered around an EAF not only reduces waste in resources but also minimizes the environmental impact. According to the data provided by the World Steel Association, the CO2 emissions per ton of steel from the EAF route, using scrap as the metal charge, are 0.68 tons, with an energy intensity of 10.20 GJ per ton, giving it an advantage over the other process routes [10,11].
The EAF steelmaking process realizes the transformation of raw materials into products, accompanied by energy conversions [12]. EAFs exhibit a strong adaptability to raw materials [13,14], with the main materials being scrap. However, due to a shortage in scrap reserves, some steel mills adopt the practice of adding hot metal (HM) to the furnace as a supplement [15,16]. This approach adjusts the composition of the raw materials and obtains a good smelting effect. The material and energy input factors have a certain degree of impact on the energy consumption levels, energy conservation, emission reduction, and efficiency improvements [17]. At present, most steel companies evaluate the performance of the smelting process by using the yield of molten steel [18], but only the initial and final weight conditions are considered and an evaluation indicator for the energy utilization efficiency (EUE) is lacking. The evaluation fails to consider the influence of the operation on energy efficiency during the steelmaking process. Therefore, the energy conversion process becomes unclear, and the evaluation indicator shows significant fluctuations. The above situations hinder energy conservation and the development of reductions in the emissions from EAF steelmaking. Furthermore, there are numerous factors related to the EUE whose importance levels cannot be determined, and the potential correlations between these factors remain unexplored, leading to redundant data. The complexity of the data leads to challenges for research. Moreover, the EUE of EAF steelmaking relies heavily on the production experience of operators. The existing large-scale dataset has not been fully utilized to provide standardized guidance for the operational processes in steelmaking. To address these issues, this paper proposes integrating the evaluation indicator of the EUE with association rules mining to extract useful data from the extensive dataset and to reveal the relationships between different data variables. This approach aims to provide support for more accurate decisions for operators.
Domestic and foreign scholars have conducted a large amount of theoretical and experimental research in fields such as energy optimization in the EAF steelmaking process. Chen [19], based on theoretical calculations and a statistical analysis, discussed the impact of the charge structure on production indicators and found that the EUE decreases with the increase in the proportion of HM in EAF steelmaking. Mapelli [20] pointed out that the assessment of energy consumption is fundamental in the steelmaking process, and a correct analysis of the energy input and utilization is crucial to better control the time of melting and refining. Li [21] used the principle of material flow to analyze the material and energy utilization rates of a blast furnace, considering the converter and EAF processes. Sun [22] developed a matrix model of the material–energy–emission relationships and determined the influence of various operational parameters on the material, on the energy, and on the emission intensity. Sun [23] outlined different steel production routes and introduced the modeling, scheduling, and interrelationships of materials and energy flows in the iron and steel industry. Na [24], using the ISMP as a typical case, established the material and energy flow networks of typical steel enterprises; analyzed their required energy, surplus energy, and energy efficiency; and discussed the factors influencing energy efficiency. Data mining is widely applied in various fields, such as the biomedical field and the field of energy construction, by domestic and foreign scholars. It extracts rules from complex data, discovers association patterns between different features, and achieves functions such as fault diagnosis [25,26], behavior prediction [27,28], pattern recognition [29,30], and disease research [31,32]. Data mining also has some successful applications in the iron and steel industry. Li [33] used historical operational data from an industrial blast furnace to establish a comprehensive evaluation and prediction model for the blast furnace operation state using big data mining methods. Manojlović [34] evaluated the energy efficiency parameters of the EAF process using different machine learning and data processing methods. Andonovski [35] studied the data-based optimization problem of the energy consumption of EAFs and proposed a model that can effectively predict energy consumption. The model can be used to reduce energy consumption and improve the overall efficiency of steelmaking plants. The above research has achieved good application results and is significant for promoting energy conservation, emission reduction, and cost reduction.
The above research has laid a solid theoretical foundation for optimizing energy in the EAF steelmaking process. However, the internal reactions of the steelmaking process in the EAF are complex and opaque, making it challenging to quantitatively analyze and accurately assess the flow and utilization of the energy. Additionally, the application of data mining and association rules in the EAF steelmaking field is rare. By adopting a data-driven association rules mining (ARM) [30,36,37] model, the industrial data can be effectively utilized to determine the optimal solutions. Through controlling and optimizing the key parameters of the steelmaking process, the energy consumption of the industrial process can be reduced, thereby achieving energy conservation and emission reduction goals. Therefore, to solve the above problems, this paper aims to develop an energy model specifically for the EAF steelmaking process. This model will analyze energy flow, calculate energy composition and EUE, and fully exploit the advantages of data mining in improving data quality and the AR algorithm in analyzing massive data. The goal is to determine the optimal smelting scheme of energy efficient utilization and improve the EUE of EAF steelmaking.
The research objectives of this paper are as follows:
  • Based on the reaction mechanism of the steelmaking process, the first goal is to quantify the energy components of the EAF steelmaking process, establish an evaluation system for the EUE, and develop a energy model to calculate, evaluate, and analyze the EUE of the EAF.
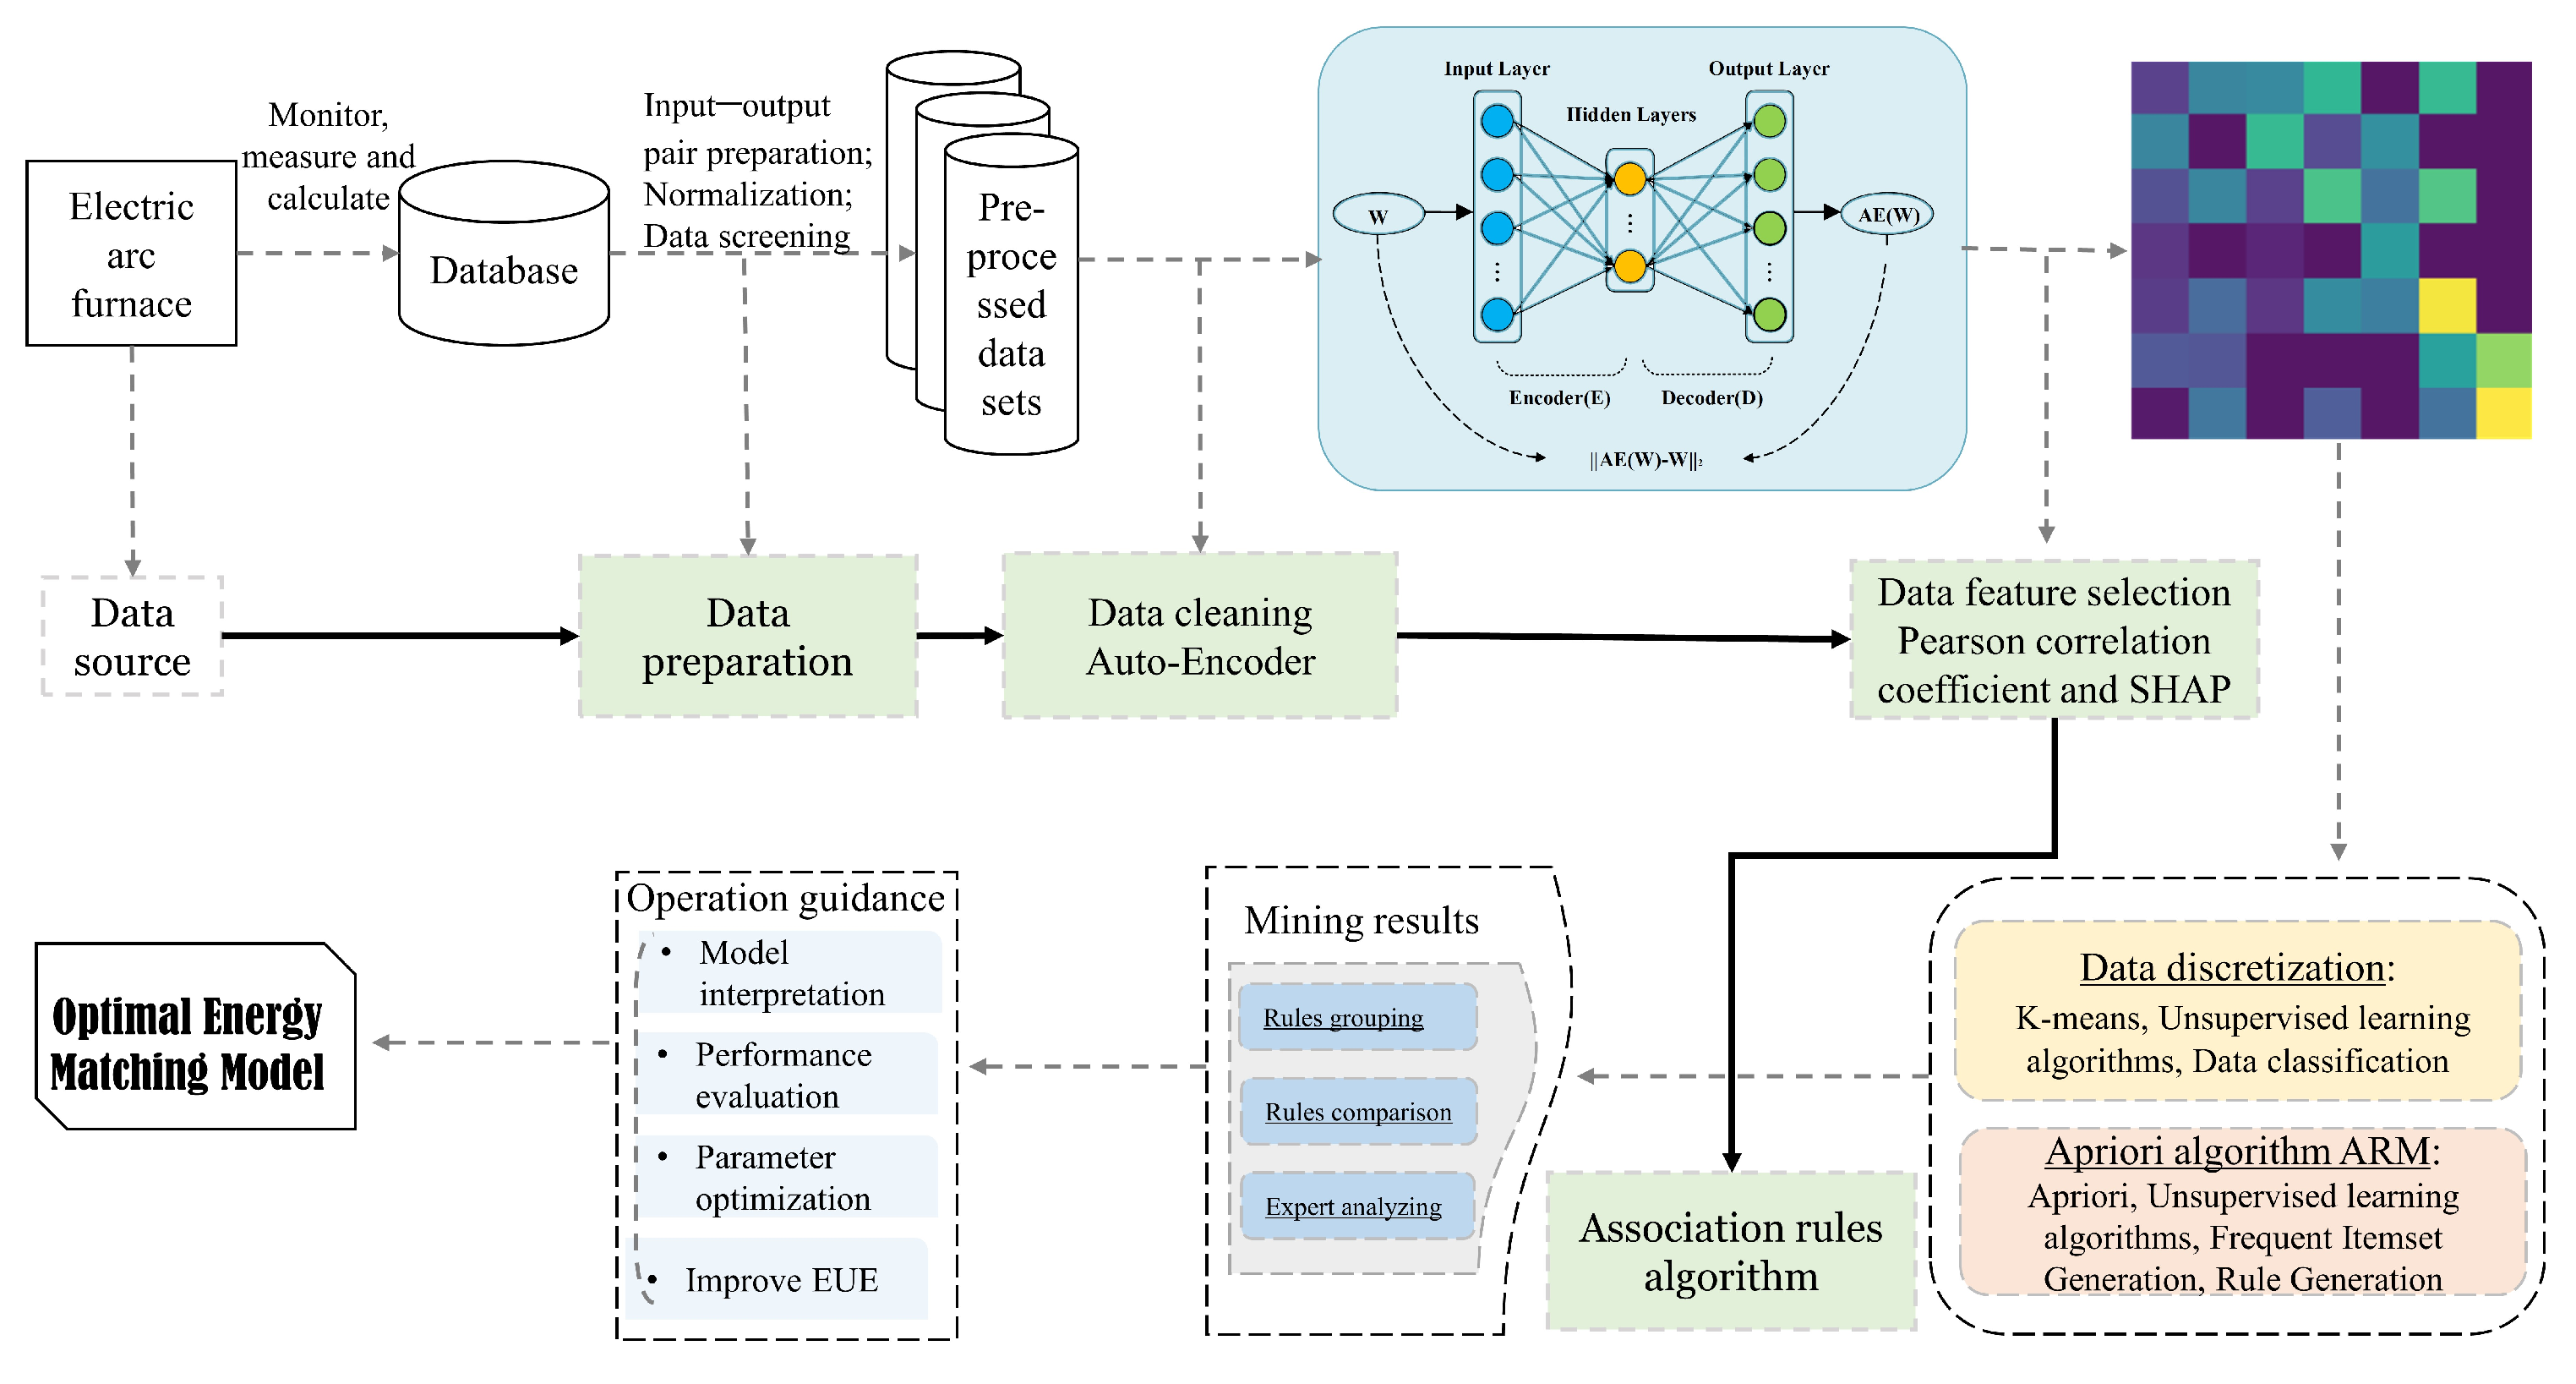
  • This paper will establish a data preprocessing workflow, utilizing auto encoders (AEs) to detect and remove abnormal data to ensure data quality and accuracy and using correlation analysis to determine important data features.
  • We will explore the use of the AR algorithm for optimizing the control of the use of energy in the EAF steelmaking process, utilizing knowledge of the principles of the steelmaking process to interpret the rules, verify the feasibility and practicality of the rules, and guide the actual steelmaking process in the EAF.
  • This paper will provide the methods and means of reducing energy consumption and enhancing the EUE in the EAF steelmaking process, achieving energy coordination and optimization in the steelmaking process, responding to the call for green smelting in the iron and steel industry, and taking on the important responsibility of energy saving and emission reduction.

2. Mathematical Modeling

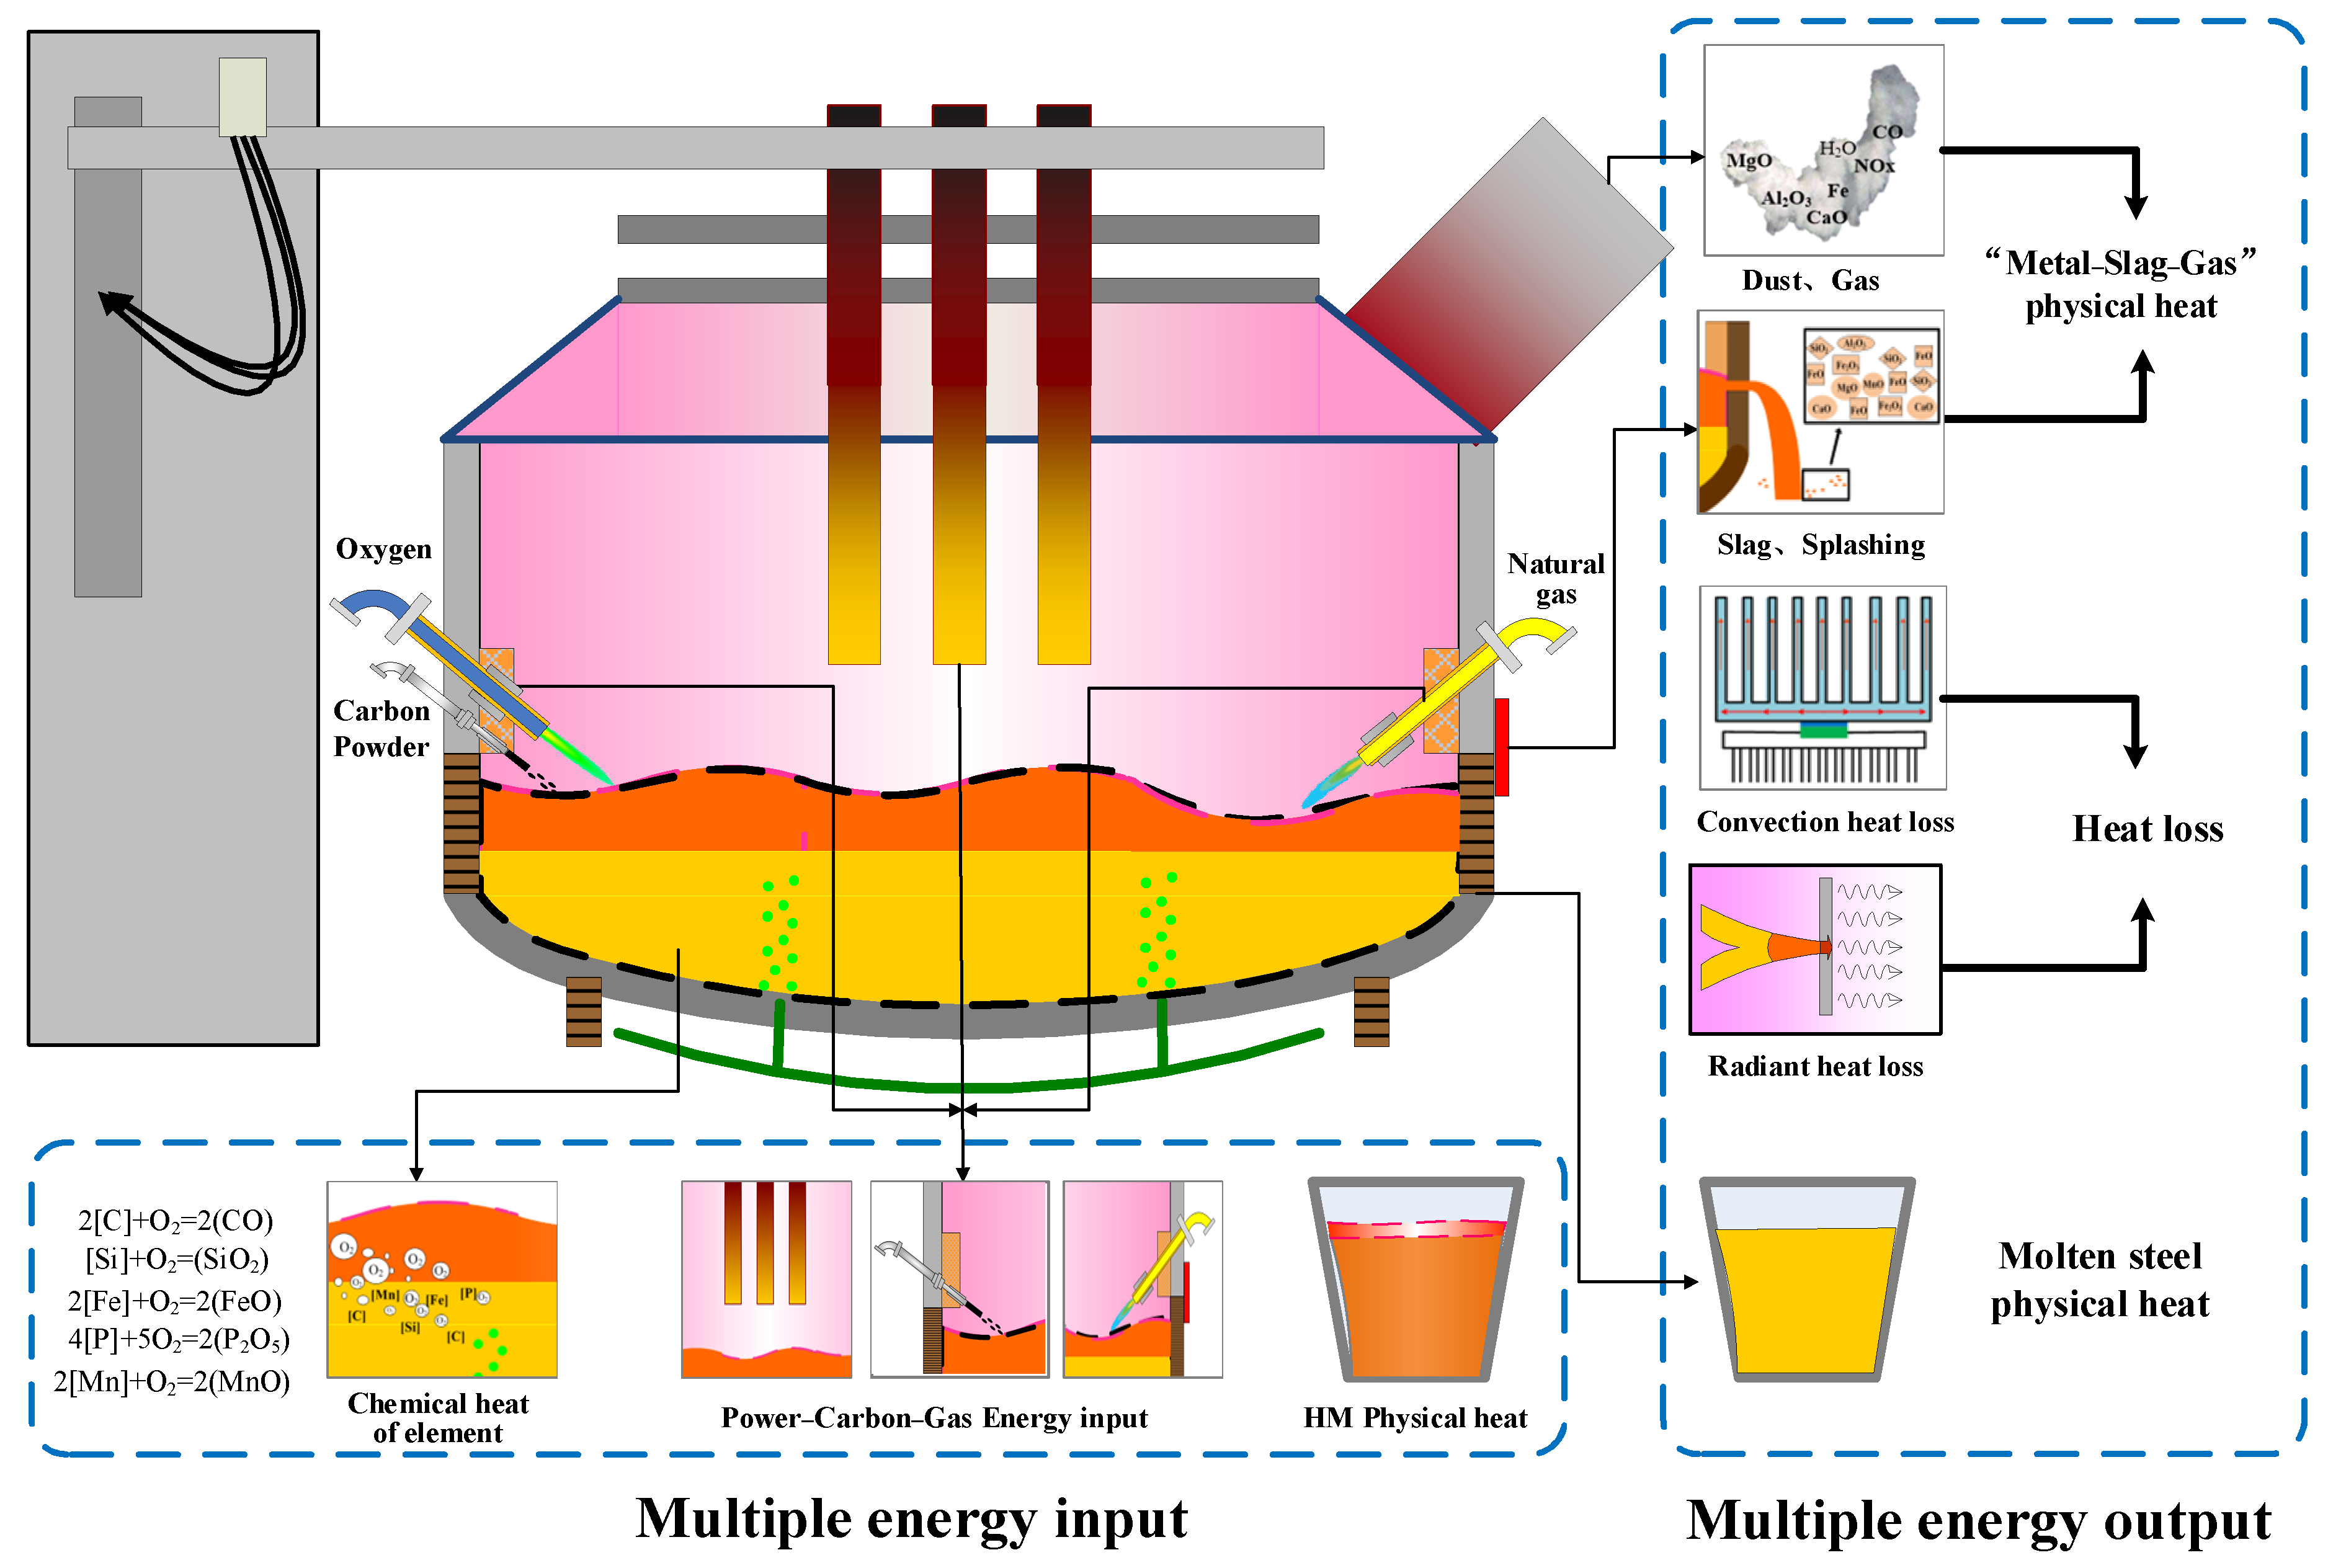
2.1. Description of the EAF Steelmaking Process

The research subject of this paper is a 90t EAF at Hengyang Steel Company (Hengyang, China). The data sample period is from September 2022 to September 2023, with a total of 9807 groups. This EAF has a charging capacity of 120t and uses HM and scrap as the metal charge for smelting. The EAF is equipped with three-phase AC electrodes and has a good cooling water system, blowing system, and charging system. The factory is equipped with comprehensive automation equipment, which can collect real-time smelting data, providing hardware conditions for developing an energy model for the EAF steelmaking process. Before the smelting process begins, the HM produced by the blast furnace is transported to the HM ladle station by train, while the purchased scrap is transported to the batching station by truck. At these stations, the HM and scrap are allocated, and various operations such as temperature measurements and weighing are conducted. Finally, the HM and scrap are poured into the EAF using cranes to start the smelting process.
The steelmaking process in an EAF is a physicochemical reaction process that occurs under high-temperature conditions. To establish an energy model for EAF steelmaking, it is necessary to consider the influence of the energy balance and heat balance relationships inside the furnace. The variation of the energy input and output within the furnace needs to be studied from a thermodynamic perspective. In the research object of this paper, the steelmaking process involves adding HM and scrap. At the same time, the furnace is supplied with electricity, oxygen, carbon powder, and natural gas as energy inputs to ensure the complete melting of the scrap. In this steelmaking mode, the main forms of energy are electrical energy, the physical heat of the HM, the chemical heat of the elements in the metal charge, and the exothermic reactions from the high-temperature multiphase chemical reactions during the EAF steelmaking process. During the steelmaking process, the HM and scrap are transformed into molten steel, and there are losses due to oxidation of the elements, slag loss, splashing loss, dust loss, and gas loss. Correspondingly, the energy is transferred into various forms, such as the physical heat of the molten steel, the chemical heat of the molten steel, the physical heat of the slag, the physical heat of the gas, the physical heat of the dust, and the physical heat of the splashed metal, as well as the energy losses in the EAF steelmaking process. Figure 1 shows the energy balance relationships in the steelmaking process of the EAF.

2.2. Energy Utilization Efficiency of the EAF Steelmaking Process

The smelting process of the EAF involves multiple types of energy and complex flow directions, such as electrical energy, chemical energy, thermal energy, etc. These energies are difficult to measure directly and need to be calculated indirectly through the material and energy balances within the furnace. The specific calculation formula is as follows:
(1)
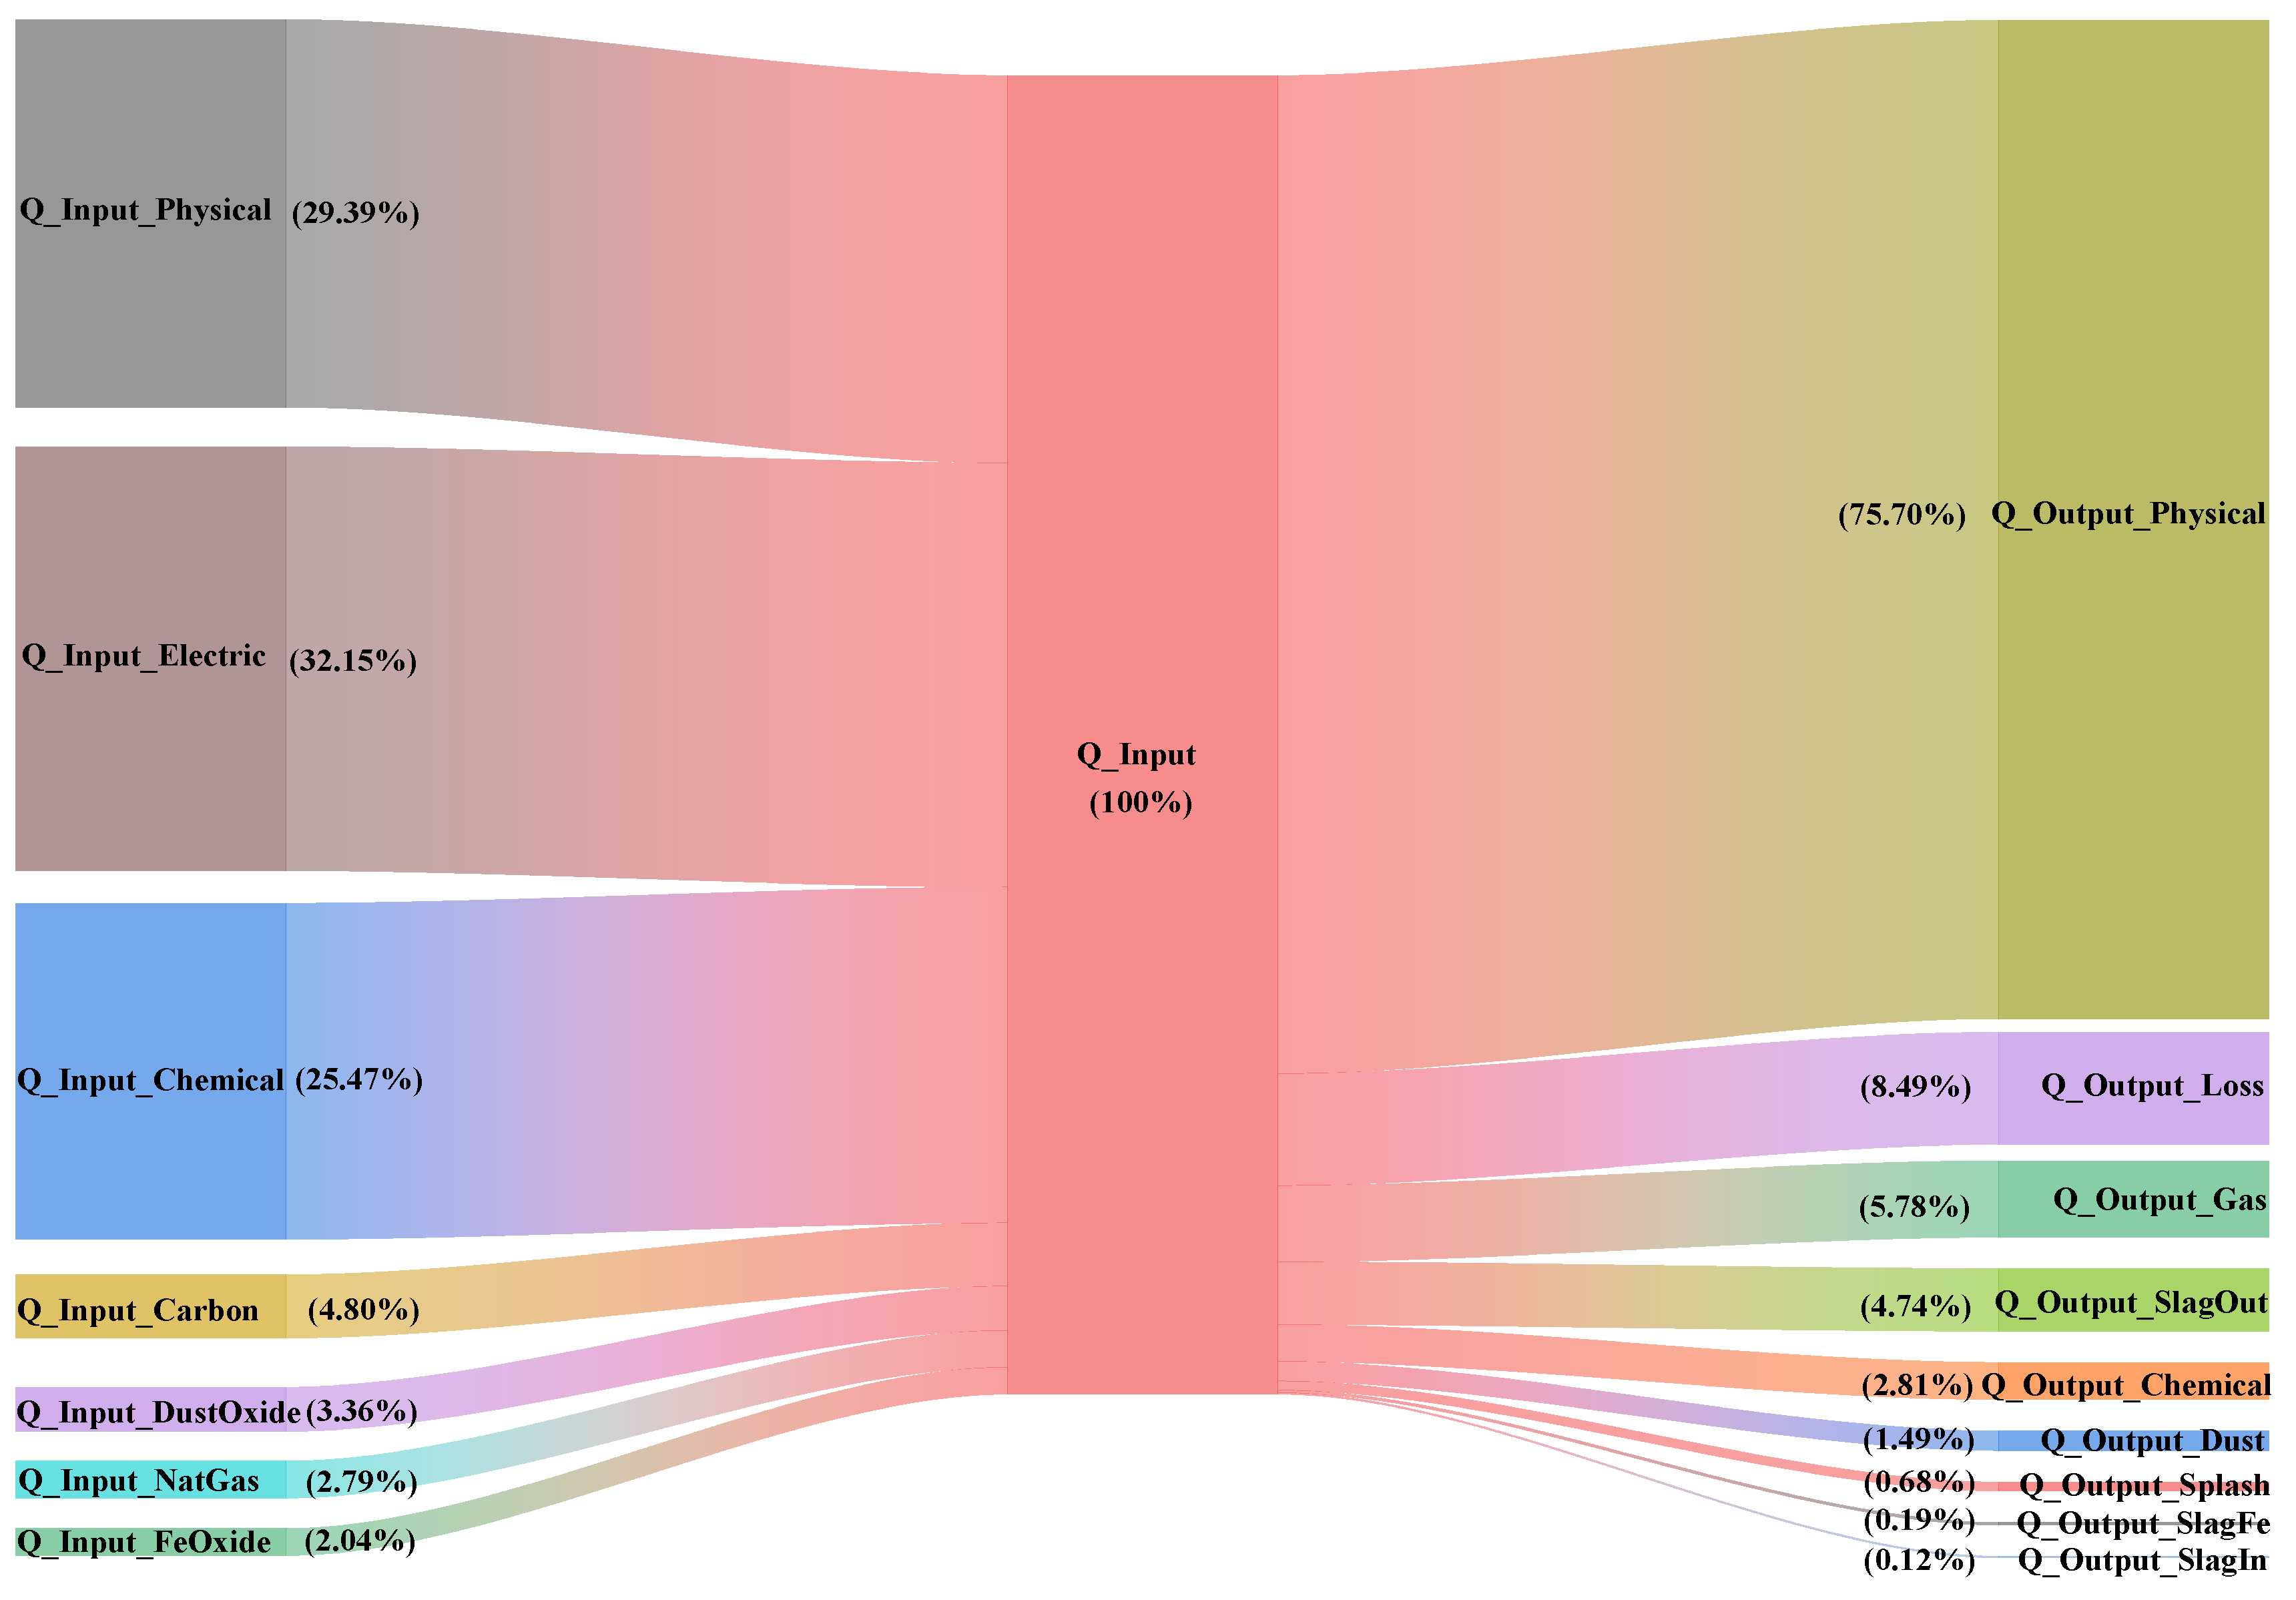
Calculation of Energy Input
(1) Physical heat of the HM: The HM has a high temperature, approximately 1300 °C, and contains a significant amount of physical heat, which is the main energy source for steelmaking in an EAF, which is illustrated as Equation (1).
Q I n p u t P h y s i c a l = M H . M × [ c s H . M ( T mp H . M 25 ) + H s l H . M + c l H . M ( T H . M T mp H . M ) ]
where M H . M is the weight of the HM; c s H . M is specific heat of the pig iron; c l H . M is specific heat of the H.M; H s l H . M is the latent heat of the H.M; T mp H . M is the H.M melting point; and T H . M is the H.M temperature.
(2) During the smelting process in the EAF, the elements in the metal charge and alloy undergo oxidation reactions, generating chemical heat. Furthermore, carbon powder and natural gas is commonly injected to provide additional energy for the steelmaking in the EAF, which is illustrated as Equations (2)–(10). The oxidation reaction of natural gas is shown in Equation (7).
Q I n p u t C h e m i c a l = Q C-CO + Q C-CO 2 + Q Si-SiO 2 + Q Mn-MnO + Q P-P 2 O 5 + Q S-SO 2 = M C-CO × Δ H C-CO + M C-CO 2 × Δ H C-CO 2 + M Si-SiO 2 × Δ H Si-SiO 2 + M Mn-MnO × Δ H Mn-MnO + M P-P 2 O 5 × Δ H P-P 2 O 5 + M S-SO 2 × Δ H S-SO 2
Q I n p u t O x i d e F e = Q Fe-FeO + Q Fe-Fe 2 O 3 = M Fe-FeO × Δ H Fe-FeO + M Fe-Fe 2 O 3 × Δ H Fe-Fe 2 O 3
Q I n p u t H M S l a g = M HM-Slag × [ c s HM-Slag ( t mp HM-Slag 25 ) + H s l HM-Slag + c l HM-Slag ( t HM-Slag t mp HM-Slag ) ]
Q I n p u t O x i d e D u s t = Q Dust-Fe-FeO + Q Dust-Fe-Fe 2 O 3 = M Dust-Fe-FeO × Δ H Fe-FeO + M Dust-Fe-Fe 2 O 3 × Δ H Fe-Fe 2 O 3
Q I n p u t C a r b o n = M Carbon-C-CO × Δ H C-CO + M Carbon-C-CO 2 × Δ H C-CO 2
CH 4 + 2 O 2 = CO 2 + 2 H 2 O
Q I n p u t N G = M NG-CH 4 -CO 2 × Δ H CH 4 -CO 2
Q I n p u t E l e c t r i c = P Electric × 3600
Q I n p u t = Q I n p u t C h e m i c a l + Q I n p u t O x i d e F e + Q I n p u t H M S l a g + Q I n p u t O x i d e D u s t + Q I n p u t C a r b o n + Q I n p u t N G + Q I n p u t E l e c t r i c
where Q I n p u t C h e m i c a l is the chemical heat of the oxidation reaction of the C, Si, Mn, P, and S elements, that is, the chemical heat of the initial state energy input; Q I n p u t O x i d e F e is the chemical heat of the oxidation of iron; Q I n p u t H M S l a g is the physical heat of the HM slag; Q I n p u t O x i d e D u s t is the chemical heat released by the oxidation of the iron in the dust; Q I n p u t C a r b o n is the chemical heat of the carbon reaction; Q I n p u t N G is the chemical heat of the natural gas reaction; Q I n p u t E l e c t r i c is the electric energy; P Electric is the electricity consumption, kWh; 3600 is the conversion coefficient between kWh and kJ; Q I n p u t is the energy input; Q C-CO is the chemical heat released by the conversion of C to CO in the melting; M C-CO is the mass of the C element converted to CO; Δ H C-CO is the enthalpy of the C to CO reaction; M NG-CH 4 -CO 2 is the mass of the CH4 converted to CO2 in natural gas; and Δ H CH 4 -CO 2 is the enthalpy of the CH4 to CO2 reaction. The other variables are defined in the same way as carbon.
(2)
Calculation of Energy Output
In the steelmaking process of the EAF, the physical heat of the molten steel is the primary form of energy output. Additionally, due to the high temperature of the molten steel, some materials are generated, carrying away a portion of the heat from the furnace. This portion of the energy output is calculated by Equations (11)–(19).
Q O u t p u t P h y s i c a l = M Steel × [ c s Steel ( t mp Steel 25 ) + H s l Steel + c l Steel ( t Steel t mp Steel ) ]
Q o u t p u t C h e m i c a l = Q C-CO + Q C-CO 2 + Q Si-SiO 2 + Q Mn-MnO + Q P-P 2 O 5 + Q S-SO 2 = M C-CO × Δ H C-CO + M C-CO 2 × Δ H C-CO 2 + M Si-SiO 2 × Δ H Si-SiO 2 + M Mn-MnO × Δ H Mn-MnO + M P-P 2 O 5 × Δ H P-P 2 O 5 + M S-SO 2 × Δ H S-SO 2
Q O u t p u t S l a g I n = M Slag-In × [ c s Slag-In ( t mp Slag-In 25 ) + H s l Slag-In + c l Slag-In ( t Slag-In t mp Slag-In ) ]
Q O u t p u t S l a g O u t = M Slag-Out × [ c s Slag-Out ( t mp Slag-Out 25 ) + H s l Slag-Out + c l Slag-Out ( t Slag-Out t mp Slag-Out ) ]
Q O u t p u t S l a g F e = M Slag-Fe × [ c s Slag-Fe ( t mp Slag-Fe 25 ) + H s-l Slag-Fe + c l Slag-Fe ( t Slag-Fe t mp Slag-Fe ) ]
Q O u t p u t S p l a s h = M Splash × [ c s Splash ( t mp Splash 25 ) + H s l Splash + c l Splash ( t Splash t mp Splash ) ]
Q O u t p u t D u s t = M Dust × [ c s Dust ( t Dust 25 ) + H s l Dust ]
Q O u t p u t G a s = M Gas × c g Gas ( t Gas 25 )
Q O u t p u t L o s s = Q Input Q O u t p u t P h y s i c a l Q o u t p u t C h e m i c a l Q O u t p u t S l a g I n Q O u t p u t S l a g O u t Q O u t p u t S l a g F e Q O u t p u t S p l a s h Q O u t p u t D u s t Q O u t p u t G a s
where Q O u t p u t P h y s i c a l is the physical heat of the molten steel; M Steel is the weight of the molten steel; c s Steel is the specific heat of the solid steel; c l Steel is the specific heat of the molten steel; H s l Steel is the latent heat of the steel; t mp Steel is the steel melting point; t Steel is the molten steel temperature; Q o u t p u t C h e m i c a l is the chemical heat of the energy output; Q O u t p u t S l a g I n is the physical heat of the slag left in the ladle; Q O u t p u t S l a g O u t is the physical heat of the slag flowing from the furnace door; Q O u t p u t G a s is the physical heat of the gas; Q O u t p u t D u s t is the physical heat of the dust; Q O u t p u t S l a g F e is the physical heat of the iron bead; Q O u t p u t S p l a s h is the physical heat of the splashing; and Q O u t p u t L o s s is heat loss. Other variables are defined in the same way as steel.
In the type of material output, the mass of dust, gas, splashing and so on can be obtained by the proportion. The total mass of the final slag is obtained by calculating the mass sum of all other substances except iron oxides in the final slag and the corresponding proportion in the mass of the final slag. The total mass of the final slag can be calculated as Equations (20)–(22).
M Slag = M Slag Other η Slag Other = M Slag Other ( 1 η Slag FeO η Slag Fe 2 O 3 )
M Slag Other = M Slag CaO + M S l a g SiO 2 + + M S l a g CaF 2
M Slag CaO = M Auxiliary Slag CaO + M Oxide Slag CaO
where M Slag is the quality of the final slag; M Slag Other is the mass sum of all other substances in the final slag except iron oxide; η Slag Other is the proportion of all other substances except iron oxide in the final slag; η Slag FeO is the proportion of FeO in the final slag; η Slag Fe 2 O 3 is the proportion of Fe2O3 in the final slag; M Slag CaO is the mass of various oxides in the final slag, including the formation of elemental oxidation and the introduction of auxiliary materials; M Auxiliary Slag CaO is the mass of CaO in the lime and other auxiliary materials into the slag; and M Oxide Slag CaO is the mass of CaO generated by the oxidation reaction into the slag.
Lime is taken as an example to calculate the sum of the compound mass in the slag brought by lime, which is illustrated as Equations (23)–(25).
M Lime Slag CaO = M Lime × η Lime CaO M Lime × η Lime S · 56 32
M Lime Slag MgO = M Lime × η Lime MgO
M Lime Slag = M Lime Slag CaO + M Lime Slag MgO +
where M Lime Slag CaO is the mass of CaO in the lime added into the slag; M Lime is the mass of the added lime; 56 32 represents the conversion coefficient of S to CaS; M Lime Slag MgO is the mass of MgO in the lime added into the slag; and η Lime CaO is the proportion of CaO in the lime. The other symbols have the same meaning as above.
To evaluate the energy utilization situation in the EAF steelmaking process, the EUE of the EAF is defined as the ratio of the physical heat of the molten steel to the total energy input of the EAF, which is illustrated as Equation (26).
η EAF = ( Q Steel EAF / Q Input EAF ) × 100 %
where η EAF is the EUE; Q Steel EAF is the molten steel physical heat; and Q Input EAF is the total energy input.

3. Association Rule Methodology

The tool used for data analysis in this article is Python 3.10, and the compiler uses PyCharm community. As a high-level programming language, Python has a wide range of applications, including data analysis, artificial intelligence, machine learning, and more. This paper uses Python’s rich third-party libraries, such as NumPy, Pandas, Scikit-learn, aPriori, etc., to bring about various data processing functions to achieve complex data processing.
Figure 2 shows the general research framework of this study, including the four main steps, i.e., the EAF raw data preparation, data cleaning, data feature selection, and association rules algorithm.

3.1. Data Preparation

When an EAF is smelting, the energy produced by the arc discharge and the physical heat of the HM heat the metal to the melting temperature. The metals are melted and mixed while chemical reactions take place, providing chemical heat. The electrode position is controlled to adjust the current intensity; the oxygen gun flow is controlled to adjust the oxygen supply; the amount of carbon, natural gas and other auxiliary fuels, and lime is controlled, in order to achieve the purpose of raising the temperature of the liquid steel; and the content of harmful elements is controlled, before the metal melting process is completed.
The production data of the EAF steelmaking process mainly comes from the three-level data information system and the programmable logic controller (PLC) production data. C# programming language was used to develop a three-level data acquisition module, and KEPServerEX 6 software was used as a third-party OPC server to build a PLC data acquisition platform, which classified and archived the obtained data and stored them in a specific table of the database.
Combined with the principle of the EAF steelmaking process, this study divides the data of factors that influence the EUE into three categories: (1) metal charge data (2) process feeding data, and (3) steelmaking rhythm data. The metal charge data and process feeding data directly reflect the energy supply situation in the smelting process of the EAF, while the steelmaking rhythm data reflects the rhythm of the steelmaking process. The input of matter and energy at different stages directly affects variations in the condition of the furnace and the temperature. The approach of dividing the smelting process into stages helps analyze the impact of the electrical energy and oxygen inputs at different stages on the EUE. The smelting rhythm can be monitored through real-time production data, such as the stage oxygen consumption, stage power consumption, lime addition points at each stage, and other parameters in the steelmaking process.
According to the average smelting cycle of the EAF, the steelmaking process is divided into four stages. In each stage, the electrical energy and oxygen inputs provide the energy required for the melting and heating of the metal charge. In the first stage, the electrodes supply power to provide energy to the furnace. Oxygen is injected into the molten bath through the oxygen lances, causing oxidation reactions to occur in the furnace. The scrap and other metal materials gradually melt. The second and third stages are the active periods of the oxidation reactions. A continuous electrical energy is supplied, and oxygen reacts vigorously with elements such as C, Si, Mn, and P in the molten bath. At the same time, high-speed oxygen jets enhance the mixing of the molten bath, accelerating the mass transfer within the bath. The scrap melts rapidly. Lime and other auxiliary materials are added into the molten bath as slagging agents to remove the harmful elements from the molten bath. In the fourth stage, all the scrap is dissolved, and the smelting process transitions to the flat bath smelting. During this process, the slag is discharged through the furnace door, which absorbs the oxidized products of Si, Mn, P, and other elements from the molten bath. Afterward, the operators promptly increase the temperature and adjust the composition of the molten steel. Finally, when the temperature and composition of the molten steel meet the requirements, the smelting process is stopped, and the steel is tapped out. Furthermore, lime is used as a flux for the removal of harmful elements such as P and S in the furnace. Lime melting and chemical reactions absorb or release energy, affecting the furnace temperature and the amount of slag tapped from the furnace door, which takes away more heat and impacts the EUE. The above data can be collected by the data acquisition system, and the operating status of the equipment and the cumulative consumption of each stage can be clearly understood.
Based on the analysis above, this study divided the power supply and oxygen supply in the smelting process into four stages. The electrical consumption and oxygen consumption in each stage can be calculated by measuring within an 8 min time interval. By analyzing the average smelting time in this paper, 0~8 min is the first stage, 8~16 is the second stage, and 16~24 is the third stage. From 24 min to the end of the smelting, the smelting time was divided into the fourth stage, and the cumulative material consumption data of each stage were counted as the smelting rhythm data, to explore the influence of the energy input at each stage on the energy utilization efficiency. The timing of the lime addition can be calculated by measuring the time intervals between the three lime additions and the start of the smelting process. The influencing factors related to the EUE are shown in Table 1.

3.2. Data Cleaning

Due to the harsh conditions of the steelmaking process, there are phenomena such as data fluctuations, data gaps, and data anomalies in the production data obtained through the PLC and data acquisition system [38,39]. These phenomena have a significant impact on the evaluation indicators of the EUE. Therefore, before conducting an evaluation and analysis of the EUE, it is necessary to detect and clean the raw data, eliminate abnormal data, and avoid the impact caused by erroneous data. In this paper, the methods of data pre-screening and AE cleaning were used to remove missing data, abrupt data, data deviating from the normal range, and data with a large reconstruction error.
Unsupervised learning means that in the training stage, the training dataset of the model only contains input features, without corresponding output tags. Auto-Encoder (AE) [40,41] is an unsupervised neural network that can extract features to reconstruct data. Its basic structure consists of an encoder and decoder. The encoder extracts the latent code of the input data X , while the decoder reconstructs the inputs based on the latent code as consistent as possible with the inputs.
Using an AE for the data cleaning, an autoencoder model must first be built, that is, a neural network structure including an encoder and decoder must be defined, the number of hidden layers and nodes must be determined, and the activation function and loss function of the autoencoder must be defined. Secondly, the dataset must be standardized; the data scaled to a given range; the number of complete iterative training sets determined, along with the number of samples for each training; the proportion of training sets delimited; and the training dataset used to train the autoencoder model, constantly optimizing the neural network structure through hyperparameter optimization, monitoring the training time and convergence of loss functions, etc. To ensure the effectiveness of the training, the autoencoder can learn effective representations of the data and use these representations to reconstruct the input data. Finally, the trained autoencoder is used to reconstruct the data of the test set, and the difference between the reconstructed data and the original data is calculated. Samples with large reconstruction errors can be marked as abnormal data, and the abnormal range can be delimited by setting thresholds. After identifying abnormal data, the data are screened, and the data points with large reconstruction errors are regarded as abnormal and eliminated.
The encoder provides a low-dimensional representation of the extracted features, that is, the latent variable Z . The decoder decodes Z and obtains the reconstructed representation of the data A E ( X ) as in Equations (27) and (28).
Z = E c ( X ) = σ ( a E c X + b E c )
A E ( X ) = D e c ( Z ) = σ ( a D e c Z + b D e c )
where σ ( ) is a nonlinear activation function; and a E c , b E c , a D e c , and b D e c represent the weights and biases of the encoder and decoder, respectively.
The training objective of the AE is often set to minimize the input data reconstruction error R e A E ( X ) , which is the difference between A E ( X ) and X as in Equation (29).
min A E { R e A E ( X ) } = min A E A E ( X ) X 2 = min A E i = 0 n ( A E ( X i ) X i ) 2
where A E ( X ) X 2 represents the L 2 norm. The L 2 norm can prevent overfitting and improve the generalization ability of the model.
Theoretically, the reconstructed output of A E ( X ) should be identical to the input data X . However, for abnormal data, an AE trained with normal data will suppress abnormal information to a certain extent in the coding process. Consequently, the characteristics of the abnormal data cannot be captured well, resulting in a large difference between the reconstructed output of the abnormal data and the original input. In this paper, the reconstruction error (Re) is used for data cleaning. Under normal conditions, Re remains within the threshold range, and when the change of Re crosses the threshold and remains above the threshold, it is determined that there is an anomaly in the dataset. Through the established AE model, the Re of the dataset is calculated. It is used as the detection standard of abnormal data.

3.3. Data Feature Selection

In the EAF steelmaking process, not all variables are closely related to the EUE, and information redundancy may also have adverse effects on the model. High data dimensions can also increase the computational load. Therefore, it is essential to perform feature selection on the original data. In this study, feature selection begins with exploring the relationships between input variables and between the input and target output variables. Two analytical methods, the Pearson correlation coefficient and the Shapley additive explanations (SHAP), are used to rank the importance of the input variables and analyze the influence of each factor on the EUE.
The Pearson correlation coefficient measures the linear relationship between variables. If the coefficient is 0, there is no linear correlation between x and y. The closer the coefficient is to 0, the weaker the correlation, and the closer the absolute value is to 1 or −1, the stronger the correlation. In a heat map, a darker color indicates a larger influence of the factors on the EUE evaluation indicator. When controlling the EUE, higher requirements are needed for regulating these influential factors.
In this study, an Extreme gradient boosting (XGBoost) [42,43] model is also established and trained to complete the feature selection [44]. XGBoost constructs multiple decision tree models through iterative iterations to continuously optimize the prediction objective. During the construction of each tree, the model selects suitable features and fits the target variable based on these features. The model records the number of times each feature is selected as a splitting feature and the prediction gain brought by each feature split. By accumulating these statistics, the importance score of each feature can be calculated. The results are displayed in the form of a bar chart, forming a feature importance plot. The height of the bars represents the importance of the features, where a higher height indicates a greater contribution of that feature to the model prediction.

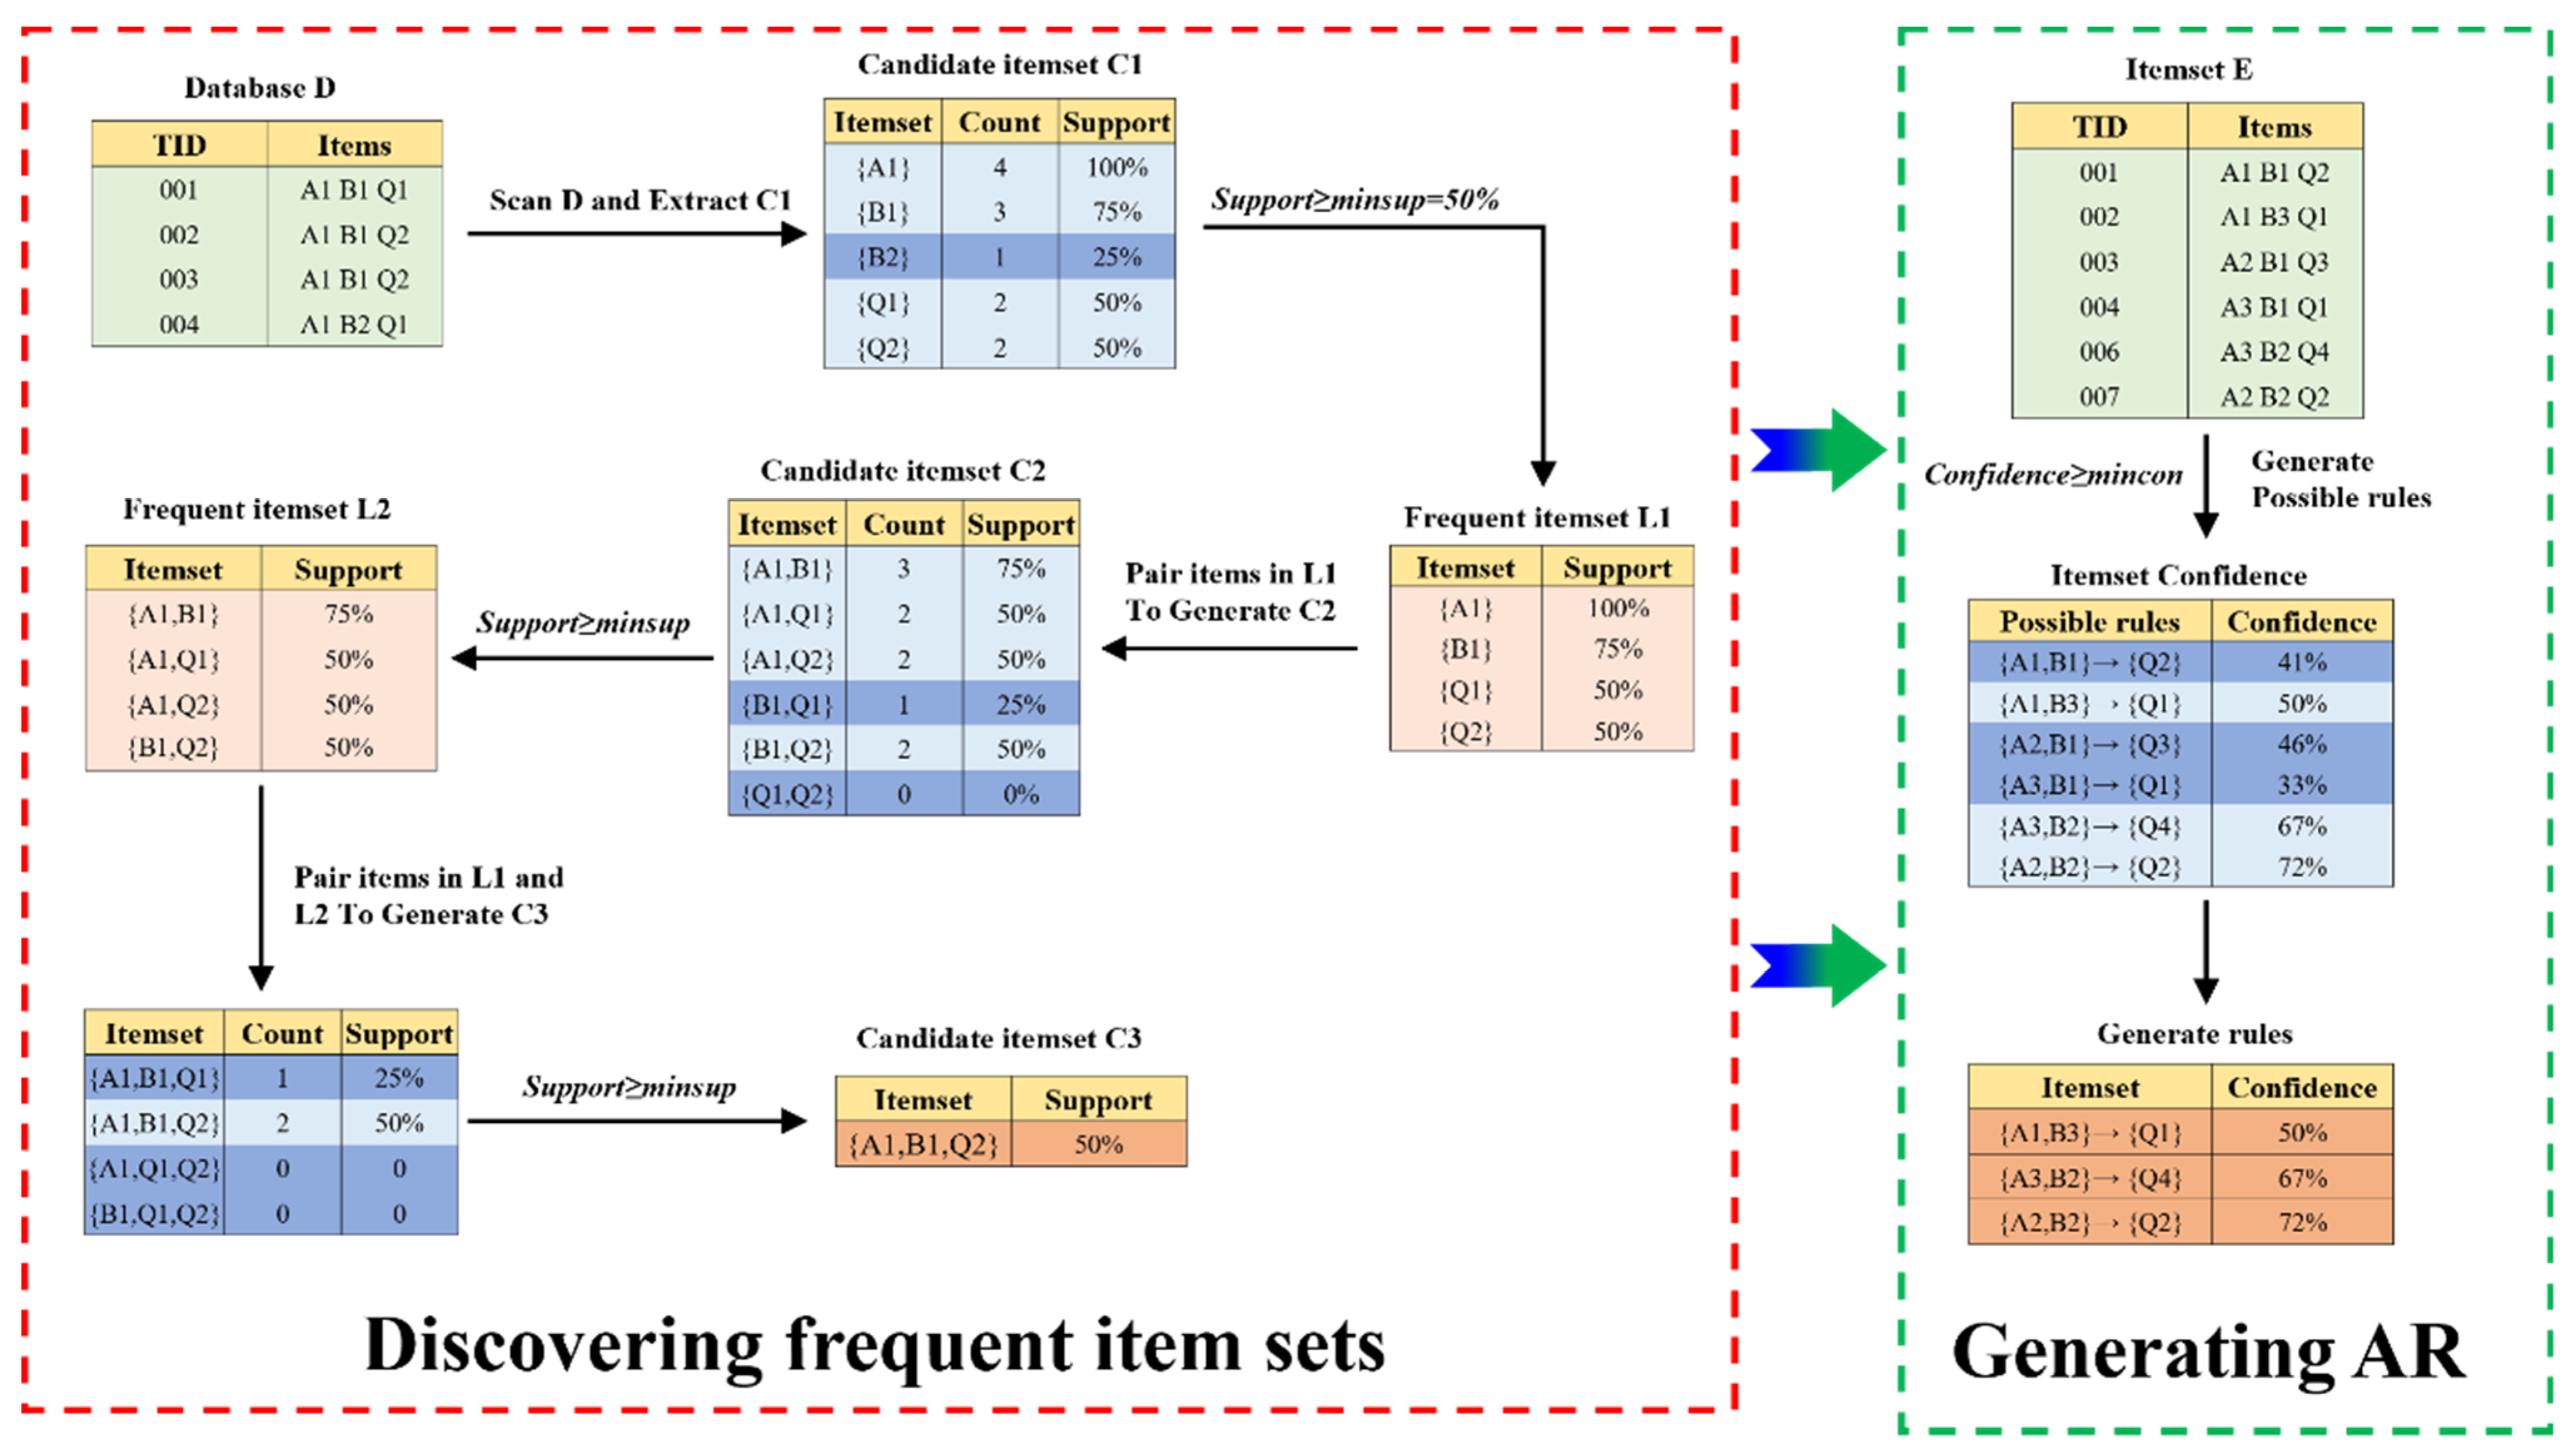
3.4. Association Rules Algorithm

The ARM aims to discover hidden associations among frequently occurring data items in a dataset. It analyzes a large volume of transaction data or sample datasets to determine the associations between itemsets, helping to understand the correlation patterns between the data and to determine reasonable parameter ranges. ARs are expressed in the form of X -> Y, where X and Y are disjoint subsets of data in the dataset, describing the occurrence of Y based on X. In this study, X represents the relevant energy features in the EAF steelmaking process and Y represents the EUE of the EAF, serving as the antecedent and consequent of the AR, respectively. The two main processes of the ARM are discovering frequent itemsets and generating the AR. Figure 3 shows the ARM flow diagram. The ARM uses support, confidence, and lift as the selection indicators. Support indicates the frequency with which an itemset appears in the entire dataset. Confidence is the conditional probability and can measure the accuracy of the AR. Lift measures the relevance of the AR and evaluates whether itemsets X and Y are positively or negatively correlated. The formulas are shown below. Additionally, the results obtained from the ARM need to satisfy a minimum support threshold (minsup) and a minimum confidence threshold (mincon). The formula for calculating the support, confidence and lift is described in Equations (30)–(32).
s u p p o r t ( X Y ) = P ( X Y ) = n u m b e r ( X Y ) n u m ( A l l S a m p l e s )
c o n f i d e n c e ( X Y ) = P ( Y | X ) = s u p p o r t ( X Y ) s u p p o r t ( X )
l i f t ( X Y ) = c o n f i d e n c e ( X Y ) s u p p o r t ( Y )
where s u p p o r t ( X Y ) represents the probability that the X termset and the Y termset will occur simultaneously and c o n f i d e n c e ( X Y ) represents the conditional probability of Y occurring at the same time that X occurs.
The AR obtained cannot be used directly. Post-processing is required to extract usable rules. This includes rule grouping, rule comparison, and expert analysis. Rule grouping involves grouping the ARs that have the same antecedents and similar consequents. Rule comparison is performed to extract rules that best reflect the EUE smelting patterns within each group, based on confidence. The compared rules are further analyzed, combined with the principles of the steelmaking process and the knowledge of steelmaking experts, to filter and interpret the rules.

4. Results and Discussions

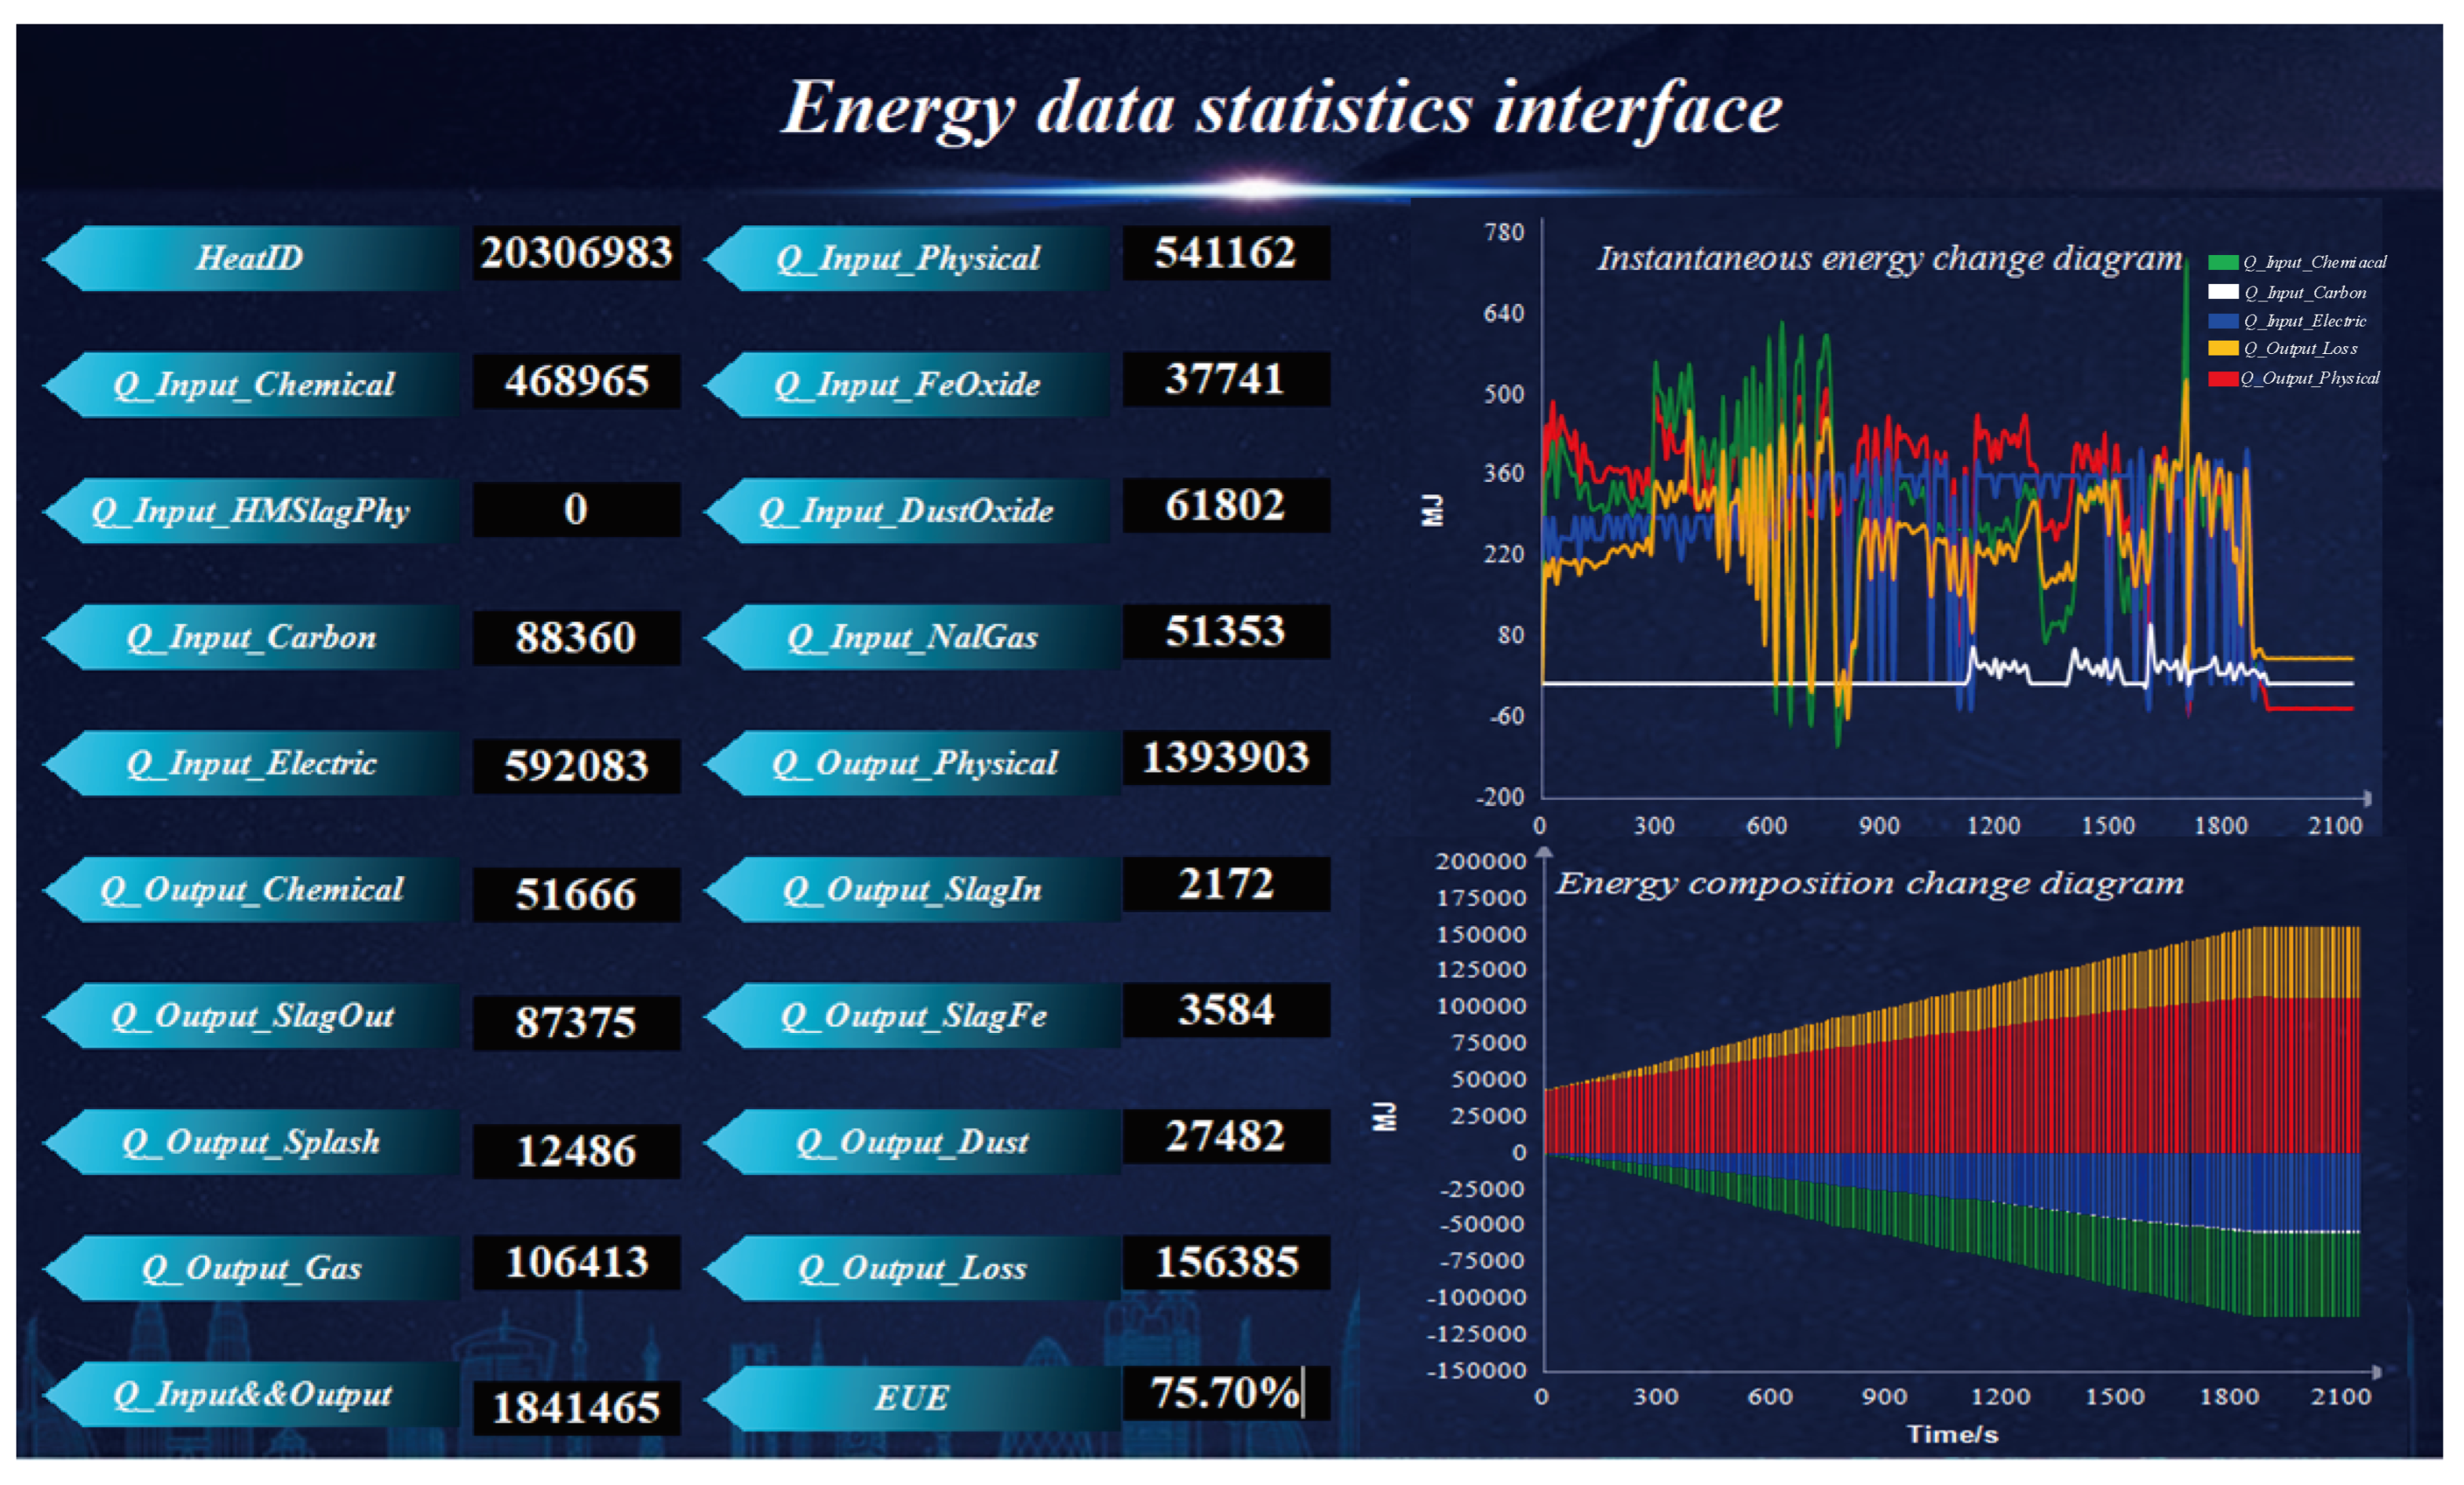
4.1. Energy Model of the EAF Steelmaking Process

The energy model V1.0 development tool for the EAF steelmaking process adopts Microsoft Visual Studio 2013 and chooses C# as the programming language. The database management system selected is the Microsoft SQL Server 2012 database, facilitating operations such as retrieval, addition, modification, analysis, and integration for users. In this model, the energy input and output are calculated as units of tons of steel, based on the collected material data information and the actual steel production of the EAF. The calculated results are displayed on the interface. After the smelting is completed, the model automatically calculates the EUE with the observations of the energy flow and the utilization by on-site operators. The statistical interface of the energy data is shown in Figure 4. The energy composition and flow of the furnace number ‘20306983’ has an HM ratio of 0.48 and an HM temperature of 1333 °C, as shown in Figure 5.

4.2. Node Optimization of the AE Data Cleaning

To ensure that the data are within the same scale range, the original data need to be normalized before data cleaning. The Min–Max method is used to scale the input features to the range of [0, 1]. A Multi-Layer Perceptron (MLP) is used as the AE model with one hidden layer. To seek the best model performance, the number of nodes in the hidden layer is set as a hyperparameter to be optimized, with a constraint that the number of nodes should be between 6 and 19, with a step size of 1. A grid search method is used to search for different combinations of the number of nodes in the hidden layer. To accurately evaluate the cleaning effect of the different numbers of hidden layer nodes in the AE model, the best hyperparameter configuration is selected through a 5-fold cross-validation. The negative mean square error (NMSE) is used as the performance metric to evaluate the machine learning models in this study. The NMSE can be obtained as in Equation (33). The results of the 5-fold cross-validation are shown in Table 2.
N M S E = 1 n i = 1 n ( y i y ^ i ) 2
In the table, the “Node” column represents the number of nodes in the hidden layer. “Spliti” denotes the i-th cross-validation result, with i ranging from 0 to 4. “Mean” indicates the average test score, which is higher for a better model performance, considering that it represents the negative mean square error. “Std” represents the standard deviation of the test scores, indicating the degree of variation in the model performance across different data folds. A higher value suggests greater fluctuations on different data partitions. “Rank” refers to the ranking of the test scores. Based on the table above, it can be concluded that the model performs best when the number of nodes in the hidden layer is 18.
The AE model is built through the best hyperparameters and is trained and reconstructed on the entire dataset. The reconstructed data are compared with the original data, the difference between the two is calculated, and the threshold is set as 3.0. If the gap between the reconstructed data and the original data exceeds the threshold, the sample is judged to be an abnormal sample, and the data marked as an abnormal sample is deleted. The data cleaning process is complete.

4.3. Importance Feature Selection of EUE

The Pearson correlation analysis was conducted to assess the relationship between various influencing factors and EUE evaluation indicators. It quantitatively describes the direction and strength of the linear relationship between two variables. The ρ X , Y can be obtained as in Equation (34). Figure 6 shows the correlation plots for all the input and output variables based on the Pearson coefficient.
ρ X , Y = cov ( X , Y ) σ X σ Y = E [ ( X EX ) ( Y EY ) ] σ X σ Y = E ( XY ) E ( X ) E ( Y ) E ( X 2 ) E 2 ( X ) E ( Y 2 ) E 2 ( Y )
where cov represents the covariance and σ represents the standard deviation. If X and Y are independent, then ρ X , Y = 0 . 1 ρ X , Y 1 has a negative correlation when less than 0, a positive correlation when greater than 0, and the greater the absolute value, the stronger the linear correlation.
It can be observed that there is a strong linear relationship among some input variables, such as the HM weight, scrap weight, and HM ratio. These variables exhibit significant redundancy in the modeling process, and it is advisable to avoid using all three of them for modeling. However, the preliminary results show weak linear correlations between the 29 input variables and the output variable, because the chemical reactions in steelmaking are very complex, there are many factors that affect the EUE, and there may be nonlinear relationships between the factors. By comparing the Pearson index, we can note that the HM ratio, HM weight, scrap weight, power consumption in the second stage, carbon content in the HM, manganese in the HM, power consumption in the fourth stage, furnace wall oxygen consumption in the second stage, power consumption, phosphorus content in the HM, furnace wall oxygen consumption, time interval for the first lime addition, sulfur content in the HM, power consumption in the first stage, HM temperature, total oxygen consumption, and furnace wall oxygen consumption in the first stage have relatively significant linear associations with the EUE evaluation indicators. The HM ratio and HM weight are the two factors with the highest correlation to the EUE evaluation indicators. The HM weight shows a negative correlation, suggesting that the physical heat brought by the HM is one of the main sources of energy during the steelmaking process in the EAF. It affects the progress of chemical reactions and the amount of the power supply. A higher HM weight or temperature facilitates the progress of reactions but leads to a localized oxidation and the loss of iron. The scrap weight shows a positive correlation with the EUE evaluation indicators, indicating that when the scrap weight is larger, the energy in the EAF is mainly provided by electricity, resulting in less heat loss from splash, dust, and gas, thus achieving a higher EUE. Power consumption at each stage reflects the supply of electrical energy during different stages of the smelting process. Ensuring the adequate supply of electrical energy within a certain smelting time is an important measure to guarantee a smooth operation and improve the EUE. The power consumption in the second stage, power consumption in the fourth stage, and total power consumption are the factors with a significant impact on the EUE. The power consumption in the fourth stage shows a negative correlation and power consumption in the second stage shows a positive correlation. Oxygen reacts with various elements in the smelting process, so that the elements are oxidized and enter the slag or gas, which affects the EUE. It can be seen from Figure 6 that the furnace wall oxygen consumption in the second stage and the furnace wall oxygen consumption show a positive correlation with the EUE, but the correlation coefficients are relatively low. Additionally, strengthening the furnace wall oxygen consumption in the fourth stage is not conducive to improving the EUE. The carbon powder weight and natural gas consumption show negative correlations with the EUE.
Furthermore, this research also employs the Shapley values to evaluate the importance of 29 input variables by building an XGBoost algorithm model. The SHAP method calculates the average Shapley values for these 29 input variables, and Figure 7 presents the ranking result of their importance. The importance ranking of these variables roughly aligns with the importance ranking in the heat map. The result is shown in Figure 7. After comparison, 10 important data features are finally selected, including the HM ratio, HM temperature, total power consumption, power consumption in the second stage, power consumption in the fourth stage, furnace wall oxygen consumption, furnace wall oxygen consumption in the first stage, furnace wall oxygen consumption in the second stage, carbon powder weight, and natural gas consumption.

4.4. Association Rule Mining of the EUE in EAF Steelmaking

The HM ratio, HM temperature, and the operation of various stages such as the power supply and oxygen supply collectively influence the EUE. In the actual steelmaking process, the allocation of the HM is determined based on the dispatch schedule and factors such as the ladle age. Therefore, different steelmaking strategies need to be developed based on different HM ratios. In order to study the impact of process operations on the EUE, the dataset was divided based on the HM ratio and HM temperature, excluding the influence of the metal charge. Specifically, the low HM ratio range was A1 (<0.591), medium HM ratio range was A2 (0.591~0.637), and high HM ratio range A3 was (>0.637). The HM temperature feature data were divided into two levels based on the median, namely a low HM temperature range, which is B1 (<1309), and a high HM temperature range, which is B2 (>1300). By combining the levels of the HM ratio and HM temperature, the data could be divided into six groups of datasets as shown in Table 3 below. By establishing AR models for each category, the parameter range of various influential factors conducive to the EUE can be obtained.
Taking the smelting mode A1B1 as an example, an ARM analysis was conducted. The data in the EAF steelmaking process are all numerical data, which must undergo the necessary processing to meet the requirements for the AR analysis. The main strategy is to divide the numerical data into several intervals and transform the numerical values into discrete values according to the interval division. In this study, the k-means algorithm was used to perform cluster discretization on the influential factors and EUE data. The principle of the k-means algorithm is to determine similarity based on distance. The distance measurement method used in this paper is Euclidean distance, which is one of the most commonly used distance measurement methods in a k-means algorithm. The smaller the distance between samples, the higher the similarity. By selecting the 10 important features mentioned in Section 4.2, excluding the HM ratio and HM temperature, a cluster analysis was performed. The number of clusters was set to four. The results of the data clustering and discretization are shown in Figure 8.
After performing the cluster analysis, the ARM was conducted for the A1B1 smelting mode. In the input feature parameters, there were no restrictions on the antecedents of the AR, but the consequents were limited to include the EUE. The relevant threshold values in the algorithm were set as minsup = 0.03 and mincon = 0.2. A model of the ARM was established to conduct rule mining, and the original ARs were obtained. The rule post-processing was performed. To illustrate the mining results, the top five rules with the highest confidence were selected, as shown in Table 4.
The AR = (‘EL2_4’, ‘OG2_4’, ‘NAG_2’) => (‘EUE_4’,) is the optimal decision solution for achieving the EUE in the A1B1 smelting mode. The confidence level is 0.36, which means that when the itemset (‘EL2_4’, ‘OG2_4’, ‘NAG_2’) occurs, the consequent (‘EUE_4’,) will also occur with a probability of 36%. The support level is 0.03, indicating that 3% of the dataset contains both the itemset (‘EL2_4’, ‘OG2_4’, ‘NAG_2’) and the itemset (‘EUE_4’,). The lift level is 2.36, indicating that the occurrence probability of the consequent (‘EUE_4’,) is 2.36 times higher when the itemset (‘EL2_4’, ‘OG2_4’, ‘NAG_2’) occurs compared to when there is no antecedent itemset, demonstrating a significant association between the antecedent and the consequent. In addition, the table also provides alternative solutions, such as the AR = (‘ELW_1’, ‘EL2_3’) => (‘EUE_3’). Although the attainable EUE level is EUE_3, it has the highest confidence among all the rules, reaching 55%. This rule demonstrates a strong level of trustworthiness and relevance, making it a relatively safe smelting solution adopted in the steelmaking process.
The above-mentioned AR can be explained based on the principles of metallurgical processes. “EL2” represents the power consumption in the second stage, where “EL2_4” indicates a higher input of electricity during this stage. This is because the second stage is a period of intense oxidation reactions, and increasing the power supply helps accelerate the melting of scrap, promotes reactions, and speeds up the smelting process, thus enhancing the EUE. Similarly, increasing the furnace wall oxygen consumption in the second stage of the steelmaking process (represented by OG2_4) provides ample oxygen in the furnace, accelerating the oxidation process of elements like C, Si, Mn, P, and S, aiding in impurity removal, and improving the purity of the molten steel. “NAG” represents the natural gas consumption, which serves as an additional energy source in the steelmaking process. It provides energy for the melting pool, ensuring the high efficiency of the steelmaking process. These explanations align with the fundamental principles of the steelmaking process, indicating that the ARM results are consistent with the physical and chemical characteristics of steelmaking processes. They can provide guidance and optimization solutions for the smelting process.
An ARM analysis was performed on the data from the six smelting modes mentioned above and the best control schemes for the EUE were summarized by the AR algorithm, which is shown in Table 5.
According to the results of the ARM, the model interface of the optimal energy matching mode for EAF steelmaking is established. The interface of the EAF optimal energy matching model based on the ARM is shown in Figure 9. The interface consists of basic smelting information, material consumption information, the association rules mining results, the optimal energy matching mode, and historical data statistics.
In order to evaluate the effectiveness of the results of the ARM, this paper divides each EUE into three levels, namely, low (EUE ranges from 0% to 75%), medium (EUE ranges from 75% to 80%), and high (EUE ranges from 80% to 100%), and draws a stacked bar chart of the EUE before and after the use of the ARM. Figure 10 shows the proportion of each grade in the sample.
As can be seen from the figure above, with the increase of the ratio and temperature of the HM, the proportion of the EUE at a medium or high grade has a decreasing trend, which is consistent with the actual steelmaking process. At the same time, in each smelting mode, the smelting scheme obtained by the ARM has improved the proportion of the medium and high grades. In each smelting mode, the proportion of EUE above 75% is 92.7%, 94.3%, 78.8%, 79.8%, 50.5%, and 50.9%, which became 100%, 100%, 95.9%, 91.1%, 76.9%, and 77.5%, all of which had significant improvements. In the grade of a high EUE, the improvement of the A2B1 smelting mode is the most obvious, from 24.7% to 53%. The above results show that the smelting strategy obtained by the ARM has a great effect on improving the EUE.

5. Conclusions

The EUE of EAF the steelmaking process is of great significance for energy conservation and emission reduction. Based on the mechanism of the EAF steelmaking process, this paper conducts an energy balance analysis, establishes an energy model by collecting production data, and is applied in the field. After detecting and proposing abnormal data, the relevant technologies and algorithms are used to identify the degree of influence of several factors affecting the EUE and to decide the optimal smelting scheme under different smelting modes. This study points out the direction for the energy optimization of the EAF steelmaking. The main conclusions are summarized as follows:
  • This paper analyzes the energy input and output of a 90t EAF at the Hengyang Steel Company from September 2022 to September 2023, a total of 9807 sets of data samples, and defines the calculation methods of each energy. An evaluation framework for the EUE is constructed, with the ratio of the physical heat of the molten steel to the total energy input as the evaluation parameter. Using the SQL2012 and VS2013 developed energy model to analyze the energy balance and EUE of the EAF steelmaking in multiple smelting modes, the model was applied in the field.
  • By using an unsupervised learning neural network model called AE, the 29 features that affect the EUE and the data on the EUE itself are subjected to anomaly detection and elimination for the purposes of the NMSE. A grid search method, 5-fold cross-validation, and NMSE is used to seek the best model performance. The results show that when the number of hidden layer nodes is 18, the effect of the AE model is best, and the NMSE is −0.0051. It ensures the quality and accuracy of the data.
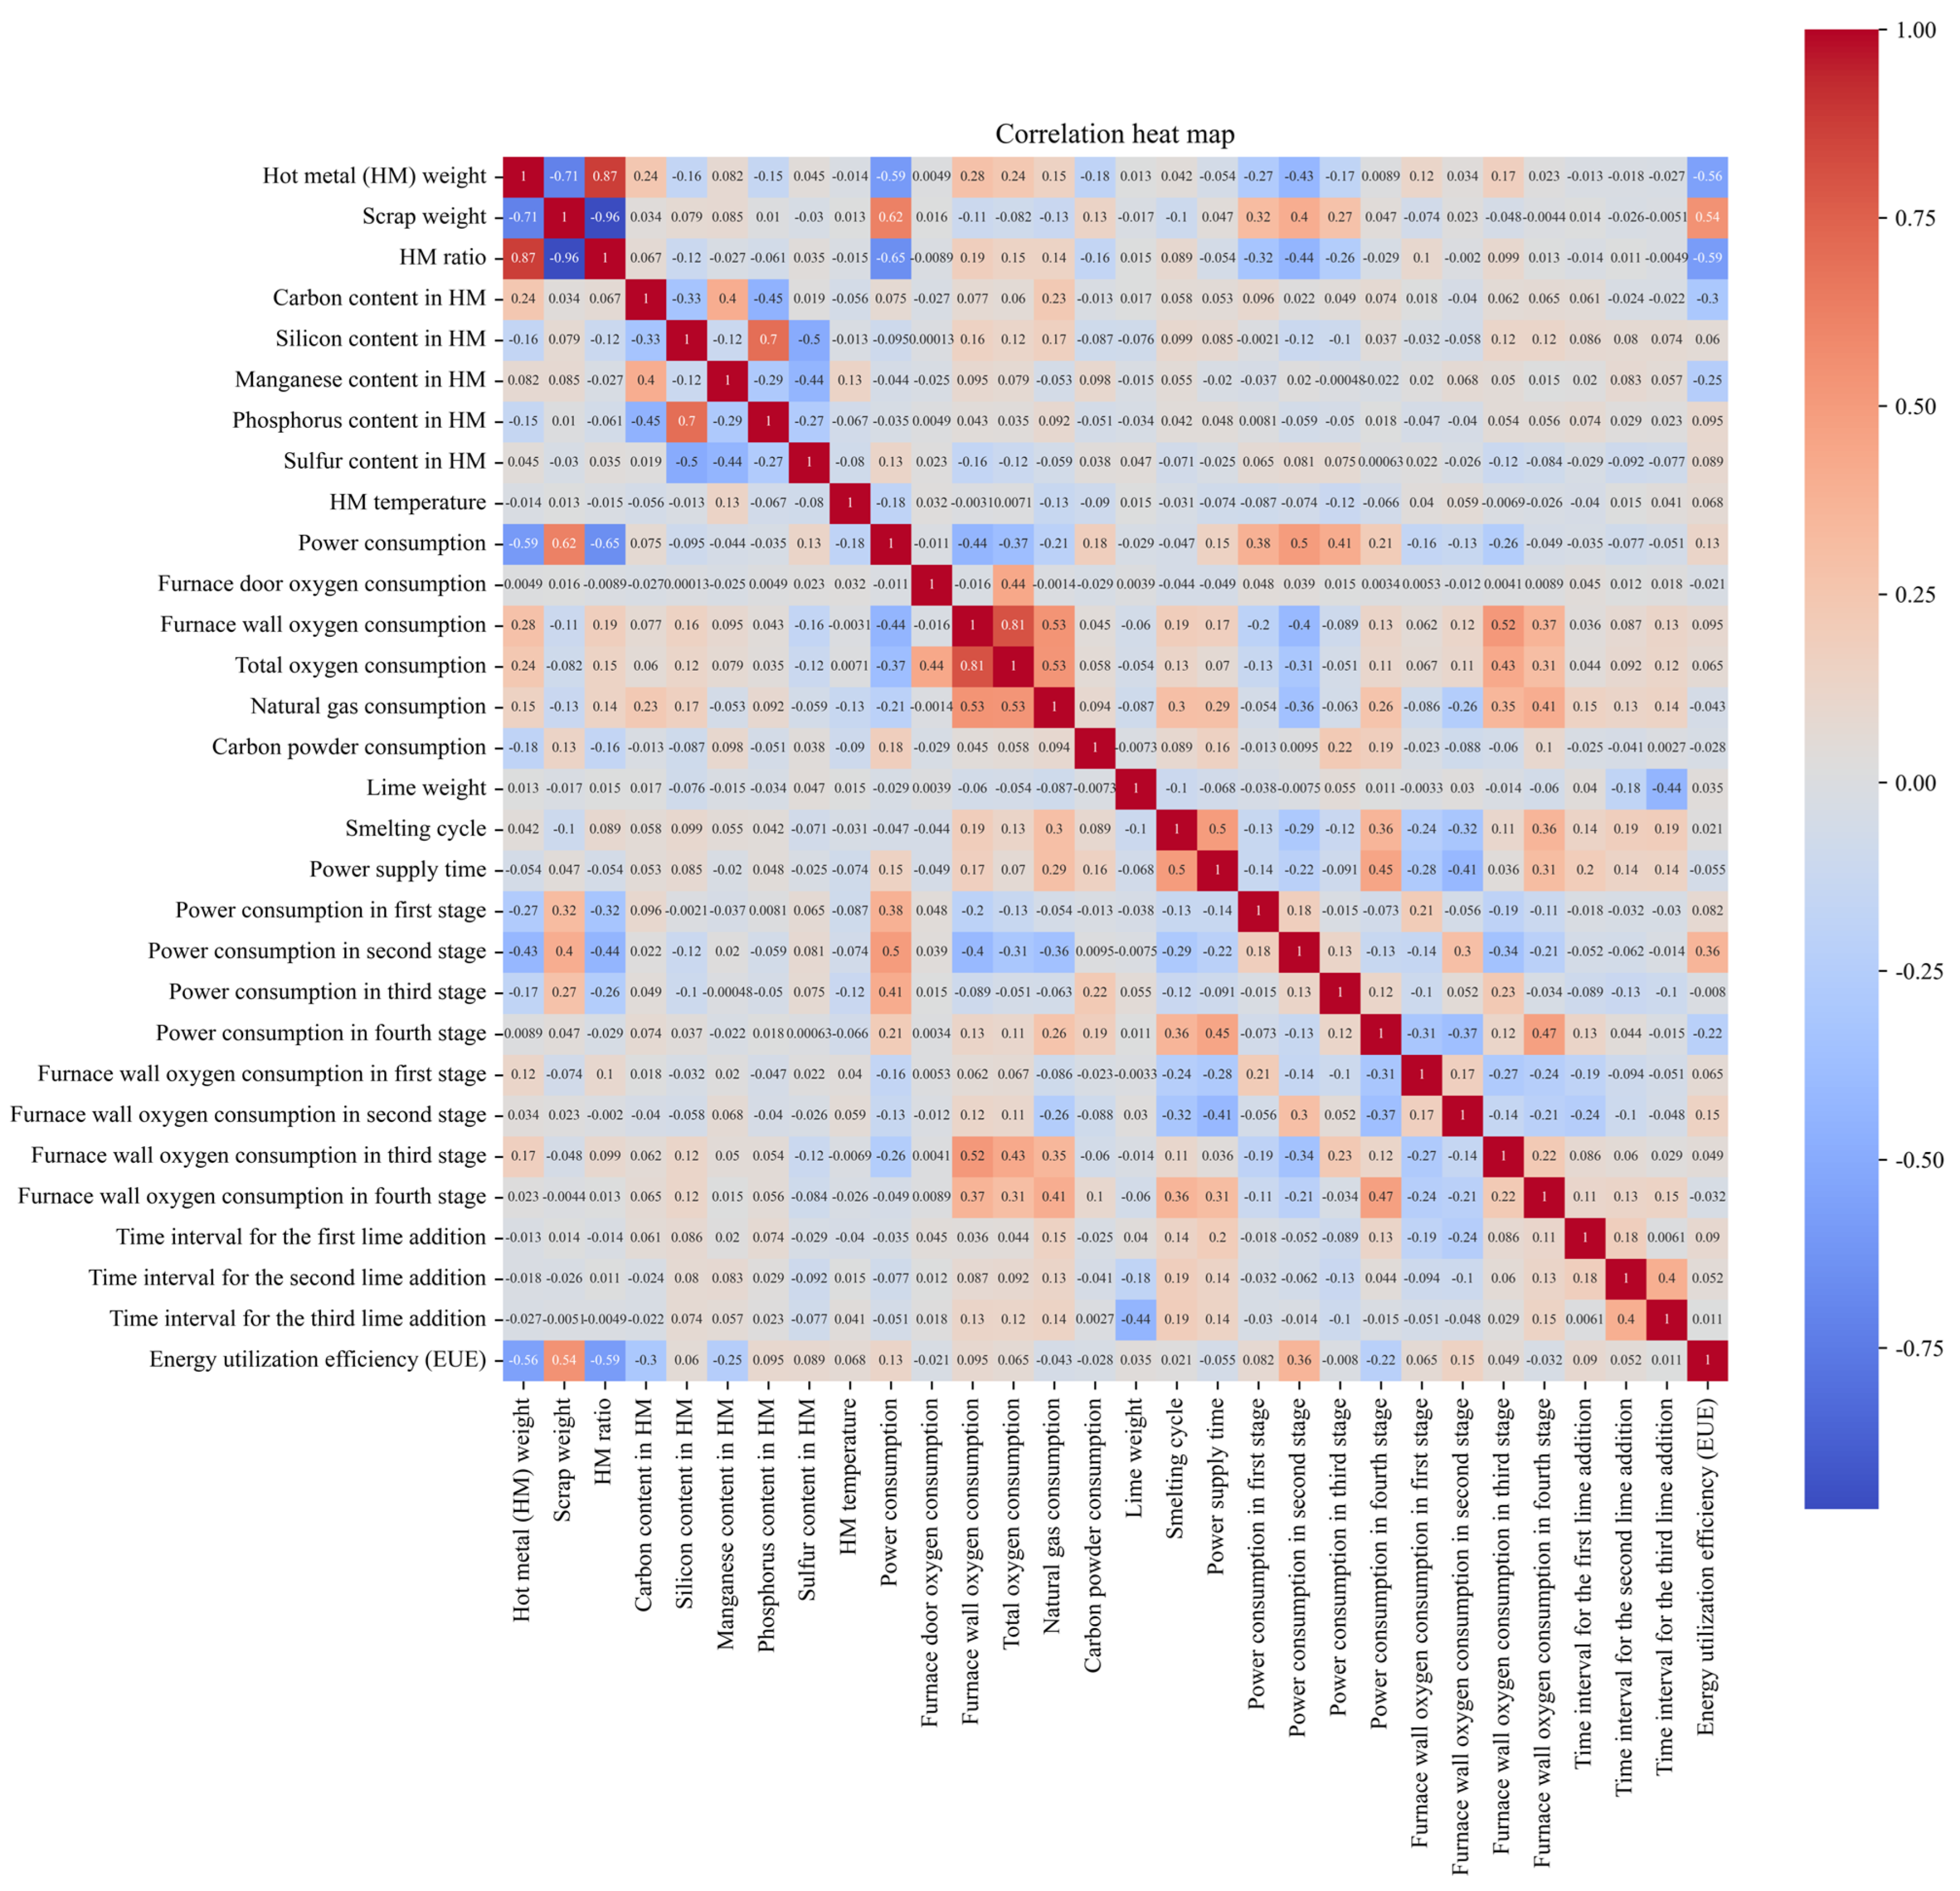
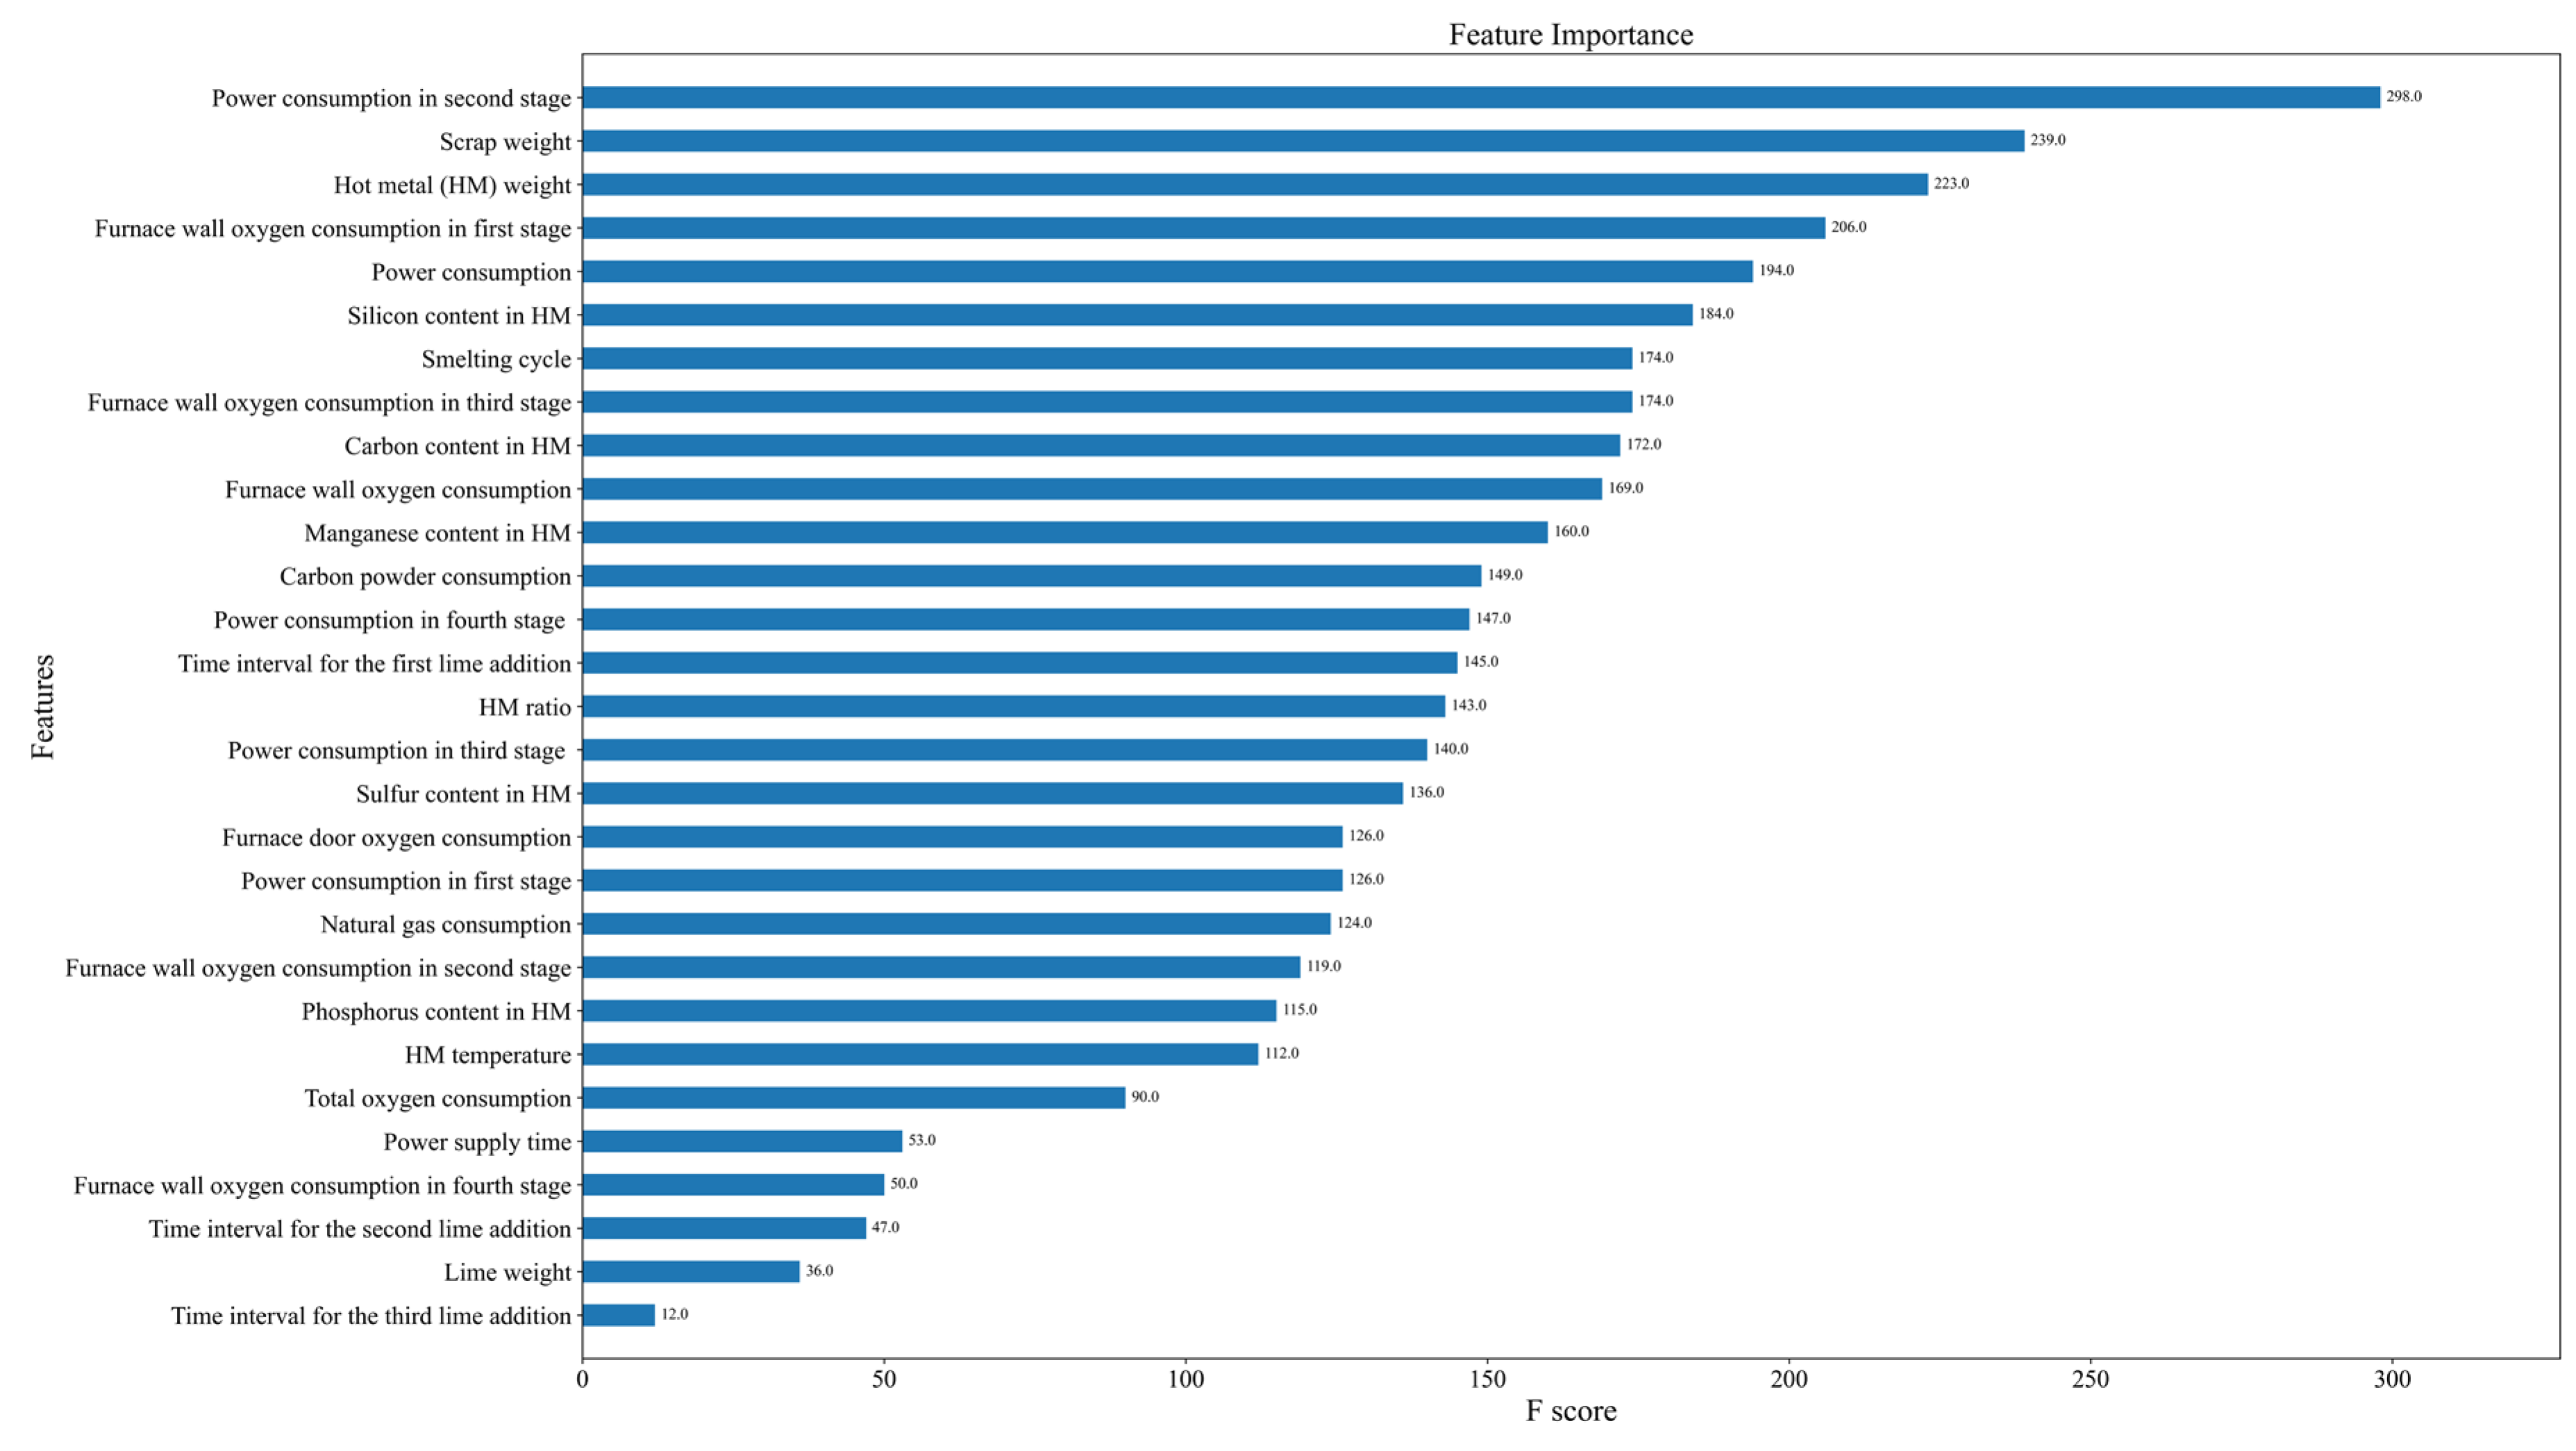
  • A correlation analysis and XGBoost model is performed on various factors to assess their impact on the EUE. The following features are identified as important data features: the HM ratio, HM temperature, total power consumption, power consumption in second stage, power consumption in the fourth stage, furnace wall oxygen consumption, furnace wall oxygen consumption in the first stage, furnace wall oxygen consumption in the second stage, carbon powder weight, and natural gas consumption. A data feature selection process simplifies the model structure.
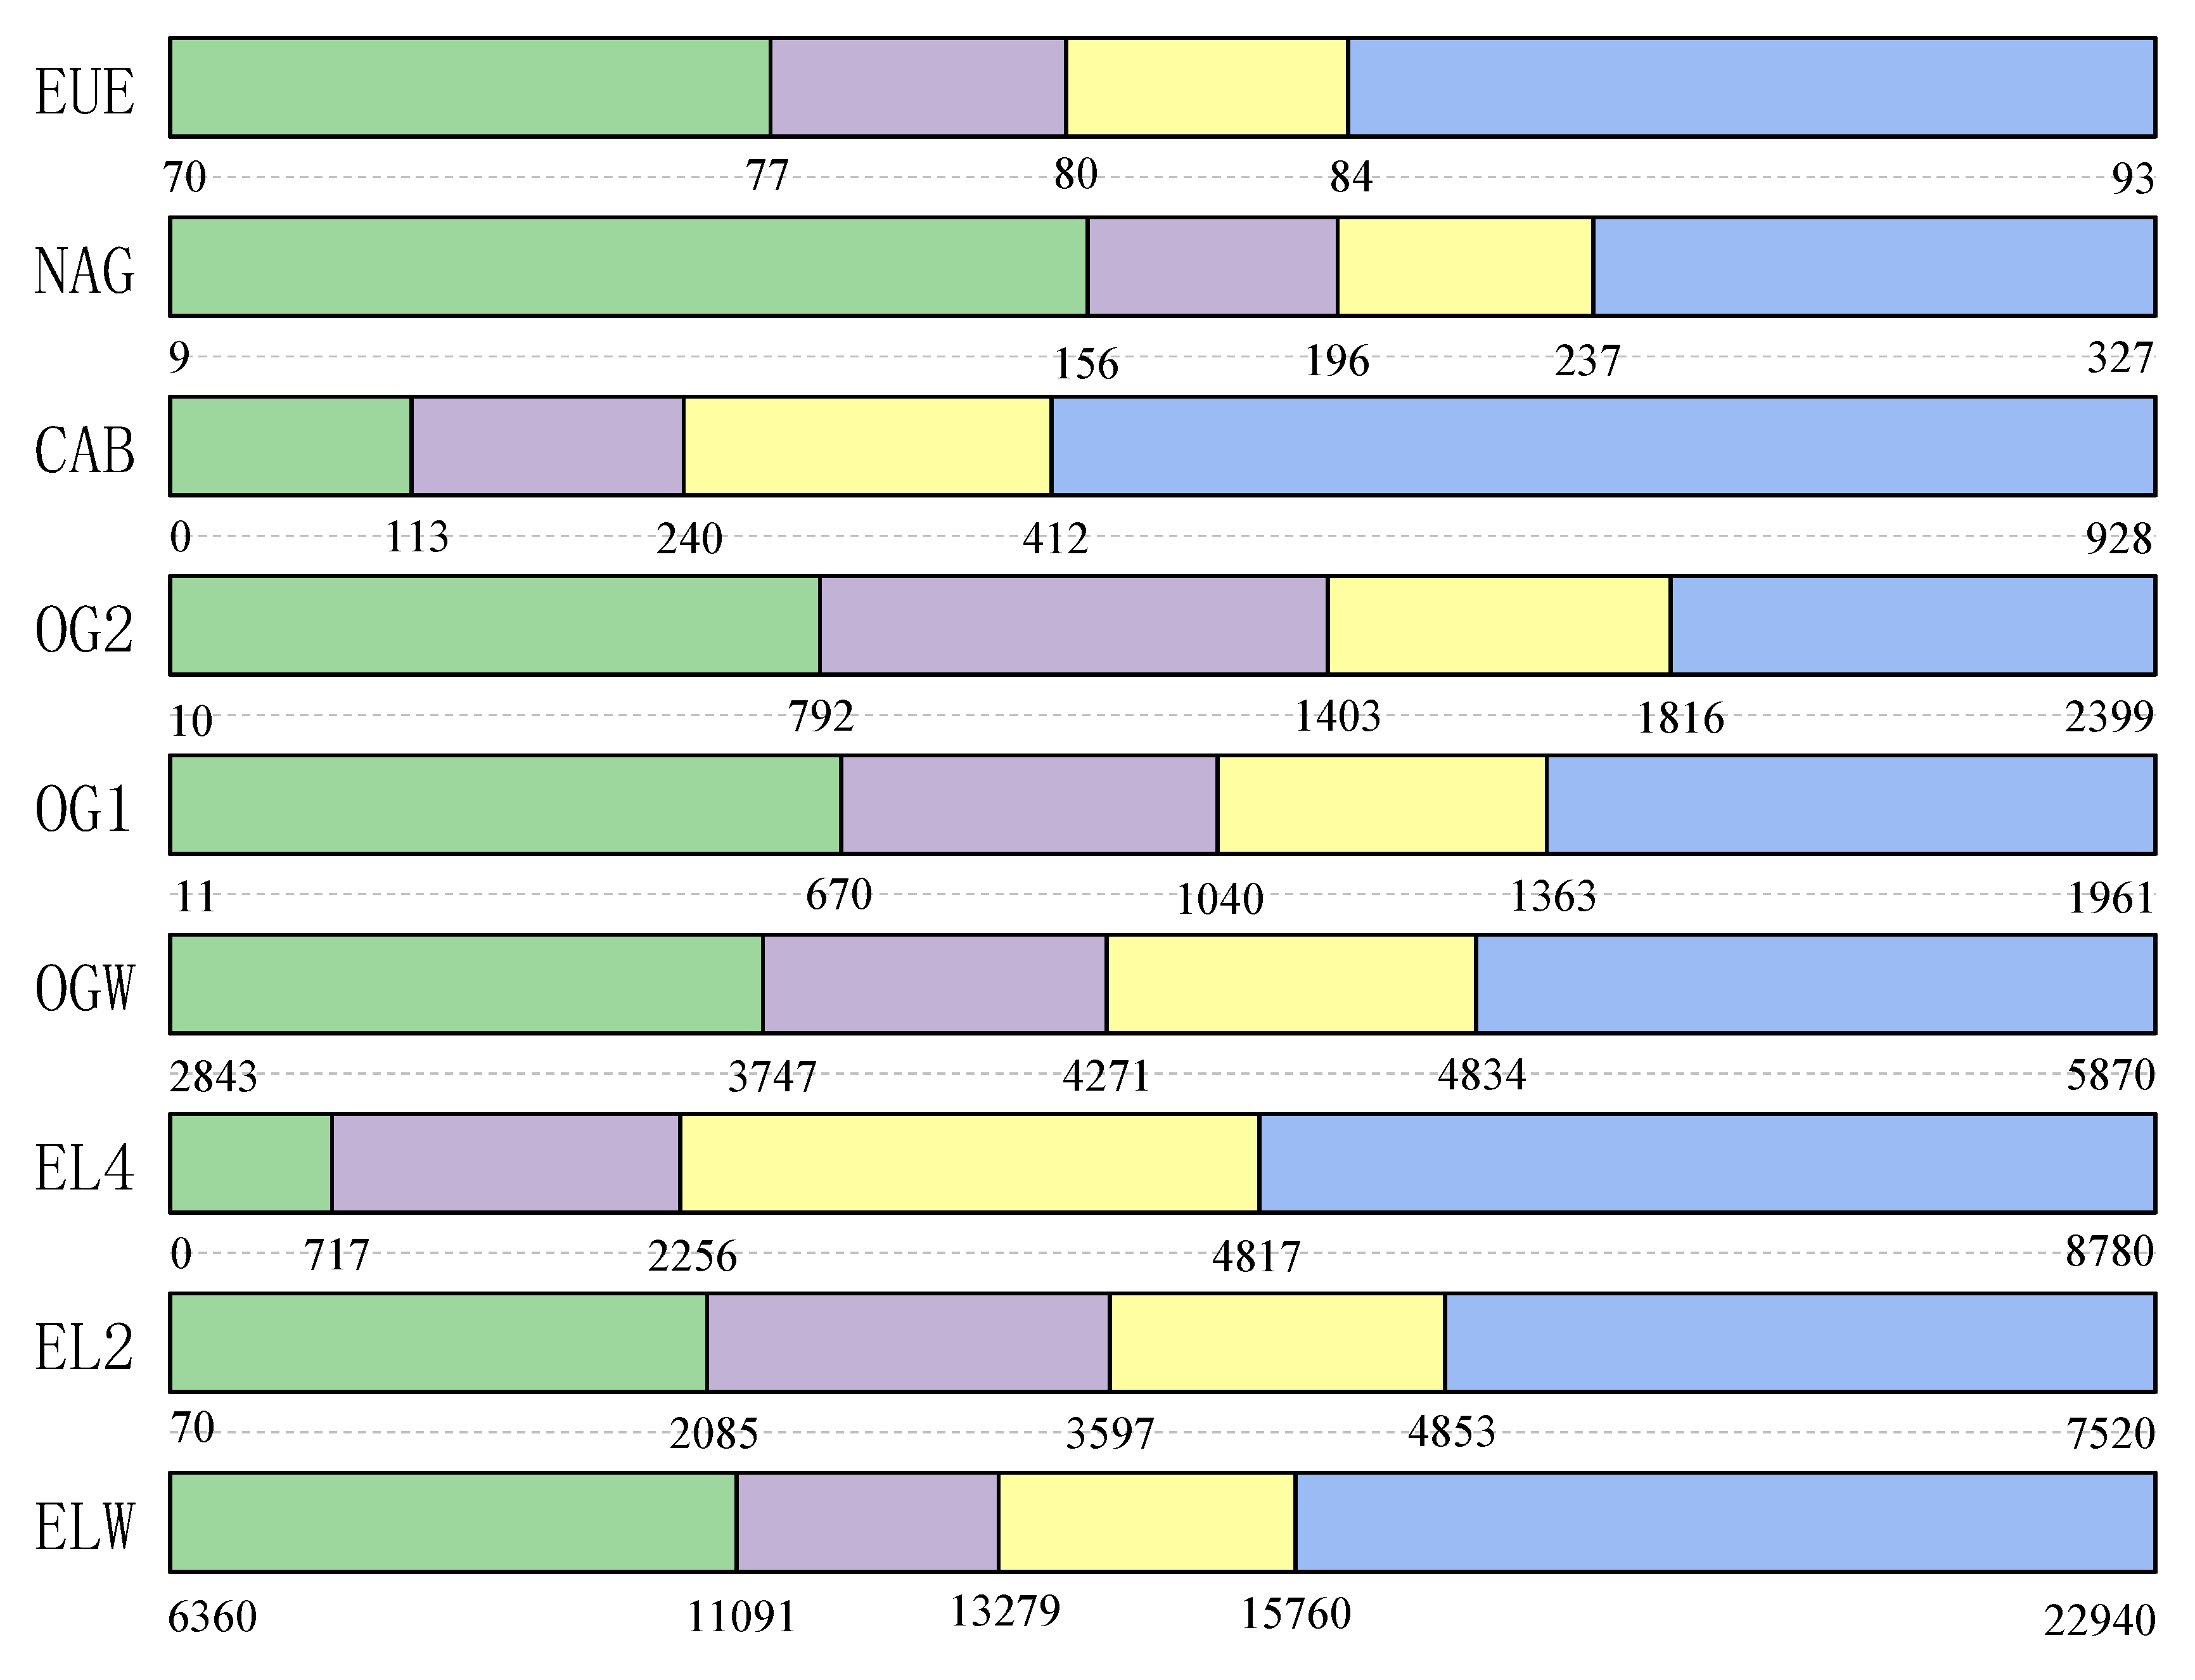
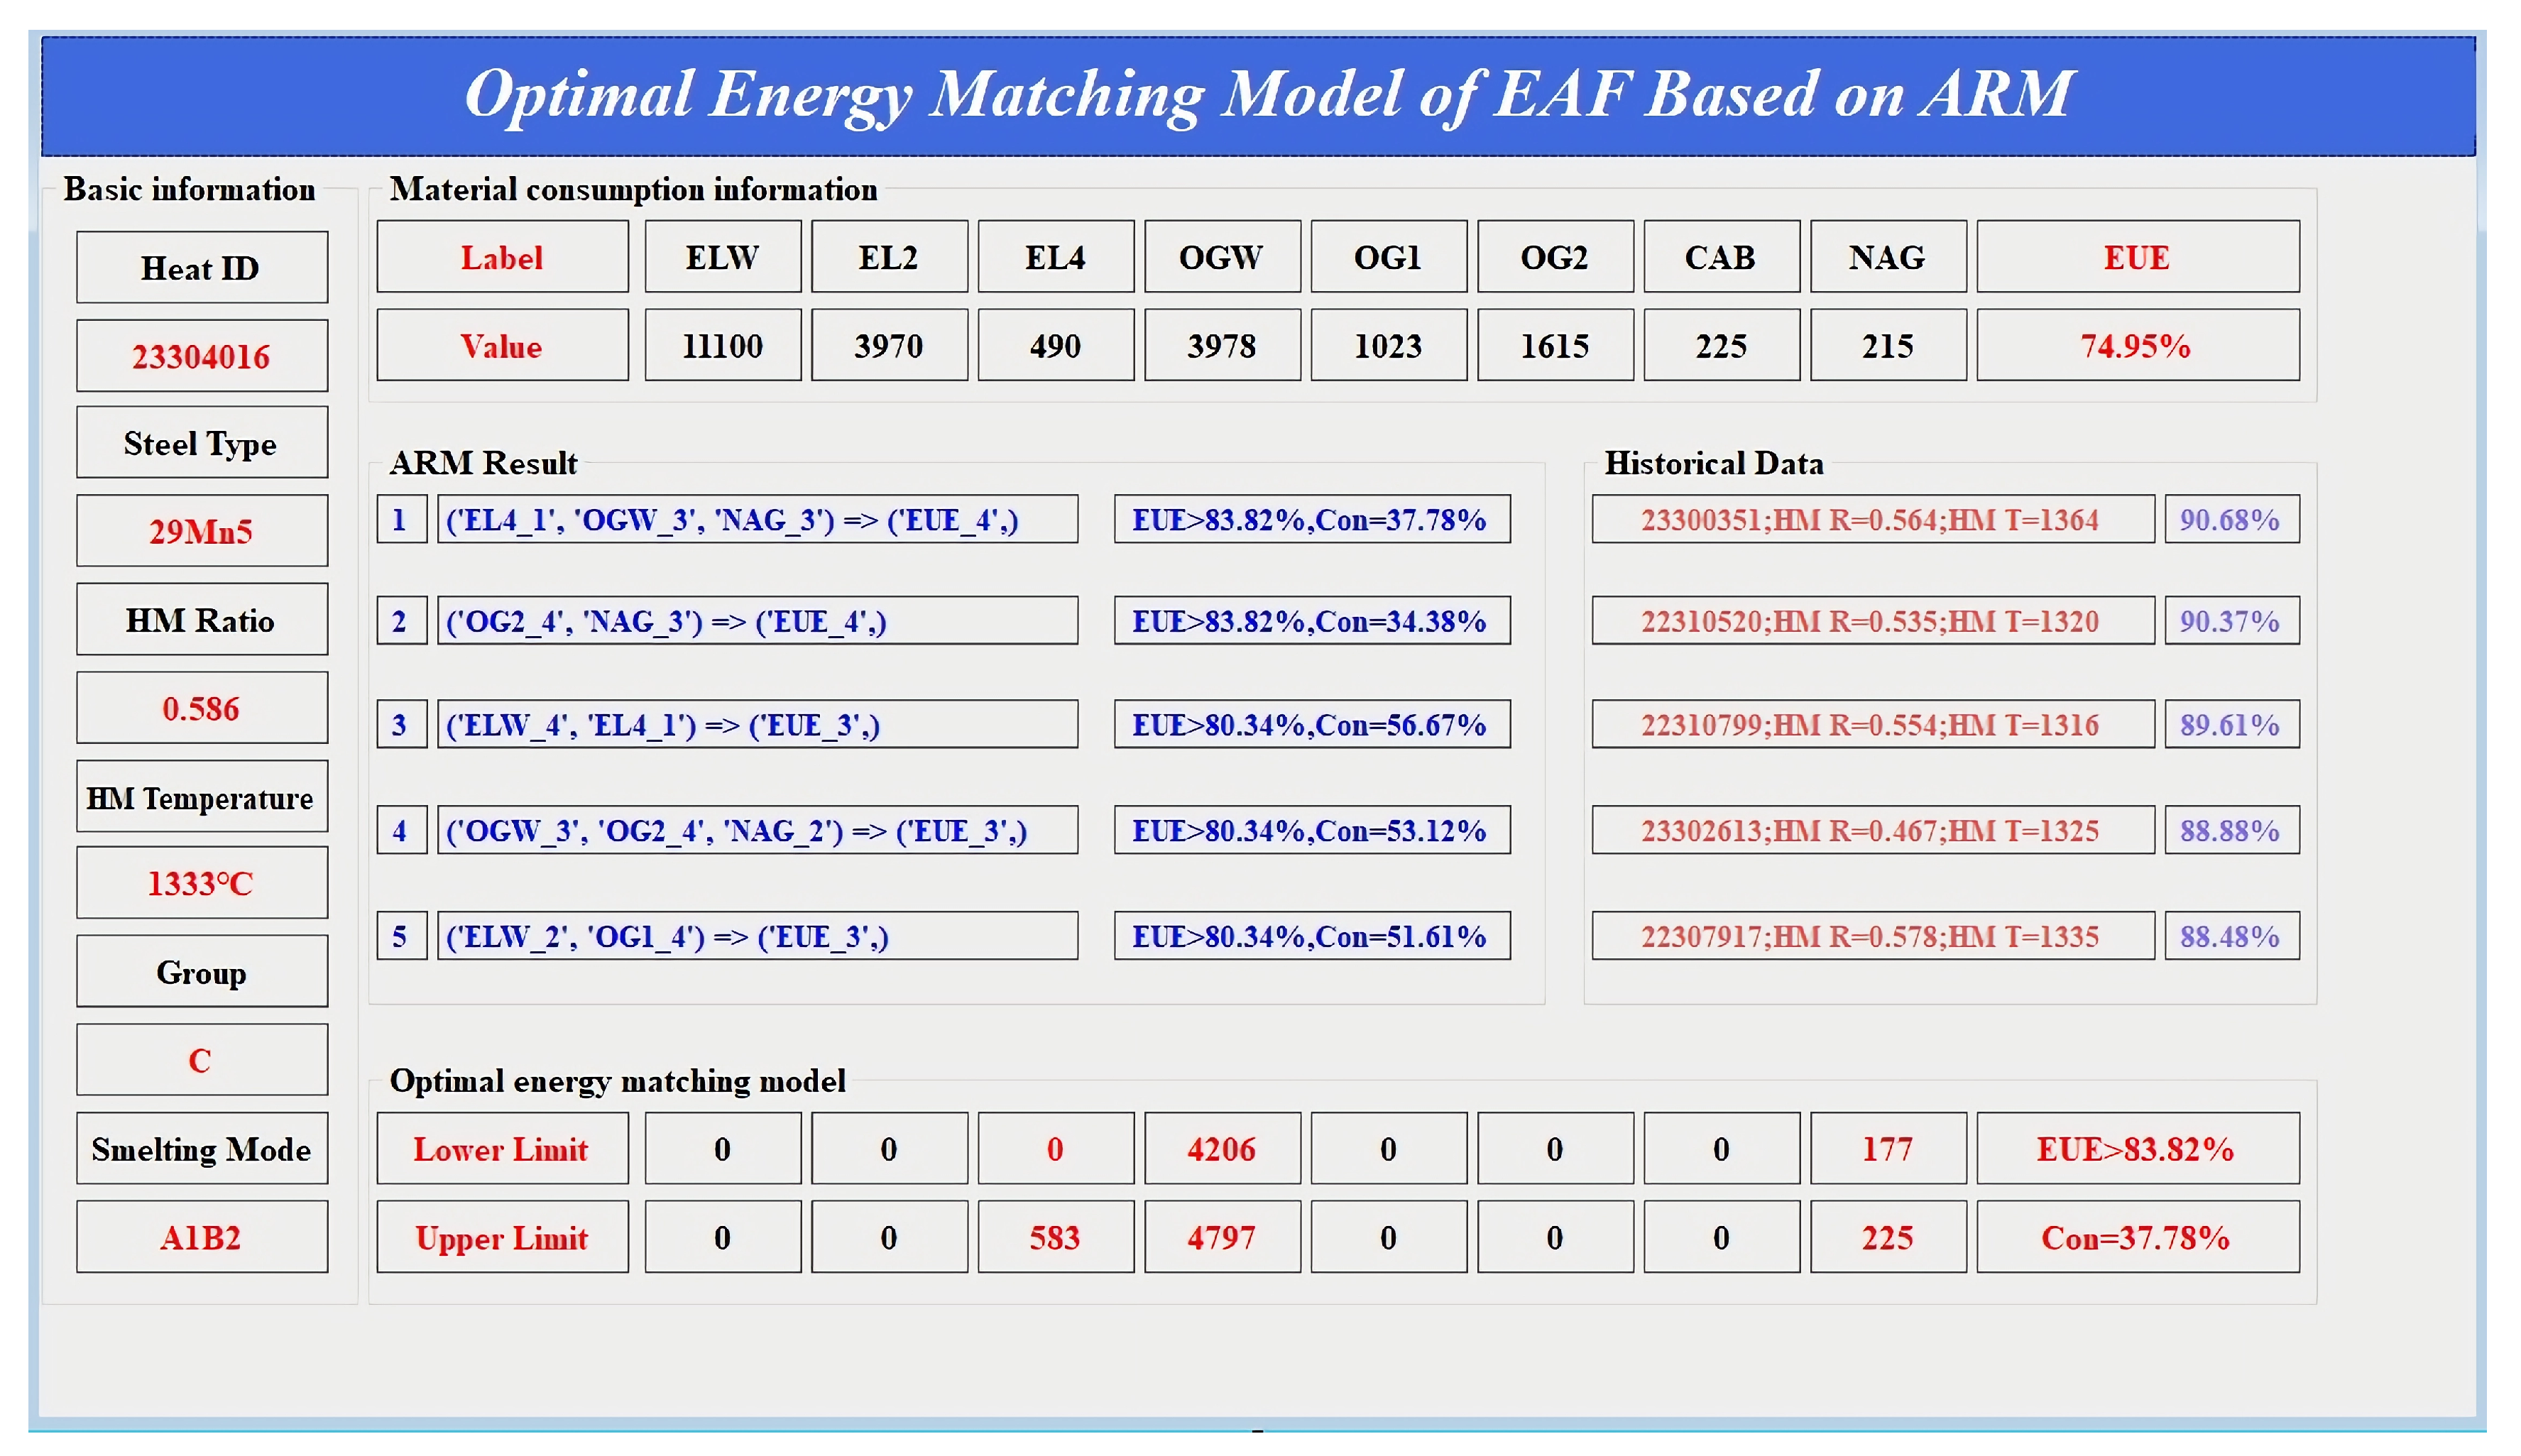
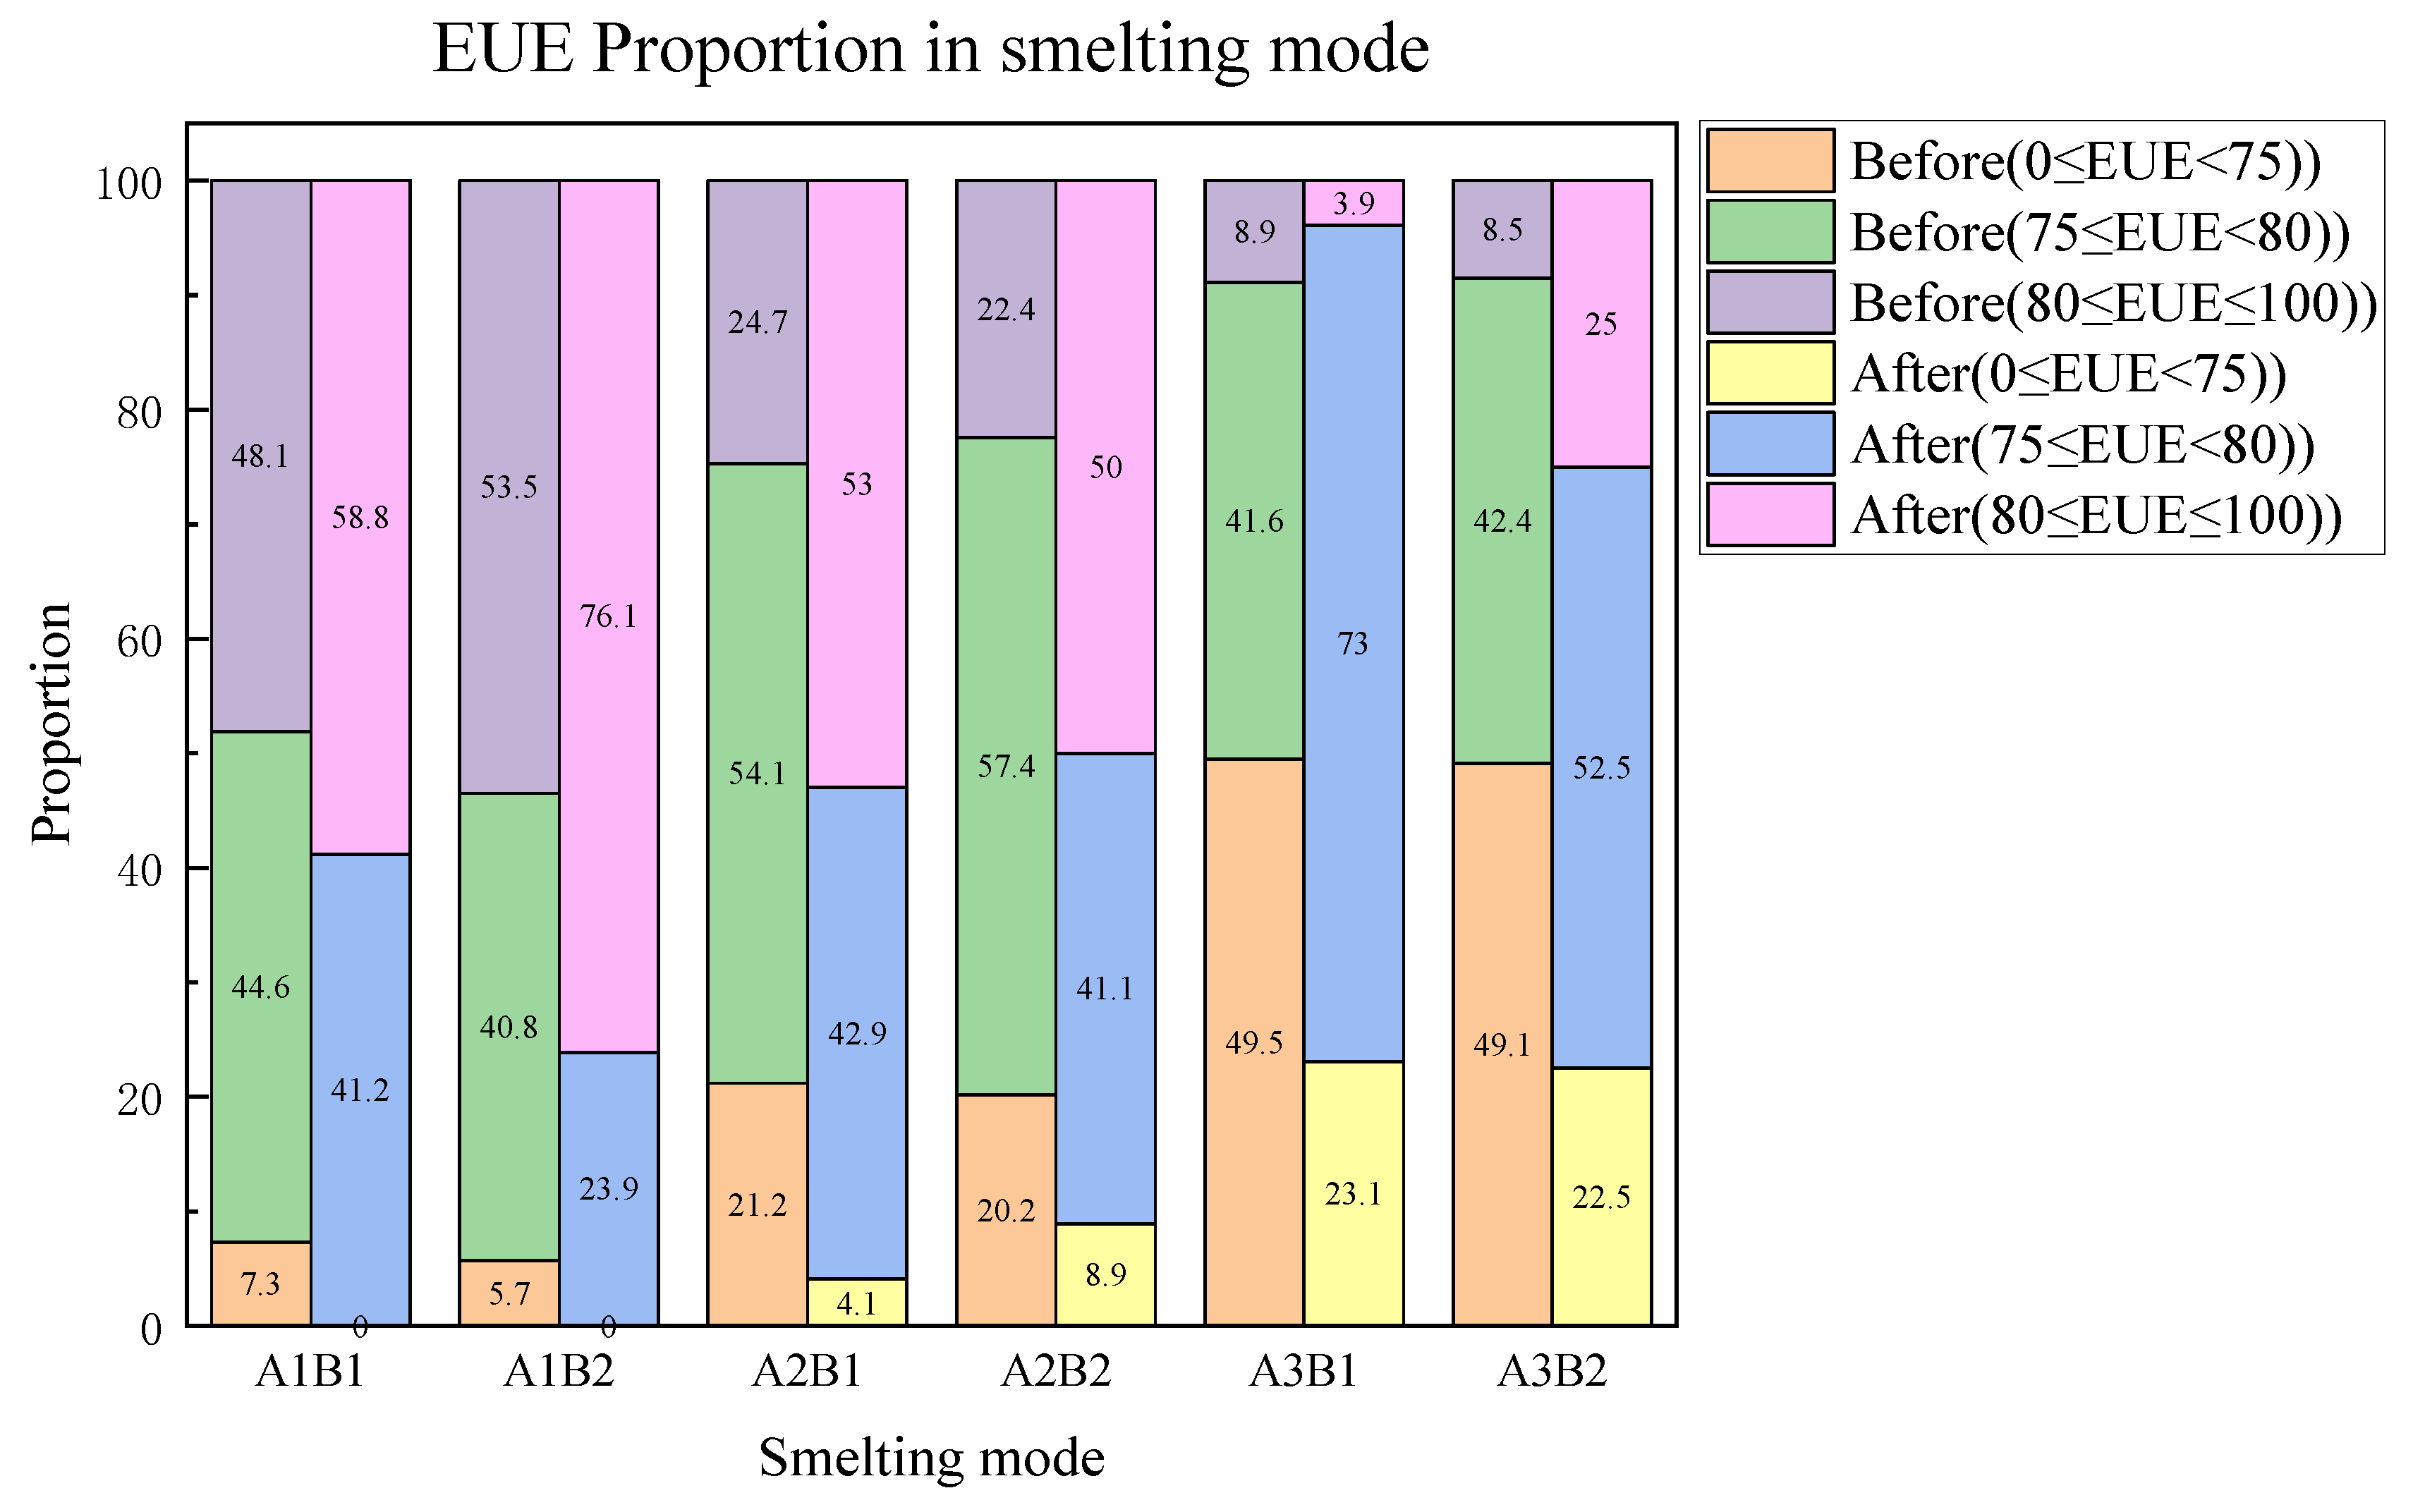
  • According to the different proportions and temperatures of the HM combined with the k-means clustering algorithm and AR algorithm, the optimization of the process operation of the EUE in the EAF steelmaking process was studied to guide the EAF steelmaking process. The results indicated that under the conditions of a low HM ratio and low HM temperature, the EUE is best when the power consumption in the second stage ranges between 4853 kWh and 7520 kWh, the oxygen consumption in the second stage ranges between 1816 m3 and 1961 m3, and the natural gas consumption ranges between 156 m3 and 196 m3. The probability that the EUE is greater than 84% is 36%. Conversely, under the conditions of a high HM ratio and high HM temperature, the EUE tends to decrease, and the EUE is best when the furnace wall oxygen consumption ranges between 4732 m3 and 5670 m3, and the oxygen consumption in the second stage ranges between 1561 m3 and 1871 m3. The probability that the EUE is greater than 78% is 48%. The results showed that the proportion of more than 75% in different smelting modes changed from 92.7%, 94.3%, 78.8%, 79.8%, 50.5%, and 50.9% to 100%, 100%, 95.9%, 91.1%, 76.9%, and 77.5%. In the high energy efficiency grade, the improvement of the A2B1 smelting method is the most obvious, from 24.7% to 53%.
  • In this study, methods such as data cleaning, feature selection, clustering discretization, and ARM were employed to obtain usable rules. However, further research is needed to improve the efficiency, accuracy, and applicability of the AR extraction. In the future, AEs and principal component analysis (PCA) can be explored to improve the data quality and the silhouette coefficient can be used to determine the number of discretization intervals for each feature, allowing for greater flexibility in selecting the optimal number of clusters. Considering the strong correlation between the power supply data of the EAF and the EUE, future efforts will focus on optimizing the power supply guidance for different smelting modes to further enhance the EUE.
  • The study of the optimal energy matching model can also be applied to different types of EAF and refining furnaces in addition to sintering, pelletizing, blast furnace ironmaking, and other upstream industries. By analyzing the material and energy of the processes, machine learning and data mining can be used to optimize the energy supply structure and improve the combustion efficiency and heat energy recovery rate of blast furnaces and reduce fuel consumption and energy waste. Similarly, this method can also be used as an evaluation index of energy saving measures such as waste heat utilization to promote the development of waste energy recovery technology and to realize the renewable utilization of waste heat.

Author Contributions

L.Y.: conceptualization, methodology, software, validation, formal analysis, investigation, resources, data curation, writing—original draft, writing—review and editing, visualization, and funding acquisition; Z.L.: software, validation, formal analysis, investigation, data curation, writing—original draft, and funding acquisition; H.H.: funding acquisition, conceptualization, software, methodology, validation, writing—original draft, writing—review and editing, and visualization; Y.Z.: software, validation, and data curation; Z.F.: software, visualization, and project administration; W.C.: visualization and data curation; F.C.: visualization and project administration; S.W.: writing—review and editing, validation, formal analysis, and project administration; Y.G.: conceptualization, resources, and supervision. All authors have read and agreed to the published version of the manuscript.

Funding

This research was supported by the National Natural Science Foundation of China (No. 52174328) and the Fundamental Research Funds for the Central Universities of Central South University (No. 2022ZZTS0134, 2024ZZTS0062 and No. 2022ZZTS0084).

Data Availability Statement

The raw data supporting the conclusions of this article will be made available by the authors on request.

Conflicts of Interest

The authors declare no conflicts of interest.

References

  1. Zhu, T.-Y.; Liu, X.-L.; Wang, X.-D.; He, H. Technical Development and Prospect for Collaborative Reduction of Pollution and Carbon Emissions from Iron and Steel Industry in China. Engineering 2023, 31, 37–49. [Google Scholar] [CrossRef]
  2. Gao, C.-K.; Wang, D.; Zhao, B.-H.; Chen, S.; Qin, W. Analyzing and forecasting CO2 emission reduction in China’s steel industry. Front. Earth Sci. 2015, 9, 105–113. Available online: https://link.springer.com/article/10.1007/s11707-014-0447-6 (accessed on 16 February 2024). [CrossRef]
  3. Zhang, J.-S.; Shen, J.-L.; Xu, L.-S.; Zhang, Q. The CO2 emission reduction path towards carbon neutrality in the Chinese steel industry: A review. Environ. Impact Assess. Rev. 2023, 99, 107017. [Google Scholar] [CrossRef]
  4. Yu, J.-Y.; Xu, R.-S.; Zhang, J.-L.; Zheng, A.-Y. A review on reduction technology of air pollutant in current China’s iron and steel industry. Environ. Impact Assess. Rev. 2023, 414, 137659. [Google Scholar] [CrossRef]
  5. Wang, X.-L.; Zhang, T.-Y.; Luo, S.-Y.; Abedin, M.-Z. Pathways to improve energy efficiency under carbon emission constraints in iron and steel industry: Using EBM, NCA and QCA approaches. J. Environ. Manag. 2023, 348, 119206. [Google Scholar] [CrossRef]
  6. Al-Nasser, A.; Kharicha, A.; Barati, H.; He, H.; Pichler, C.; Hackl, G.; Gruber, M.; Ishmurzin, A.; Redl, C.; Wu, M.-H.; et al. Toward a Simplified Arc Impingement Model in a Direct-Current Electric Arc Furnace. Metals 2021, 11, 1482. [Google Scholar] [CrossRef]
  7. Yao, C.-L.; Jiang, Z.-H.; Zhu, H.-C.; Pan, T. Characteristics Analysis of Fluid Flow and Heating Rate of a Molten Bath Utilizing a Unified Model in a DC EAF. Metals 2022, 12, 390. [Google Scholar] [CrossRef]
  8. Pan, P.; Hou, D.; Wang, D.-Y.; Wang, H.-H.; Qu, T.-P.; Tian, J. Effect of magnesium treatment on microstructure and property of H13 die steel during EAF-LF-VD-CC steelmaking process. J. Mater. Res. Technol. 2022, 21, 416–428. [Google Scholar] [CrossRef]
  9. Kim, Y.; Min, D.-J. Viscosity and Structural Investigation of High-Concentration Al2O3 and MgO Slag System for FeO Reduction in Electric Arc Furnace Processing. Metals 2021, 11, 1169. [Google Scholar] [CrossRef]
  10. Yang, L.-Z.; Hu, H.; Yang, S.; Chen, F.; Guo, Y.-F. Life cycle carbon footprint of electric arc furnace steelmaking processes under different smelting modes in China. Sustain. Mater. Technol. 2023, 35, e00564. [Google Scholar] [CrossRef]
  11. World Steel Association. Sustainability Indicators 2023 Report. Available online: https://worldsteel.org/steel-topics/sustainability/sustainability-indicators-2023-report/ (accessed on 21 March 2024).
  12. Tunc, M.; Camdali, U.; Arasil, G. Energy Analysis of the Operation of an Electric-Arc Furnace at a Steel Company in Turkey. Metallurgist 2015, 59, 489–497. Available online: https://link.springer.com/article/10.1007/s11015-015-0130-5 (accessed on 25 March 2024). [CrossRef]
  13. Heo, J.; Park, J.-H. Interfacial reactions between magnesia refractory and electric arc furnace (EAF) slag with use of direct reduced iron (DRI) as raw material. Ceram. Int. 2022, 48, 4526–4538. [Google Scholar] [CrossRef]
  14. Heo, J.; Park, J.-H. Effect of temperature on the slag/refractory interfacial reaction with directed reduced iron (DRI) addition in an electric arc furnace (EAF) process: Diffusional growth of magnesiowüstite layer by Boltzmann-Matano analysis. Ceram. Int. 2022, 48, 17217–17224. [Google Scholar] [CrossRef]
  15. Tian, B.-H.; Wei, G.-S.; Li, X.; Zhu, R.; Bai, H.; Tian, W.-J.; Dong, K. Effect of hot metal charging on economic and environmental indices of electric arc furnace steelmaking in China. J. Clean. Prod. 2022, 379, 134597. [Google Scholar] [CrossRef]
  16. Duan, J.-P.; Zhang, Y.-L.; Yang, X.-M. EAF steelmaking process with increasing hot metal charging ratio and improving slagging regime. Int. J. Miner. Metall. Mater. 2009, 16, 375–382. [Google Scholar] [CrossRef]
  17. Wei, G.-S.; Zhu, R.; Yang, S.-F.; Wu, X.-T.; Dong, K. Simulation and application of submerged CO2-O2 injection in EAF steelmaking: Combined blowing equipment arrangement and industrial application. Ironmak. Steelmak. 2020, 48, 703–711. [Google Scholar] [CrossRef]
  18. Chen, L.-G.; Liu, X.; Feng, H.-J.; Ge, Y.-L.; Xie, Z.-H. Molten steel yield optimization of a converter based on constructal theory. Sci. China-Technol. Sci. 2017, 61, 496–505. Available online: https://link.springer.com/article/10.1007/s11431-017-9162-y (accessed on 1 April 2024). [CrossRef]
  19. Chen, Y.; Li, S.-Q.; Ji, S.-J.; Liu, R.-Z. Theory and practice of the optimizing of charging structure in EAF steelmaking. J. Univ. Sci. Technol. Beijing 2005, 12, 313–316. Available online: https://www.researchgate.net/publication/297304619 (accessed on 1 April 2024).
  20. Mapelli, C.; Baragiola, S. Evaluation of energy and exergy performances in EAF during melting and refining period. Ironmak. Steelmak. 2006, 33, 379–388. Available online: https://journals.sagepub.com/doi/10.1179/174328106X118044 (accessed on 1 April 2024). [CrossRef]
  21. Li, X.-L.; Sun, W.-Q.; Zhao, L.; Cai, J.-J. Material metabolism and environmental emissions of BF-BOF and EAF steel production routes. Miner. Process. Extr. Metall. Rev. 2018, 39, 50–58. [Google Scholar] [CrossRef]
  22. Sun, W.-Q.; Wang, Q.; Zheng, Z.; Cai, J.-J. Material–energy–emission nexus in the integrated iron and steel industry. Energy Convers. Manag. 2020, 213, 112828. [Google Scholar] [CrossRef]
  23. Sun, W.-Q.; Wang, Q.; Zhou, Y.; Wu, J.-Z. Material and energy flows of the iron and steel industry: Status quo, challenges and perspectives. Appl. Energy 2020, 268, 114946. [Google Scholar] [CrossRef]
  24. Na, H.-M.; Sun, J.-C.; Qiu, Z.-Y.; He, J.-F.; Yuan, Y.-X.; Yan, T.-Y.; Du, T. A novel evaluation method for energy efficiency of process industry—A case study of typical iron and steel manufacturing process. Energy 2021, 233, 121081. [Google Scholar] [CrossRef]
  25. Hu, Y.-P.; Chen, H.-X.; Xie, J.-L.; Yang, X.-S.; Cheng, Z. Chiller sensor fault detection using a self-Adaptive Principal Component Analysis method. Energy Build. 2012, 54, 252–258. [Google Scholar] [CrossRef]
  26. Gu, X.-J.; Xie, Y.-T.; Tian, T.; Liu, T.-S. A Lightweight Neural Network Based on GAF and ECA for Bearing Fault Diagnosis. Metals 2023, 13, 822. [Google Scholar] [CrossRef]
  27. Zhi, Y.-J.; Fu, D.-M.; Zhang, D.-W.; Yang, T.; Li, X.-G. Prediction and Knowledge Mining of Outdoor Atmospheric Corrosion Rates of Low Alloy Steels Based on the Random Forests Approach. Metals 2019, 9, 383. [Google Scholar] [CrossRef]
  28. Raj, D.; Kumar, A.; Tripti; Maiti, S.-K. Health Risk Assessment of Children Exposed to the Soil Containing Potentially Toxic Elements: A Case Study from Coal Mining Areas. Metals 2022, 12, 1795. [Google Scholar] [CrossRef]
  29. Feng, G.-Y.; Fan, G.-Y. Research on learning behavior patterns from the perspective of educational data mining: Evaluation, prediction and visualization. Expert Syst. Appl. 2024, 237, 121555. [Google Scholar] [CrossRef]
  30. Li, G.-N.; Hu, Y.-P.; Chen, H.-X.; Li, H.-R.; Hu, M.; Guo, Y.-B.; Liu, J.-Y.; Sun, S.-B.; Sun, M. Data partitioning and association mining for identifying VRF energy consumption patterns under various part loads and refrigerant charge conditions. Appl. Energy 2017, 185, 846–861. [Google Scholar] [CrossRef]
  31. Chen, K.-L.; Abtahi, F.; Carrero, J.-J.; Fernandez-Flatas, C.; Seoane, F. Process mining and data mining applications in the domain of chronic diseases: A systematic review. Artif. Intell. Med. 2023, 144, 102645. [Google Scholar] [CrossRef]
  32. Zhou, Y.; Wang, Y.; Li, C.-S.; Ding, L.-Y.; Mei, Y.-Q. Coupled risk analysis of hospital infection: A multimethod-fusion model combining association rules with complex networks. Comput. Ind. Eng. 2023, 186, 109720. [Google Scholar] [CrossRef]
  33. Li, H.-W.; Li, X.; Liu, X.-J.; Li, H.-Y.; Bu, X.-P.; Chen, S.-J.; Lyu, Q. Evaluation and Prediction Models for Blast Furnace Operating Status Based on Big Data Mining. Metals 2023, 13, 1250. [Google Scholar] [CrossRef]
  34. Manojlović, V.; Kamberović, Ž.; Korać, M.; Dotlić, M. Machine learning analysis of electric arc furnace process for the evaluation of energy efficiency parameters. Appl. Energy 2022, 307, 118209. [Google Scholar] [CrossRef]
  35. Andonovski, G.; Tomažič, S. Comparison of data-based models for prediction and optimization of energy consumption in electric arc furnace (EAF). IFAC-Pap. 2022, 55, 373–378. [Google Scholar] [CrossRef]
  36. Mudumba, B.; Kabir, M.F. Mine-first association rule mining: An integration of independent frequent patterns in distributed environments. Decis. Anal. J. 2024, 10, 100434. [Google Scholar] [CrossRef]
  37. Fister, I., Jr.; Fister, I.; Fister, D.; Podgorelec, V.; Salcedo-Sanz, S. A comprehensive review of visualization methods for association rule mining: Taxonomy, challenges, open problems and future ideas. Expert Syst. Appl. 2023, 233, 120901. [Google Scholar] [CrossRef]
  38. Wang, B.; Wang, W.-J.; Meng, G.-L.; Qiao, Z.-H.; Guo, Y.-M.; Wang, N.; Wang, W.; Mao, Z.-Z. Boosting the prediction of molten steel temperature in ladle furnace with a dynamic outlier ensemble. Eng. Appl. Artif. Intell. 2022, 116, 105359. [Google Scholar] [CrossRef]
  39. Wang, B.; Wang, W.-J.; Qiao, Z.-H.; Meng, G.-L.; Mao, Z.-Z. Dynamic selective Gaussian process regression for forecasting temperature of molten steel in ladle furnace. Eng. Appl. Artif. Intell. 2022, 112, 104892. [Google Scholar] [CrossRef]
  40. Yan, X.-G.; Gao, L. A feature extraction and classification algorithm based on improved sparse auto-encoder for round steel surface defects. Math. Biosci. Eng. 2020, 17, 5369–5394. [Google Scholar] [CrossRef]
  41. Fang, X.-Y.; Qu, J.-F.; Chai, Y.; Liu, B.-W. Adaptive multiscale and dual subnet convolutional auto-encoder for intermittent fault detection of analog circuits in noise environment. ISA Trans. 2023, 136, 428–441. [Google Scholar] [CrossRef]
  42. Elith, J.; Leathwick, J.-R.; Hastie, T. A working guide to boosted regression trees. J. Anim. Ecol. 2008, 77, 802–813. [Google Scholar] [CrossRef] [PubMed]
  43. Zha, W.-T.; Liu, J.; Li, Y.-L.; Liang, Y.-Y. Ultra-short-term power forecast method for the wind farm based on feature selection and temporal convolution network. ISA Trans. 2022, 129, 405–414. [Google Scholar] [CrossRef] [PubMed]
  44. Altmann, A.; Tolosi, L.; Sander, O.; Lengauer, T. Permutation importance: A corrected feature importance measure. Bioinformatics 2010, 26, 1340–1347. [Google Scholar] [CrossRef] [PubMed]
Figure 1. Energy balance diagram of EAF steelmaking process.
Metals 14 00458 g001
Figure 2. Research framework of this study.
Metals 14 00458 g002
Figure 3. Association rules mining flow diagram.
Metals 14 00458 g003
Figure 4. The statistical interface of energy data.
Metals 14 00458 g004
Figure 5. The energy composition and flow of the furnace number ‘20306983’.
Metals 14 00458 g005
Figure 6. Correlation heat map between variables.
Metals 14 00458 g006
Figure 7. Feature selection results for the extreme gradient boosting (XGBoost) model.
Metals 14 00458 g007
Figure 8. The k-means clustering algorithm discretization result. Note that ELW, EL2, EL4, etc. in the figure represent the clustering and discretization results of different features. Each symbol represents power consumption, power consumption in the second stage, power consumption in the fourth stage, furnace wall oxygen consumption, furnace wall oxygen consumption in the first stage, furnace wall oxygen consumption in the second stage, carbon powder weight, natural gas consumption, and EUE. The line of the different colors represents the labels of each cluster, and the numbers below represent the boundaries of each grouping.
Metals 14 00458 g008
Figure 9. Optimal energy matching model of EAF based on ARM.
Metals 14 00458 g009
Figure 10. EUE stacked bar chart under different smelting modes.
Metals 14 00458 g010
Table 1. Data information of influencing factors of EUE.
NOVariable ClassVariableUnit
1Metal charge dataHot metal (HM) weightt
2Metal charge dataScrap weightt
3Metal charge dataHM ratiot/t
4Metal charge dataCarbon content in HM%
5Metal charge dataSilicon content in HM%
6Metal charge dataManganese content in HM%
7Metal charge dataPhosphorus content in HM%
8Metal charge dataSulfur content in HM%
9Metal charge dataHM temperature
10Process feeding dataPower consumptionkWh
11Process feeding dataFurnace door oxygen consumptionm3
12Process feeding dataFurnace wall oxygen consumptionm3
13Process feeding dataTotal oxygen consumptionm3
14Process feeding dataNatural gas consumptionm3
15Process feeding dataCarbon powder consumptionkg
16Process feeding dataLime weightkg
17Steelmaking rhythm dataSmelting cyclemin
18Steelmaking rhythm dataPower supply timemin
19Steelmaking rhythm dataPower consumption in first stagekWh
20Steelmaking rhythm dataPower consumption in second stagekWh
21Steelmaking rhythm dataPower consumption in third stagekWh
22Steelmaking rhythm dataPower consumption in fourth stagekWh
23Steelmaking rhythm dataFurnace wall oxygen consumption in first stagem3
24Steelmaking rhythm dataFurnace wall oxygen consumption in second stagem3
25Steelmaking rhythm dataFurnace wall oxygen consumption in third stagem3
26Steelmaking rhythm dataFurnace wall oxygen consumption in fourth stagem3
27Steelmaking rhythm dataTime interval for the first lime additions
28Steelmaking rhythm dataTime interval for the second lime additions
29Steelmaking rhythm dataTime interval for the third lime additions
30Output variableEnergy utilization efficiency (EUE)%
Table 2. AE cleaning 5-fold cross-validation results.
NodeSplit0Split1Split2Split3Split4MeanStdRank
18−0.0059 −0.0054 −0.0042 −0.0052 −0.0050 −0.00510.0005 1
19−0.0051 −0.0052 −0.0052 −0.0072 −0.0056 −0.0057 0.0008 2
13−0.0082 −0.0067 −0.0052 −0.0062 −0.0059 −0.0064 0.0010 3
16−0.0078 −0.0075 −0.0062 −0.0066 −0.0054 −0.0067 0.0009 4
17−0.0087 −0.0076 −0.0076 −0.0083 −0.0079 −0.0080 0.0004 5
Table 3. Dataset partitioning according to the HM ratio and HM temperature.
Smelting ModeParameter ScaleSample Count
A1B1HM ratio: (<0.591); HM temperature: (<1309)518
A1B2HM ratio: (<0.591); HM temperature: (>1309)527
A2B1HM ratio: (0.591~0.637); HM temperature: (<1309)538
A2B2HM ratio: (0.591~0.637); HM temperature: (>1309)509
A3B1HM ratio: (>0.637); HM temperature: (<1309)531
A3B2HM ratio: (>0.637); HM temperature: (>1309)568
Table 4. Association rules in A1B1 smelting mode.
Association RulesConfidenceSupportLift
(‘EL2_4’, ‘OG2_4’, ‘NAG_2’) => (‘EUE_4’)0.360.032.36
(‘EL2_4’, ‘EL4_1’, ‘CAB_2’) => (‘EUE_4’)0.290.041.94
(‘ELW_1’, ‘EL2_3’) => (‘EUE_3’)0.550.031.97
(‘ELW_1’, ‘EL4_1’, ‘OG1_3’) => (‘EUE_3’)0.520.041.87
(‘ELW_1’, ‘EL4_1’, ‘CAB_2’) => (‘EUE_3’,)0.490.031.74
Table 5. Association rule control scheme.
ModeOptimal Control Parameter ScaleEUE GradeConfidence
A1B1EL2 (4853, 7520) kWh, OG2 (1816, 1961) m3, NAG (156, 196) m3EUE > 84%36%
A1B2EL4 (0, 583) kWh, OGW (4206, 4797) m3, NAG (177, 225) m3EUE > 84%38%
A2B1ELW (0, 8339) kWh, EL4 (0, 819) m3EUE > 82%47%
A2B2ELW (0, 7679) kWhEUE > 81%32%
A3B1OGW (4177, 4766) kWh, CAB (0, 91) kg, NAG (215, 251) m3EUE > 80%64%
A3B2OGW (4732, 5670) m3, OG2 (1561, 1871) m3EUE > 78%48%
Disclaimer/Publisher’s Note: The statements, opinions and data contained in all publications are solely those of the individual author(s) and contributor(s) and not of MDPI and/or the editor(s). MDPI and/or the editor(s) disclaim responsibility for any injury to people or property resulting from any ideas, methods, instructions or products referred to in the content.

