Article

Study on Recovery of Lithium from Lithium-Containing Aluminum Electrolyte

1
Key Laboratory for Nonferrous Vacuum Metallurgy of Yunnan Province, Kunming University of Science and Technology, Kunming 650093, China
2
National Engineering Research Center of Vacuum Metallurgy, Kunming University of Science and Technology, Kunming 650093, China
3
Faculty of Metallurgical and Energy Engineering, Kunming University of Science and Technology, Kunming 650093, China
4
State Key Laboratory of Complex Non-Ferrous Metal Resources Clean Utilization, Kunming University of Science and Technology, Kunming 650093, China
*
Author to whom correspondence should be addressed.
Metals 2024, 14(4), 460; https://doi.org/10.3390/met14040460
Submission received: 18 March 2024 / Revised: 7 April 2024 / Accepted: 9 April 2024 / Published: 13 April 2024

Abstract

:
The current process of recovering lithium from wasted aluminum electrolyte mostly entails extracting lithium from lithium-containing aluminum electrolyte by acid leaching and dissipation. Aiming at the disadvantages of the existing treatment method, such as the long process flow, environmental pollution, poor working environment, etc., we propose a new technology to extract lithium from the wasted aluminum electrolyte and systematically investigate the effects of raw material particle size, holding time, temperature and other factors on the recovery of lithium. The results show that the better process conditions for the recovery of lithium are as follows: the raw material particle size is 75~150 μm, the additive is CaCl2, the mass ratio of calcium chloride to lithium-containing aluminum electrolyte is 3:5, the reaction temperature is 1473 K, and the holding time is 3 h. After the product of the reaction is crushed and leaching is carried out by using deionized water (pH = 6.8), the temperature of the leaching is 368 K, the leaching time is 3 h, and the solid–liquid ratio is 1/3, and the leaching rate of Li can be up to 75.1%. In addition, the purity of the recovered AlF3 is more than 92.7%. This process realizes the comprehensive and efficient use of lithium-containing aluminum electrolyte and provides a new idea for the development of lithium extraction technology from lithium-containing aluminum electrolyte.

1. Introduction

In 2023, China’s production of electrolytic aluminum reached 41.5 million tons, up 3.5% year on year, making China one of the world’s largest producers of electrolytic aluminum. However, the bauxite used in China is of low grade and contains large amounts of lithium salts [1,2]. The usage of this bauxite as a feedstock for alumina production results in the formation of a lithium-rich, low-temperature aluminum electrolyte system [3]. The properties of this system include a low initial crystallization temperature, a high conductivity, and a low solubility of alumina. Secondly, the lithium in the aluminum electrolyte may also come from the aluminum electrolysis process. To reduce the melting point of aluminum oxides, the temperature of electrolysis, and energy consumption, and improve the conductivity of electrolytes [4,5,6,7], additional lithium fluoride is required, resulting in lithium enrichment [8,9]. The effect of excessive lithium content on the stability of the electrolyte becomes more and more obvious, and it readily leads to the generation of alumina and aluminum–lithium compounds, which cause the stability of the electrolyte to deteriorate. At the same time, excessive lithium content will also affect the electrolytic deposition speed and quality of aluminum [10,11,12,13].
Currently, the method of aluminum electrolysis waste disposal is still not perfect. Many aluminum electrolysis enterprises usually grind the generated electrolyte into a fine powder for reuse [14,15], and this practice may lead to the accumulation of a large number of impurities inside the electrolytic cell, thus affecting the efficiency of its function. It also increases the cost of production and reduces the service life of electrolytic cell greatly, which also further increases the degree of resource consumption. Some aluminum electrolysis companies also periodically draw from the smelter and add new low-concentration lithium electrolytes [16]. This extracted spent electrolyte is no longer used for production but is disposed of as solid waste, and the amount of spent aluminum electrolyte is increasing every year. Due to the high fluoride content, the long-term stockpiling of spent aluminum electrolyte can cause serious harm to the environment, crop yields, and human health [17,18,19]. Therefore, it is of great value to study a method of recovering and treating waste high-lithium aluminum electrolyte. So, research on the extraction of lithium and aluminum resources from the lithium-rich aluminum electrolyte is bound to be the focus of the development and recycling of lithium and aluminum resources.
At present, the comprehensive utilization of electrolytic aluminum slag and the recovery process of the lithium-containing electrolyte by-products of electrolytic aluminum is relatively backward, resulting in a large amount of waste of expensive resources [20,21,22]. There are three main existing methods: one is to add acid to dissolve the lithium-containing aluminum electrolyte to obtain soluble lithium salt and hydrofluoric acid solution [23] and then use calcium hydroxide to adjust the value of the precipitation of fluorine in the leaching solution; the second is to add calcium chloride to obtain the leaching of lithium chloride solution and calcium fluoride slag [24]; the third is to directly add a calcium hydroxide conversion [25] to obtain lithium hydroxide solution and calcium fluoride slag. The three methods have their advantages and disadvantages [26]. Regarding the use of acid dissolution and then adding calcium hydroxide to remove fluoride, the process producing hydrogen fluoride and other gases causes the serious corrosion of metal equipment and also makes the operating environment worse. The health of the workers is affected [27,28]. However, this method has a high lithium recovery rate; the advantage of using calcium hydroxide to prepare lithium hydroxide solution is that the leaching solution of lithium hydroxide solution is strongly alkaline, and there are very few impurities in the solution, so the subsequent cost of removing impurities is low. However, calcium hydroxide is slightly soluble in water. At the same time, in strong alkaline reaction conditions, lithium fluoride in an aqueous solution is also difficult to ionize lithium ions and fluoride ions, so the reaction speed is very slow and requires a very high reaction temperature, while the lithium leaching rate is very low, and due to the high cost and low operational efficiency, it is difficult to be realized in the actual production. Using calcium chloride leaching alone, the operation method is simple and the process flow is short, but the lithium leaching rate is still low, At the same time, the impurity calcium ions in the leaching solution were higher [29,30].
How to choose effective chloride additives was the first problem we faced. We found, in the exploratory experiments, that when sodium chloride or aluminum chloride is used to chlorinate lithium aluminum electrolyte, the lithium leaching effect was not good; the lithium leaching rate was less than 30%. Regarding the use of calcium chloride in lithium-containing aluminum electrolyte chlorine roasting, lithium leaching achieved better results. Secondly, the lithium content in the lithium-containing aluminum electrolyte raw material used in this experiment was 1.8%, which was low and increased the difficulty of the subsequent extraction and detection. Finally, the reaction conditions were an even more momentous part of the chlorination roasting experiment, which required continuous research and the improvement of the lithium extraction process.
Therefore, this paper attempted to chlorinate lithium aluminum electrolyte by adding calcium chloride under different reaction conditions, extracting Li at the same time to achieve the recovery of Al in lithium-containing aluminum electrolyte. Lithium-containing aluminum electrolyte lithium extraction technology provides a new way of thinking.

2. Experimental

2.1. Experimental Raw Materials

2.1.1. Mineralogical Analysis of Lithium-Containing Aluminum Electrolyte

The semi-quantitative analysis of the components in the lithium-containing aluminum electrolyte was carried out using X-ray fluorescence spectroscopy (XRF) (SciAps, Inc., Woburn, MA, USA), and the results are shown in Table 1. From the results in Table 1, it can be initially judged that the lithium-containing aluminum electrolyte contained a large amount of aluminum and sodium, and due to the small atomic radius and light atomic mass of lithium, XRF could not quantitatively analyze the lithium element. The use of inductively coupled plasma atomic emission spectrometry (ICP-AES) was adopted to quantitatively analyze the components in the lithium-containing aluminum electrolyte, and the results are shown in Table 2, in which the lithium element accounted for 1.82%.

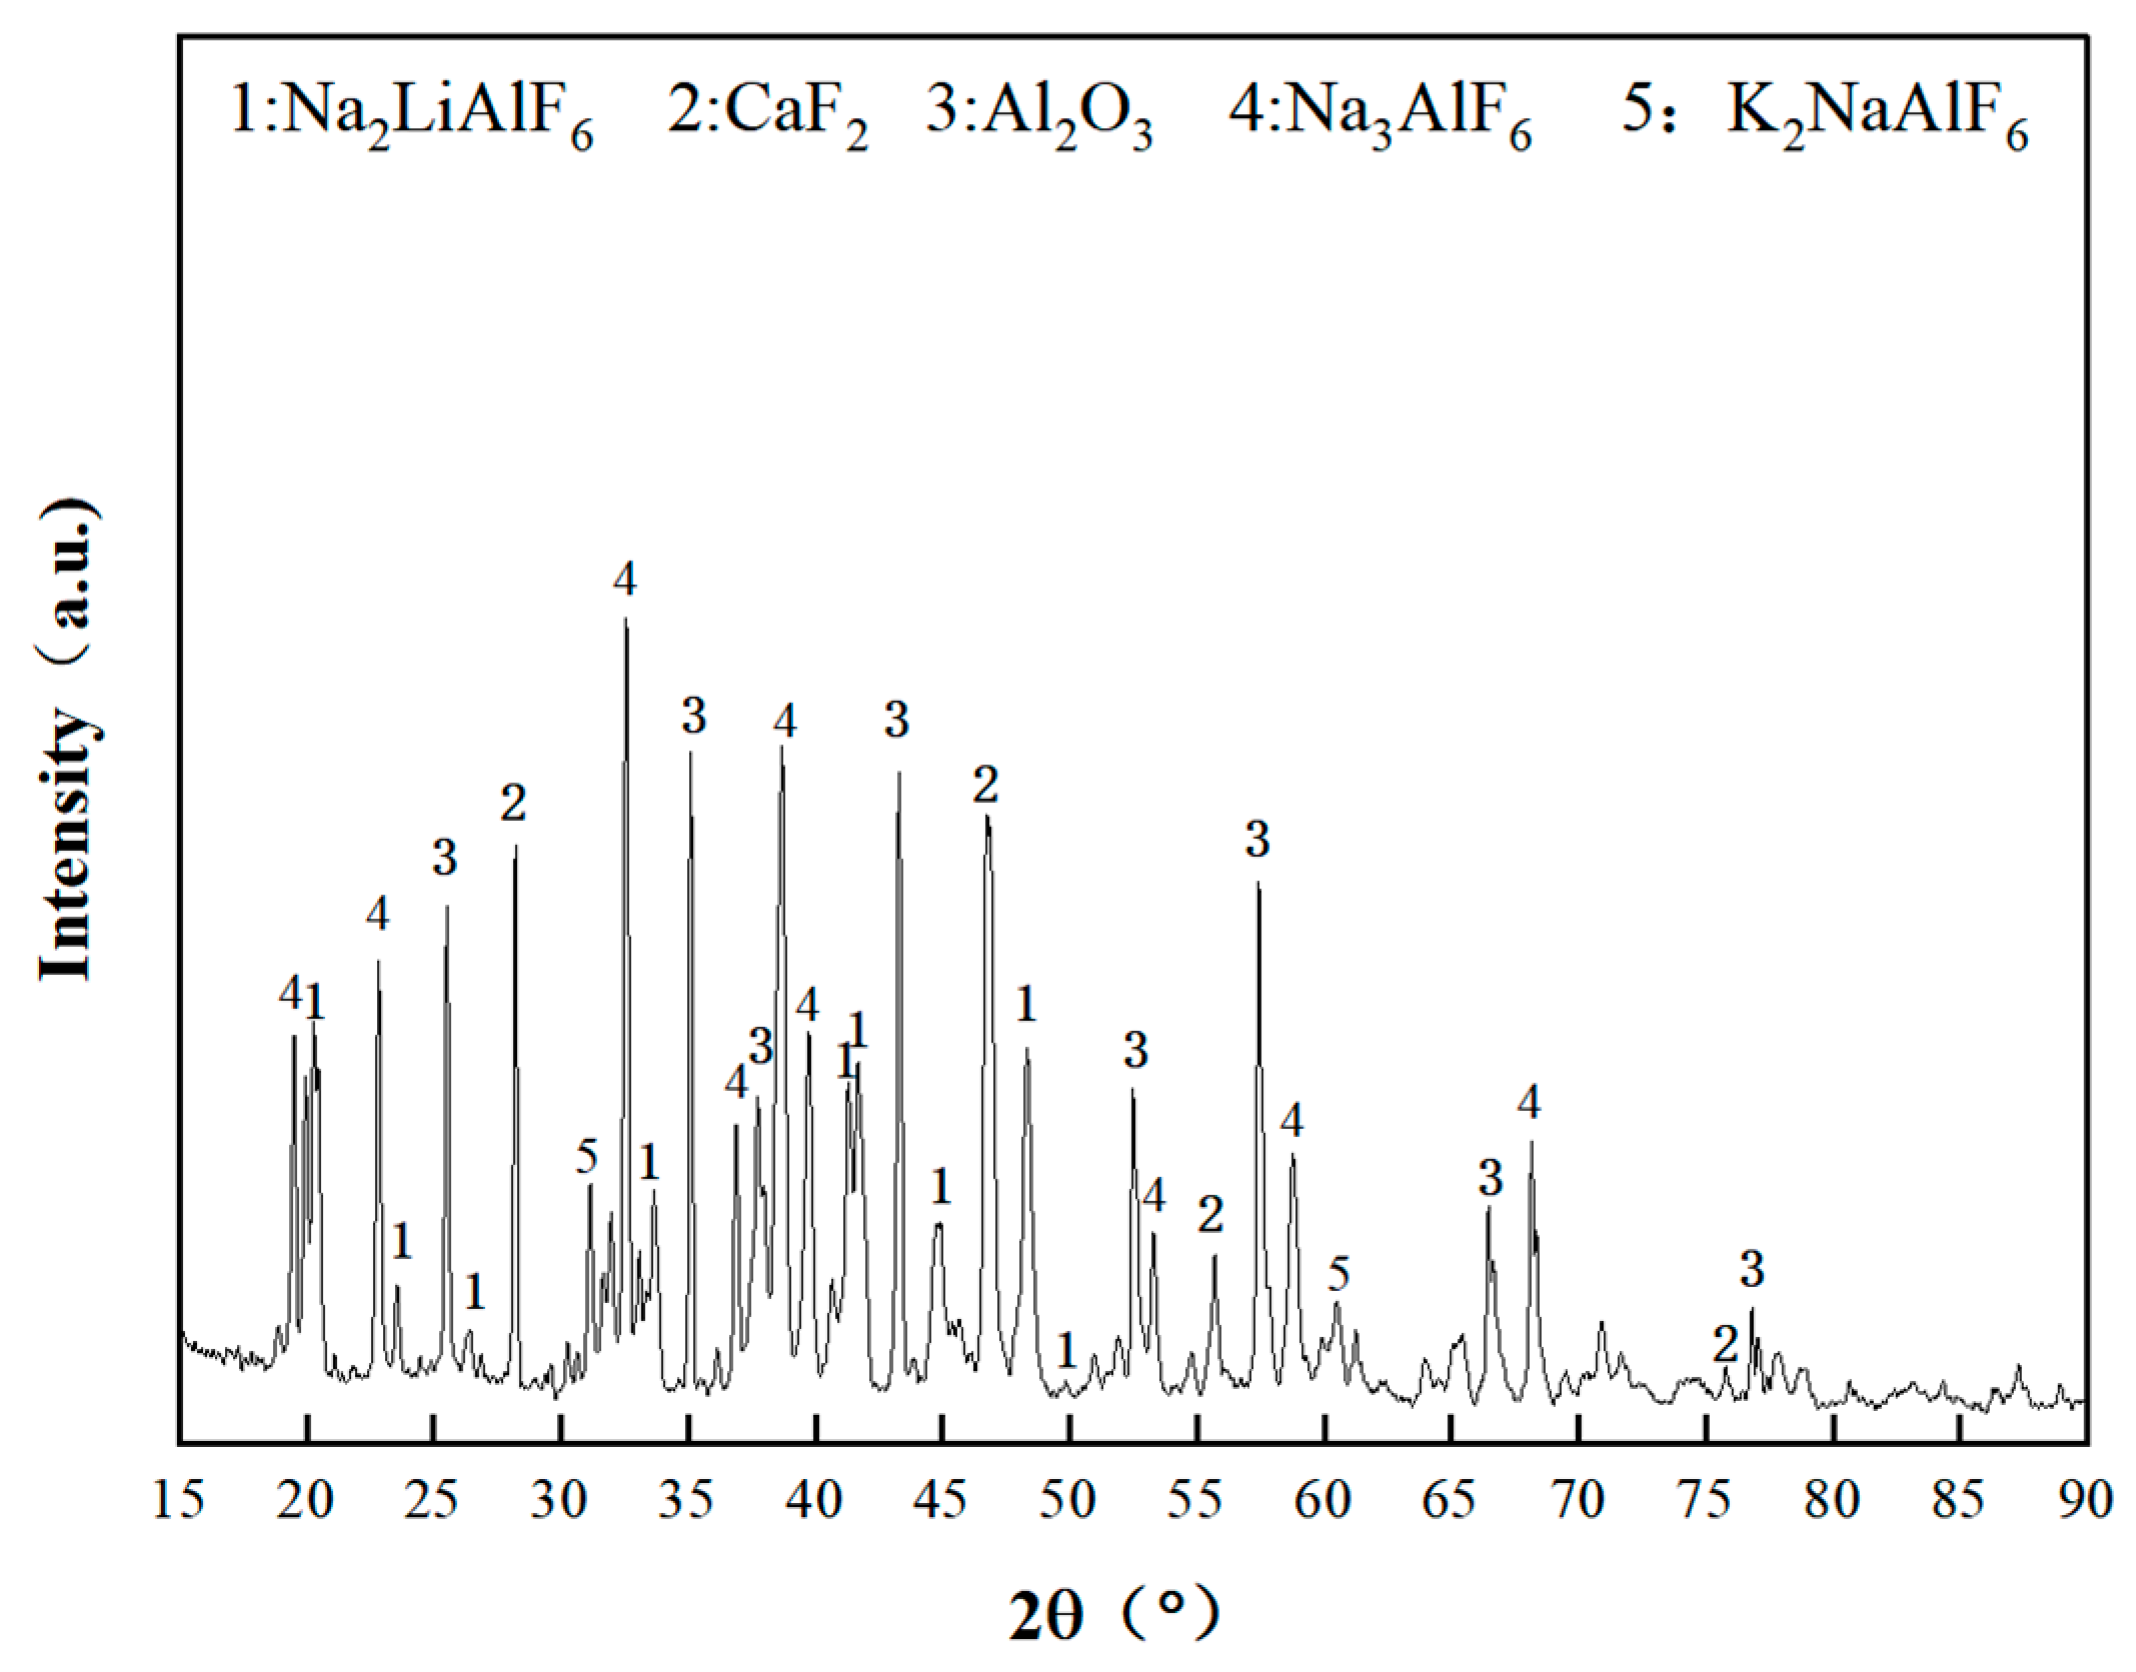
2.1.2. Lithium-Containing Aluminum Electrolyte Mineral Phase Analysis

The raw material used in this experiment was a lithium-containing aluminum electrolyte provided by a Shanxi electrolytic aluminum plant. The XRD analysis of the lithium-containing aluminum electrolyte was carried out, and the X-ray diffraction pattern is shown in Figure 1. From the figure, it can be seen that the raw material mainly consisted of lithium cryolite (Na2LiAlF6), cryolite (Na3AlF6), potassium cryolite (K2NaAlF6), fluorite (CaF2), and alumina (Al2O3). Lithium was present in the form of lithium cryolite by isomeric substitution.
Based on the quantitative analysis of the main chemical elements in the lithium-containing aluminum electrolyte in Table 2 combined with the main phases in the lithium-containing aluminum electrolyte shown in Figure 2, it was assumed that the feedstock was a mixture of the main chemical elements.
According to the quantitative analysis results of the main chemical elements in the lithium-containing aluminum electrolyte in Table 2 and the main phases in the lithium-containing aluminum electrolyte shown in Figure 2, assuming that all the lithium in the raw material came from Na2LiAlF6, it could be deduced inversely that the content of Na2LiAlF6 in the lithium-containing aluminum electrolyte used in the experiment was 50.84%.
To further verify the chemical composition of each element of the above XRD characterization, SEM-EDS was used to analyze the distribution of the lithium-containing aluminum electrolyte from a microscopic point of view, and the results are shown in Figure 2a for the randomly selected region under the scanning electron microscope, from which it can be seen that the morphology of the main substances in the lithium-containing aluminum electrolyte was an irregular block, and an EDS analysis was carried out on the region, and the results of the distribution of the elements of the F and Ca were as shown in the figure. The distribution of elements F and Ca coincide, and the percentage of Ca: F atoms at point 1 is 26.78:67.38, which was consistent with the stoichiometric ratio of 1:2 for CaF2. In addition, Al2O3 (point 2), Na3AlF6 (point 3), and K2NaAlF6 (point 3) were also detected. The SEM results were consistent with the XRD analysis.

2.2. Additive Analysis

According to the XRD detection, most of the Li in the raw aluminum electrolyte exists in the form of Na2LiAlF6, and the structure is shown in Figure 3, where lithium atoms replace some of the sodium atoms in the cryolite by isomorphic substitutions to form a lithium-containing cryolite structure (Na2LiAlF6). Since aluminum in aluminum electrolytes mainly exists in the form of cryolite, the crystal structure of lithium-containing cryolite consists of isolated octahedral AlF63− combining with Li+ and Na+ at six vertices to form a regular octahedron with good stability, which is difficult to decompose in general [31]. The extraction of lithium from lithium-containing aluminum electrolytes requires breaking the stable structure of lithium cryolite.
Liu Fengqin et al. [32] showed that when aluminum electrolyte and calcium carbonate are mixed and roasted, the highly reactive calcium oxide produced by the decomposition of calcium carbonate reacts with cryolite to produce Al2O3, CaF2, and NaF. Zhang Yinli et al. [33] showed that under the condition of 9.9 × 10⁻⁵ atm, the decomposition of Na3AlF6 produces AlF3 and NaF at 1028 K. It can be seen that given certain reaction conditions, the stabilizing conditions of AlF63− can be broken, thus releasing the Li element in Na2LiAlF6.
Without introducing new elements, the Li elemental product should be in soluble form, and the rest of the product should preferably be in insoluble form for the subsequent extraction of the Li element. CaCl2 with lithium-containing aluminum electrolyte can be selected for this purpose. The selected CaCl2 is analytically pure CaCl2 produced by Tianjin Windship Chemical Reagent Technology Co. (Tianjin, China).

2.3. Evaluating Indicators

2.3.1. Lithium Leaching Rate

η L i = V 1 × C L i ω L i × m 1 × 100 %
η L i is the leaching rate of lithium, ω L i is the mass fraction of the Li element in the raw material, m 1 is the weighed mass of the raw material (g), m 2 is the weighed mass of the additive CaCl2 (g), m 3 is the mass of the product added to the water by roasting and grinding (g), V 1 is the volume of the aqueous solution used in the leaching (mL), and C L i is the concentration of the Li element in the filtrate (g/mL).

2.3.2. Aluminum Direct Yield

β A l = ω A l 2 × m 2 ω A l 1 × m 1 × 100 %
β A l is the direct yield of Al, ω A l 1 is the mass fraction of the Al element in the feedstock, m 1 is the weighed mass of the feedstock (g), m 2 is the mass of the condensate (g), and ω A l 2 is the mass fraction of the Al element in the feedstock.

3. Results and Discussion

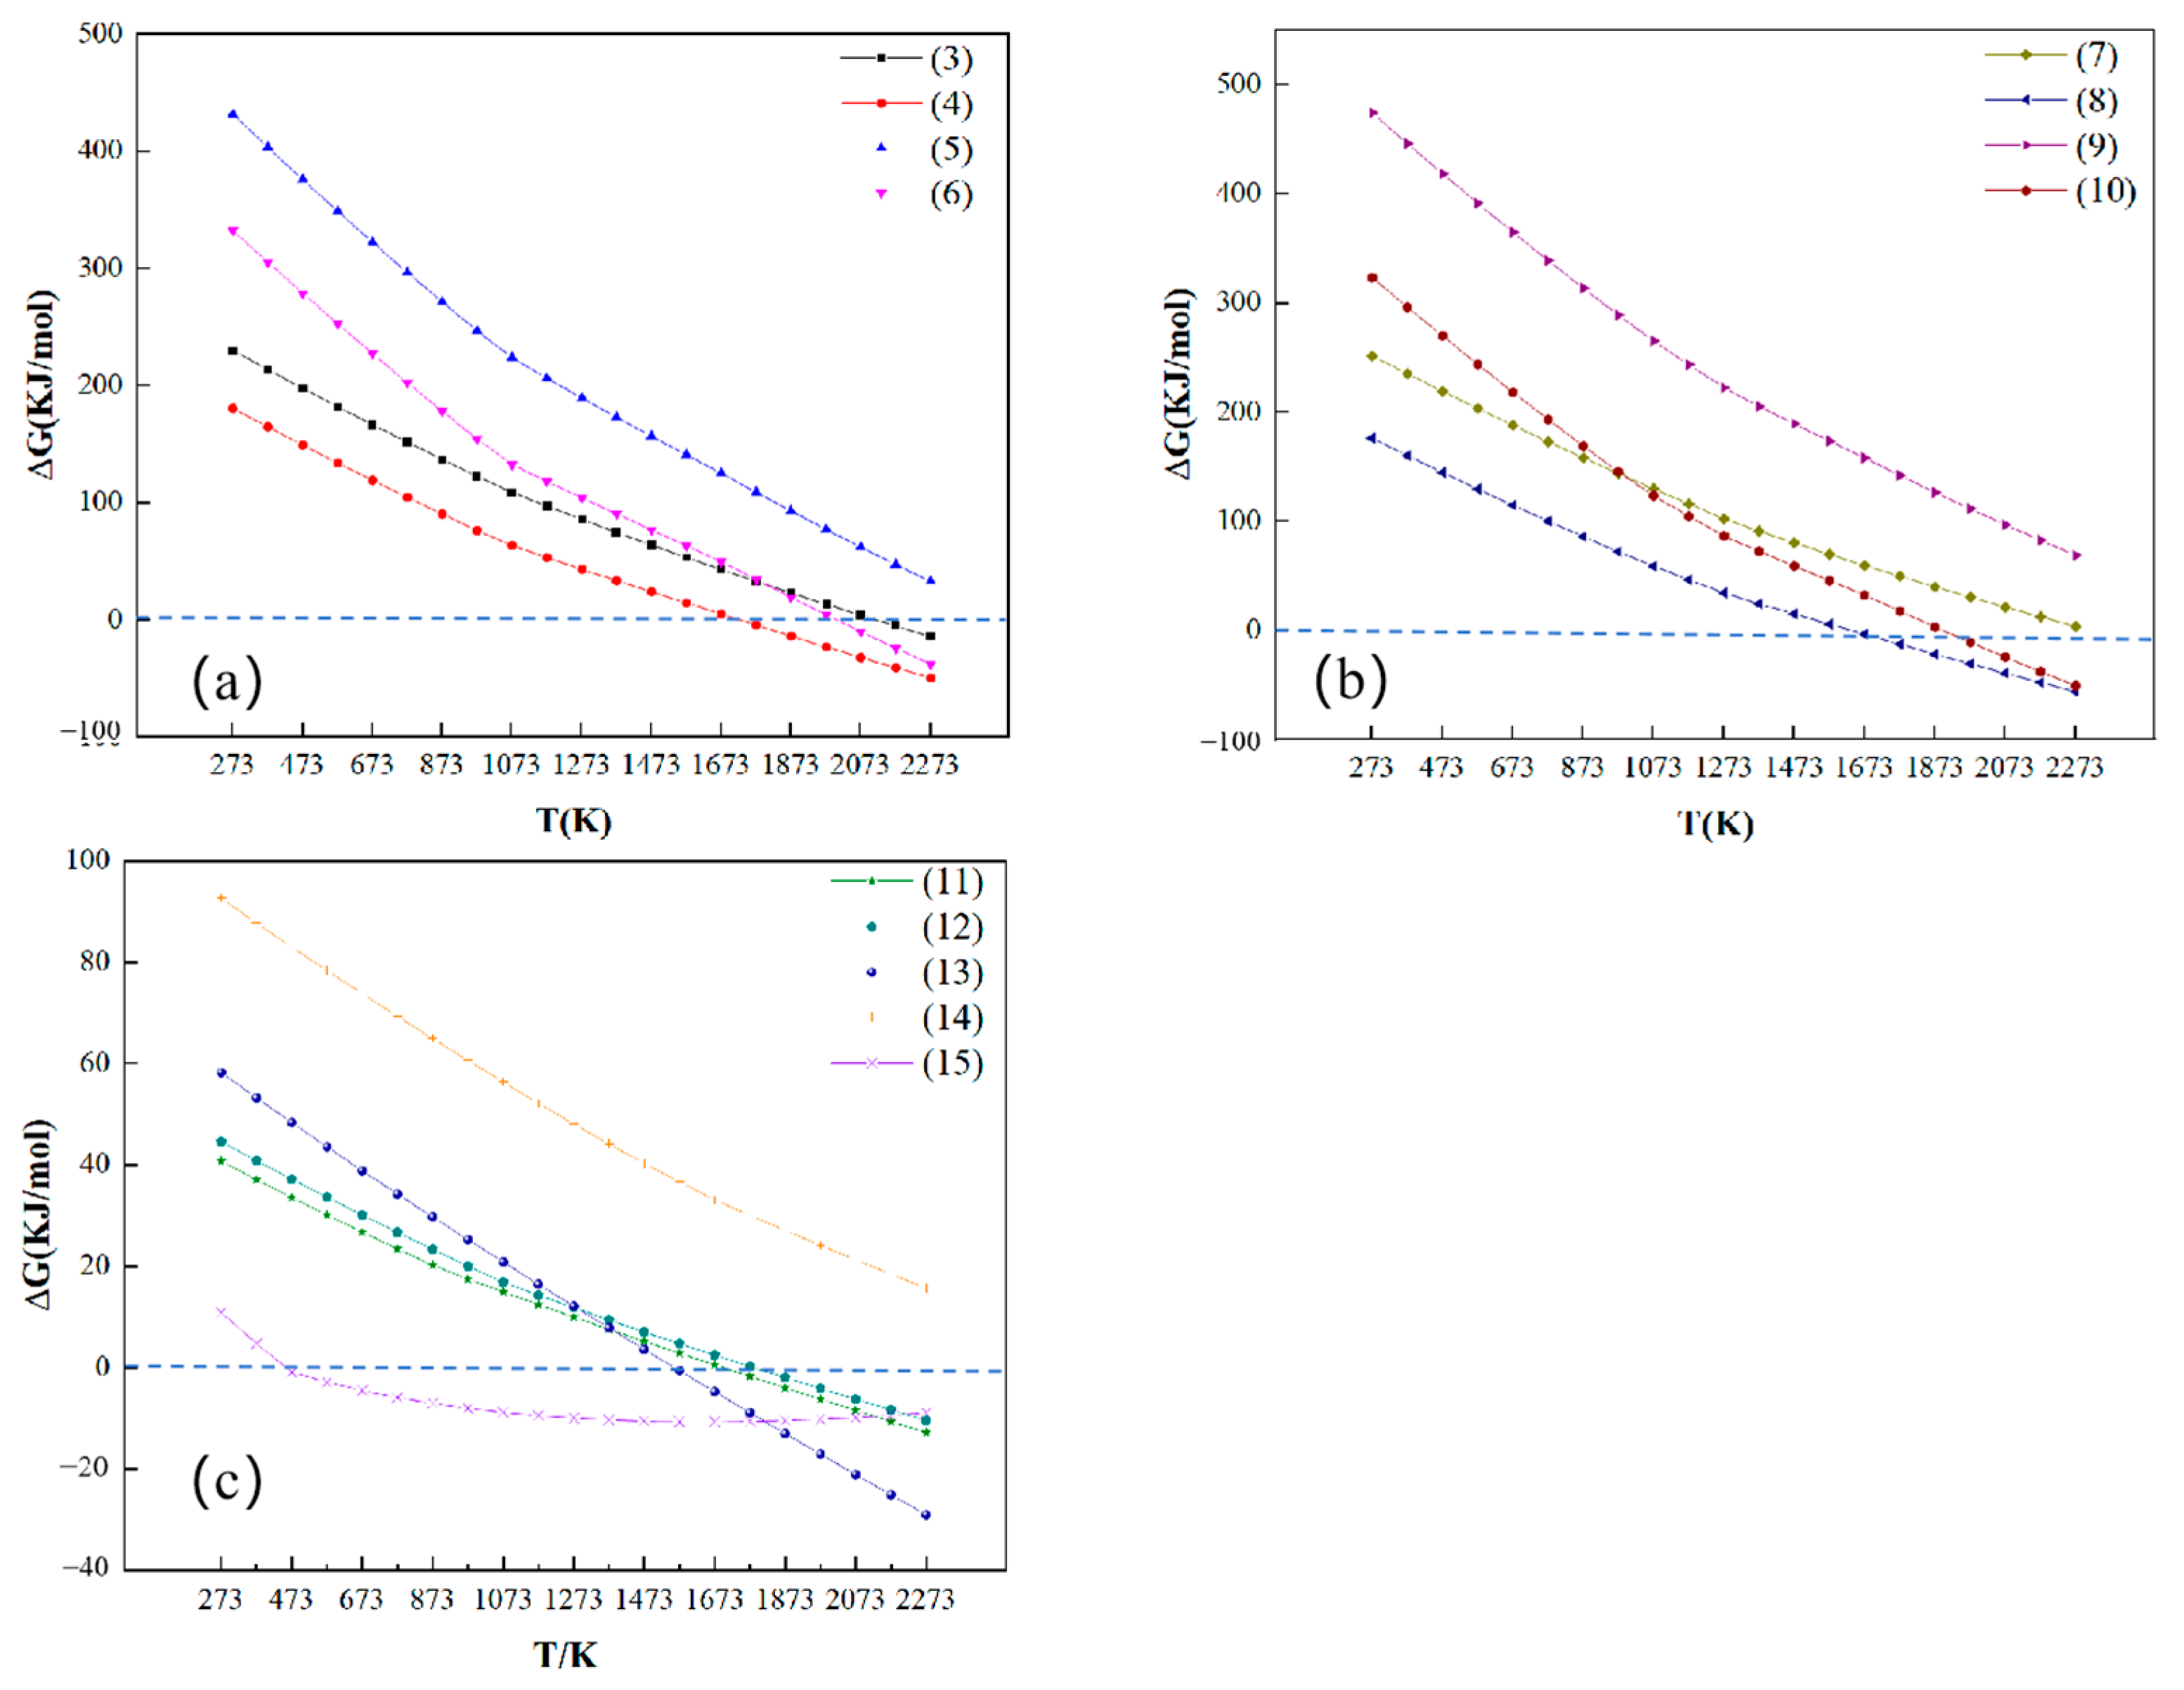
3.1. Thermodynamic Analysis

Since it is difficult to find thermodynamic data for Na2LiAlF6, a thermodynamic estimation of Na3AlF6 and Li3AlF6, which have similar structure and properties, were used. Reactions (3)–(15) are the reactions that may occur when calcium chloride is used for roasting.
L i 3 A l F 6 = 3 L i F ( g ) + A l F 3 ( g )
L i 3 A l F 6 + C a C l 2 = 3 L i C l ( g ) + 1.5 C a F 2 + A l F 3 ( g )
2 L i 3 A l F 6 + 3 C a C l 2 = 6 L i F ( g ) + 3 C a F 2 + A l 2 C l 6 ( g )
2 L i 3 A l F 6 + 6 C a C l 2 = 6 L i C l ( g ) + 6 C a F 2 + A l 2 C l 6 ( g )
N a 3 A l F 6 = 3 N a F ( g ) + A l F 3 ( g )
N a 3 A l F 6 + 1.5 C a C l 2 = 3 N a C l ( g ) + 1.5 C a F 2 + A l F 3 ( g )
2 N a 3 A l F 6 + 3 C a C l 2 = 6 N a F ( g ) + 3 C a F 2 + A l 2 C l 6 ( g )
2 N a 3 A l F 6 + 6 C a C l 2 = 6 N a C l ( g ) + 6 C a F 2 + A l 2 C l 6 ( g )
L i C l = L i C l ( g )
N a C l = N a C l ( g )
A l F 3 = A l F 3 ( g )
C a F 2 = C a F 2 ( g )
2 A l C l 3 = A l 2 C l 6 ( g )
Based on the above equation, the Gibbs free energy versus temperature was calculated for the reactions (3)–(14) at 1 atm, and the results are shown in Figure 4. According to Figure 4, the initial reaction temperature of each reaction under the 1 atm condition can be calculated, and the results are shown in Table 3. From Table 3, it can be seen that the initial temperature of (3) is 2117 K and the initial temperature of (7) is 2318 K under the 1 atm condition, which indicates that it is difficult to decompose the reaction of Li3AlF6 and Na3AlF6 under low temperature. The initial temperature of (5) is 2510 K and that of (9) is 2819 K. This indicates that the chlorination of Li3AlF6 and Na3AlF6 with CaCl2, respectively, can produce LiF and NaF only at higher reaction temperatures. When the reaction is increased to 1730 K, the first reaction that occurs for Li3AlF6 may be reaction (4), which produces a Li-containing compound mainly in the form of LiCl, and the generated Al is mainly in the form of AlF3. When the reaction is increased to 1637 K, the first reaction of Na3AlF6 may be reaction (8), and the resulting Na-containing compounds mainly exist in the form of NaCl, and the resulting Al mainly exists in the form of AlF3. As the chlorination roasting reaction temperature increases, the chlorine in CaCl2 combines with the Al in Li3AlF6, and likewise with the Al in Na3AlF6, and then the reaction yields Al2Cl6. The initial reaction temperatures of reactions (11)–(13) are between 1650 and 1787 K. However, other substances in the lithium-containing aluminum electrolyte may cause the (11)–(13) initial reaction temperatures to decrease, while the initial reaction temperature of (14) is at 2871 K, which is essentially impossible at lower temperatures. The initial reaction temperatures of reaction (14) is 454 K. However, the reactions that produce AlCl3 all have high initial reaction temperatures.

3.2. Experimental Programs

Firstly, a planetary ball mill was used to grind the bulk lithium-containing aluminum electrolyte into powder form with different particle sizes of 150–250 μm and 75–150 μm, then CaCl2 was added to the lithium-containing aluminum electrolyte raw materials in a certain proportion, which was mixed uniformly, and then a high-temperature smelting furnace was used as the heating equipment. Figure 5 shows the schematic diagram of the high-temperature melting furnace used in the experiment. According to the experimental requirements, under the standard condition, the specimen was thermally chlorinated and roasted in the high-temperature smelting furnace for a certain chlorination roasting time and at a certain temperature, and the specimen was cooled down to room temperature with the furnace after the heating was completed. Then, the product after chlorination roasting was crushed, leached with ionized water (pH = 6.8), kept warm, and then filtered to obtain the aqueous solution containing Li and the filter residue.

3.3. Effect of Reaction Conditions on Li Leaching Rate

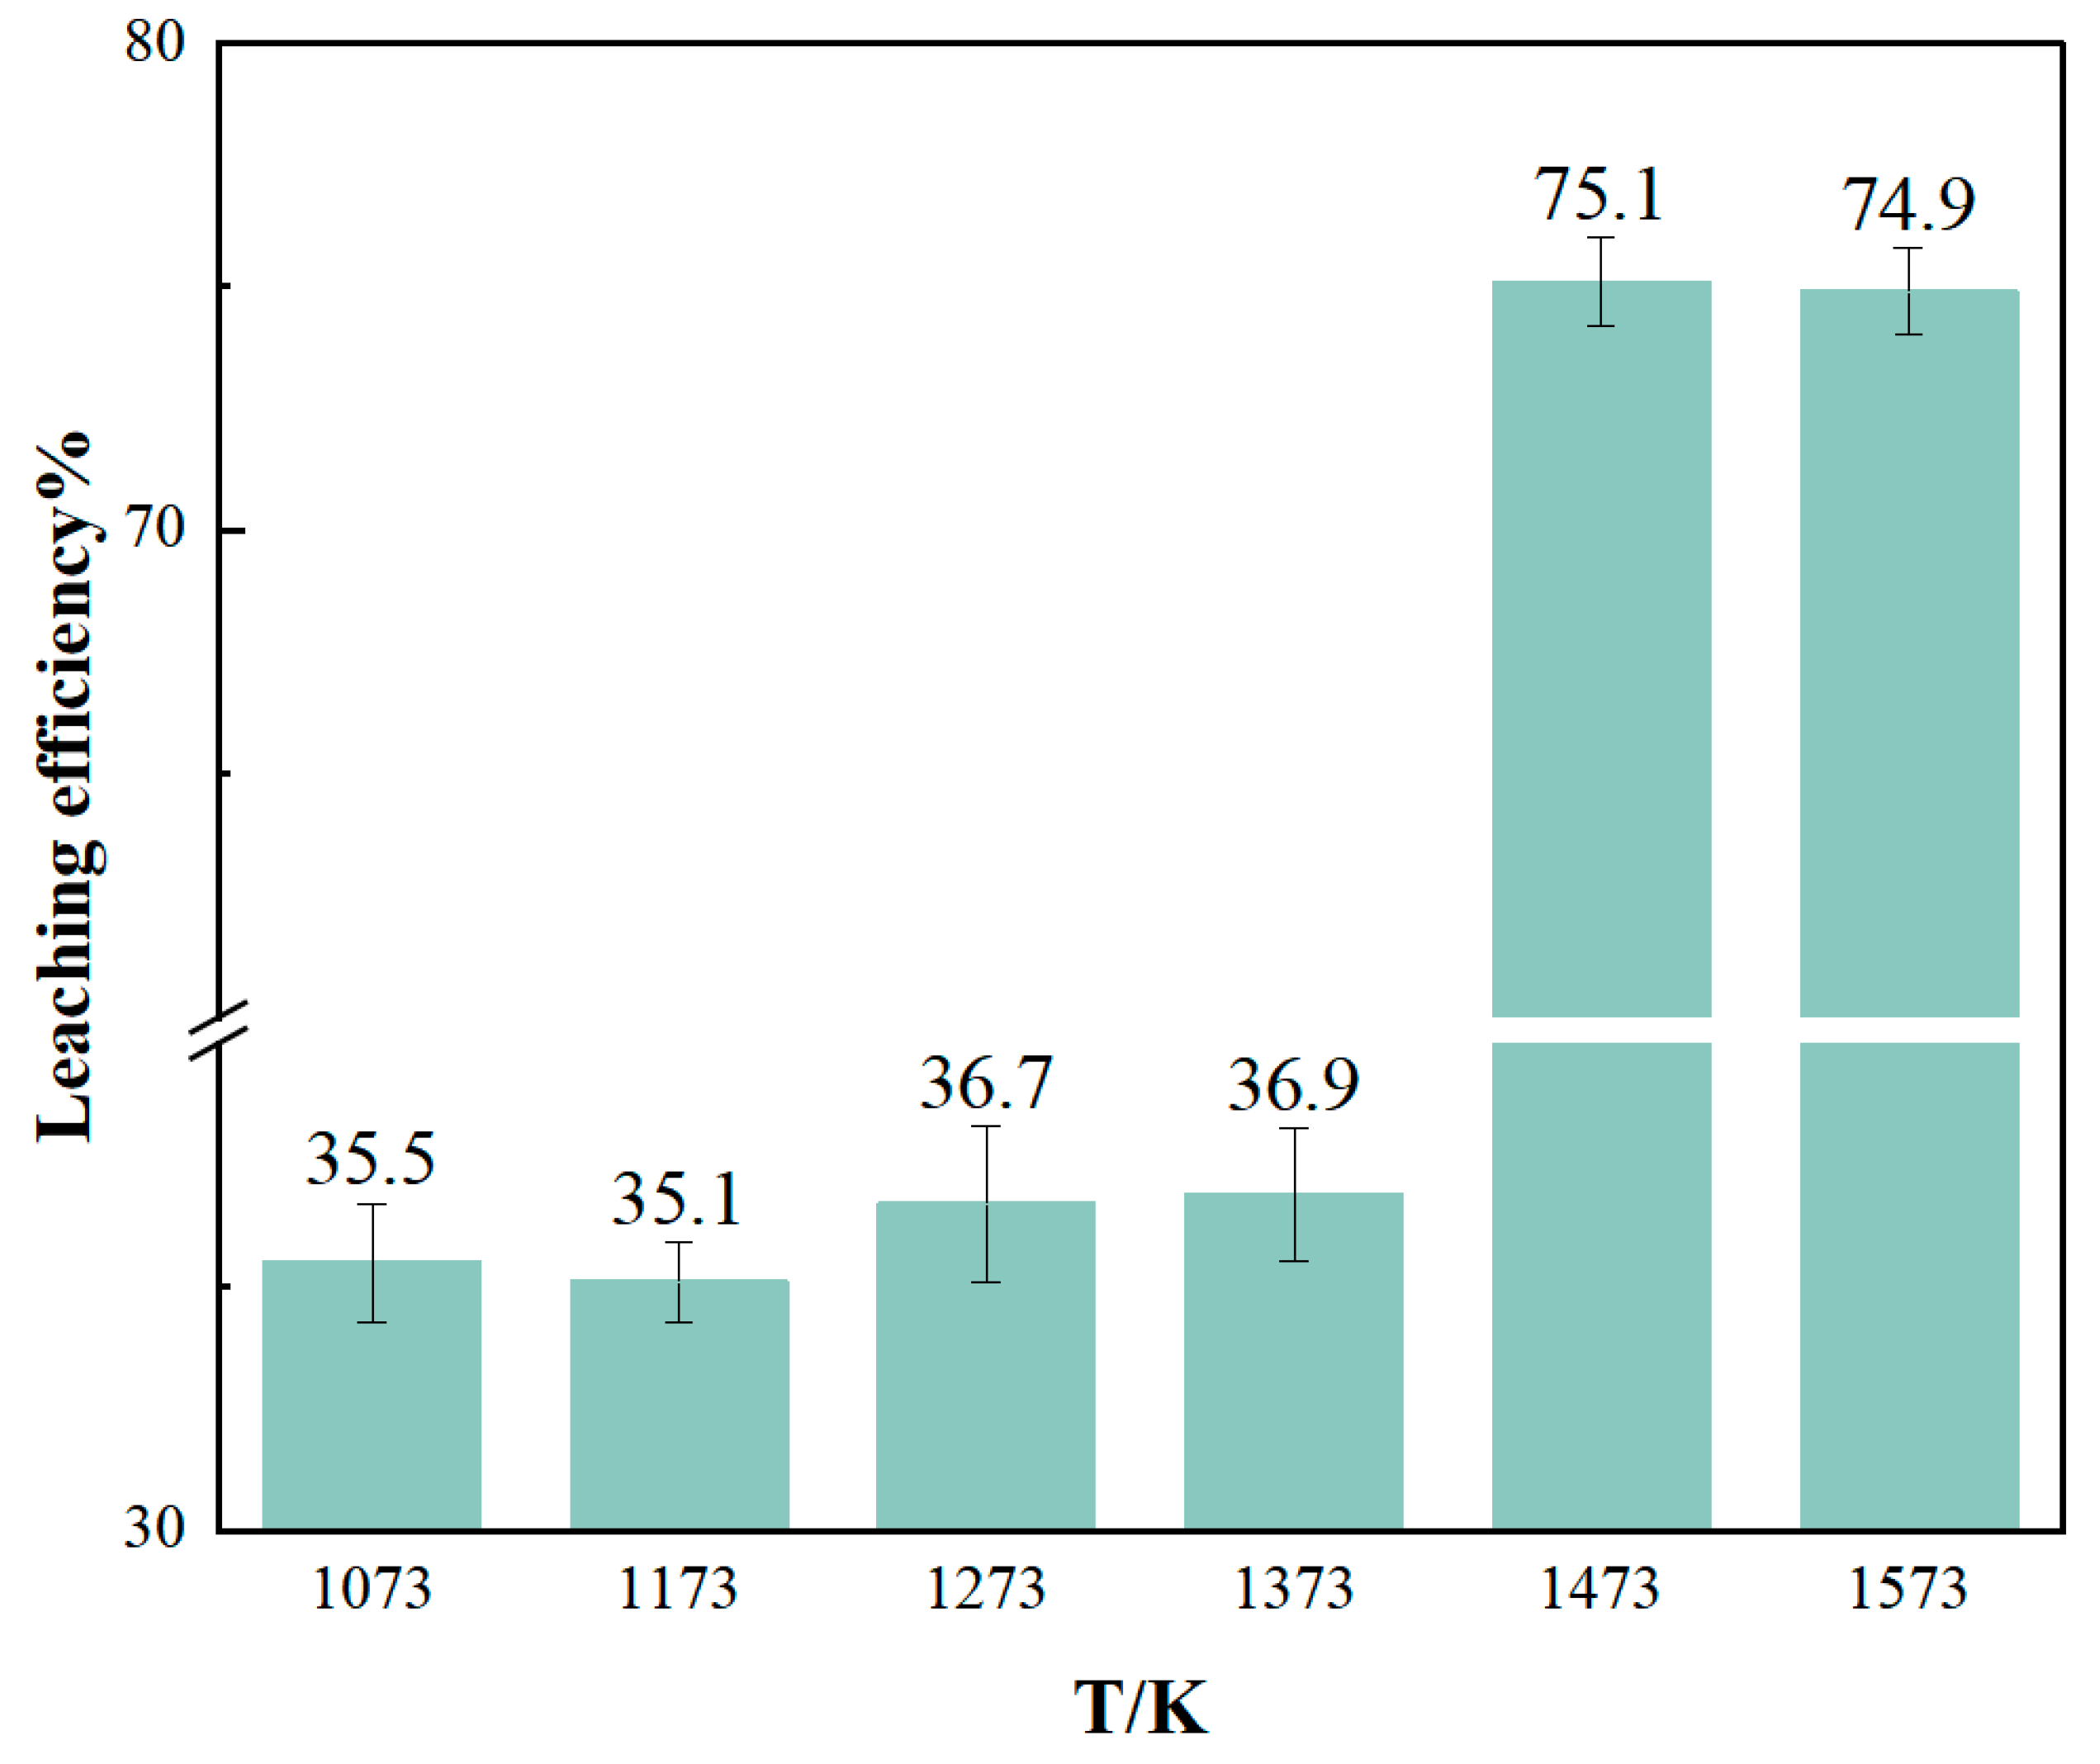
3.3.1. Effect of Chlorination Roasting Temperature on Li Leaching Rate

A lithium-containing aluminum electrolyte with particle sizes in the range of 75~150 μm was used, and the mass ratio of calcium chloride to the lithium-containing aluminum electrolyte was 3:5. The residue obtained after holding for 3 h was completely pulverized in a planetary ball mill under the temperature conditions of 1073~1573 K. The purpose of grinding was for subsequent leaching experiments and the related detection. The residue obtained was subjected to XRD analysis, and the results are shown in Figure 6. From the figure, it can be found that in the temperature range of 1073~1573 K, the physical phases of the roasting products obtained from various experiments were the same, which were mainly the incompletely reacted LiCaAlF6 phase, NaCl. The appearance of the LiCaAlF6 phase was due to the reaction between CaCl2 and Na2LiAlF6 in the lithium-containing aluminum electrolyte, and the Ca element replaces the Na element in Na2LiAlF6, which was still insufficient at this reaction temperature. The reaction temperature at this time was not enough to break the stable structure of lithium cryolite, so the LiCaAlF6 phase was generated. The reason for the decrease in NaCl content with increasing temperature may be that NaCl will volatilize in the form of gaseous NaCl and a small amount of gaseous Na2Cl2 near 800 °C and finish volatilizing near 1100 °C [34], which was consistent with thermodynamic calculations. When the temperature was increased to 1473 K, the diffraction peaks of LiCaAlF6 completely disappeared, accompanied by the enhancement of the intensity of the diffraction peaks of CaClF and CaF2. The diffraction peaks of LiCaAlF6 completely disappeared, while the diffraction peaks of Al-containing compounds did not enhance, and the ICP-AES detection of the Al element in the product of the chlorine roasting at 1473 K gave the mass fraction of the Al element to be 17.89%, while after the volatilization of NaCl, the theoretical mass fraction of Al should be 24.75%, which was about 6.9% lower, probably generating gaseous AlF3 or Al2Cl6, which was in line with the results of the thermodynamic calculations, so the enhancement of the diffraction peaks of Al-containing compounds was not detected. The generated Li-containing compounds were not detected in the XRD images of the residue at 1473 K and 1573 K. Combined with the thermodynamic analysis, it can be seen that this may have been due to the generation of gaseous LiCl volatilization, or it may have been due to the low content of Li in the raw material, which resulted in the content of Li in the roasting product being lower than the lower limit value of detection.
The condensate under the conditions of 1473 K and 1573 K was subjected to XRD detection, and the results are shown in Figure 7, which shows that the main components of the condensate under the conditions of 1473 K and 1573 K for chlorine roasting were LiCl, AlF3, and NaCl, but the result of the XRD detection was LiCl·H2O, and the reason for the generation of LiCl·H2O may be that LiCl is extremely water-absorbent and may have absorbed water from the air during the process. The reason for the generation of LiCl·H2O may be that LiCl is very easy to absorb water and may have absorbed water in the air during the process of grinding and being sent for the inspection so that it existed in the form of LiCl·H2O. After the ICP-AES detection of lithium in the residue of chlorination roasting at 1473 K and 1573 K, it was calculated that the Li in the residue accounted for 1.31% and 1.28% of the Li in the raw material, and only a small amount of lithium still existed in the residue, so it can be seen that most of the lithium existed in the condensate after chlorination roasting with CaCl2.
The residue after chlorination roasting was pulverized together with the condensate and leached using deionized water at a leaching temperature of 368 K, a leaching time of 3 h, and a solid–liquid ratio of 1/3, and the stirring rate was 300 r/min. The leaching experiments were carried out under these conditions, and it can be seen in Figure 8 that when the chlorination roasting temperatures ranged from 1073 to 1373 K, the leaching rate of Li was lower than 37% in all cases. When the chlorination roasting temperature was increased to 1473 K, the leaching rate of Li reached 75.1%. It can be seen that the Li compounds generated under the condition of 1473 K were transformed into soluble lithium salts. When the temperature was further increased to 1573 K, the Li leaching rate did not increase, and the leaching rate decreased by 0.2%. The leaching rate of Li reached 75.0%. It can be seen that the generated Li-containing compounds mainly existed in the condensate in the collection tray.
From the use of calcium chloride on the lithium-containing aluminum electrolyte for chlorine roasting and the effect of the Li leaching rate, it can be determined that the optimal temperature for the experiment is 1473 K under the condition of a chlorine roasting time of 3 h.

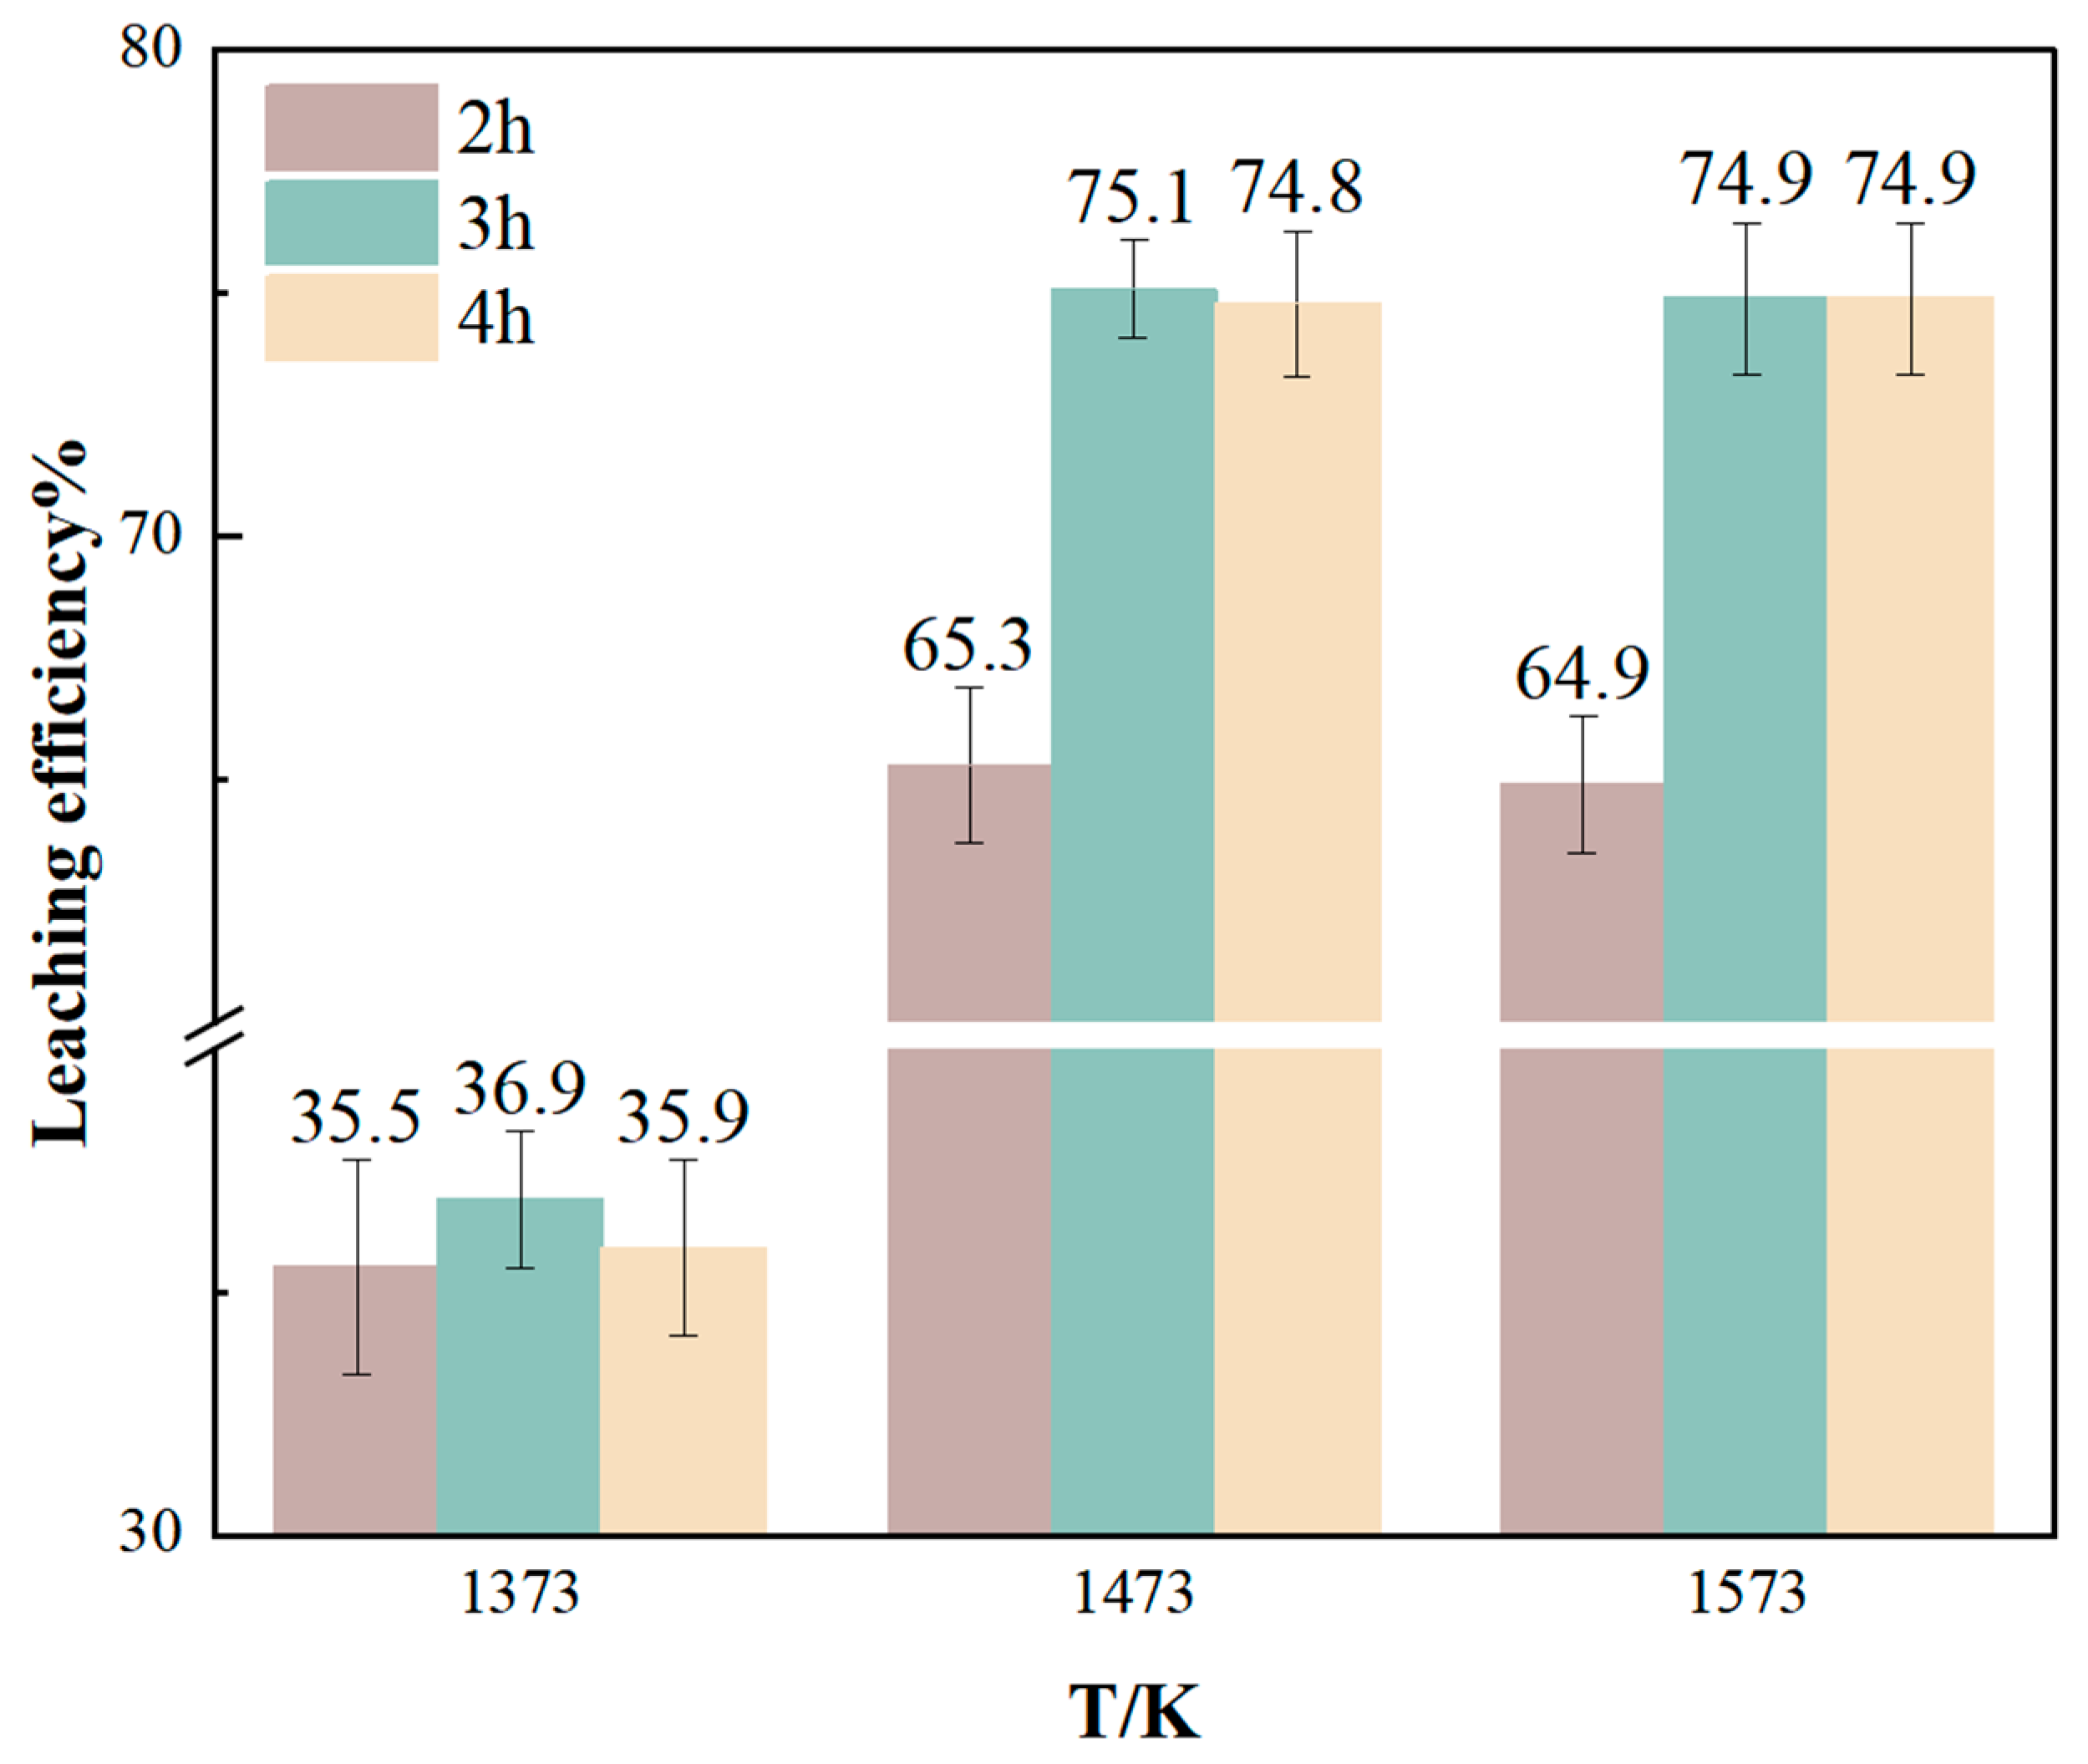
3.3.2. Effects of Chlorination Roasting Temperature and Holding Time on Li Leaching Rate

Using the lithium-containing aluminum electrolyte with the particle size of 75~150 μm, the mass ratio of calcium chloride to lithium-containing aluminum electrolyte is 3:5. The holding time is 2~4 h under the temperature condition of 1373~1573 K. The 5 g condensate is crushed and then leach with deionized water. The leaching temperature is 368K, the leaching time is 3 h, the solid–liquid ratio is 1/3, and the stirring rate is 300 r/min. Figure 9’s experimental results show that under the same holding time, the leaching rate of Li increases with the increase in the temperature of chlorine roasting. When the chlorine roasting temperature is less than 1473 K, the reaction temperature has not yet reached, and increasing the temperature of chlorine roasting has a greater impact on the leaching rate of Li; when the temperature of chlorine roasting is greater than 1473 K, the leaching rate of Li is unchanged. At the same chlorination roasting temperature, the leaching rate of Li increases with the increase in holding time. When the holding time is less than 3 h, part of the Na2LiAlF6 has not fully reacted, resulting in a low leaching rate of Li. At this time, the extension of the holding time has a greater impact on the recovery of lithium from Na2LiAlF6, and the leaching rate of Li increases faster. When the holding time is greater than 3 h, the growth of the leaching rate of Li by extending the holding time becomes slow. Under the present experimental conditions, the optimum temperature for the experiment is 1473 K, the holding time is 3 h, and the leaching rate of Li is 75.1%.

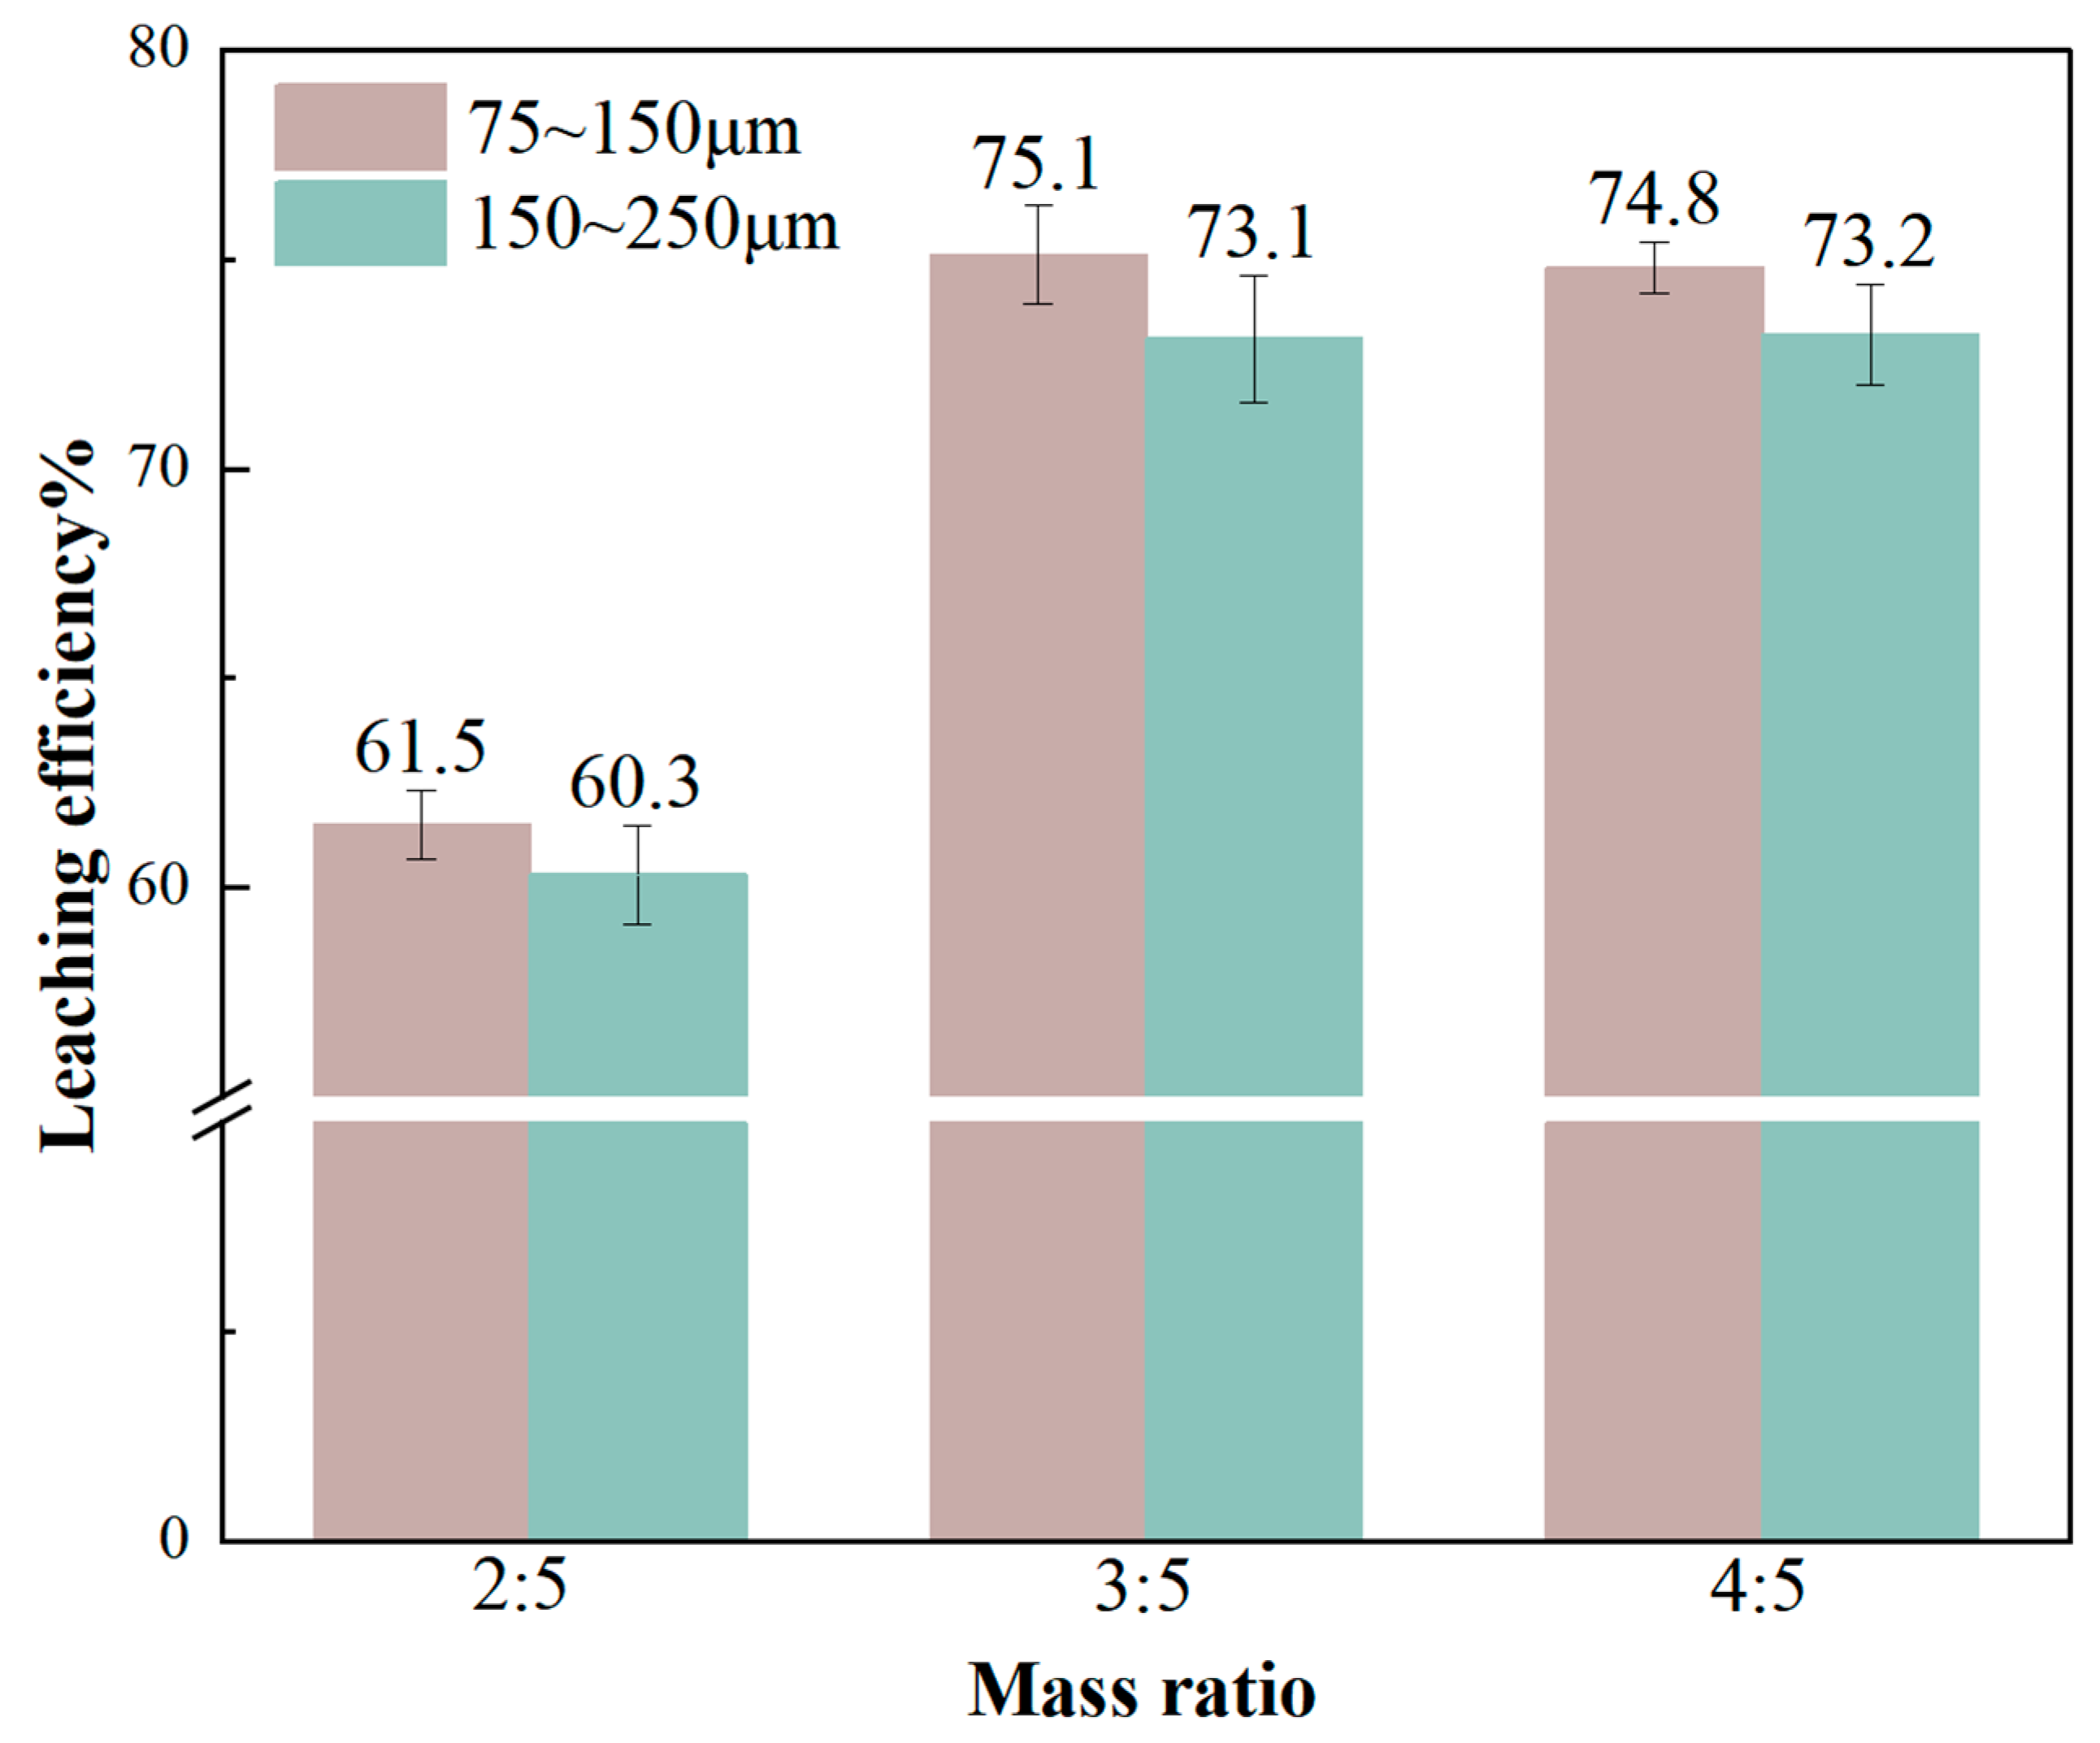
3.3.3. Effects of Raw Material Particle Size and CaCl2 Ratio on Li Leaching Rate

Using the lithium-containing aluminum electrolyte with the particle size of 75~150 μm and 150~250 μm, the mass ratios of CaCl2 and lithium-containing aluminum electrolyte used in the experiment were 2:5, 3:5, and 4:5, respectively, and the temperature of chlorination roasting was kept at 1473 K and held for 3 h. The condensate was pulverized and then used to be leached with deionized water with the temperature of leaching at 368 K, and the time of leaching was 3 h, the solid–liquid ratio was 1/3, and the stirring rate was 300 r/min, and the results of leaching experiments under these conditions are shown in Figure 10. It can be seen that when the same amount of CaCl2 is added, the smaller the particle size of the raw material, the higher the leaching rate of Li, but too high a particle size will increase the time of processing raw materials and increase the cost of extracting Li, so choosing the appropriate particle size is conducive to the comprehensive recovery of Li. When the mass ratio of added calcium chloride to lithium aluminum electrolyte is less than 3:5, it is not enough to react with all of the Na2LiAlF6, resulting in a lower leaching rate of Li. At this time, increasing the addition of CaCl2 has a greater impact on the recovery of lithium from Na2LiAlF6, and the leaching rate of Li increases faster. When the mass ratio of added calcium chloride to lithium–aluminum electrolyte is greater than 3:5, the added CaCl2 has less effect on the leaching rate of Li, indicating that when the mass ratio of calcium chloride and lithium-containing aluminum electrolyte used in the experiment is 3:5, the added calcium chloride is sufficient to react with lithium-containing aluminum electrolyte. Therefore, under the present experimental conditions, the optimal particle size of the experimental raw materials is 75~150 μm, the optimal mass ratio of calcium chloride and lithium-containing aluminum electrolyte is 3:5, and the leaching rate of Li is 75.1%.

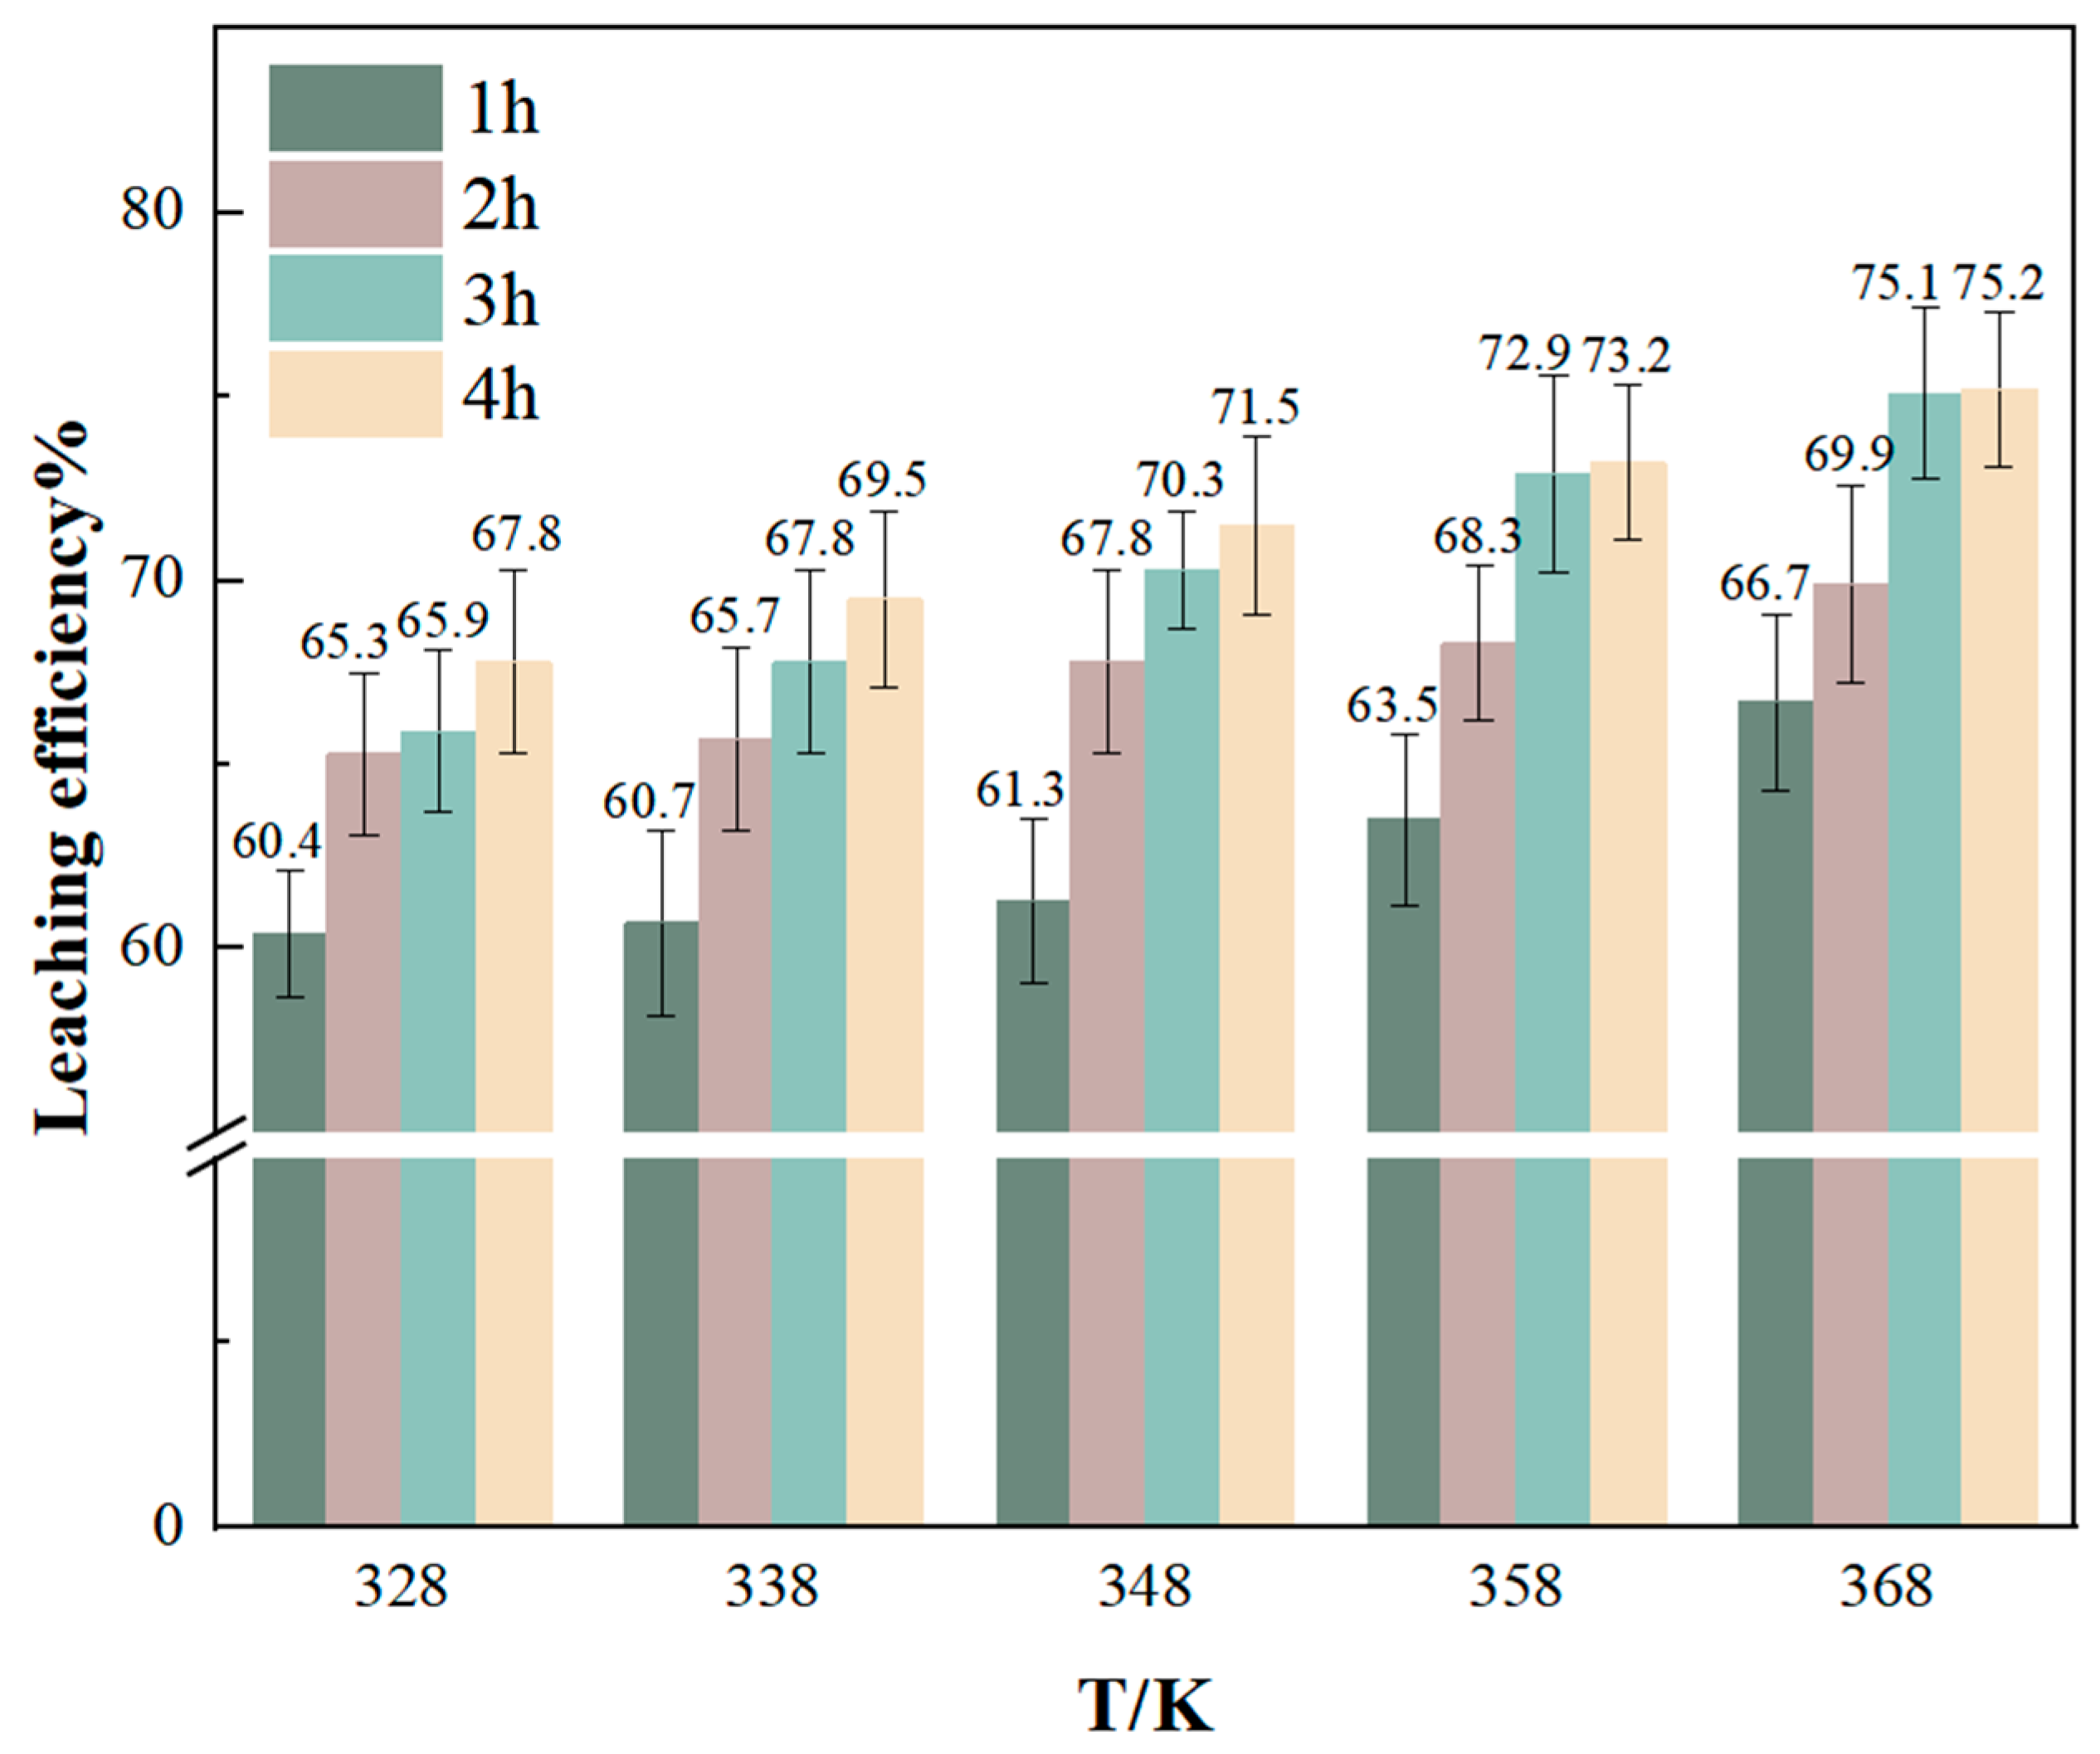
3.3.4. Effect of Leaching Temperature and Leaching Time on the Leaching Rate of Li

The condensate after chlorination roasting was leached under the conditions of selecting the chlorination roasting temperature of 1473 K, the holding time of 3 h, the particle size of raw materials of 75~150 μm, and the mass ratio of calcium chloride to the lithium-containing aluminum electrolyte of 3:5, with the leaching temperature of 328~368 K, the leaching time of 1~4 h, and the stirring rate of 300 r/min. The leaching rate of Li is shown in Figure 11. The experimental results showed that at the same leaching temperature, the leaching rate of Li increased with the increase in leaching time. However, when the reaction temperature was increased to 368 K, the leaching time was greater than 3 h, which has little effect on the leaching rate of lithium. Appropriately increasing the leaching temperature and leaching time was favorable to the leaching of Li, but too long a leaching time increased the cost of recovering lithium. Therefore, the optimum leaching temperature for this experiment was selected as 368 K, the leaching time was 3 h, and the leaching rate of Li was 75.1%.
Under these conditions, the ICP-MS detection of Li in the residue of chlorination roasting and leaching residue showed that the mass fraction of Li in the residue was 0.21%, the mass fraction of Li in the leaching residue was 0.56%, the volatilization rate of Li was 90.3%, the leaching rate of Li was 75.1%, the chlorination efficiency was 68.7%, and the reason for the lower leaching rate of Li was due to the insufficient condensation collection system of the experimental equipment, resulting in a small amount of LiCl cannot be collected.

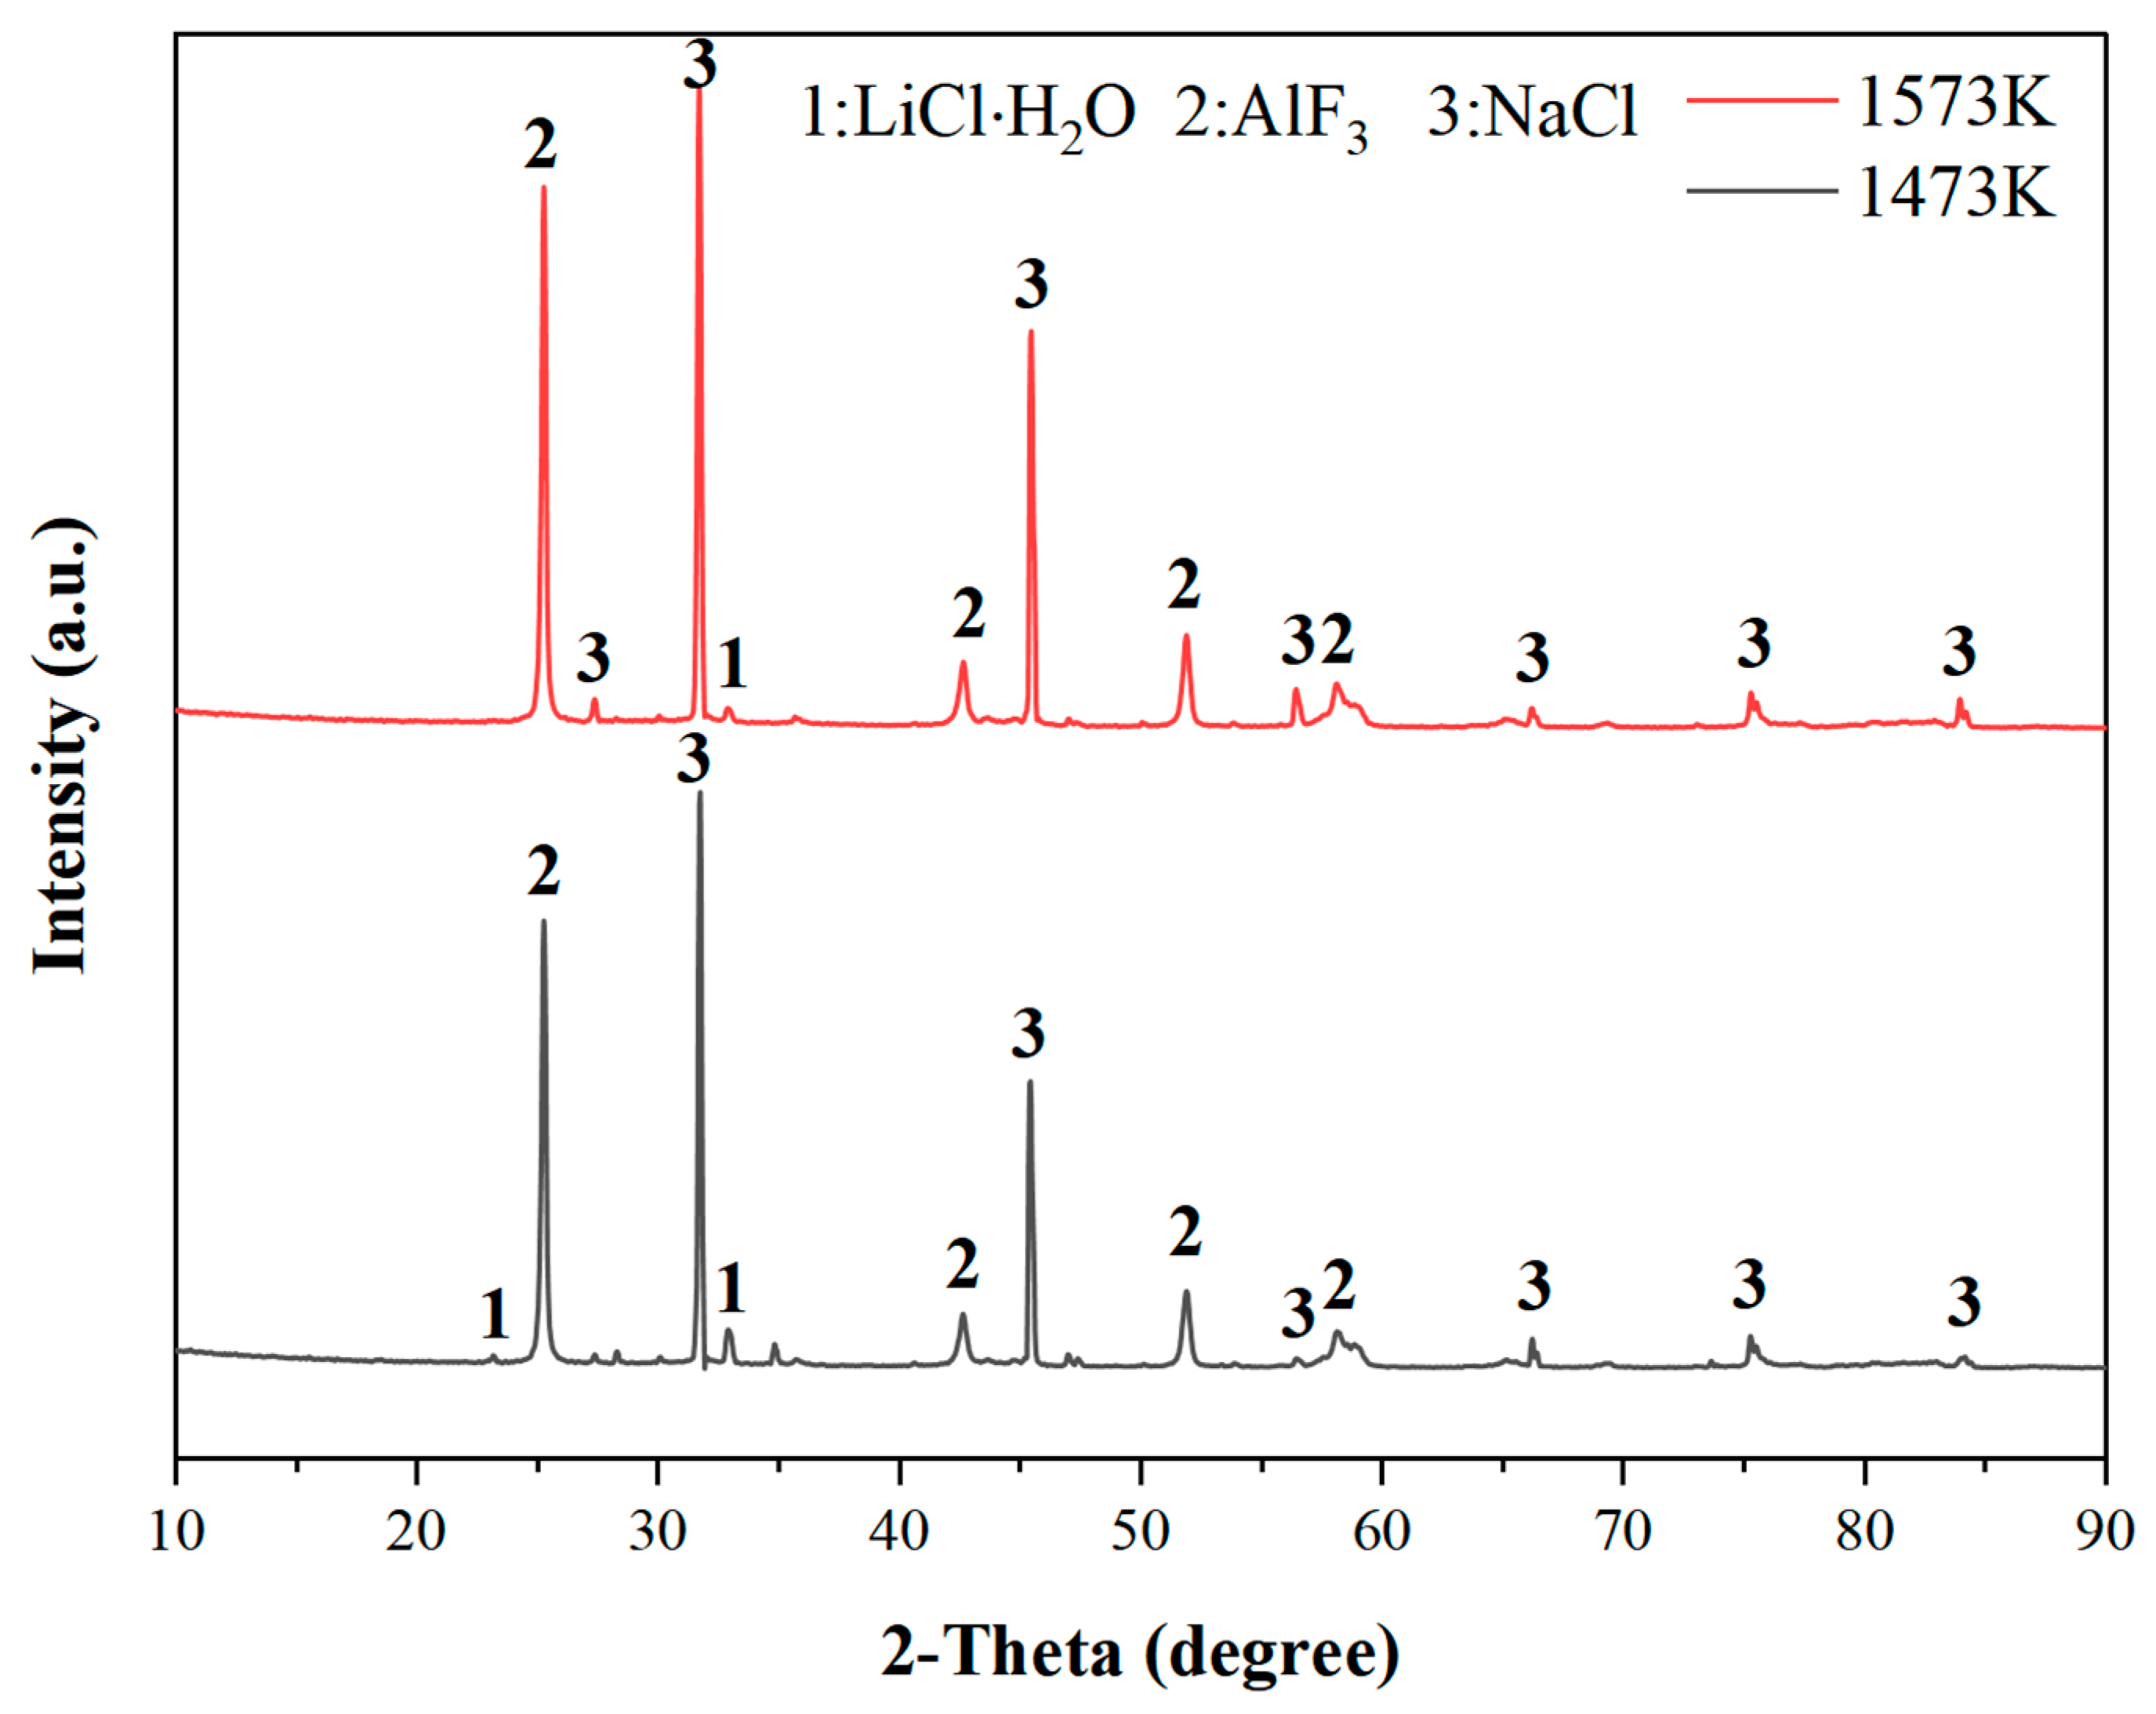
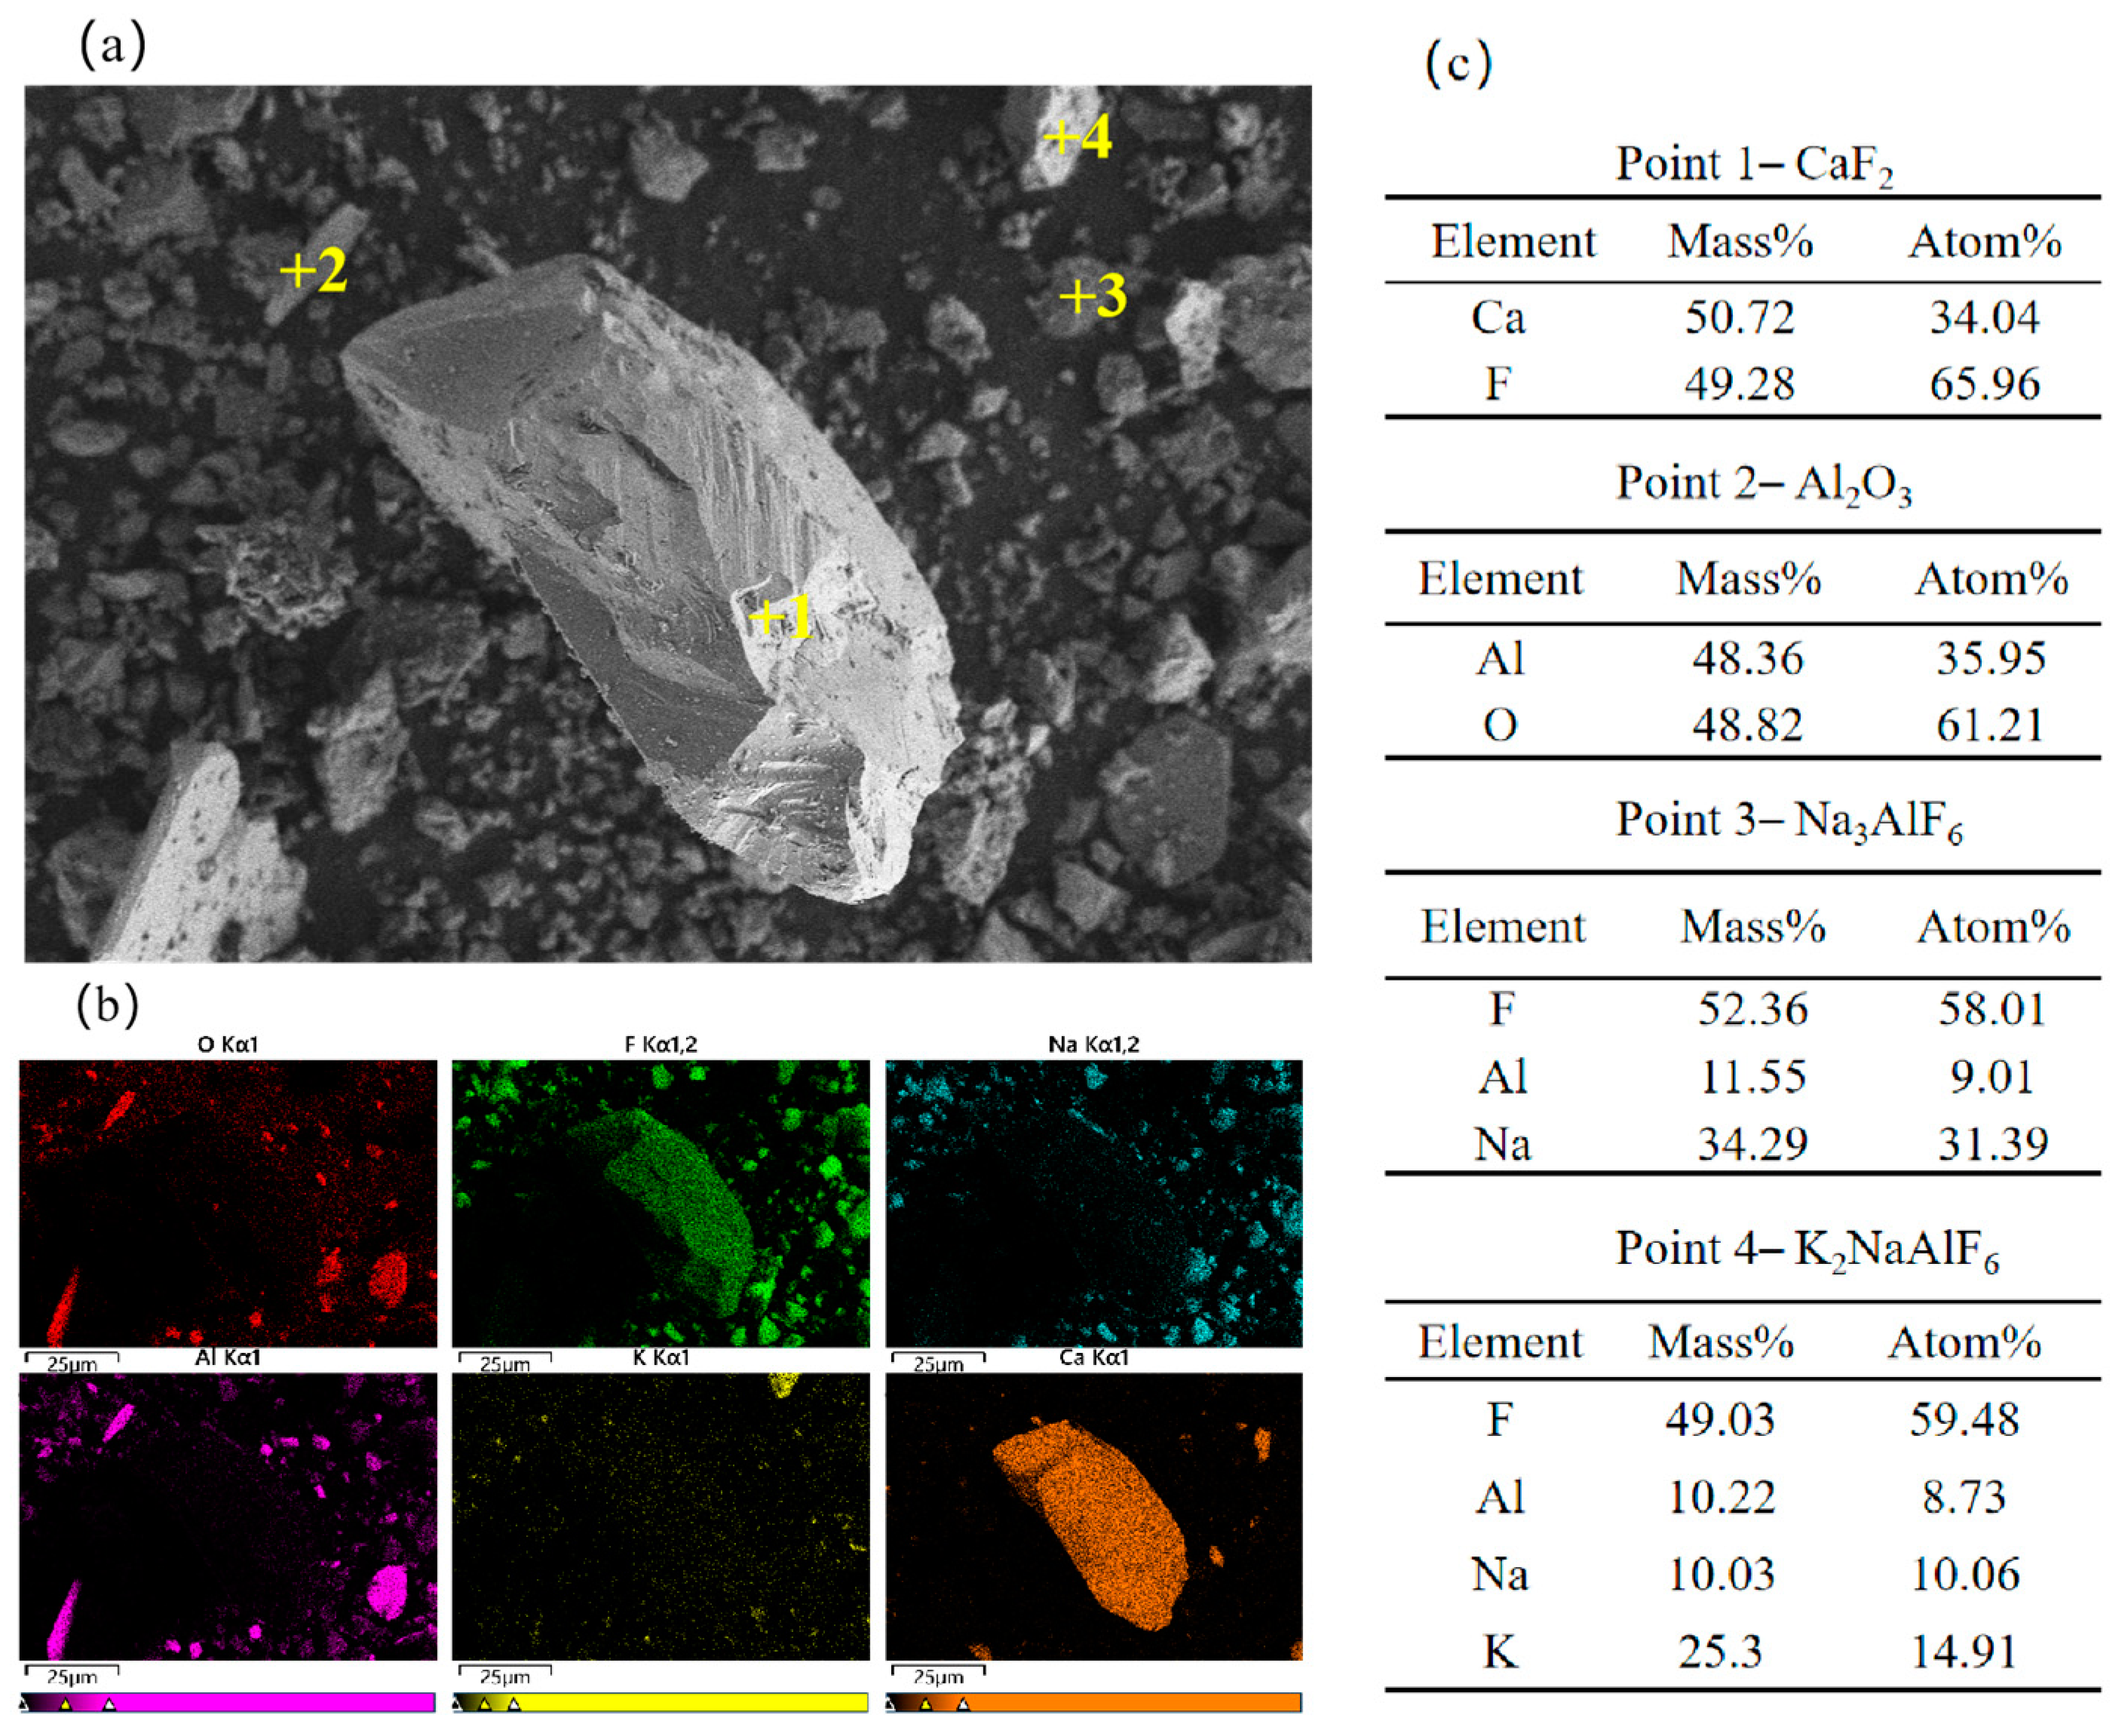
3.3.5. Analysis of Leach Residue

After drying the leaching slag, it was subjected to XRD testing and elemental analysis, and the XRD results are shown in Figure 12. At the same time, the obtained products were compared with the standard composition of GB/T4292-2017 [35] implemented in China’s aluminum fluoride industry, and the specific results are shown in Table 4.
As can be seen from Figure 12, through the physical phase analysis of the leaching slag of the process, the diffraction peaks of the leaching slag are consistent with that of aluminum fluoride, and there are no other phases, which can indicate that the leaching slag has a pure component. The content of the main elements in the leaching slag is shown in Table 4, and its main components are Al, and F, and it also contains a small amount of O and Na elements. Compared with the industrial aluminum chloride composition of the national standard, it meets the standard of aluminum chloride. The mass fraction of the Al element in the residue of chlorination roasting is 19.52%, the mass fraction of the Al element in the leaching slag is 31.72%, the direct yield of Al is 32.39%, and the purity of AlF3 recovered after testing is 92.7%. The reason for the lower straight yield of the Al element is that the raw material also contains a large amount of alumina, which is structurally stable and not easy to react under neutral conditions, so it leads to a poor recovery of Al in lithium-containing aluminum electrolytes.

4. Conclusions

(1)
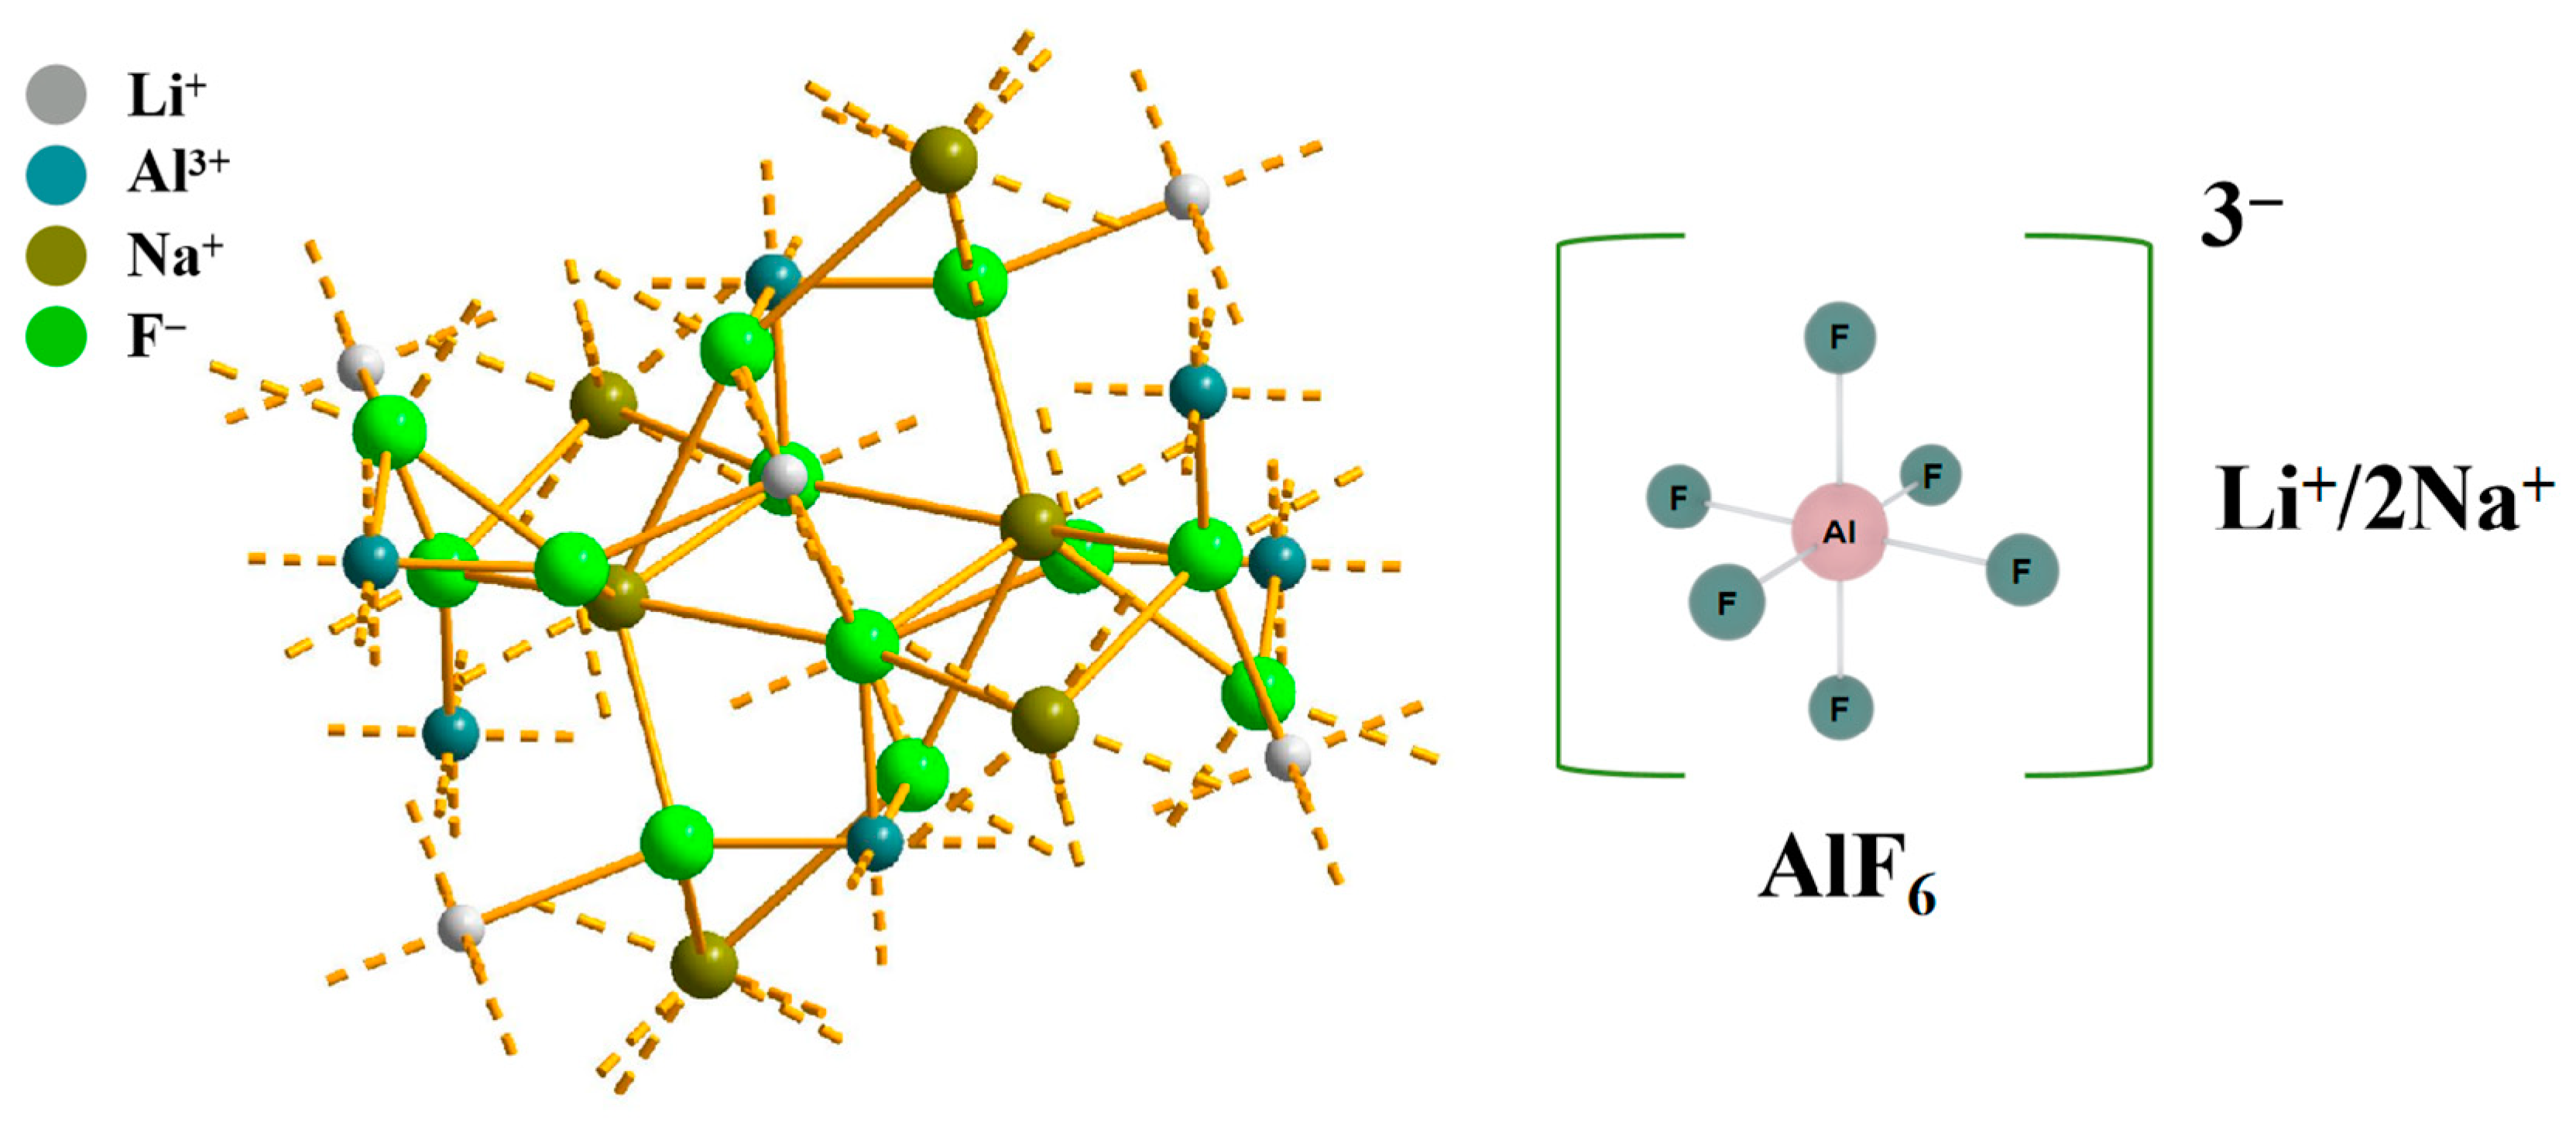
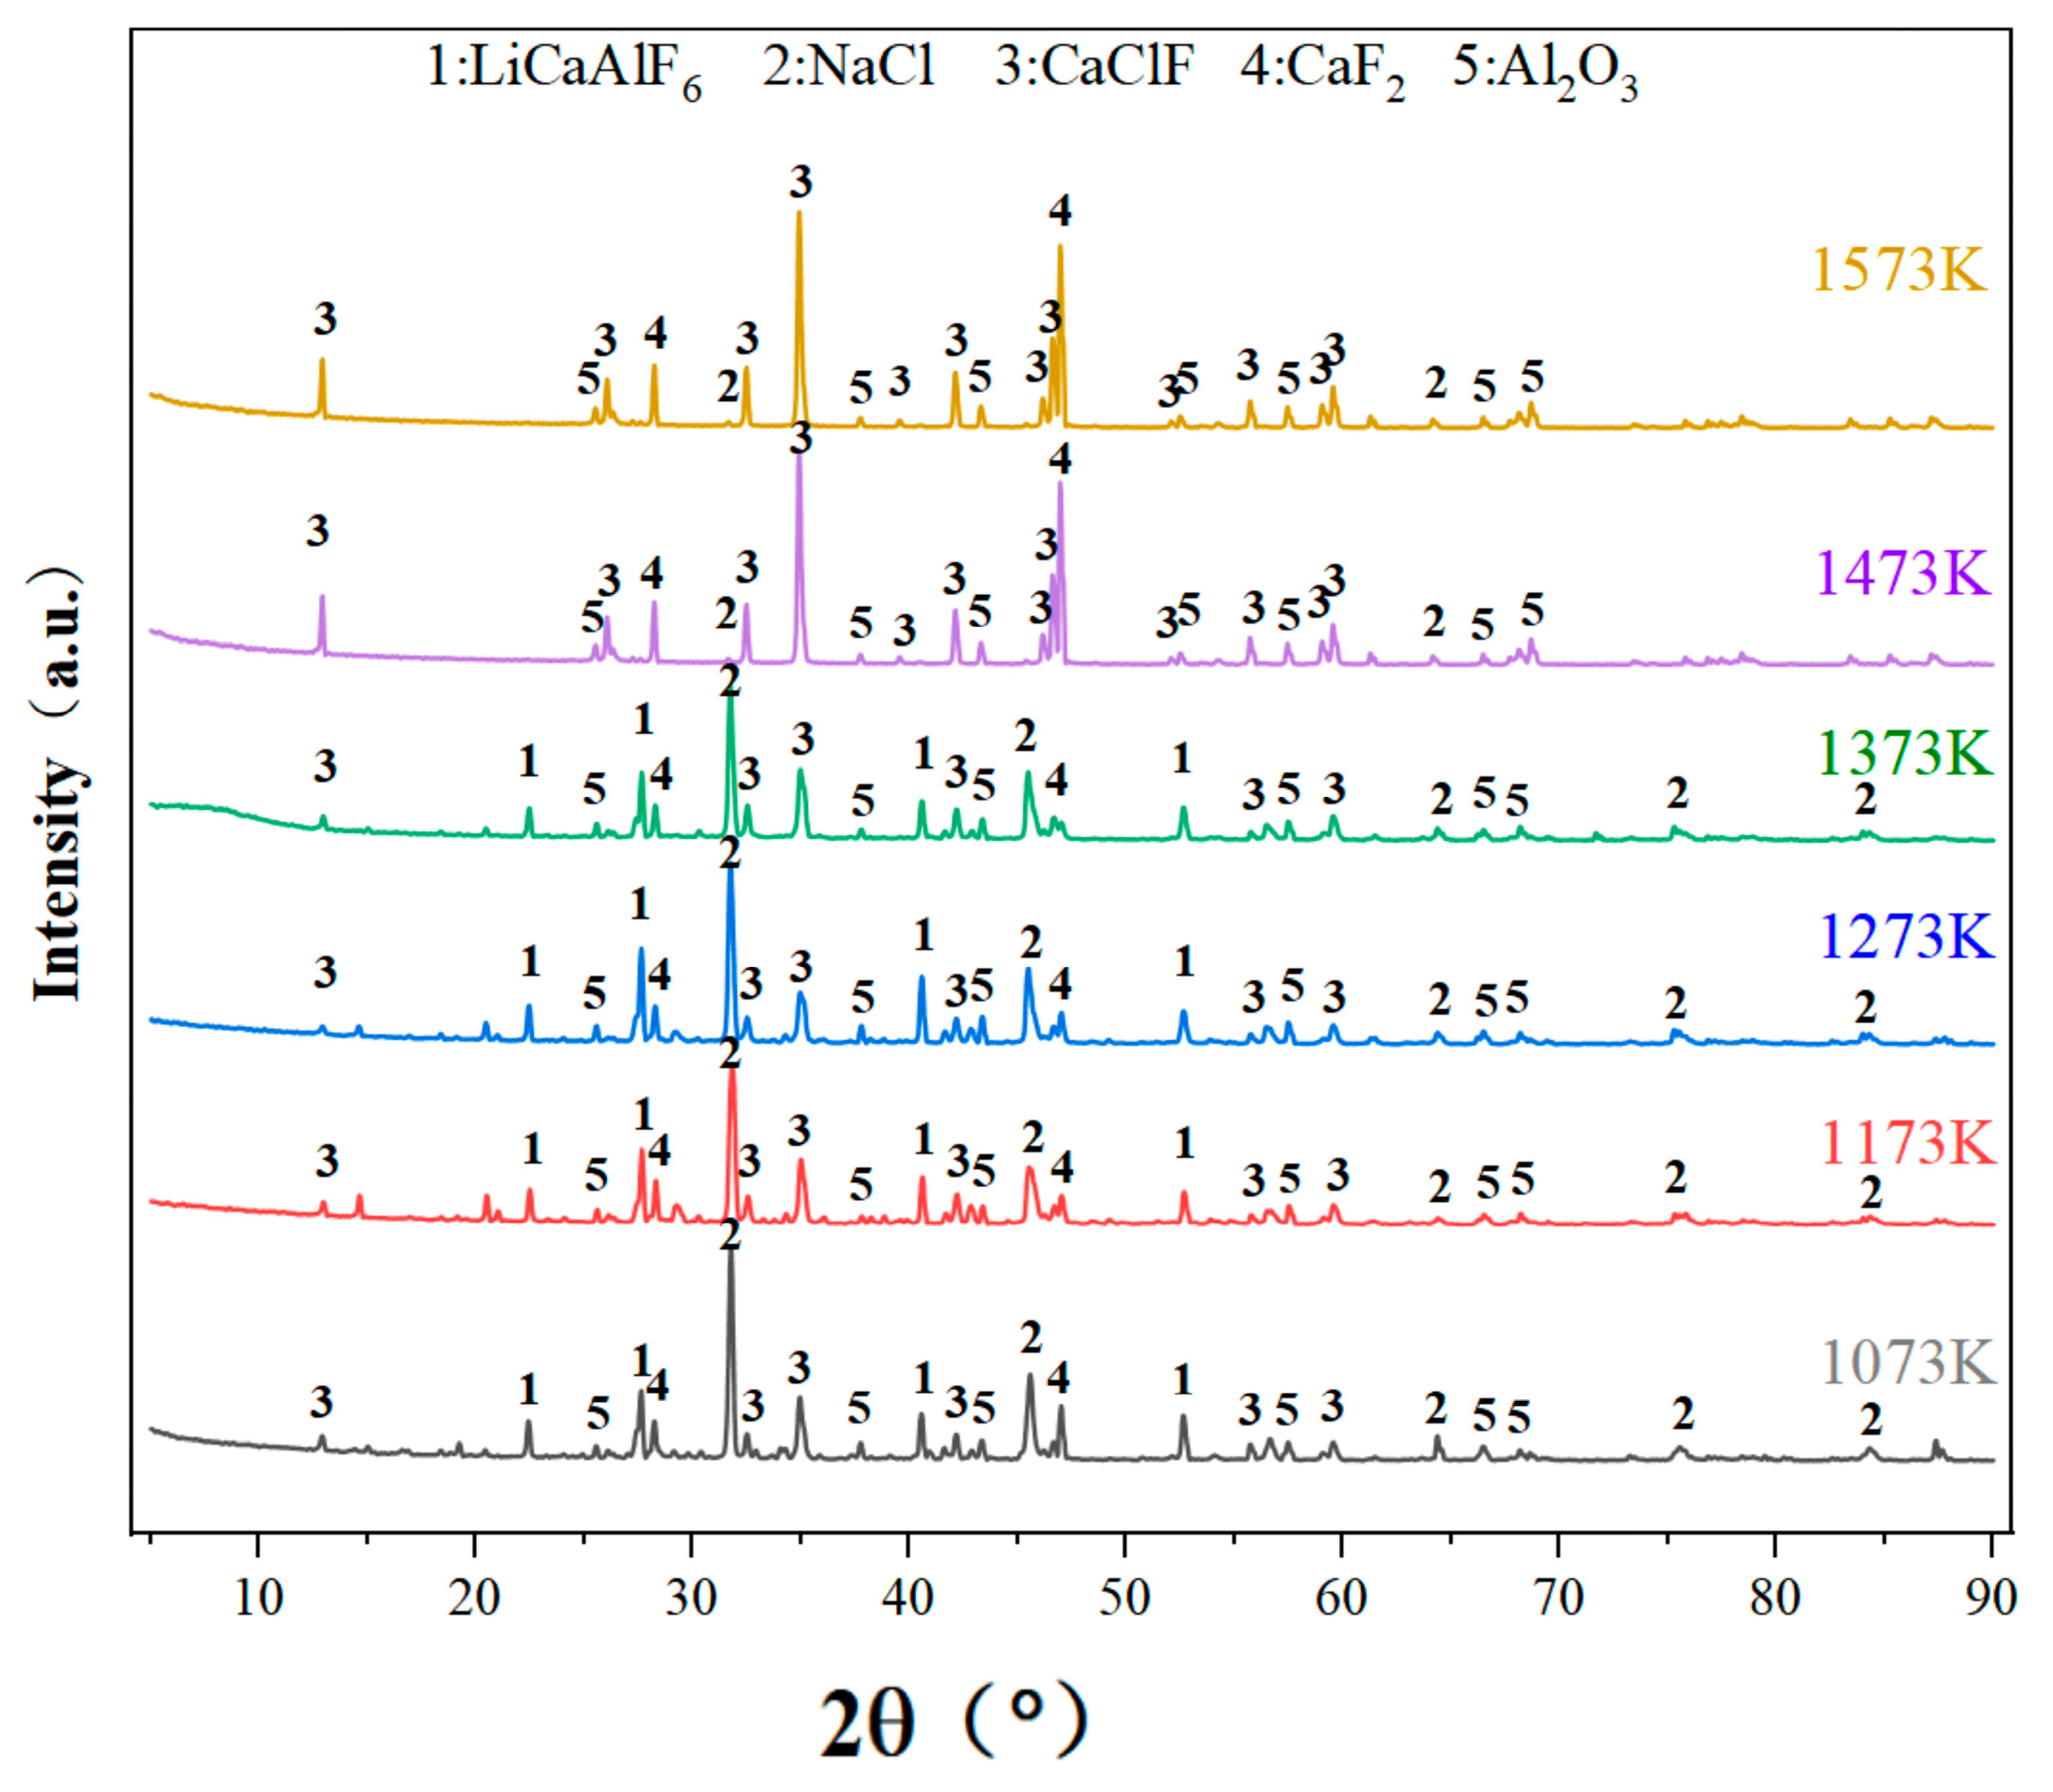
Thermodynamic calculations are carried out using HSC Chemistry 6.0 thermodynamic software, and the results show that chlorination roasting using CaCl2 with Na2LiAlF6 reacts preferentially at 1630 K to produce LiCl, NaCl, and AlF3, while the decomposition produces LiF at temperatures above 2000 K, which suggests that the addition of CaCl2 reduces the reaction temperature and improves the feasibility of the reaction. Through the experiments, it is shown that CaCl2 reacts with Na2LiAlF6 to produce CaLiAlF6 when the temperature is less than 1473 K. With the increase in the reaction temperature, CaLiAlF6 is transformed into LiCl, which exists in the condensate, which proves that it is feasible to prepare soluble lithium salts using CaCl2.
(2)
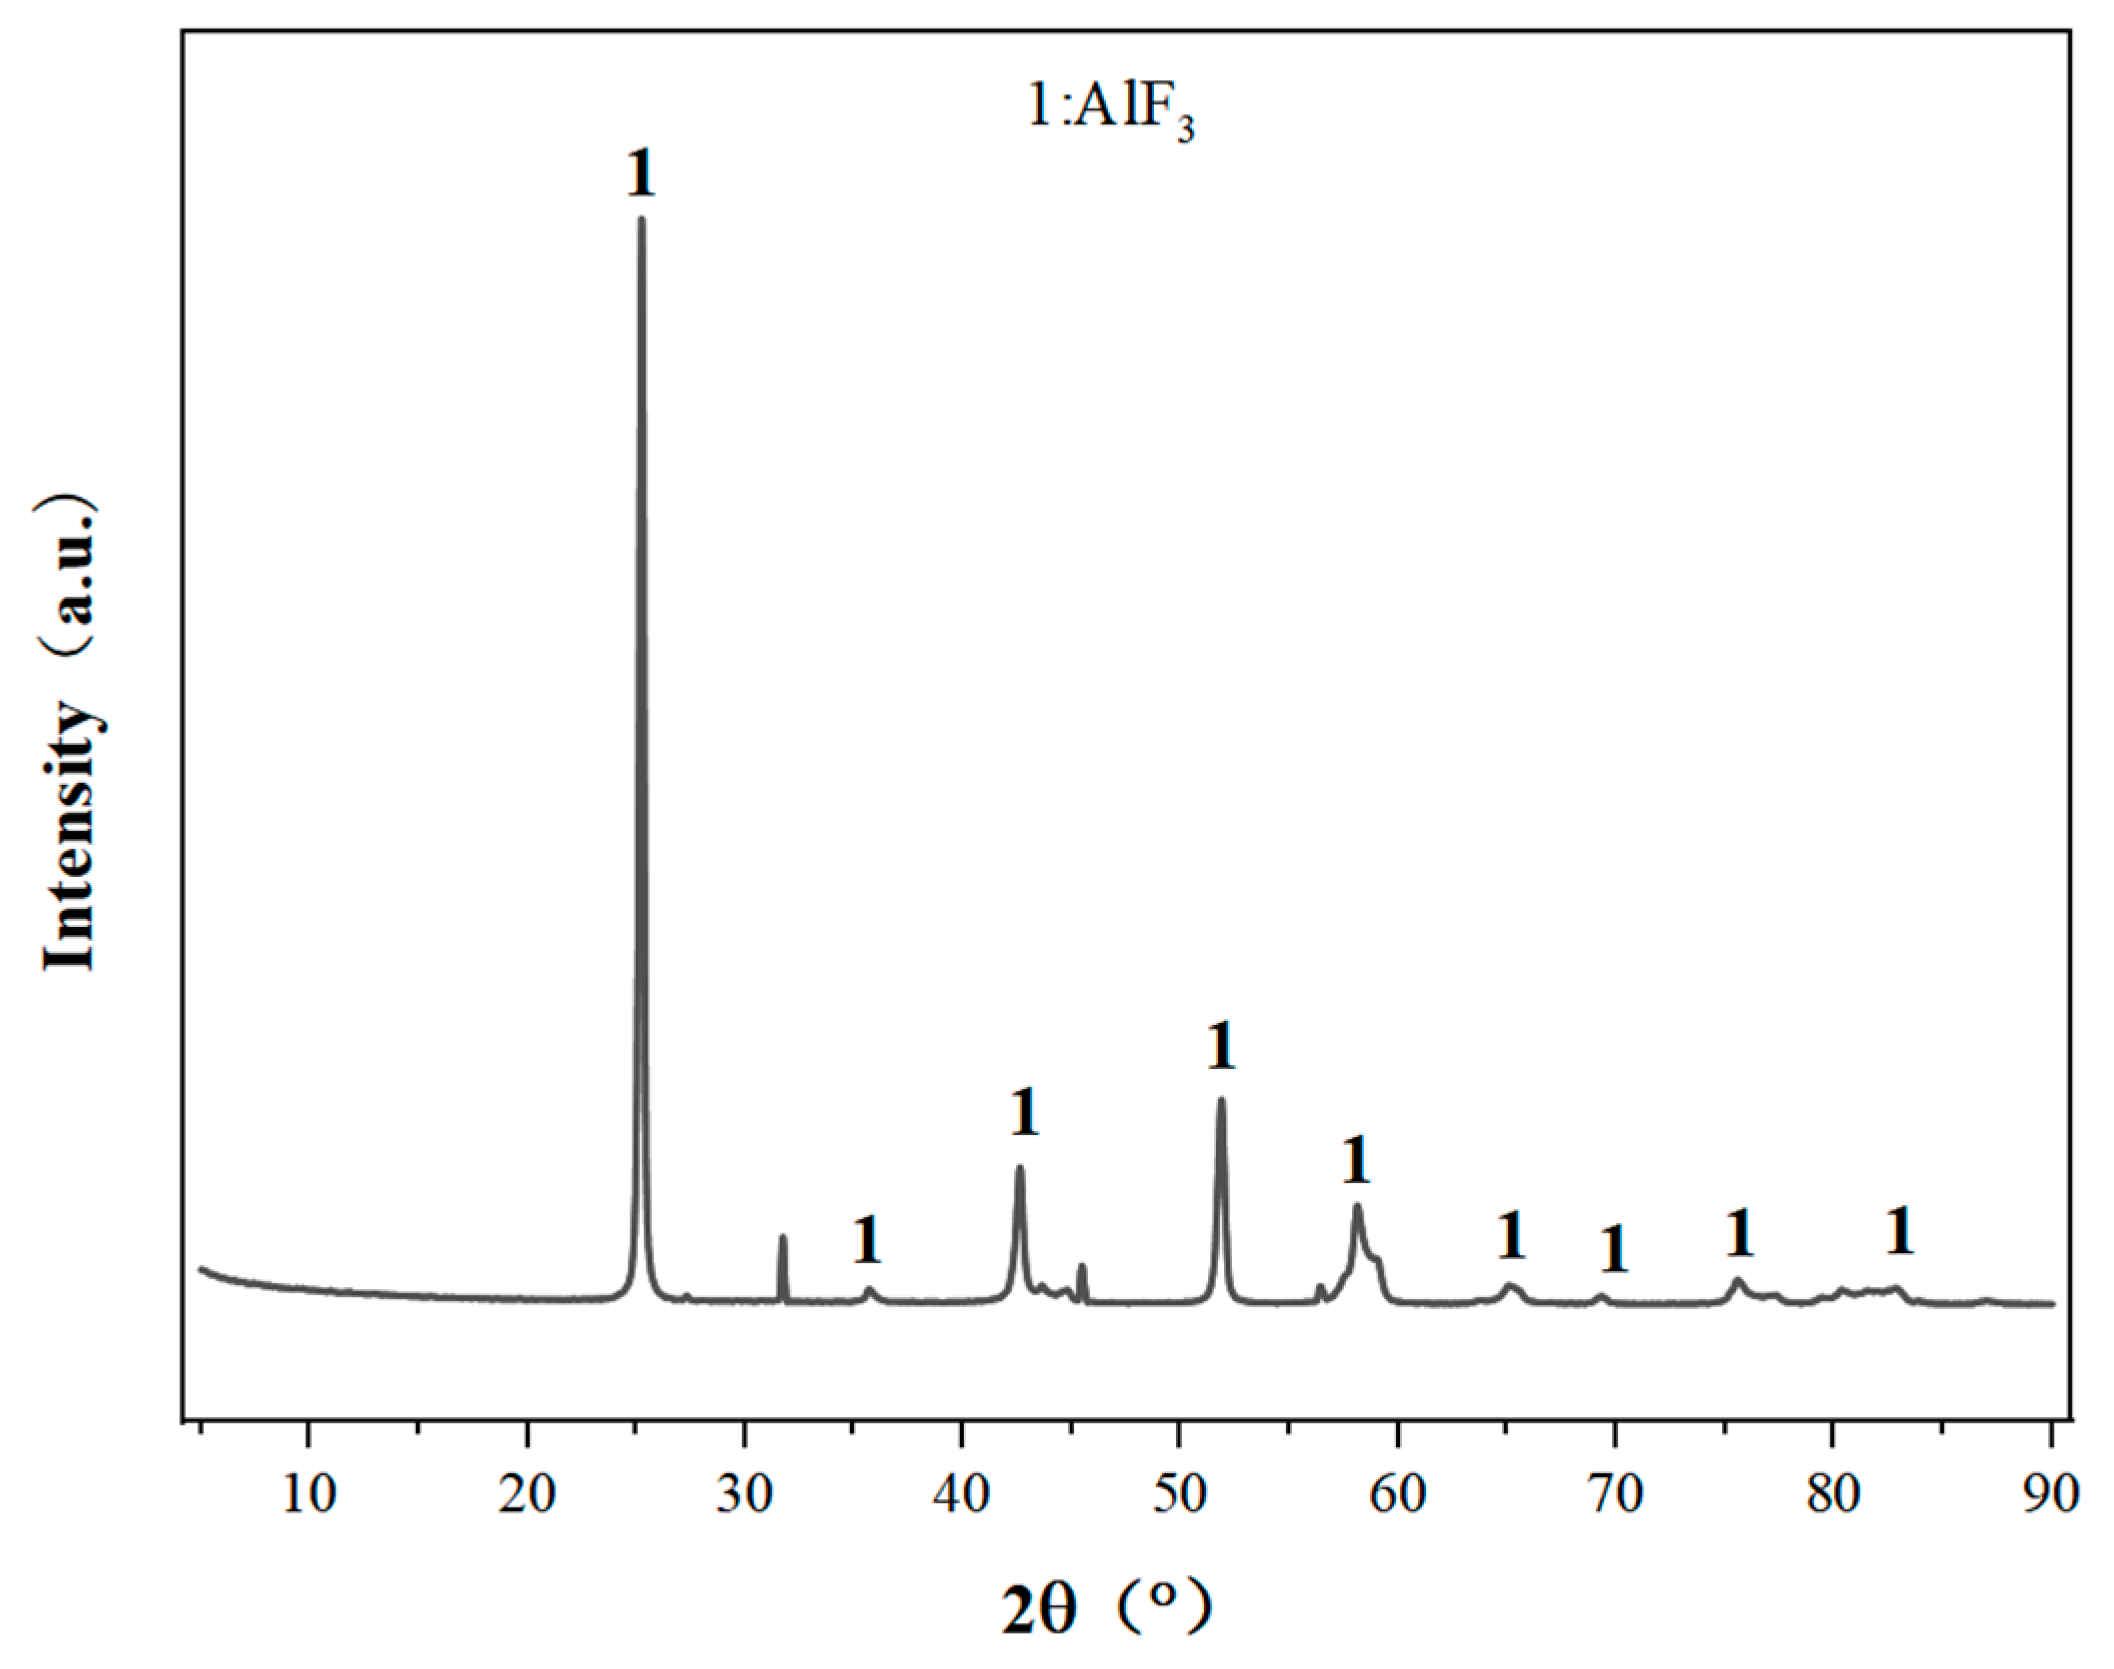
From the experimental results, it can be seen that reducing the particle size of raw materials, increasing the leaching temperature, and increasing the leaching time are all conducive to improving the leaching rate of Li, but too high a temperature, too long a reaction time, and the refinement of the particle size of the raw materials will increase the cost of recovering lithium, so more appropriate reaction conditions should be selected. The best experimental conditions for the recovery of lithium from lithium-containing aluminum electrolyte by chloride roasting are as follows: the particle size of lithium-containing aluminum electrolyte is 75~150 μm, the mass ratio of calcium chloride to the lithium-containing aluminum electrolyte is 3:5, the reaction temperature is 1473 K, and the holding time is 3 h. The product of the reaction is crushed, and then it is leached using deionized water, the temperature of which is 368 K and the duration of which is 2 h. The solid–liquid ratio is 1/3, the stirring rate is 300 r/min, and the leaching rate of Li under the experimental conditions is as follows. Under these conditions, the leaching rate of Li can reach 75.1%, and the purity of collected AlF3 can reach 92.7%. From the lithium content in the residue of chlorination roasting, it can be seen that 98% of the lithium is converted to a gaseous state after chlorination roasting, and it should exist in the condensate. Theoretically, the leaching rate of lithium should reach more than 95%. The condensation system under the current process conditions is not perfect enough, resulting in part of the lithium chloride vapor easily escaping and being difficult to collect effectively. Therefore, the recovery of lithium can be enhanced in the future by improving the condensation collection system, and the recovery of lithium chloride can also be enhanced by simulating the variation in the thermal field in the furnace chamber to select a suitable condensation interval.
(3)
The disadvantage of chlorination roasting with CaCl2 is that the current process conditions for optimal lithium extraction have a low direct yield of Al. This is mainly because the lithium-containing aluminum electrolyte feedstock also contains a large amount of stable alumina, which is not easy to react under neutral conditions.

Author Contributions

Conceptualization, R.J. and T.Q.; methodology, R.J., X.C., W.Z., S.W., M.Y. and T.Q.; theoretical basis, R.J., X.C. and W.Z.; formal analysis, R.J.; investigation, S.W. and M.Y.; resources, T.Q.; data curation, R.J. and T.Q.; writing—original draft preparation, R.J.; writing—review and editing, R.J.; visualization X.C. and W.Z. All authors have read and agreed to the published version of the manuscript.

Funding

This research received no external funding.

Data Availability Statement

The data presented in this study are available on request from the corresponding author (privacy).

Conflicts of Interest

The authors declare no conflicts of interest.

References

  1. Li, C.X.; An, H.Y.; Bai, Y.; Liu, G.Q.; Wang, G.L.; Liu, X. Experimental Study on the Removal of Electrolytic Aluminum Slag by Flotation. Non-Met. Mines 2019, 42, 66–68. [Google Scholar] [CrossRef]
  2. Ishak, R.; Laroche, G.; Lamonier, J.F.; Ziegler, D.P.; Alamdari, H. Characterization of Carbon Anode Protected by Low Boron Level: An Attempt to Understand Carbon–Boron Inhibitor Mechanism. ACS Sustain. Chem. Eng. 2017, 5, 6700–6706. [Google Scholar] [CrossRef]
  3. Lv, X.; Shuang, Y.; Li, J.; Chen, S.; Lai, Y.; Zhang, H.; Liu, Y. Physicochemical Properties of Industrial Aluminum Electrolytes Enriching Li and K: The Liquidus Temperature. Metall. Mater. Trans. B 2017, 48, 1315–1320. [Google Scholar] [CrossRef]
  4. Hou, H.J. Brief Discussion of Application of Anhydrous Aluminium Fluoride Contained Lithium. Light Met. 2011, 48, 34–36. [Google Scholar] [CrossRef]
  5. Gheribi, A.E.; Phan, A.T.; Chartrand, P. Electrochemical Description of the Interfacial Tension between the Liquid Metal Pad and Cryolitic Melts in Industrial Electrolysis Cells. J. Mol. Liq. 2023, 369, 120843. [Google Scholar] [CrossRef]
  6. Cassayre, L.; Palau, P.; Chamelot, P.; Massot, L. Properties of Low-Temperature Melting Electrolytes for the Aluminum Electrolysis Process: A Review. J. Chem. Eng. Data 2010, 55, 4549–4560. [Google Scholar] [CrossRef]
  7. Bo, D. Study on Analytical Method of Aluminum Electrolyte. Chem. Eng. Des. Commun. 2021, 47, 59–60. [Google Scholar] [CrossRef]
  8. Lin, Y.C.; Liu, Y.; Yin, G.; Dang, C.G.; Xiong, R.Y. Research on Fluoride Whole-Process Prevention and Control in the Electrolytic Aluminum Enterprise Based on Material Flow Analysis. J. Environ. Eng. Technol. 2023, 13, 800–807. [Google Scholar] [CrossRef]
  9. Hao, J.T.; Wen, F.Y.; Li, X. Study on Extracting Lithium from Electrolytic Aluminum Waste Residue. Inorg. Chem. Ind. 2019, 51, 69–71. [Google Scholar] [CrossRef]
  10. Xu, H.; Fu, C.C.; Xu, R. Extraction Toxicity Identification of Anode Slime and Anode Scrap Produced by Electrolytic Aluminum Enterprises and Recommendations on Their Management. Environ. Monit. China 2015, 31, 22–25. [Google Scholar] [CrossRef]
  11. Li, Q.; Cui, X.D.; Gao, W.Y. Countermeasures and Origins of Carbon Residue in Aluminum Reduction Production. Light Met. 2015, 52, 36–38. [Google Scholar] [CrossRef]
  12. Huang, L.H.; Shi, H.L.; Hou, A.Y. Influence of Lithium-Rich Alumina on Production of Aluminum Electrolysis. Nonferrous Met. Des. 2018, 45, 98–100, 110. [Google Scholar] [CrossRef]
  13. Cao, A.L.; Yao, S.H. Analysis on Enrichment Mechanism of Li in the Aluminum Electrolyte and Its Measures. Light Met. 2017, 54, 27–31. [Google Scholar] [CrossRef]
  14. Arahman, N.; Mulyati, S.; Lubis, M.R.; Takagi, R.; Matsuyama, H. The Removal of Fluoride from Water Based on Applied Current and Membrane Types in Electrodialyis. J. Fluorine Chem. 2016, 191, 97–102. [Google Scholar] [CrossRef]
  15. Corral-Capulin, N.G.; Vilchis-Nestor, A.R.; Gutiérrez-Segura, E.; Solache-Ríos, M. The Influence of Chemical and Thermal Treatments on the Fluoride Removal from Water by Three Mineral Structures and Their Characterization. J. Fluor. Chem. 2018, 213, 42–50. [Google Scholar] [CrossRef]
  16. Yelatontsev, D.; Mukhachev, A. Processing of Lithium Ores: Industrial Technologies and Case Studies—A Review. Hydrometallurgy 2021, 201, 105578. [Google Scholar] [CrossRef]
  17. Ding, S.H.; Chen, R. Exploration and Practice on Purification of Electrolyte System with High Lithium Potassium Salt by Segregation Method. Nonferrous Met. Des. 2020, 47, 14–18. [Google Scholar] [CrossRef]
  18. Gao, B.L.; Jiang, Q.W.; Qiu, Z.X.; Zhao, X.L. Phases of Complicated Aluminum Electrolytes. J. Northeast. Univ. (Nat. Sci.) 2002, 23, 28–31. [Google Scholar] [CrossRef]
  19. Li, D. Phases Analysis and Cryolite Ratio Determination of Aluminum Electrolytes. Master’s Thesis, Northeastern University, Shenyang, China, 2009. [Google Scholar] [CrossRef]
  20. Han, J.J. Study on Recovery Process of Lithium-Containing Electrolyte Produced by Electrolytic Aluminum Industry. Henan Chem. Ind. 2018, 35, 24–27. [Google Scholar] [CrossRef]
  21. Mei, X.Y.; Li, J.; Yu, Z.L. The Research on Recycling Carbon Residue by Floatation Process. Light Met. 2016, 53, 28–30. [Google Scholar] [CrossRef]
  22. Dong, L.M.; Jiao, F.; Liu, W.; Jiang, S.Q.; Wang, H.L. Research Progress of Electrolytic Aluminum Overhaul Slag Disposal. Multipurp. Util. Miner. Resour. 2023, 44, 159–168. [Google Scholar] [CrossRef]
  23. Tang, C.; Wang, J.; Yang, S.; Zhang, X.; Li, S.; Lai, Y.; Tian, Z.; Jin, S.; Chen, Y. Efficient Extraction and Recovery of Lithium from Waste Aluminum Cryolite Electrolyte. Resour. Conserv. Recycl. 2023, 197, 107070. [Google Scholar] [CrossRef]
  24. Tang, J.; Chen, X.Q.; Wang, B.; Chen, L.J. Research and Application of Low Temperature Fire Treatment Technology for Electrolytic Aluminum Carbon Slag. World Nonferrous Met. 2021, 36, 134–137. [Google Scholar] [CrossRef]
  25. Ma, J.L.; Shang, X.F.; Ma, Y.P.; Qiao, P.; Feng, L.; Zhang, W.Q. Directions for Development of Hazardous Waste Treatment Technologies in Electrolytic Aluminum Industry. Environ. Prot. Chem. Ind. 2016, 36, 11–16. [Google Scholar] [CrossRef]
  26. Li, Z.; Wu, A.H.; Wang, J.C.; Lu, W.Y.; Li, Q.Q.; Zhang, L.S. Research Status and Prospects of Resource Recycling and Harmless Treatment Technology for Aluminum Electrolysis Waste Residue. Met. Mine 2023, 12, 252–262. [Google Scholar] [CrossRef]
  27. Zhang, N.N.; Wu, M.Q.; Han, R.; Shi, Z.Y.; Li, Z.; Yu, Y.X. Research Progress on Harmless Treatment and Resource Utilization of Electrode Waste Residue from Electrolytic Aluminum Industry. Nonferrous Met. (Extr. Metall.) 2023, 75, 102–110. [Google Scholar] [CrossRef]
  28. Gao, Y. Current Situation and Development Trend of Hazardous Waste Disposal Technology in Electrolytic Aluminum Industry. Nonferrous Met. Eng. Res. 2019, 40, 33–35. [Google Scholar] [CrossRef]
  29. Lin, Y.Q. Safety Production Management of Hydrofluoric Acid Using Process. Mod. Chem. Res. 2020, 20, 45–47. [Google Scholar] [CrossRef]
  30. Hou, J.; Shi, D.; Wang, Z.; Gao, B.; Shi, Z.; Hu, X. Influence of Additives on Bath Analysis in Aluminum Electrolysis. JOM 2017, 69, 2057–2064. [Google Scholar] [CrossRef]
  31. Ross, K.C.; Mitchell, R.H.; Chakhmouradian, A.R. The Crystal Structure of Synthetic Simmonsite, Na2LiAlF6. J. Solid State Chem. 2003, 172, 95–101. [Google Scholar] [CrossRef]
  32. Liu, F.Q.; Li, A.J.; Li, R.B.; Yang, X.; Wu, Z.G. Study on Recovery and Utilization of Multiple Elements in Aluminum Electrolyte by Calcified Roasting. Nonferrous Met. (Extr. Metall.) 2021, 73, 67–71. [Google Scholar] [CrossRef]
  33. Zhang, Y.L.; Cheng, J.Y.; Wang, T.; Han, Q.C. Study on Impurity Removal by Secondary Cryolite Roasting. Gansu Metall. 2023, 45, 78–81. [Google Scholar] [CrossRef]
  34. Li, J.; Pu, G.; Chen, J.S.; Liu, Q.W. High-Temperature Volatility Characteristics and Pyrolysis Mechanism of Common Sodium Salts. CIESC J. 2020, 71, 3452–3459. [Google Scholar] [CrossRef]
  35. GB/T4292-2017; Aluminium Fluoride. China Electricity Council (CEC): Beijing, China, 2017.
Figure 1. XRD pattern of lithium-containing aluminum electrolyte.
Metals 14 00460 g001
Figure 2. SEM-EDS analysis: (a) SEM image of Li-containing aluminum electrolyte, (b) element distribution, (c) elemental analysis.
Metals 14 00460 g002
Figure 3. Structure of Na2LiAlF6 substance.
Metals 14 00460 g003
Figure 4. Variation in Gibbs free energy with reaction temperature at 1 atm, (a) Li3AlF6-related reactions, (b) Na3AlF6-related reactions, (c) reactions (11)–(14).
Metals 14 00460 g004
Figure 5. High-temperature melting furnace: (a) description of the experimental equipment, (b) physical drawing of the experimental equipment.
Metals 14 00460 g005
Figure 6. XRD images of chlorinated roasting products at different temperatures.
Metals 14 00460 g006
Figure 7. XRD images of condensate fractions from 1473 K and 1573 K CaCl2 roasting under 1 atm conditions.
Metals 14 00460 g007
Figure 8. Li leaching rate of chlorinated roasting products at different temperatures.
Metals 14 00460 g008
Figure 9. Effect of different chlorination roasting temperature and holding time on the leaching rate of Li.
Metals 14 00460 g009
Figure 10. Effect of different raw material particle size dimensions and different CaCl2 percentages on the leaching rate of Li.
Metals 14 00460 g010
Figure 11. Effect of leaching conditions on leaching rate of Li.
Metals 14 00460 g011
Figure 12. Physical phase analysis of leaching slag.
Metals 14 00460 g012
Table 1. Elemental content of lithium-containing aluminum electrolyte measured by XRF.
ElementAlNaOCaFThe Rest
content (wt.%)21.0819.278.922.3745.442.91
Table 2. Elemental content of lithium-containing aluminum electrolyte measured by ICP-AES.
ElementLiAlNaKCa
content (wt.%)1.8220.7719.521.592.63
Table 3. Initial reaction temperatures of reactions (3)–(14) at 1 atm.
Reaction EquationInitial Reaction Temperature at 1 atm/K
(3)2117
(4)1730
(5)2510
(6)2007
(7)2318
(8)1637
(9)2819
(10)1896
(11)1700
(12)1787
(13)1651
(14)2871
(15)454
Table 4. Elemental content of leaching residue.
ElementAlFNa
content(wt.%)31.7263.250.27
GB/T4292-2017(AF-0) [35]31.561.00.30
Disclaimer/Publisher’s Note: The statements, opinions and data contained in all publications are solely those of the individual author(s) and contributor(s) and not of MDPI and/or the editor(s). MDPI and/or the editor(s) disclaim responsibility for any injury to people or property resulting from any ideas, methods, instructions or products referred to in the content.

