

Planning Mechanical Behavior of A356 Alloy Wheels by Using Distinct Heat Treatments

1
Faculdade de Ciências Aplicadas, FCA, Centro de Pesquisa em Manufatura e Materiais Avançados (CPMMA), Campus II, Universidade de Campinas, UNICAMP, Limeira 13484-350, Brazil
2
Faculdade de Tecnologia, FT, Campus I, Universidade de Campinas, UNICAMP, Limeira 13484-332, Brazil
*
Author to whom correspondence should be addressed.
Metals 2024, 14(4), 461; https://doi.org/10.3390/met14040461
Submission received: 5 March 2024
/
Revised: 8 April 2024
/
Accepted: 9 April 2024
/
Published: 13 April 2024
(This article belongs to the Topic Alloys and Composites Corrosion and Mechanical Properties)
Abstract
:The aim of this investigation concerns evaluating the mechanical strength and microhardness values of A356 alloy samples in distinctive heat treatments, including those commonly applied to automotive wheels. It is recognized that A356 and Al-Si-based alloys exhibit considerable versatility across numerous industrial applications. The mechanical behavior obtained is intimately associated with different operational parameters (e.g., cooling rates, solution treatment, quenching, and artificial aging). In this study, a group of samples are quenched at 30, 60 and 80 °C. Another set is quenched and subsequently aged at three different temperatures, i.e., 180, 200, and 220 °C for 5 h, and mechanical responses are compared. Microstructural characterization, X-ray diffraction (XRD) analysis, tensile testing, and microhardness measurements are carried out. Using the Rietveld data and based on the modified Williamson–Hall method, the microstrains, crystallite size, and dislocation densities are calculated. Based on this, the resulting mechanical strengths from distinctive quenching and aging are understood. It was found that there exists a “quasi-optimal range” of operational parameters involving different A356 alloy treatments, which vary depending on the manufacturing route. Considering A356 alloy wheels, the planning of the powder coat treatment before or after T6 treating provides better mechanical properties and ductility.

1. Introduction
The automotive sector has adopted light alloys as an efficient strategy for decreasing vehicle weight [1]. Aluminum and its alloys are replacing ferrous alloys, leading to a decrease in greenhouse gas emissions. This shift has resulted in the substitution of traditional steel frameworks in complex wheel configurations with lightweight alloys. The use of lightweight materials in wheel production not only enhances visual appeal but also reduces stress on the suspension system, requiring less effort for maneuvering. Furthermore, it facilitates the smoother braking and acceleration of vehicles [2,3,4]. Investigations concerning Al-Si-based alloys are widely reported [4,5,6,7,8,9,10,11,12,13,14,15,16,17,18,19,20,21,22,23,24,25]. These provide various discussions concerning selecting die-casting parameters (e.g., mold materials, pouring temperature, etc.) and addition elements such as Ti and Sr as grain refiners, and Si for eutectic morphology modification. Moreover, the literature also discusses solution treating, quenching, and artificial aging of the microstructure and on mechanical behavior [10,11,12,13,14,15,16,17,18,19,20,21,22,23,24,25]. These articles were probably written because Al-Si-based alloys exhibit excellent castability and affordability and have a low coefficient of thermal expansion and attractive mechanical properties, making them suitable for manufacturing wheels by casting [4,5,6].
It has also been reported that the microstructural characteristics are influenced by the presence of α-Al dendrites and lamellar eutectic Si [7]. It is widely recognized that a typical as-cast microstructural array affects the resulting properties [6,7,8,9,10,11,12,13,14,15]. When coarse Al and interdendritic Si particles are constituted, the reached ductility is considerably decreased [6,7,8,9,10,11,15,16,17,18,19,20,21,22,23]. This is associated with a plate-like eutectic Si morphology formation [6,7,8]. On the other hand, when manufacturing routes or treatments provide an acicular-like morphology and/or spheroidal-like morphology, reasonable yield or gains are obtained for both the strength and ductility [6,7,8,9,10,11].
The automotive wheel industry demands specific alloying elements to reduce porosity and improve the casting quality. For this purpose, Al-Ti-B master alloys are commonly used [10,11,12,13,14,15]. Moreover, an increase in microstructural homogeneity in the casting is also obtained [10,11,12,13,14,15]. Al-B master alloys are effective grain refiners [14,15], and consequently, the resulting mechanical properties are improved. A refined particle size not only improves the flowability of the molten material into the mold, minimizing the entrapped air and preventing cracks, but it also facilitates a more manageable machining [15,16].
In the manufacture of aluminum wheels, low-pressure die-casting (LPDC) is the most widely applied method. It provides a finer microstructural array, leading to improved fatigue characteristics, and a significant reduction in the resulting shrinkage. It is also reported that LPDC decreases the required lead time for wheel production [11,17,18,19]. T6 heat treatment improves A356 mechanical behavior mainly in terms of ductility and elongation [11,19]. Conventional heat treatment involves a typical solution treatment, quenching, and artificial aging, which improves the resulting ductility [20]. It is recognized that eutectic Si morphology is affected by the temperature at which it dissolves, with grain growth being maximized at temperatures around 550 °C.
Jin et al. [21] demonstrated that hardness and tensile strength increase with the increase in solution temperature, i.e., close to 555 °C. These authors have also shown that mechanical behavior is increased. This is because heat treatment and aging affect Mg2Si formation [21].
It is remarked that certain studies have demonstrated the effect of the cooling rate on Si morphology formation. Dang et al. [10] have shown that the dendrite arm spacings decrease with increased cooling rate. Also, eutectic Si morphology is modified from coarse plate-like to short-rod shape and even spherical shape [21,22,23]. Associated with this, they have also observed that microhardness is increased. Yang et al. [23] have also shown that the eutectic morphology of an as-cast A356 alloy is modified from large plate-like eutectic to fine plate-like eutectic, applying cooling rates of 3 and 96 K/s, respectively. It is also extensively reported [10,23,24,25,26,27,28] that the modification of eutectic silicon during solution heat treatment is affected by using distinctive solution heat treatment temperatures. A combination of solidification parameters with solution heat treatment also implies an efficient eutectic Si morphology modification [10]. Roy and Maijer [25] have reported that a wide range of solution treatments associated with water quenching at distinct temperatures and various artificial agings minimizes or decreases the precipitation driving force necessary for artificial aging [25].
In the field of material science and engineering, extensive literature addresses Al-Si-based and A356 alloys, scrutinizing various manufacturing conditions, Si morphology modifiers, and different heat treatments [4,8]. The literature reported [10,11,12,13,14,15,16,17,18,19,20,21,22,23,24,25,26,29,30,31,32,33,34,35,36,37,38] has shown a great gamma of studies. When the PRISMA concept (preferred reporting items for systematic reviews and meta-analyses), stringers “Al-Si-based alloys”, and “eutectic” are utilized when searching articles, more than 1400 papers are obtained. When replacing the term “eutectic” with “solution” or T6 heat treatment”, more than 90,000 objects are reached. This suggests that Al-Si-based alloys and A356 alloys have been intensively studied. However, certain future gaps concerning these Al-based alloys still need to be investigated. Recently, a review proposed by Dash and Chen [37], containing more than 320 references, reported that Al-Si-based alloys are still focused on a wide range of automotive components. They are manufactured to supply the premier auto giants (e.g., Audi, GM, Nissan, Volkswagen, Chevrolet, Tesla, etc.) [38]. Although there exists a promising and exponentially growing market for hybrid and fully electric vehicles or electrified automobiles, the forecast of the global Al-Si alloy market indicates an increasing trend up to 2030 [37]. These alloys are also focused on the complex structural Al-Si alloy components in aerospace industries, e.g., Boeing, Airbus, and Bombardier [37].
Since the 1990s, the literature concerning Al-Si-based and/or A356 alloys, specifically covering the effects of heat treatments upon microstructural array and mechanical behavior, is vast with numerous articles, as previously commented [10,11,12,13,14,15,16,17,18,19,20,21,22,23,24,25,26,27,28,29,30,31,32,33,34,35,36,37,38]. However, in this present investigation, the novelty provided has two distinct technological and scientific aspects. The first has an issue core involving technological aspects, independent of particularities or peculiarities of manufacturing stages. For the automotive wheel industry, the contribution favors planning the manufacturing route, including the paint curing temperature and time (e.g., powder polymeric coating). Another novelty concerns the use of the Rietveld method as a viable and cheaper tool to understand the microstructural modifications provided by different treatments. This permits the decline in more sophisticated and complex sample preparation techniques and more technologically robust equipment (e.g., transmission electron microscopy or high-resolution TEM). With this, it is possible to obtain, easily or conveniently, a “quasi-optimal operational range” of parameters considering different A356 alloy treatments.
2. Experimental Procedure
2.1. Die Casting Sample Preparation
An as-received commercial A356 (Al-7Si-0.3Mg) alloy ingot is produced at 760 (±5) °C by using an electric-induction furnace. The minimum and maximum contents of the main alloying elements are shown in Table 1. It is noted that, except for Si content, all other identified elements have their corresponding errors up to 10% from the reported values. This is because duplicates are considered, and the accuracy of the utilized equipment is also taken into account.
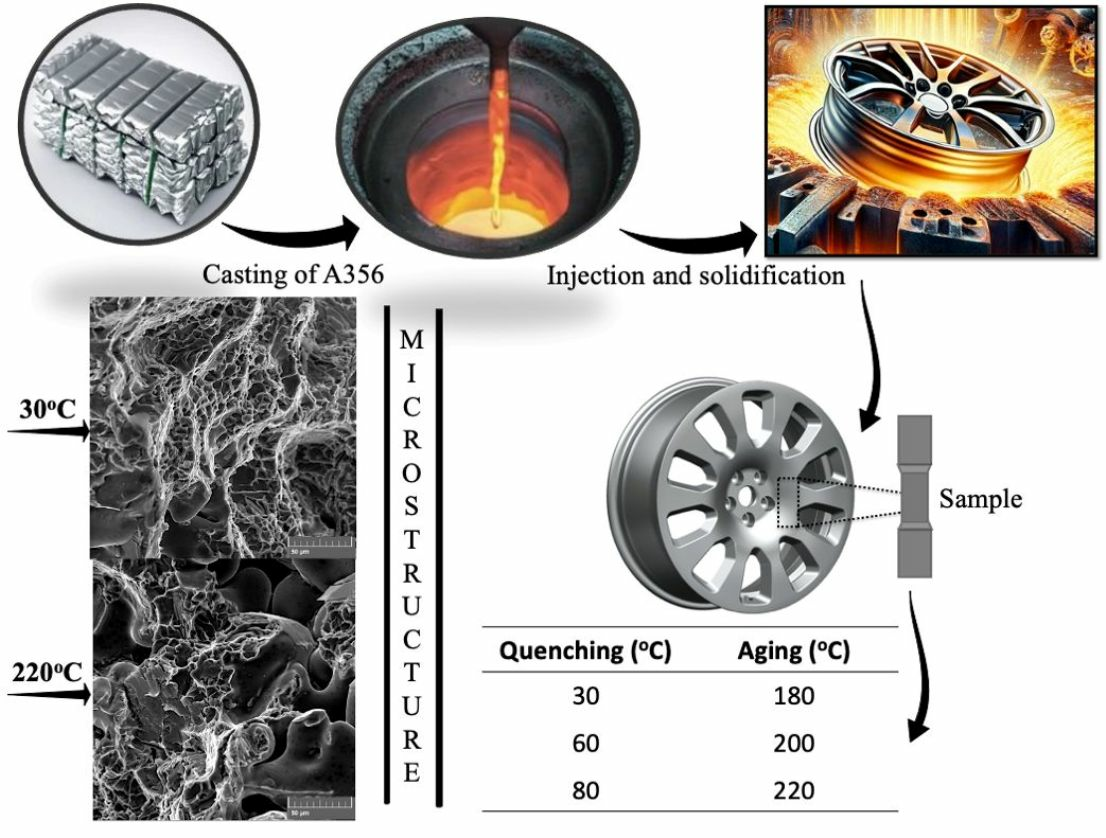
The molten alloy is poured into the permanent molds (AISI H13 steel), which are specifically designed for automotive wheels. A nitrogen gas flux (3 L.p.m) at 780 (±5) °C is applied to remove any impurities. A graphite rod is utilized for mechanical stirring of the molten. Both the grain refiners and modifiers, i.e., Al-5Ti-1B (0.12 wt.%) master alloy and Al-10Sr (0.004 wt.%) master alloy, are used. The molten alloy is subjected to a network of graphite pipes to the injector, operating under squeeze casting (~1 bar) at 680 (±5) °C, and the AISI H13 mold is filled. The sample solidifies with internal cooling channels in the top and bottom dies. This solidification is promoted by compressed air under pressures of 2 and 3 bars, for 4 min. Once the solidification process is finished, the mold parts are opened, and the casting is extracted. The average duration of the normal cycle is about 360 s. Triplicates are considered to obtain the specimens. The selected specimen is taken for all other complementary experimentations, i.e., microstructural characterization, heat treating, tensile tests, etc.
2.2. Heat Treatments
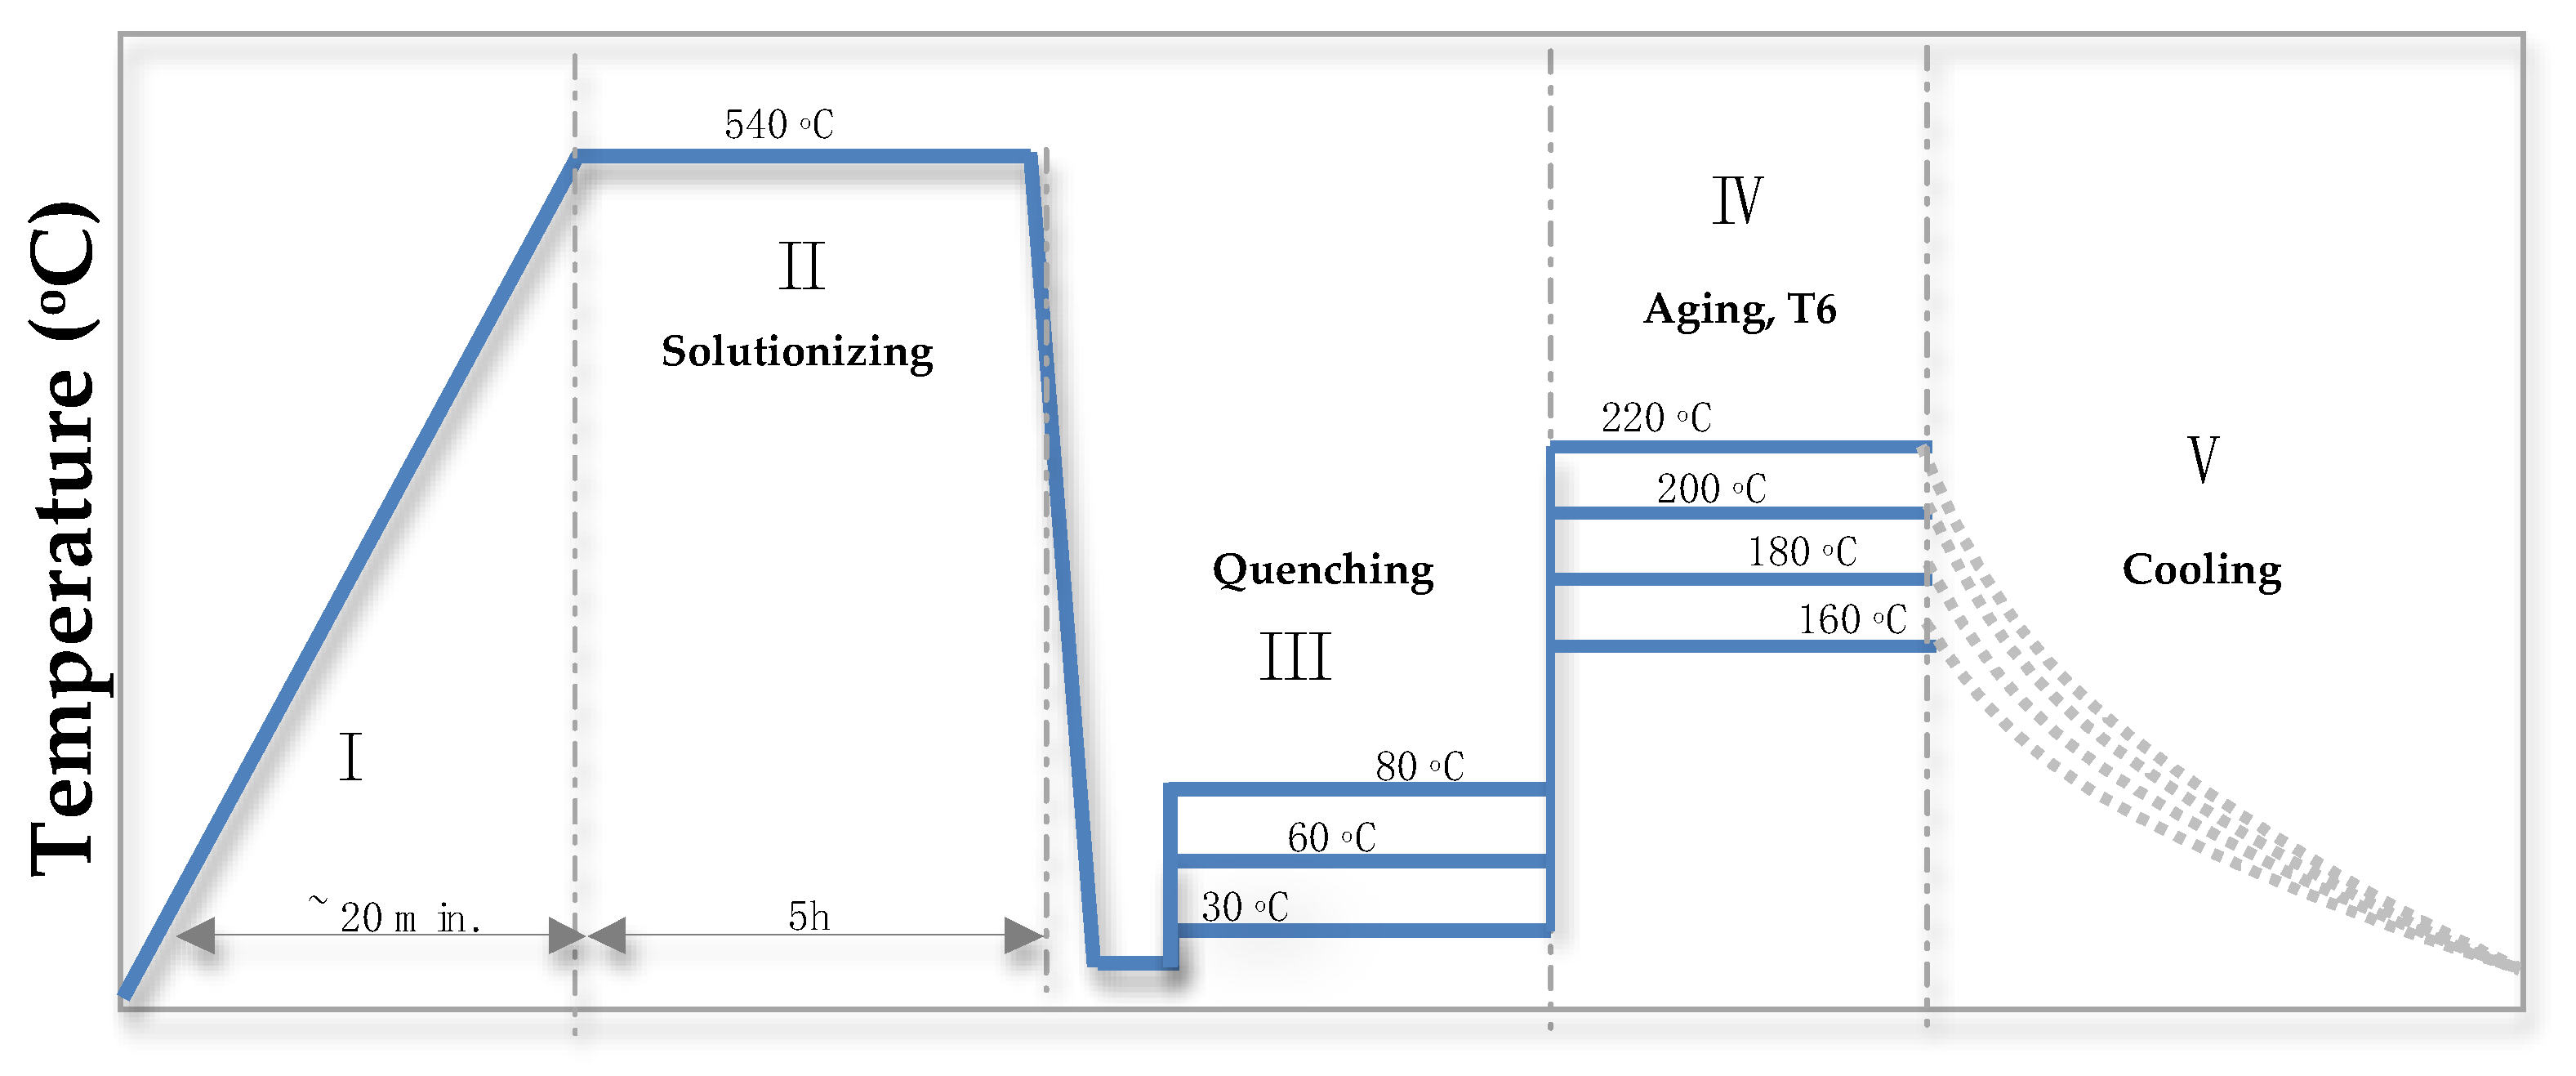
After the wheel design with the 360 s cycle, the samples are obtained by cutting the front surface of the wheel to proceed with the heat treating (Graphical Abstract). A solution treating is carried out with a heating rate of 20 °C/min, reaching a plateau at 540 (±3) °C. Subsequently, the samples are maintained at 540 (±3) °C for 5 hours. Sequentially, the quenching in three distinct water temperatures is carried out, i.e., 30, 60, and 80 (±2) °C. This provides three different quenching rates. For this mentioned purpose, a water-to-sample ratio of 320 mL H2O per gram of the sample and a magnetic stirrer (Fisatom—752A, São Paulo, Brazil) are utilized. For the next stage, the three artificial agings are adopted. After water quenching, three distinct artificial aging treatments (T6) are carried out at 180, 200, and 220 (±3) °C for 300 min. These parameters represent the commonly applied T6 in wheel manufacturing. In order to guarantee reproducibility, a duplicate is considered for each selected condition, and the average result is taken into account for analysis. Figure 1 depicts the representative temperature vs. time profile for the solution treating, quenching, and three distinctive T6 heat treatments for the examined A356 alloy samples.
2.3. The Sample Characterization
A universal electro-hydraulic servo machine operating at environmental temperature (25 ± 2 °C) with a loading speed of approximately 25 mm/min and a strain rate of 2 × 10⁻⁴ s−1 is utilized. In order to guarantee reproducibility, triplicate is considered, and average values are depicted. Vickers hardness measurements (HV) (Buehler—Wilson VH1102, Lake Bluff, IL, USA) are conducted at environmental temperature (25 ± 2 °C). A least 20 measurements are performed for each one of the examined samples. A polished surface by applying a load of 9.8 N and a dwell time of 10 s is utilized to attain Vickers microhardness.
The experimental thermal curves comprising TG/DTG/DSC (TA Instruments—Q600, New Castle, DE, USA) are obtained between 50 and 700 °C. For this purpose, the samples with 18 (±0.8) inside α-alumina pan (30 μL), and applying a heating rate of 20 °C/min, are utilized. A nitrogen atmosphere of about 50 mL/min during examination is maintained. A duplicate is adopted and average curves are considered.
A scanning electron microscopy (SEM) (TESCAN® model VEGA3, Brno, Czech Republic) coupled with an energy-dispersive X-ray spectroscopy (EDS) is utilized for the microstructural characterization. Magnifications ranging between 500 and 1000 times are used. Typical SEM micrographs representing each selected condition are taken into account. To characterize the constituents and microstructural parameters, standard metallographic procedures are adopted. X-ray diffractometry (Panalytical diffractometer, X’Pert model, Malvern, UK), in Bragg–Brentano geometry is utilized. This is carried out at 25 (±2) °C with a Ni filter and Cu-Kα radiation (λ = 0.15406 nm, 45 kV, and 40 mA). Angles (2θ) between 10° and 120° with a scan rate of 0.008 s are utilized.
3. Results and Discussion
3.1. Quenching and Aging Effects on Mechanical Behavior
Three distinctive aging temperatures are evaluated, i.e., 30, 60, and 80 (±2) °C. It has previously been reported that a higher quenching rate provides increased mechanical strength [10,23]. These are attributed to finer eutectic Si morphology, which is modified from the coarse plate-like to spherical shape and/or fine plate-like eutectic. It has also been observed that the solution temperature affects the constituted eutectic silicon [10,16,23,33,35]. Based on this, solutioning at 540 °C is adopted. To correlate the mechanical strengths with heat treatments, the resulting mechanical behavior represented by conventional stress vs. strain curves and microhardness are carried out.
Figure 2a,b depict the experimental results of stress vs. strain for distinct quenching and aging temperatures, respectively. As previously reported, the highest ultimate tensile strength (UTS) is that of the A356 alloy sample quenched at 30 °C, i.e., 241 (±6) MPa. The intermediate and the lowest UTS values are those corresponding to the samples quenched at 60 and 80 °C, respectively. From a scientific and technological aspect, no intrinsic novelty was obtained, as previous investigations [10,16,23,33,35] have also reported similar UTS values.
It is recognized that Mg2Si particles decrease mechanical behavior [21,22,23,38]. Additionally, it has been found that its dissolution occurs at solutioning, and this process is commonly rapidly obtained, i.e., between 2 and 4 min [38]. It is also understood that the optimal solutioning temperature and time is close to 540 °C for 3 and 6 h [10,35,38]. In the quenching stage, a supersaturated solid solution forms a significant number of vacancies. Dang et al. [11] demonstrated that after solutioning at 540 °C for 1 h, followed by water quenching (~2.6 K/s), a completely spheroidized Si morphology microstructural array is obtained, and the resulting microhardness is increased. It is also found that the highest ductility (represented by resulting elongation) is that of the sample quenched at 30 °C.
For the as-cast samples, the intermediate ductility values are confirmed, while the lowest are those of samples quenched at 60 and 80 °C. Ductility is a critical attribute for the performance of vehicle wheels, and the mechanical responses are affected by plastic deformation of the Al matrix and dislocation interactions. The yield strength (YS) and elongation (ε) values are determined from stress vs. strain at 0.2% proof strength, and these values are depicted in Figure 3.
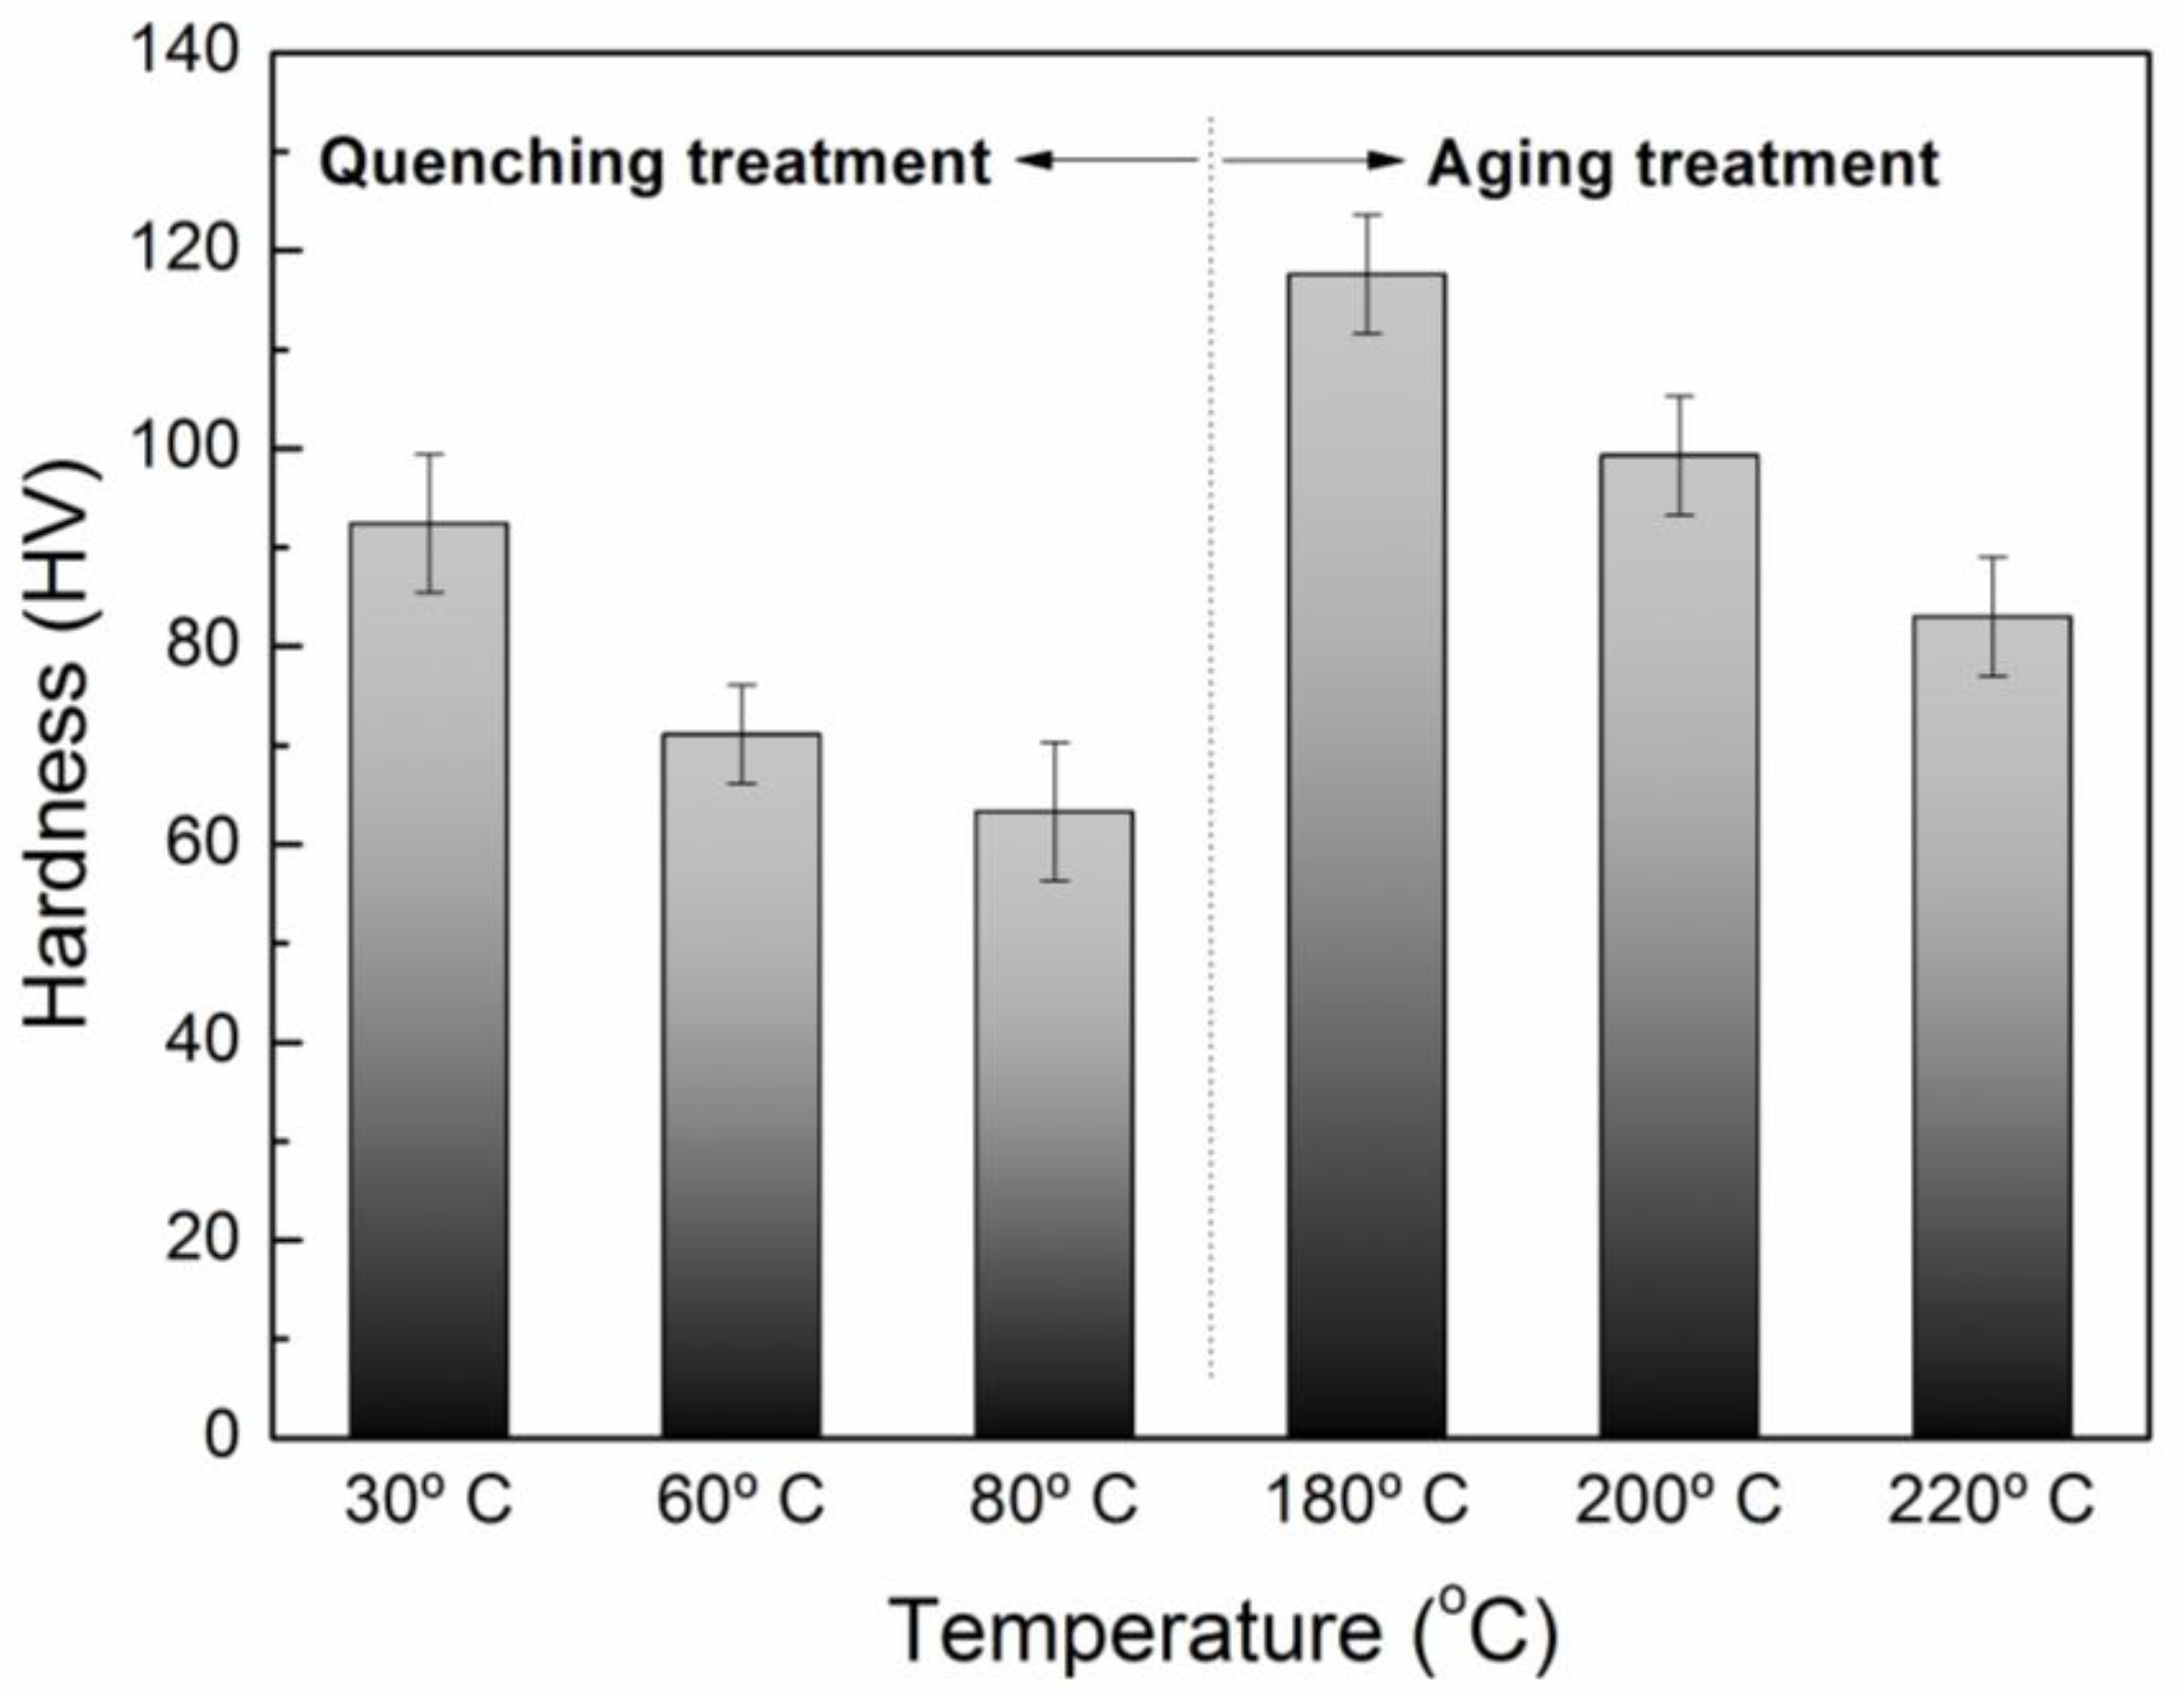
Figure 3a shows that a similar decreasing trend of UTS and YS is obtained. It is remarkable that those mechanical strengths corresponding to the three different aging temperatures are obtained for quenching at 30 °C. Another interesting observation corresponds to the ductility, which is not substantially modified after the three different aging temperatures, as shown in Figure 3b. Moreover, the YS values corresponding to the aged and quenched samples are not substantially modified. This induces a very similar resulting microstructural array in terms of how the dendritic arm spacings and possible intermetallic phases are constituted. This will be confirmed when SEM micrographs are analyzed below. It is also noteworthy that decreasing trends are verified for the microhardness values obtained, i.e., with the increase in quenching and aging, the microhardness decreases, as depicted in Figure 4.
Quenching temperature and time have important roles in the achieved hardness. When selecting or adopting appropriate quenching parameters, the hardness can be tailored to reach certain desirable requirements. Based on the obtained results, a low quenching temperature induces a hardness increase. On the other hand, high temperature promotes a decreasing trend in hardness. At 30 °C, the high hardness obtained seems to be attributed to the formation and transformation of the strengthening phases. These phases act as obstacles to dislocation movement, impeding deformation and contributing to the increase in the hardness.
When aging at 180 °C is carried out, an optimized mechanical response is achieved. This suggests that there is an optimal aging temperature without excessive particle growth. With an increase in the aging temperature to 200 °C and 220 °C, a decrease of about 10% in the tensile strength is verified. This seems to be associated with a possible occurrence of overaging, which leads to the dissolution of precipitated phases. Notably, the decrease in tensile strength does not coincide with the major alterations in the elongation. This suggests that similar ductility is obtained in all examined temperature ranges.
The correlations between UTS and YS and microhardness (HV) are proposed in order to compare with previous investigations [39,40,41,42,43,44,45], as shown in Figure 4. The problem of finding meaningful relationships between hardness and tensile strength has been widely reported [39,40,41,42,43,44,45].
Figure 5a depicts the relations between UTS and HV and UTS and YS and HV of the examined samples. These were quenched at 30, 60, and 80 °C, and aged at 180, 200, and 220 °C. Exponential equations with exponents 1/2 and 1/4 prescribe the relation for both the YS and UTS (i.e., 21.5 HV½) for the quenched and aged samples, respectively, and between UTS and YS with HV for the quenched and aged samples, respectively.
However, a linear regression model previously proposed by Cerri and Ghio [42] and Krishna et al. [43] is evaluated in Figure 5b. Krishna et al. [43] have proposed linear equations, i.e., UTS = 3.865 HV and YS = 1.97 HV, which overestimate the experimental results obtained for the samples aged in the three different aging temperatures. On the other hand, when only the quenched samples are considered (closed point in Figure 5b), the experimental results are within the range prescribed by the linear equations proposed, i.e., UTS = 3.865 HV and YS = 1.97 HV.
Cerri and Ghio [42] proposed a simplified correlation between HV and UTS, modifying the Tabor and Cahoon equations [42]. In this sense, they also utilized linear equations adjusting the regression (constant) coefficients, i.e., to 3.328 and to 2.155 for UTS and YS correlations, respectively, as depicted in Figure 5b.
It is also clearly perceived that both the YS and UTS = f(HV) equations proposed by Cerri and Ghio mainly encompass or outline the experimental results. However, the experimental YS values corresponding to the aging treatment are overestimated by equation YS = 2.155 HV. To adjust these regression coefficients, the equations proposed by Cerri and Ghio [43] are modified, i.e., new equations prescribing the experimental results are UTS = 2.12 HV and YS = 1.65 HV, respectively, as shown in Figure 6a. It is worth noting that the coefficient (constant) described in both Krishna et al. and Cerri and Ghio’s equations should range from 2.9 and 3.1, as suggested by Tabor and Cahoon [42]. This is intimately associated with Meyer’s coefficient, which represents the “strain hardening” of the material, as reported by Cerri and Ghio [42].
Figure 6b shows a correlation between the yield strength (YS) and microhardness (in MPa) considering two other investigations. The first equation is based on Abdulwahab et al.’s [40] study with YS = 0.303 HV − 79.7, and another investigation, by Rometsch and Schaffer [39], describes YS = 0.266 HV − 34.6.
The negative portion highlighted in the referenced equations corresponds to the strain (during Vickers indentation) on the flow stress during indentation, which is less than the representative strain, as previously reported [35,39,40,41]. Considering all experimental data (both quenching and aging), it is confirmed that no match is obtained when both the Abdulwahab et al. [40] and Rometsch and Schaffer [39] equations are used.
These equations only prescribe the best results of the quenching, i.e., the value of YS of the sample quenched at 30 °C, and, similarly, the result of the UTS corresponding to the sample aged at 220 °C. Mathematically, adjustments should be provided in these equations to describe the results of the applied quenching and aging, i.e., YSquenching = 0.106 HV + 102 and YSaging = 0.106 HV + 75. Although the same slope is used, this is lower than the range indicated by Abdulwahab et al. [40] and Rometsch and Schaffer [39]. Additionally, the positive portion is not commonly reported. With these considerations, it is observed that the adapted linear equations prescribed by Cerri and Ghio [43] and Krishna et al. [44] provide a more inclusive range that encompasses both the quenching and aging outcomes when assessing YS and UTS.
3.2. XRD and DSC Characterizations
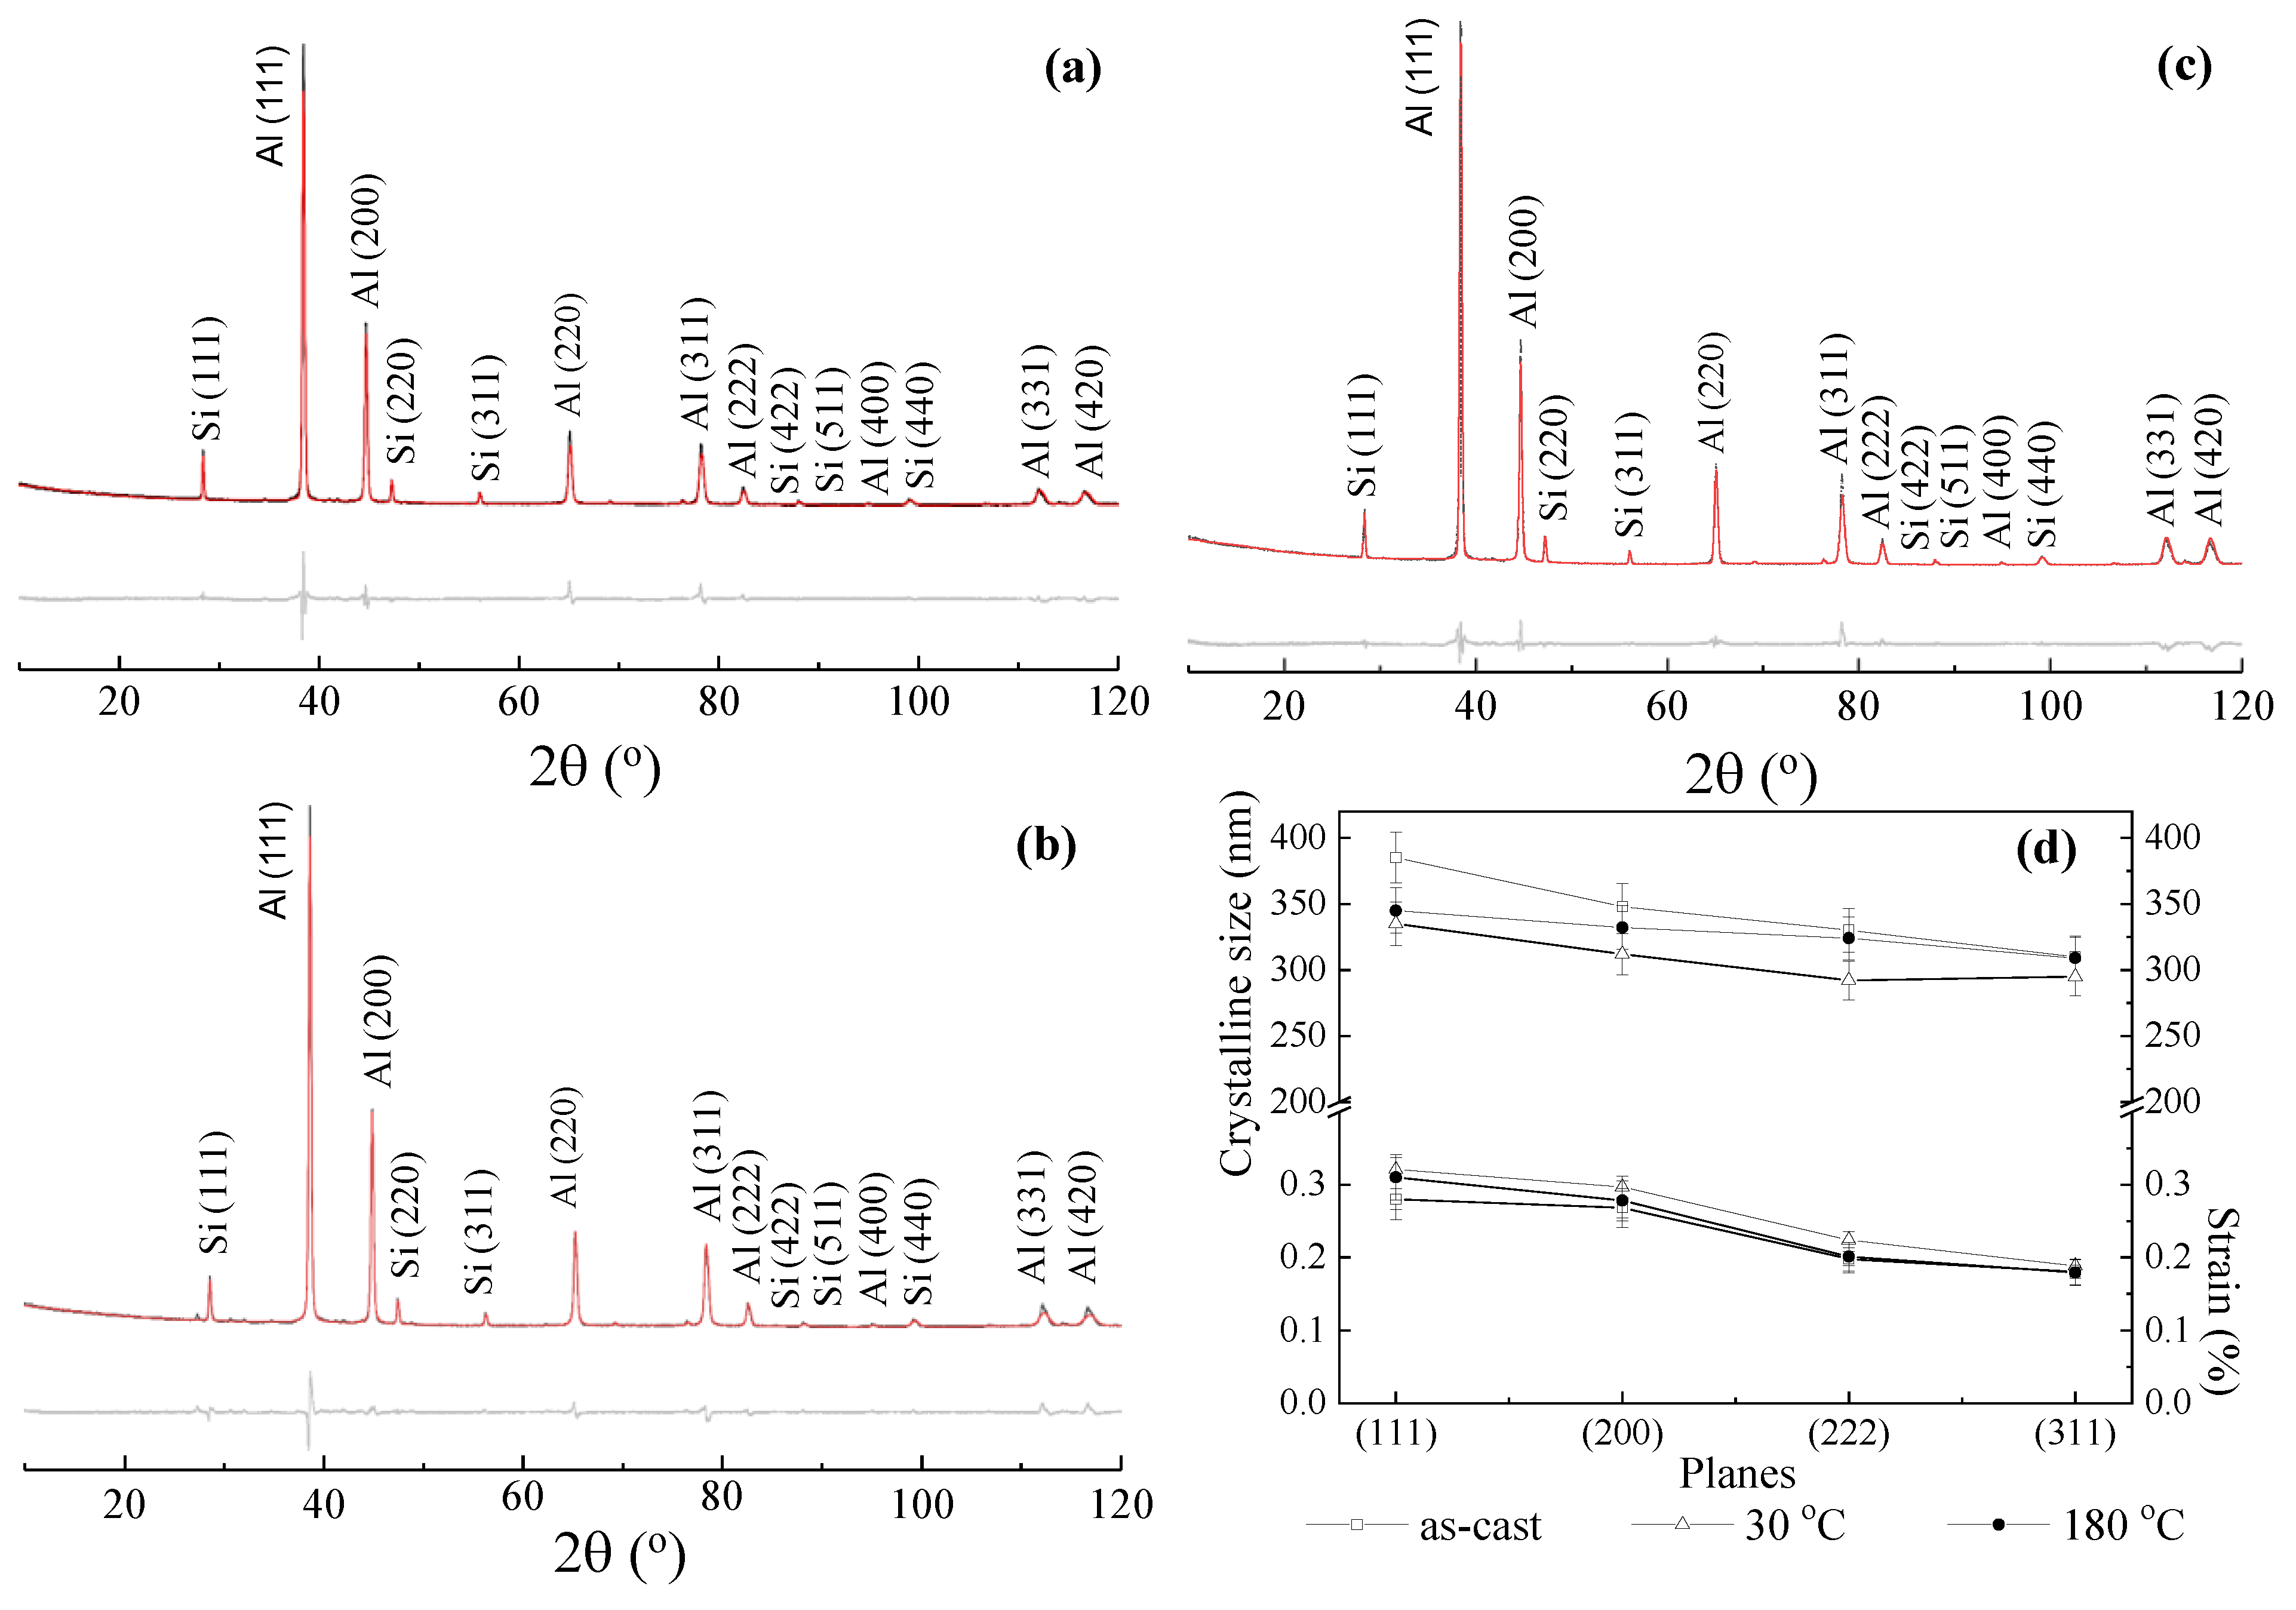
The experimental X-ray diffractometry (XRD) patterns and Rietveld profiles of the A356 alloy samples in the as-cast, quenched at 30 °C, and aged at 180 °C are shown in Figure 7a–c, respectively. Based on the obtained mechanical behavior of the A356 alloy samples, only these aforementioned three distinct samples are selected. The as-cast is the initial condition and acts as a control or reference. The other two samples, i.e., quenched at 30 °C and aged at 180 °C, are those samples with “quasi-optimal” obtained mechanical responses. It is observed that all conceivable reflections of the α-Al and Si phase are identified. Major constituent phases, such α-aluminum and the Al-Si eutectic phase, are indexed. It is considered that Mg2Si, β-Al5FeSi, and many other Fe-containing non-stoichiometric phases have been fully dissolved in these samples. These mentioned phases are not identified. It is remarkable that the Fe-rich intermetallic phases are not detected in XRD patterns. This seems to be associated with few portions being detectable, which has its fraction lower than the detection limit of the diffractogram equipment.
From Rietveld refinement of XRD data, the average crystallite sizes and lattice strains of the examined samples are determined, as shown in Figure 7d. The dislocation density (ρ) of the as-cast, quenched at 30 °C, and aged at 180 °C samples are determined by using the Equation (1) [45,46], as follows:
where the term “ε” is the microstrain, D is the crystallite size, and the term “b” means the burger vector. Based on the modified Williamson–Hall method [45,46,47,48,49], the microstrain (ε) and crystallite size (D) are determined. For this purpose, XRD peaks obtained for each examined sample and an analytical software X’pert HighScore Plus (version 4.5), by PANalytical® are used. There are other models to calculate ε and D, e.g., the modified Warren–Averbach model [49] and Shear Lag and Nes models [50], which are not used in this present investigation.
The fundamental equation utilized in this methodology incorporates the phenomenon of XRD peak broadening resulting from both ε and D, as described in Equation (2) [46].
where B is the width of the XRD peak measured at FWHM (full width at half-maximum); qb is the Bragg’s angle sample; K is a constant (commonly defined as 0.9); and l is the wavelength of the incident radiation (Cu Ka), i.e., 0.15405 nm. It is assumed that the crystallite strain is uniform in all directions of crystallography, as previously reported by Sutapa et al. [48].
Wang et al. [48] have also demonstrated that by employing the modified Williamson–Hall method, the FWHM is inversely proportional to the grain size and is proportional to the mean square strain, which is directly correlated with the dislocation density. Although it is recognized that TEM (Transmission Electron Microscopy) and EBSD (Electron Backscattering Diffraction) are techniques used to identify dislocations, XRD measurements offer more precision in quantifying dislocation density [48]. However, in this present study, no substantial apparent increases in the peak widths of these examined samples are verified, as shown in Figure 7.
Table 2 shows the calculated dislocation density (ρ) considering the (200) and (111) peaks of the as-cast, quenched at 30 °C, and aged at 180 °C. Although there exist limitations when using XRD techniques to precisely quantify the dislocation density of a material, qualitative assessments of the variations in the dislocation densities from different treatments are provided. The compensation for instrumental broadening in the peak width is achieved by estimating the Gaussian and Lorentz coefficients of the examined A356 alloy samples, and these are used as the default settings for line profile analysis. It is also recognized that the heat treatment potentially provokes a significant impact on dislocation density, which affects the resulting mechanical behavior.
Table 2 indicates that the sample quenched at 30 °C, and considering its (200) and (111) planes, is about 16 and 13% higher ρ than the as-cast sample (i.e., ρ of 7.2 × 10¹⁵ m−2 against 6.2 × 10¹⁵ m−2 and 8.9 against 7.9 × 10¹⁵ m−2), respectively. It is evidenced that the quenching provokes internal stresses possibly associated with the differences in the thermal expansion among its constituent phases.
At (111) and (200) planes, both the quenched and aged alloy samples have slightly higher strains than the as-cast sample. Moreover, the crystallite sizes are considerably (12%) lower (~350 nm) than those of the as-cast sample (~390 nm). This occurred in the majority of all the planes examined when the heat-treated samples and the as-cast sample were compared. This is coherent with the dislocation density ρ shown in Table 2. Additionally, this also corroborates with our understanding of the UTS and YS values obtained, i.e., with the increase in the ρ, mechanical behavior also increases. However, when the quenched sample is compared with the sample artificially aged at 180 °C, the dislocation densities ρ in both (200) and (111) planes are higher than those observed for the sample quenched (i.e., 7.9 against 7.2 × 10¹⁵ m−2 and 9.4 against 8.9 × 10¹⁵ m−2), respectively.
Considering these slight differences (~10 and 5%), the crystallite size and lattice strain reveal noteworthy disparities. It is observed that aging increases the dislocation density of all examined planes, accompanied by comparable strain values, as shown in Figure 7d. It is known that the dislocation density of a material is directly proportional to the lattice strain and inversely proportional to the crystallite size. Based on this, and associated with the fact that the aged sample has a similar microstrain level (from Rietveld treatment) and slightly higher crystallite size than the quenched sample, we deduce that the dislocations are responsible for the similar UTS and YS values when compared with the quenched sample, as shown in Figure 5a. Additionally, it is also clearly verified that it has substantially higher (~33%) microhardness (i.e., 120 against 90 HV), as depicted in Figure 4. These observations seem to be associated with the resulting microstructural arrays, not only at the micrometer scale but also at the nanometer scale. For example, at the microscale, there is a similarity in the dendrite arm spacings and the eutectic Si morphology and size. On the nanoscale, the characterization and observation of the dislocation densities and microstrains require TEM, EBSD, and/or HRTEM techniques. These advanced methods demand a more complex sample preparation and are more expensive than conventional microstructural characterization techniques.
From the metallurgical point of view, it is known that quenching forms a supersaturated solid solution containing numerous vacancies [38]. Associated with this, the sharp difference in the thermal expansion coefficient between the Al matrix and Si particle induces high thermal stress at the Al/Si interface. Consequently, high dislocation density is constituted, initiating from the interface inducing a mismatched lattice. Since Mg2Si dissolution and homogenization are very fast processes (occurring from 2 up to 15 min to complete its homogenization [38]), the remaining possible particles are β-Al5FeSi, as previously reported [38].
Conversely, the aging treatment achieves a more even distribution of precipitates within the material. To reach peak hardness, a specific duration of treatment is required, typically 10 h at 170 °C, although a period as brief as approximately 20 min at 210 °C can be sufficient [38,42]. From the calculated dislocation densities and microstrains results associated with the mechanical responses, it was found that the sample aged at 180 °C still exhibits a high dislocation level. This seems to be correlated with fine θ′ precipitates, which commonly nucleate on dislocation sites. It has been reported [42] that these θ″ coherent precipitates on dislocations are responsible for the earlier and higher peak hardness.
Unfortunately, in this present investigation, to identify these dislocations, TEM and EBDS techniques are not carried out. However, SEM micrographs corresponding with the fractography of the examined samples are exploited and will be depicted and discussed below. Associated with the micrographs, mechanical results, and the calculated parameters from Rietveld treatments, the correlation between the mechanical behavior and the dislocation level is evaluated. This seems to constitute an important and complementary tool to prescribe and correlate the mechanical responses with applied heat treatments. Thus, a more complex and expensive microstructural characterization technique is not required.
The experimental DSC melting results show the cooling curves as a function of the thermodynamical transformation temperatures of the A356 alloy samples before (as-cast) and after aging (adopting T6 at 220 °C), as depicted in Figure 8. A first endothermic peak is associated with an inflexion and plateau characterized at ~620 °C, as shown in Figure 8a. This is correlated with α-Al dendritic matrix transformation, and from the Al-Si phase diagram, it is designated as liquid transformation (TL) [10]. Dang et al. [10] also obtained this peak at 620 °C. Figure 8b shows a second one, which represents an endothermic peak occurring at ~590 °C. This corresponds with the Al-Si binary eutectic reaction, as reported in [10].
Dang et al. [10] also verified this transformation at a similar temperature range (i.e., ~580 °C). Considering a thermodynamic equilibrium condition, this transformation corresponds to the eutectic transformation temperature (TE) occurring at ~570 °C [10]. Considering the solidification of an A356 alloy, depending on the Si and Mg contents, another reaction can occur, i.e., one associated with Al + Si + Mg2Si ternary eutectic at 563 °C, as also demonstrated by Dang et al. [10]. As expected, after T6 treatment, the ternary eutectic transformation trends to be substantially dismissed or eliminated. This is suggested when DSC curves corresponding with the aged samples are observed.
Also, from the metallurgical point of view, depending on the Si and Mg contents, the Mg-containing phases during solidification are the Mg2Si and π-Al8Mg3FeSi phases, [10,21,24,38,39,40]. Additionally, Mg2Si particles tend to become dissolute and homogenized in a short period when heat treatment is carried out [38]. Based on the DSC results associated with the dislocation density and the microhardness and mechanical strength results, the as-cast sample is the sample exhibiting more remaining Mg2Si particles, as shown in Figure 9c. This is also clearly confirmed in DSC curves.
Considering the aged sample, the eutectic ternary reaction is almost omitted or eliminated, as depicted in the obtained DSC curves. This is provided by a solution treatment and possible thermodynamic transformation of these Mg-rich phases in β-Al5FeSi, mainly associated with more dilute Mg content (i.e., 0.3 wt.%), as reported by Chen et al [38]. Although the results of DSC and XRD have not substantially confirmed Mg2Si particles, the dislocation density results reveal a high level, which permits us to understand the reason for the increasing microhardness. This seems to be associated with fine θ phases, which are nucleated at the dislocation sites.
3.3. Microstructural Array and Fractograph Characterizations
Figure 9a–d show typical microstructural arrays of the examined A356 alloy in the as-cast condition and after quenching at three distinctive temperatures, i.e., 30, 60, and 80 °C, respectively. It is known that Al-Si-Mg alloys are constituted by a lamellar Si morphology and primary α-Al phase constituting the dendritic Al-rich matrix. It is also known that Al-Sr master alloy has effective action to spheroidize Si particles. Since all examined samples contain portions of the mentioned Al-Sr master alloy, similar spheroidization levels are observed. This spheroidized Si morphology is associated with a finer eutectic microstructure and seems to be responsible for improving the resulting ductility of the casting, as previously reported [11,19,25,26,27,28,29,30,31,32,33,34,35,36]. Moreover, similar dendrite arm spacings (λ) are also characterized, i.e., λ = 38 (±6) μm. As expected, throughout the lattice of all examined samples, Fe-rich phases (commonly designated as β-Al5FeSi) are homogeneously distributed. These resulting microstructural arrays are confirmed and are associated with the results previously discussed concerning DSC and XRD. Based only on these microstructural characterizations, it is not possible to conclude that a correlation exists between the results of the distinct quenching temperatures with the obtained mechanical behavior.
Although it is recognized that a finer dendrite spacing increases the mechanical response, this parameter is very similar for all quenched samples. The Si spheroidization is also very similar among the three quenched samples, including the as-cast sample. This differentiates only with Mg2Si particles constituting its resulting microstructural morphology. These observations reasonably corroborate with the mechanical behavior reached, mainly when low mechanical strengths are compared. However, among the quenched samples, the microstructural array characterizations do not substantially corroborate to explain the distinctive results of the UTS, YS, and microhardness.
As previously discussed and reported [38], quenching induces high thermal stress at the Al/Si interface, which generates a higher dislocation density (~7.2 × 10¹⁵ m−2) than the as-cast sample (6.2 × 10¹⁵ m−2), as shown in Table 2. Additionally, due to the same thermal mechanism, when quenching is carried out at a slightly higher temperature, such as at 60 and 80 °C, it is expected that a lower dislocation density is obtained. This helps us understand the decreasing trends of UTS, YS, and microhardness including the ductility behavior corresponding with the samples quenched at high temperatures.
The typical microstructural array of the as-cast sample is similar to the quenched samples. However, differences concerning the Mg2Si particles are observed, and it induces a distinct interpretation of their portions or volumes contributing to the decrease in mechanical strength. On the other hand, by analyzing the XRD and dislocation density results, the differences in the mechanical responses between the as-cast and the quenched samples are reasonably understood. The experimental XRD patterns characterize peaks corresponding with Mg2Si particles into the as-cast lattice, which are dissolute and homogenized into the quenched lattice samples due to solution treatment and/or associated with subsequent aging, as previously demonstrated and discussed.
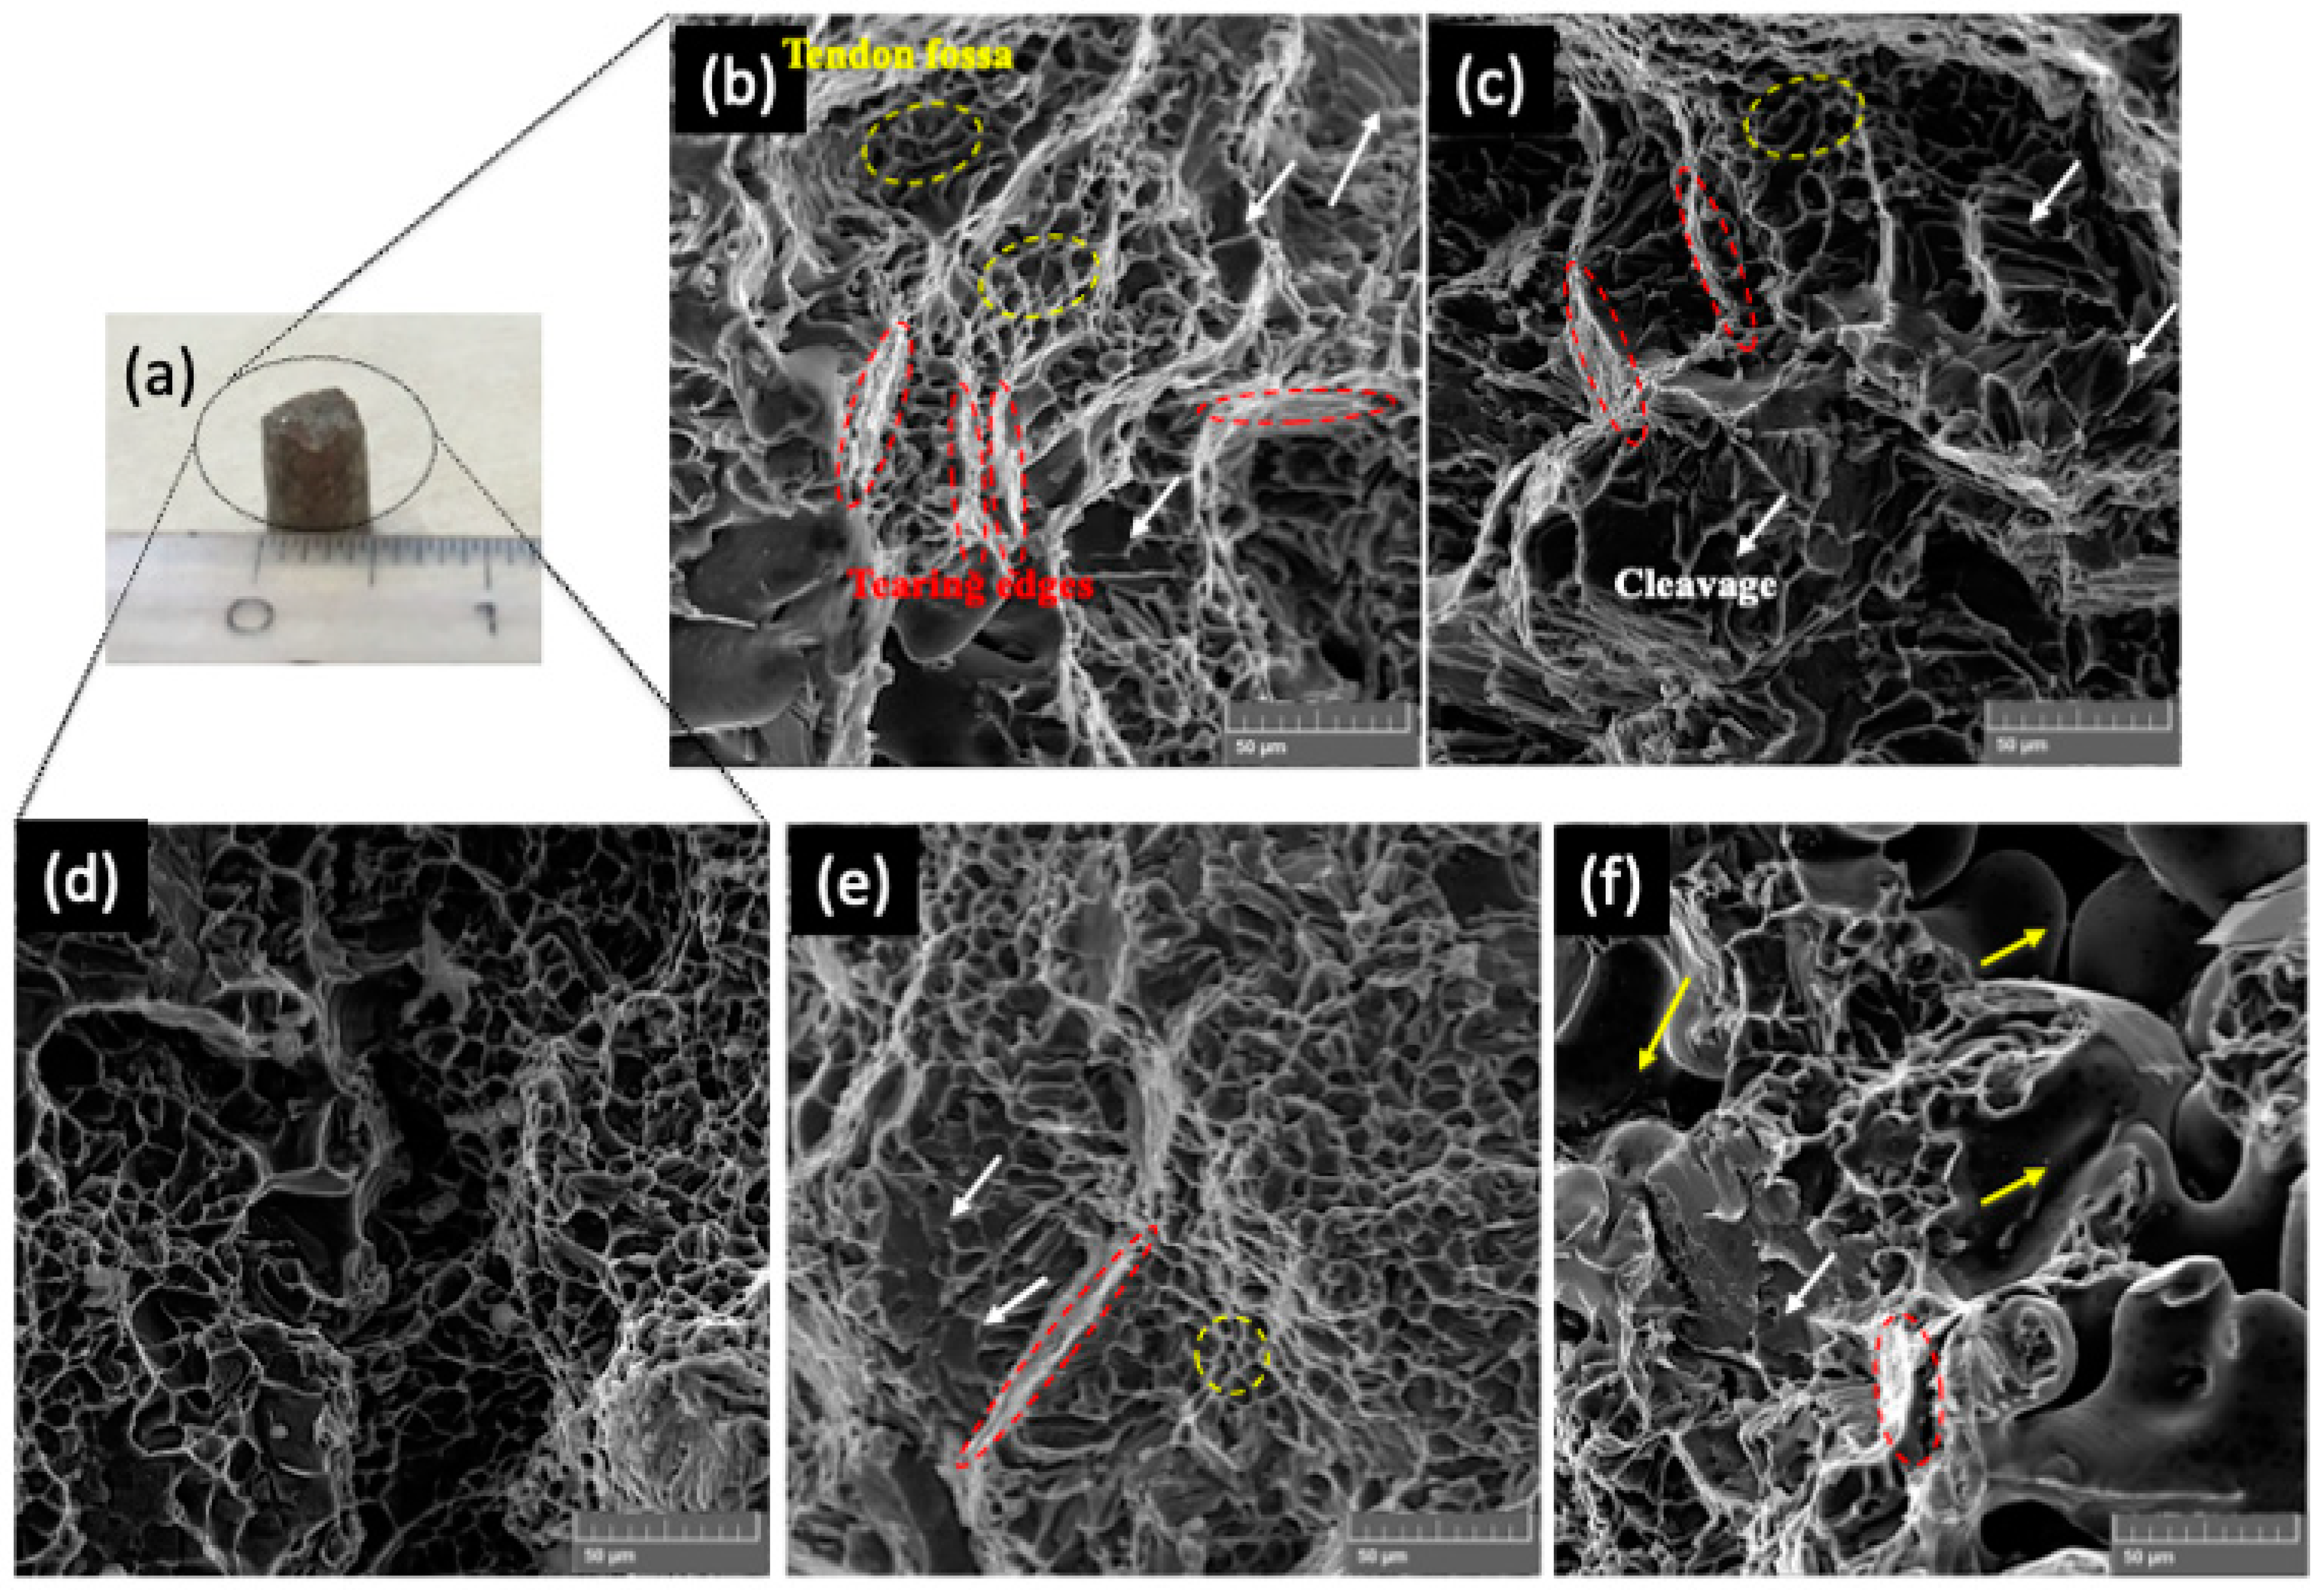
Figure 10a depicts a typical fractured surface and the corresponding SEM micrographs of the examined A356 samples after distinct quenching and aging treatments. An analysis of the physical features of fracture surfaces indicates the possible failure reason. With this, a correlation and understanding between these microstructural characteristics, fractured surface, and adopted heat treating can be provided.
Figure 10b,c correspond with the examined fractures of the quenched A356 alloy samples. The typical cleavage planes (white arrows) coexisting with typical dimples with certain tendon fossa sites (yellow dashed circles) are characterized. These characteristics have been previously reported when heat treatments of the A356 alloys are applied [50]. Additionally, the tearing edges (red dashed circles) are clearly characterized, interposing the dimple regions. These tearing edges suggest typical brittle fracture behavior [51].
Figure 10d shows the fractured SEM micrograph of the aged sample at 180 °C. When this is compared with the micrographs shown in Figure 10e,f (after quenching), both the cleavage and dimples still coexist. However, it is perceived that the former fractography has both cleavage and tearing edge regions that decreased considerably when compared with the latter one. This observation corroborates with the obtained results of the UTS, YS, and dislocation density. Based on this, it is seen that aging decreases the brittle aspect, and UTS and YS are very similar, and no substantial decrease in the ductility has been verified. Additionally, the aged samples at 180 °C have their microhardness increased when compared with the quenched samples at 30 °C.
From both quenching and aging treatments, it can reasonably be concluded that the highest mechanical behavior is that of the sample treated at 30 °C (i.e., UTS of ~245 MPa and hardness of about 120 HV). Interestingly, the highest elongation (~6%) is also reached at this temperature. When samples are aged, the highest mechanical behavior is reached after aging at 180 °C, i.e., ~240 MPa, with elongation of about 4.5%. Interestingly, its hardness is about 50% lower than the aged sample. This means that if the highest UTS is desired, quenching and aging provide very similar mechanical behavior, based on the UTS results. However, if yield strength or deformation capacity is the crucial point of the design, then the sample quenched at 30 °C has YS ~ 16% higher than the sample aged at 180 °C. These assertions are corroborated by the calculated dislocation results. The samples aged at 180 °C achieved up to 10% more dislocations than those quenched at 30 °C. This is not characterized by using typical SEM micrographs. However, due to microstructural modifications at the nanoscale level, dislocation changes are calculated by using XRD patterns and then corroborated with the mechanical results observed.
With this, Al-based alloy wheel manufacturers can plan and control heating treatments, taking into account that curing coating treatments take up to 2 h at 160 and 180 °C to complete. Consequently, we found that a quasi-overaging of the wheels can be carried out, resulting in a deleterious effect on the mechanical response.
4. Conclusions
Based on the experimental results of the mechanical behavior and microstructural characterizations concerning the A356 alloy samples after different quenching and aging treatments, the following conclusions can be drawn:
- When the A356 alloy samples are quenched at 30, 60, and 80 °C, decreasing trends in both UTS and YS results are observed. Analog tendencies are also obtained when aging treatments at 180, 200, and 220 °C are applied. It was found that the UTS results corresponding with the aging at 180 °C and quenching at 30 °C are similar (i.e., ~240 MPa). Analog YS results are also similar in these same treatment temperature ranges, i.e., ~190 MPa.
- When comparing the experimental correlations between UTS and YS with microhardness with those previously reported (e.g., Krishna et al. [43] and Cerri and Ghio [42]), a good exponential adjustment prescribes the experimental data. On the other hand, when linear equations proposed by Abdulwahab et al. [40] and Rometsch and Schaffer [39] are utilized, no good adjustments are obtained.
- It was found that the calculated microstrains, crystallite sizes, and dislocation densities from the Rietveld treatments corroborate our understanding of the distinctive mechanical behavior of the A356 alloy samples subjected to different aging and quenching treatments. We found that the dislocations are responsible for similar UTS and YS values when compared with those samples quenched at 30 °C and aged at 180 °C. It was also found that by using the Rietveld treatment, the dislocation densities are calculated and correlation with mechanical responses can be constituted.
- It is important to remember that industrial practices commonly use artificial aging after a quenching procedure. However, for automotive wheels, it is noted that a complementary powder coating wheel treatment is often applied. This can promote a certain curing of coating, which prevents corrosion damage and provides a shiny aesthetic aspect. Although certain industrial secrets are required, this abovementioned curing coating treatment takes up to 2 h at 160 and 180 °C to complete. In this particular context, it seems that it is thermodynamically sufficient for a “preaging” or “overaging” to be conducted. We found that a “quasi-overaging” of the wheels results in a deleterious effect on mechanical behavior. This is attributed to “overaging” when associated with T6. With this, operational practices can be planned in order to obtain the required mechanical properties, which is particularly useful for manufacturers of A356 alloy wheels.
Author Contributions
Methodology, A.L.T., A.D.B. and G.S.P.; Formal analysis, A.L.T.; Investigation, A.L.T. and G.S.P.; Resources, W.R.O.; Data curation, W.R.O., A.D.B. and G.S.P.; Writing—original draft, W.R.O., A.D.B. and G.S.P. All authors have read and agreed to the published version of the manuscript.
Funding
The financial support provided by FAEPEX-UNICAMP (#2252/23), CAPES (Coordination for the Improvement of Higher Education Personnel), Ministry of Education, Brazil, Grant #1), and CNPq (The Brazilian Research Council) Grants, #407595/2022-8; #313272/2021-2, 305207/2023-7, and 310010/2020-9.
Data Availability Statement
The original contributions presented in the study are included in the article, further inquiries can be directed to the corresponding author.
Acknowledgments
Acknowledgments are also provided to Luiz Antonio Garcia (technician department) who contributed with technical aspects and equipment organization.
Conflicts of Interest
The authors declare no conflicts of interest.
References
- Abdelaziz, M.H.; Samuel, A.M.; Doty, H.W.; Samuel, F.H. Effect of morphological changes of eutectic Si particles on the ambient and high temperature tensile properties of Zr containing Al–Si alloys. J. Mater. Res. Tecnol. 2020, 9, 5962–5981. [Google Scholar] [CrossRef]
- Zhang, H.; Yu, S.; Yang, Z.; Zhang, C. The influence of porosity and precipitates on the corrosion behavior of A356 aluminum alloy. J. Electroanal. Chem. 2023, 948, 117796. [Google Scholar] [CrossRef]
- Ortiz, E.L.; Osório, W.R.; Bortolozo, A.D.; Padilha, G.S. Alternative liquid-assisted sintering of Al/Cu composites using selected powders of As-Cast Al-Zn alloy. Metals 2022, 12, 962. [Google Scholar] [CrossRef]
- Gu, G.; Li, R.; Xiang, L.; Zheng, H.; Lv, Y. Semi-solid Die Casting of Some Aluminum Alloys for Lightweight Automotive Components. In Proceedings of the International Conference on the Technology of Plasticity, Mandelieu-La Napoule, France, 24–29 September 2023; pp. 249–257. [Google Scholar]
- Berlanga-Labari, C.; Biezma-Moraleda, M.V.; Rivero, P.J. Corrosion of cast aluminum alloys: A review. Metals 2020, 10, 1384. [Google Scholar] [CrossRef]
- Samuel, E.; Samuel, A.M.; Songmene, V.; Samuel, F.H. A review on the analysis of thermal and thermodynamic aspects of grain refinement of aluminum-silicon-based alloys. Materials 2023, 16, 5639. [Google Scholar] [CrossRef] [PubMed]
- Caceres, C.H.; Griffiths, J.R. Damage by the cracking of silicon particles in an Al-7Si-0.4Mg casting alloy. Acta Mater. 1996, 44, 25–33. [Google Scholar] [CrossRef]
- Samuel, E.; Tahiri, H.; Samuel, A.M.; Songmene, V.; Samuel, F.H. A review on fundamentals of grain refining of Al-Si cast alloys. Recent Adv. Alum. Alloys 2024. [Google Scholar] [CrossRef]
- Chen, Z.; Wang, T.; Gao, L.; Fu, H.; Li, T. Grain refinement and tensile properties improvement of aluminum foundry alloys by inoculation with Al–B master alloy. Mater. Sci. Eng. A 2012, 553, 32–36. [Google Scholar] [CrossRef]
- Dang, B.; Liu, C.-C.; Liu, F.; Liu, Y.-Z.; Li, Y.-B. Effect of as-solidified microstructure on subsequent solution-treatment process for A356 Al alloy. Trans. Nonferrous Met. Soc. China 2016, 26, 634–642. [Google Scholar] [CrossRef]
- Samuel, A.M.; Samuel, E.; Songmene, V.; Samuel, F.H. A comparative study of grain refining of Al-(7–17%) Si cast alloys using Al-10% Ti and Al-4% B master alloys. Materials 2023, 16, 2867. [Google Scholar] [CrossRef]
- Easton, M.A.; Prasad, A.; St John, D.H. The grain refinement of Al-Si alloys and the cause of Si poisoning: Insights revealed by the interdependence model. Mater. Sci. Forum 2014, 6, 161–166. [Google Scholar] [CrossRef]
- Elias, A.L.P.; Koizumi, M.S.; Ortiz, E.L.; Rodrigues, J.F.Q.; Bortolozo, A.D.; Osório, W.R.; Padilha, G.S. Corrosion behavior of an Al-Si casting and a sintered Al/Si composite immersed into biodiesel and blends. Fuel Process. Technol. 2020, 202, 106360. [Google Scholar] [CrossRef]
- El Haj, B.A.; Hamadellah, A.; Bouayad, A.; El Akili, C. Review of grain refinement performance of aluminium cast alloys. Metall. Mater. Eng. 2023, 29, 1–15. [Google Scholar] [CrossRef]
- Jiang, D.; Yu, J. Simultaneous refinement and modification of the eutectic Si in hypoeutectic Al–Si alloys achieved via the addition of SiC nanoparticles. J. Mater. Res. Technol. 2019, 8, 2930–2943. [Google Scholar] [CrossRef]
- Jin, B.-R.; Ha, D.-W.; Jeong, C.-Y. Effect of solution treatment on the hardness and tensile properties of Al–Mg–Si alloys for automotive chassis. Mater. Trans. 2019, 60, 815–823. [Google Scholar] [CrossRef]
- Liu, G.; Gao, J.; Che, C.; Lu, Z.; Yi, W.; Zhang, L. Optimization of casting means and heat treatment routines for improving mechanical and corrosion resistance properties of A356-0.54Sc casting alloy. Mater. Today Commun. 2020, 24, 101227. [Google Scholar] [CrossRef]
- Wei, B.; Li, S.; Jiang, T.; Zhang, Y.; Xu, G.; Li, Y.; Wang, Z. Optimization of Si content to inhibit inhomogeneous deformation in Al-Mg-Si alloy fabricated via twin-roll casting. Metals 2022, 12, 941. [Google Scholar] [CrossRef]
- Xia, G.; Zhao, Q.; Ping, X.; Zhang, Y.; Yu, Q.; Li, Z.; Cai, Q. Effect of Al–5Ti–1B–La intermediate alloy on microstructure and mechanical properties of A356 aluminum alloy. J. Mater. Res. Technol. 2024, 7, 036535. [Google Scholar]
- De Oliveira Santos, P.G.B.; Gomes, L.F.; Spinelli, J.E. Solidification and strength behavior of A356 Al alloy wheels. Int. J. Met. 2024, 1–19. [Google Scholar] [CrossRef]
- Miller, A.E.; Maijer, D.M. Investigation of erosive-corrosive wear in the low pressure die casting of aluminum A356. Mater. Sci. Eng. A 2006, 435–436, 100–111. [Google Scholar] [CrossRef]
- Ozturk, F.; Sisman, A.; Toros, S.; Kilic, S.; Picu, R.C. Influence of aging treatment on mechanical properties of 6061 aluminum alloy. Mater. Des. 2010, 31, 972–975. [Google Scholar] [CrossRef]
- Yang, C.-L.; Li, Y.-B.; Dang, B.; Lu, H.-B.; Liu, F. Effects of cooling rate on solution heat treatment of as-cast A356 alloy. Trans. Nonferrous Met. Soc. China 2015, 25, 3189–3196. [Google Scholar] [CrossRef]
- Zhang, X.L.; Liu, J.H.; Li, W.S.; Zhou, H.T.; Wang, S.C. Effect of Sr–Ce modification on the microstructure and mechanical properties of A356 alloy. Int. J. Met. 2023, 17, 1008–1020. [Google Scholar] [CrossRef]
- Roy, M.J.; Maijer, D.M. Response of A356 to warm rotary forming and subsequent T6 heat treatment. Mater. Sci. Eng. A 2014, 611, 223–233. [Google Scholar] [CrossRef]
- Shabestari, S.G.; Shahri, F. Influence of modification, solidification conditions and heat treatment on the microstructure and mechanical properties of A356 aluminum alloy. J. Mater. Sci. 2004, 39, 2023–2032. [Google Scholar] [CrossRef]
- Sjölander, E.; Seifeddine, S. The heat treatment of Al-Si-CuMg casting alloys. J. Mater. Process. Technol. 2010, 210, 1249–1259. [Google Scholar] [CrossRef]
- Xu, C.L.; Wang, H.Y.; Qiu, F.; Yang, Y.F.; Jiang, Q.C. Cooling rate and microstructure of rapidly solidified Al-20 wt. % Si alloy. Mater. Sci. Eng. A 2006, 417, 275–280. [Google Scholar] [CrossRef]
- Chen, R.; Shi, Y.-F.; Xu, Q.-Y.; Liu, B.-C. Effect of cooling rate and microstructure of Al-7Si-0.3Mg-0.15Fe alloys. Trans. Nonferrous Met. Soc. China 2014, 24, 1645–1652. [Google Scholar] [CrossRef]
- Osório, W.R.; Cheung, N.; Spinelli, J.E.; Goulart, P.R.; Garcia, A. The effects of a eutectic modifier on microstructure and surface corrosion behavior of Al-Si hypoeutectic alloys. J. Solid State Electrochem. 2007, 11, 1421–1427. [Google Scholar] [CrossRef]
- Osório, W.R.; Cheung, N.; Spinelli, J.E.; Cruz, K.S.; Garcia, A. Microstructural modification by laser surface remelting and its effect on the corrosion resistance of an Al–9 wt% Si casting alloy. Appl. Surf. Sci. 2008, 254, 2763–2770. [Google Scholar] [CrossRef]
- Apelian, D.; Shivkumar, S.; Sigworth, G. Fundamental aspects of heat treatment of cast Al-Si-Mg alloys. AFS Trans. 1989, 97, 727–742. [Google Scholar]
- Mahan, H.M.; Konovalov, S.V.; Panchenko, I. Effect of heat treatment on the mechanical properties of the aluminium alloys AA2024 with nanoparticles. Int. J. Appl. Sci. Eng. 2023, 20, 2022324. [Google Scholar] [CrossRef]
- Wang, Q.G.; Cáceres, C.H. On the strain hardening behaviour of Al-Si-Mg casting alloys. Mater. Sci. Eng. A 1997, 234–236, 106–109. [Google Scholar] [CrossRef]
- Tiryakioglu, M. The effect of solution treatment and artificial aging on the work hardening characteristics of a cast Al–7%Si– 0.6%Mg alloy. Mater. Sci. Eng. A 2006, 427, 154–159. [Google Scholar] [CrossRef]
- Campbell, J.; Tiryakioglu, M. Review of effect of P and Sr on modification and porosity development in Al–Si alloys. Mater. Sci. Technol. 2010, 26, 262–268. [Google Scholar] [CrossRef]
- Dash, S.S.; Chen, D. A review on processing–microstructure–property relationships of Al-Si alloys: Recent advances in deformation behavior. Metals 2023, 13, 609. [Google Scholar] [CrossRef]
- Chen, L.; Zhao, Y.; Wen, Z.; Tian, J.; Hou, H. Modelling and optimization for heat treatment of Al-Si-Mg alloy prepared by indirect squeeze casting based on response surface methodology. Mater. Res. 2017, 20, 1274–1281. [Google Scholar] [CrossRef]
- Rometsch, P.A.; Schaffer, G.B. An age hardening model for Al–7Si–Mg casting alloys. Mater. Sci. Eng. A 2002, 325, 424–434. [Google Scholar] [CrossRef]
- Abdulwahab, M.; Madugu, I.A.; Yaro, S.A.; Hassan, S.B.; Popoola, A.P.I. Effects of multiple-step thermal ageing treatment on the hardness characteristics of A356.0-type Al-Si-Mg alloy. Mater. Des. 2011, 32, 1159–1166. [Google Scholar] [CrossRef]
- Sekhar, A.P.; Nandy, S.; Ray, K.K.; Das, D. Hardness- yield strength realtion of Al-Mg-Si alloys. IOP Conf. Ser. Mater. Sci. Eng. 2018, 338, 012011. [Google Scholar] [CrossRef]
- Cerri, E.; Ghio, E. AlSi10Mg alloy produced by selective laser melting: Relationships between Vickers microhardness, Rockwell hardness and mechanical properties. Metall. Ital. 2020, 7–8, 5–17. [Google Scholar]
- Krishna, S.C.; Gangwar, N.K.; Jha, A.K.; Pant, B. On the prediction of strength from hardness for copper alloys. J. Mater. 2013, 9–10, 1–6. [Google Scholar] [CrossRef]
- Ungár, T. Dislocation densities, arrangements and character from X-ray diffraction experiments. Mater. Sci. Eng. A 2001, 309–310, 14–22. [Google Scholar] [CrossRef]
- Ungár, T.; Ott, S.; Sanders, P.G.; Borbély, A.; Weertman, J.R. Dislocations, grain size and planar faults in nanostructured copper determined by high resolution X-ray diffraction and a new procedure of peak profile analysis. Acta Mater. 1998, 46, 3693–3699. [Google Scholar] [CrossRef]
- Sutapa, I.W.; Wahab, A.W.; Taba, P.; Nafie, N.L. Dislocation, crystallite size distribution and lattice strain og magnesium oxide nanoparticles. J. Phys. Conf. Ser. 2018, 979, 01221. [Google Scholar] [CrossRef]
- Wang, C.; Wang, Z.; Xu, H.; Zhang, G. Decreased dislocation density as an origin for the quench sensitivity of the Al-Si-Mg alloys with high Si content. J. Alloys Compd. 2022, 910, 165011. [Google Scholar] [CrossRef]
- Muiruri, A.; Maring, M.; Preez, W. Evaluation of dislocation densities in various microstructures of additively manufactured Ti6Al4V (eli) by method of X-ray diffraction. Materials 2022, 13, 5355. [Google Scholar] [CrossRef]
- Kavosi, J.; Saei, M.; Kazeminezhad, M.; Dodangeh, A. Modeling of dislocation density and strength on rheoforged A356 alloy during multi-directional forging. Comput. Mater. Sci. 2014, 81, 284–289. [Google Scholar] [CrossRef]
- Teng, D.; Zhang, G.; Zhang, S.; Li, J.; Guan, R. Mechanical properties of refined A356 alloy in response to continuous rheological extruded Al-5Ti-0.6C-1.0Ce alloy prepared at different temperatures. Metals 2023, 13, 1344. [Google Scholar] [CrossRef]
- Dewangan, S.; Selvaraj, S.K.; Karthikeyan, B.; Chadha, U.; Singhal, P.; Sarma, P.P.; Raju, P.V.; Kumar, U.; Kumar, M.P. Fractography analysis into low-C steel undergone through various destructive mechanical tests. Mater. Res. Express 2022, 9, 126502. [Google Scholar] [CrossRef]
Figure 1.
Representative temperature vs. time profile for the heating rate (I), solution treating (II), quenching (III), and three distinctive T6 heat treatments for the examined A356 alloy samples (IV). All adopted quenching are carried out in 120 s, and all aging treatments are performed for 180 min (3 h).

Figure 2.
Experimental engineering stress vs. strain curves of A356 alloy after distinct (a) quenching and (b) aging. The as-cast (non-treated) results are also depicted.
Figure 2.
Experimental engineering stress vs. strain curves of A356 alloy after distinct (a) quenching and (b) aging. The as-cast (non-treated) results are also depicted.
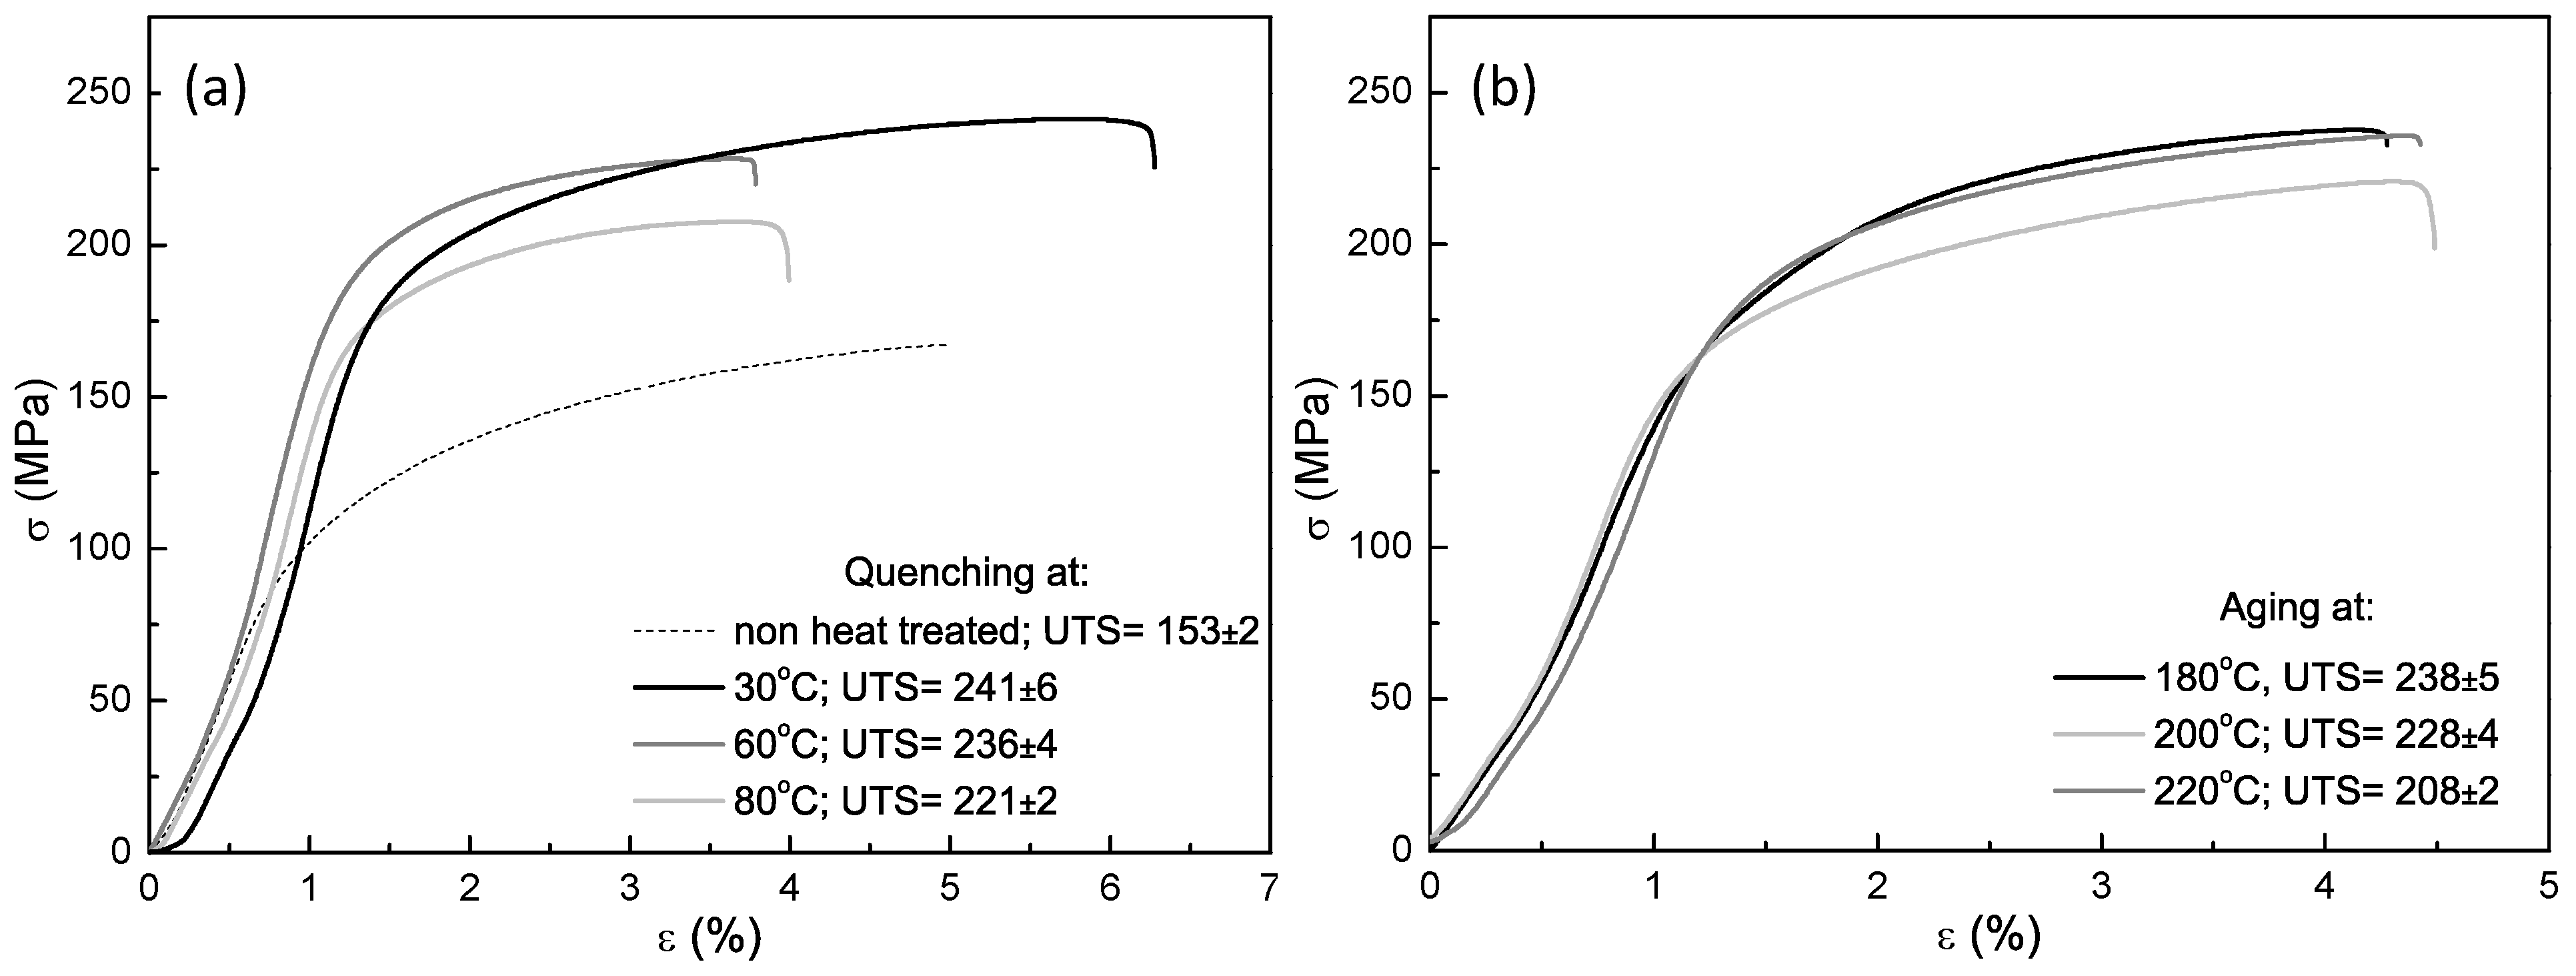
Figure 3.
Relation among UTS, YS, and ductility in distinctive (a) quenching and (b) aging temperatures.
Figure 3.
Relation among UTS, YS, and ductility in distinctive (a) quenching and (b) aging temperatures.
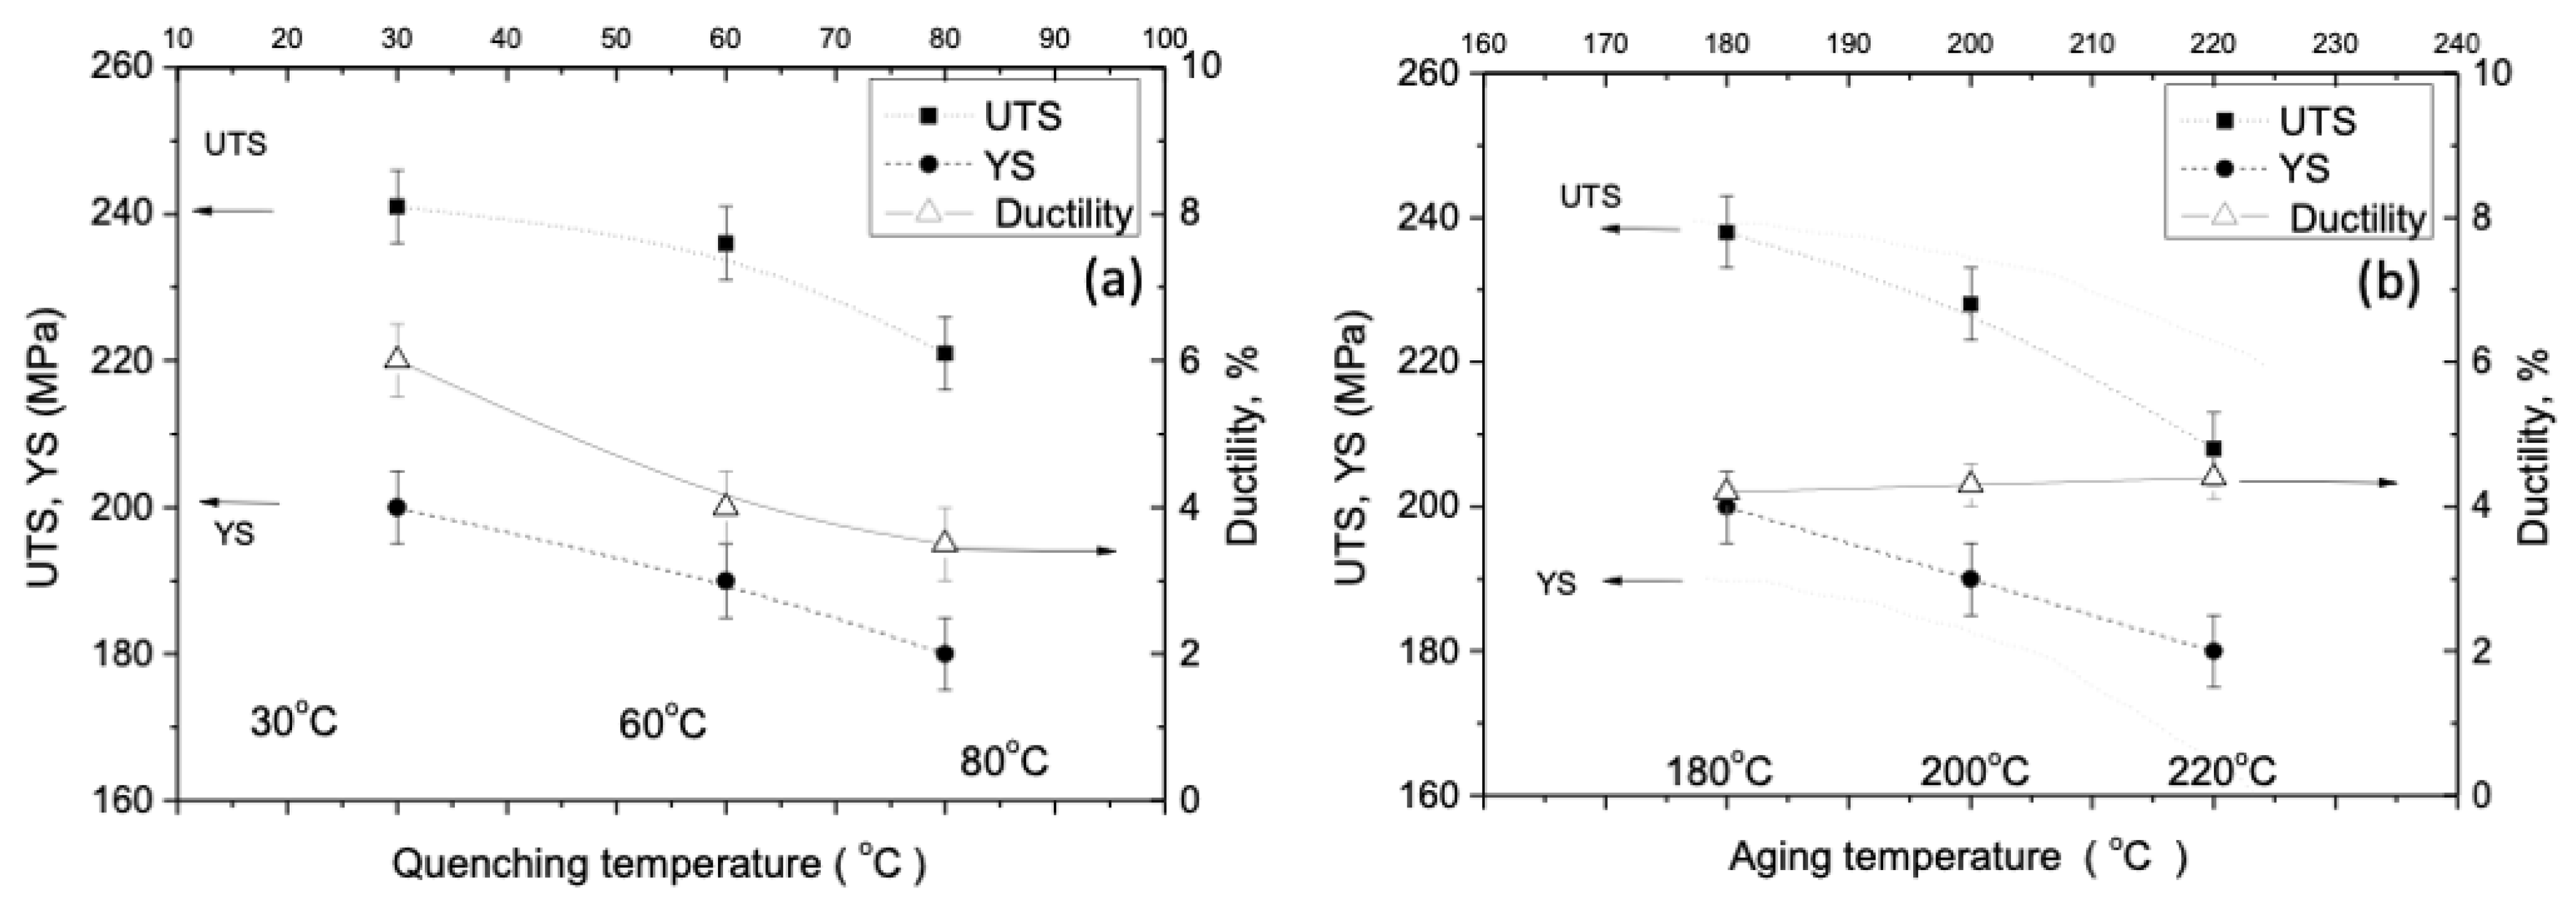
Figure 4.
Microhardness obtained after three different quenching and three different aging temperatures.
Figure 4.
Microhardness obtained after three different quenching and three different aging temperatures.

Figure 5.
Correlation between yield strength (YS) and microhardness and ultimate tensile strength (UTS) and microhardness by using (a) exponential and (b) linear regression equations based on Krishna et al.’ [43] and Cerri and Ghio’s [42] equations.
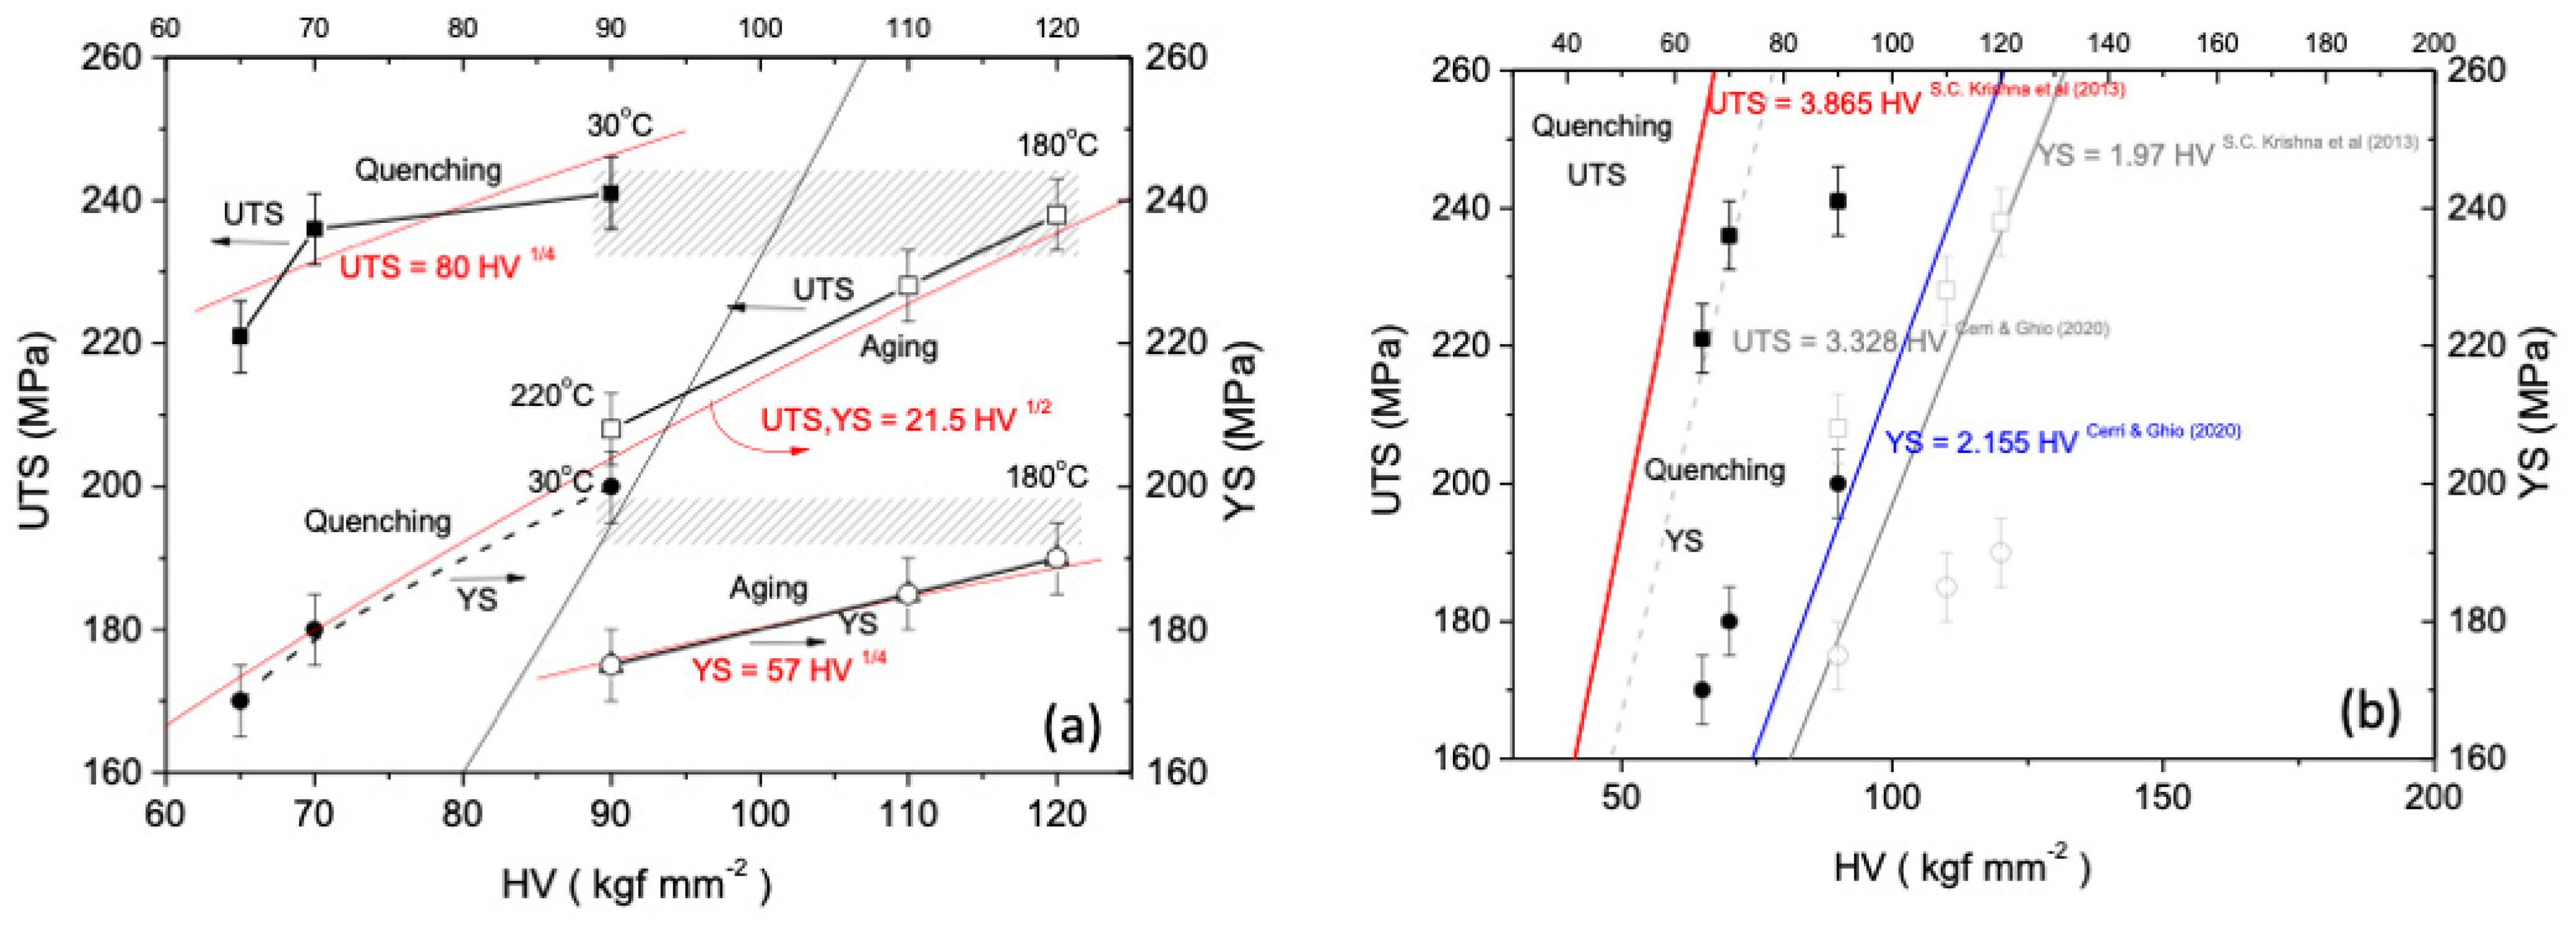
Figure 6.
Correlation between YS and UTS with microhardness fitted by (a) Cerri and Ghio’s [42] linear equation and (b) YS and UTS with microhardness (in MPa) considering the investigations of Abdulwahab et al. [40] and Rometsch and Schaffer [39].
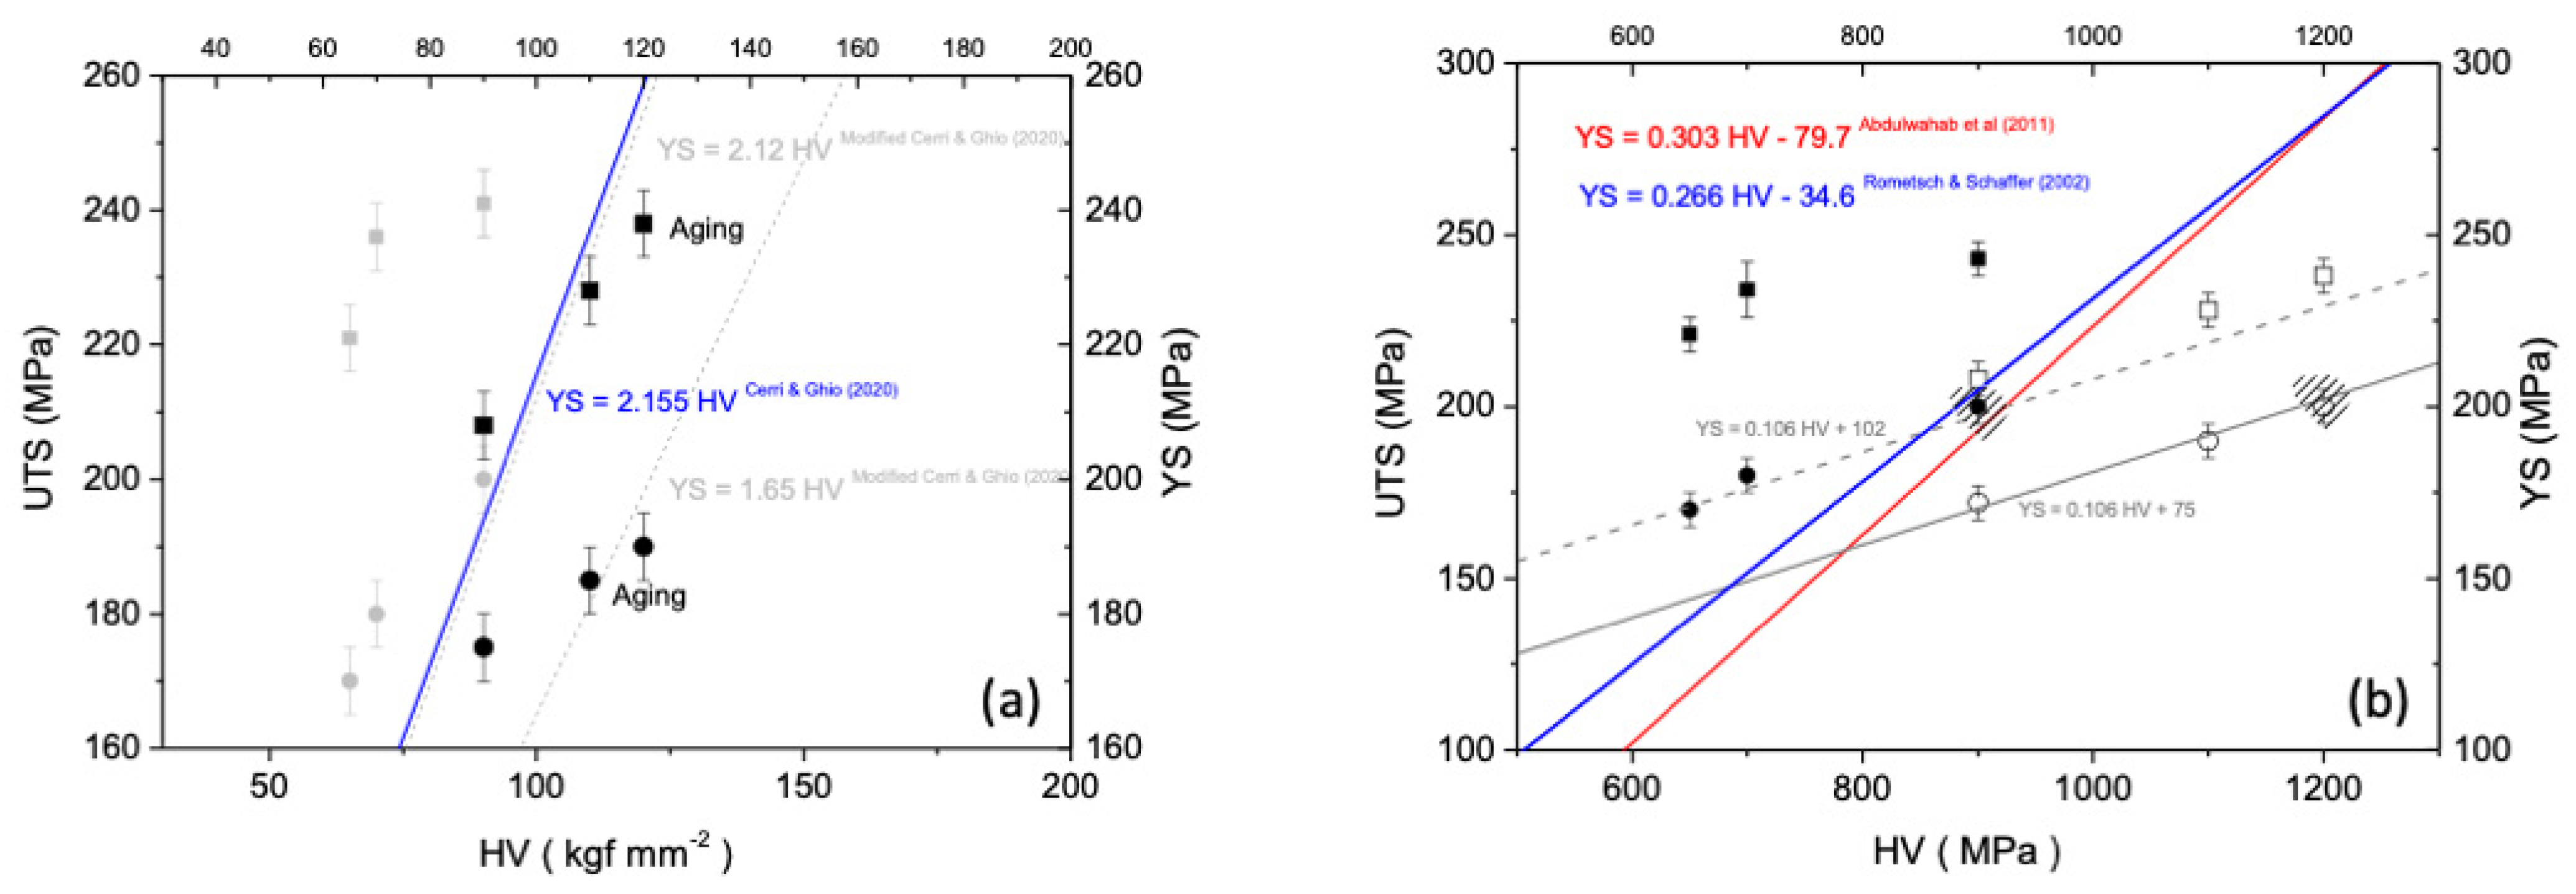
Figure 7.
XRD patterns of the A356 alloy samples in condition: (a) as-cast, (b) water-quenched at 30 °C only, (c) artificially aged (T6) at 180 °C for 3 h; and (d) the calculated crystallite size and remaining strain determined by using Rietveld data (gray lines).
Figure 7.
XRD patterns of the A356 alloy samples in condition: (a) as-cast, (b) water-quenched at 30 °C only, (c) artificially aged (T6) at 180 °C for 3 h; and (d) the calculated crystallite size and remaining strain determined by using Rietveld data (gray lines).

Figure 8.
(a) Experimental DSC curves obtained by using 10 °C/min of the A356 alloy samples: (a) quenched at 30 °C and artificially aged at 220 °C and (b) the as-cast condition; (b) A typical XRD pattern corresponding with the as-cast A356 alloy sample, evidencing (inset) remaining Mg2Si particles.
Figure 8.
(a) Experimental DSC curves obtained by using 10 °C/min of the A356 alloy samples: (a) quenched at 30 °C and artificially aged at 220 °C and (b) the as-cast condition; (b) A typical XRD pattern corresponding with the as-cast A356 alloy sample, evidencing (inset) remaining Mg2Si particles.
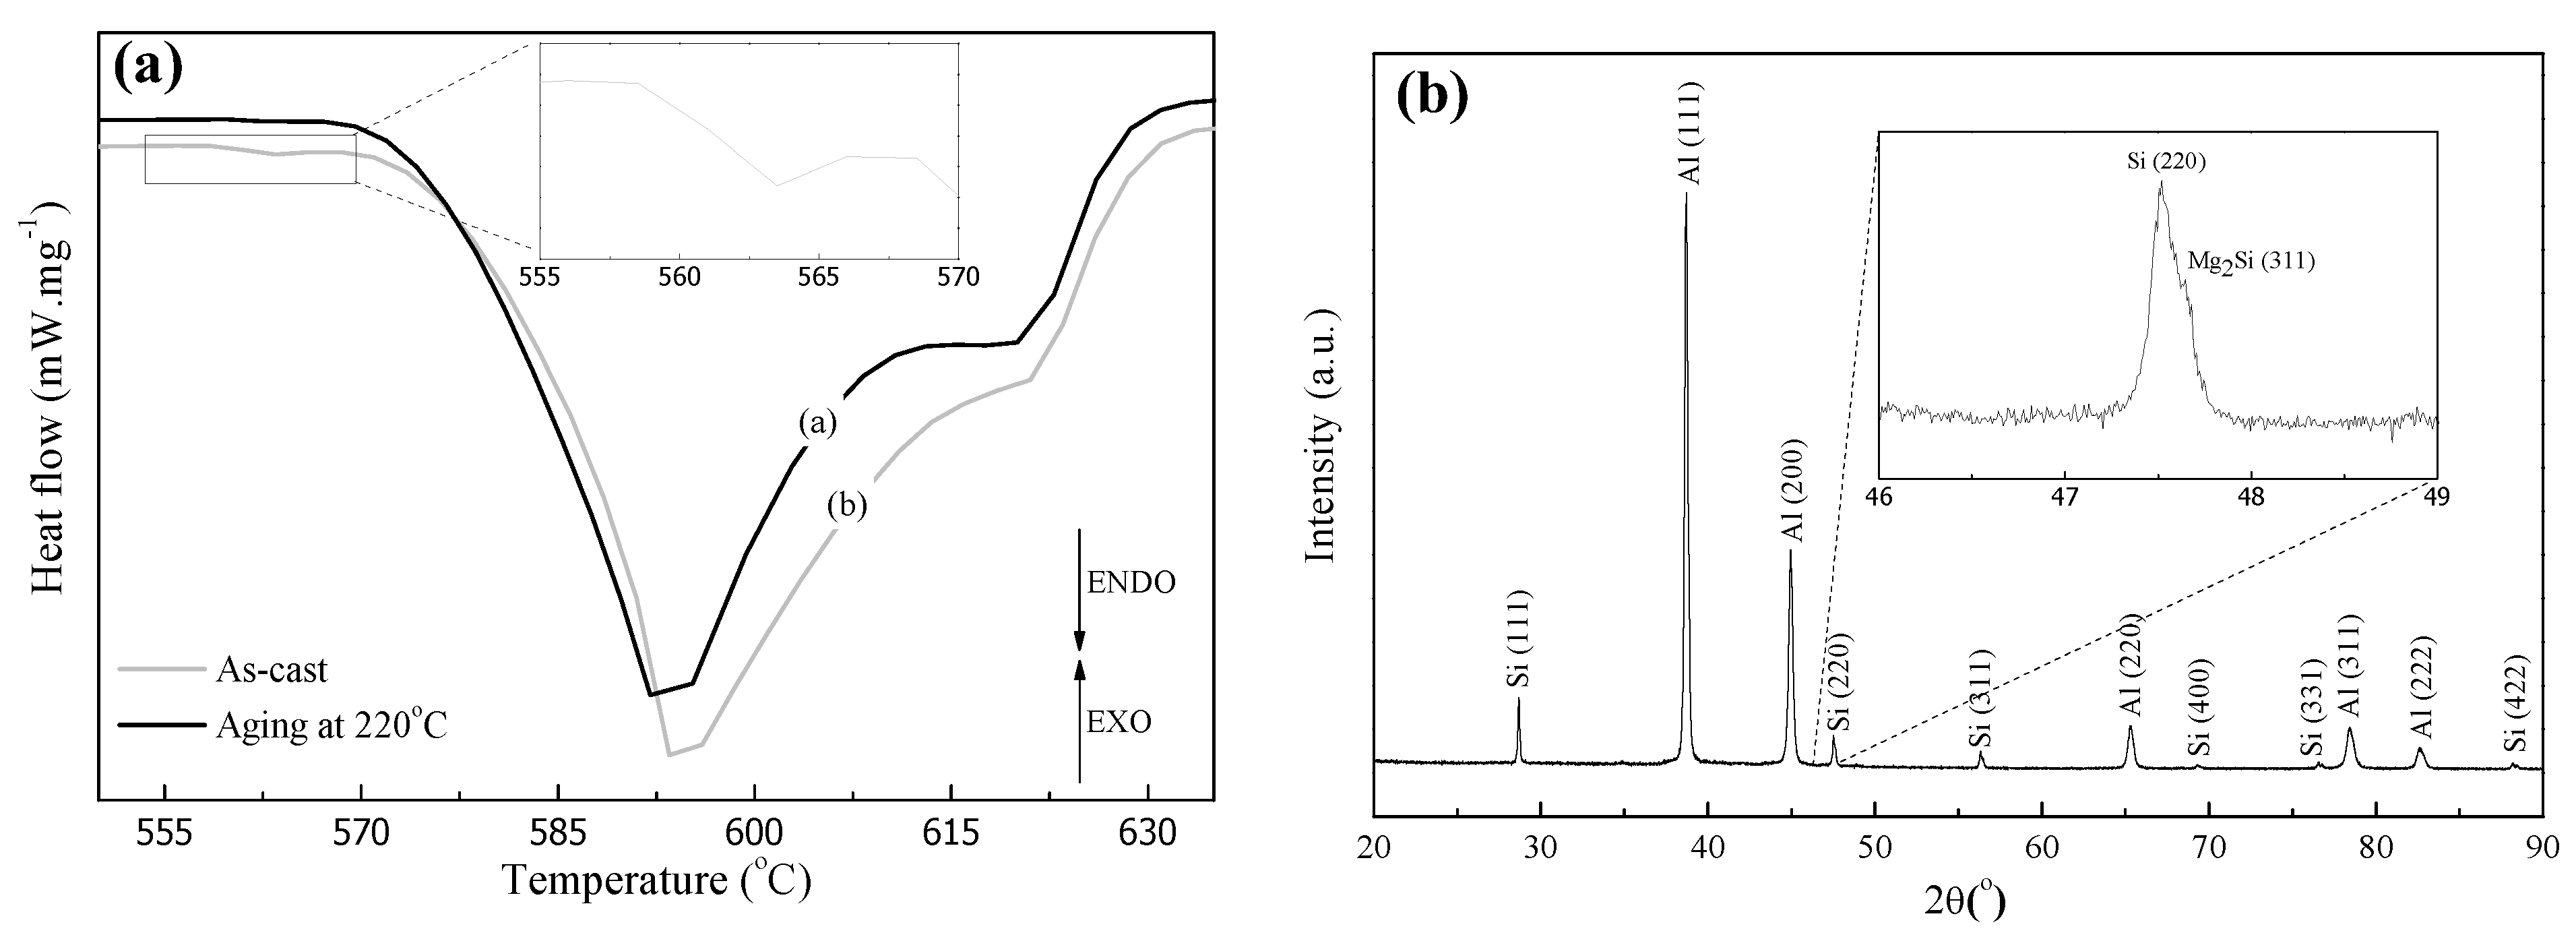
Figure 9.
Typical SEM micrographs of the A356 alloy samples of the as-cast samples (a), and quenched at (b) 30 °C, (c) 60 °C, and (d) 80 °C, evidencing Fe-rich particles and Mg2Si particles (as-cast sample).
Figure 9.
Typical SEM micrographs of the A356 alloy samples of the as-cast samples (a), and quenched at (b) 30 °C, (c) 60 °C, and (d) 80 °C, evidencing Fe-rich particles and Mg2Si particles (as-cast sample).
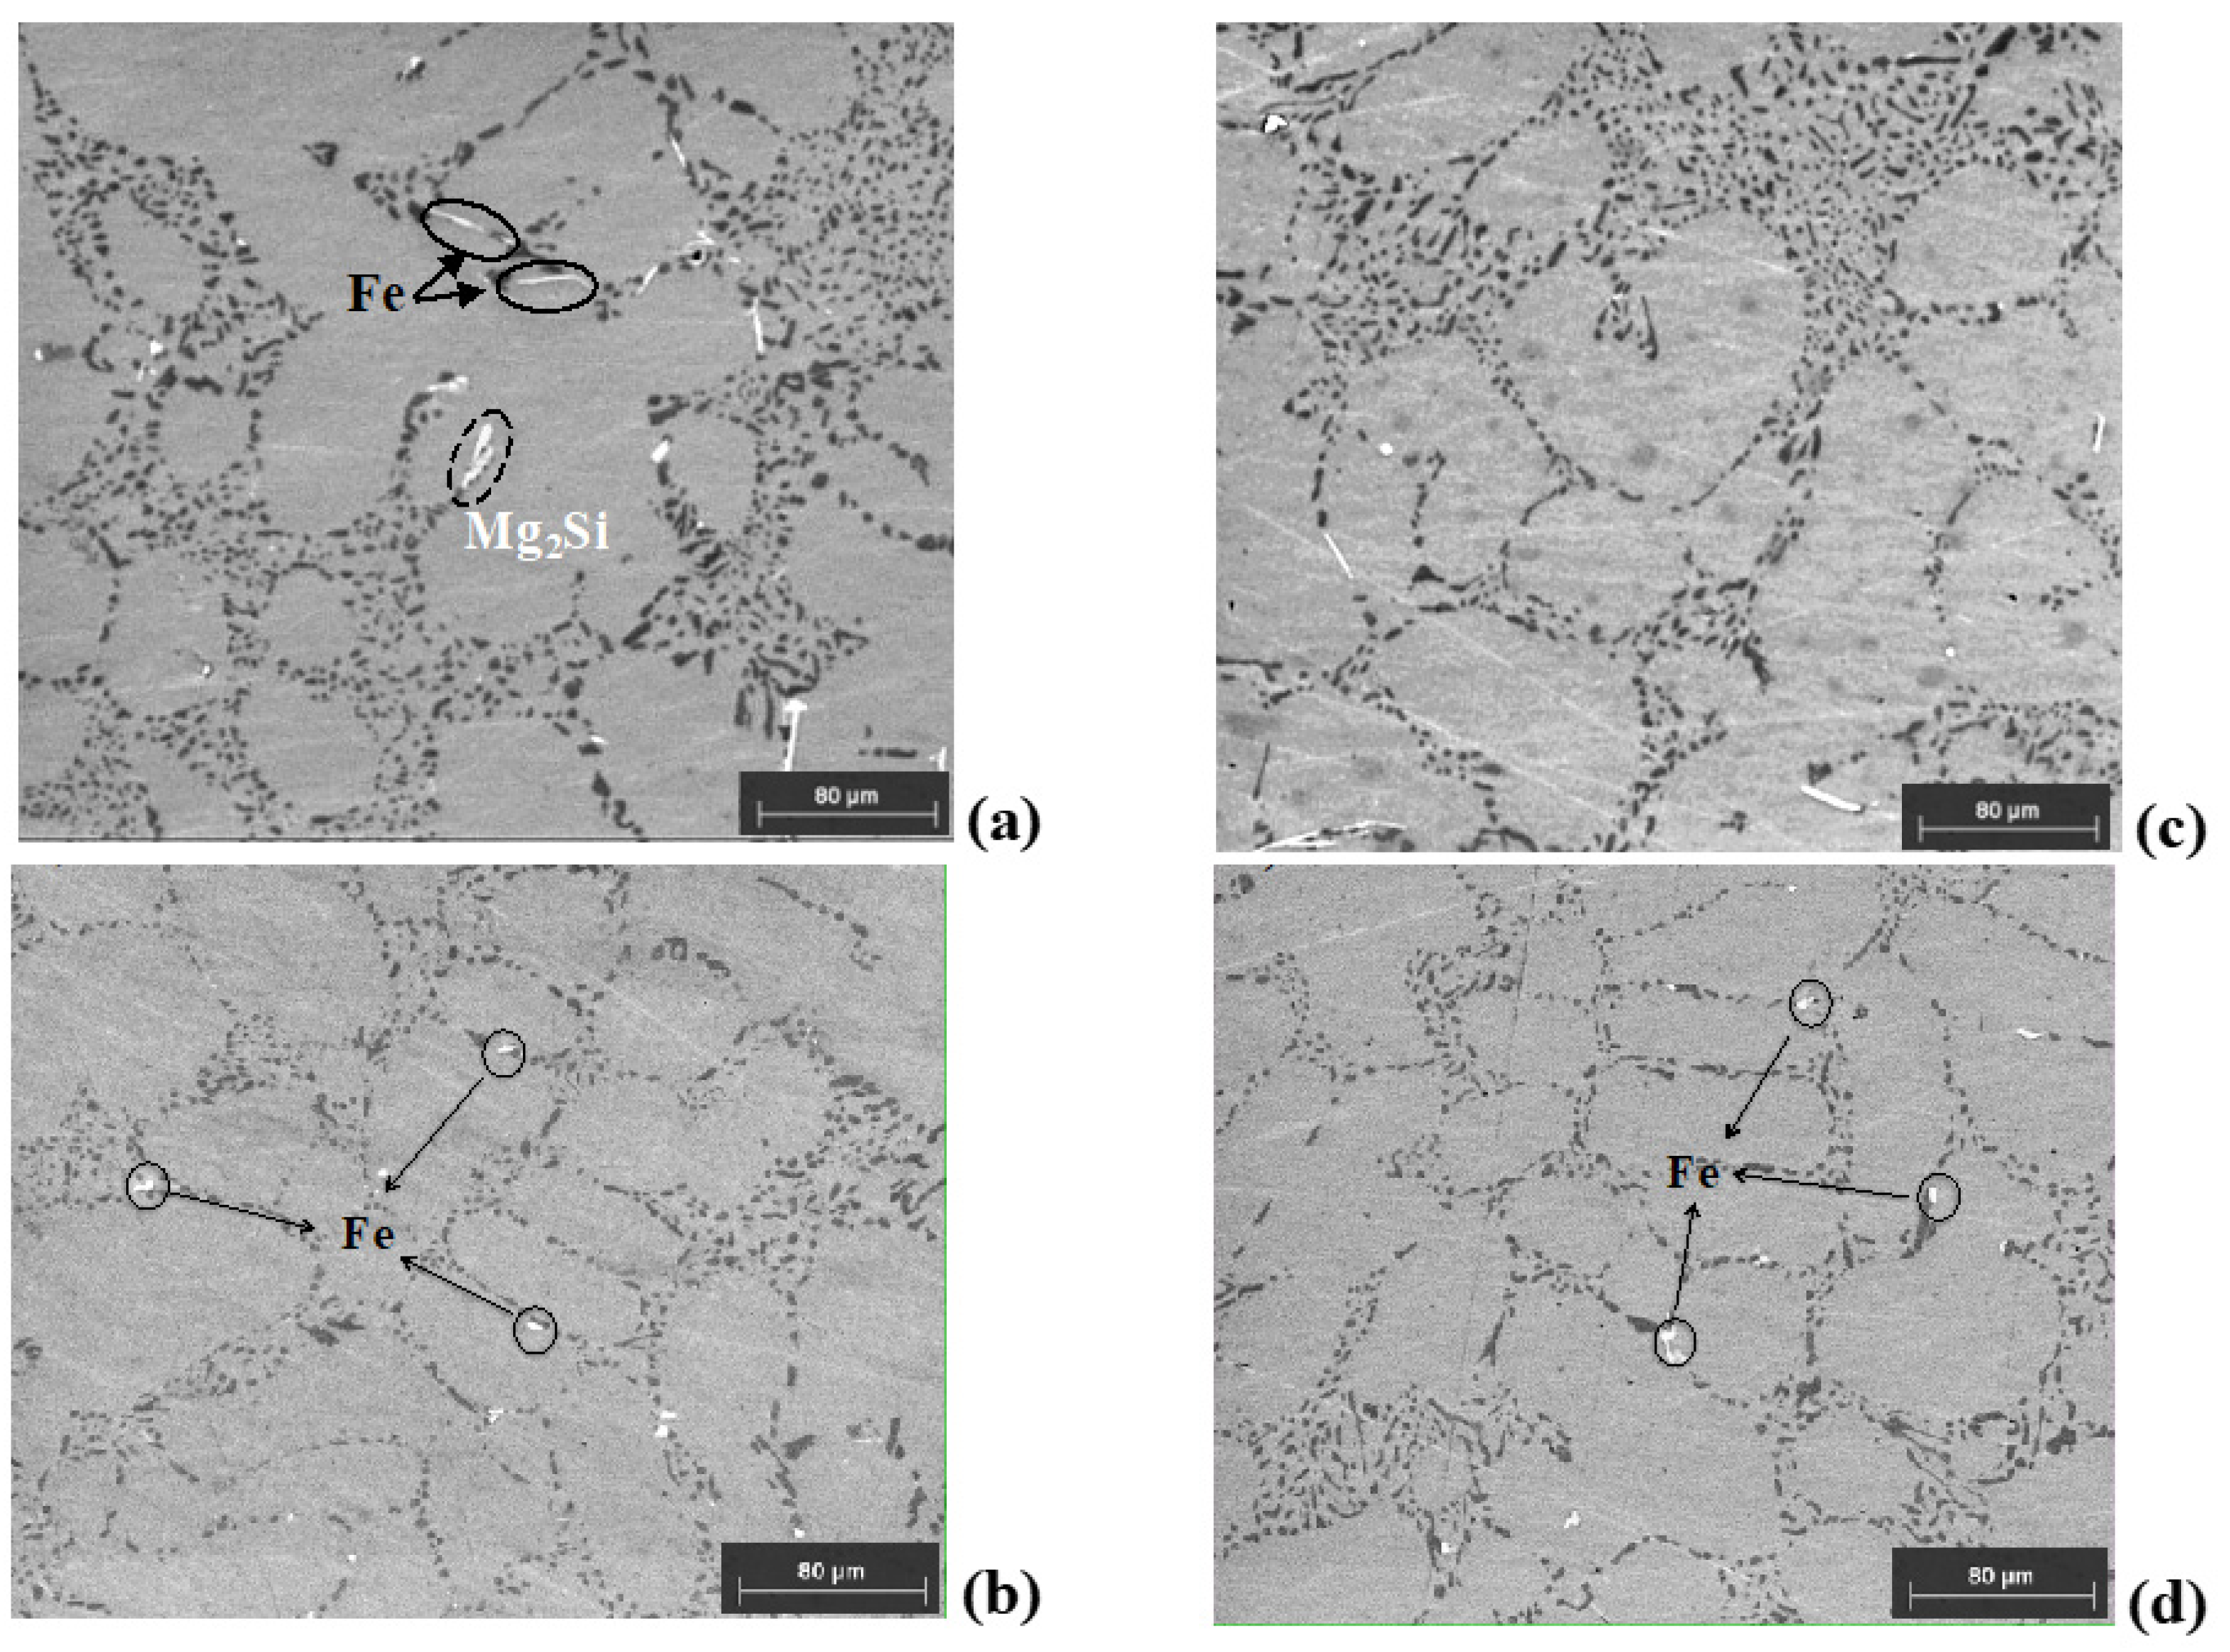
Figure 10.
(a) A typical micrograph of the fractured surface of the specimens examined, SEM micrographs of the samples quenched at (b) 30 °C and (c) 60 °C; and the samples after aging at (d) 180 °C, (e) 200 °C, and (f) 220 °C. The white arrows indicate the cleavage planes and yellow and red dashed circles represent tendon fossa (dimples sites) [50] and tearing edges, respectively. Yellow arrows depict the constituted porosity/voids.


Table 1.
The chemical composition of the commercial A356 alloy.
| Alloying Elements | Si | Mg | Cu | Fe | Ti | Sr | Al |
|---|---|---|---|---|---|---|---|
| Min. content (%wt.) | 6.5 | 0.2 | ---- | --- | 0.1 | 0.01 | Balance |
| Max. content (%wt.) | 7.5 | 0.45 | 0.2 | 0.3 | 0.2 | 0.02 | Balance |
Table 2.
Calculated dislocation density (ρ) at (200) and (111) Al peaks obtained from XRD patterns of the as-cast, quenched at 30 °C, and aged at 180 °C samples.
Table 2.
Calculated dislocation density (ρ) at (200) and (111) Al peaks obtained from XRD patterns of the as-cast, quenched at 30 °C, and aged at 180 °C samples.
| As-Cast | Quenched at 30 °C | Aging at 180 °C | |
|---|---|---|---|
| ρ (m−2 × 10¹⁵) | |||
| (200) | 6.2 (±0.2) | 7.2 (±0.2) | 7.9 (±0.2) |
| (111) | 7.9 (±0.2) | 8.9 (±0.2) | 9.4 (±0.2) |
Disclaimer/Publisher’s Note: The statements, opinions and data contained in all publications are solely those of the individual author(s) and contributor(s) and not of MDPI and/or the editor(s). MDPI and/or the editor(s) disclaim responsibility for any injury to people or property resulting from any ideas, methods, instructions or products referred to in the content. |
© 2024 by the authors. Licensee MDPI, Basel, Switzerland. This article is an open access article distributed under the terms and conditions of the Creative Commons Attribution (CC BY) license (https://creativecommons.org/licenses/by/4.0/).
Share and Cite
MDPI and ACS Style
Tonetti, A.L.; Osório, W.R.; Bortolozo, A.D.; Padilha, G.S. Planning Mechanical Behavior of A356 Alloy Wheels by Using Distinct Heat Treatments. Metals 2024, 14, 461. https://doi.org/10.3390/met14040461
AMA Style
Tonetti AL, Osório WR, Bortolozo AD, Padilha GS. Planning Mechanical Behavior of A356 Alloy Wheels by Using Distinct Heat Treatments. Metals. 2024; 14(4):461. https://doi.org/10.3390/met14040461
Chicago/Turabian StyleTonetti, Adriano L., Wislei R. Osório, Ausdinir D. Bortolozo, and Giovana S. Padilha. 2024. "Planning Mechanical Behavior of A356 Alloy Wheels by Using Distinct Heat Treatments" Metals 14, no. 4: 461. https://doi.org/10.3390/met14040461
Note that from the first issue of 2016, this journal uses article numbers instead of page numbers. See further details here.