Article

Study on Al Evaporation during AlV55 Melting and Alloy Preparation

1
Key Laboratory for Nonferrous Vacuum Metallurgy of Yunnan Province, Kunming University of Science and Technology, Kunming 650093, China
2
State Key Laboratory of Complex Non-Ferrous Metal Resources Clean Utilization, Kunming University of Science and Technology, Kunming 650093, China
3
National Engineering Research Center of Vacuum Metallurgy, Kunming University of Science and Technology, Kunming 650093, China
4
Faculty of Metallurgical and Energy Engineering, Kunming University of Science and Technology, Kunming 650093, China
5
HBIS Group Co., Ltd., Material Technology Research Institute, Shijiazhuang 050023, China
*
Authors to whom correspondence should be addressed.
Metals 2024, 14(4), 466; https://doi.org/10.3390/met14040466
Submission received: 20 March 2024 / Revised: 6 April 2024 / Accepted: 8 April 2024 / Published: 16 April 2024

Abstract

:
Vacuum induction melting is a commonly used method for preparing AlV55 alloys. However, this method results in high Al evaporation losses, leading to poor cost control. Moreover, the influence of the process parameters on the alloy composition remains unclear. In this study, the evaporation pattern of Al in the melting and preparation processes of AlV55 alloys is studied, and measures for controlling the system pressure are proposed to effectively reduce Al evaporation. The experimental results show that smelting under an Ar gas atmosphere of 2000 Pa can reduce the evaporation loss of Al from 11.48% under vacuum conditions (60 Pa) to 0.58% of the amount of raw material added, effectively improving the metal utilization rate and reducing production costs. The influence of various process parameters on the alloy composition and Al volatilization are investigated to enable the effective control of the compositional uniformity and impurity content of the resulting alloys. Under optimal conditions, the impurity contents of C, O, and N are 0.03%, 0.0073%, and 0.013%, respectively; this reduces the amount of Al lost by evaporation compared to conventional methods, and the alloy produced meets commercial standards.

1. Introduction

Vanadium metal, an important metal resource, has been widely used in Al alloys as an important means of improving the properties and composition of alloys [1]. Al–V alloys have a wide range of applications owing to their excellent properties. For example, V and Al are added as key elements during the preparation of high-quality Ti alloys in the aerospace field. TC4 (Ti-6Al-4V), the most representative of this type of alloy, is characterized by good stability at room temperature and high fatigue resistance. It is used in casting and forging alloys, brackets and fasteners in aircraft frame structures, and compression turbine disks and blades for engines. At present, the range of applications of this alloy continues to expand, particularly in the power plant, shipbuilding and nuclear reactor industries [2,3,4].
High-purity and homogeneous Al–V intermediate alloys are key to the preparation of high-performance Ti alloys. Currently, most of the world’s annual production of Al–V intermediates is used in the aerospace sector, accounting for over 70% of its consumption. The global demand for Al–V alloys and, hence, their production have seen rapid annual growth, and the market for Al–V intermediate alloys has great development potential [5,6,7]. Al–V alloys are mainly produced via the one-step and two-step methods [8]. The one-step method uses V2O5 and Al powder as raw materials and adopts the Al thermal reaction under atmospheric pressure in a reactor; this method is the most widely used in current industrial production. However, the one-step method presents a number of disadvantages that limit its applications. For instance, the thermal reaction of Al is difficult to control, the quality and uniformity of the product obtained are poor, the content of certain impurity elements is high, and the method causes environmental pollution. In the two-step process, the Al thermal method is first used to prepare an intermediate alloy containing approximately 85% V and 15% Al; in the second step, the Al–V alloy is remelted with the appropriate amount of Al in a vacuum induction furnace to obtain an alloy containing 50% or other grades of Al–V alloy. The two-step method is an effective solution to the problems inherent in the one-step method. However, the two-step method also presents a number of disadvantages. First, because it requires processing of the alloy in two steps, further declines in the metal recovery rate are often observed. Second, the two-step method requires a longer production time and higher costs. Thus, its applications are also limited [9,10].
Because the melting point of Al–V alloy is much higher than that of Al in the two-step process, large amounts of Al are inevitably lost owing to evaporation in the vacuum refining process. A previous study reported a method in which AlV65 alloy instead of AlV85 alloy was used to prepare AlV55 alloy via the vacuum refining process [11]. This method reduced the amount of Al added to the refining process and effectively recovered V and Al from the AlV65 alloy scrap. However, when the Al evaporation amount was calculated, this method did not consider the influence of the system pressure and electromagnetic stirring phenomenon of the induction furnace on Al evaporation; in actual production, these factors, particularly the system pressure, directly affect Al evaporation [12]. Therefore, the method is still prone to extensive Al volatilization, which reduces the Al utilization rate, leads to poor material control, and increases production costs. The evaporation process of Al has been reported to be divisible into three parts according to the evaporation rate depending on the system pressure: molecular evaporation, boiling evaporation, and general evaporation [13]. The evaporation of Al in the raw material can be effectively reduced to control the evaporation of Al in the melting process to general evaporation. Therefore, elucidation of the evaporation process of Al in Al–V alloys and control of the evaporation loss of Al, which has an impact on the preparation process of AlV55 alloys, are of great significance.
At present, no study has yet had an impact on the reduction in Al evaporation in alloy refining. To bridge this gap in the literature, we aimed to study the evaporation pattern of Al and the alloy preparation process, and the effect of controlling the system pressure to effectively reduce the amount of Al evaporation and reduce the production cost was studied. The optimum system pressure for alloy preparation was 2000 Pa. The AlV55 alloy product produced under this pressure complied with industrial standards. The proposed method is an efficient and economical means of preparing AlV55 alloys and provides a new approach for preparing alloys without the excessive evaporation loss of the raw materials.

2. Materials and Methods

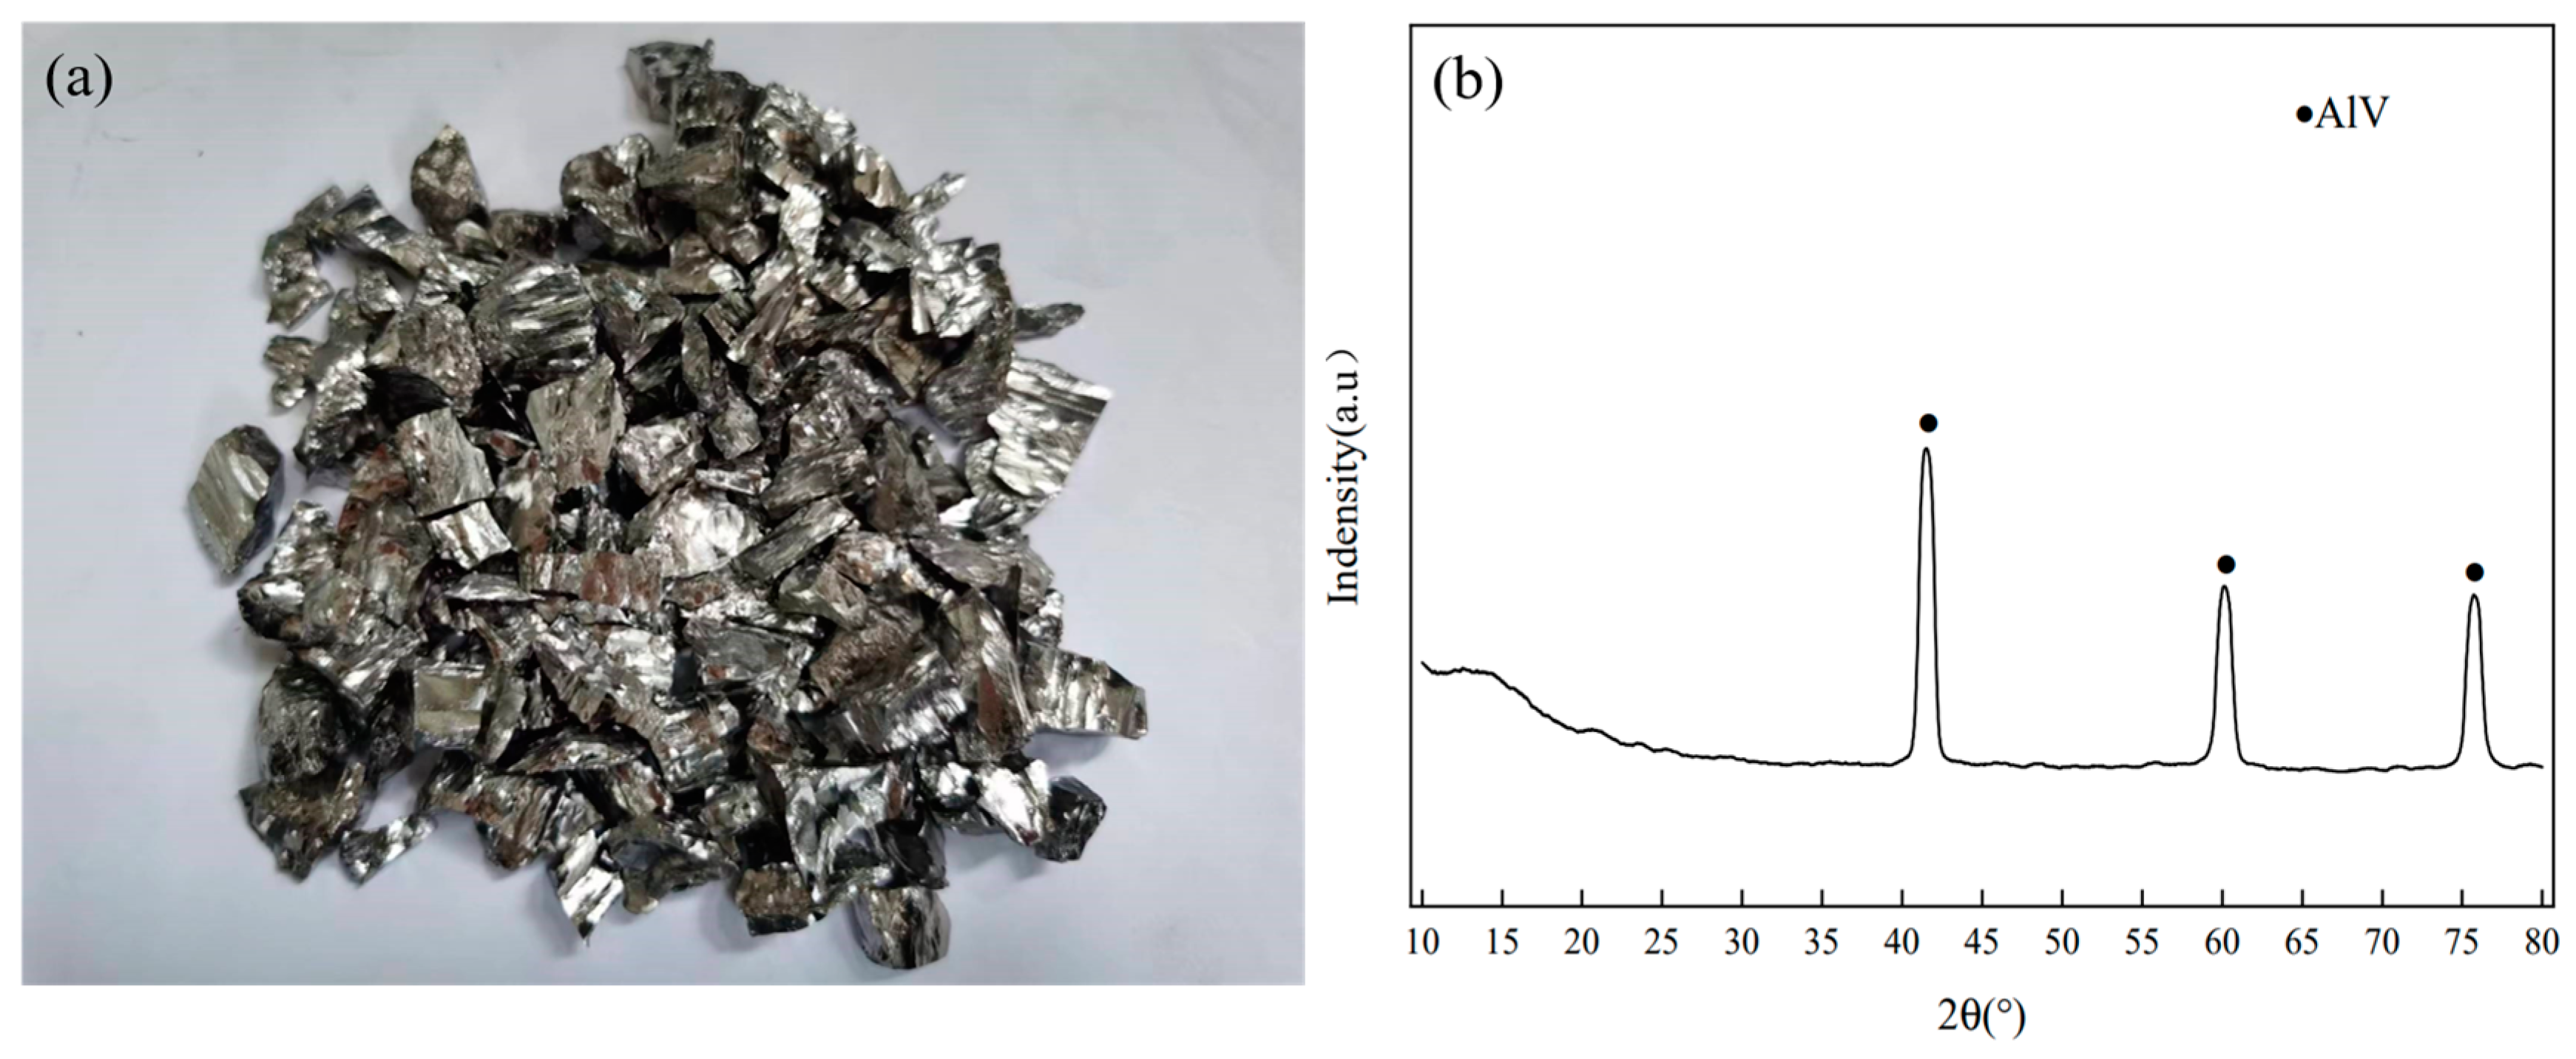
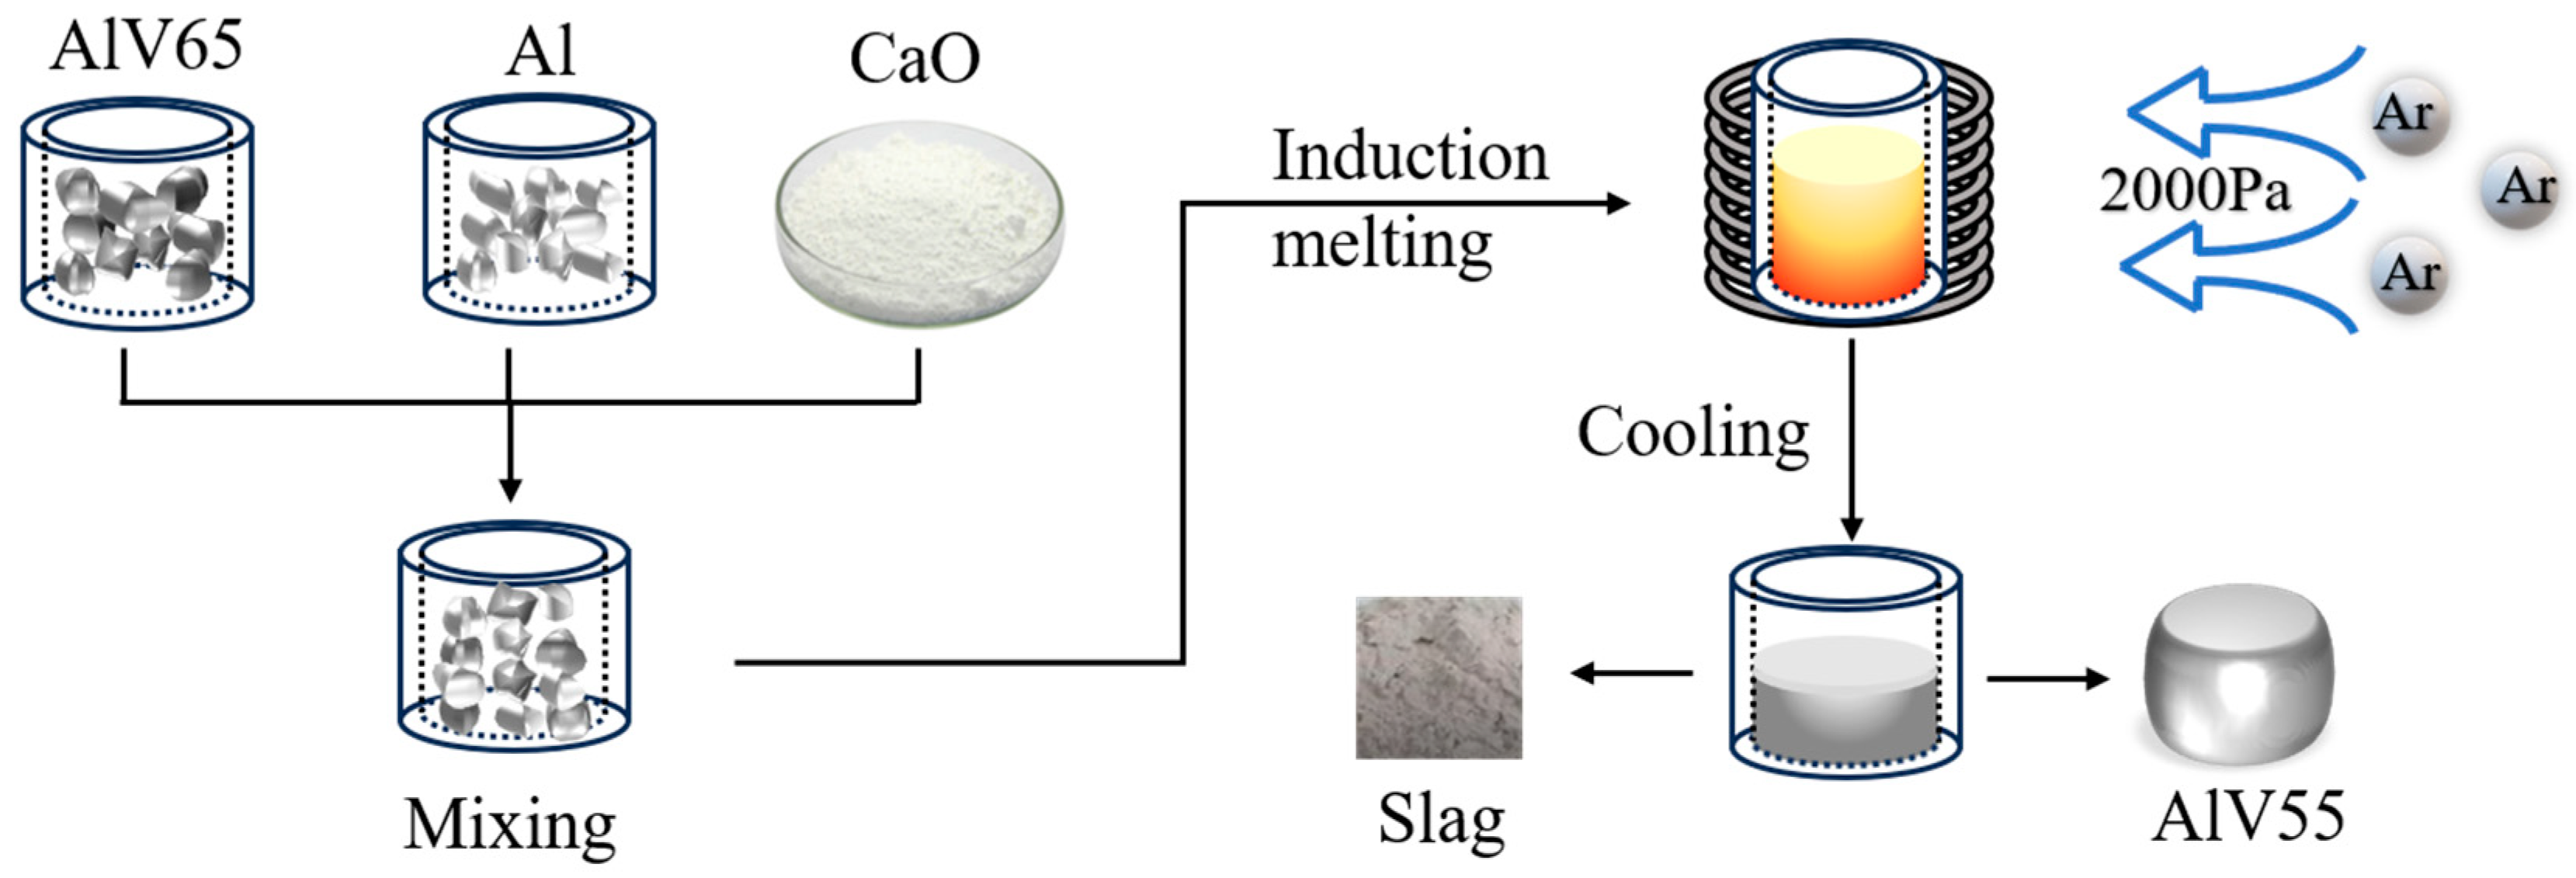
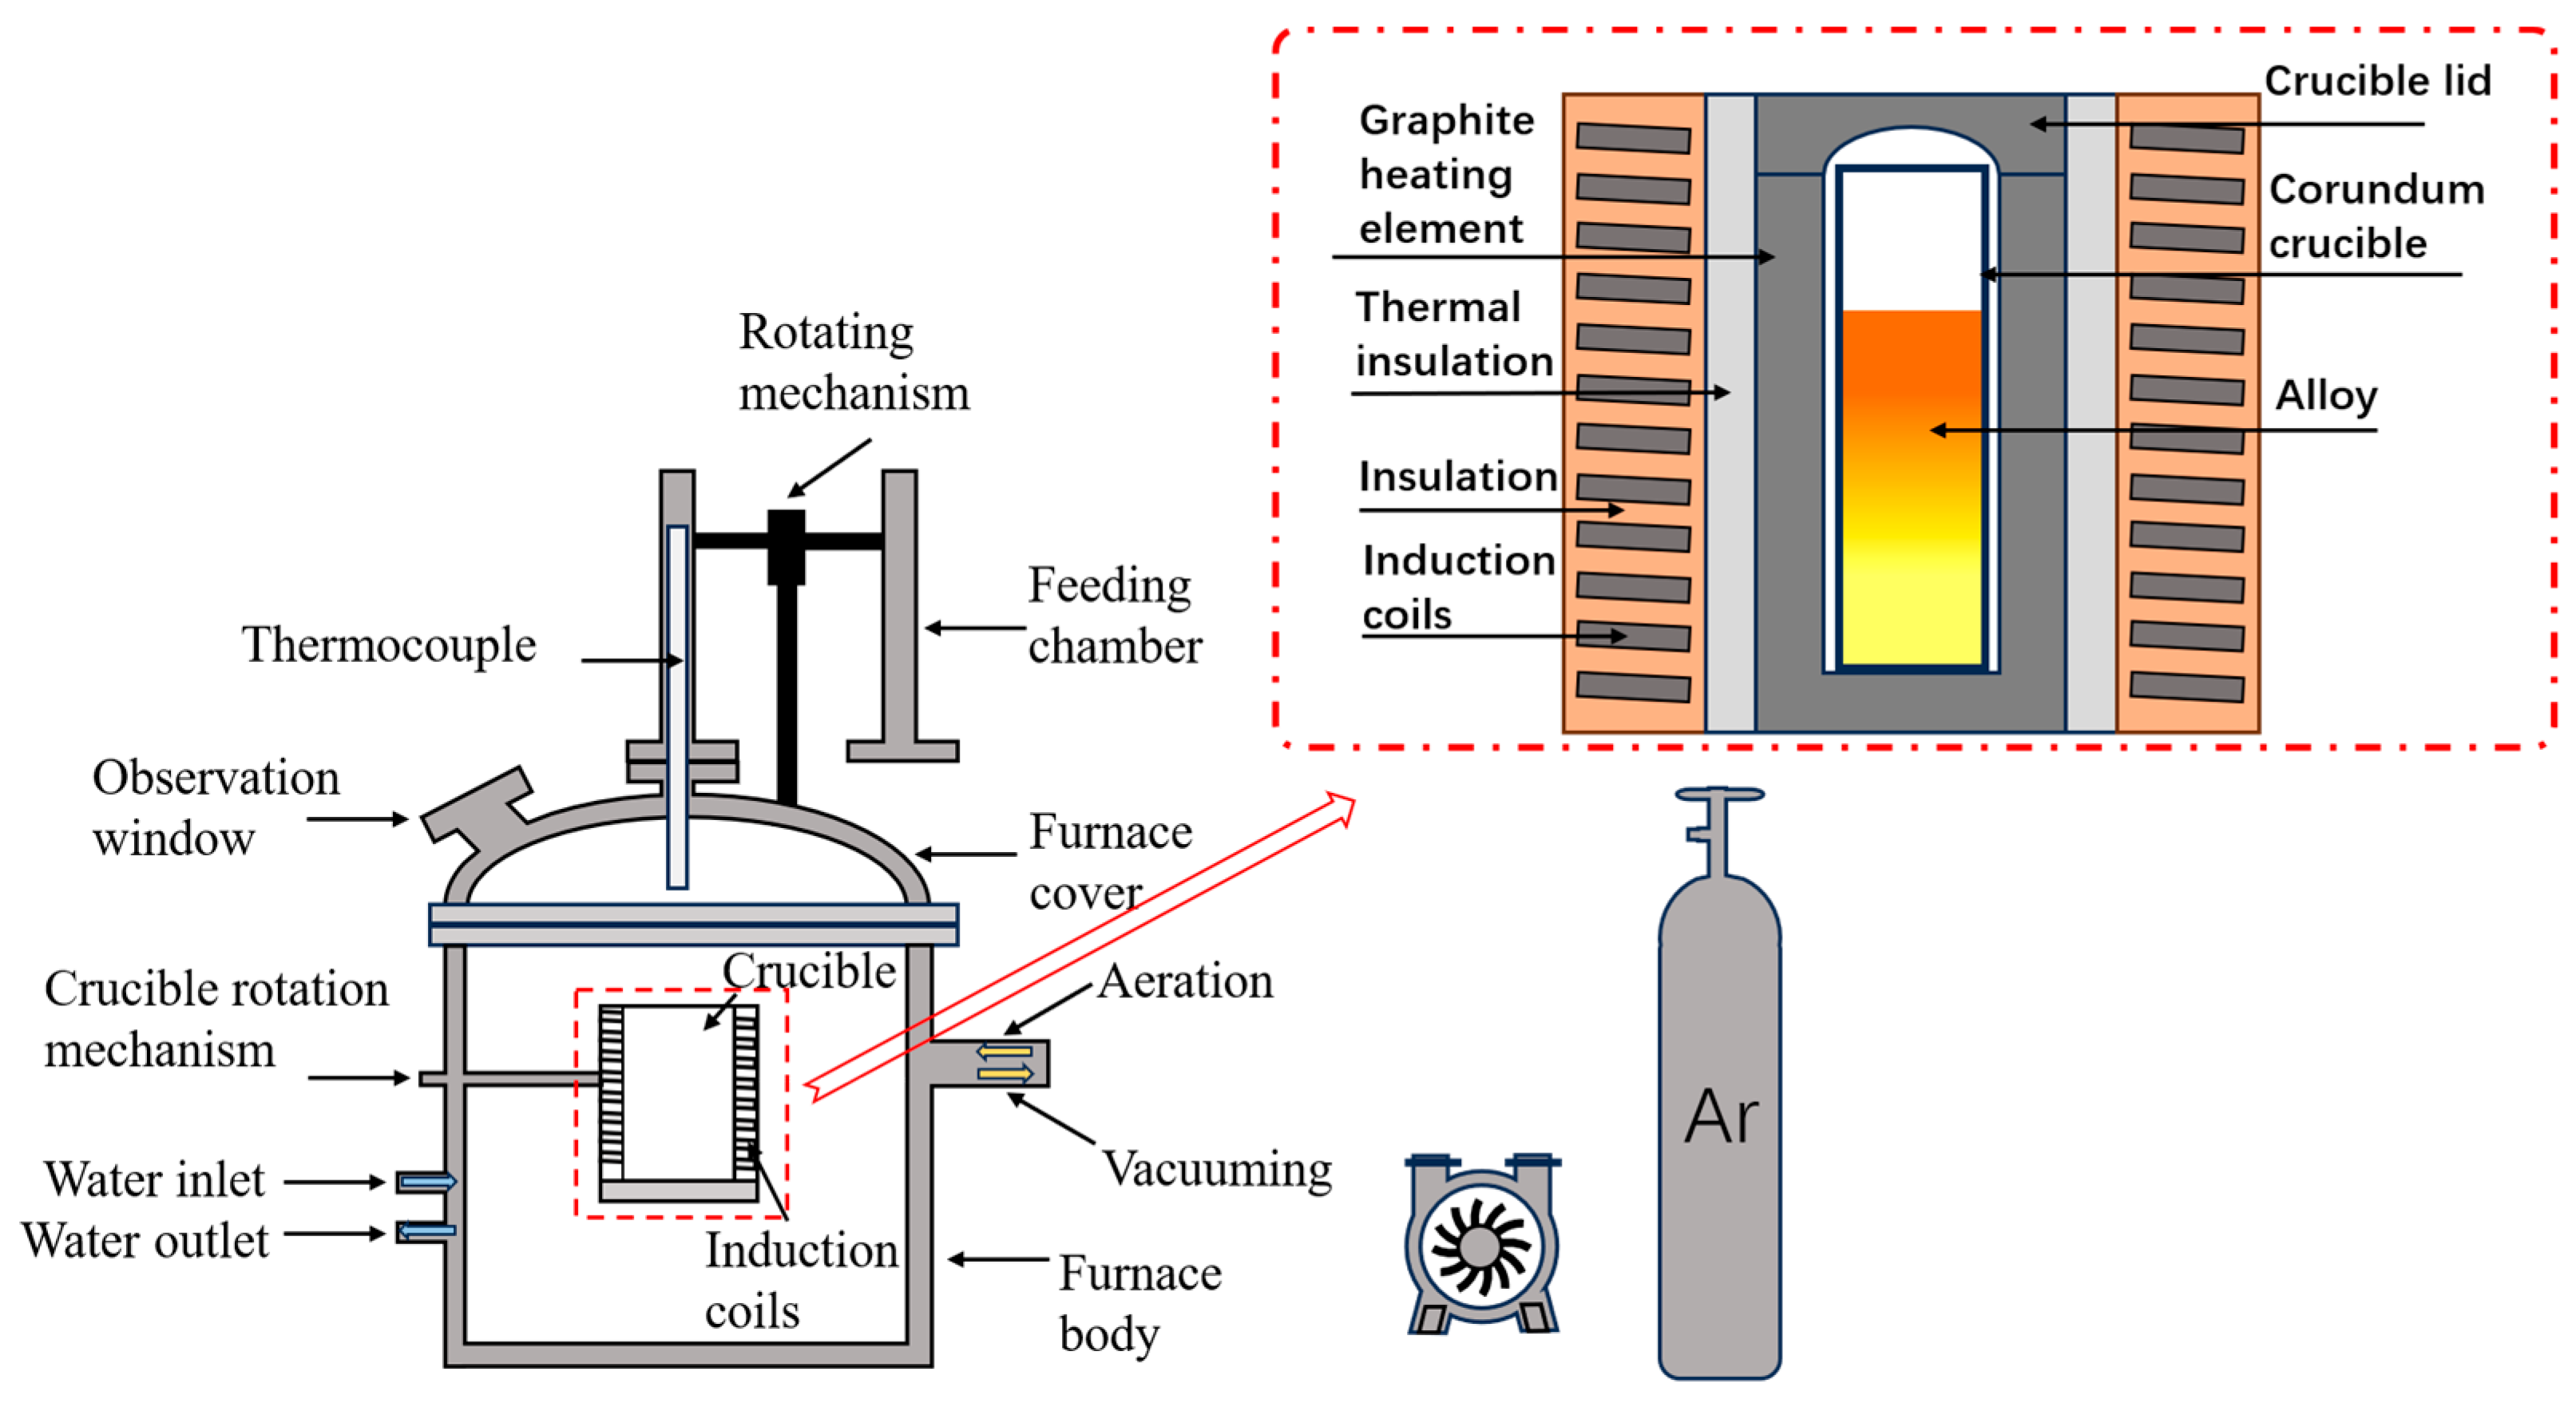
2.1. Raw Materials and Experimental Methods

The AlV65 alloy used in this study was provided by Hegang Group Co., Ltd. (No. 385, Tiyu South Street, Shijiazhuang, China) and was generated via the one-step reaction of V2O5 and Al, as shown in Figure 1a. The X-ray diffraction (XRD) patterns of the raw materials of the AlV65 alloy are shown in Figure 1b. Commercial-grade primary Al particles were used in the experiment. The physical properties of the Al particles, Ar gas, and AlV65 alloy used in this study are listed in Table 1.
The experimental procedure is illustrated in Figure 2. A crucible was filled with AlV65 alloy and Al particles in different mass ratios. The crucible was then placed in an intermediate-frequency induction furnace. The furnace body was closed, and a vacuum pump was used to evacuate the furnace to 5 Pa. The furnace was heated to the melting temperature of 2023 K, inert gas was introduced to control the system pressure, and the furnace was maintained at this temperature for 10 min. The reaction was performed in a melting unit, as shown in Figure 3. The working frequency of the medium frequency induction furnace is 4.0 KHz, the output voltage is 375 V, the output current is 40 A, the size of the graphite crucible used in the experiment is   70   mm × 70   mm × 130   mm , and the size of the corundum crucible is 60   mm × 60   mm × 120   mm .
The alloy was mixed in an induction furnace during the refining process to ensure a uniform alloy composition. A certain amount of Ar gas was introduced during the smelting process to reduce the volatilization of Al. After smelting, the AlV55 alloy was cooled under an Ar atmosphere for 24 h.

2.2. Analytical Methods

The C content in the test samples was determined using a C–S analyzer (CS230, Leco, St. Joseph, MI, USA), the O and N contents were determined using an O–N–H analyzer (ONH836, Leco), and the Al content was analyzed using inductively coupled plasma optical emission spectrometry (ICP-OES, 5110, Agilent, Santa Clara, CA, USA).
The samples were identified using XRD (Ultima IV, Rigaku, Akishima, Tokyo, Japan), and their microstructures were observed using scanning electron microscopy (SEM, VEGA3, TESCAN, Brno, Czech.). The V content in the samples was analyzed using the (NH4)2S2O8 oxidation–(NH4)2Fe(SO4)2 titration method.

3. Results and Discussion

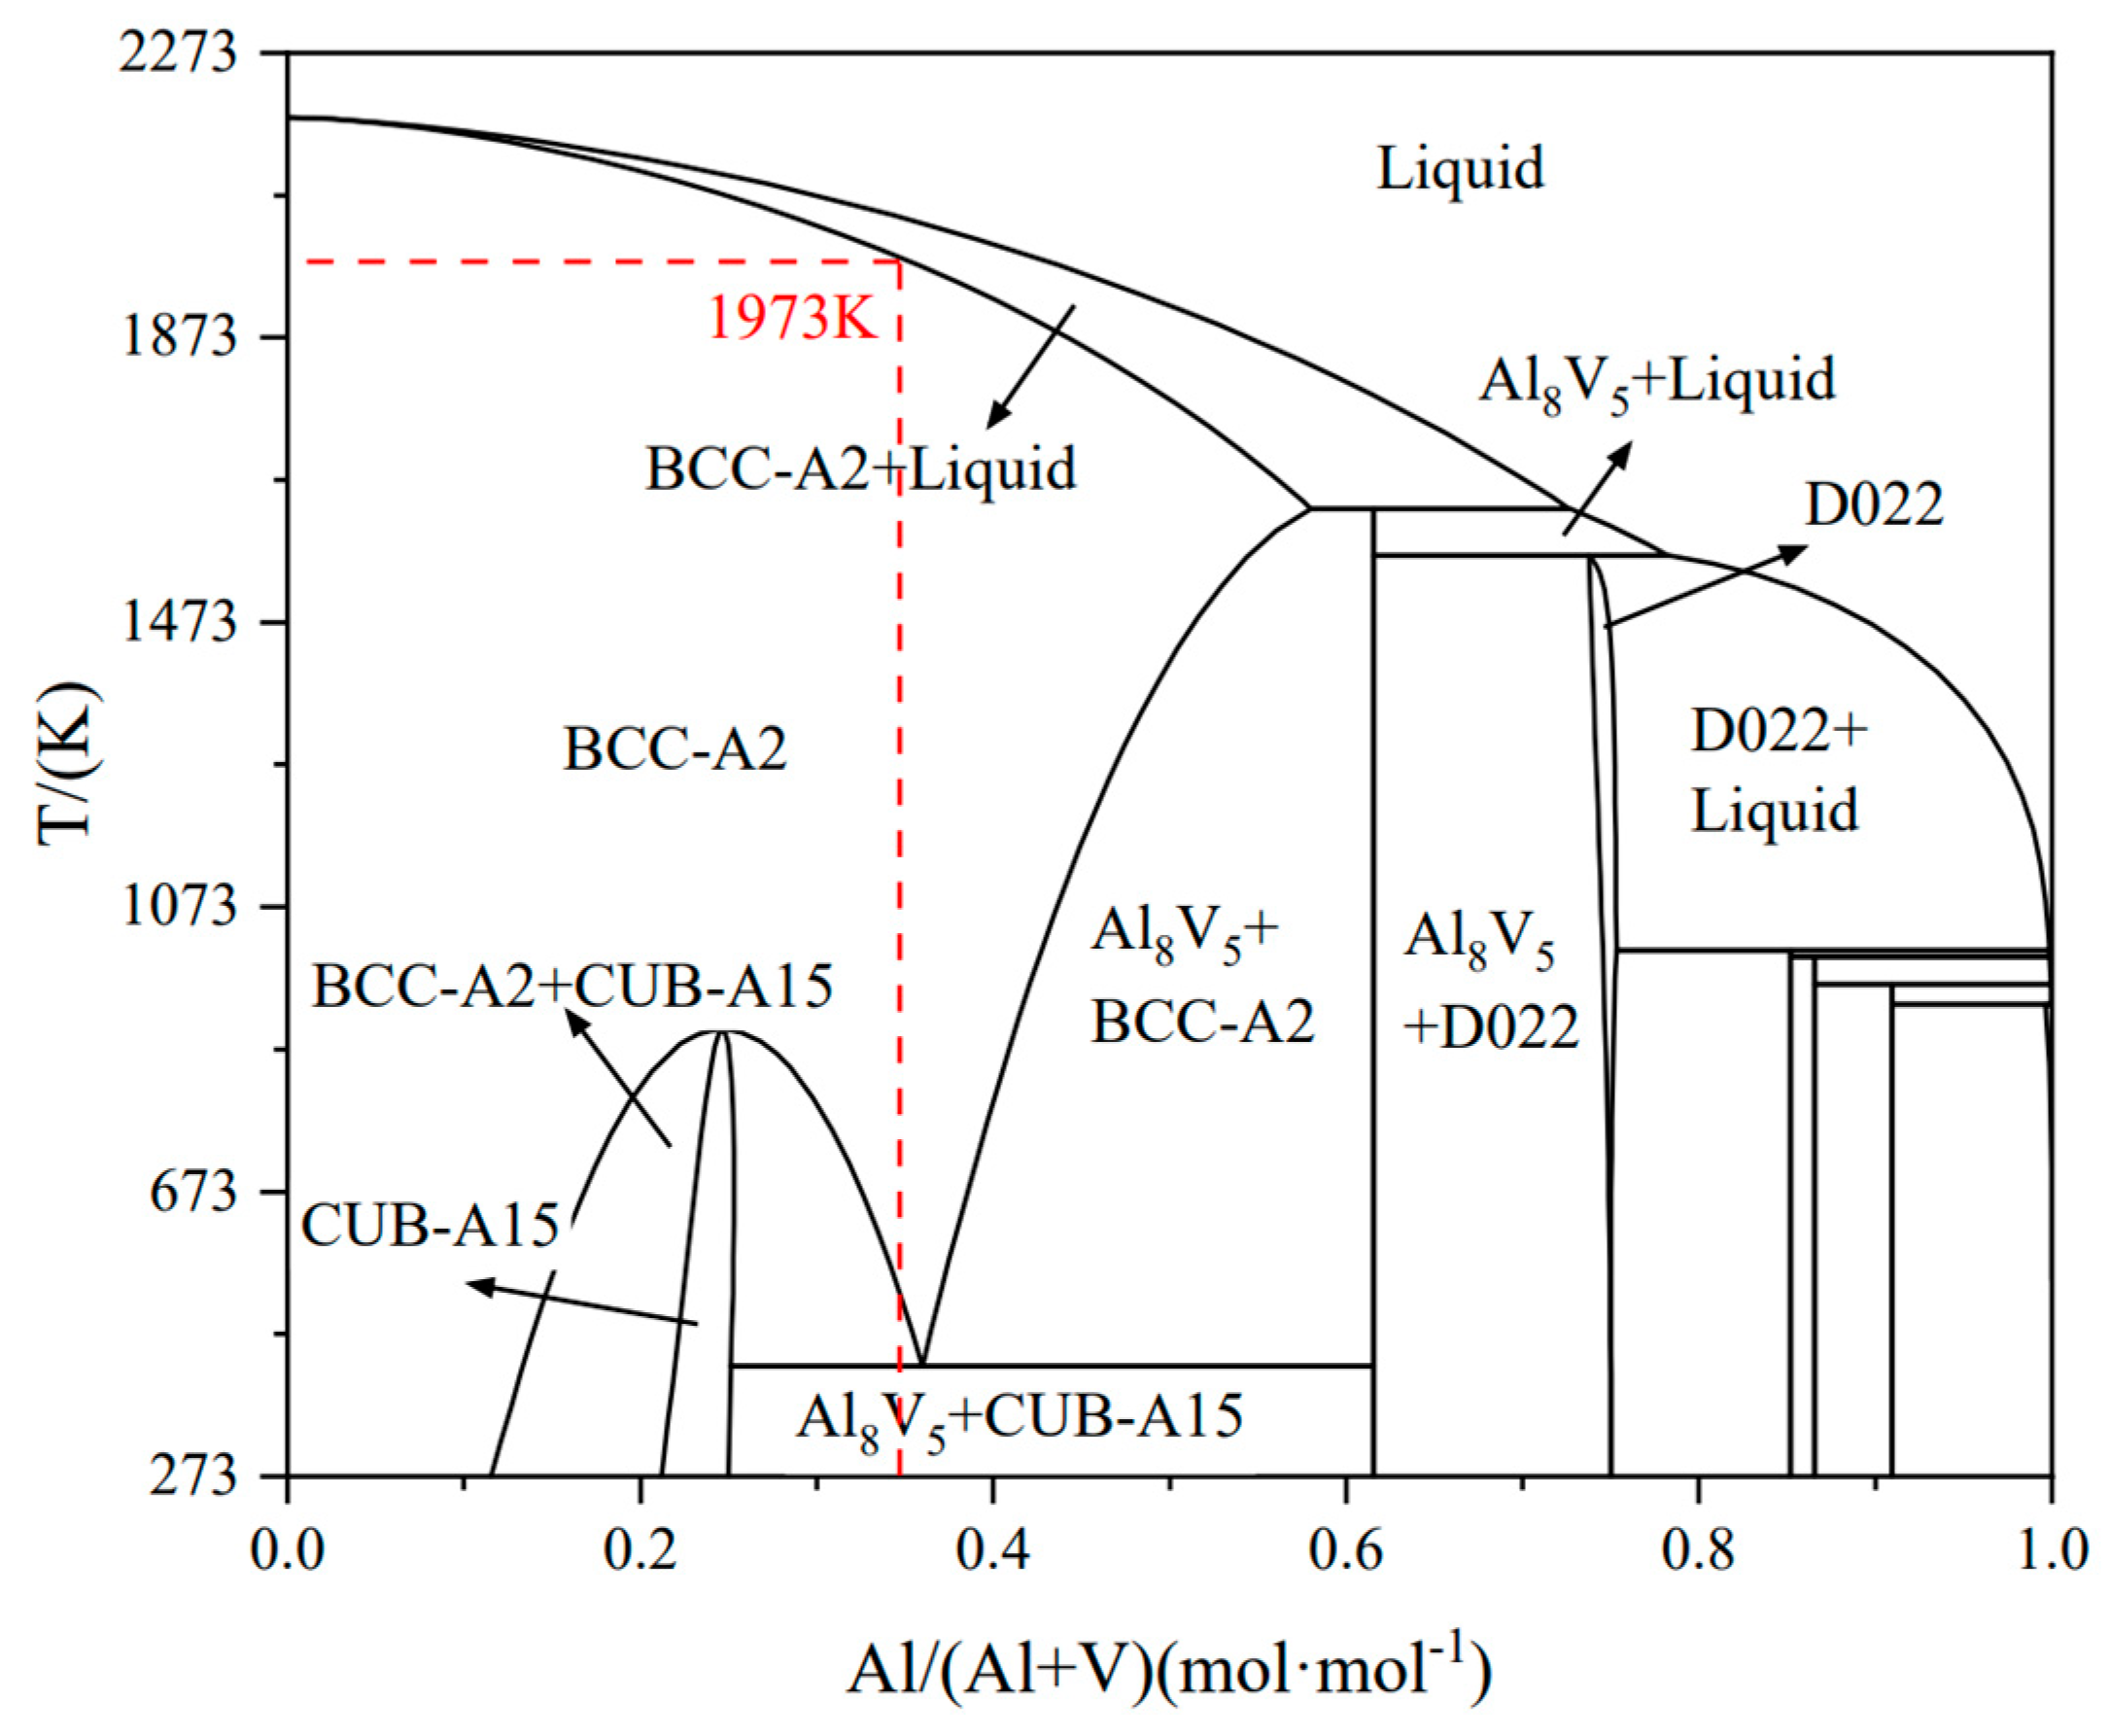
3.1. Theoretical Analysis

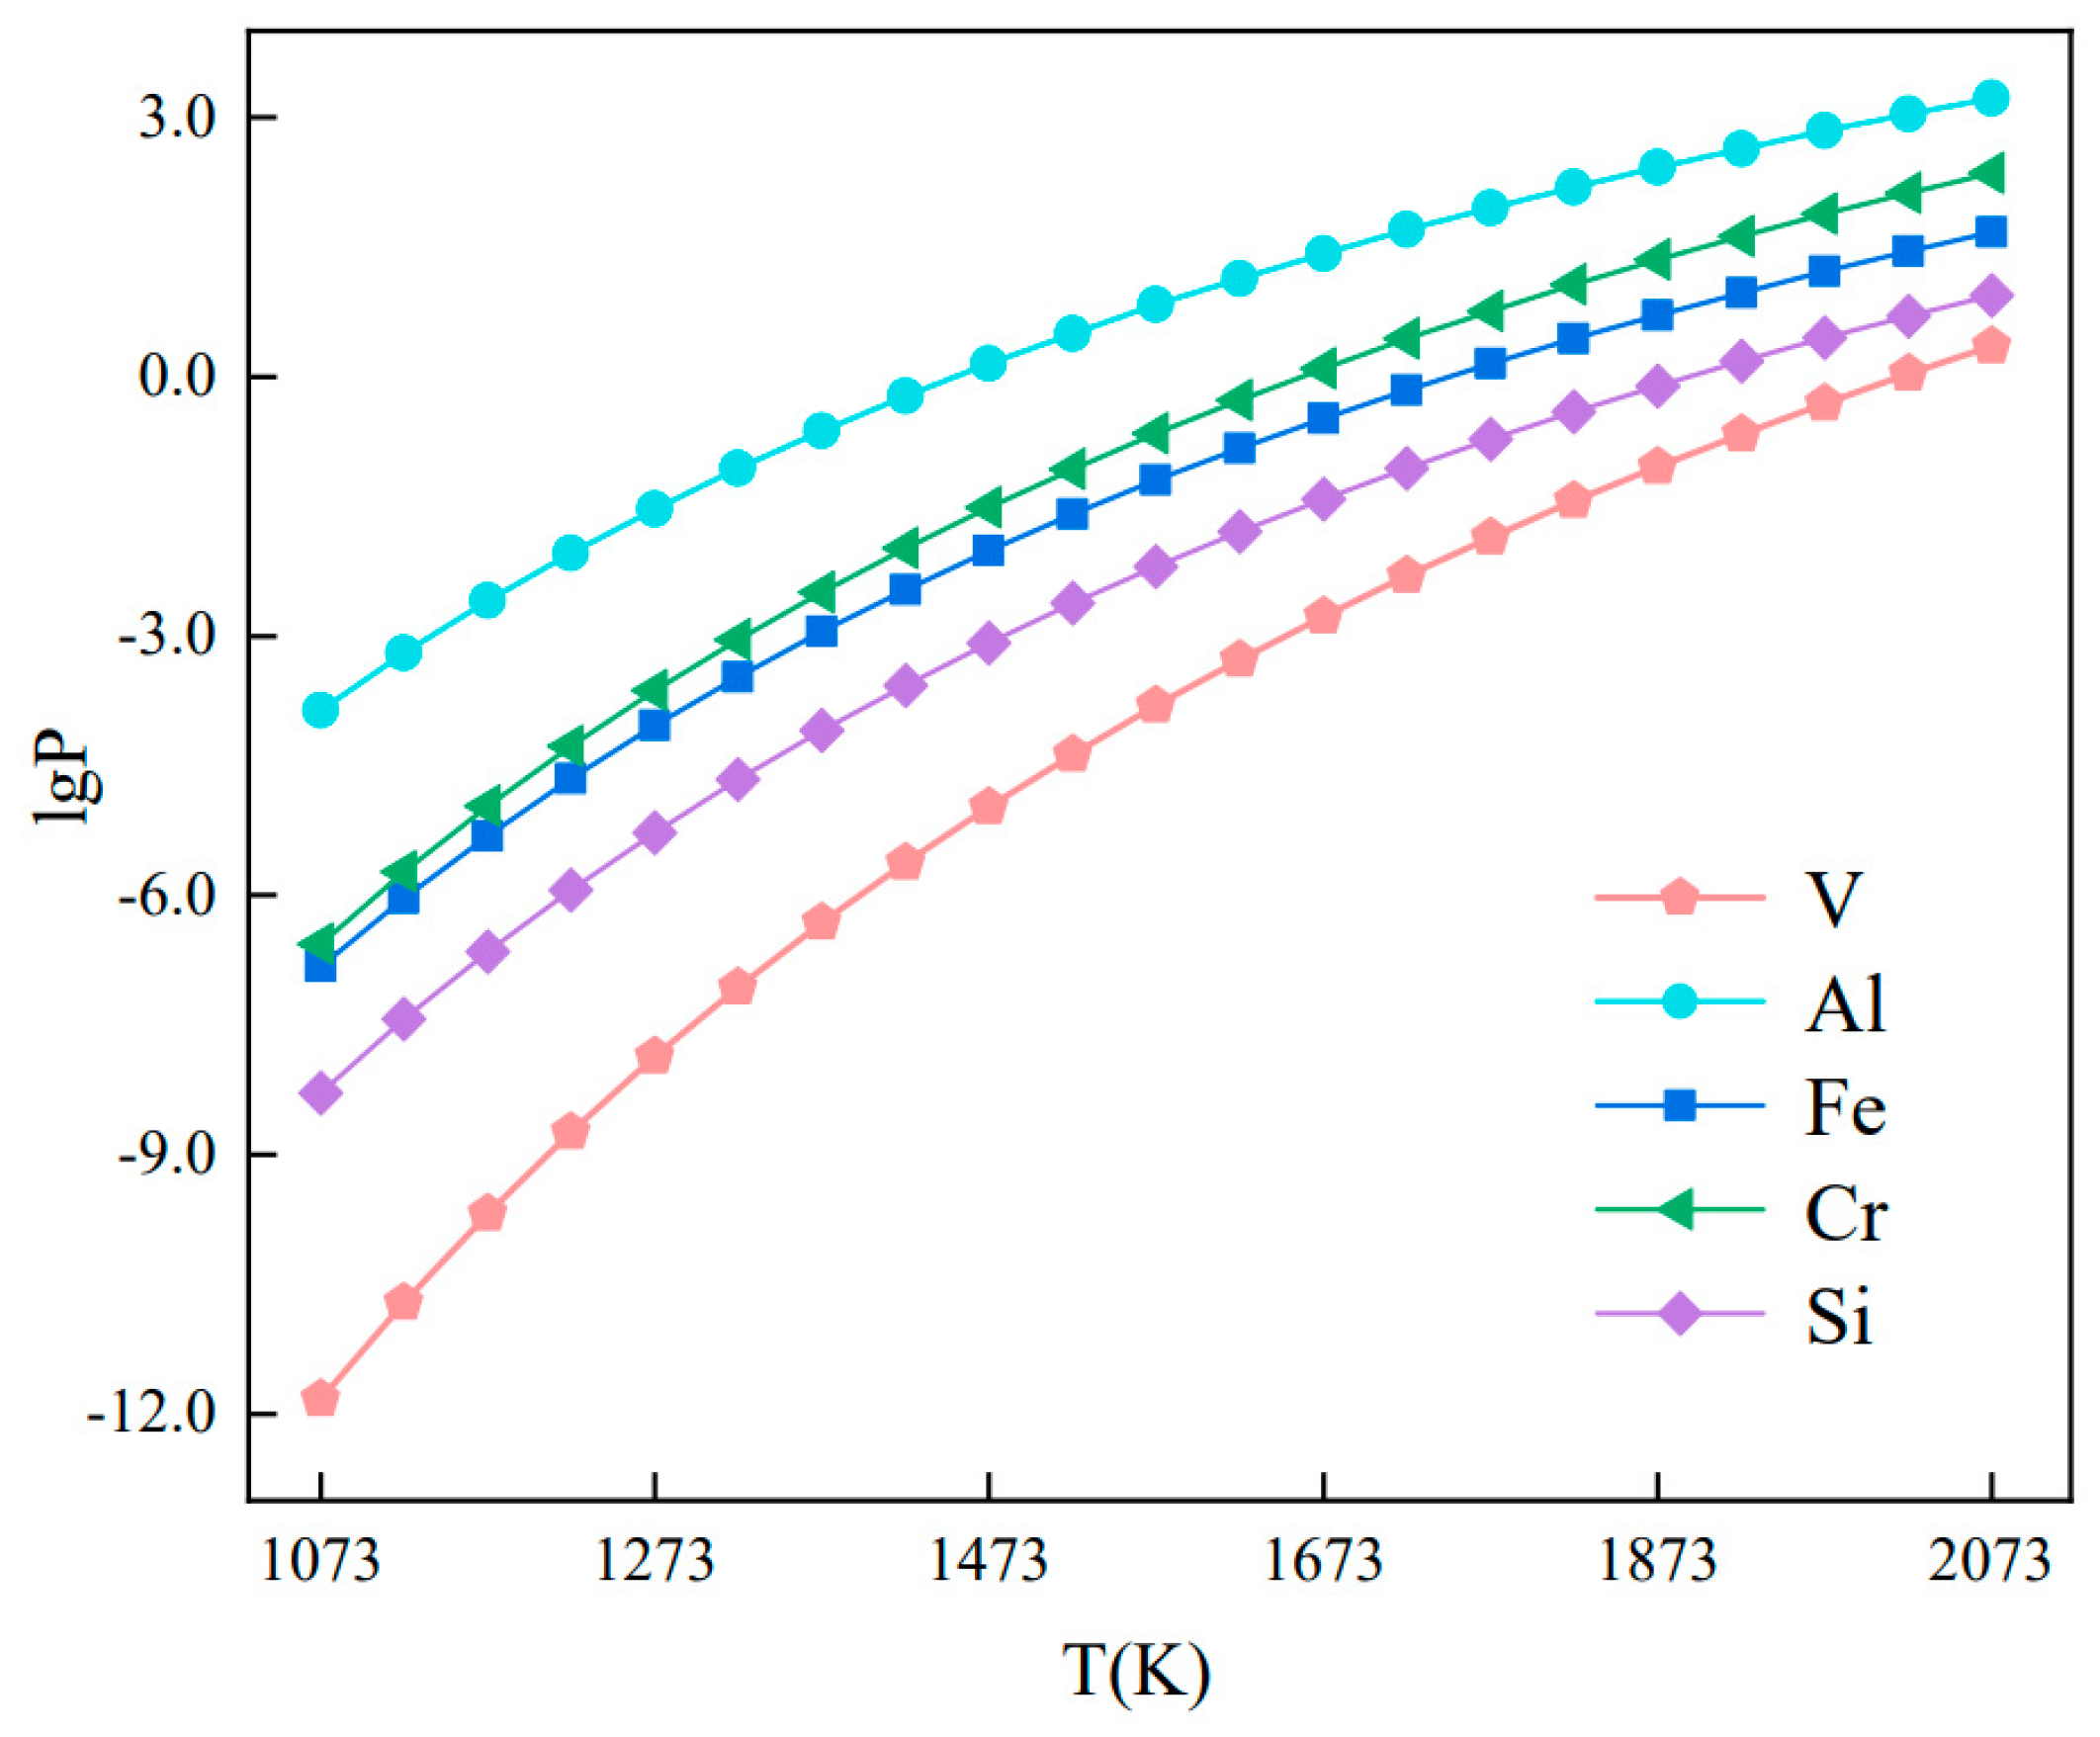
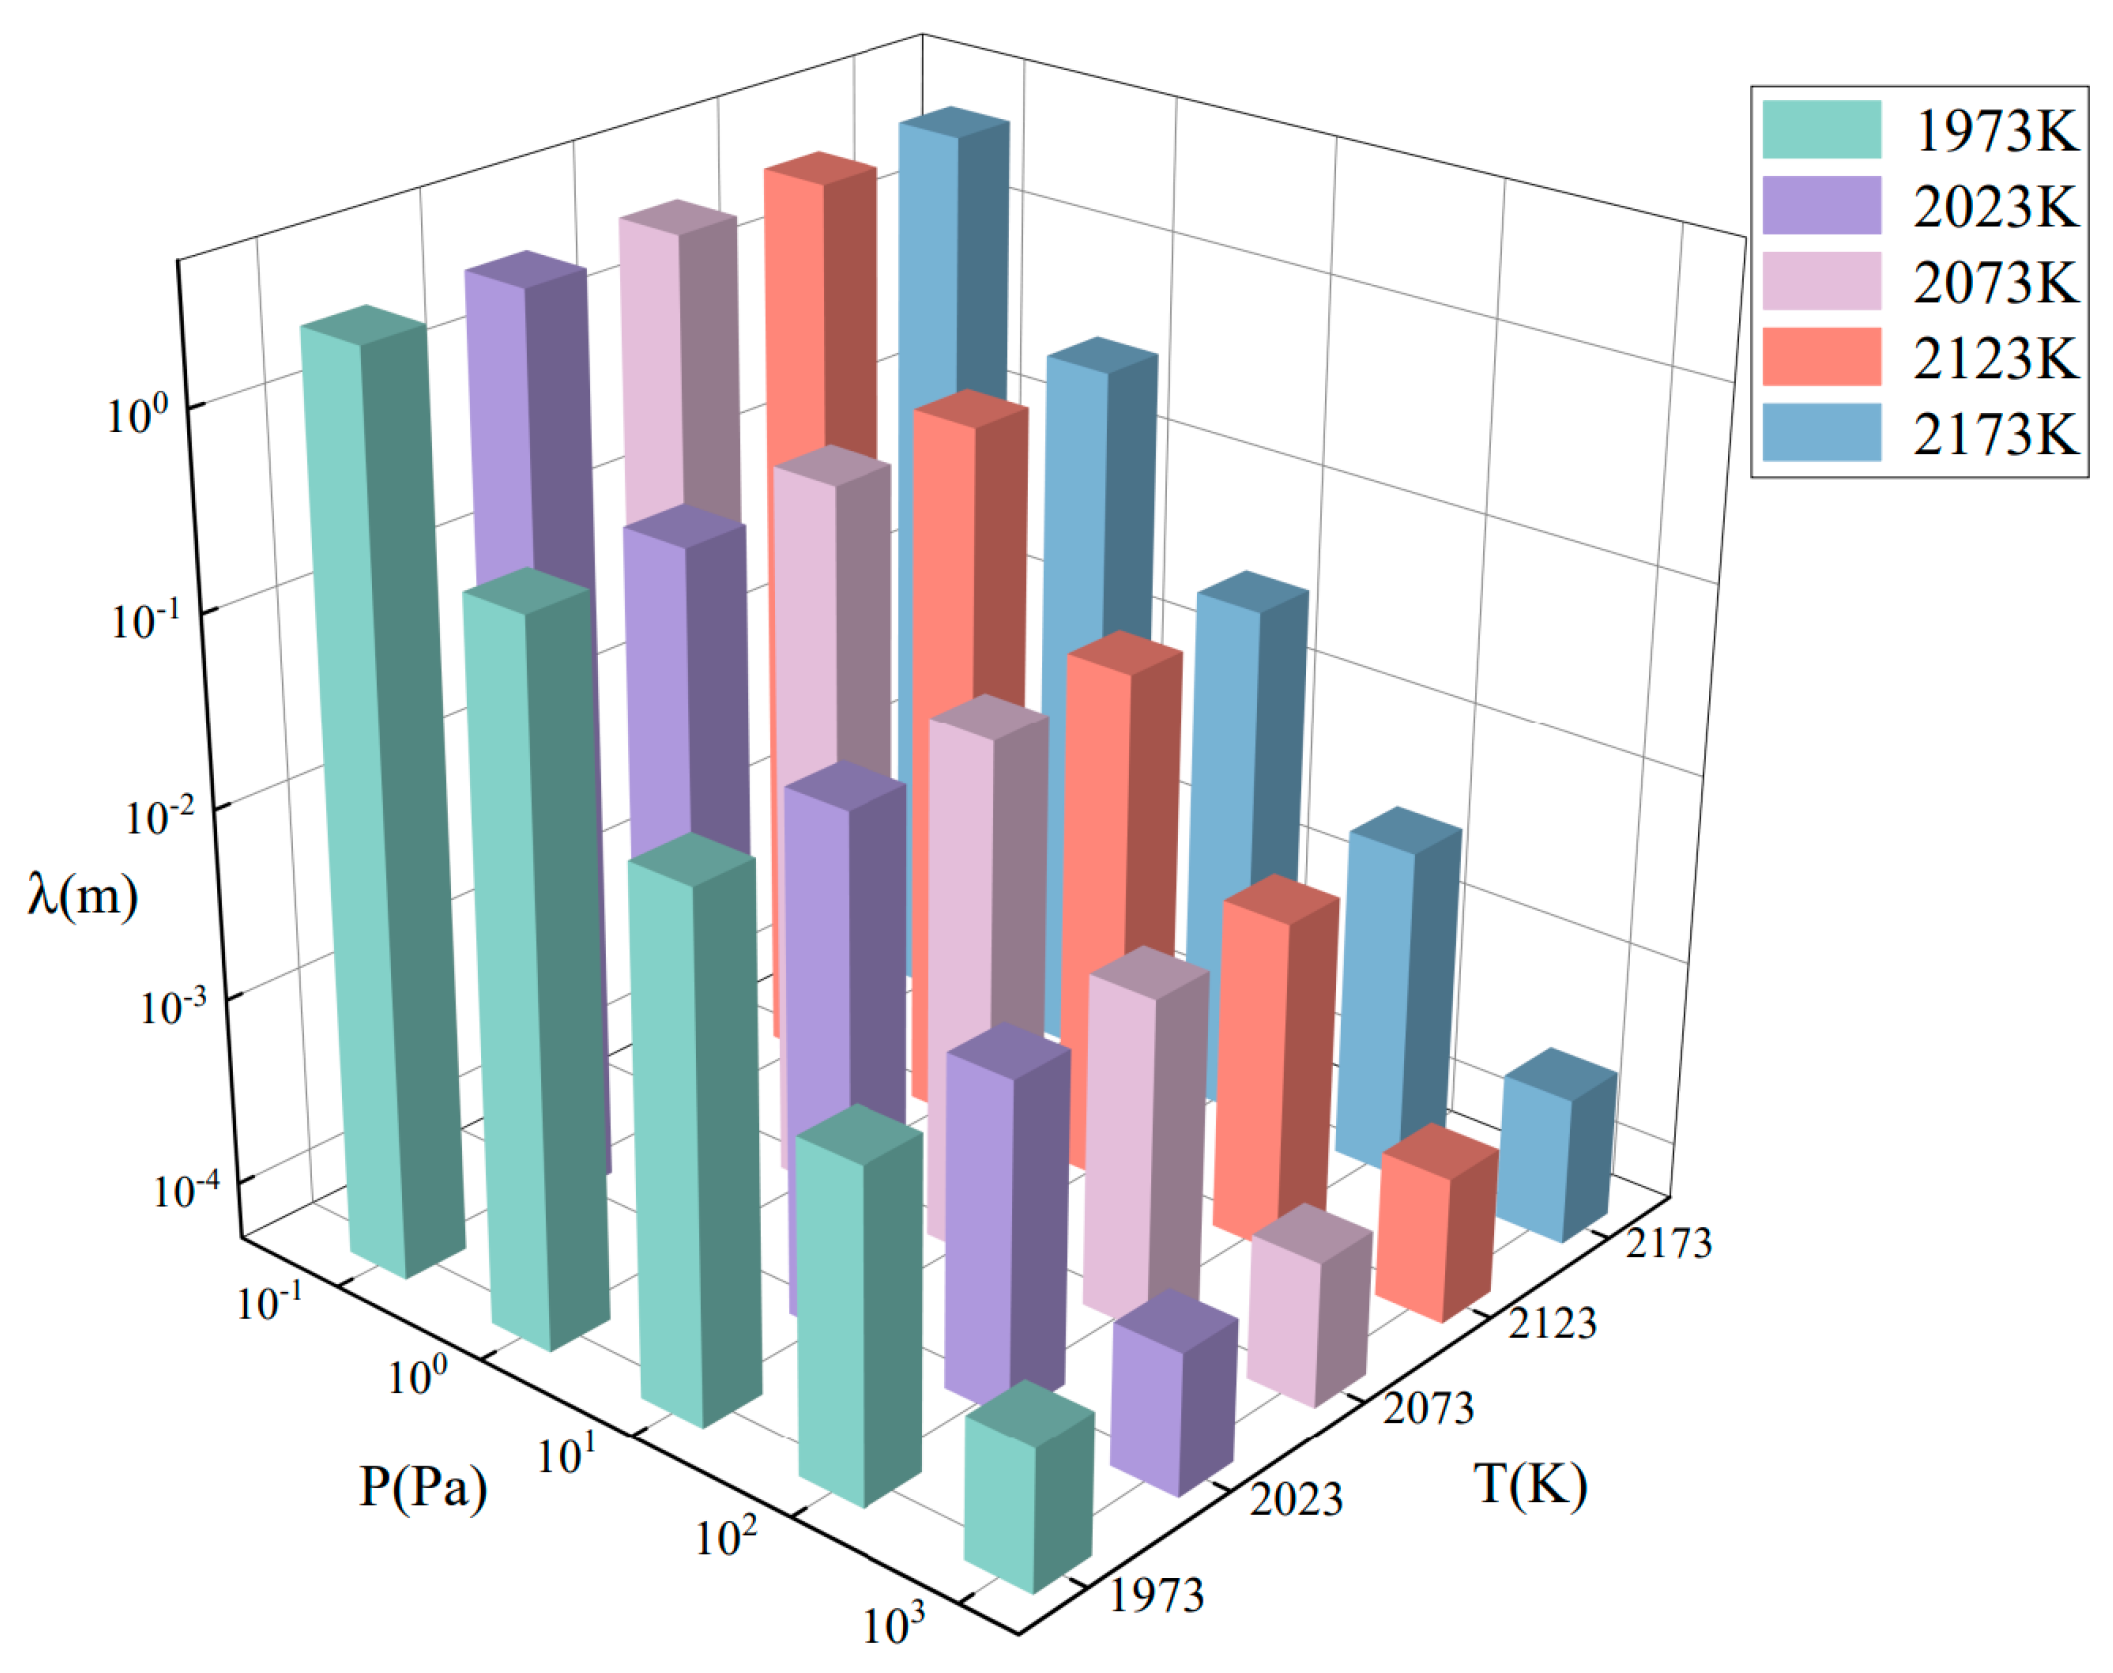
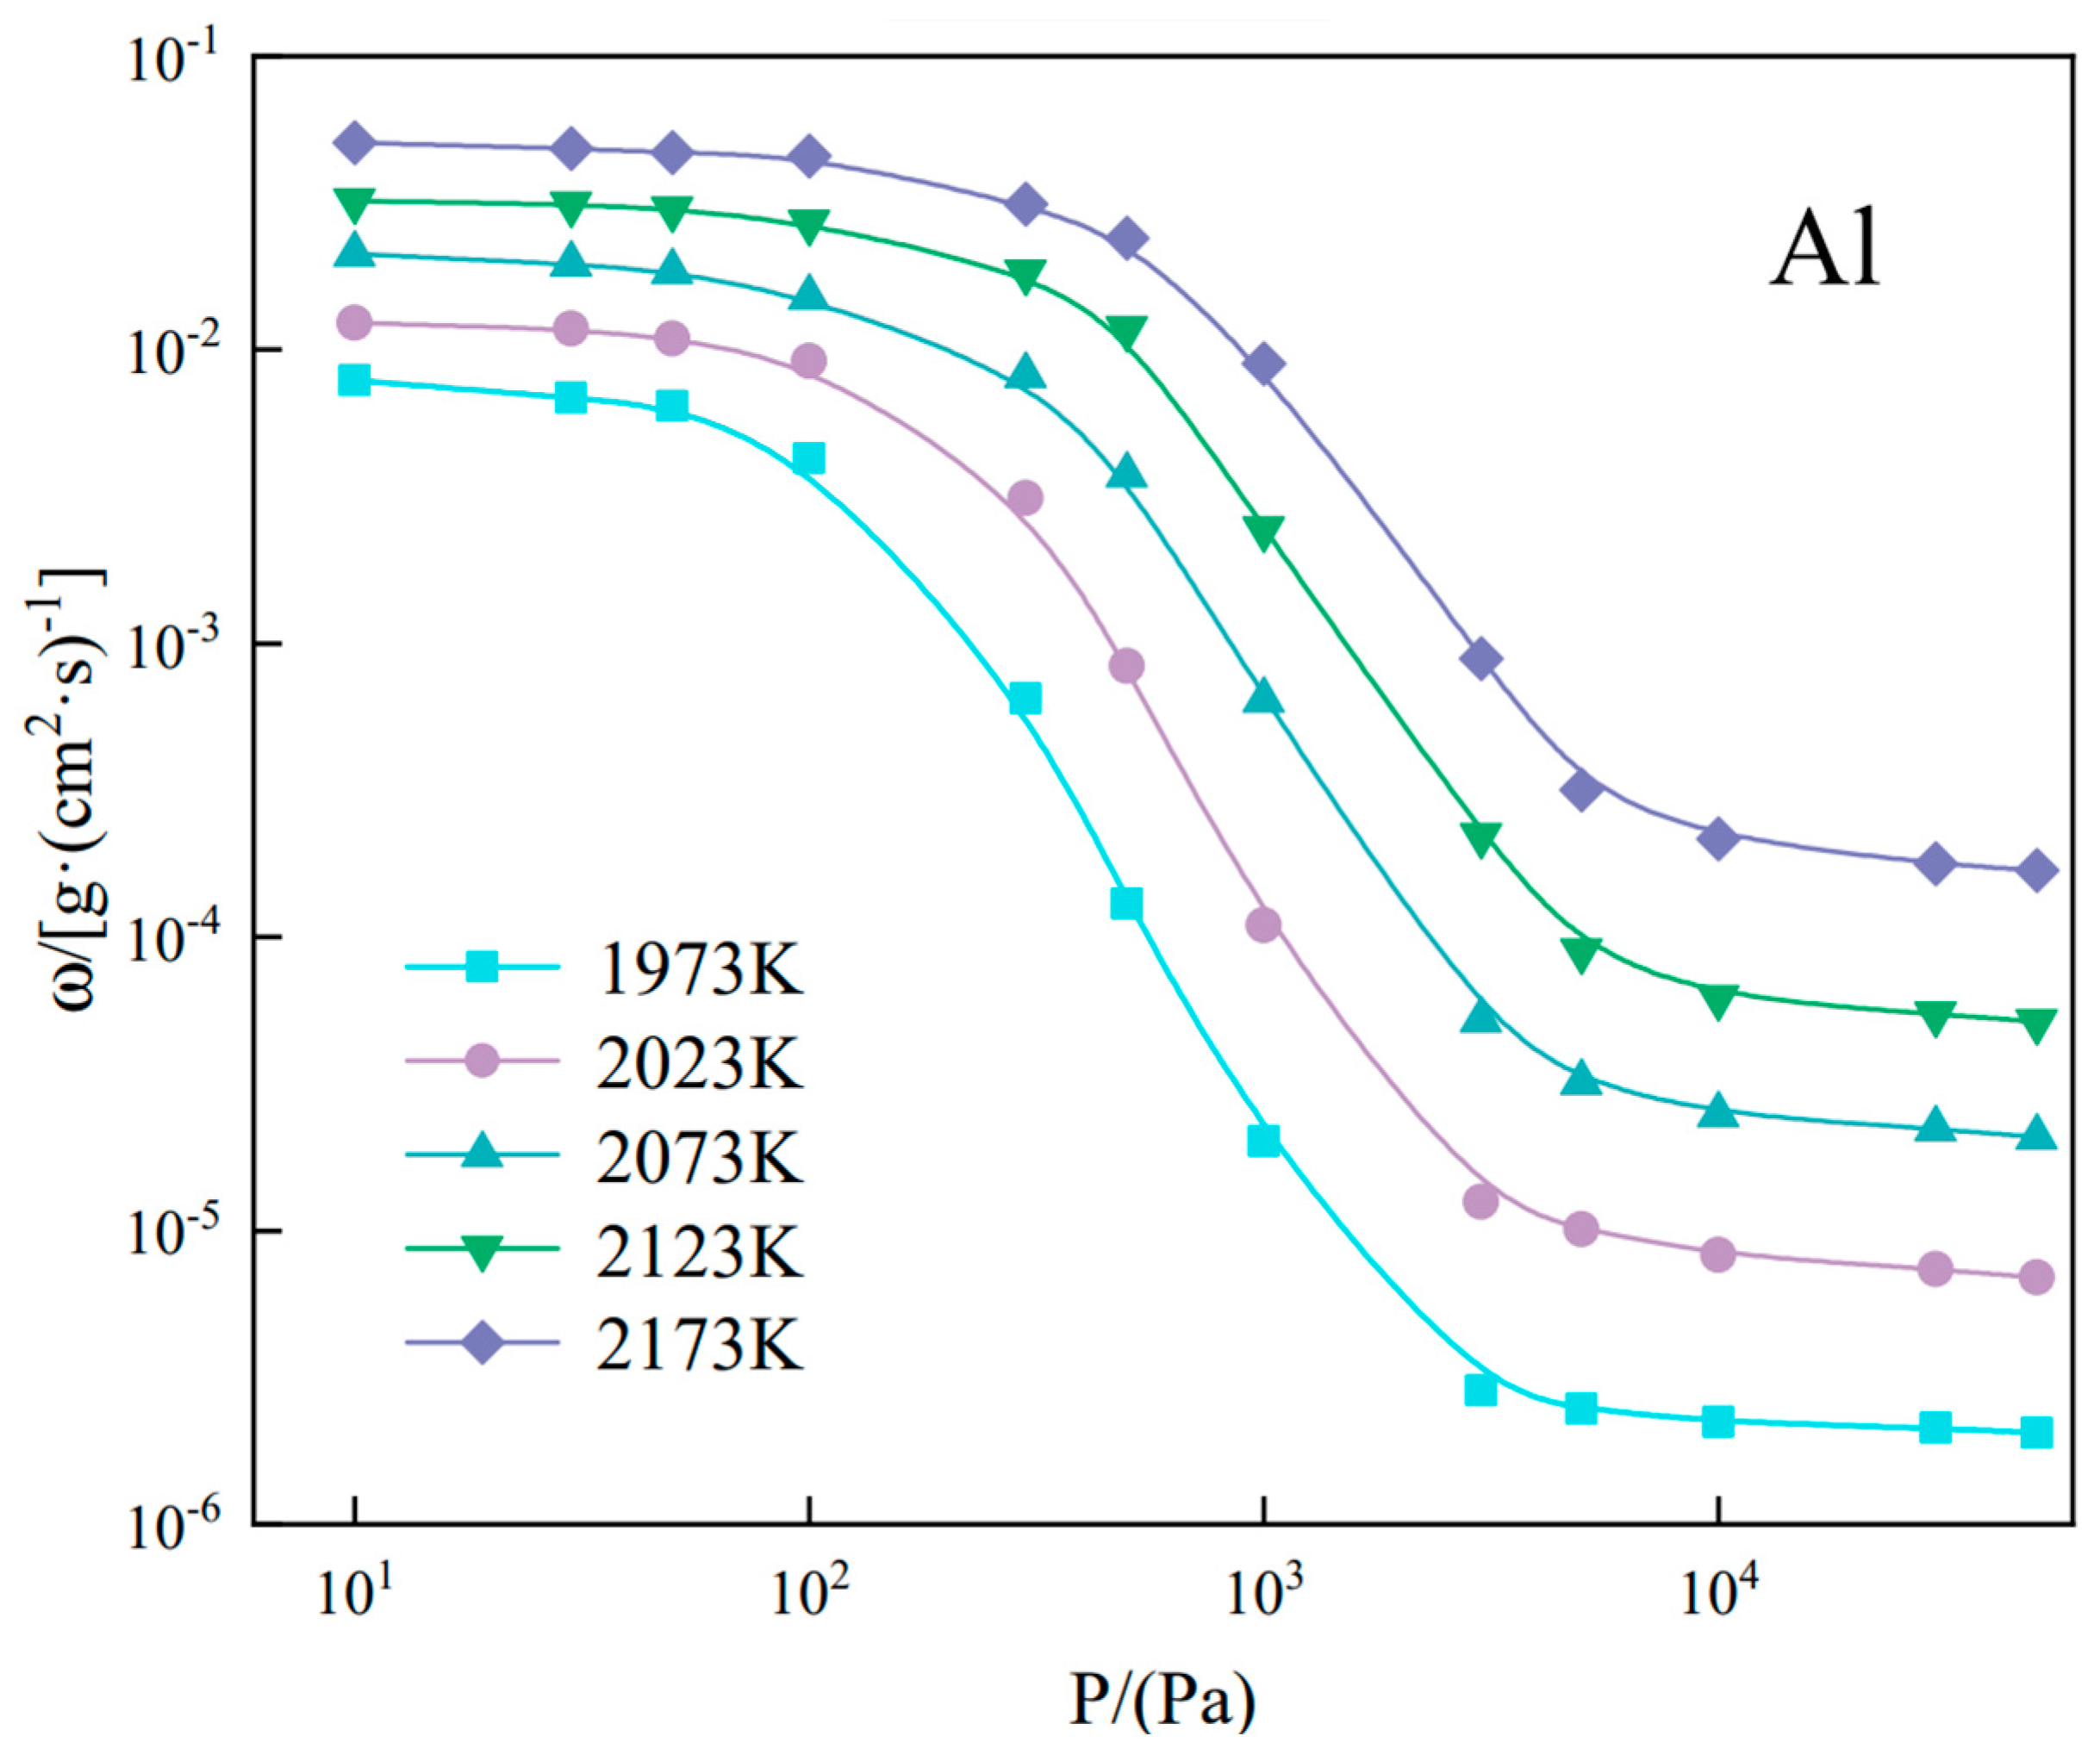
3.1.1. Saturated Vapor Pressure and Molecular Free Path of Al

In the alloy refining process, Al is the main additive material. At the same temperature, the higher the saturated vapor pressure P of the component, the easier it is to volatilize. The relationship between the P (Pa) of a pure substance and temperature T (K) can be expressed as in Equation (1) [14]:
lg P = AT 1 + B lg T + CT + D
where A, B, C, and D are evaporation constants, which can be obtained from the literature.
The saturation vapor pressure equations for each element are shown in Table 2 [15]. The relationship between the P and T of each element in AlV55 alloy is shown in Figure 4.
Because Al has the highest P among the main elements of the Al-V alloy and the melting point of the alloy is much higher than that of Al (Figure 5), the refining temperature must meet the melting points of both the Al-V alloy and Al particles; hence, the smelting temperature must be higher than the melting point of the alloy. At this temperature, Al inevitably evaporates during smelting.
Gas molecules often collide with each other. The path through which a molecule collides with other gas molecules twice in a row is called the free path. According to the average number of molecular collisions within 1 s, the distance moved by a molecule in 1 s is equal to v. The average molecular free range λ can be calculated, as shown in Equation (2) [16]:
Λ = v Z = 1 2 π d 2 n = 3.107   ×   10 24   T P d 2
where Z is the average number of collisions (s−1), d is the molecular diameter (m), n is the molecular density of the gas (cm−3), P is the gas pressure (Pa), and T is the thermodynamic temperature (K). According to the literature [17], the Al gas molecule is a monoatomic molecule, and its d is equal to its atomic diameter (i.e., d = 1.43 × 10⁻¹⁰ m). By substituting these parameters into Equation (2), the molecular free path of the Al molecules at different T and P can be calculated as shown in Figure 6.
The evaporation mode can be determined by comparing λ and the distance L between the evaporating and condensing surfaces. When λL, the evaporation mode is general evaporation; when λ < L, the evaporation mode is boiling evaporation; finally, when λ > L, the evaporation mode is molecular evaporation. The system pressure and evaporation rate of metal elements are negatively correlated; that is, the higher the system pressure, the slower the evaporation rate. Therefore, the evaporation of Al must be controlled to general evaporation to reduce both the evaporation loss of Al and the amount of Al added to the reaction system.

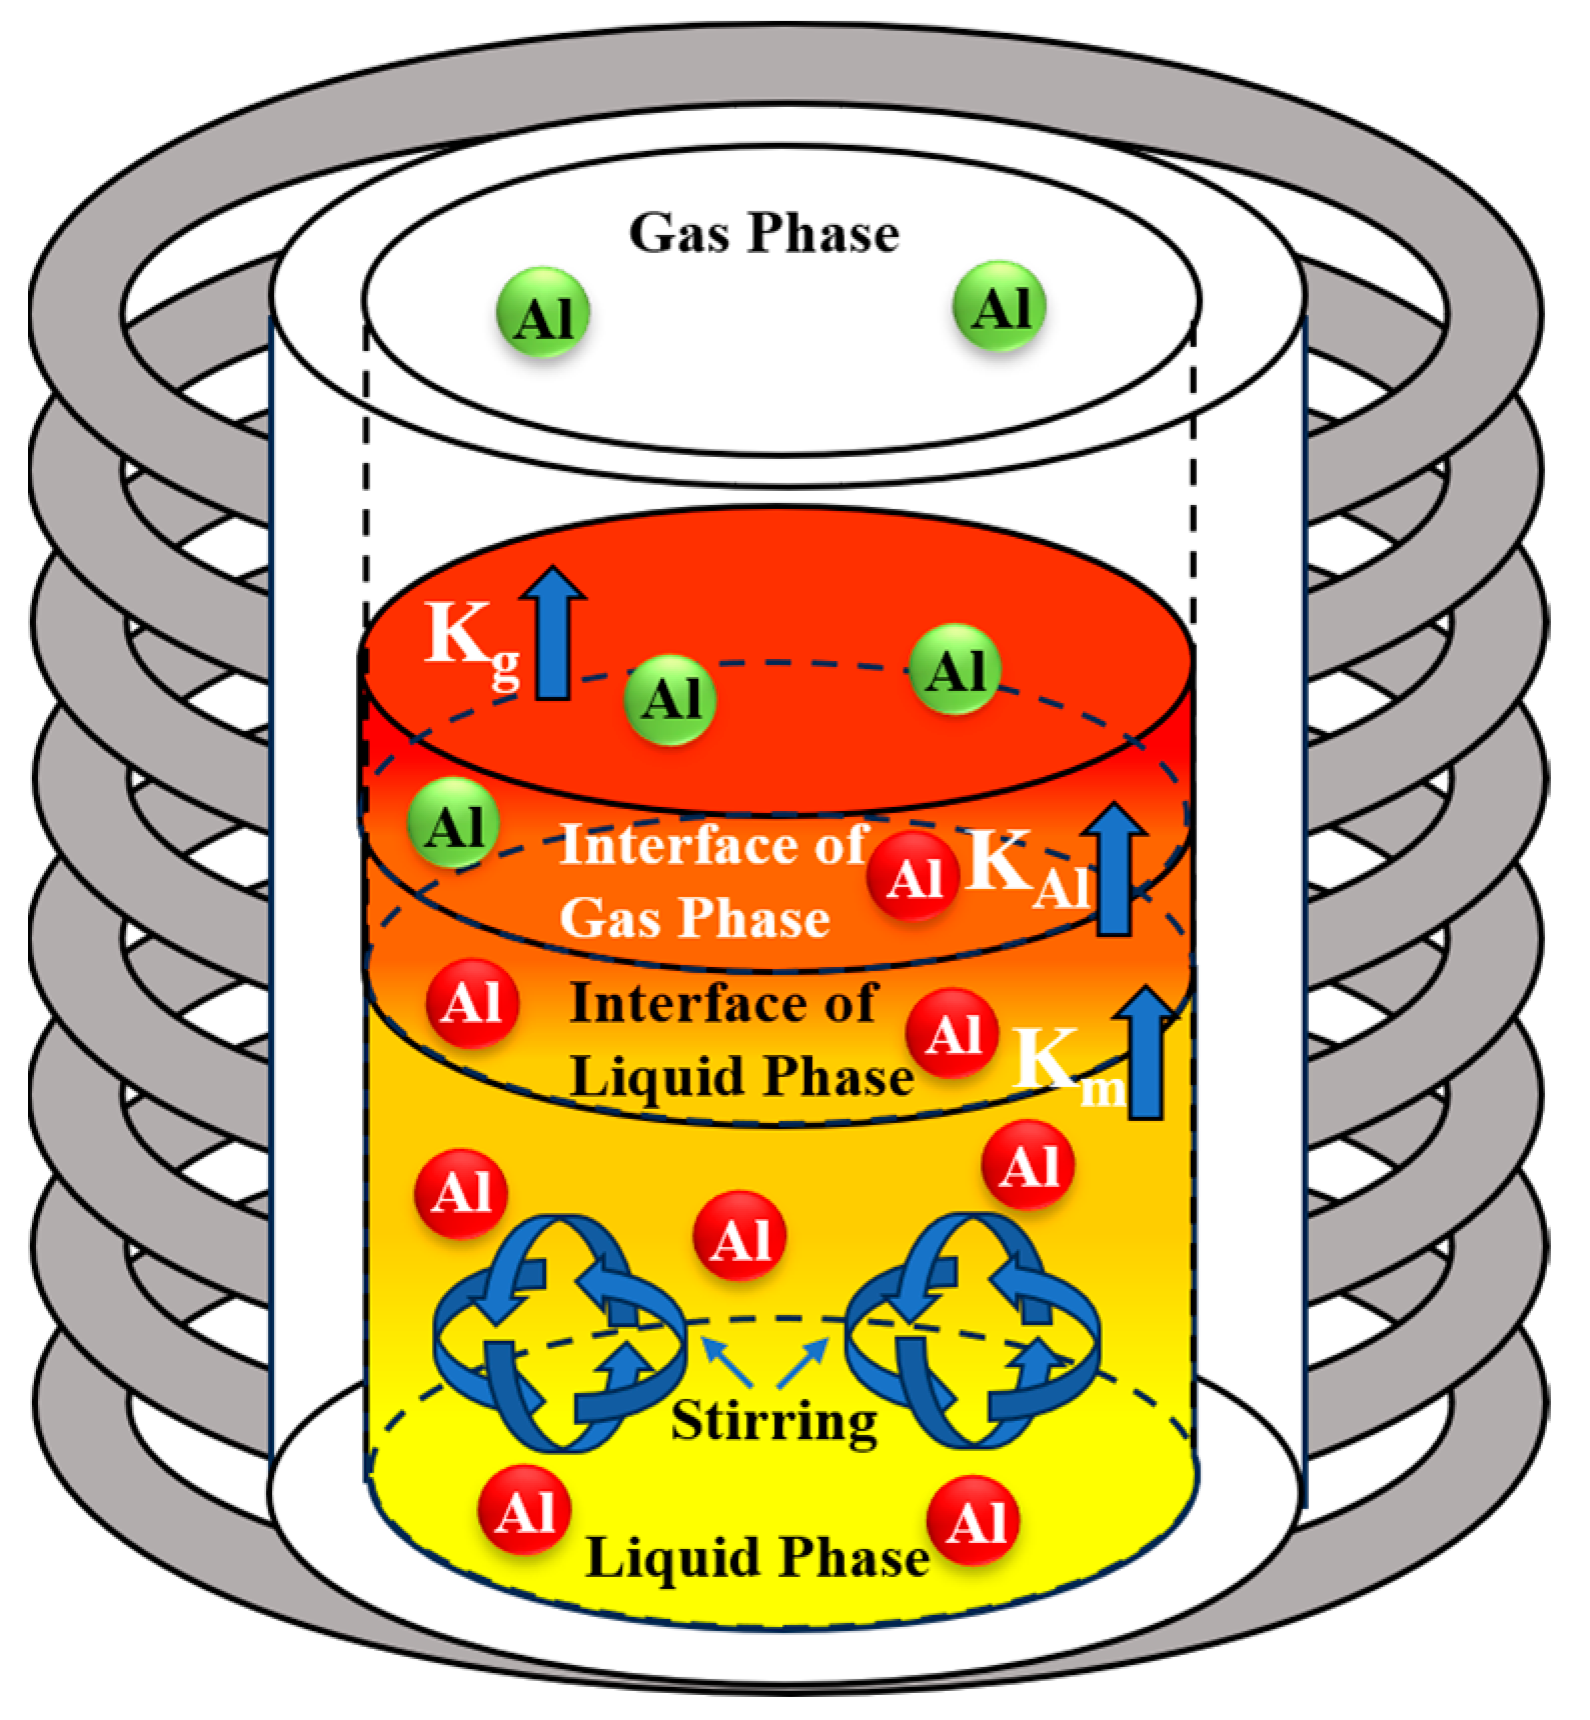
3.1.2. Evaporation Kinetics of Al in the Alloy

The spatial process of material evaporation essentially involves the movement of molecules in the evaporated material. The continuous motion and constant collision of evaporated molecules are the most fundamental features of the evaporation process. The evaporation of Al from the alloy, which is illustrated in Figure 7, consists of four steps [18]:
(a)
Diffusive mass transfer during the movement of atoms inside the Al melt to the surface, Km;
(b)
Interfacial mass transfer during the movement of Al molecules across the melt surface to the gas phase, KAl;
(c)
Gas-phase mass transfer during the movement of Al molecules across the melt surface toward the condensation disk, Kg; and
(d)
Coalescence of Al molecules on the condensation surface.
During induction furnace melting to prepare AlV55 alloys, the furnace chamber size is large, and the Al molecules evaporate during the melting process and condense on the furnace wall; therefore, the condensation process is not the limiting step.
According to Fick’s first law [19], the mass-transfer rate of element A through diffusion across a liquid boundary layer can be expressed as in Equation (3):
JL = Km (CACAi)
where CA is the molar concentration of element A in the melt, CAi is the molar concentration of element A at the surface, and JL is the liquid-phase mass-transfer coefficient (cm/s).
The concept of boundary layer thickness is required to calculate the liquid-phase diffusion coefficient according to Fick’s first law [20]. The melt is affected by induction stirring, which is in line with the application scope of the Machlin model [21]; therefore, the mass-transfer coefficient can be expressed as in Equation (4):
K m = 2 g ( 2 Dv / π r ) 1 / 2
where D is the diffusion coefficient of the evaporating element (m2/s), v is the flow velocity of the melt in the liquid boundary layer (m/s), and r is the effective radius of the crucible (m). In this study, r = 0.06 m.
During induction melting, the agitation effect, D, V, and melt temperature increase with increasing input power. According to the literature [22], V is linearly related to the melt temperature T, which can be approximately expressed by Equation (5):
V = V 1 + ( V 2 V 1 ) × T T 1 300
where T1 is the melting point of the alloy and V1 and V2 are the surface velocities of the melt at the corresponding temperatures. According to the literature [23], V1 = 0.06 m/s and V2 = 0.21 m/s.
A formula proposed in the literature was used to calculate the diffusion coefficient of Al in the liquid phase [24], which can be expressed as in Equation (6):
D Al = 10 8 exp [ 25000 R 1 1925 1 T ]
The maximum evaporation rate of element A under absolute vacuum conditions can be expressed using the Langmuir formula [25], as shown in Equation (7):
J E =   α P Ae 2 π RTM v 1 / 2
where π and R are thermodynamic constants, Mv is the molecular mass of V, T is the melt temperature (K), and α a is the evaporation coefficient, for metals, which is taken as 1. PAe is the equilibrium saturated vapor pressure of element A on the melt surface and can be calculated using Equation (8) [26]:
P Ae = P A O γ A x Ai
where γA and xAi are the activity coefficient of element A in the melt and the molar fraction concentration of A on the surface of the melt, respectively, which can be obtained from the phase diagram [27]. According to the literature [28], xAi can be calculated using Equation (9).
x A i = M V ρ V C A l
Substituting Equations (8) and (9) into Equation (7) yields:
J E = α P A O γ A M V ρ mix 2 π RTM i 1 / 2 C Al
Based on Equation (10), the evaporation rate constant is defined by Equation (11):
K Al = α 2 π RTM i 1 / 2
where KAl is the mass-transfer coefficient of interfacial volatilization, MV is the molecular mass of V, and ρmix is the melt density of the matrix alloy.
The theoretical density of the alloy can be obtained by weighing the density of each metal in the alloy [29], which is mainly affected by temperature. According to the literature, ρmix can be calculated using Equation (12):
ρ m i x = c i A i c i A i ρ i
where ci is the atomic fraction of the ith element, Ai is the atomic weight of the ith element, and ρi is the density of the ith element, which is calculated using Equation (13) [30]:
ρ i = ρ m + a ( T T m )
where ρm is the density of the metal at the melt temperature Tm and a is the temperature coefficient of the density of the liquid metal. According to the literature [31], ρAl = 2.38 × 10³ kg/m3, ρAl = 5.36 × 10³ kg/m3, aAl = 3.5 × 10⁻¹, and aV = 3.2 × 10⁻¹.
The mass-transfer rate of evaporated substance A through the gas boundary layer can be expressed by Equation (14) [32]:
J E = K g R T ( P A i P A )
where Kg is the mass-transfer coefficient in the gas phase, R is a thermodynamic constant, T is the melt temperature, PAi is the partial pressure of volatile component A in the gas-phase boundary layer, and PA is the partial pressure of volatile component A in the main body of the gas phase. According to the literature [33], the flux of metal elements diffused away per unit area per unit time (g/s·cm2) can be expressed as in Equation (15):
ω m = α ( P Ai P ) M 2 π RT
where α is the evaporation coefficient, which is generally taken as 1, M is the molecular weight (g/mol), and P is the system gas pressure.
According to this definition, the mass-transfer rate in the gas phase can be expressed by Equation (16) [34]:
K g = ω m RT ( P Ai P A )
According to the theoretical calculations, the evaporation of Al from the alloy is primarily affected by the pressure and temperature of the system. In the calculations, the temperature was set to 1923–2173 K, with a gradient of 50 K, and the pressures were set to 101, 102, 103, 104, and 105 Pa. The diffusion coefficients and interfacial evaporation mass transfer rates of Al atoms in the liquid phase are listed in Table 3 and Table 4, and the mass-transfer coefficients of Al in the gas phase are listed in Table 5.
During alloy smelting, the evaporation speed of the metal component is determined by the slowest migration rate of the three stages. In the third stage of gas-phase mass transfer, the mass-transfer rate of Al is affected not only by the temperature but also by the system pressure; therefore, this property must be discussed in terms of their classification. The mass transfer characteristics of the alloy can be observed in Table 3, Table 4 and Table 5.
When the system pressure is low (103 Pa or below) and the temperature is below 2023 K, Km   Kg   >  KAl, and mass transfer is limited by both interfacial volatilization and gas-phase diffusion. When the temperature is above 2023 K, Km >  Kg  KAl, and mass transfer is controlled by gas-phase diffusion.
When the pressure is high (103 Pa or above), Km  >  Kg   KAl at all temperatures; thus, mass transfer is controlled by gas-phase diffusion.

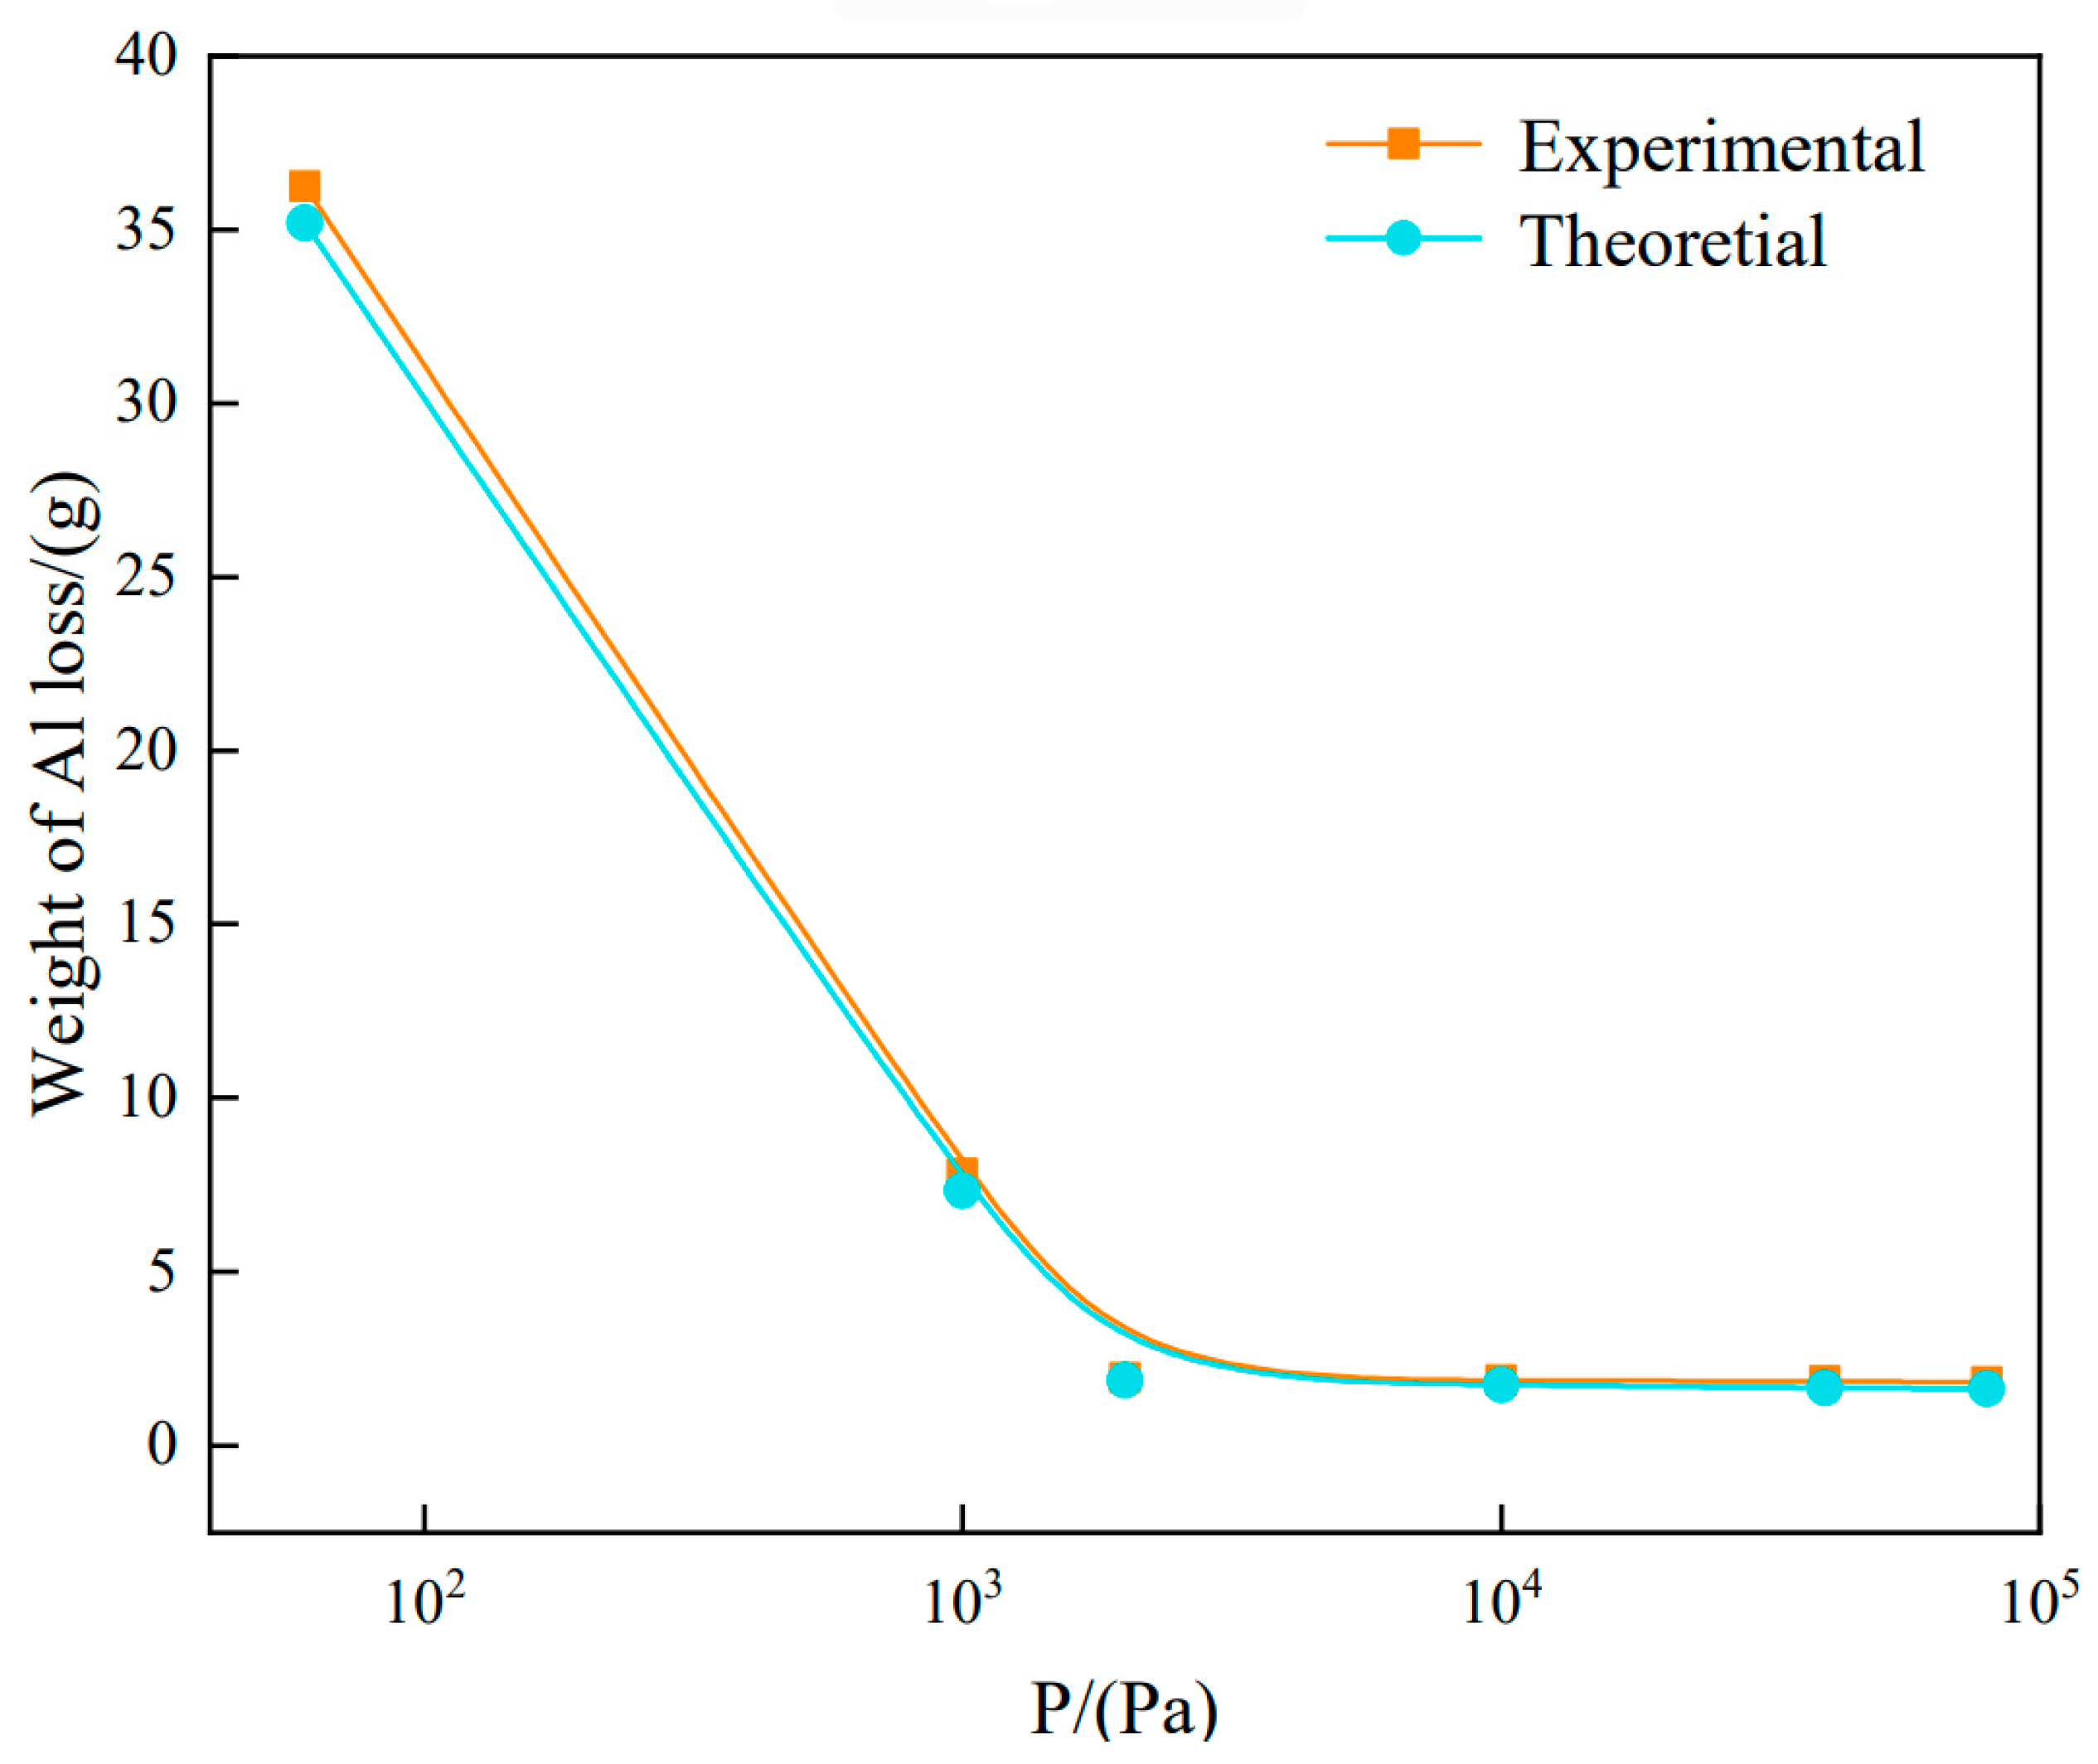
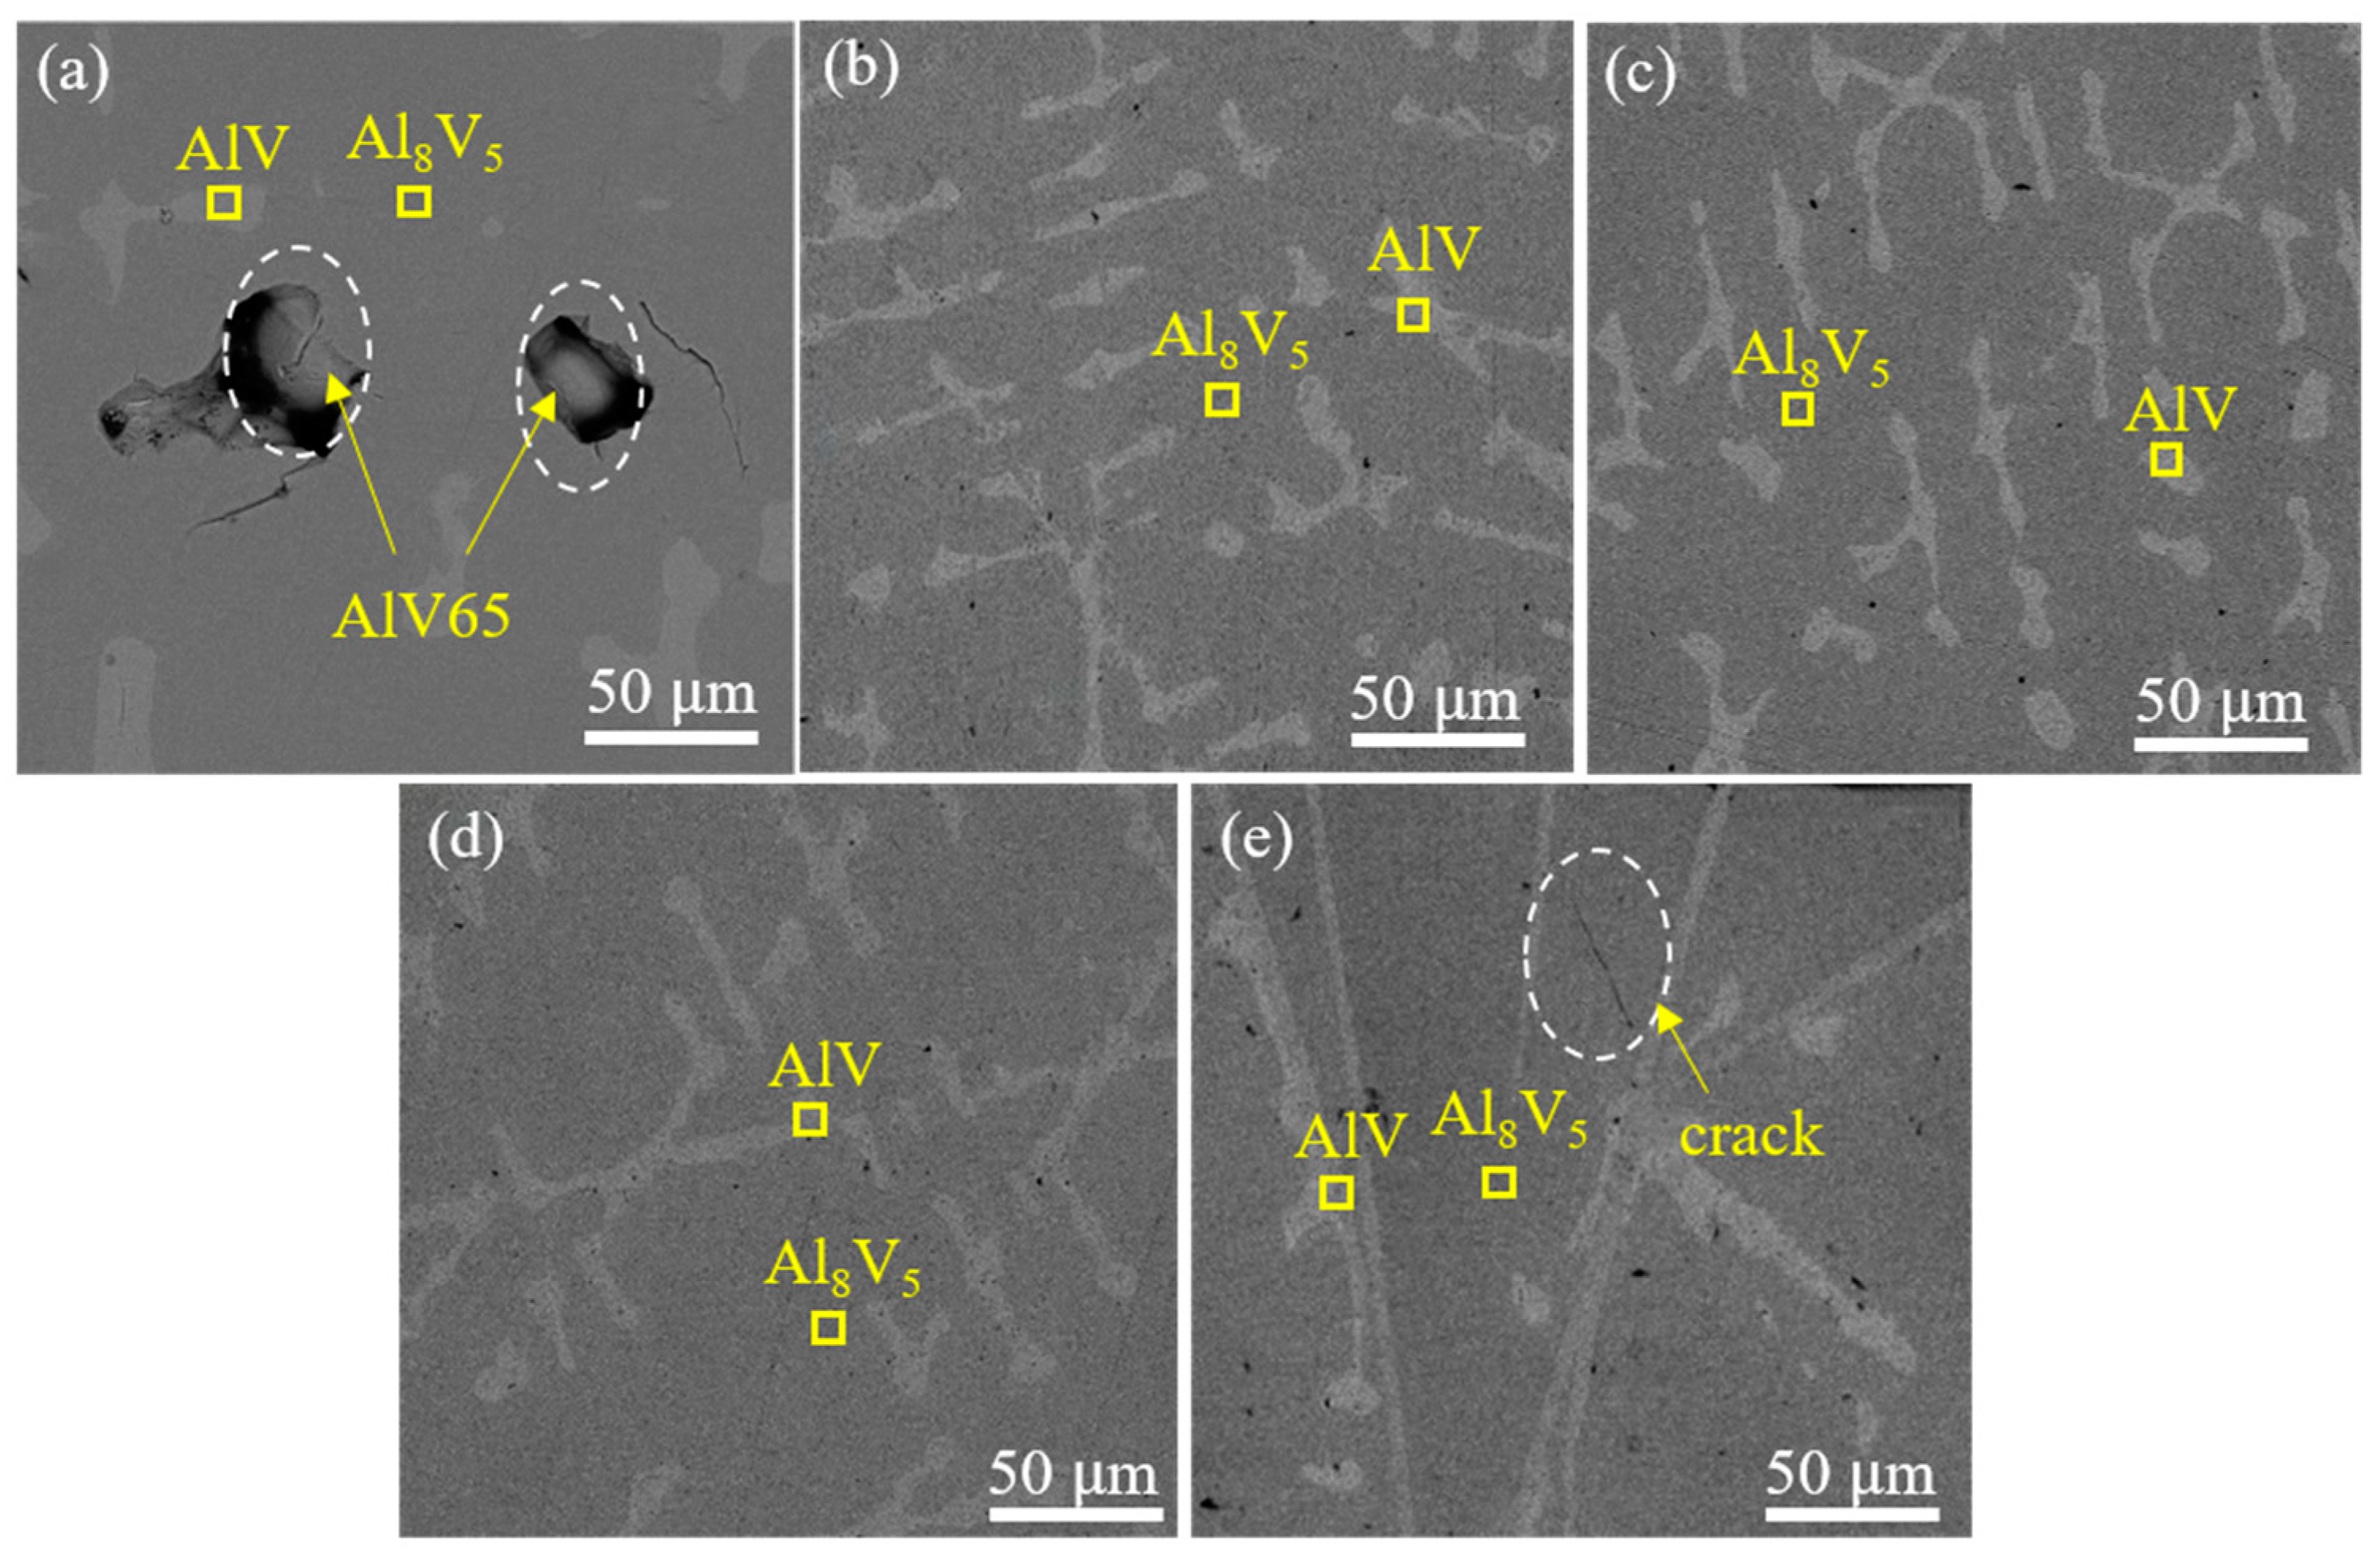
3.2. Effect of Pressure on the AlV55 Alloy

In this study, AlV65 alloy particles with diameters of 10–20 mm were used in the melting experiments. The diameter of the Al particles was also in the range of 10–20 mm. The experimental conditions are listed in Table 6.
The XRD pattern of the AlV55 alloy product is shown in Figure 8. The alloy product is composed of AlV and Al8V5 phases. Figure 9a shows an SEM image of the alloy product, and Figure 9b,c show the EDS results of the spot analysis of the alloy. The mass ratios of Al and V in the light phase are 67% and 33%, respectively, and the atomic ratio in this region is close to 1:1, which is consistent with the characteristics of the AlV phase. The mass ratios of Al and V in the dark phase are 55% and 45%, respectively, and the atomic ratio in this region is approximately 6:5, which is consistent with the characteristics of the Al8V5 phase. These findings are consistent with the XRD results. Therefore, the transformation process of alloying compounds in the Al-V alloy is Al→AlV→Al8V5.
Figure 10 shows the evaporation rates of Al in the alloy under different pressures and temperatures. The mass loss and corresponding percentage of Al in the alloys melted under different pressures were obtained experimentally, as shown in Figure 11. When the smelting pressure is 60 Pa, the loss of raw material is 36.24 g, which accounts for 11.48% of the added raw material. When the smelting pressure is 2000 Pa, the loss of raw material is 1.94 g, which accounts for 0.58% of the added raw material. Moreover, under high-vacuum conditions, the evaporation rate is only 5%. When the system pressure is higher than 2000 Pa, further increases in system pressure do not significantly reduce the evaporation loss of Al but increase the required amount of Ar gas, which is not conducive to cost control. Therefore, the optimal melting pressure is 2000 Pa.

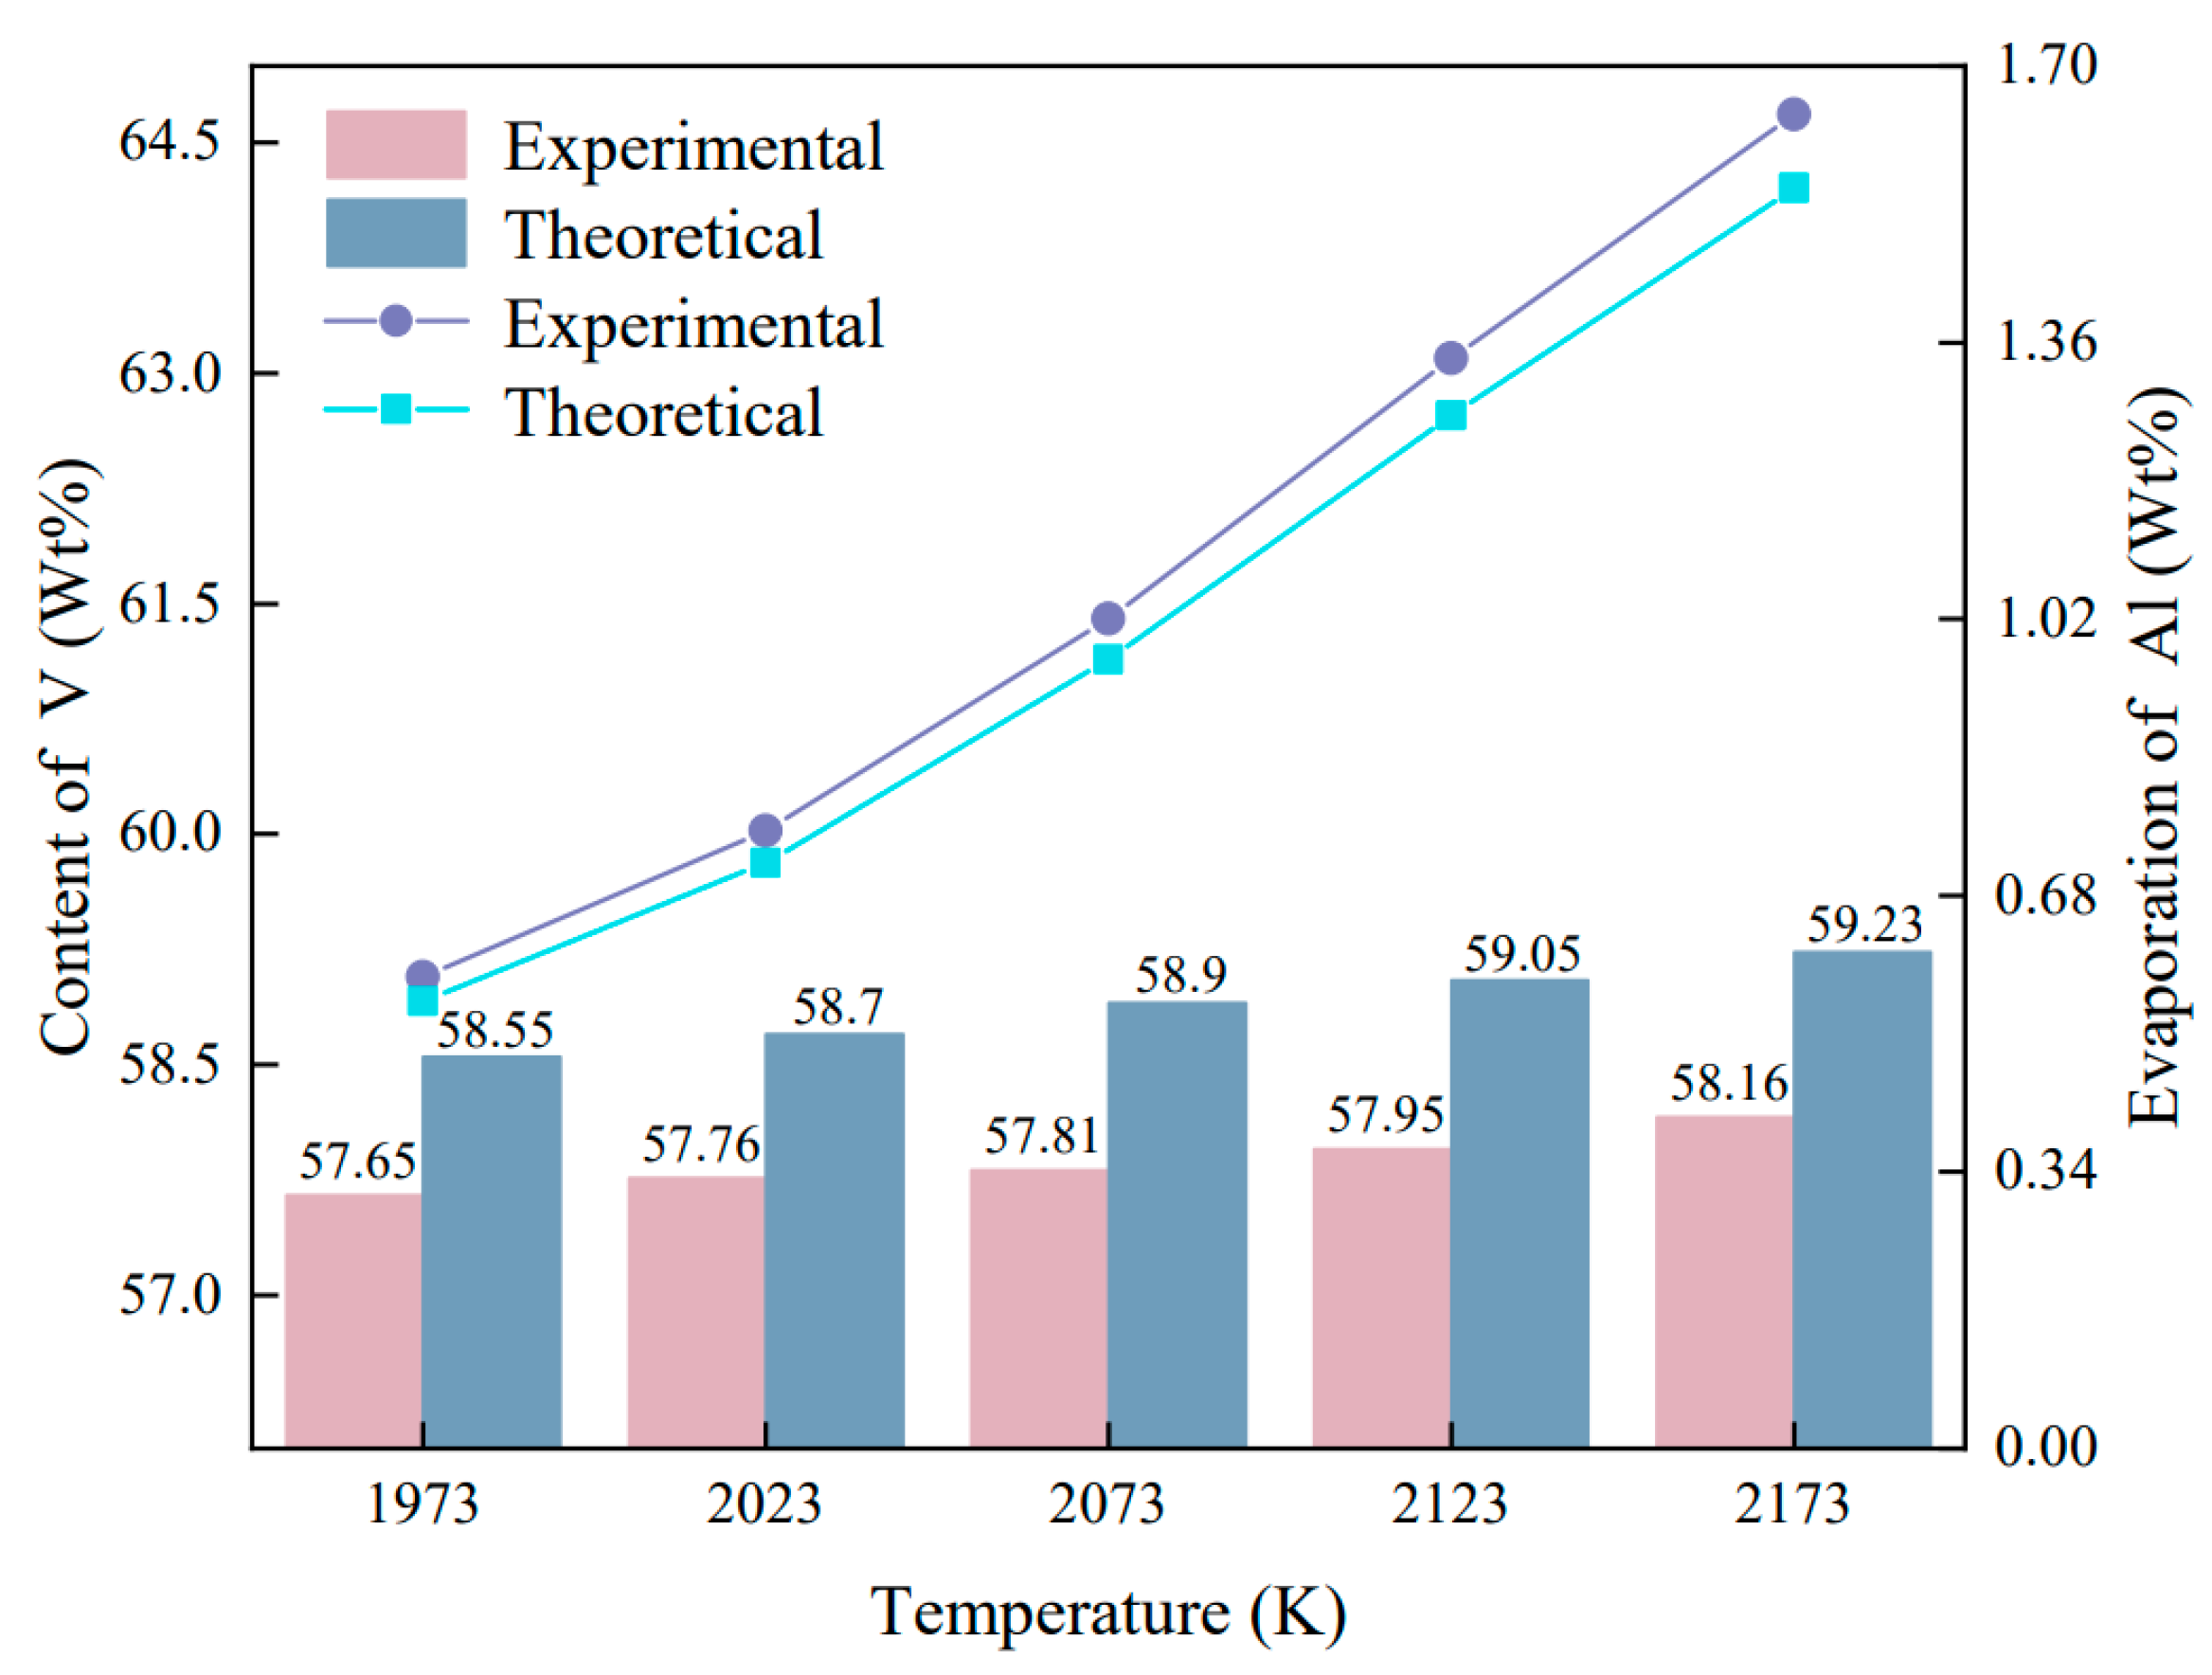
3.3. Effect of Temperature on the AlV55 Alloy

The influence of different temperatures on the refining process was investigated. According to the phase diagram of the Al-V alloy, the experimental temperature was set to 1973–2173 K, the furnace pressure was set to 2000 Pa, and the holding time was set to 10 min. The experimental conditions are listed in Table 7. The evaporation loss and loss rate of Al as well as the V content of the alloy product were calculated as a function of temperature, as shown in Figure 12. The V content of the product increases with increasing temperature because the evaporation of Al increases, and thus, the Al content of the product decreases under this condition, which is consistent with the theoretical calculations. Figure 13 shows SEM images of the alloy product obtained at different temperatures. When the melting temperature is 1973 K, spherical AlV65 alloy particles that are not completely dissolved remain in the alloy. When the temperature is set to 2023–2123 K, dendritic AlV phases are uniformly distributed in the matrix Al8V5 phase in the alloy. When the temperature reaches 2173 K, some AlV phases are transformed into Al8V5 phases, resulting in a rapid reduction in V content, cracks in the alloy products, and an increase in the content of nonmetallic impurities in the final products. Therefore, the optimal melting temperature is 2023 K.

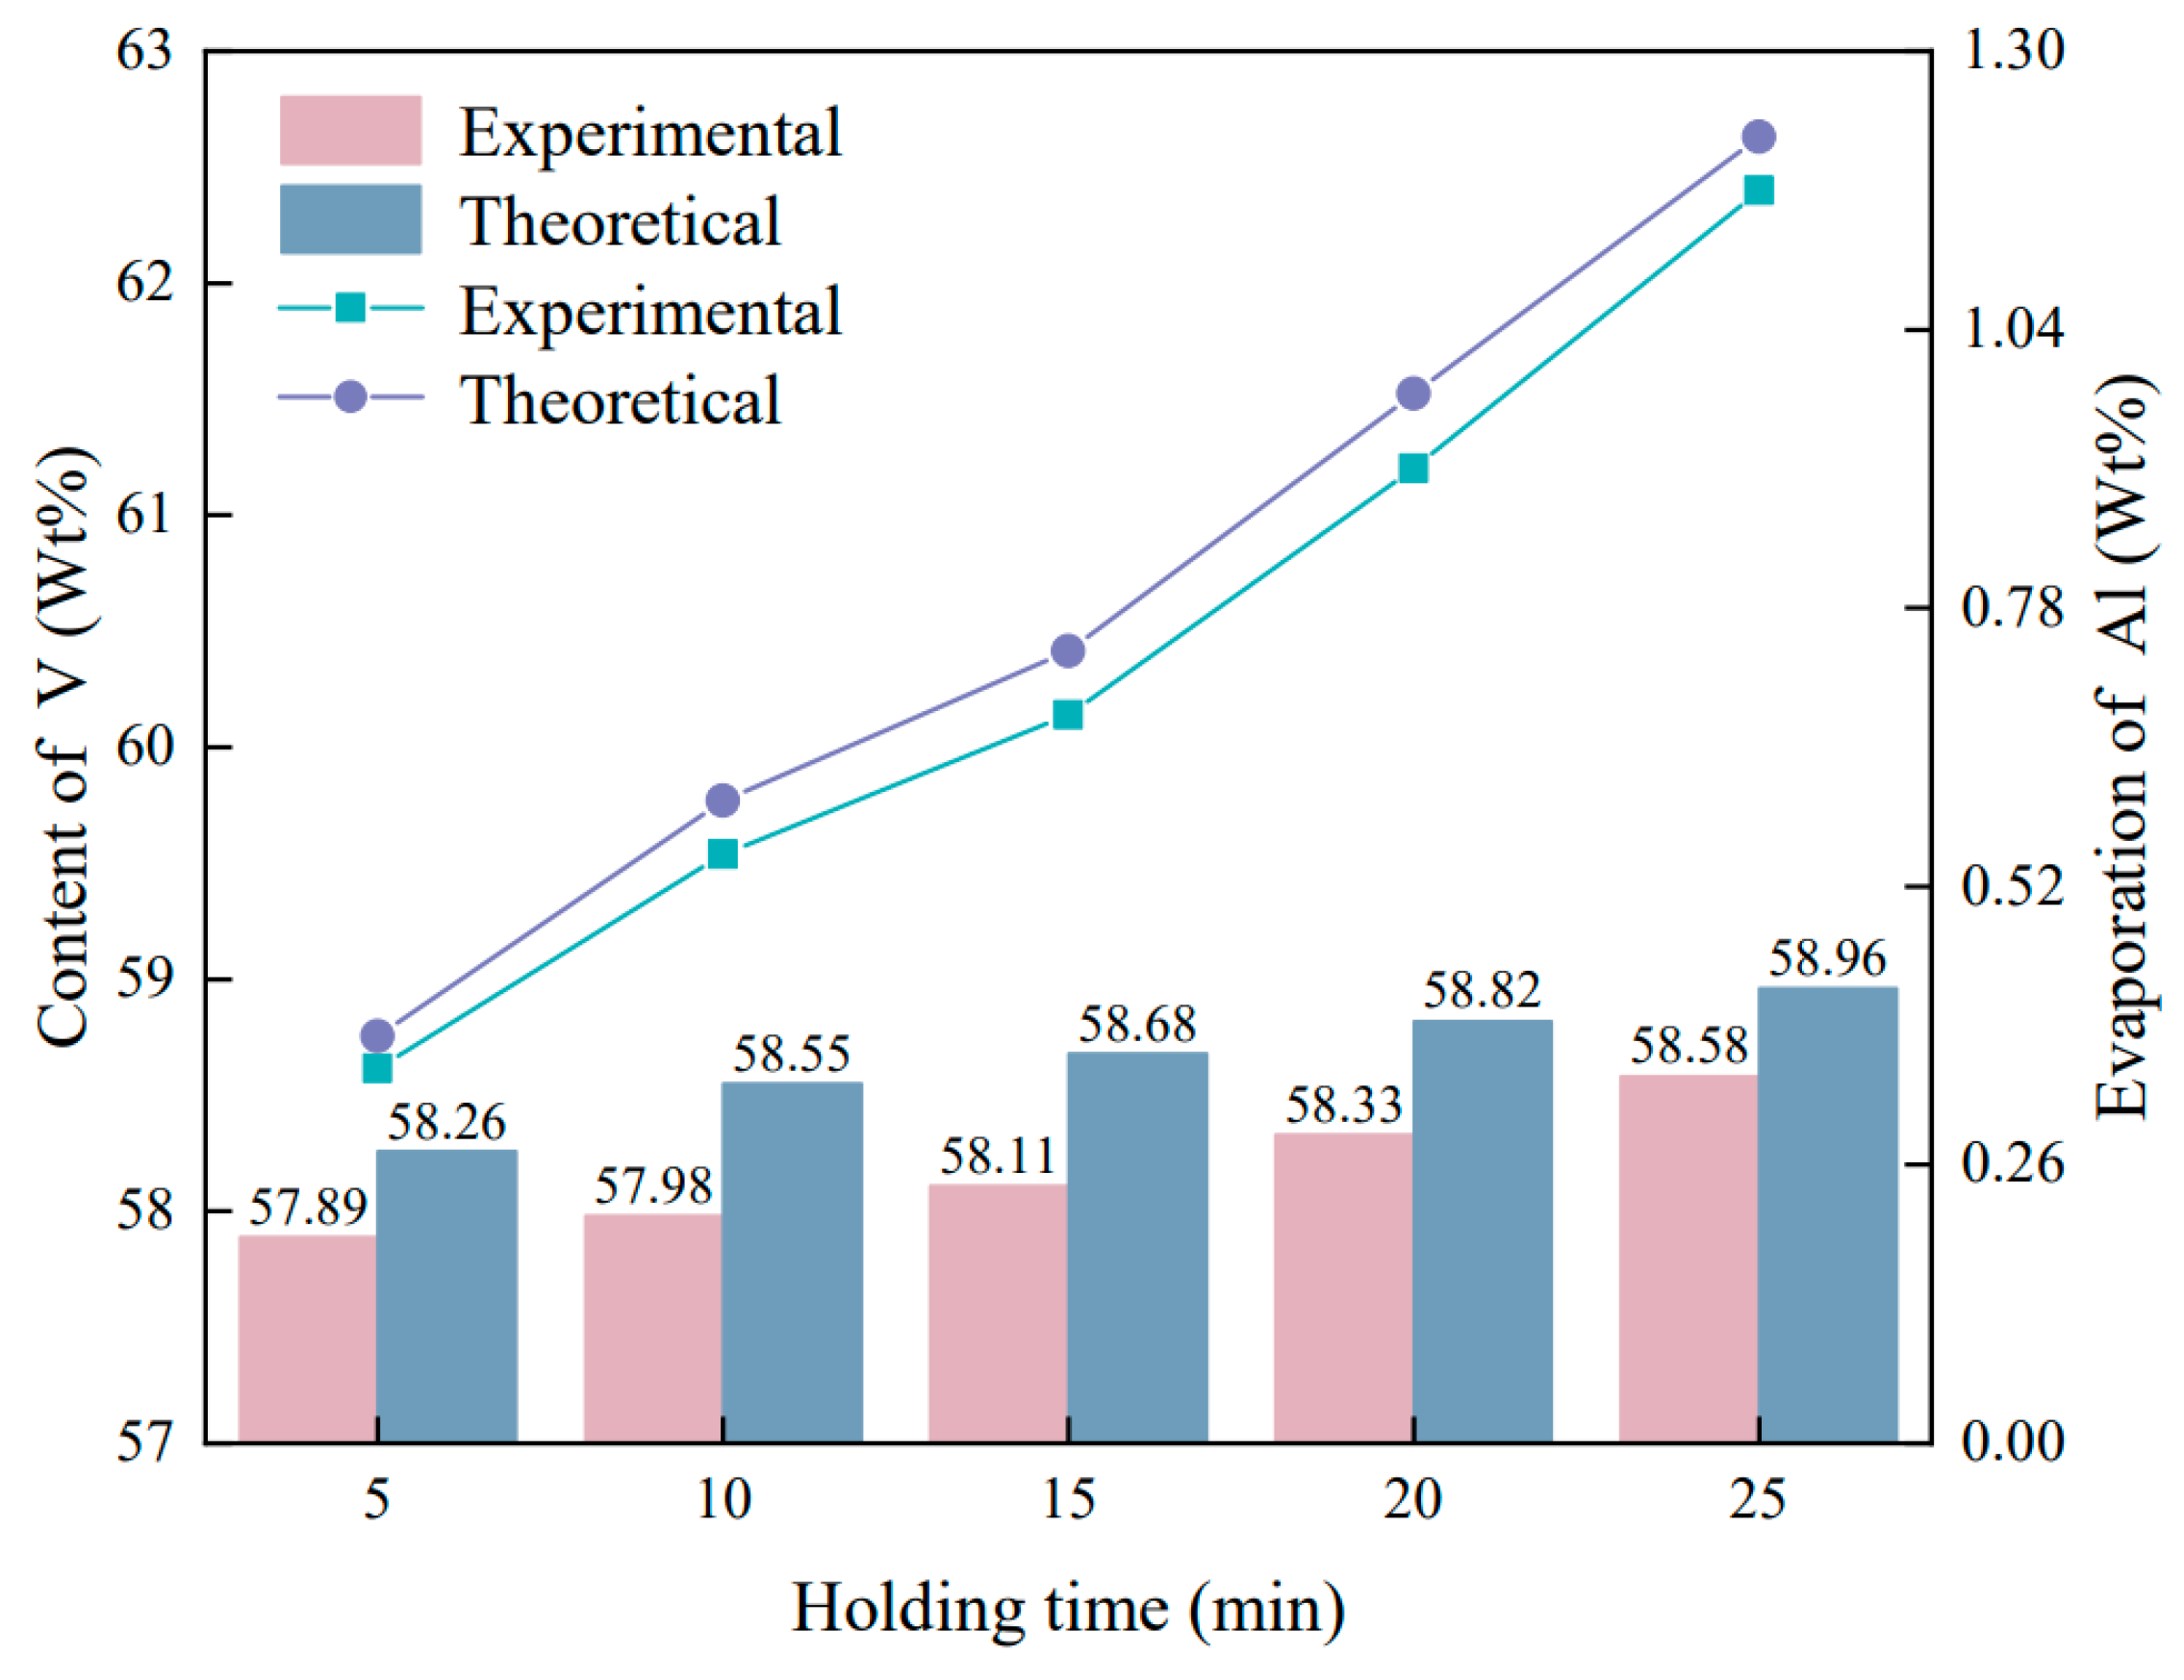
3.4. Effect of Holding Time on the AlV55 Alloy

The influence of holding time on the refining process was investigated. The pressure in the furnace was set to 2000 Pa, the temperature was set to 2023 K, and the holding time was set to 5–25 min, with a gradient of 5 min. The experimental conditions are listed in Table 8. The changes in the V content and Al evaporation loss of the alloy product as a function of the holding time are shown in Figure 14. The V content and Al evaporation loss of the product increase with increasing holding time, as indicated in the experimental and theoretical values shown in the figure. Figure 15 shows SEM images of the alloy product obtained at different holding times. At a holding time of 5 min, the AlV phase in the Al8V5 phase does not completely form dendrites, increasing the inhomogeneity of the composition of the alloy. Thus, prolonging the holding time appears to be necessary. At a holding time of 10 min, the AlV phase shows a dendritic distribution in the Al8V5 phase [35]. Further increases in the holding time appear to increase the Al evaporation loss. Thus, the holding time was set to 10 min in subsequent experiments.

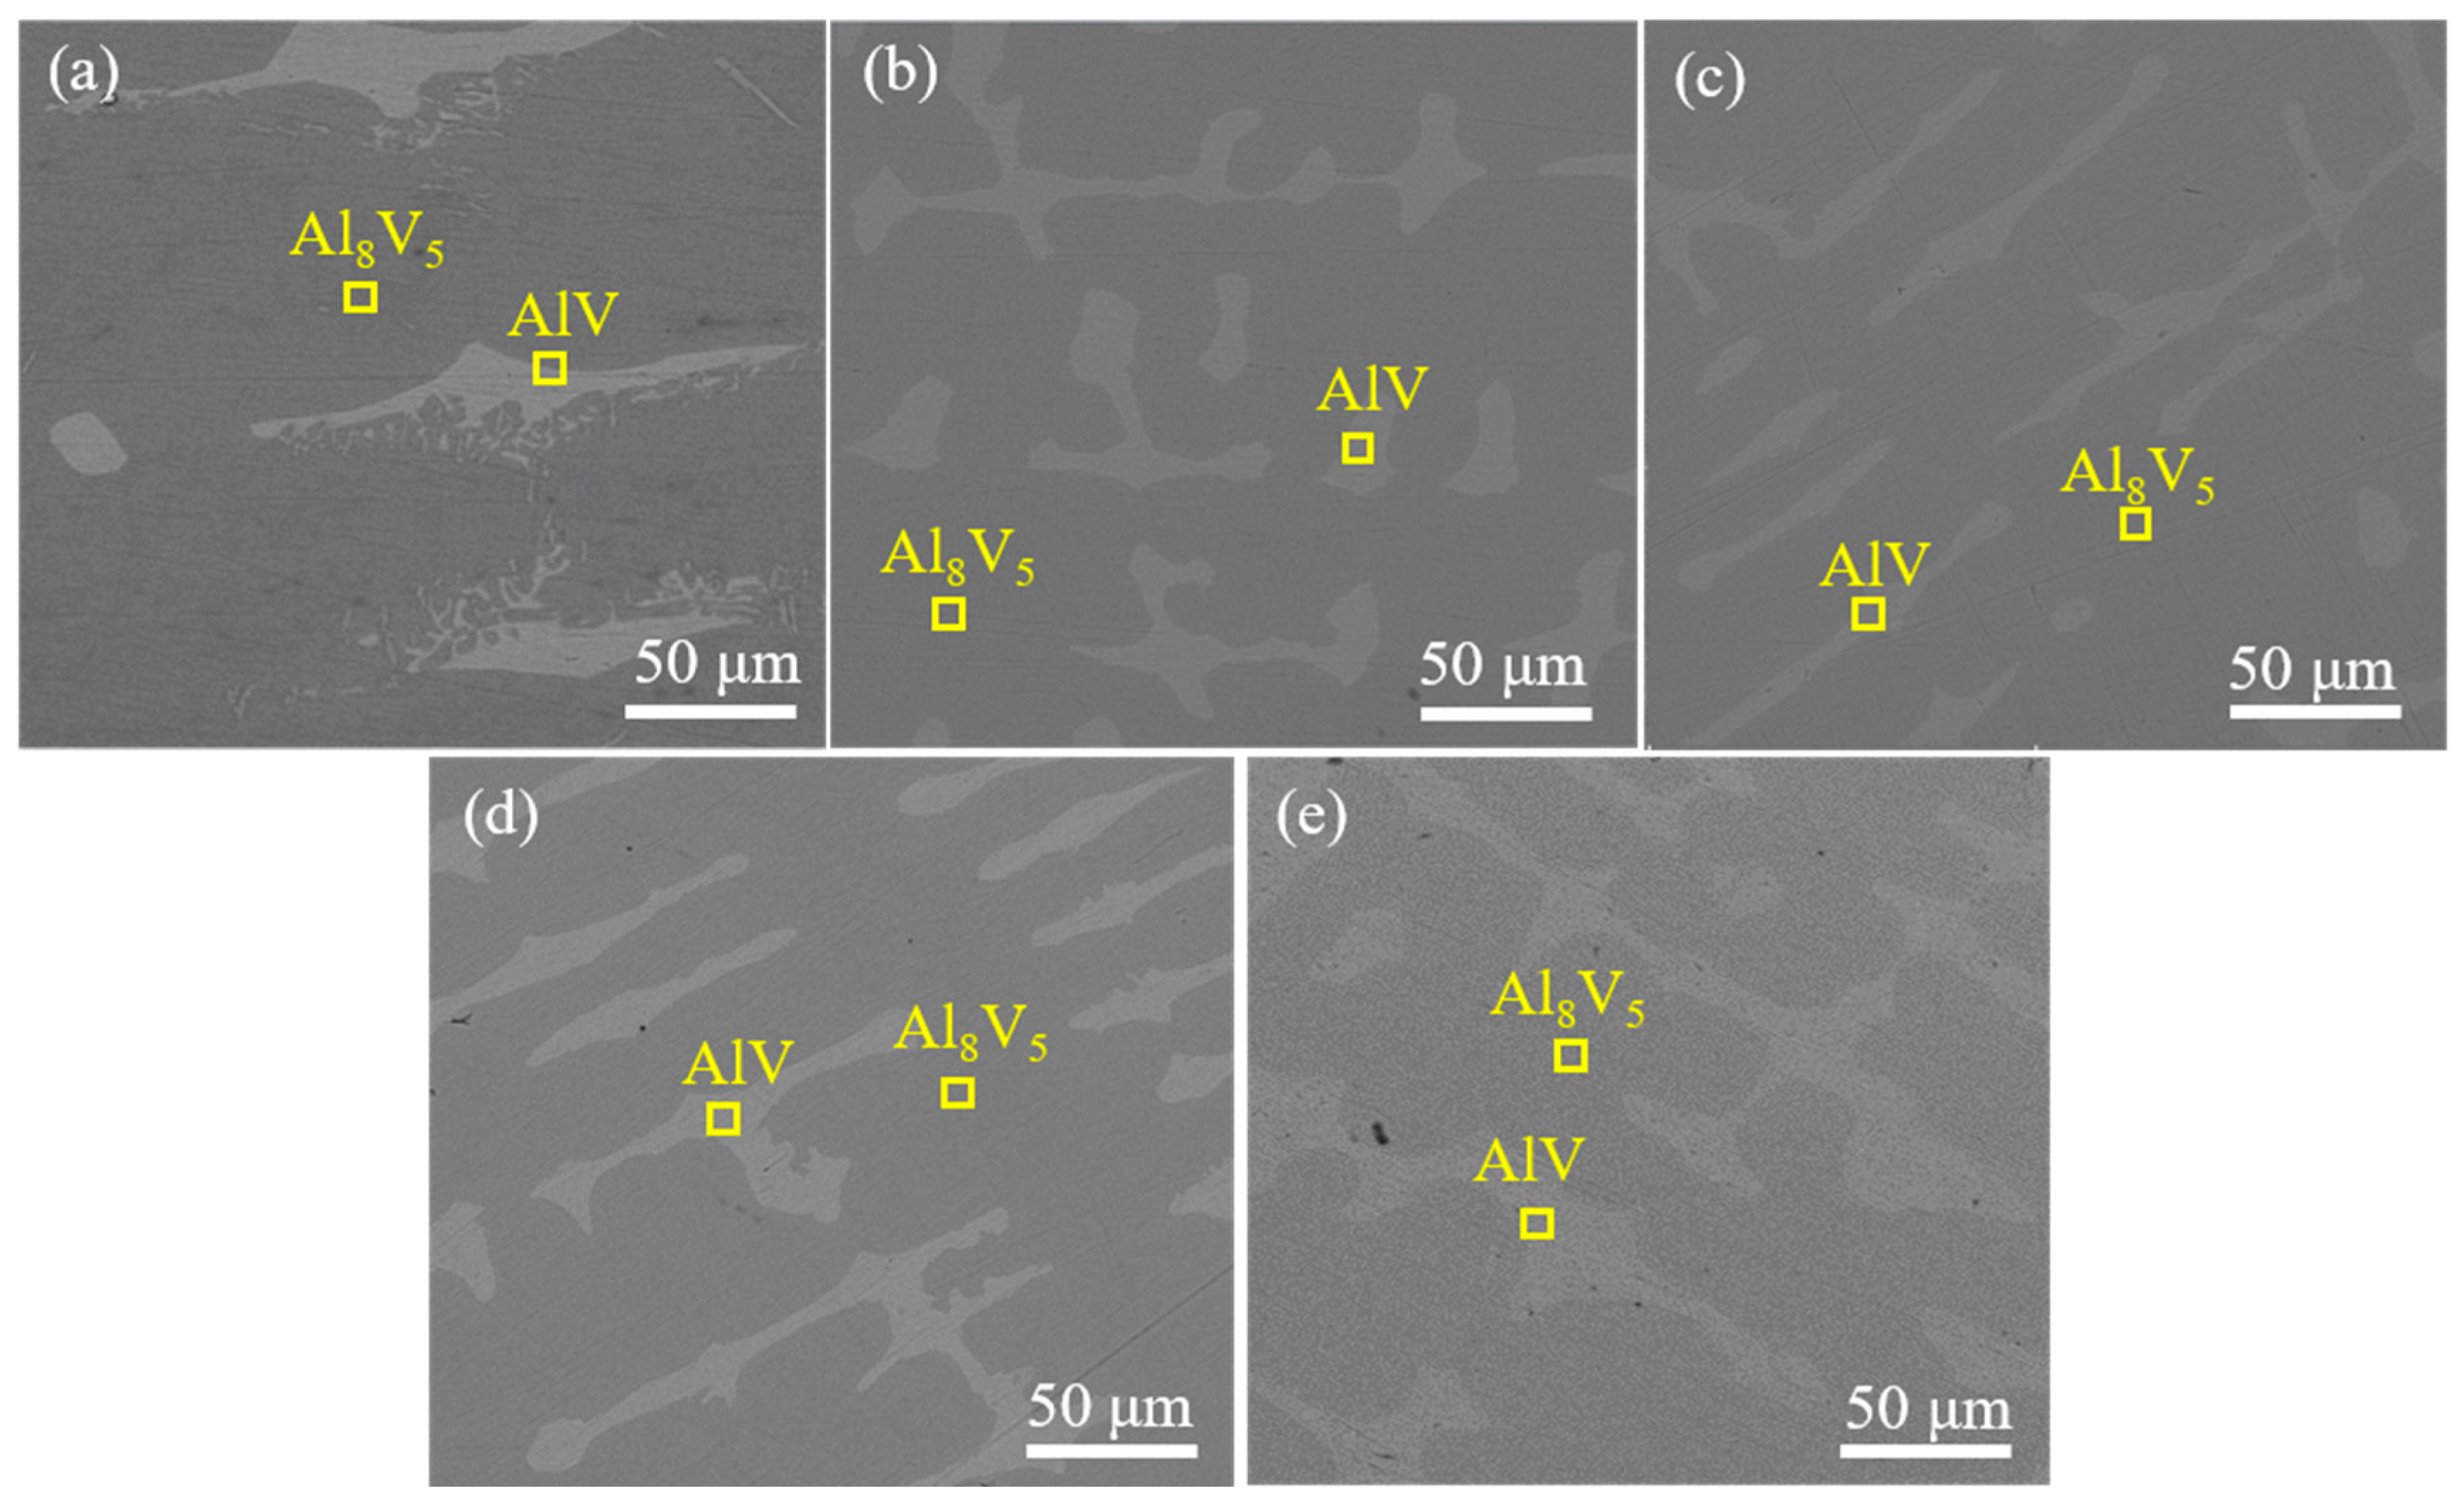
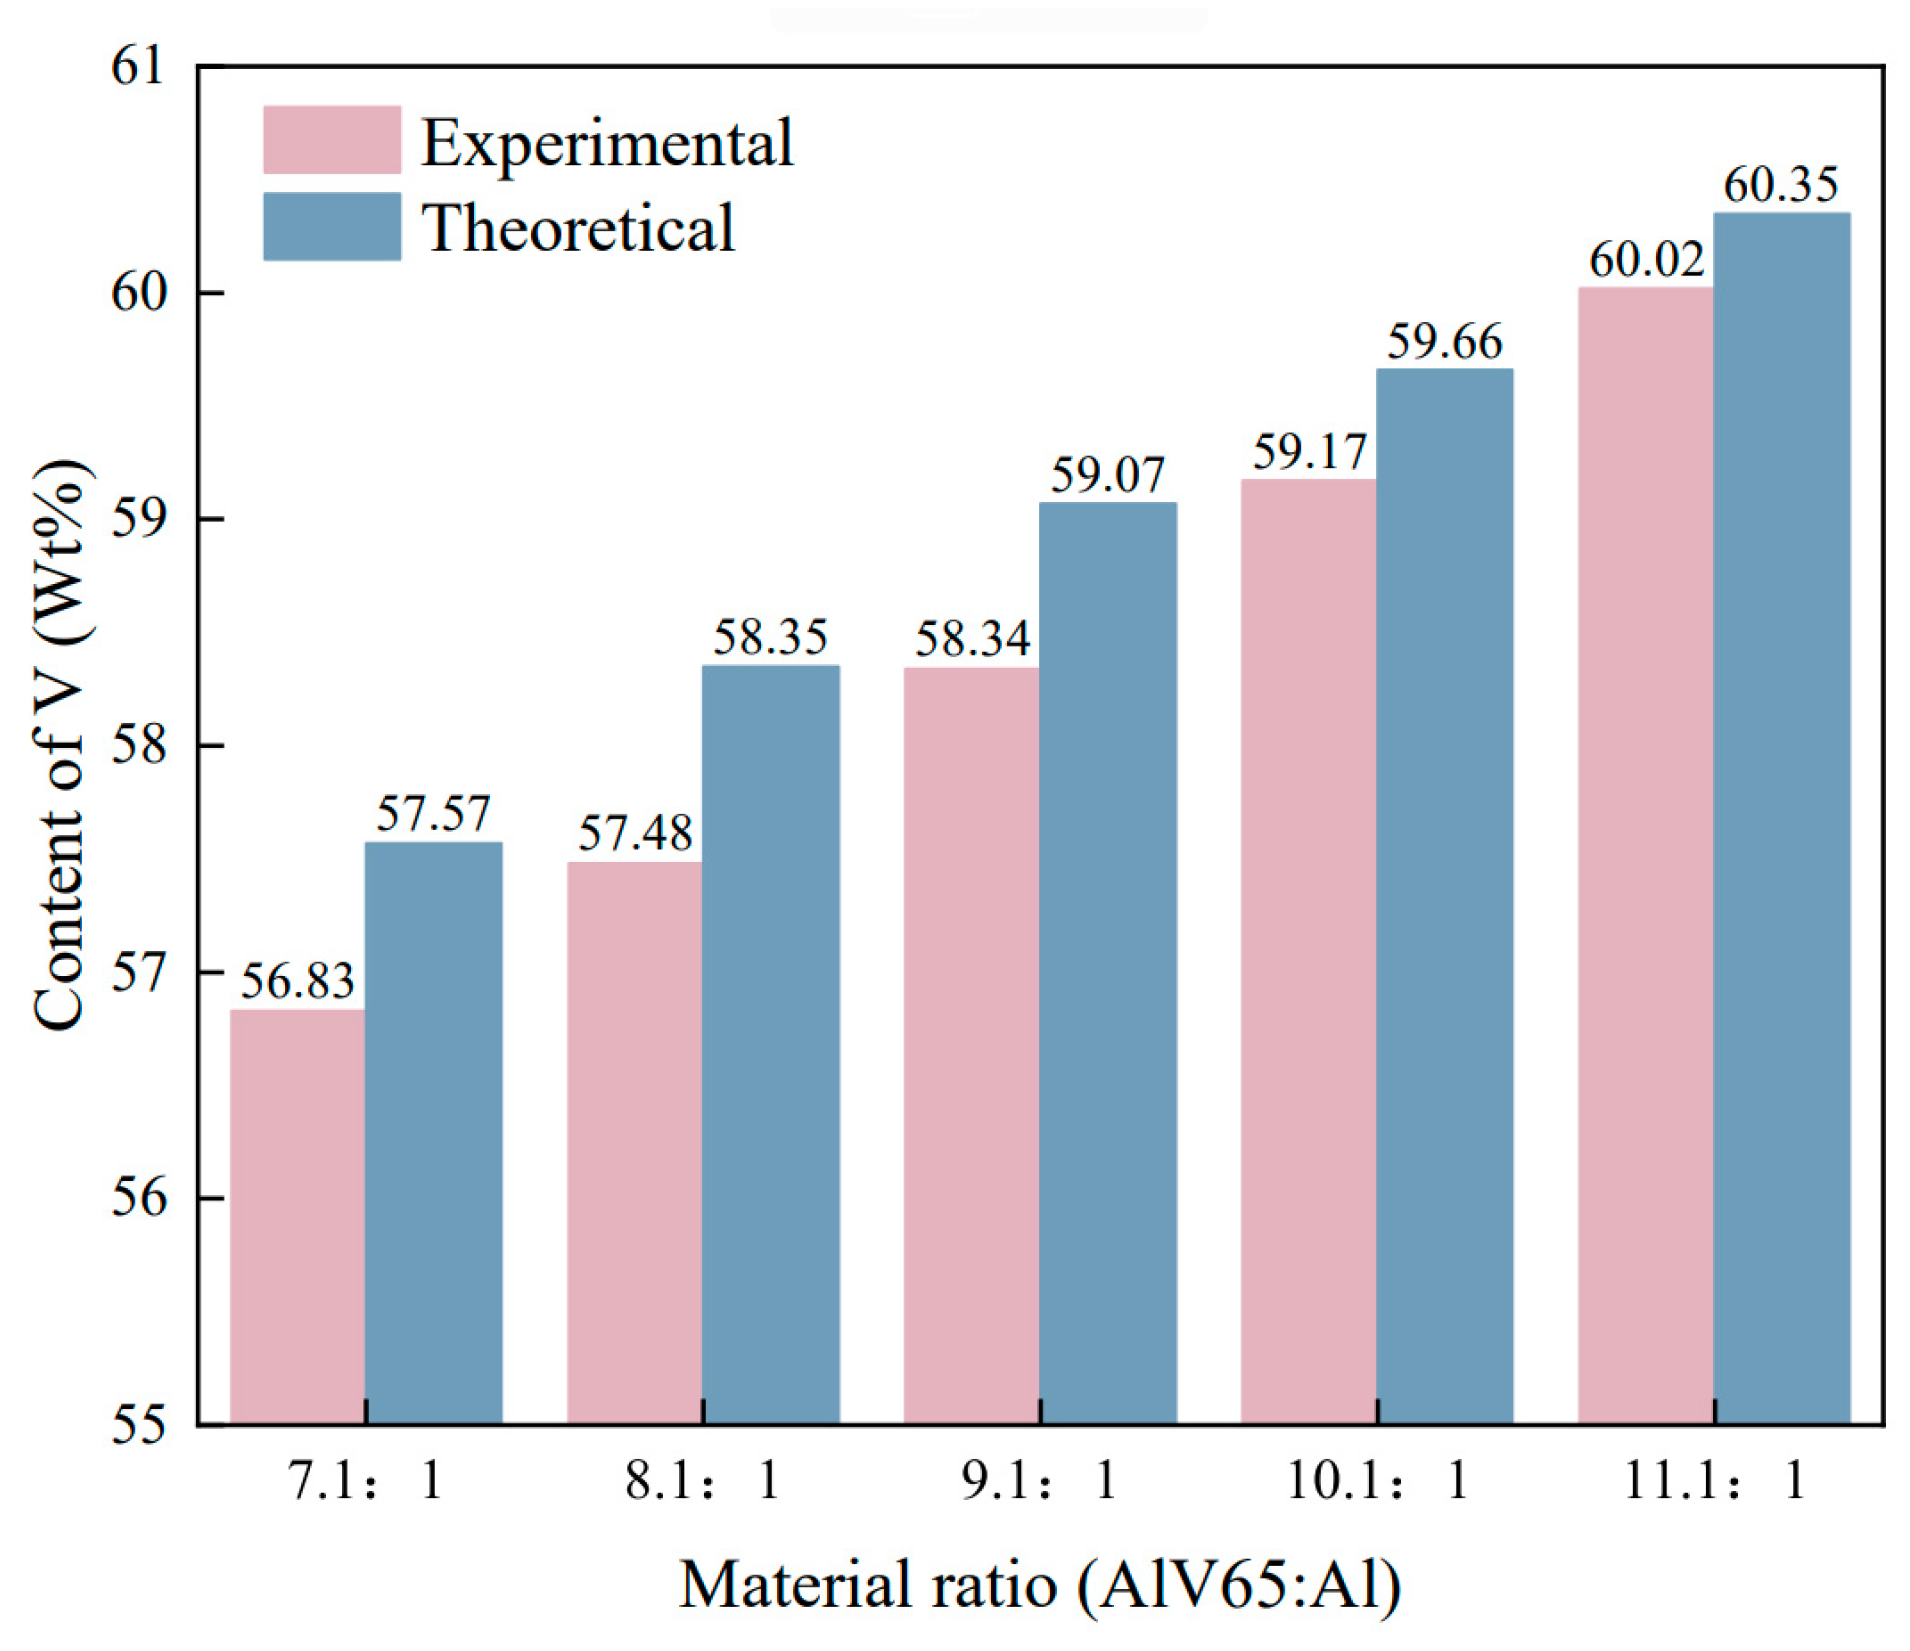
3.5. Effect of Material Ratio on the AlV55 Alloy

The effect of different material ratios on the refined products was investigated. The pressure in the furnace was set to approximately 2000 Pa, the temperature was set to 2023 K, and the holding time was set to 10 min. The experimental conditions are listed in Table 9. The elemental contents of commercial AlV55 alloy are shown in Table 10 [36]; according to the commercial standard, the V content of AlV55 alloy must be 55–60 wt%. Considering the evaporation loss of Al and the V content of the raw material, smelting experiments were conducted using AlV65:Al material ratios of 7.1:1–11.1:1. The relationship between the V content of the alloy product and material ratio is shown in Figure 16. When the material ratio is 11.1:1, the V content of the product is 60.02%, which exceeds the commercial standard for AlV55 alloy (60%).

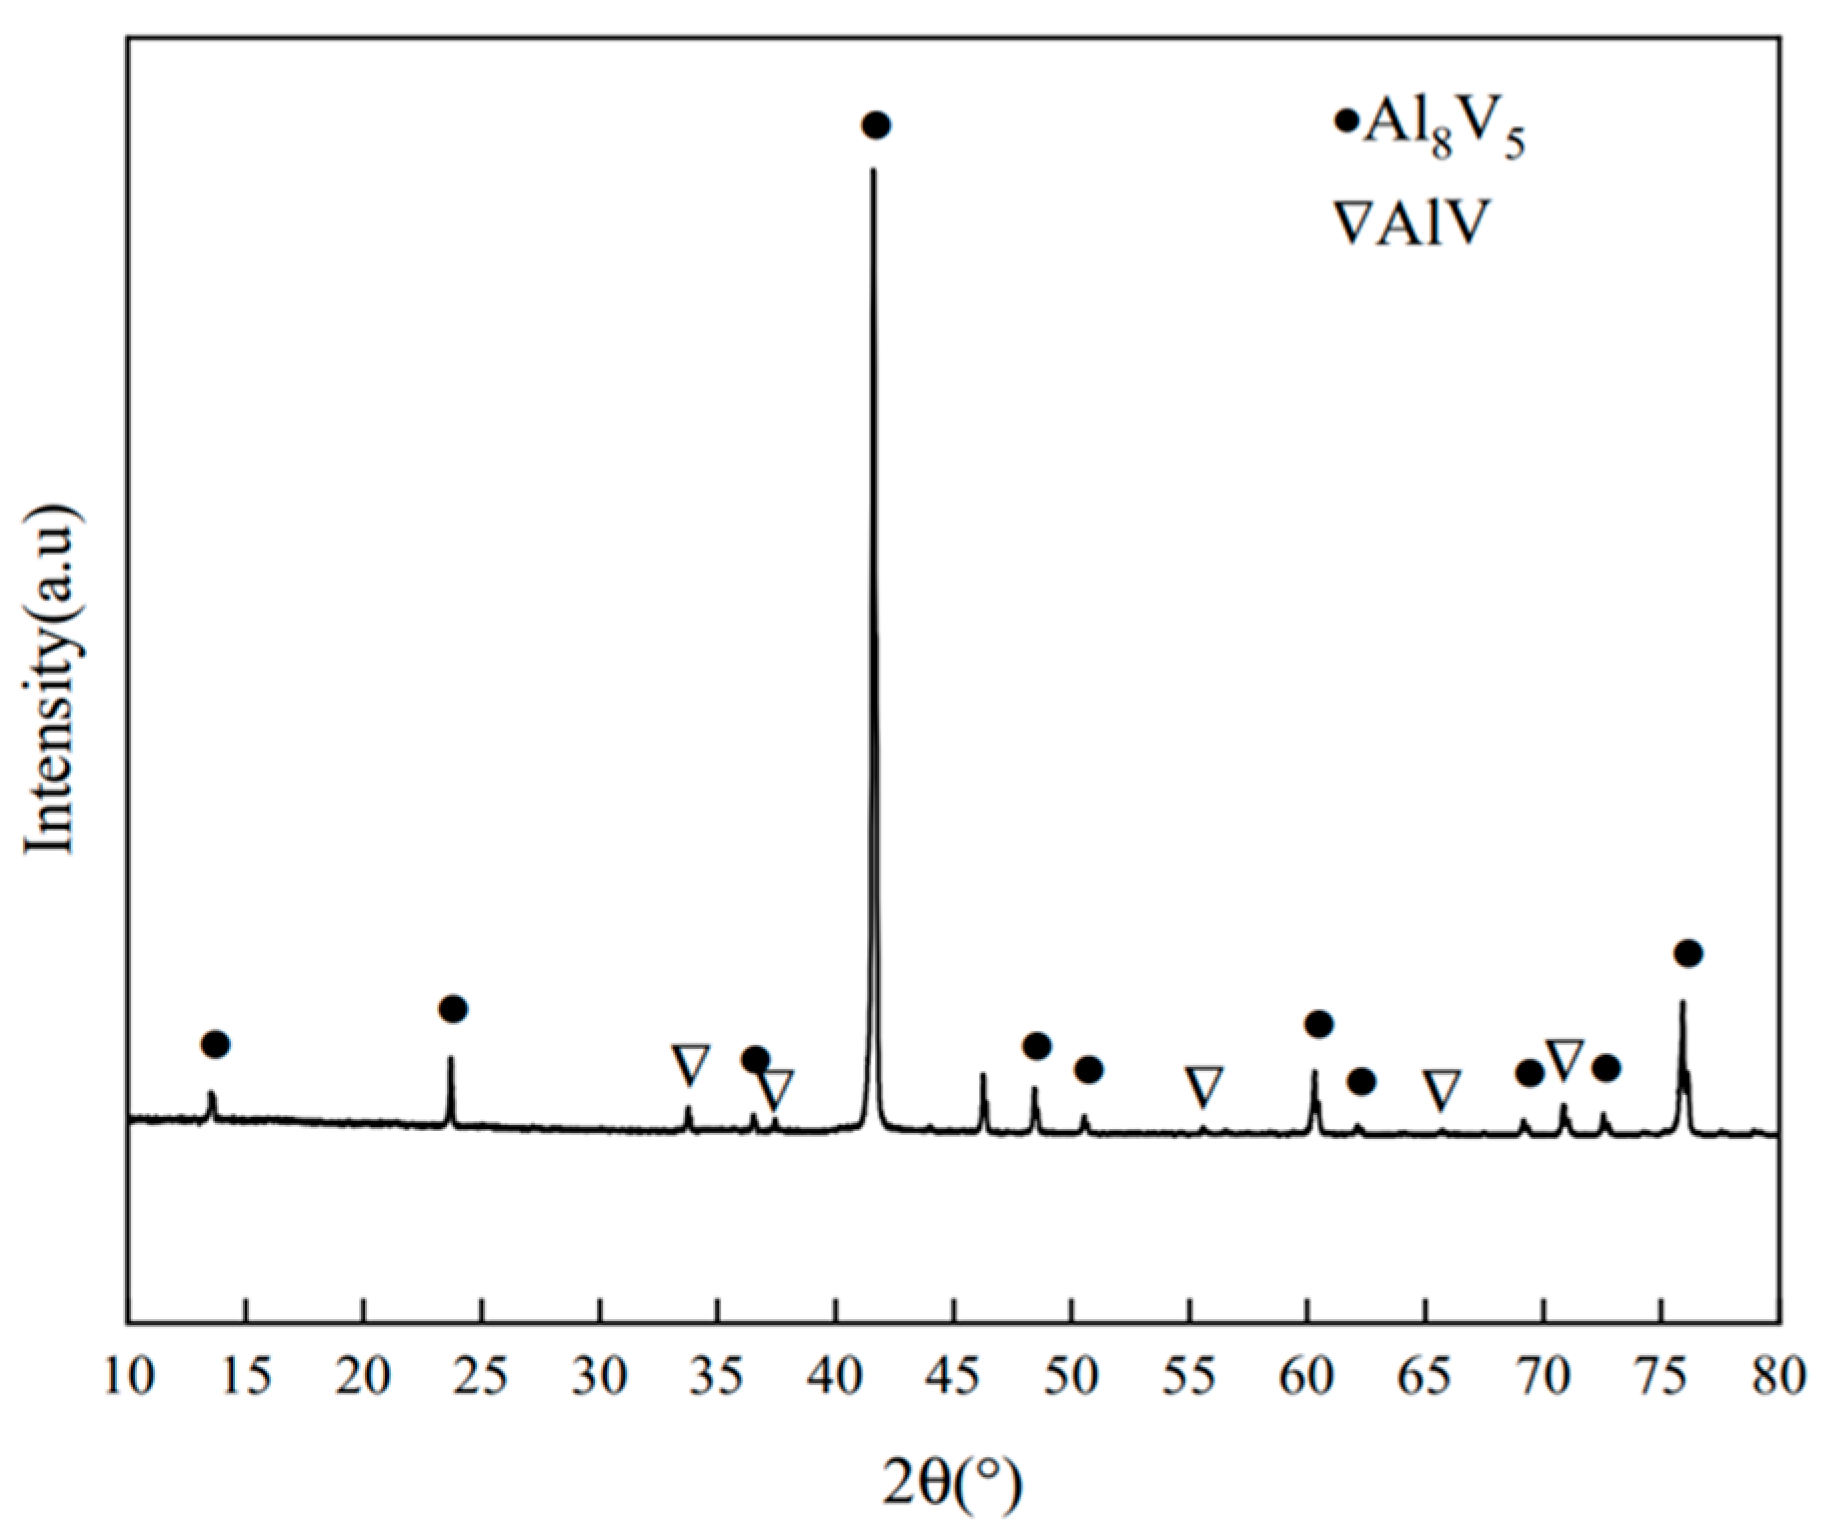
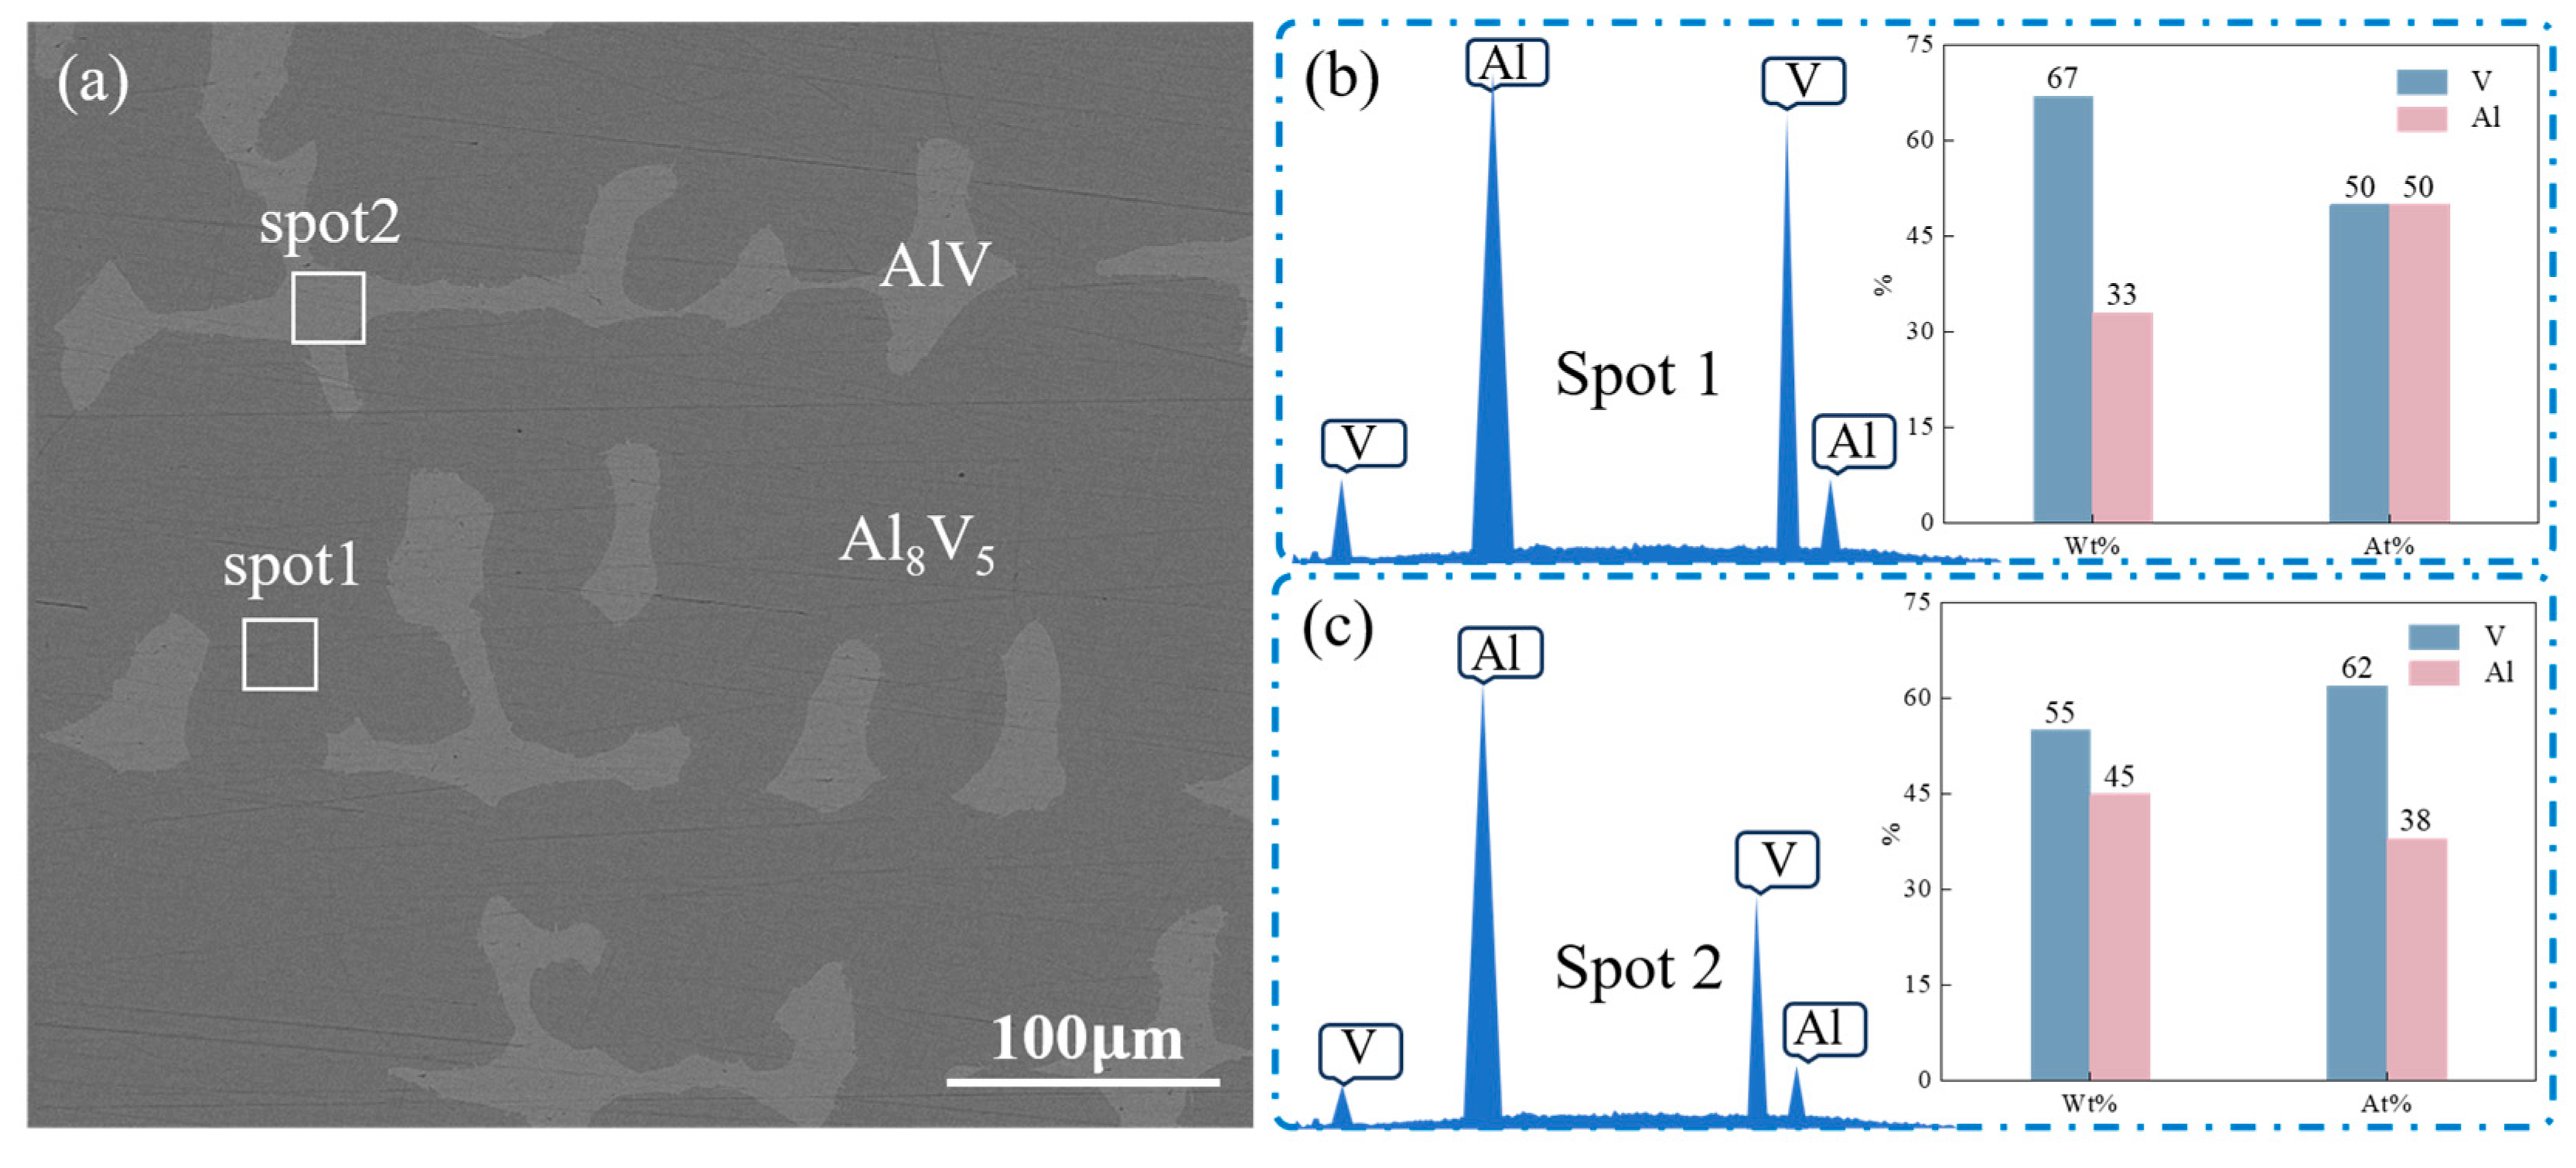
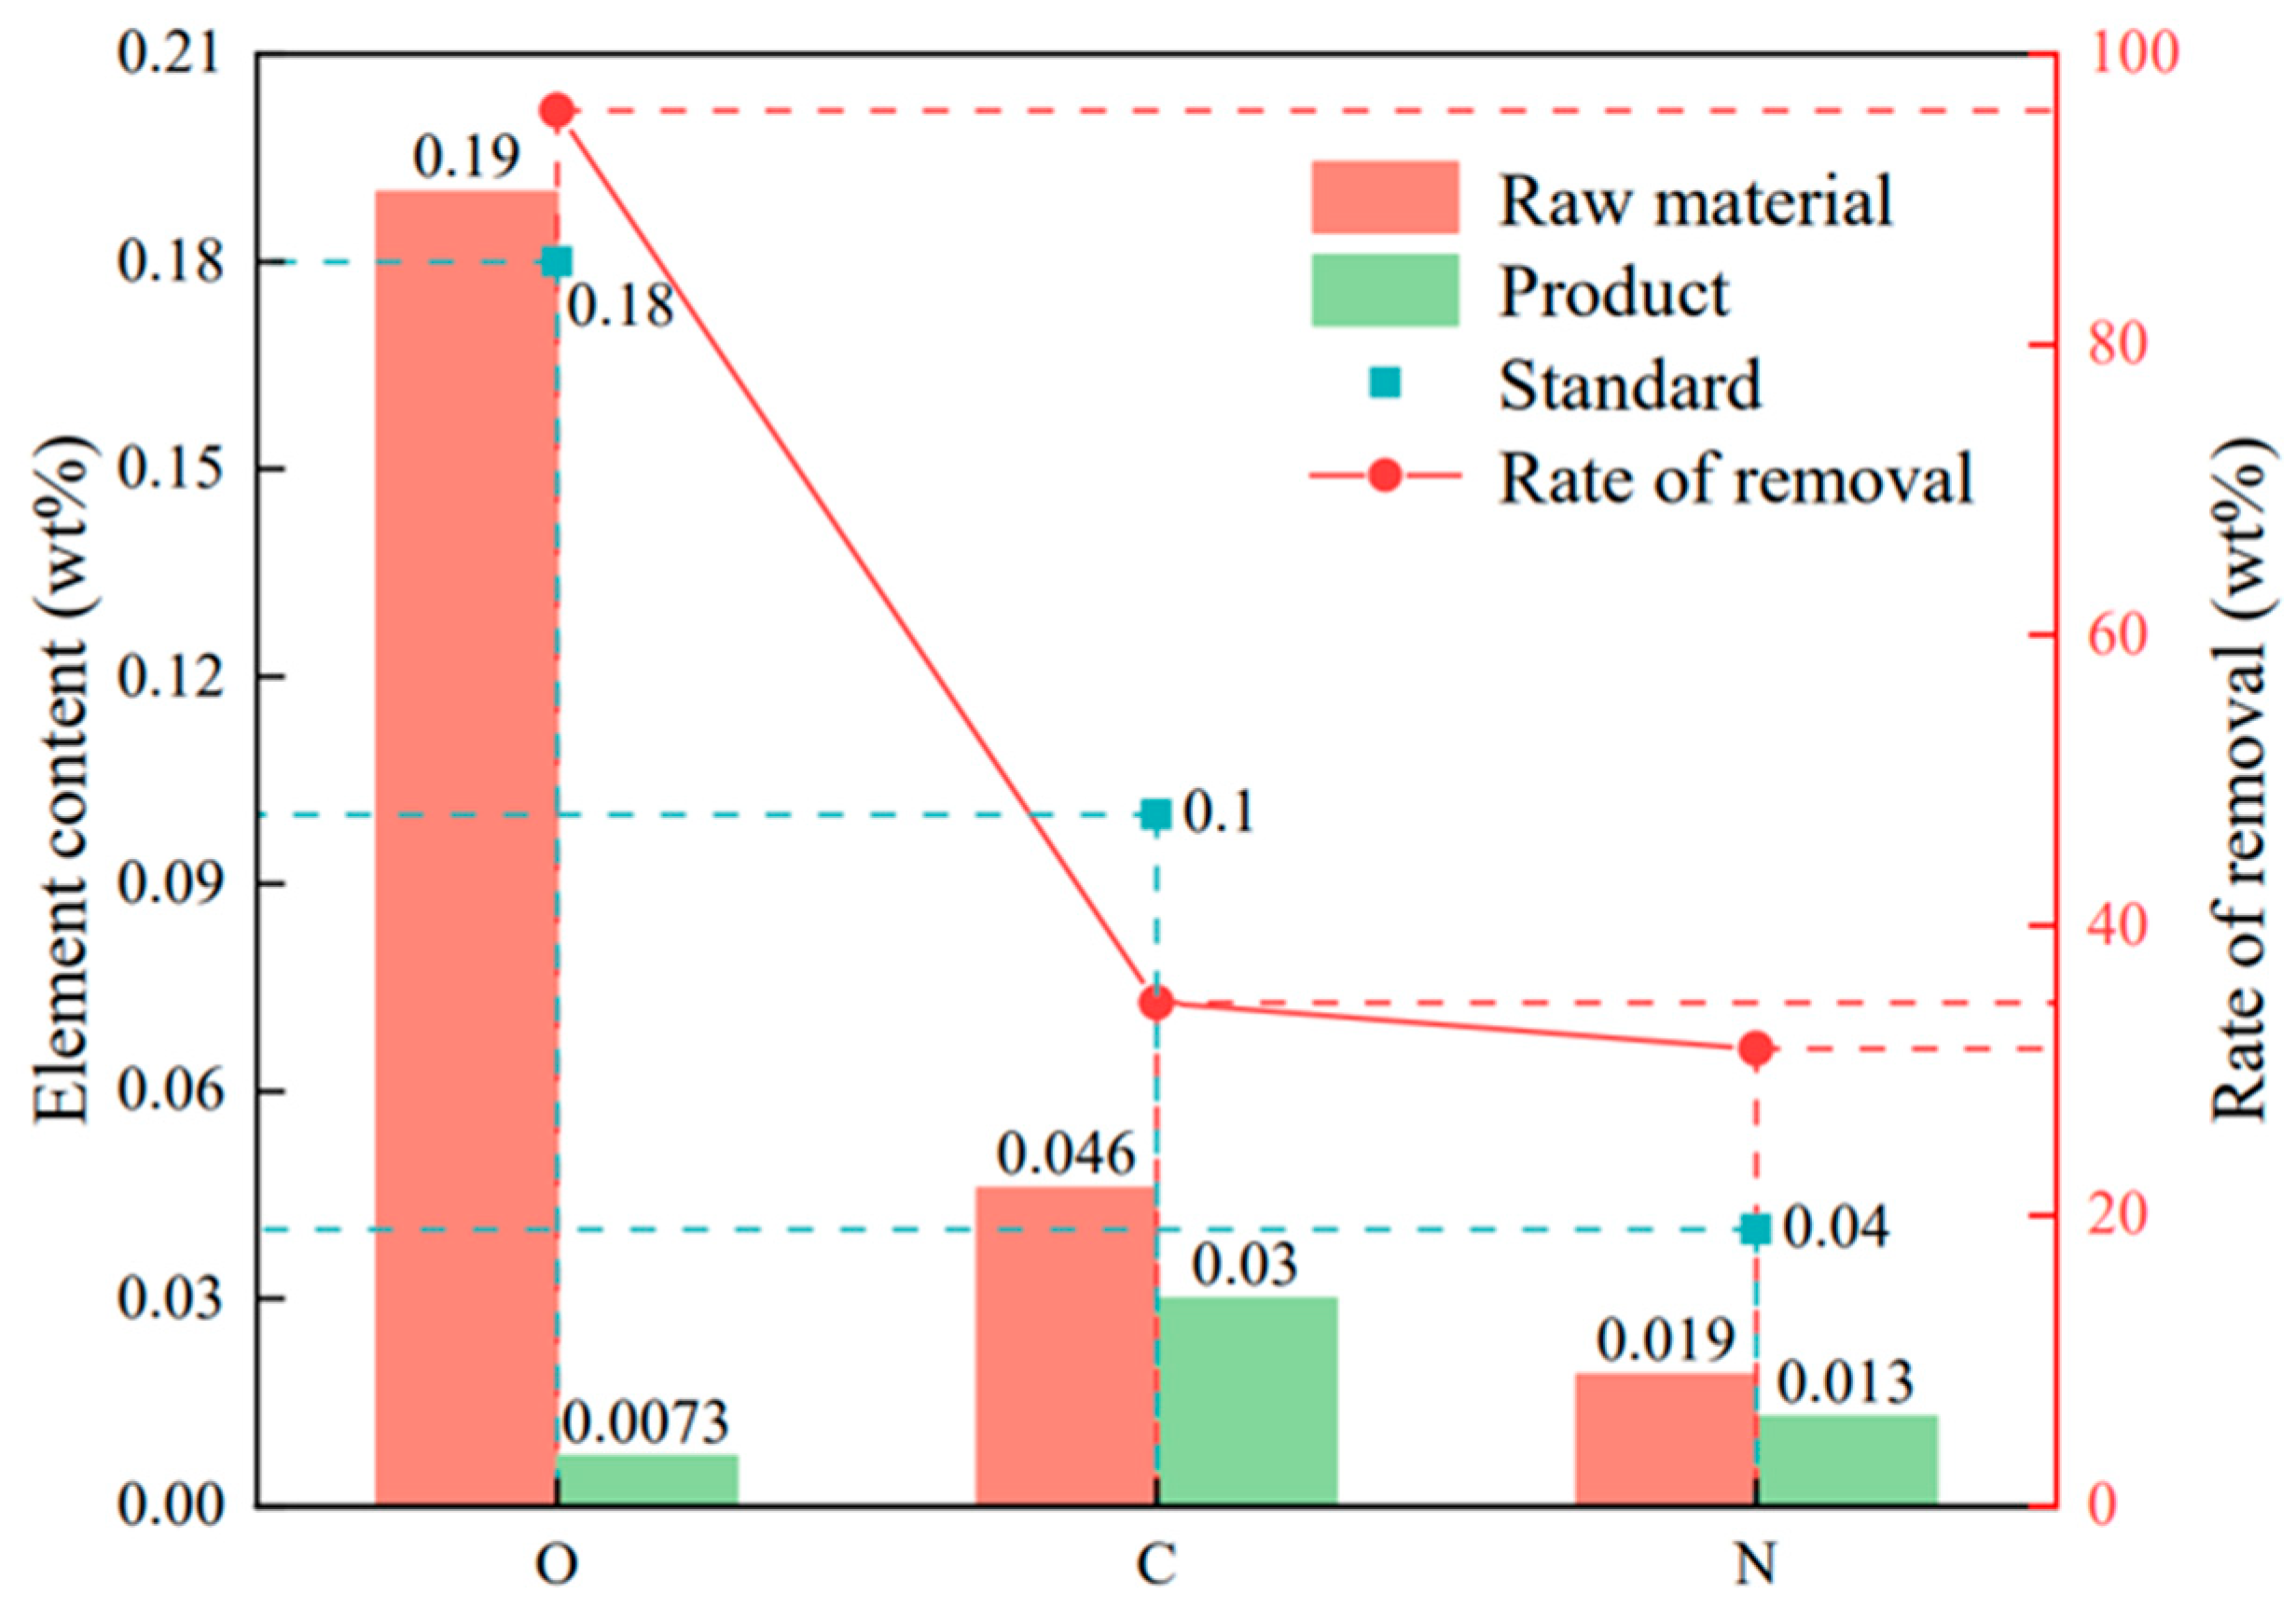
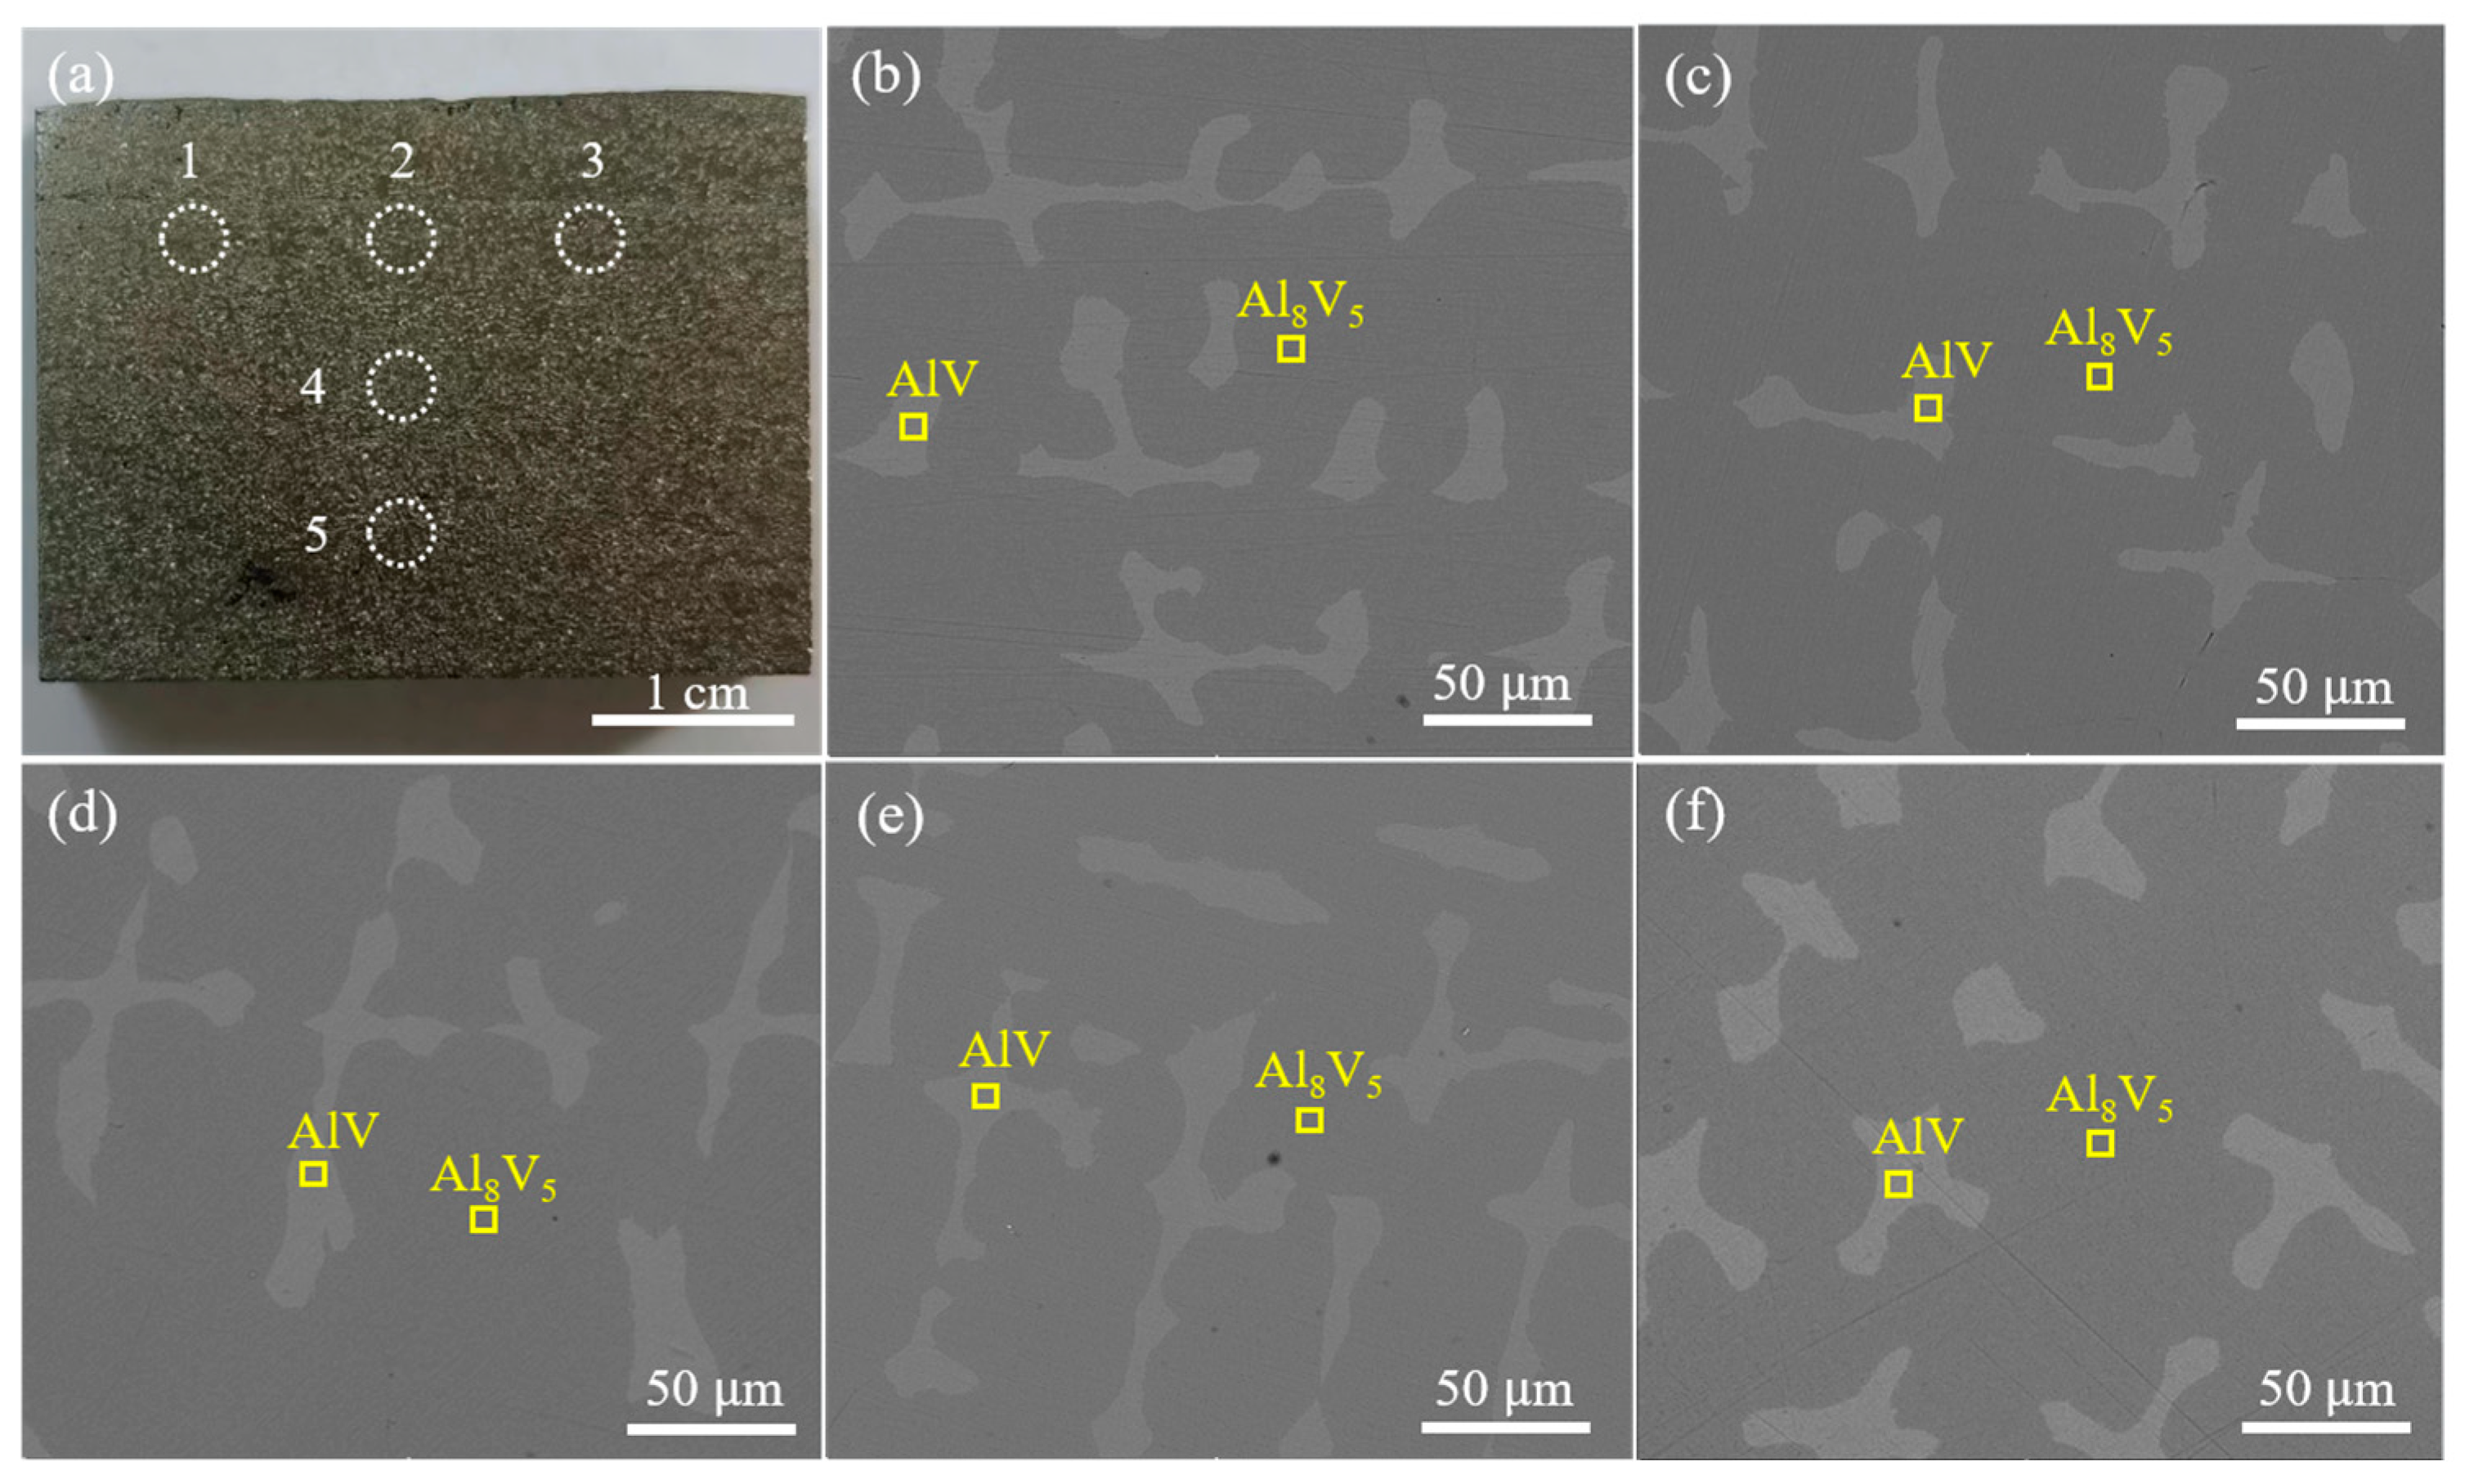
3.6. Impurity Content and Uniformity of AlV55

According to Table 10, the Fe contents (0.006%) and Si contents (0.017%) in the raw materials are lower than the commercial standards, so the removal effect of non-metallic impurities is mainly concerned. AlV55 alloy was prepared under the experimental conditions of temperature 2023 K, holding time 10 min, furnace pressure 2000 Pa and material ratio 9.1:1. The obtained alloy composition is shown in Table 11, and the composition of each element met the standard of AlV55 alloy. The impurity content and removal rate of the alloy products after refining are shown in Figure 17. The alloy achieved 0.0073% O with 96.1% removal, 0.03% C with 34.7% removal and 0.013% N with 31.5% removal. These C, N, and O contents are significantly lower than those of the standard [38].
The content of each element meets the standard requirements of commercial AlV55 alloy, and the contents of the nonmetallic impurities C, N, and O are significantly lower than those of the standard (C   0.03 % , N   0.013 %, O   0.0073 % ) . The uniformity of the composition of the alloy was assessed by analyzing the elemental contents of various sampling points in the alloy. Figure 18a shows a photograph of the sampling points in the alloy, and Figure 18b–f show SEM images of these points. The SEM images exhibit a similar internal organization of the alloy in the horizontal and vertical directions, with the AlV phase distributed in the alloy in the form of dendrites. Table 12 lists the elemental contents of the different sampling points. The mass fractions of V and Al in these points are similar, and the error does not exceed 0.5%. Thus, the composition of the prepared alloy composition is relatively uniform.

4. Conclusions

A new process for the preparation of AlV55 alloy by controlling the system pressure on the basis of vacuum induction melting is presented in this study. The evaporation loss of Al during smelting was effectively reduced by introducing Ar gas into the furnace to increase the smelting pressure. The reaction of AlV65 alloy with Al under different conditions was experimentally verified, and the results indicated that the amount of Al required for the reaction was consistent with the theoretical calculations. Introducing Ar gas at 2000 Pa reduced the Al evaporation loss from 11.48% under vacuum conditions to 0.58%, effectively reducing the amount of Al added to the raw materials. This strategy can effectively reduce nonmetallic impurities in the alloy. When the AlV65:Al mass ratio was 7.1:1–10.1:1, the holding time was 10 min, the furnace pressure was 2000 Pa, and the smelting temperature was 2023 K, AlV55 alloy with low impurity contents (C   0.03 % , N     0.013 % , O   0.0073 % ) and a uniform composition was obtained. Thus, the proposed process has promising application prospects.

Author Contributions

Conceptualization, X.L.; methodology, B.S.; validation, H.W.; formal analysis, B.S. and X.L.; investigation, H.W.; resources, L.L.; data curation, B.X.; writing—original draft preparation, B.S.; writing—review and editing, B.S. and L.L.; visualization, B.S.; supervision, X.L. and B.X.; funding acquisition, B.X. and L.L. All authors have read and agreed to the published version of the manuscript.

Funding

This research was funded by “Technology development and industrialisation of 1000 t vanadium-aluminium alloy production line” grant number [HG2022110-JS-2022-43].

Data Availability Statement

The raw data supporting the conclusions of this article will be made available by the authors on request.

Conflicts of Interest

Authors Heli Wan and Lanjie Li were employed by the company HBIS Material Technology Research Institute. The remaining authors declare that the research was conducted in the absence of any commercial or financial relationships that could be construed as a potential conflict of interest.

References

  1. Gao, F.; Olayiwola, A.U.; Liu, B.; Wang, S.; Du, H.; Li, J.; Wang, X.; Chen, D.; Zhang, Y. Review of Vanadium Production Part I: Primary Resources. Min. Proc. Ext. Met. Rev. 2022, 43, 466–488. [Google Scholar] [CrossRef]
  2. Ahmed, T.; Flower, H.M. The phase-transformations in alloys based on titanium aluminides TI3AL-V and TIAL-V. Mater. Sci. Eng. Struct. Mater. Prop. Microstruct. Process. 1992, 152, 31–36. [Google Scholar] [CrossRef]
  3. Kamyshnykova, K.; Lapin, J. Vacuum induction melting and solidification of TiAl-based alloy in graphite crucibles. Vaccum 2018, 154, 218–226. [Google Scholar] [CrossRef]
  4. Kostov, A.; Živković, D. Thermodynamic analysis of alloys Ti-Al, Ti-V, Al-V and Ti-Al-V. J. Alloys Compd. 2008, 460, 164–171. [Google Scholar] [CrossRef]
  5. Wan, H.; Xu, B.; Li, L.; Yang, B.; Li, D.; Dai, Y. A Novel Method of Fabricating Al-V Intermetallic Alloy through Electrode Heating. Metals 2019, 9, 558. [Google Scholar] [CrossRef]
  6. Xu, Y.; Jiao, H.; Wang, M.; Jiao, S. Direct preparation of V-Al alloy by molten salt electrolysis of soluble NaVO3 on a liquid Al cathode. J. Alloys Compd. 2019, 779, 22–29. [Google Scholar] [CrossRef]
  7. Muroga, T.; Chen, J.M.; Chernov, V.M.; Fukumoto, K.; Hoelzer, D.T.; Kurtz, R.T.; Nagasaka, T.; Pint, B.A.; Satou, M.; Suzuki, A.; et al. Review of advances in development of vanadium alloys and MHD insulator coatings. J. Nucl. Mater. 2007, 367, 780–787. [Google Scholar] [CrossRef]
  8. Yee, S.L.; Wan, H.; Chen, M.; Li, L.; Li, J.; Ma, X. Development of a cleaner route for Aluminum–Vanadium alloy production. J. Mater. Res. Technol. 2022, 16, 187–193. [Google Scholar] [CrossRef]
  9. de Souza, D.A.P.; Nunes, C.A.; Sandim, H.R.Z.; Ramos, A.S.; Neto, A.C. The effect of excess Al and fabrication environment on the composition and microstructure of V-Al alloys. Int. J. Refract. Met. Hard Mater. 2000, 18, 55–60. [Google Scholar] [CrossRef]
  10. Blacha, L.; Siwiec, G.; Oleksiak, B. Loss of aluminium during the process of Ti-Al-V alloy smelting in a vacuum induction melting (vim) furnace. Metallurgy 2013, 52, 301–304. [Google Scholar]
  11. Wan, H.; Xu, B.; Wang, L.; Yang, B.; Li, L.; Ding, Z.; Dai, Y.; Li, D. A novel method of AlV55 alloy production by utilizing AlV65 alloy scrap. Vacuum 2018, 155, 127–133. [Google Scholar] [CrossRef]
  12. Blacha, L.; Michalek, K.; Smalcerz, A.; Warzecha, M. Effects of a bath composition on aluminium loss during Ti-Al alloy smelting in a vacuum induction furnace. Metallurgy 2014, 53, 574–576. [Google Scholar]
  13. Blacha, L.; Mizera, J.; Folega, P. The effects of mass transfer in the liquid phase on the rate of aluminium evaporation from the Ti-6Al-7Nb Alloy. Metallurgy 2014, 53, 51–54. [Google Scholar]
  14. Zha, G.; Zhao, Y.; Luo, H.; Jiang, W.; Xu, B.; Yang, B. Evaporation Regularities of Elemental Selenium in the Vacuum Distillation Process. Metall. Mater. Trans. B 2022, 53, 3856–3864. [Google Scholar] [CrossRef]
  15. Yang, B.; Xu, B.Q. Vacuum Metallurgy; Central South University Press: Changsha, China, 2021; pp. 489–491. [Google Scholar]
  16. Liu, Y. Design of Vacuum Engineering; Chemical Industry Press: Beijing, China, 2016; p. 27. [Google Scholar]
  17. Wang, D.; Liu, Z.; Liu, W. Experimental Measurement of Vacuum Evaporation of Aluminum in Ti-Al, V-Al, Ti6Al4V Alloys by Electron Beam. Metals 2021, 11, 1688. [Google Scholar] [CrossRef]
  18. Duan, Y.J.; Chen, B.; Ma, Y.C.; Liu, K. Kinetics of Al Evaporation from Liquid U–Al Alloys in Vacuum Induction Melting. J. Mater. Res. Technol. 2015, 31, 423–426. [Google Scholar] [CrossRef]
  19. Guo, J.J.; Liu, Y.; Su, Y.Q.; Ding, H.S.; Liu, G.Z.; Jia, J. Evaporation behavior of aluminum during the cold crucible induction skull melting of titanium aluminum alloys. Metall. Mater. Trans. B 2000, 31, 837–844. [Google Scholar] [CrossRef]
  20. Ivanchenko, V.G.; Ivasishin, O.M.; Semiatin, S.L. Evaluation of evaporation losses during electron-beam melting of Ti-AlN alloys. Metall. Mater. Trans. B 2003, 34, 911–915. [Google Scholar] [CrossRef]
  21. Zhang, Y.W. Study of Volatilisation Mechanisms and Dosing Parameters of TC4 Group Elements. Master’s Thesis, Kunming University of Science and Technology, Kunming, China, 2018. [Google Scholar]
  22. Guo, J.J.; Liu, G.Z.; Su, Y.Q. Evaporation of multi-components in Ti-25Al-25Nb melt during induction skull melting process. Trans. Nonferrous Met. Soc. 2002, 12, 587–591. [Google Scholar]
  23. Miyauchi, A.; Okabe, T.H. Development of New Manufacturing Technology for Vanadium Metal and Alloys. J. Jpn. Inst. Met. 2010, 74, 701–711. [Google Scholar] [CrossRef]
  24. Christian, J.W. Phase Transformations in Metals and Alloys, 3rd ed.; CRC Press: Boca Raton, FL, USA, 1992; pp. 299–301. [Google Scholar]
  25. Siwiec, G. The kinetics of aluminium evaporation from the Ti-6Al-4V alloy. Arch. Metall. Mater. 2013, 58, 1155–1160. [Google Scholar] [CrossRef]
  26. Hua, Y.X. Introduction to Metallurgical Process Dynamics; Metallurgical Industry Press: Beijing, China, 2004; pp. 268–269. [Google Scholar]
  27. Zhang, Z.; Wu, Z.; Zeng, W.; Chen, N.; Peng, R. Calculation of activity coefficient from immiscible binary alloy phase diagram by means of modified sub-regular solution model. Rare Met. 1998, 17, 193–197. [Google Scholar]
  28. Truong, V.D.; Hyun, Y.T.; Won, J.W.; Lee, W.; Yoon, J. Numerical Simulation of the Effects of Scanning Strategies on the Aluminum Evaporation of Titanium Alloy in the Electron Beam Cold Hearth Melting Process. Materials 2022, 15, 820. [Google Scholar] [CrossRef] [PubMed]
  29. Sahoo, S.; Licata, O.; Mazumder, B.; Roy, S. Novel insights on the near atomic scale spatial distributions of substitutional alloying and interstitial impurity elements in Ti-6Al-4V alloy. J. Alloys Compd. 2022, 907, 164511. [Google Scholar] [CrossRef]
  30. Meng, Y.; Cui, J.; Zhao, Z.; Zuo, Y. Effect of vanadium on the microstructures and mechanical properties of an Al-Mg-Si-Cu-Cr-Ti alloy of 6XXX series. J. Alloys Compd. 2013, 573, 102–111. [Google Scholar] [CrossRef]
  31. Siwiec, G. Elimination of aluminum during the process of Ti-6Al-4V alloy, smelting in a vacuum induction furnace. Arch. Metall. Mater. 2012, 57, 951–956. [Google Scholar] [CrossRef]
  32. Uwanyuze, R.S.; Alpay, S.P.; Schafföner, S.; Sahoo, S. A first principles analysis of oxidation in titanium alloys with aluminum and vanadium. Surf. Sci. 2022, 719, 122026. [Google Scholar] [CrossRef]
  33. Sharma, I.G.; Kale, G.B. A study on preparation and characterization of vanadium master alloys. Trans. Indian Inst. Met. 1995, 48, 197–201. [Google Scholar]
  34. Yoshinaga, H.; Dan, S.; Kawabata, A.; Nishi, S.; Kusamichi, T.; Kamiya, Y.; Tsukahara, M.; Sakai, T. Development of a low-cost vanadium purification process using electro-slag remelting and its application to hydrogen storage alloys. J. Jpn. Inst. Met. 2002, 66, 1340–1344. [Google Scholar] [CrossRef]
  35. Shi, C.; Chen, X.G. Effect of vanadium on hot deformation and microstructural evolution of 7150 aluminum alloy. Mater. Sci. Eng. A 2014, 613, 91–102. [Google Scholar] [CrossRef]
  36. Meng, Y.; Cui, J.; Zhao, Z.; Zuo, Y. Study on Microstructures of Al-4 wt pct V Master Alloys. Metall. Mater. Trans. Phys. Metall. Mater. Sci. 2014, 45A, 3741–3747. [Google Scholar] [CrossRef]
  37. TS/T 579-2014; Vanadium-Aluminium Master Alloy. Standards Press of China: Beijing, China, 2015.
  38. Khiavi, F.B.; Soltanieh, M.; Abbasi, S.M. The effect of refining time and calcium addition on the removal of oxygen, nitrogen, and hydrogen from IN713LC during vacuum induction refining. Vacuum 2022, 197, 110752. [Google Scholar] [CrossRef]
Figure 1. (a) Photograph of AlV65 alloy scrap; (b) XRD pattern of AlV65.
Metals 14 00466 g001
Figure 2. Schematic of the AlV55 alloy preparation process.
Metals 14 00466 g002
Figure 3. Schematic diagram of the reaction furnace system.
Metals 14 00466 g003
Figure 4. Saturated vapor pressures P of different elements in the alloy as a function of temperature T.
Metals 14 00466 g004
Figure 5. Phase diagram of Al-V alloy.
Metals 14 00466 g005
Figure 6. Molecular free path of Al.
Metals 14 00466 g006
Figure 7. Schematic diagram of the Al evaporation process.
Metals 14 00466 g007
Figure 8. XRD pattern of AlV55 alloy.
Metals 14 00466 g008
Figure 9. (a) SEM image and EDS analysis of AlV55 alloy; (b,c) scanning results of (b) Spot 1 and (c) Spot 2 in (a).
Metals 14 00466 g009
Figure 10. Theoretical evaporation rate of Al.
Metals 14 00466 g010
Figure 11. Theoretical and measured values of Al evaporation.
Metals 14 00466 g011
Figure 12. Effect of temperature on the V content and Al evaporation loss of the alloy product.
Metals 14 00466 g012
Figure 13. SEM images of the alloy product obtained at different temperatures: (a) 1973 K, (b) 2023 K, (c) 2073 K, (d) 2123 K, and (e) 2173 K.
Metals 14 00466 g013
Figure 14. Effect of holding time on the V content and Al evaporation of the alloy product.
Metals 14 00466 g014
Figure 15. SEM images of the alloy product obtained at different holding times: (a) 5 min, (b) 10 min, (c) 15 min, (d) 20 min, and (e) 25 min.
Metals 14 00466 g015
Figure 16. Effect of material ratio on V content.
Metals 14 00466 g016
Figure 17. Impurity removal effect.
Metals 14 00466 g017
Figure 18. (a) Photograph of the alloy section with sampling points indicated; (bf) SEM images of the sampling points: (b) Point 1, (c) Point 2, (d) Point 3, (e) Point 4, and (f) Point 5.
Metals 14 00466 g018
Table 1. Materials used in the experiments.
MaterialFormPurity (%)Size
AlV65particle>99.5%10–20 mm
Alparticle>99.8%10–20 mm
Argas>99.9%
Table 2. Saturated vapor pressure equations for each element.
ElementalSaturated Vapor Pressure Equation
Allgp = −16,380T−1 − lgT + 14.44
Vlgp = −26,900T−1 + 0.33gT − 0.265 × 10⁻³ + 12.24
Felgp = −19,710T−1 − 1.27lgT + 15.39
Silgp = −20,900T−1 − 0.565lgT + 12.9
Crlgp = −20,680T−1 − 1.31lgT + 16.68
Table 3. Diffusion coefficients Km of Al in the liquid phase.
T (K)192319732023207321232173
Km (cm/s)2.21 × 10−32.68 × 10−33.11 × 10−33.51 × 10−33.88 × 10−34.25 × 10−3
Table 4. Interfacial evaporation rate constants KAl of Al.
T (K)192319732023207321232173
KAl (cm/s)2.43 × 10−44.05 × 10−46.56 × 10−41.03 × 10−31.59 × 10−32.41 × 10−3
Table 5. Mass-transfer coefficients of Al in the gas phase.
T (K)192319732023207321232173
P (Pa)
1014.23 × 10−34.29 × 10−34.34 × 10−34.4 × 10−34.45 × 10−34.50 × 10⁻³
1025.58 × 10−45.65 × 10−45.72 × 10−45.8 × 10−45.86 × 10−45.93 × 10⁻⁴
1033.40 × 10−53.45 × 10−53.49 × 10−53.54 × 10−53.58 × 10−53.62 × 10⁻⁵
1042.77 × 10−52.80 × 10−52.84 × 10−52.88 × 10−52.91 × 10−52.94 × 10⁻⁵
1052.12 × 10−52.15 × 10−52.18 × 10−52.21 × 10−52.23 × 10−52.26 × 10⁻⁵
Table 6. Experimental conditions in the pressure study.
Reaction Temperature
(K)
Holding Time
(min)
AlV65:Al Mass RatioPressure
(Pa)
2023109.1:160
1000
2000
10,000
100,000
Table 7. Experimental conditions in the temperature study.
Reaction Temperature
(K)
Holding Time
(min)
AlV65:Al Mass RatioPressure
(Pa)
1973109.1:12000
2023
2073
2123
2173
Table 8. Experimental conditions in the holding time study.
Reaction Temperature
(K)
Holding Time
(min)
AlV65:Al Mass Ratio Pressure
(Pa)
202359.1:12000
10
15
20
25
Table 9. Experimental conditions in the material ratio study.
Reaction Temperature (K)Holding Time
(min)
AlV65:Al Mass RatioPressure
(Pa)
2023107.1:12000
8.1:1
9.1:1
10.1:1
11:1
Table 10. The composition of the AlV55 alloy for commercial application (TS/T 579-2014 [37]).
Content of Element (wt%)
VOCNSiFeAl
55–60 0.18 0.1 0.04 0.25 0.25Remainder
Table 11. Composition of the alloy product.
Content of Element (wt%)
VOCNAl
57.480.00730.030.013Remainder
Table 12. Elemental contents of different sampling points.
ElementSpot 1Spot 2Spot 3Spot 4Spot 5
V (wt%)57.257.157.657.657.3
Al (wt%)42.842.942.442.442.7
Disclaimer/Publisher’s Note: The statements, opinions and data contained in all publications are solely those of the individual author(s) and contributor(s) and not of MDPI and/or the editor(s). MDPI and/or the editor(s) disclaim responsibility for any injury to people or property resulting from any ideas, methods, instructions or products referred to in the content.

