
Corrosion Behavior of FeCrMnxAlCu High-Entropy Alloys in NaOH Solutions

1
School of Materials Science and Engineering, Lanzhou University of Technology, Lanzhou 730050, China
2
State Key Laboratory of Advanced Processing and Recycling of Nonferrous Metals, Lanzhou University of Technology, Lanzhou 730050, China
*
Author to whom correspondence should be addressed.
Metals 2024, 14(4), 468; https://doi.org/10.3390/met14040468
Submission received: 18 March 2024
/
Revised: 14 April 2024
/
Accepted: 16 April 2024
/
Published: 17 April 2024
Abstract
:FeCrMnxAlCu (x = 2.0, 1.5, 1.0, 0.5, and 0.0) high-entropy alloys (HEAs) were prepared using vacuum arc melting. The phase structure, microstructure, and element distribution of FeCrMnxAlCu (x = 2.0, 1.5, 1.0, 0.5, and 0.0) HEAs were analyzed using X-ray diffraction, scanning electron microscopy, and energy-dispersive spectroscopy. The corrosion resistance of the alloy in a NaOH solution was evaluated using a potentiodynamic polarization curve, electrochemical impedance spectroscopy, an immersion test, WLI, and X-ray photoelectron spectroscopy. The results showed that FeCrMnxAlCu HEAs are an FCC+BCC bi-phase mixed structure with typical dendrite and interdendrite structures. The corrosion test demonstrated that the HEAs presented a breakthrough characteristic of activation–passivation–passivation. With an increase in Mn content, the corrosion potential shifted first positively and then negatively, and the corrosion current first decreased and then increased. Among HEAs, the FeCrMn0.5AlCu HEA had the best electrochemical corrosion resistance. After corrosion, both oxide and hydroxide corrosion product films were formed on the surface, which reduced the ion diffusion rate, slowed down the corrosion process, and improved the corrosion resistance.
1. Introduction
High-entropy alloys (HEAs) are a new type of alloy with a unique compositional structure characterized by the presence of five or more alloying elements in approximately equal molar ratios [1,2,3,4]. HEAs exhibit excellent mechanical properties and high temperature and corrosion resistance owing to their special chemical composition and microstructure [5,6]. These properties mean that HEAs demonstrate considerable potential for application in many fields, such as aerospace, the automotive industry, and biomedicine. Thus, they have become a hotspot in materials science research [7,8]. The application of HEAs and their performance in terms of corrosion resistance have not been completely explored; moreover, corrosion is one of the major contributors to material failure in a wide range of industrial and environmental applications, with its impact on the global economy estimated to be as high as 3% of the world’s gross national product [9,10]. In particular, the strong alkalinity of NaOH solutions is an important corrosion threat to conventional materials in industries involving chemical processing, detergent production, and pulp processing. Corrosion suffered by materials in such strongly alkaline environments not only leads to damage to their physical structure but may cause a reduction in productivity and an increase in maintenance costs. Therefore, the compositional design and elemental selection of alloys for corrosion in alkaline environments is extremely important. Bosch [11] et al. performed an in-depth study on the corrosion behavior of high manganese austenitic Fe-Mn-Al-Cr-C steel in NaCl and NaOH solutions. The results of the study demonstrated that pitting corrosion is the primary form of corrosion of this material in NaOH solutions. The Al element played an important role in the formation of the protective Al2O3 passivation film, which effectively enhanced the corrosion resistance of the material. However, the high concentration of manganese in the steels increased their corrosion susceptibility; MBIP steels in particular showed high corrosion susceptibility. Abedini [12] et al. investigated the corrosion behavior of Zn-Ni-Mn alloy coatings prepared by electrodeposition in alkaline solutions containing Mn salts. They evaluated the effect of the Mn2+ concentration of the electrolyte and deposition potential on the surface morphology, phase structure, and corrosion properties of the alloy coatings. Corrosion polarization analysis demonstrated that increased Mn contents in the Zn-Ni-Mn alloy coatings considerably improved their corrosion resistance compared to the Zn-Ni-only coatings, as confirmed by the enhancement of the passivation film quality. Note that a considerable increase in polarization resistance and a considerable decrease in corrosion current density was observed. Analyzing the corroded alloy coatings using X-ray diffraction (XRD) and X-ray photoelectron spectroscopy (XPS) confirmed that the passivation layer was primarily composed of zinc hydroxide chloride, zinc oxide, zinc hydroxide carbonate, and manganese oxide. Zhu [13] et al. investigated the corrosion behavior of austenitic Fe30.8Mn8.2Al alloys in a range of aqueous solutions with pH values ranging from −0.8 to 15.3. They compared the corrosion behavior of the Fe-30Mn alloy with that of other steels and demonstrated that the addition of 30 wt.% manganese to mild steel considerably affected its corrosion resistance in aqueous solutions.
Nevertheless, Mn still plays an important role in mechanical properties, such as transformation-induced plasticity (TRIP) and/or twinning-induced plasticity (TWIP) effects [14,15]. Therefore, it is necessary to carry out corrosion experiments of Mn on high-entropy alloys to further explore the deep mechanism of the influence of Mn and various alloying elements on the corrosion properties. In this study, we demonstrate that elemental Mn has a considerable influence on the stability of the phase structure, mechanical properties, and corrosion resistance of alloys owing to its ability to exist in a variety of oxidation states and exhibit considerable chemical reactivity [16,17]. Therefore, Mn is considered an important element in the compositional design of HEAs. Although HEAs have demonstrated excellent performance in many applications, their corrosion resistance to NaOH solutions, especially the effect of the content of the trace element Mn on this performance, has not been completely investigated and understood. Therefore, this study aimed to make a detailed investigation of the effect of Mn content on the corrosion resistance of FeCrMnxAlCu HEAs in NaOH solutions.
2. Materials and Methods
2.1. Preparation of the FeCrMnxAlCu HEAs
In this experiment, Al, Cr, Cu, Fe, and Mn metal particles with purity as high as 99.9% were selected as raw materials. A series of FeCrMnxAlCu HEAs were prepared by vacuum arc melting along with a copper mold casting technique, for which the values of x were 2.0, 1.5, 1.0, 0.5, and 0.0. Ingots were remelted at least five times in an Ar atmosphere to ensure a uniform distribution of the composition. Subsequently, these ingots were drop-cast into Cu molds with an inner diameter of 60 mm; the mass of each ingot was ~200 g. The ingots were then cooled in the copper mold, removed, and cut into 10 mm × 10 mm × 3 mm specimen blocks with a wire cutter. They were then then sanded, polished, cleaned, and dried before being prepared for use. In these alloys, the nominal content of Mn was 0, 11.1, 20.0, 27.3, and 33.3 at%, which was expressed as Mn0, Mn0.5, Mn1.0, Mn1.5, and Mn2.0, respectively. Note that the chemical composition of the alloys is listed in Table 1.
2.2. Electrochemical Corrosion Test
The electrochemical corrosion test of the specimens was performed as follows: a Cu wire was soldered to the bottom of one end of the specimen and then a working surface of 10 × 10 mm was left and sealed in epoxy resin and placed in a desiccator for curing. Tests were performed using an electrochemical workstation (CHI 760E, Chenhua, Shanghai, China), with an HEA as the working electrode, a platinum sheet as the counter electrode, mercuric oxide as the reference electrode, and a 1 M NaOH solution as the electrolyte. Before testing, the samples were left in the electrolyte for >1 h to reach a stable open-circuit potential. The electrochemical impedance spectroscopy (EIS) test was performed under open-circuit conditions at a frequency ranging from 0.005 to 105 Hz and an amplitude of 0.01 V. The kinetic polarization curve test was performed at a voltage range of −0.6 to +0.8 V with a scanning rate of 0.01 mV/s. To minimize the testing error, three parallel samples were tested in each group.
2.3. Corrosion Immersion Test
To assess the corrosion resistance of HEAs, a corrosion immersion test was used. Three parallel specimens were used for each group of samples during the test to ensure the reliability of the experimental results. Before the corrosion immersion test, the specimens were polished, cleaned, dried, and weighed. The treated specimens were submerged in 1 M NaOH for 168 h, and the corrosion solution was replaced every 48 h to ensure that the specimens were always in a consistent corrosive environment during the corrosion process. After the immersion test, the specimens were ultrasonically cleaned and dried.
2.4. Material Characterization
The crystal structure of the HEA was analyzed by XRD (Bruker D-8 Focus, Billerica, MA, USA) using Cu target Kα rays (λ = 0.15418 nm) at 40 kV and 40 mA for scans ranging from 20° to 90° with a step size of 0.02° and a speed of 4°/min. The alloy was etched with aqua regia (HCl: HNO3 = 3:1) before corrosion. The etching liquid was Aqua regia and the etching time was 30 s. Then, the alloy was washed with anhydrous ethanol. The micro-morphology and elemental distribution of samples before and after corrosion was observed using a scanning electron microscope with an energy spectrometer (SEM&EDS, Quanta FEG250, FEI, Waltham, MA, USA). The elemental analyses of alloy surfaces were performed using an X-ray photoelectron spectrometer (XPS, Thermo Scientific K-Alpha+, Waltham, MA, USA) with monochromatic Al Kα rays (λ = 1486.6 eV) as a light source at 100 W and in vacuum-like conditions (p < 10−8 bar). All data were calibrated against the C1s peak (284.8 eV) and analyzed by peak fitting using software. Following the corrosion immersion tests, the 3D morphology and surface roughness of alloy surfaces were determined using a white light interferometer (WLI, SuperView W3, CHOTEST, Shenzhen, China) in combination with a 50× microscope. The interferometer had a 100 mm stroke, 0.75% accuracy, 0.1% repeatability, and a scanning range of 0 to 10 nm.
3. Results
3.1. Phase Structure of FeCrMnxAlCu HEAs
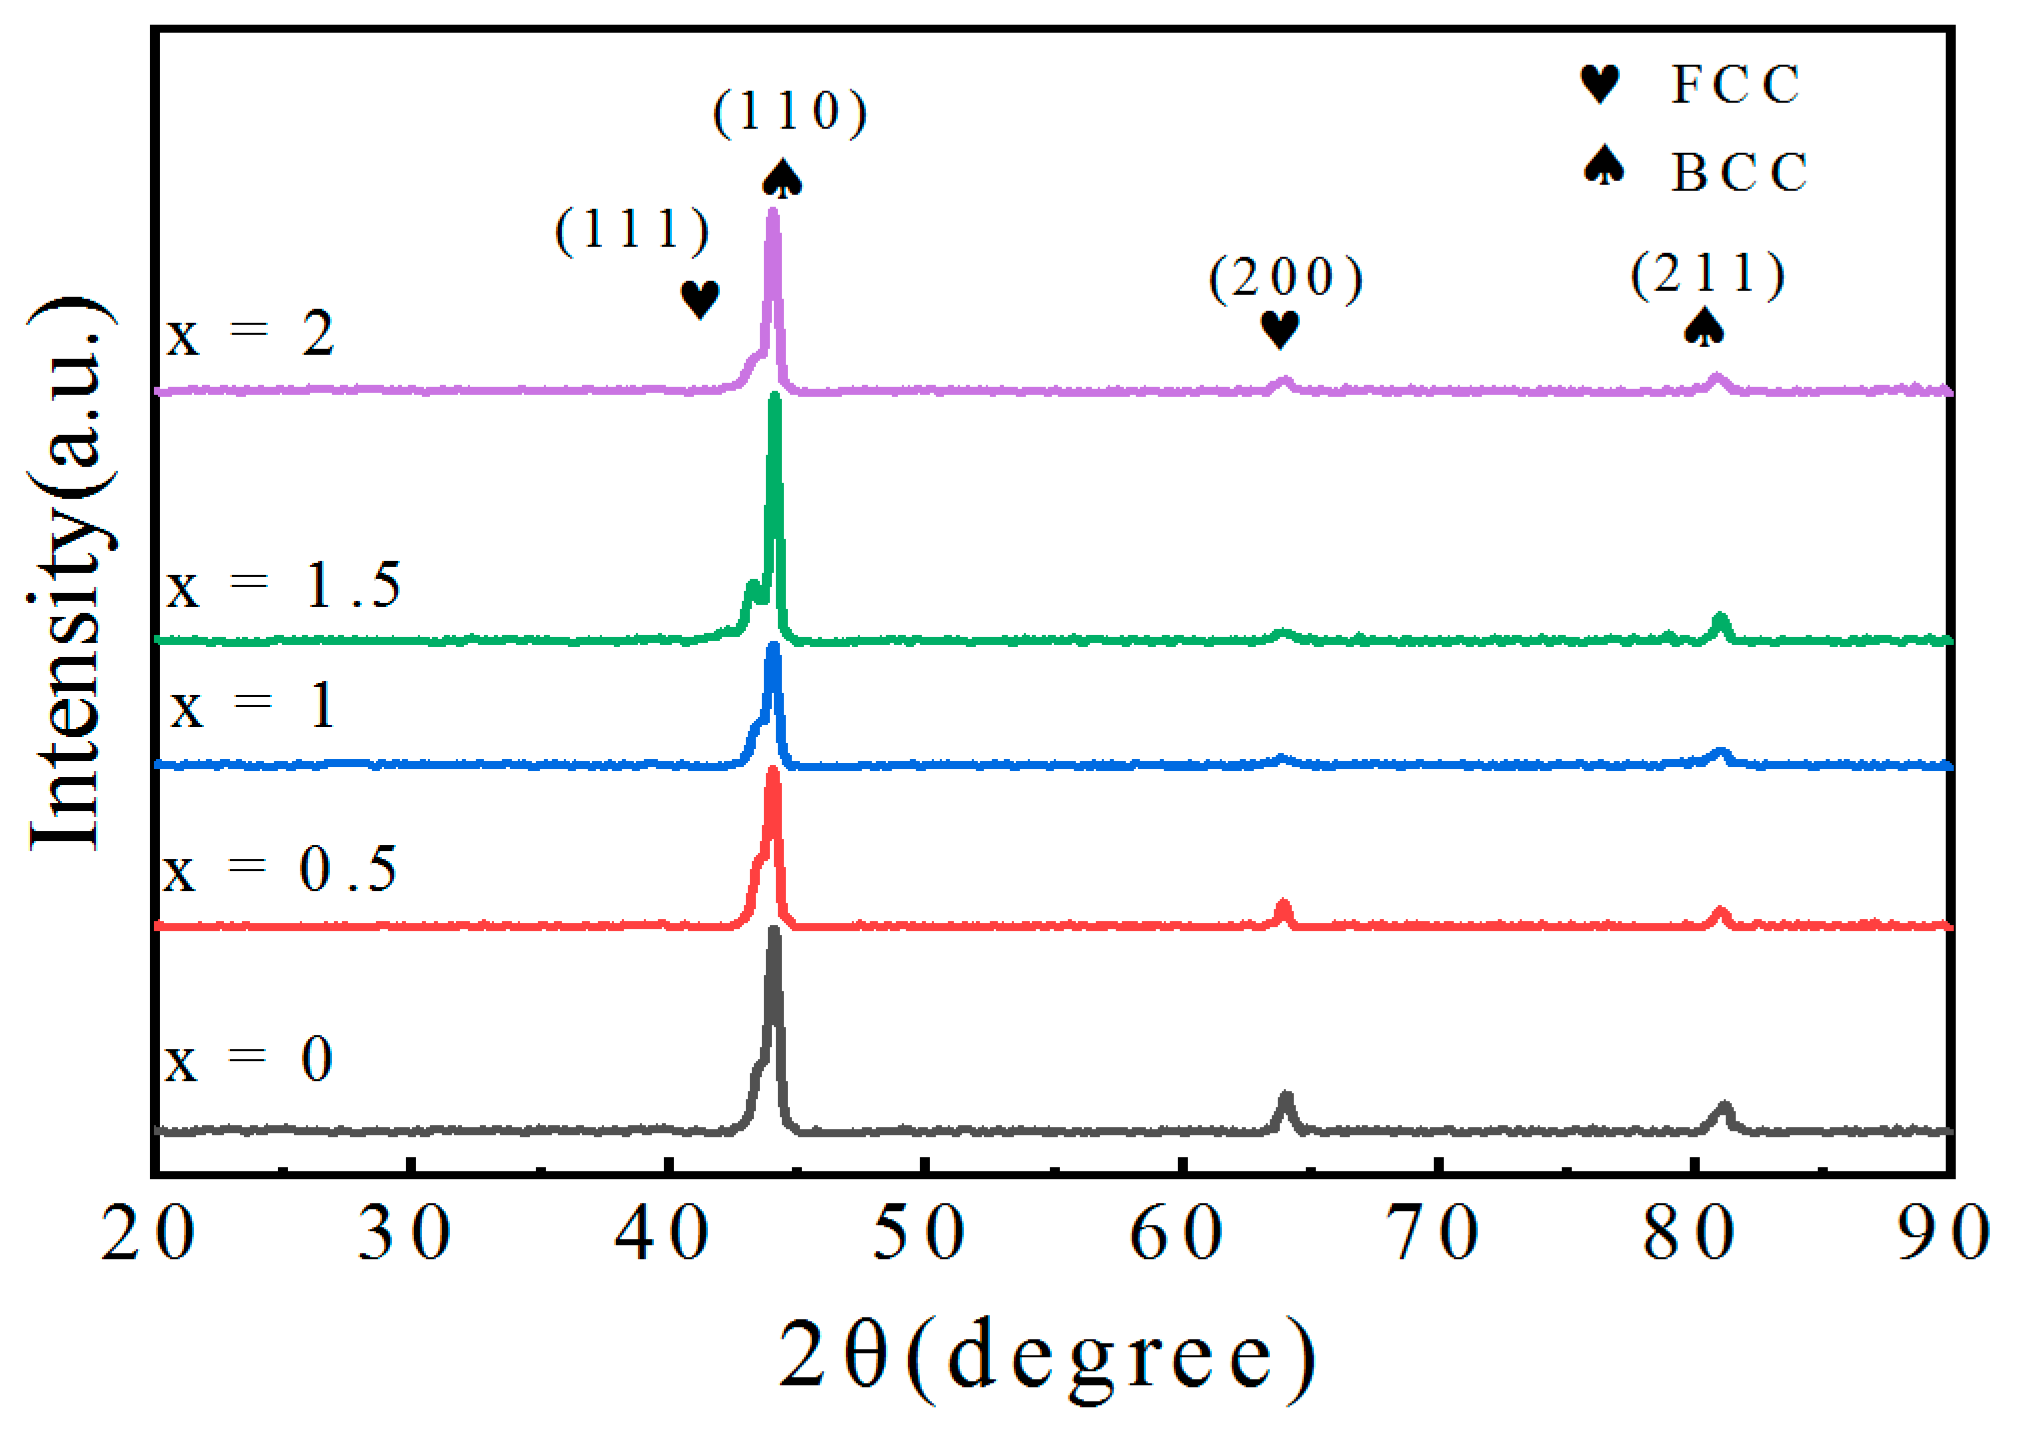
The XRD patterns of the FeCrMnxAlCu (x = 0, 0.5, 1.0, 1.5, and 2.0) HEA alloys are illustrated in Figure 1. The alloys exhibited a two-phase mixed organization comprising FCC and BCC structures. In particular, the (111) and (200) diffraction peaks corresponded to the FCC phase, while the (110) and (211) diffraction peaks were attributed to the BCC phase. In addition to these major characteristic peaks, no other diffraction signals of the precipitated phases were observed. With the increase in Mn content, the diffraction peak intensities of the BCC phase demonstrated a tendency to decrease and then increase. Furthermore, the diffraction peak intensities of the BCC phase were higher than those of the FCC phase in all specimens with different Mn contents.
3.2. Microstructural Analysis of FeCrMnxAlCu HEAs
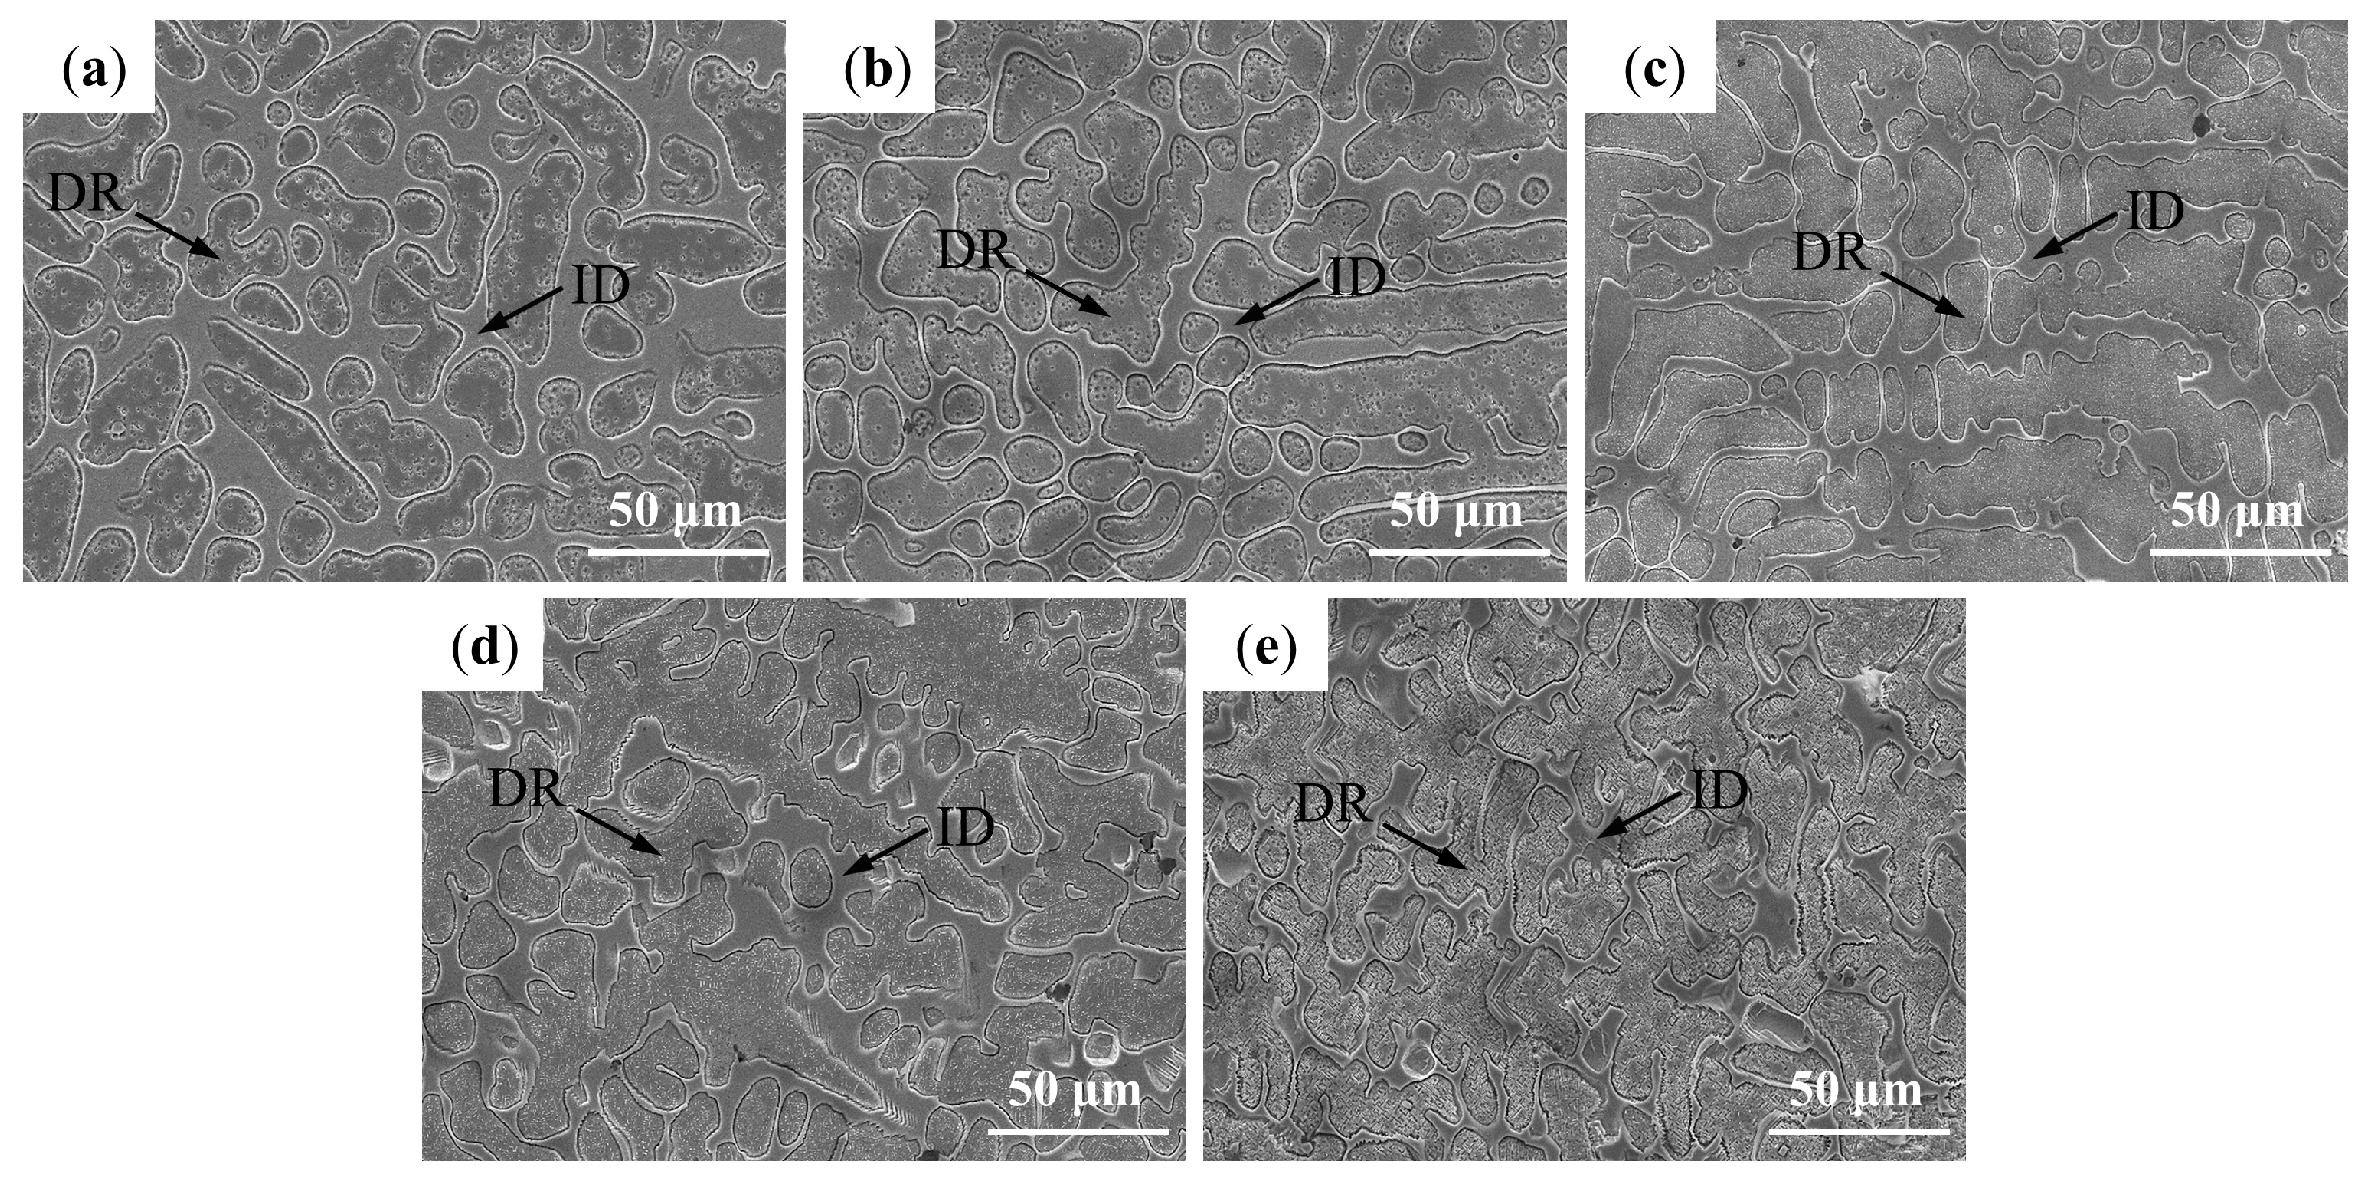
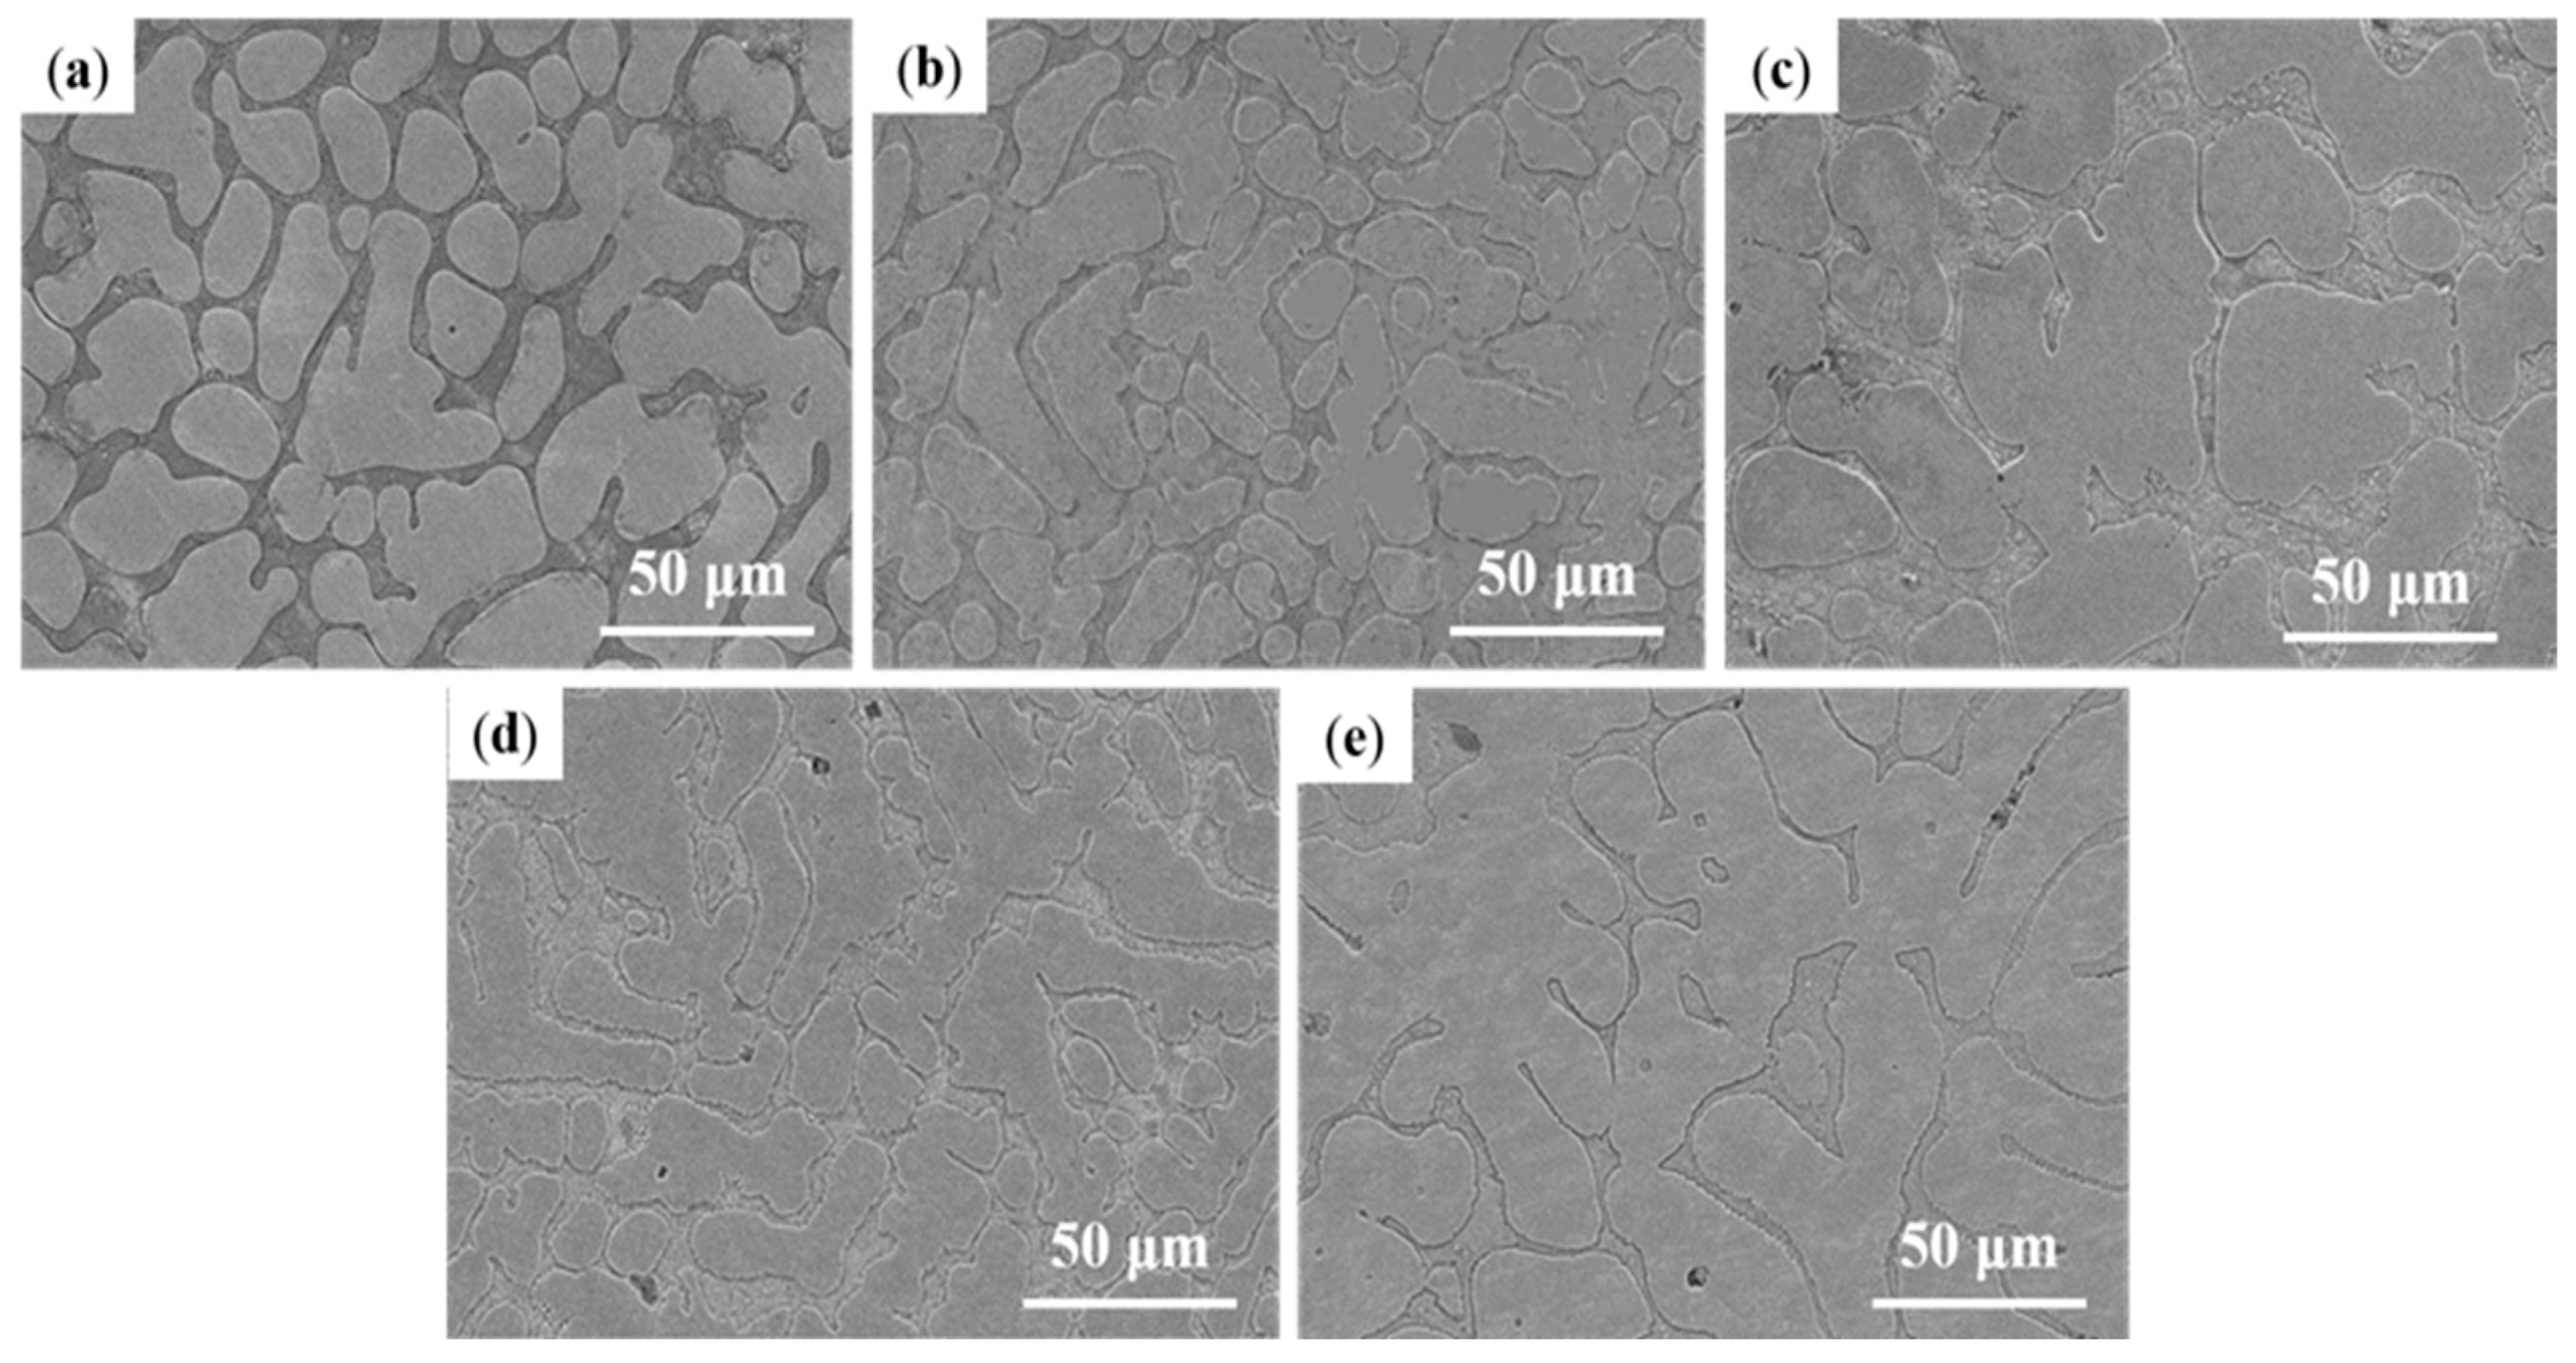
Figure 2 shows the scanning electron microscopy images of FeCrMnxAlCu HEAs; all samples exhibited dendritic crystal microstructures, and two regions of dendrites (DR) and inter-dendrites (ID) can be seen in the figure. With the increase in Mn content, the thickness and length of the dendrites changed. Figure 2a–c demonstrate that with the increase in Mn content, the dendrites became thicker and increased in length, which may be attributed to the addition of Mn causing a change in the crystal growth rate. This, in turn, affected the morphology of the dendrites. Figure 2d–e show that the additional increase in Mn content resulted in relatively unstable changes in the thickness and length of the dendrites. This may indicate that the addition of Mn has a considerable effect on the morphology of dendritic crystals within a certain range; however, when the Mn content exceeds a certain threshold, the effect may become complex or unstable.
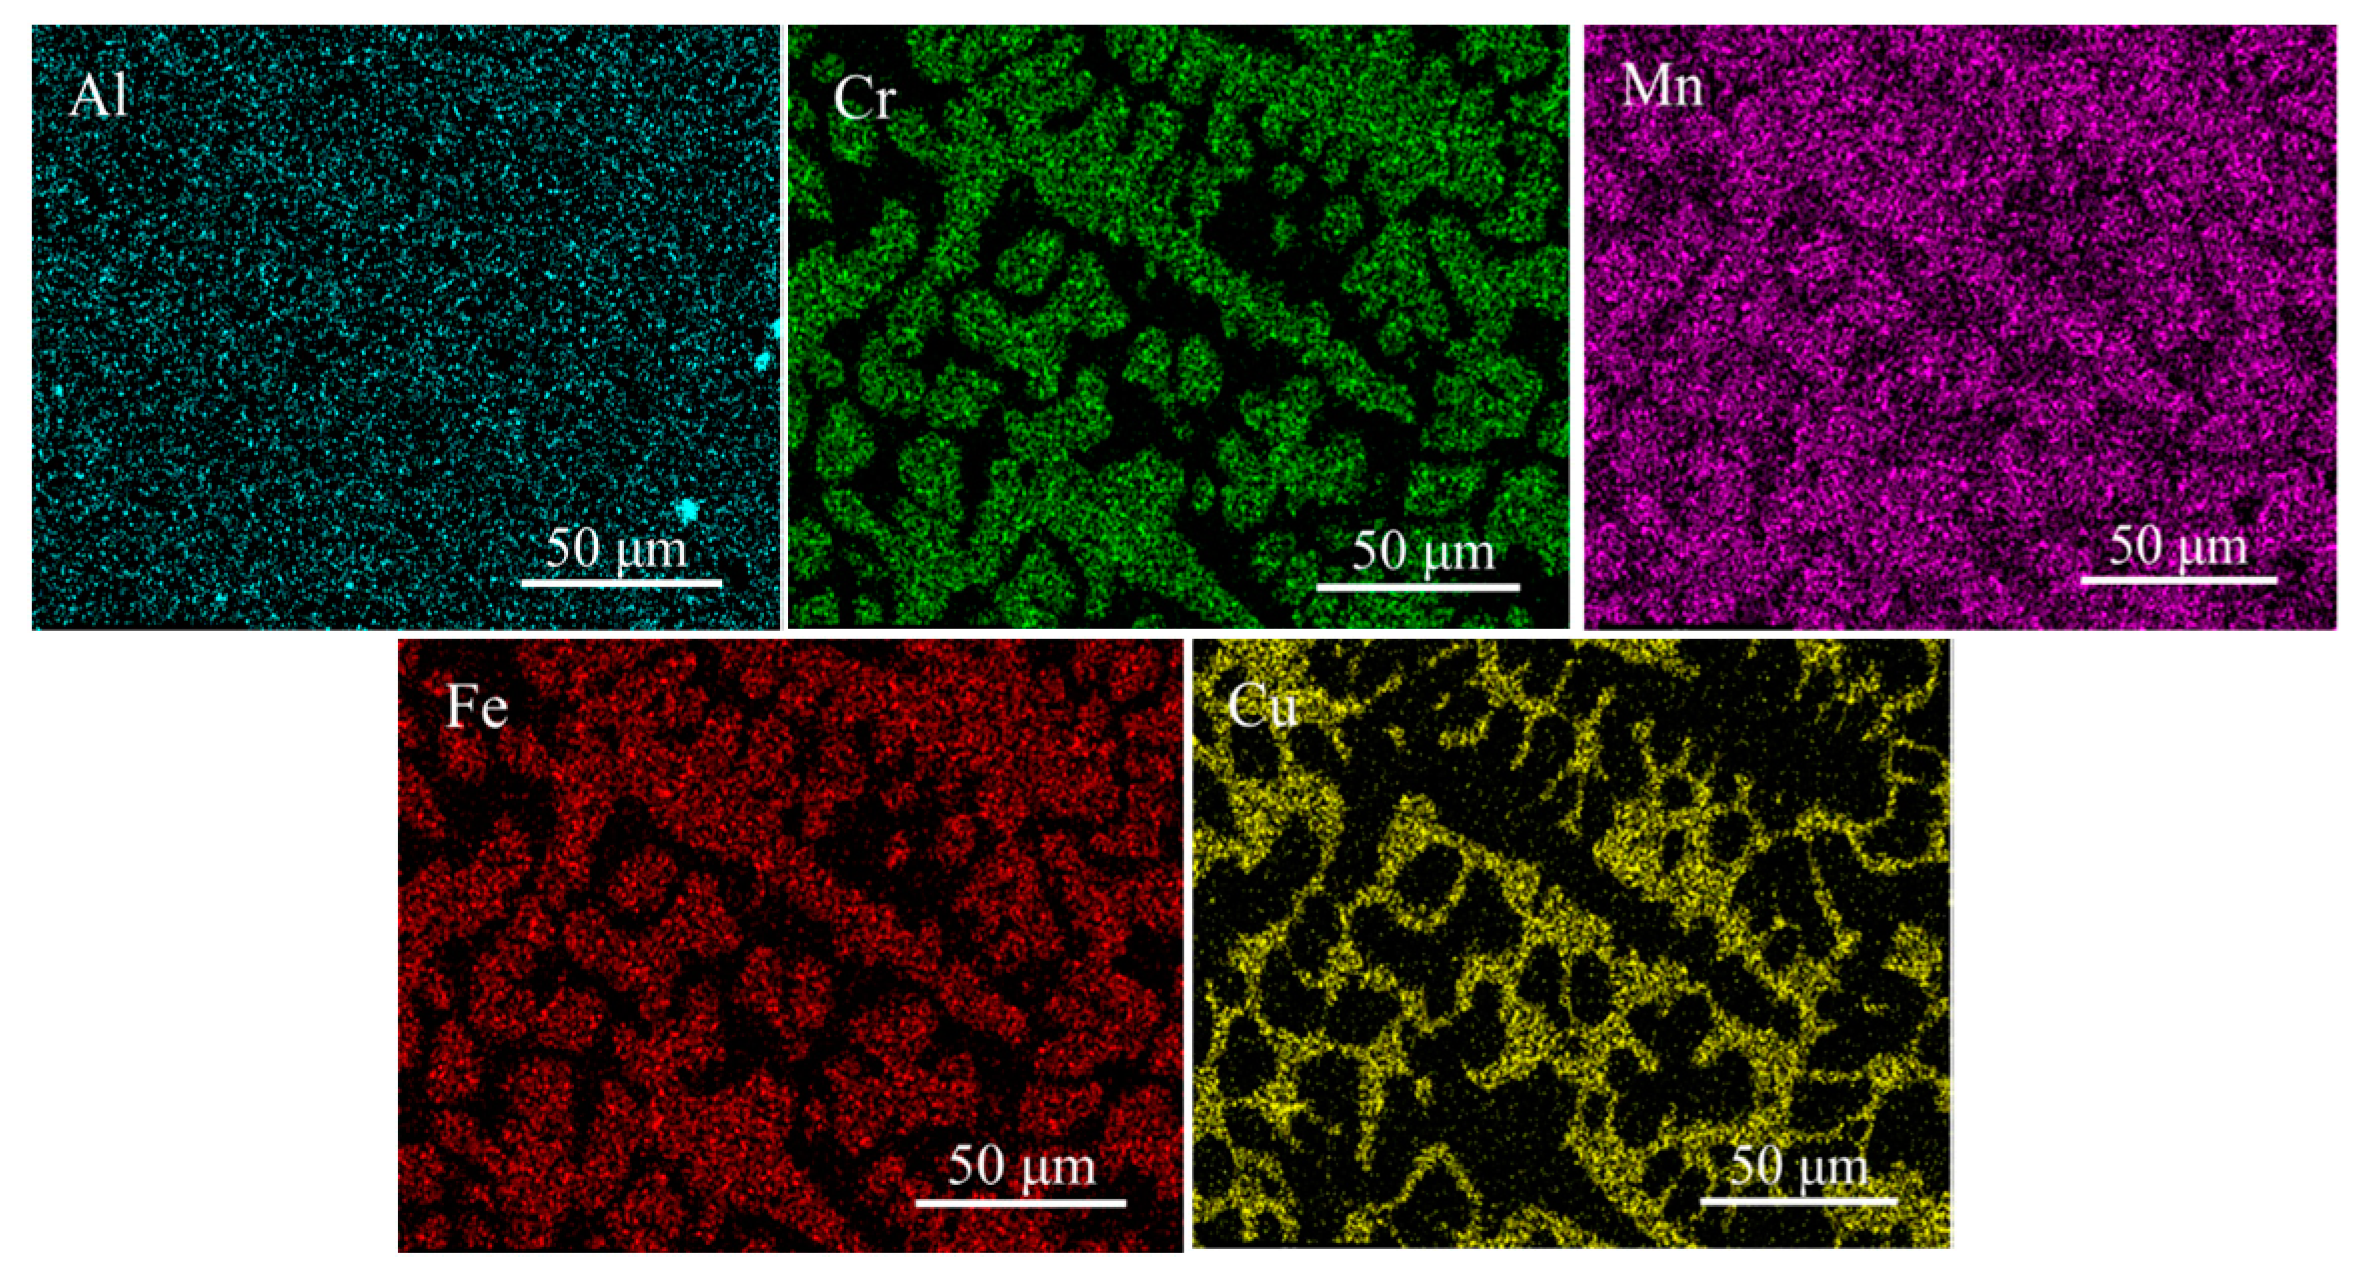
The EDS map of the FeCrMn1.5AlCu HEAs is demonstrated in Figure 3. Comparison with the compositional analysis of the FeCrMnxAlCu HEAs in Table 2 confirms that the chemical compositions of samples were determined using standard compositions, and these data provide clear information about the distribution characteristics of the elements in these alloys. In the FeCrMnxAlCu HEAs, Fe, Cr, and Mn tended to concentrate within the dendrites during solidification, whereas Cu favored the inter-dendritic region, and Al was more uniformly distributed in the dendritic and inter-dendritic regions. Table 2 shows that increasing the Mn element content promoted the bias of Fe and Cr elements within the dendrites and the bias of Cu elements between the dendrites.
3.3. Electrochemical Corrosion Properties of FeCrMnxAlCu HEAs
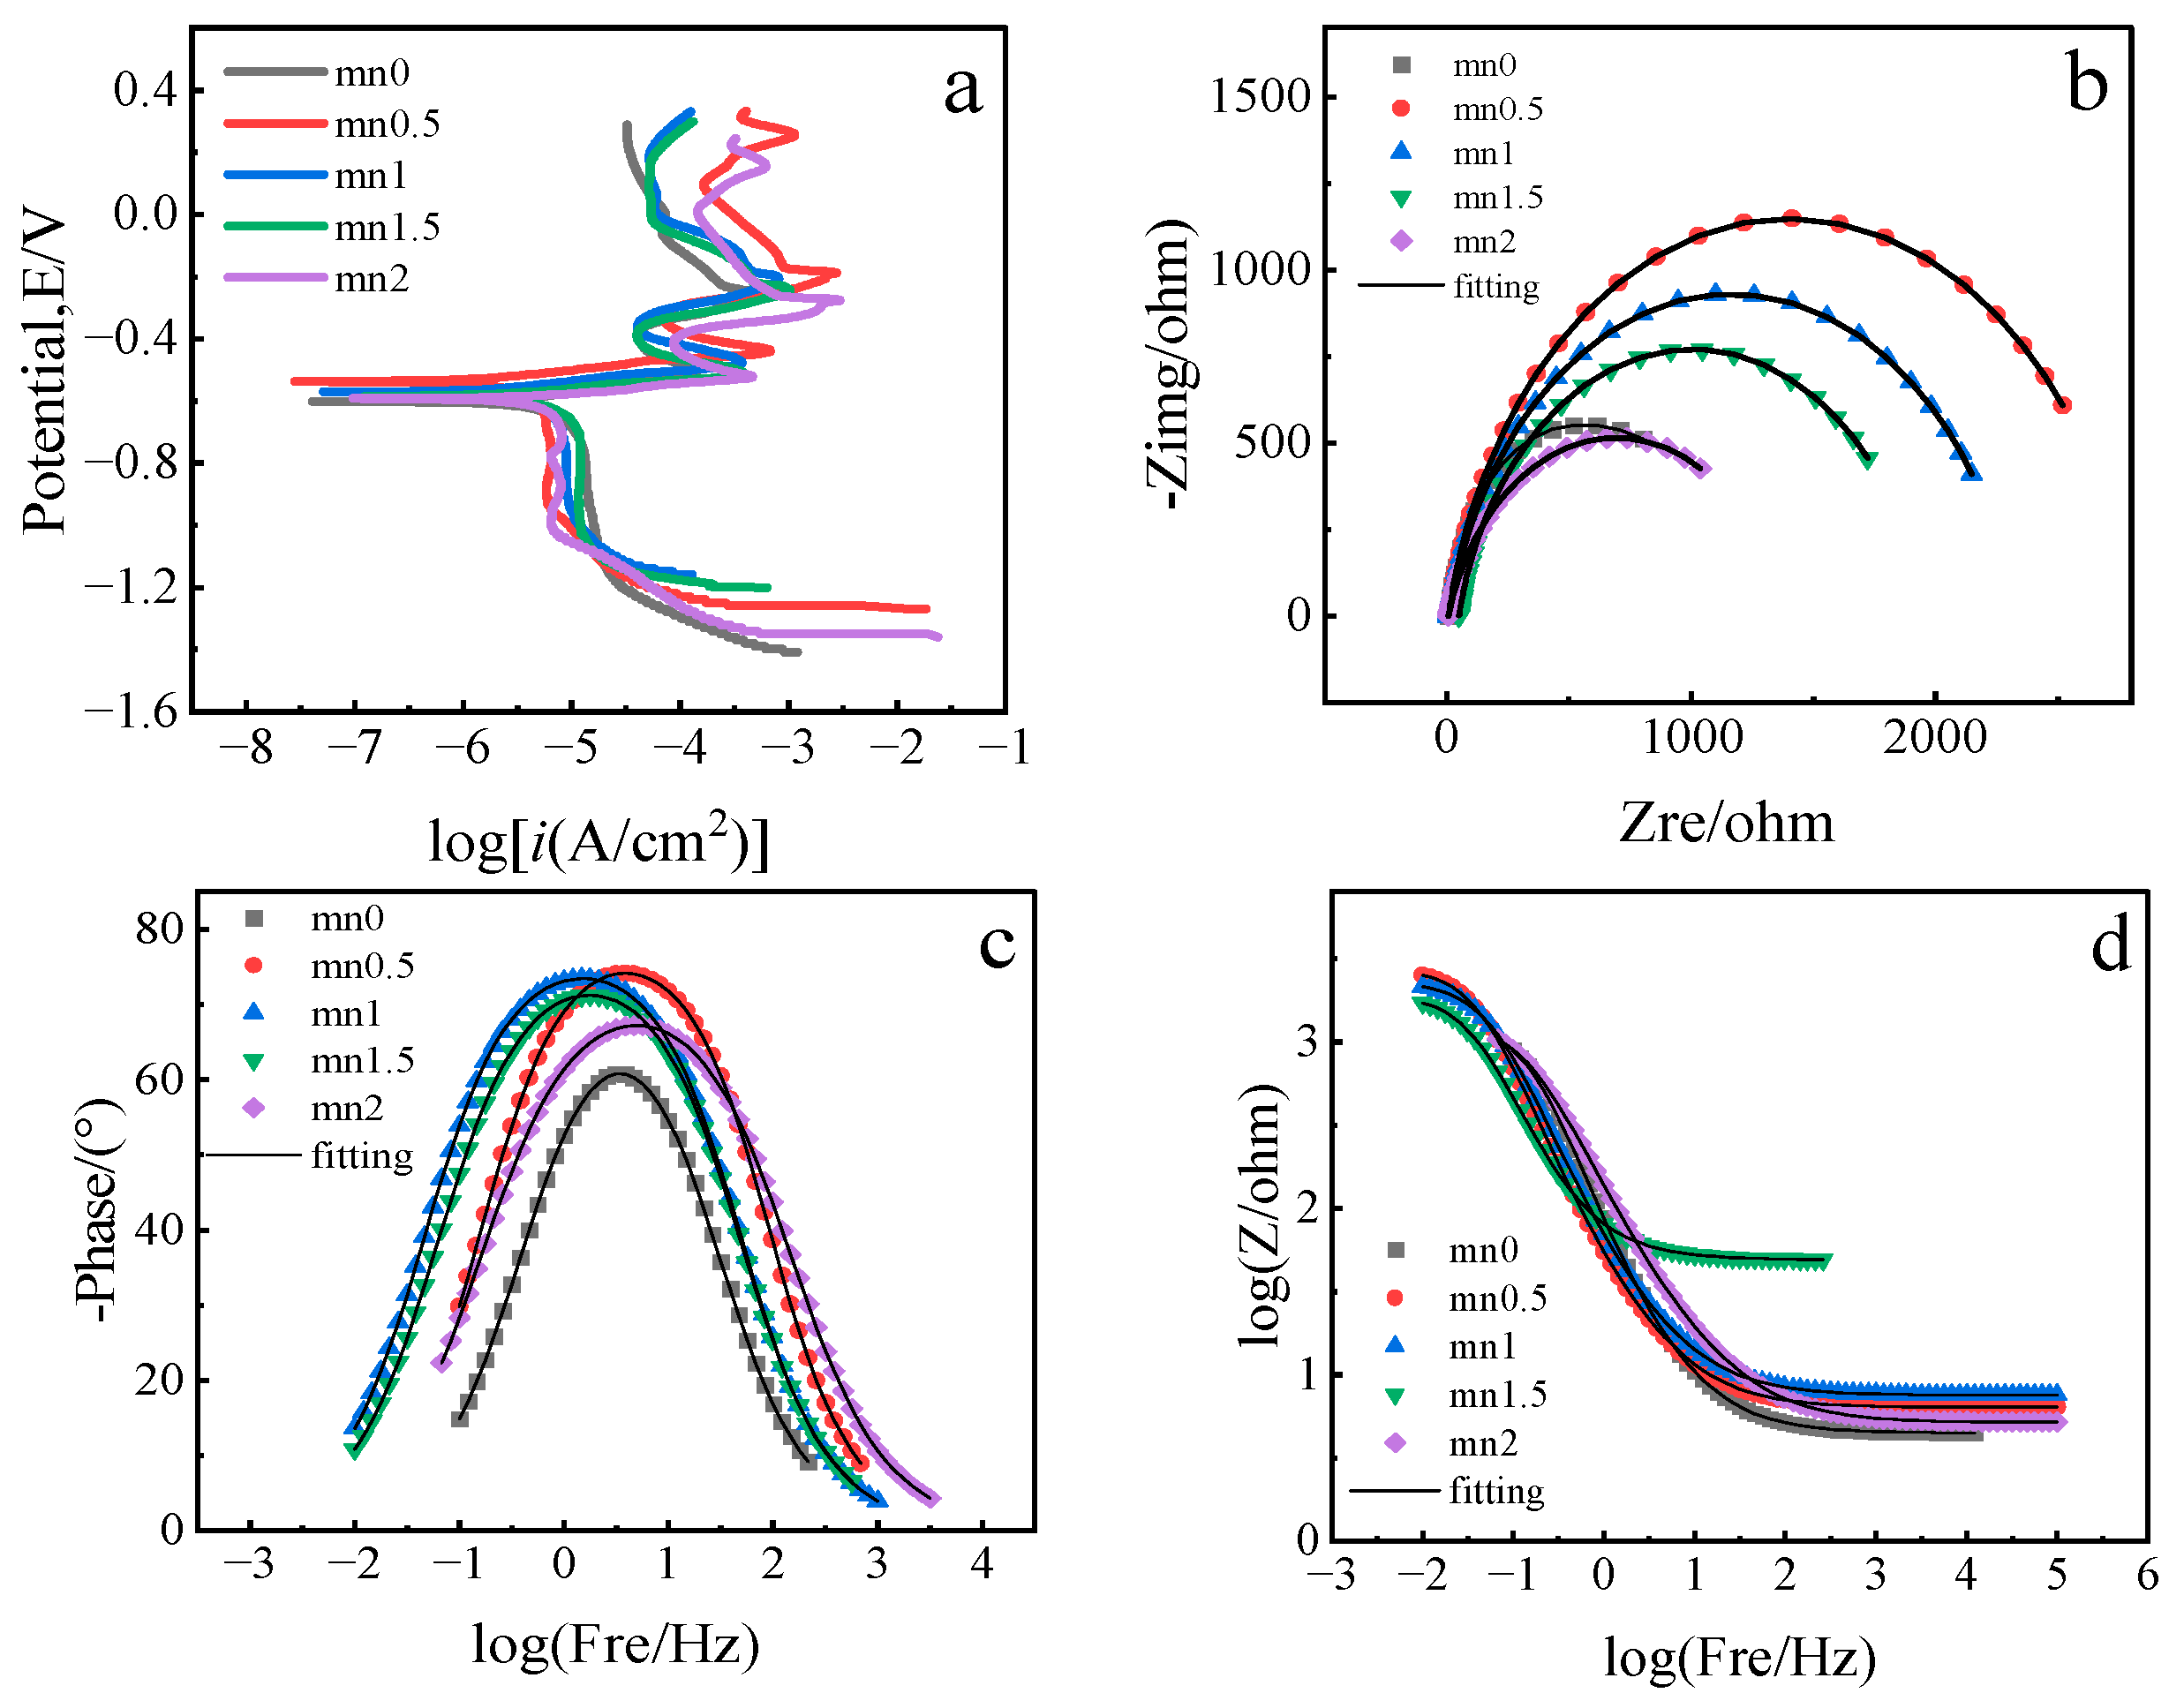
Figure 4a shows the kinetic potential polarization curves of the FeCrMnxAlCu HEAs in 1 M NaOH. The curve analysis showed that all samples exhibited passivation, with a reduction in current density in a certain potential range. With the increase in the potential, passivation breakthrough occurred at the end of the passivation interval, which indicated passivation film disruption and an increased corrosion rate. The electrochemical parameters (Ecorr, Icorr, and Rp) obtained by polarization curve fitting are listed in Table 3. Both corrosion currents and potentials of the samples were similar, thus resulting in insignificant differences in corrosion rates. The increase in Mn content initially resulted in a slight increase in corrosion potential (from Mn0 to Mn0.5), followed by a slight decreasing trend. The corrosion current initially decreased but gradually increased with an additional increase in Mn content. The FeCrMn0.5AlCu HEA exhibited superior electrochemical properties, with a more positive self-corrosion potential (−0.538 V), lower self-corrosion current density (3.045 × 10⁻⁶ A/cm2), and higher polarization resistance (7158.3 Ω·cm2). Therefore, the corrosion resistance of HEAs in a 1 M NaOH solution demonstrated a tendency to enhance and then decrease with an increase in Mn content, which was always better than that of the Mn-free alloys, with FeCrMn0.5AlCu HEAs demonstrating the best corrosion resistance. In addition, the FeCrMnxAlCu HEAs exhibited better corrosion resistance compared to some metal monomers (Al), high-entropy alloy coatings (Al2CoCrCuFeNiTi2), and Q235 steel, which may be related to the higher number of passivation-prone element types and contents in the alloy. Figure 4b shows the Nyquist plot of the electrochemical AC impedance test of specimens in a 1 M NaOH solution. The figure shows that all five alloys had typical capacitive impedance characteristics, and the curves demonstrated a semicircular shape. The alloys with different Mn contents exhibited different semicircular diameters; moreover, the radius of the capacitive resistance arc first increased and then gradually decreased with the increase in Mn content, indicating that the corrosion resistance of these alloys changed. Figure 4c,d show the Bode phase angle plots and Bode mode plots of the electrochemical AC impedance tests of specimens in a 1 M NaOH solution, respectively. The plots show that the curves of all samples showed a similar trend in which both the phase angle and impedance modes increased and then decreased with the increase in Mn content. Larger arcs, increased phase angles, and higher impedance mode values indicated greater resistance to charge transfer in electrochemical reactions, which is usually considered an important indicator of a material’s corrosion resistance [16]. Therefore, the order of strength of corrosion resistance of the specimens was as follows: FeCrMn0.5AlCu > FeCrMnAlCu > FeCrMn1.5AlCu > FeCrMn2.0AlCu > FeCrAlCu. Despite these differences, the corrosion rates of the five alloys did not considerably differ, and all of them demonstrated good corrosion resistance. The Mn0.5 alloy exhibited the largest semicircular diameter, the highest phase angle, and the largest impedance modulus. This indicated that the FeCrMn0.5AlCu HEA had the lowest corrosion rate and, hence, the best corrosion resistance in 1 M NaOH.
Table 4 shows the electrochemical impedance spectra (EIS) fitting parameters of FeCrMnxAlCu HEAs in 1 M NaOH. The data showed that the charge transfer resistance (Rct) exhibited an increasing and then decreasing trend with increasing Mn content, with the FeCrMn0.5AlCu HEA possessing the highest Rct value, which was associated with a lower corrosion rate. The FeCrMn0.5AlCu alloy exhibited the lowest Y0 value, which was indicative of a more homogeneous surface or a more complete passivation layer. Moreover, the n value of this alloy was closest to 1, indicating that its capacitive behavior was closer to the ideal state. In summary, the FeCrMn0.5AlCu HEA showed excellent electrochemical properties under the same test conditions; moreover, its high charge transfer impedance and CPE parameters close to the ideal capacitive behavior confirmed its excellent corrosion resistance.
Figure 5 demonstrates the corrosion surface morphology of FeCrMnxAlCu HEAs after polarization in 1 M NaOH. Figure 5a–e show that all FeCrMnxAlCu HEAs exhibited inter-dendritic selective corrosion. In the FeCrAlCu HEA (Figure 5a), the larger grain boundaries became regions where corrosive media accumulated, leading to the occurrence of localized corrosion. By adding Mn, the FeCrMn0.5AlCu alloy showed fewer defects and sharper grain boundaries; however, when the Mn content was increased to 1.0 and 1.5, defects at the grain boundaries became more pronounced, which increased the complexity of the surfaces and provided more pathways for corrosive media to attack. When the Mn content reached 2.0, the irregularities at grain boundaries increased further and surface defects were more pronounced.
3.4. Immersion Corrosion Performance of FeCrMnxAlCu HEAs
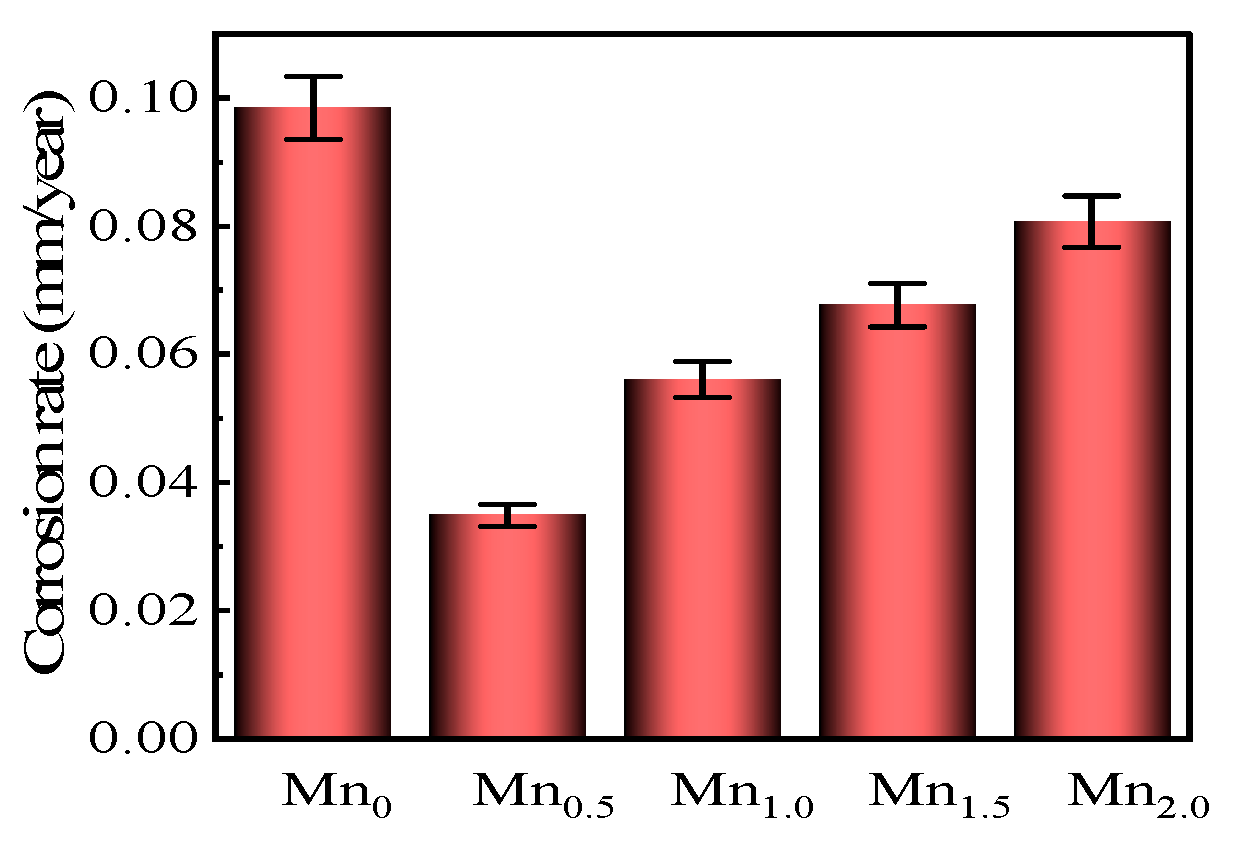
Figure 6 shows the histogram of the corrosion rate of the FeCrMnxAlCu HEAs after immersion, and the average corrosion rate of the alloys was calculated using Equation (1) [20]:
where ΔW is the mass loss of the specimen before and after corrosion (g), t is the immersion time in the corrosion solution (h), A is the surface area of the specimen exposed to the surface of the corrosion solution (cm2), and D is the density of the specimen (g/cm3), which was obtained by Archimedes’ law measurement. The figure shows that the corrosion rate was higher (0.0984 mm/y) when x = 0. However, when the Mn content was slightly increased to x = 0.5, the corrosion rate considerably decreased to 0.0349 mm/y, at which point, the corrosion resistance of the alloy was optimized. However, with an additional increase in Mn content, the corrosion rate gradually increased.
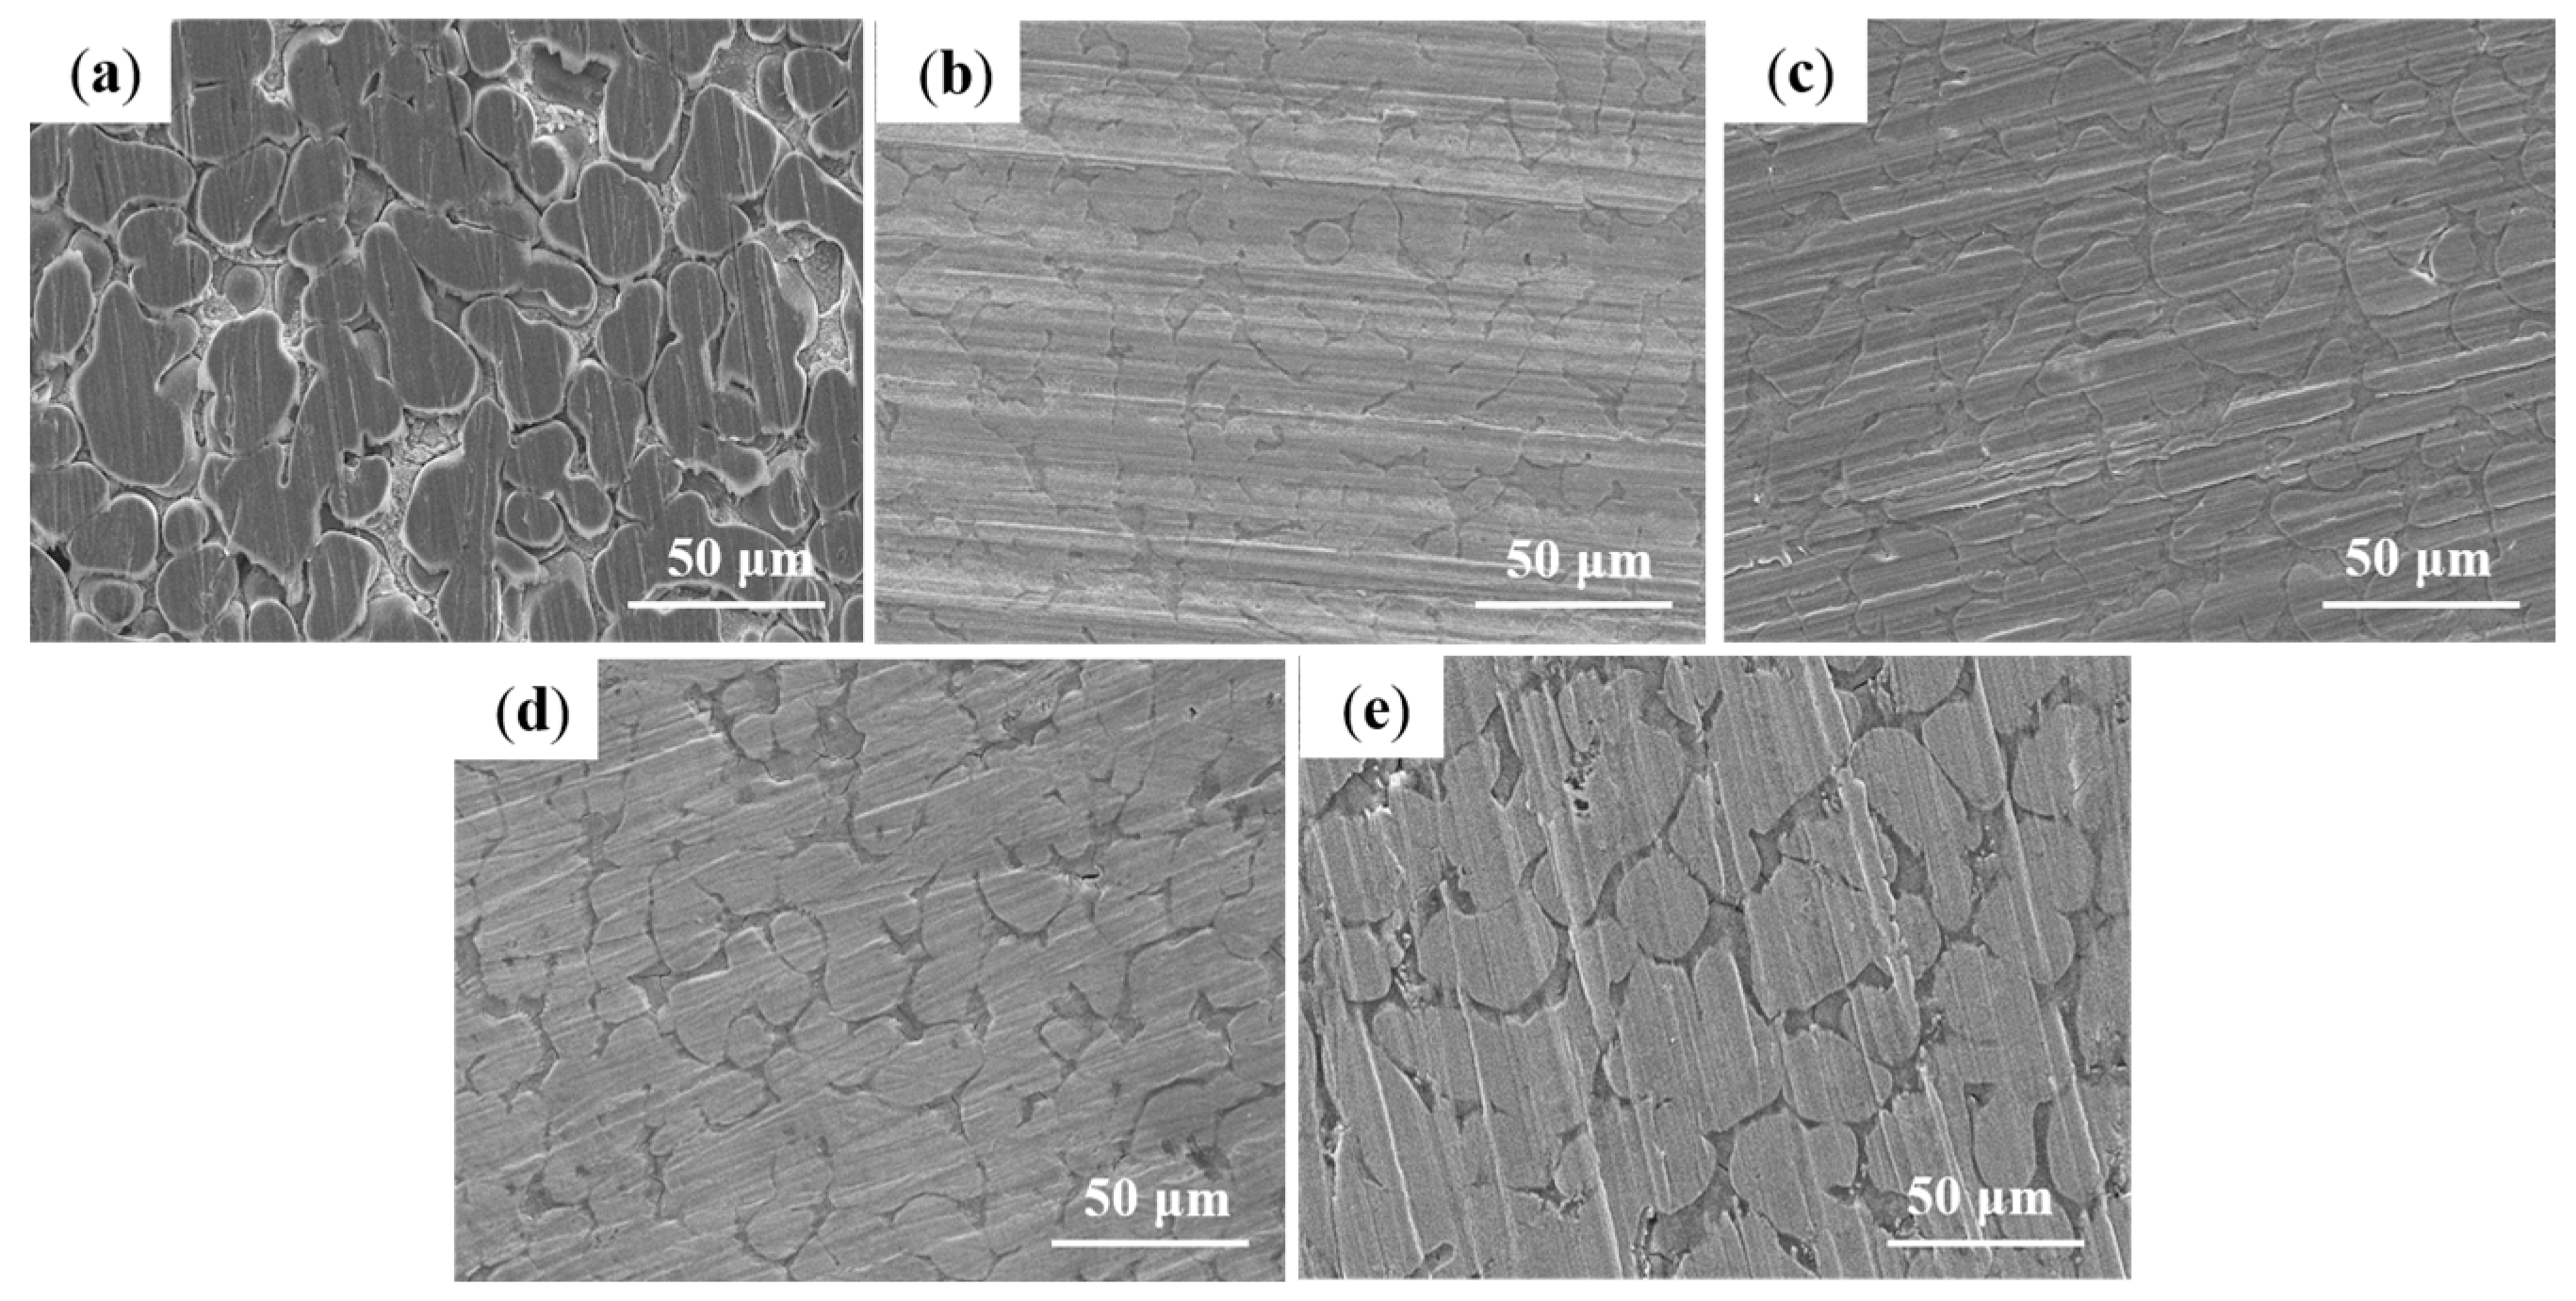
Figure 7 shows the corrosion surface morphology of HEAs with different Mn contents after immersion in 1 M NaOH for 168 h. Figure 7a–e show that all corrosion occurred along the grain boundaries. The corrosion products appeared on the surface of all alloys and formed a layer of cover on the alloy surface. Among them, the multiple straight lines in the SEM image of Figure 7 were caused by insufficient polishing of the sample, and the 3D morphology image of Figure 9 shows similar features. Figure 7a shows that the alloy without added Mn had deeper and wider corrosion depths at the inter-dendrites. With the gradual increase in Mn, the corrosion degree was improved. When x = 0.5, the surface had the least corrosion characteristics; moreover, the grain boundaries were more stable and less affected by corrosion, showing the best corrosion resistance. However, with an additional increase in Mn, as shown in Figure 7c–e, the corrosion features began to become obvious, the grain boundaries were clearly visible, and the corrosion resistance began to decrease.
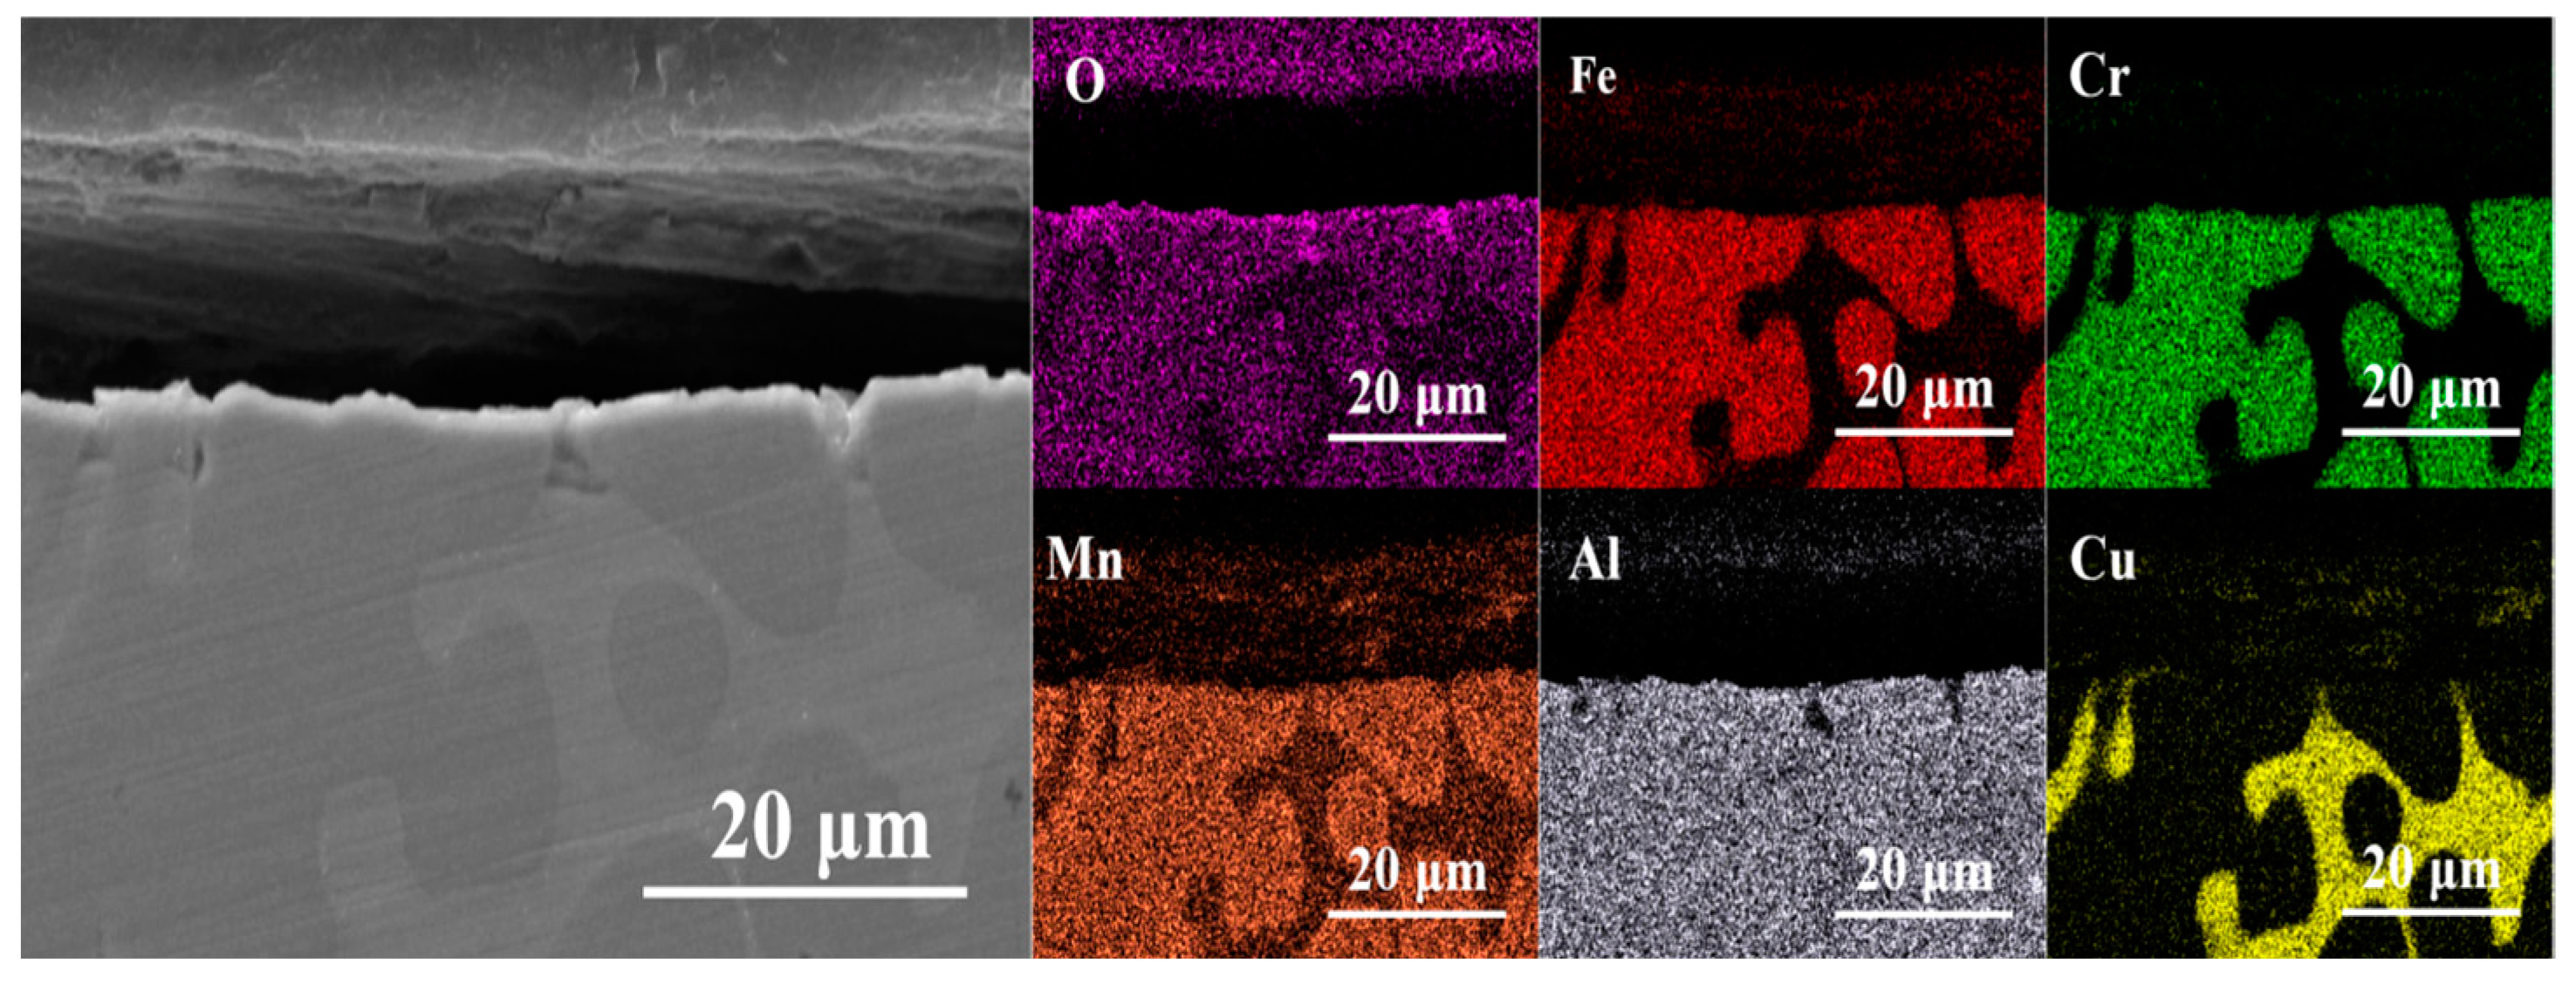
Figure 8 shows the cross-sectional SEM and EDS images of the FeCrMn0.5AlCu HEAs after immersion in 1 M NaOH for 168 h. The SEM images demonstrate corrosion-induced microstructural changes, including the formation of surface craters and pores. The EDS analyses show the distribution of elemental oxygen over the alloy surface, indicative of the formation of an oxide layer. The differences in the chemical composition and microstructure of the different phases led to their corresponding corrosion behavior. After corrosion, dendritic regions were enriched with Fe, Cr, and Mn, whereas interdendritic regions contained Cu, which contributed to the difference in the corrosion resistance of the alloys with the dendritic and interdendritic regions in corrosive media.
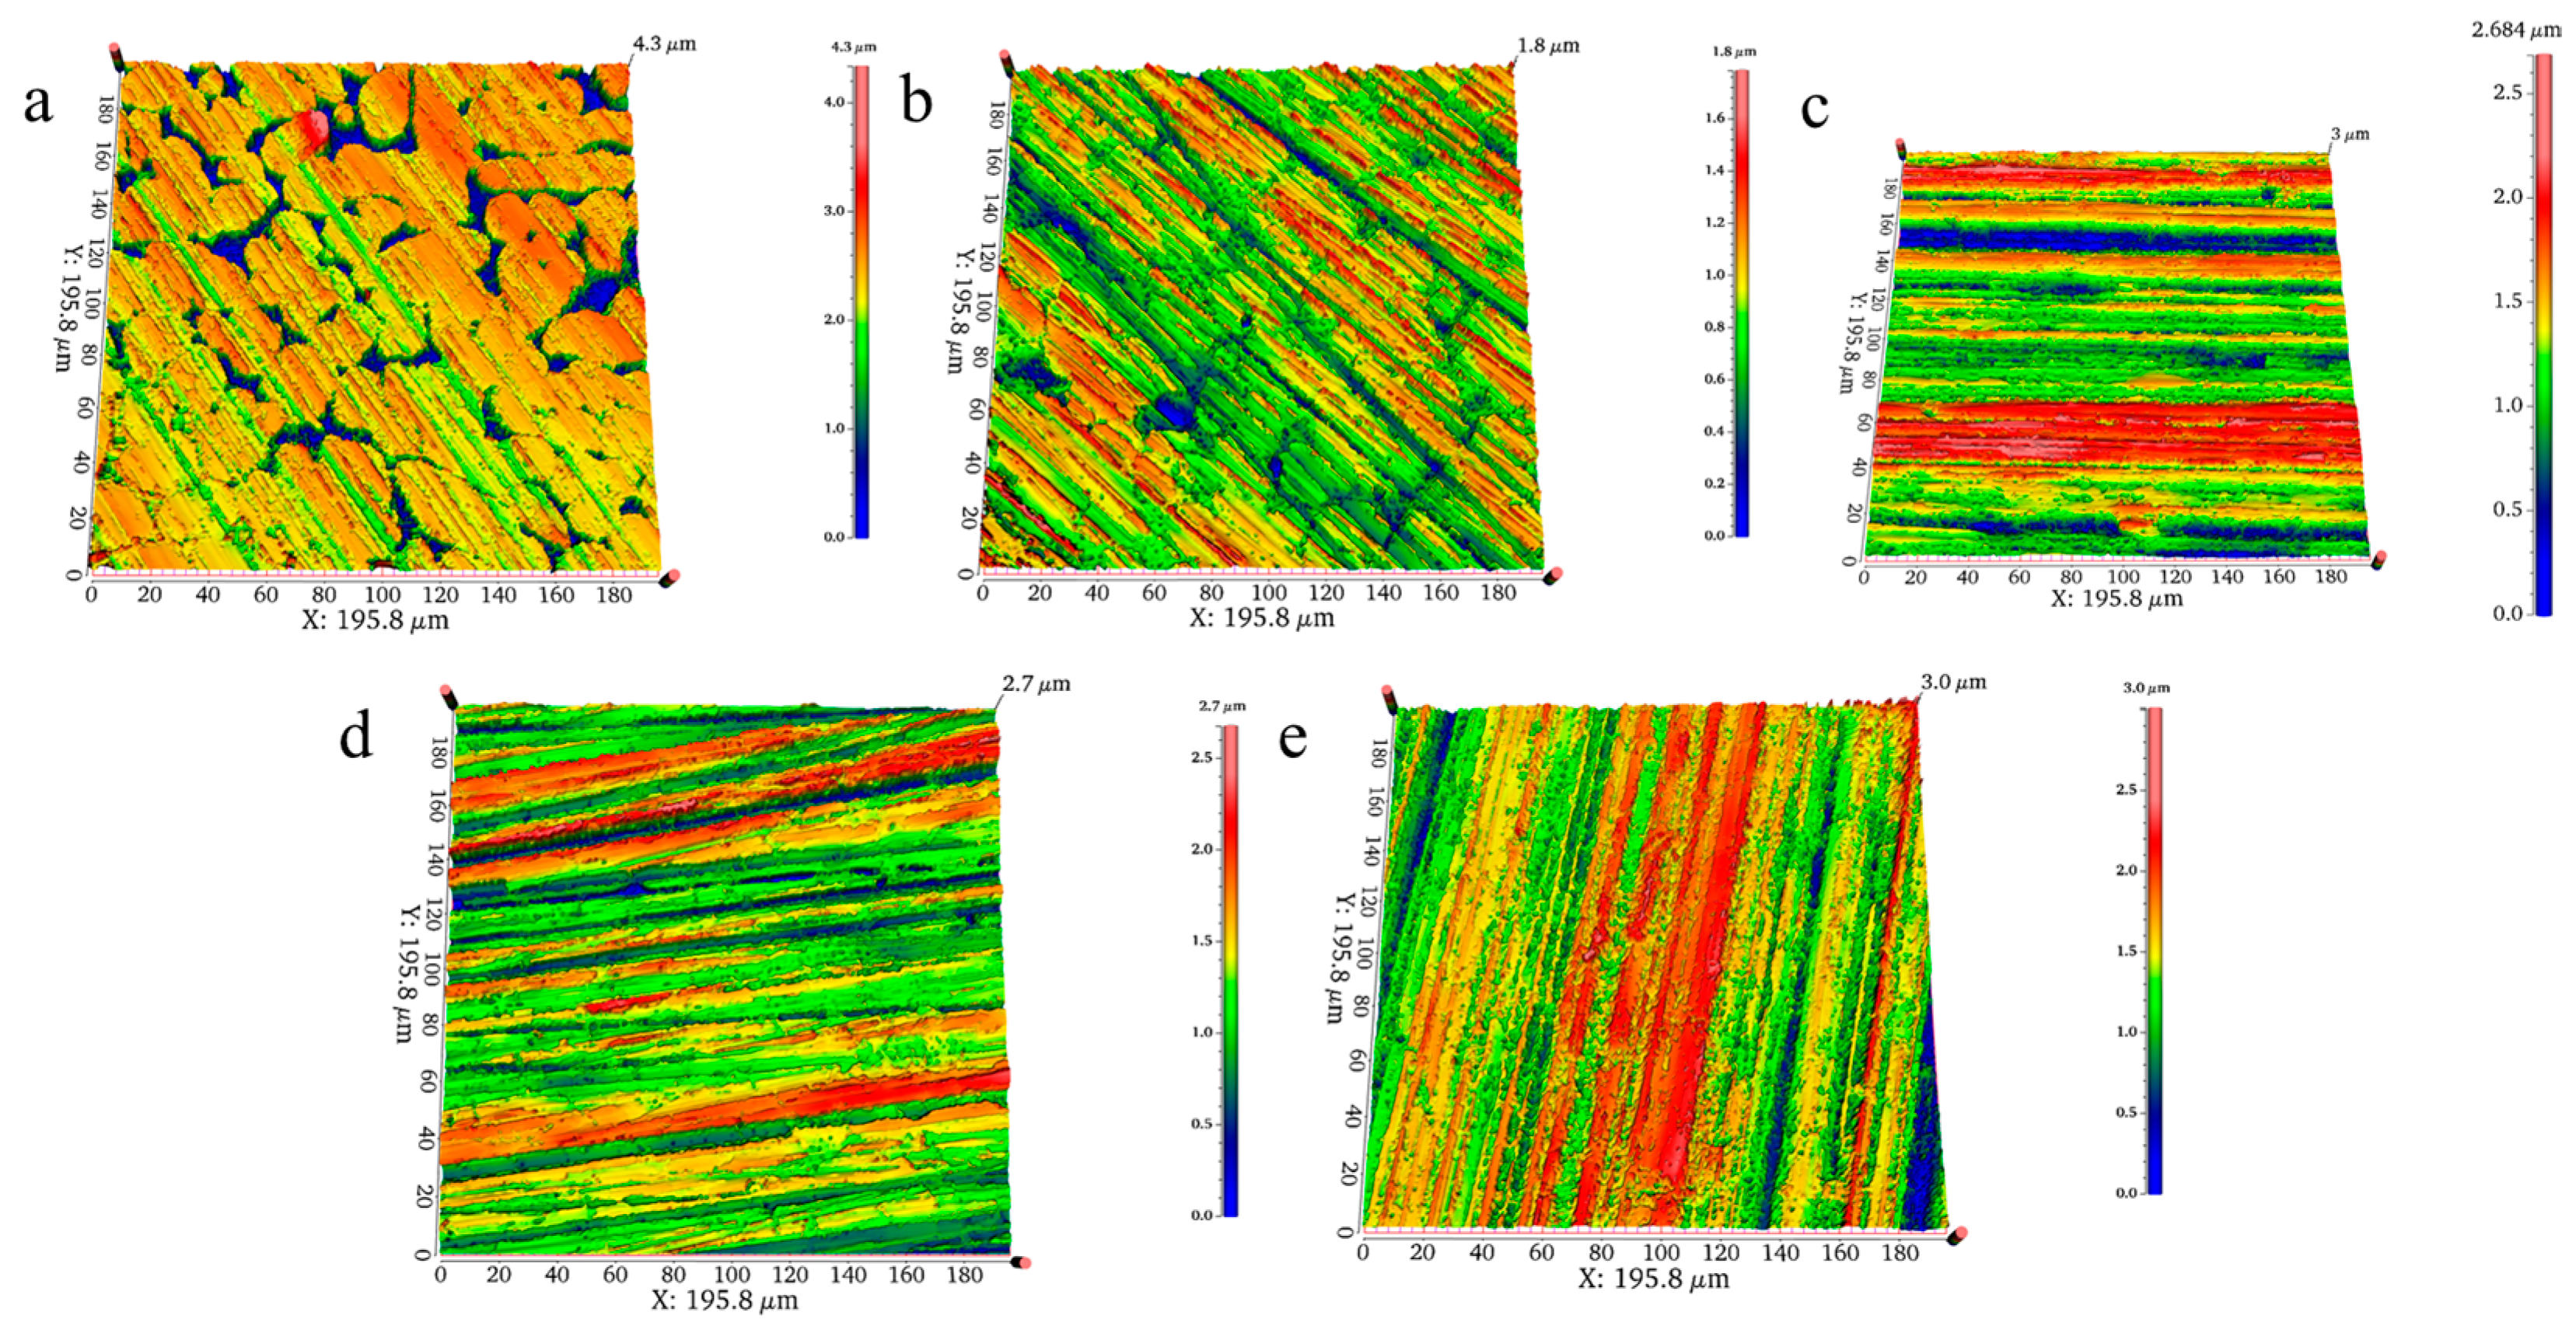
Figure 9 shows the 3D morphology of the surface of FeCrMnxAlCu HEAs after immersion in 1 M NaOH solution for 168 h. The results show that corrosion occurred on the surface of all alloys; however, the maximum corrosion depth did not considerably differ. When the Mn element was completely missing, the corrosion crevices between the dendrites were clear and the maximum corrosion depth was 4.3 μm. With the increase in Mn content, the depth of the corrosion pits decreased and then increased. Figure 9b–e demonstrate that the corrosion degrees of Mn-containing alloys were similar, among which, the Mn0.5 alloy had the smallest degree of corrosion, with a maximum corrosion depth of only 1.8 μm. This then confirmed the excellent corrosion resistance of the FeCrMn0.5AlCu HEA in 1 M NaOH.
3.5. FeCrMnxAlCu HEA Corrosion Products
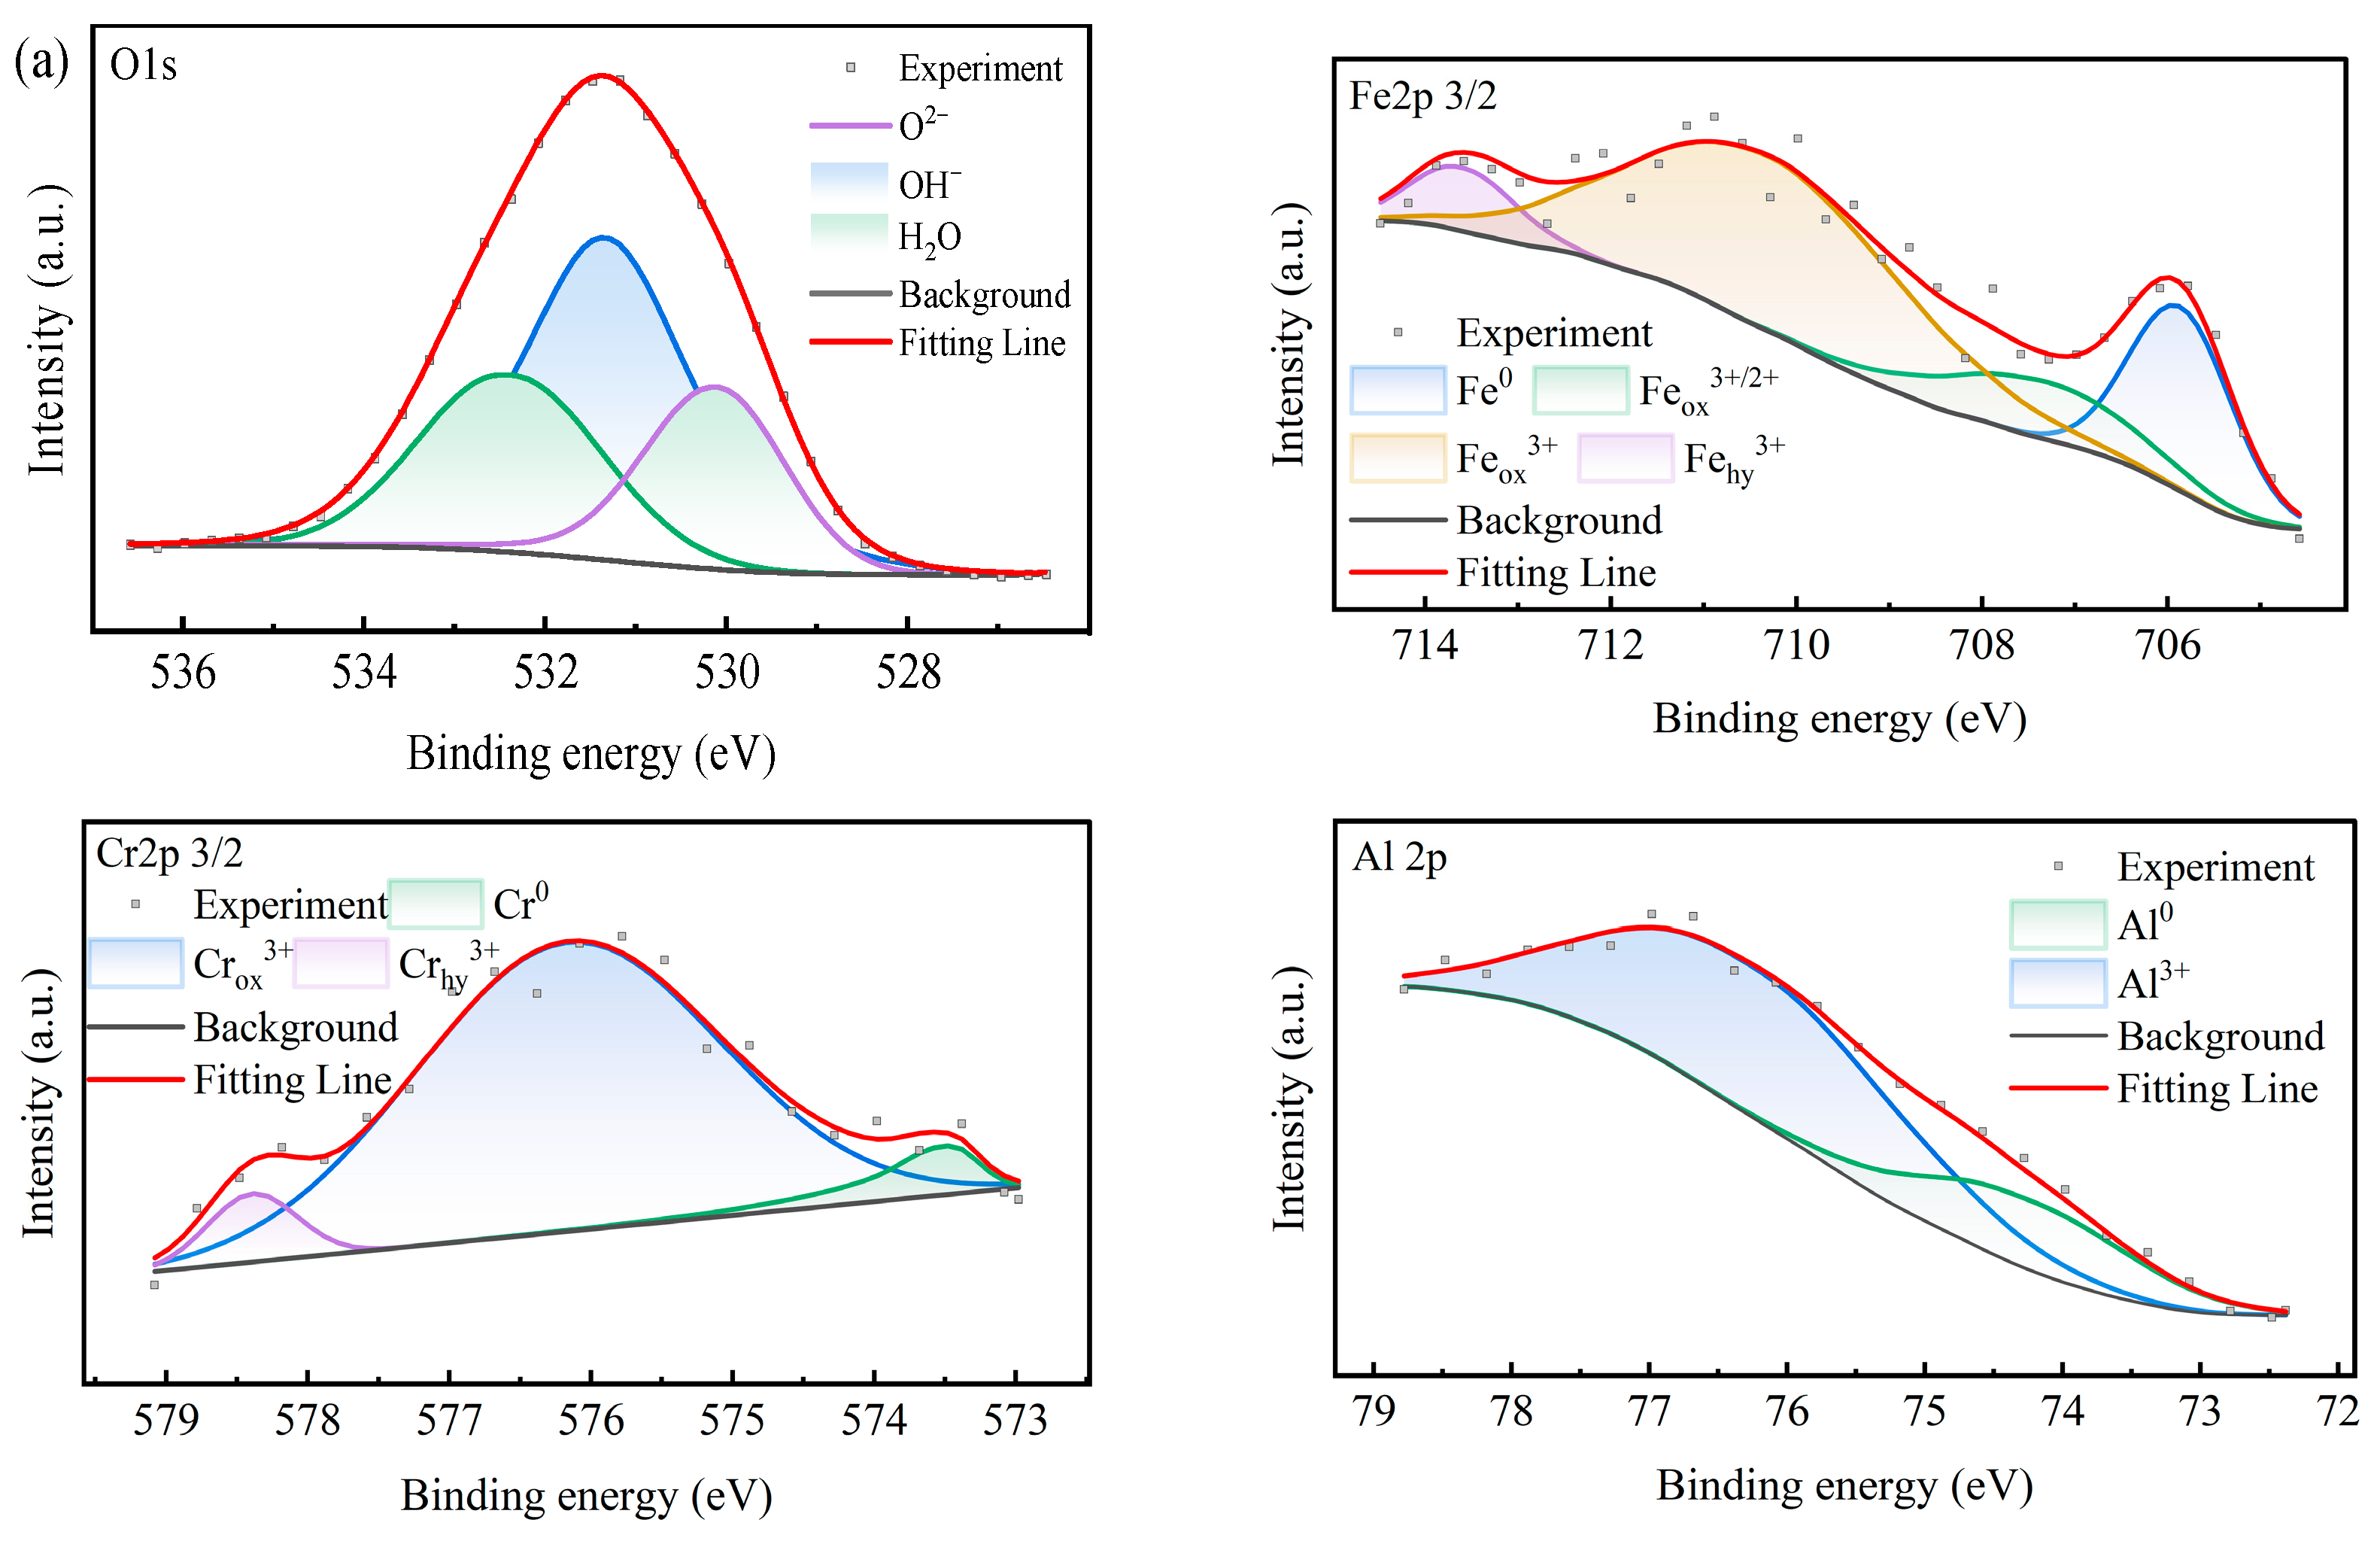
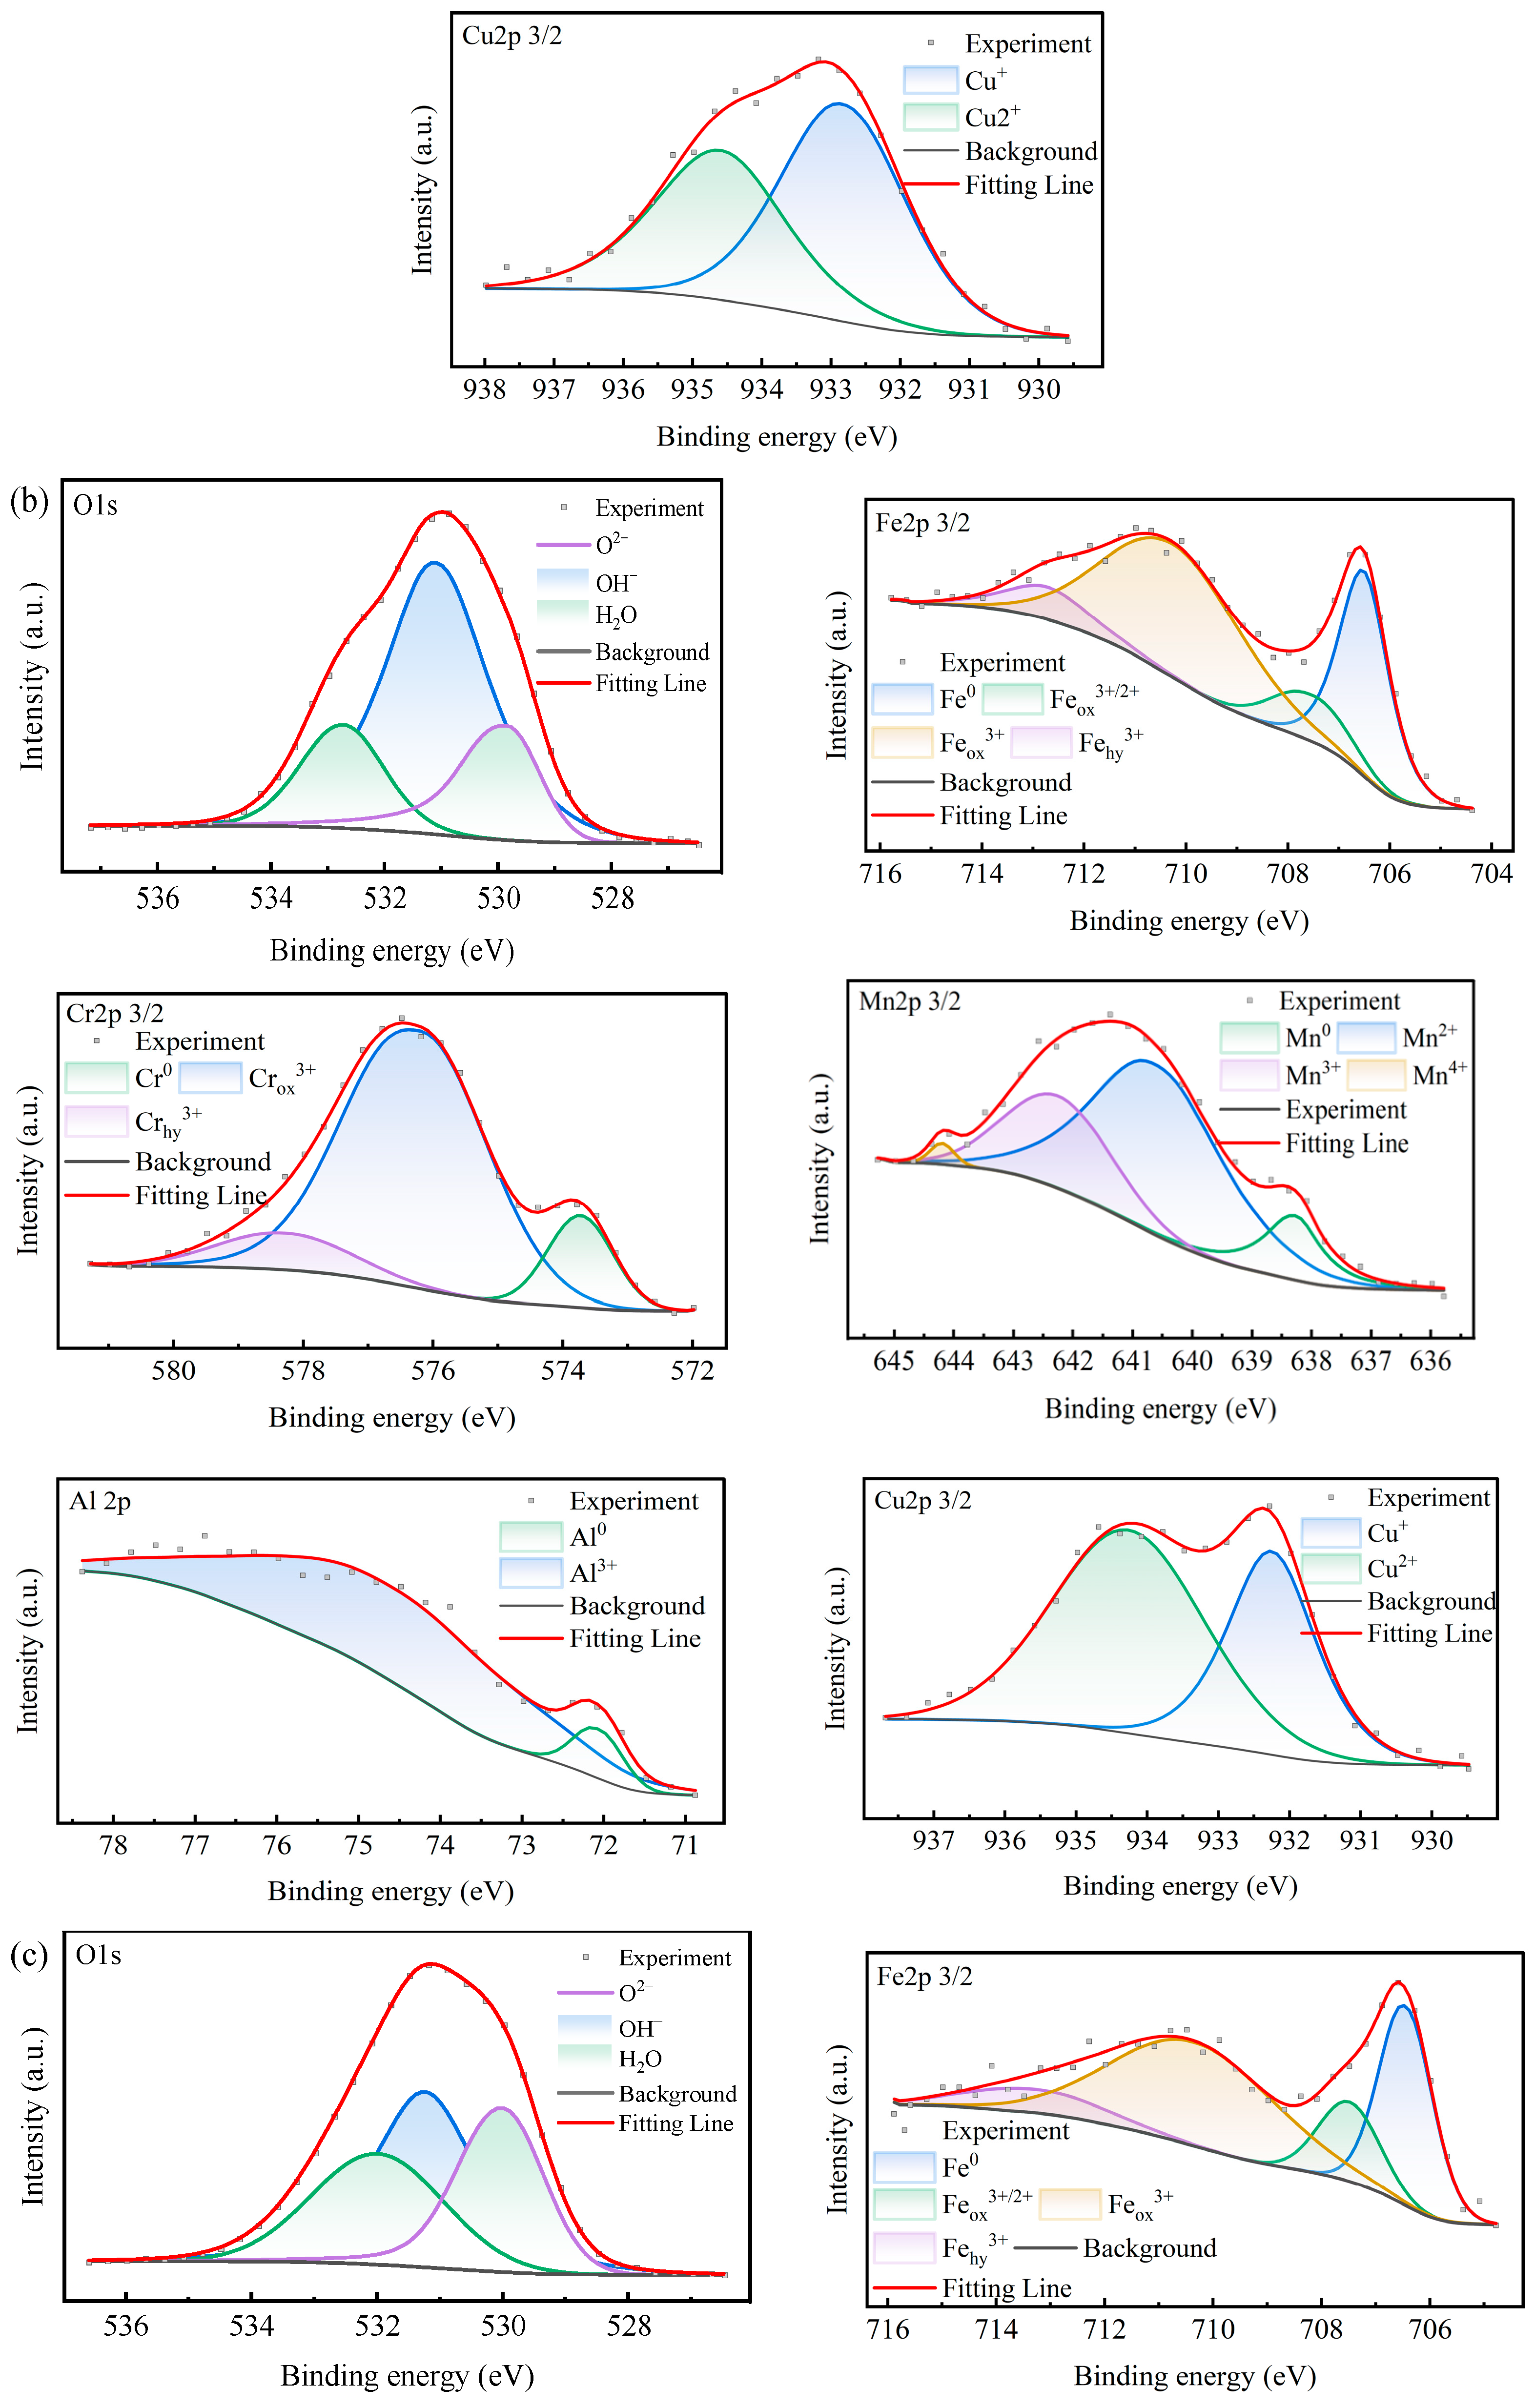
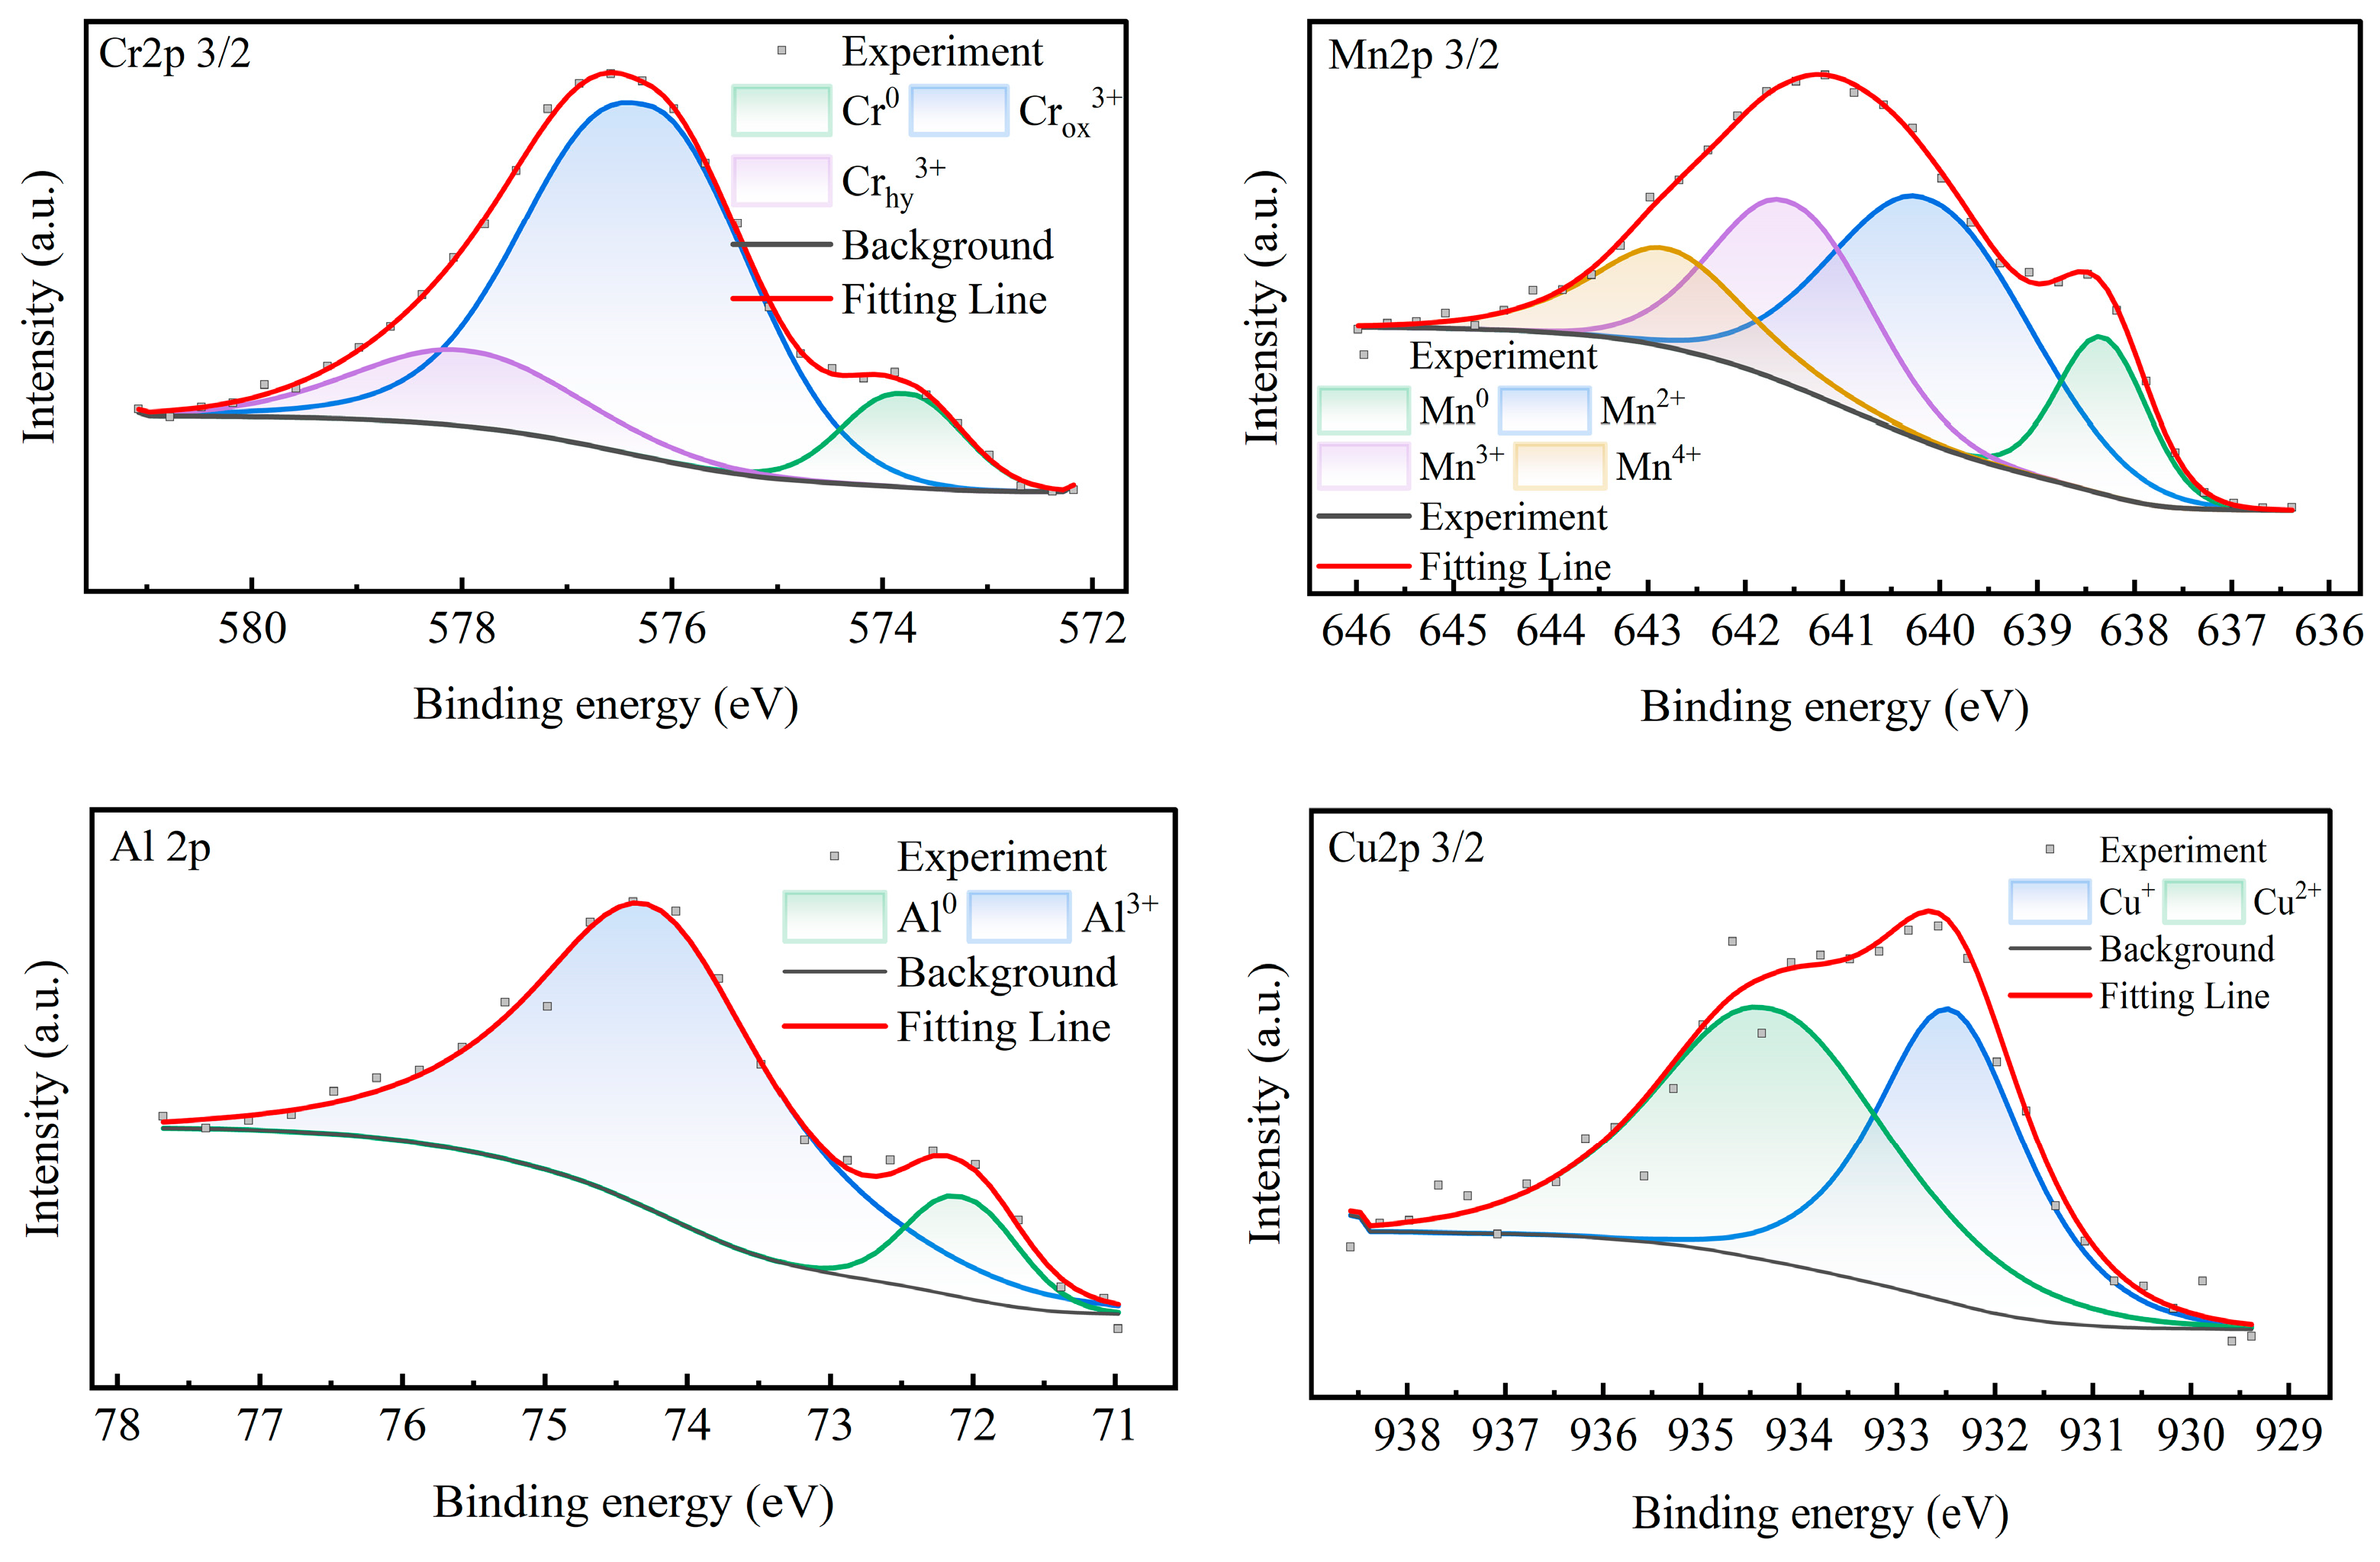
Figure 10 shows the XPS high-resolution spectra of the corrosion product films of Mn0, Mn0.5, and Mn2.0 alloys, including O 1s, Fe 2p3/2, Cr 2p3/2, Mn 2p3/2, Al 2p, and Cu 2p3/2 peaks. Compounds were identified by comparison with the NIST database. The Fe 2p3/2 spectral fit demonstrated the presence of Fe0, Feox3+/2+ (associated with Fe3O4), Feox3+ (associated with Fe2O3), and Fehy3+ (associated with Fe(OH)3 and FeOOH) fractions. The Cr 2p3/2 spectral fit demonstrated the presence of Cr0, Crox3+ (associated with Cr2O3), and Crhy3+ (associated with Cr(OH)3) fractions. The Mn 2p3/2 spectra showed Mn0, Mn2+ (associated with MnO and Mn(OH)2), Mn3+ (associated with Mn2O3 and MnOOH), and Mn4+ (associated with MnO2) fractions. The Al 2p spectra comprised Al0 and Al3+, while the Cu 2p3/2 spectra were associated with Cu2O and Cu2+, respectively. The O 1s spectra decomposed into O2−, OH−, and H2O components.
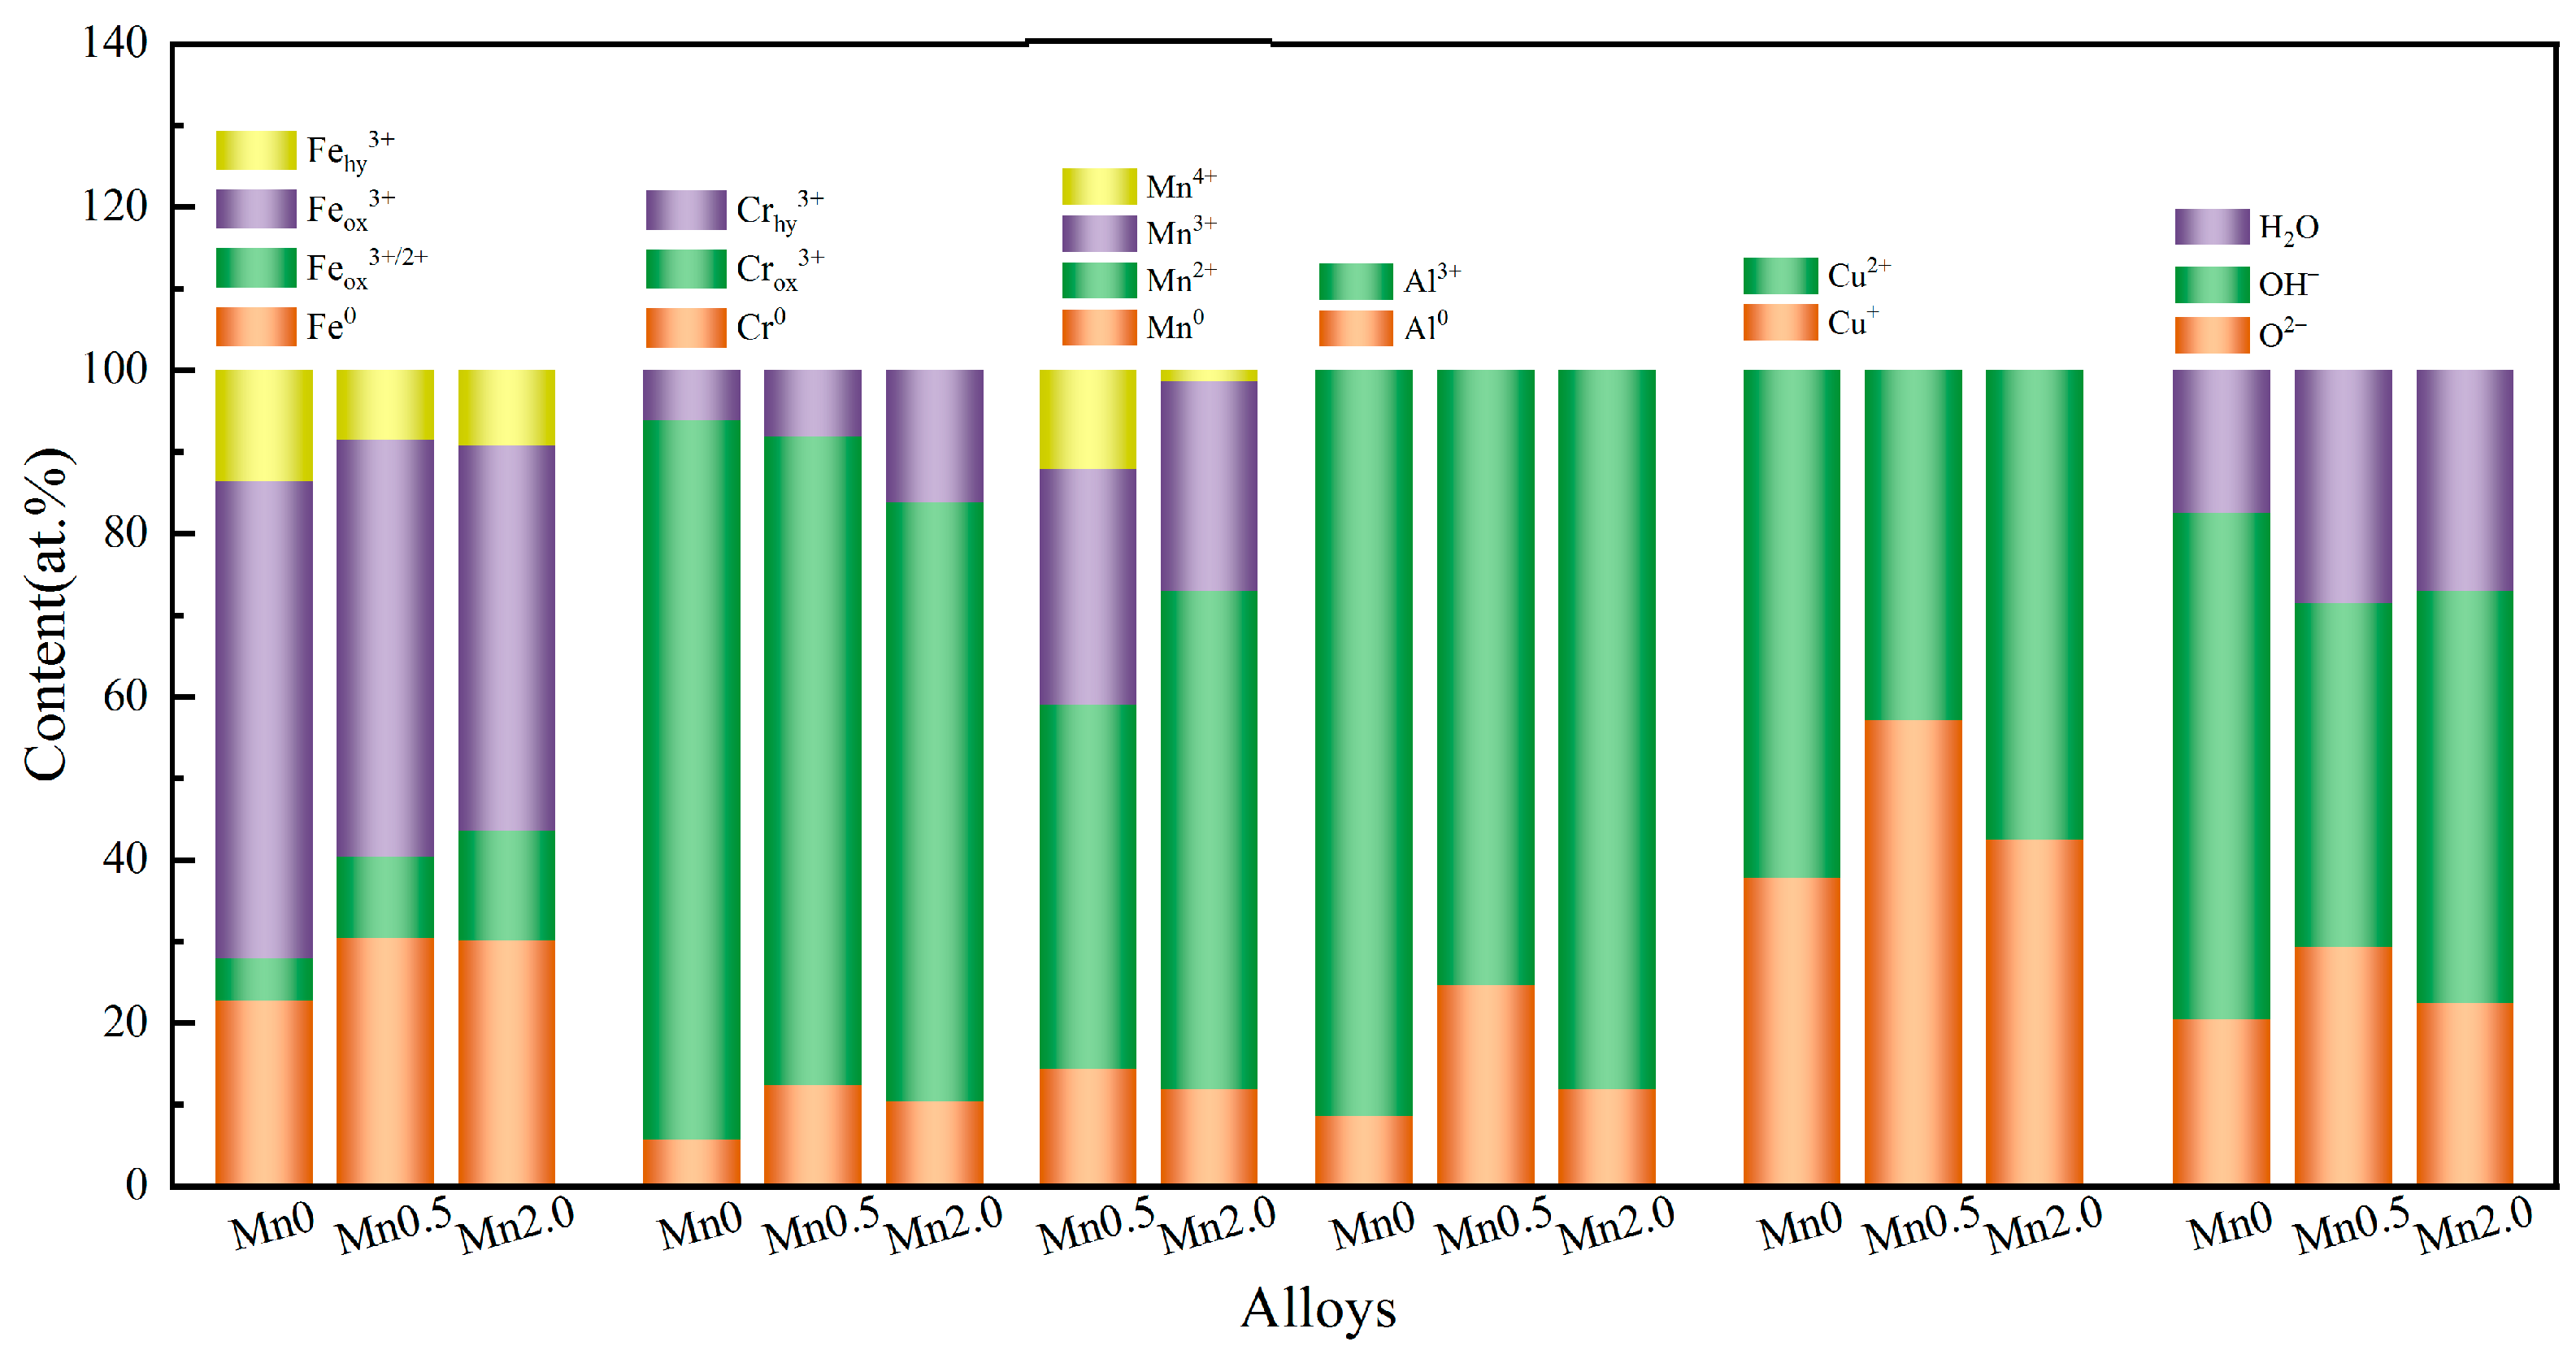
Figure 11 shows the atomic percentages of metallic and oxide/hydroxide phases in HEA surfaces with different Mn contents. The chemical valence distribution on the surface of the alloys changed with increasing Mn content. In the Mn0.5 alloy, the metal state contents of Fe, Cr, and Al were higher, indicating that these elements primarily existed in the pristine metallic form, which was conducive to the improvement of the corrosion resistance of the alloy. The content of Cu2O was higher than that of CuO, and the contents of Fe3O4 and Cr2O3 were also higher, indicating that a more stable passivation layer was formed in the Mn0.5 alloy. Moreover, the multivalent distribution of Mn contributed to the formation of a complex and stable oxide structure. The presence of O2− and water molecules in the passivation layer helped to enhance its stability. Consequently, the Mn0.5 alloy exhibited better corrosion resistance in a 1 M NaOH solution than other alloys.
The corrosion process of the FeCrMnxAlCu HEAs in a NaOH solution can be expressed by reaction Equations (2)–(4):
M → Mn+ + ne−
2Mn ++ n/2O2 + 2ne− → M2On
Mnn+ + nH2O ↔ M(OH)n + nH+
Equation (2) shows that the dissolution of the alloying elements in the solution occurred to produce metal cations. Equations (3) and (4) show that as corrosion proceeded, the cations generated metal oxides and hydroxides through oxidation and hydrolysis, which were deposited to form a corrosion film product. Figure 5 and Figure 7 show that the FeCrMnxAlCu HEAs demonstrated selective corrosion, which was primarily attributed to the compositional differences between the dendritic region and the inter-dendritic region. The Cu elements were polarized at the inter-dendritic region, and the Fe and Cr elements were enriched at the dendritic region, and the two regions formed a protocell reaction owing to the difference in potentials. Secondly, the nature of the oxide film had an important impact on the corrosion. The five metal elements forming the degree of protection of the oxide film were different. The oxide film at the dendrite compared to the inter-dendrite was denser and more stable with better protection, thus making the inter-dendritic region more susceptible to corrosion. The cause of microscopic galvanic coupling corrosion aggravated the severity of corrosion at the junction of the two regions, thus accelerating the dissolution rate of the metal.
4. Conclusions
- (1)
- Electrochemical tests showed that all alloys exhibited activation–passivation–passivation breakthrough corrosion characteristics in NaOH. The increase in Mn content led to a positive and then negative shift in corrosion potential, as well as a decreasing and then increasing trend in corrosion current and capacitive arc diameter. Note that the impedance modulus and phase angle showed similar changes. Thus, the FeCrMn0.5AlCu HEA had optimum electrochemical properties and the best corrosion resistance.
- (2)
- SEM analysis after polarization demonstrated that selective corrosion occurred in all alloys, primarily located in the interdendrites and grain boundaries. The addition of a moderate amount of Mn helped to improve the corrosion resistance of the alloys; however, with excessive Mn content, the surface cracks and defects of the alloys increased, the corrosion channels increased, and the corrosion resistance decreased.
- (3)
- After corrosion, the alloy surface formed a corrosion film product composed of oxides and hydroxides, which reduced the rate of ion diffusion, slowed down the corrosion process, and improved the corrosion resistance. The Mn0.5 alloy contained a high proportion of metal state elements, which reduced the corrosion-involved elements and lowered the degree of corrosion. A moderate addition of Mn then inhibited the local corrosion between the dendrites and enhanced the overall corrosion resistance. However, when Mn was in excess, the instability of the grain size caused inhomogeneous corrosion and reduced the corrosion resistance. Therefore, the right amount of Mn is important for achieving superior corrosion resistance.
Author Contributions
Y.Y. and J.C. contributed equally to this work. Conceptualization, Y.Y.; methodology, Y.Y.; software, Y.Y. and J.C.; validation, Y.Y.; investigation, Y.Y and Z.W.; writing—original draft, Y.Y.; writing—review and editing, L.F.; supervision, Y.Y., L.F., J.C. and Z.W. All authors have read and agreed to the published version of the manuscript.
Funding
This study was supported by CNNP Nuclear Power Operation Management Co., Ltd. (QS4FY-22003224) and the fourth batch of top leading talents fund projects in Gansu Province (ZZ2023G50100013).
Institutional Review Board Statement
Not applicable.
Informed Consent Statement
Not applicable.
Data Availability Statement
The raw data supporting the conclusions of this article will be made available by the authors upon request.
Conflicts of Interest
The authors declare no conflicts of interest.
References
- Yeh, J.-W.; Chen, S.K.; Lin, S.-J.; Gan, J.-Y.; Chin, T.-S.; Shun, T.-T.; Tsau, C.-H.; Chang, S.-Y. Nanostructured High-Entropy Alloys with Multiple Principal Elements: Novel Alloy Design Concepts and Outcomes. Adv. Eng. Mater. 2004, 6, 299–303. [Google Scholar] [CrossRef]
- Zhang, Y.; Zuo, T.T.; Tang, Z.; Gao, M.C.; Dahmen, K.A.; Liaw, P.K.; Lu, Z.P. Microstructures and properties of high-entropy alloys. Prog. Mater. Sci. 2014, 61, 1–93. [Google Scholar] [CrossRef]
- Li, Z.; Pradeep, K.G.; Deng, Y.; Raabe, D.; Tasan, C.C. Metastable high-entropy dual-phase alloys overcome the strength ductility trade off. Nature 2016, 534, 227–230. [Google Scholar] [CrossRef] [PubMed]
- Zhou, H.; Jiang, L.; Jia, L.; Zhu, S.; Wang, L.; Wu, A.; Zhang, X. Interstitial boron-doped FeCoNiCr high entropy alloys with excellent electromagnetic-wave absorption and resistance to harsh environments. J. Alloys Compd. 2023, 959, 170579. [Google Scholar] [CrossRef]
- Yang, J.; Liu, Z.; Zhou, H.; Jia, L.; Wu, A.; Jiang, L. Enhanced Electromagnetic-Wave Absorbing Performances and Corrosion Resistance via Tuning Ti Contents in FeCoNiCuTix High-Entropy Alloys. ACS Appl. Mater. Interfaces 2022, 14, 12375–12384. [Google Scholar] [CrossRef] [PubMed]
- Li, S.; Hou, X.; Wang, X.; Liu, Z.; Xia, Y.; Dong, H. Weldability of high entropy alloys: Microstructure, mechanical property, and corrosion resistance. J. Manuf. Process. 2023, 99, 209–229. [Google Scholar] [CrossRef]
- Slobodyan, M.; Pesterev, E.; Markov, A. Recent advances and outstanding challenges for implementation of high entropy alloys as structural materials. Mater. Today Commun. 2023, 36, 106422. [Google Scholar] [CrossRef]
- Xiong, W.; Cheng, L.; Zhan, S.; Guo, A.X.Y.; Liaw, P.K.; Cao, S.C. Recent Advances on Lightweight High-Entropy Alloys: Process, Design, and Applications. High Entropy Alloys Mater. 2023, 1, 175–194. [Google Scholar] [CrossRef]
- Shi, S.-C.; Liu, C.-F.; Fang, T.-T.; Chen, T.-H. Effects of Mn addition on mechanical properties, fracture surface, and electrochemical corrosion resistance of CoCrFeNiAl high-entropy alloys. Mater. Res. Express 2023, 10, 074002. [Google Scholar] [CrossRef]
- Abdiyan, F.; Mahmudi, R.; Ghasemi, H.M. Effect of Mn addition on the microstructure, mechanical properties and corrosion resistance of a biodegradeble Mg–Gd–Zn alloy. Mater. Chem. Phys. 2021, 271, 124878. [Google Scholar] [CrossRef]
- Bosch, J.; Martin, U.; Aperador, W.; Bastidas, J.M.; Ress, J.; Bastidas, D.M. Corrosion Behavior of High-Mn Austenitic Fe–Mn–Al–Cr–C Steels in NaCl and NaOH Solutions. Materials 2021, 14, 425. [Google Scholar] [CrossRef] [PubMed]
- Abedini, B.; Ahmadi, N.P.; Yazdani, S.; Magagnin, L. Electrodeposition and corrosion behavior of Zn–Ni–Mn alloy coatings deposited from alkaline solution. Trans. Nonferrous Met. Soc. China 2020, 30, 548–558. [Google Scholar] [CrossRef]
- Zhu, X.; Zhou, S.; Zhang, Y. Corrosion performance and passive film of an austenitic Fe-Mn-Al alloy. J. Chin. Soc. Corros. Prot. 1996, 16, 275–280. [Google Scholar]
- Li, Z.; Pradeep, K.G.; Deng, Y. Metastable high-entropy dualphase alloys overcome the strength-ductility trade-off. Nature 2016, 534, 227–230. [Google Scholar] [CrossRef] [PubMed]
- Wu, P.; Gan, K.; Yan, D.; Fu, Z.; Li, Z. A non-equiatomic FeNiCoCr high-entropy alloy with excellent anti-corrosion performance and strength-ductility synergy. Corros. Sci. 2021, 183, 109341. [Google Scholar] [CrossRef]
- Amin, M.A.; Khaled, K.F.; Fadl-Allah, S. Testing validity of the Tafel extrapolation method for monitoring corrosion of cold rolled steel in HCl solutions–experimental and theoretical studies. Corros. Sci. 2010, 52, 140–151. [Google Scholar] [CrossRef]
- Wang, M.; Xue, Z.; Yan, S.; He, J.; Shao, Q.; Ge, W.; Lu, B. Pulse Electrodeposited Super-Hydrophobic Ni-Co/WS2 Nanocomposite Coatings with Enhanced Corrosion-Resistance. Coatings 2022, 12, 1897. [Google Scholar] [CrossRef]
- Qiu, X. Structure and Electrochemical Properties of Laser Cladding Al2CoCrCuFeNiTix High-Entropy Alloy Coatings. Met. Mater. Int. 2020, 26, 998–1003. [Google Scholar] [CrossRef]
- Padash, R.; Jafari, A.H.; Jamalizadeh, E. Experimental and theoretical study of aluminium corrosion in NaOH, NaCl and HCl solutions. Anti-Corros. Methods Mater. 2018, 65, 350–360. [Google Scholar] [CrossRef]
- Baboian, R. Corrosion Tests and Standards: Application and Interpretation; ASTM International: West Conshohocken, PA, USA, 2005; Volume 20. [Google Scholar]
Figure 1.
The X-ray diffraction pattern of the FeCrMnxAlCu HEAs.

Figure 2.
The SEM images of the FeCrMnxAlCu HEAs: (a) x = 0, (b) x = 0.5, (c) x = 1.0, (d) x = 1.5, (e) x = 2.0.
Figure 2.
The SEM images of the FeCrMnxAlCu HEAs: (a) x = 0, (b) x = 0.5, (c) x = 1.0, (d) x = 1.5, (e) x = 2.0.

Figure 3.
Face scanning EDS map of FeCrMn1.5AlCu HEAs.

Figure 4.
Electrochemical test results of FeCrMnxAlCu HEAs in 1 M NaOH solution: (a) polarization curves, (b) Nyquist plots, (c) Bode phase angle, (d) Bode mode plots.
Figure 4.
Electrochemical test results of FeCrMnxAlCu HEAs in 1 M NaOH solution: (a) polarization curves, (b) Nyquist plots, (c) Bode phase angle, (d) Bode mode plots.

Figure 5.
The SEM images of the FeCrMnxAlCu HEAs after electrochemical testing: (a) x = 0, (b) x = 0.5, (c) x = 1.0, (d) x = 1.5, (e) x = 2.0.
Figure 5.
The SEM images of the FeCrMnxAlCu HEAs after electrochemical testing: (a) x = 0, (b) x = 0.5, (c) x = 1.0, (d) x = 1.5, (e) x = 2.0.

Figure 6.
The corrosion rate of the FeCrMnxAlCu HEAs after immersion.

Figure 7.
The surface SEM images of FeCrMnxAlCu HEAs after immersion testing: (a) x = 0, (b) x = 0.5, (c) x = 1.0, (d) x = 1.5, (e) x = 2.0.
Figure 7.
The surface SEM images of FeCrMnxAlCu HEAs after immersion testing: (a) x = 0, (b) x = 0.5, (c) x = 1.0, (d) x = 1.5, (e) x = 2.0.

Figure 8.
EDS spectrum of FeCrMn0.5AlCu HEAs after immersion.

Figure 9.
Three-dimensional images of the surface of FeCrMnxAlCu HEAs after immersion: (a) x = 0, (b) x = 0.5, (c) x = 1.0, (d) x = 1.5, (e) x = 2.0.
Figure 9.
Three-dimensional images of the surface of FeCrMnxAlCu HEAs after immersion: (a) x = 0, (b) x = 0.5, (c) x = 1.0, (d) x = 1.5, (e) x = 2.0.

Figure 10.
High-resolution spectroscopy of FeCrMnxAlCu HEAs after corrosion: (a) x = 0, (b) x = 0.5, (c) x = 2.0.
Figure 10.
High-resolution spectroscopy of FeCrMnxAlCu HEAs after corrosion: (a) x = 0, (b) x = 0.5, (c) x = 2.0.


Figure 11.
The atomic percentage of each element’s valence state on the surface of FeCrMnxAlCu HEAs after corrosion.
Figure 11.
The atomic percentage of each element’s valence state on the surface of FeCrMnxAlCu HEAs after corrosion.


Table 1.
Nominal chemical composition (wt.%) of FeCrMnxAlCu HEAs.
| Alloy | Fe | Cr | Cu | Al | Mn |
|---|---|---|---|---|---|
| Mn0 | 28.1 | 26.1 | 32.2 | 13.6 | 0 |
| Mn0.5 | 25.2 | 23.5 | 28.9 | 12.2 | 10.2 |
| Mn1.0 | 22.0 | 20.5 | 25.1 | 10.7 | 21.7 |
| Mn1.5 | 19.8 | 18.5 | 22.7 | 9.6 | 29.4 |
| Mn2.0 | 18.1 | 16.8 | 20.7 | 8.8 | 35.6 |
Table 2.
The compositional analysis of the FeCrMnxAlCu HEAs.
| Sample | Element (wt.%) | |||||
|---|---|---|---|---|---|---|
| Parameter | Fe | Cr | Cu | Al | Mn | |
| Mn0 | DR | 39.55 | 41.87 | 5.77 | 12.81 | — |
| IR | 3.65 | 1.69 | 78.36 | 16.30 | — | |
| Mn0.5 | DR | 35.05 | 36.83 | 4.34 | 11.04 | 12.74 |
| IR | 2.81 | 1.30 | 73.69 | 12.09 | 10.11 | |
| Mn1 | DR | 31.86 | 30.66 | 6.23 | 10.52 | 20.73 |
| IR | 2.69 | 0.82 | 69.38 | 11.48 | 15.63 | |
| Mn1.5 | DR | 26.33 | 27.19 | 5.30 | 8.50 | 32.68 |
| IR | 1.64 | 0.85 | 66.43 | 8.69 | 22.39 | |
| Mn2.0 | DR | 22.88 | 21.92 | 5.41 | 8.81 | 40.98 |
| IR | 2.12 | 1.07 | 66.33 | 8.39 | 22.09 | |
Table 3.
The electrochemical parameters of FeCrMnxAlCu HEAs and other materials in 1 M NaOH solution.
Table 3.
The electrochemical parameters of FeCrMnxAlCu HEAs and other materials in 1 M NaOH solution.
| Alloy | Ecorr/V | Icorr/(A/cm2) | βa(mv/dec) | βc(mv/dec) | Rp/(Ω·cm2) |
|---|---|---|---|---|---|
| Mn0 | −0.602 | 6.306 × 10⁻⁶ | 2.392 | 15.193 | 3920.6 |
| Mn0.5 | −0.538 | 3.045 × 10⁻⁶ | 0.591 | 19.356 | 7158.3 |
| Mn | −0.571 | 3.630 × 10⁻⁶ | 2.039 | 19.165 | 5647.7 |
| Mn1.5 | −0.586 | 4.895 × 10⁻⁶ | 2.028 | 19.299 | 4164.3 |
| Mn2.0 | −0.593 | 6.099 × 10⁻⁶ | 1.046 | 24.323 | 2810.2 |
| Al2CoCrCuFeNiTi2 a | −0.89 | 1.70 ×10⁻⁴ | - | - | - |
| Q235steel a | −0.92 | 6.70 × 10⁻⁴ | - | - | - |
| Al b | −1.55 | 1.8450 × 10⁻² | - | - | - |
Table 4.
The fitted results of electrochemical impedance data for the FeCrMnxAlCu HEAs.
| Alloy | Rs/(Ω·cm2) | Rct/(Ω·cm2) | CPE | |
|---|---|---|---|---|
| Y0/(sn·Ω−1·cm−2) | n | |||
| Mn0 | 4.48 | 1372 | 7.5144 × 10⁻⁴ | 0.82046 |
| Mn0.5 | 6.386 | 2795 | 1.0453 × 10⁻⁴ | 0.89689 |
| Mn | 7.55 | 2316 | 9.0236 × 10⁻⁴ | 0.87549 |
| Mn1.5 | 49.15 | 1910 | 1.7032 × 10⁻⁴ | 0.86171 |
| Mn2.0 | 5.192 | 1304 | 7.1385 × 10⁻⁴ | 0.84696 |
Disclaimer/Publisher’s Note: The statements, opinions and data contained in all publications are solely those of the individual author(s) and contributor(s) and not of MDPI and/or the editor(s). MDPI and/or the editor(s) disclaim responsibility for any injury to people or property resulting from any ideas, methods, instructions or products referred to in the content. |
© 2024 by the authors. Licensee MDPI, Basel, Switzerland. This article is an open access article distributed under the terms and conditions of the Creative Commons Attribution (CC BY) license (https://creativecommons.org/licenses/by/4.0/).
Share and Cite
MDPI and ACS Style
Yang, Y.; Cui, J.; Wang, Z.; Feng, L. Corrosion Behavior of FeCrMnxAlCu High-Entropy Alloys in NaOH Solutions. Metals 2024, 14, 468. https://doi.org/10.3390/met14040468
AMA Style
Yang Y, Cui J, Wang Z, Feng L. Corrosion Behavior of FeCrMnxAlCu High-Entropy Alloys in NaOH Solutions. Metals. 2024; 14(4):468. https://doi.org/10.3390/met14040468
Chicago/Turabian StyleYang, Yang, Junpeng Cui, Zhipeng Wang, and Li Feng. 2024. "Corrosion Behavior of FeCrMnxAlCu High-Entropy Alloys in NaOH Solutions" Metals 14, no. 4: 468. https://doi.org/10.3390/met14040468
Note that from the first issue of 2016, this journal uses article numbers instead of page numbers. See further details here.