Article

Crystal Plasticity Finite Element Analyses on the Formability of AA6061 Aluminum Alloy with Different Ageing Treatments

1
School of Mechanical and Automotive Engineering, Qingdao University of Technology, Qingdao 266520, China
2
Department of Materials AI & Big Data, Korea Institute of Materials Science, Changwon 51508, Republic of Korea
3
Department of Mechanical & Aerospace Engineering, Konkuk University, Seoul 05029, Republic of Korea
*
Authors to whom correspondence should be addressed.
Metals 2024, 14(5), 503; https://doi.org/10.3390/met14050503
Submission received: 11 March 2024 / Revised: 19 April 2024 / Accepted: 23 April 2024 / Published: 26 April 2024
(This article belongs to the Special Issue Advances in Modeling and Simulation in Metal Forming)

Abstract

:
Different ageing treatments have been developed to achieve targeted properties in aluminum alloys through altering microstructures. However, there is a lack of understanding regarding the effect of ageing treatments on the formability of these alloys. In this study, we employed crystal plasticity finite element (CPFE) modeling, in conjunction with the Marciniak-Kuczynski (M-K) approach, to investigate the effects of ageing treatments on the mechanical properties and formability of AA6061 aluminum alloy. The as-received sheet was in the T6 heat treatment state, which was subjected to artificial ageing and pre-ageing, respectively, to achieve two age-hardened alloys with modified precipitation states. The microstructures and crystallographic textures of the three alloys were measured using the electron backscattering diffraction (EBSD) technique, and uniaxial tensile tests were performed along the rolling direction (RD), transverse direction (TD), and diagonal direction (DD, 45° to the RD) for each alloy. The forming limit curve (FLC) of the as-received alloy was determined using the Nakazima test. The dependence of mechanical strength, tensile ductility, and work-hardening behavior on the ageing treatments was clarified. Then, the tensile test results were utilized to calibrate the modeling parameters used in the CPFE model, whereas the FLC predictability of the developed model was validated with the experimental one. In the formability analysis, the effects of the ageing treatment on the FLC exhibit a notable dependency on loading paths, and the pre-aged alloy exhibits better formability than the other two at the plane strain tension state, thanks to its high work-hardening levels. In addition, the deformed textures along the different loading paths and the effects of the initial texture on the FLC are also discussed.

1. Introduction

The precipitation-hardenable 6XXX series of aluminum alloys, also known as the Al-Mg-Si(-Cu) alloys, have been extensively used in transportation applications, owing to the combination of high specific strength, excellent formability, good corrosion resistance, and sufficient strength [1,2]. The age-hardening effect is acquired in these alloys through quenching them from the solution treatment state in order to achieve a supersaturated solid solution, followed by ageing treatments at different temperatures. The enhancement of the mechanical properties comes as a result of the formation of metastable, semi-coherent precipitates that are homogeneously dispersed in the matrix and impede the movement of dislocations during plastic deformation [3,4]. Due to the complex metallurgical phenomena involved in the ageing (precipitation) process, a minor change in the chemical composition and treatment condition will alter the type, size, number density, and shape of these precipitates, leading to diverse mechanical properties in these alloys [5,6,7,8]. For example, it is found that a slightly different Mg/Si atomic ratio would lead to a different time required to meet the peak age, and the presence of β″ precipitates leads to significant changes in the mechanical behavior of the material in terms of the variation of yield stress, ultimate tensile strength, ductility, and the strain hardening rate as a result of different aging treatments [9]. Moreover, natural ageing is known to possibly deteriorate the age-hardening response as compared to artificial ageing, and a transition temperature has also been shown to exist in Al-Mg-Si(-Cu) alloys, above which the type of precipitates differs from that below. The clusters formed in natural ageing can differ in composition, structure, and size, and can also contain more vacancies when compared with the artificial ageing clusters [4,10,11].
To mitigate the detrimental effects of natural ageing, an additional ageing treatment, referred to as pre-ageing, is often employed shortly after the solution treatment to create clusters that grow and readily transform into coherent precipitates upon paint baking. However, the stretch formability is shown to decrease during pre-ageing for 6XXX alloys with the levels of the Mg/Si ratio ranging from 2.5 to 0.4, as a result of the reduction in both work-hardening and strain-rate-hardening capabilities [12]. The effects of natural ageing, artificial ageing, and pre-ageing on the characteristics of precipitates and the resultant mechanical properties of precipitate-hardenable aluminum alloys have been extensively studied in past decades [3,4,10,13], which has led to the development of novel ageing treatment methods, which can obtain the better overall performance of these alloys in manufacturing process [8,14]. It is noted that, in industrial practice, the alloys may be formed into their component shape with different ageing treatment conditions, e.g., in a solution treatment state followed by precipitation hardening after forming (e.g., the paint-bake cycle), or in a precipitate-strengthened state [1,15]. Österreicher et al. [16] investigated the pre-ageing heat treatments on the formability of AA2024, and concluded that the improved processability, characterized by increased forming limits and reduced wrinkling, of the pre-aged temper could be achieved by suppressing the formation of Mg/Cu-clusters. Until now, however, the effects of the ageing treatment on the formability of these alloys have not been clearly clarified.
In sheet metal forming, the formability of the material is restricted by the appearance of the plastic flow localization during deformation, and premature failure occurs when the limit strain (in certain loading conditions) is approached, which is often characterized by the FLC plotted on the forming limit diagram (FLD) [17,18]. The FLC of a material can be determined through either experimental measurement based on the Nakazima and Marciniak tests, or through numerical modeling that predicts the local necking behavior of the material [19]. Because the formability of sheet metals can be affected by many factors, the measurement of the FLC is usually an extremely cost-intensive and time-consuming task. Therefore, various theoretical models have been proposed as alternatives to FLC experiments. The M-K approach [20], based on the assumption that the necking band in the sheet metals is initiated by a pre-existing imperfection due to a higher thinning rate in the groove region than that in the homogeneous region, has been widely employed for the prediction of the FLCs of various structural metals via coupling with suitable constitutive frameworks, e.g., the phenomenological constitutive models [21,22,23] and the crystal plasticity models [24,25,26,27,28,29]. Kim et al. [26] conducted crystal plasticity finite element analyses, combined with the M-K approach for accurately predicting the formability of ferritic stainless steel by considering two different slip modes, and they emphasized that the dominant slip system differs for different strain paths. The {112}<111> slip systems were found to be dominant under balanced biaxial stretching, while the {110}<111> and {112}<111> slip systems were dominant in the small and large strain regions under plane strain tension. In [29], a dynamic recrystallization (DRX) model is incorporated into a self-consistent crystal plasticity model to evaluate the warm formability of magnesium alloys, and it was found that the forming limits increased evidently with the annealing time, and they emphasized the role of the activation of <c+a> the slip played in improving the formability of the magnesium alloy at elevated temperatures. Moreover, the M-K approach has also been extended to incorporate other types of microstructural inhomogeneities, such as void density, crystallographic texture, and surface roughness, as present in recent reviews [22,30].
It is noteworthy that different ageing treatments can yield distinct microstructures in aluminum alloys [16,30], resulting in distinct mechanical properties and formability. For instance, the difference in the crystallographic texture plays an important role in determining the material responses in the biaxial loading condition, typically seen in forming processes [17], and leads to the varied formability of aluminum alloys [30]. However, the effects of ageing treatments on the formability of aluminum alloys have not been well understood. In this study, the M-K approach is incorporated into the crystal plasticity framework, proposed by Rice [31] and Asaro and Needleman [32], to predict the FLCs of AA6061 aluminum alloys with different ageing treatments. First, the developed CPFE model is calibrated by reproducing the uniaxial tensile stress–strain curves along different in-plane directions, i.e., RD, TD, and DD, of the sheet material using a small number of material constants; second, the FLC predictability of the model is validated using the experimental results obtained from a standard Nakazima test; furthermore, the validated model is employed to explore the effects of different ageing treatments and crystallographic textures on the mechanical response and formability of AA6061 aluminum alloys.

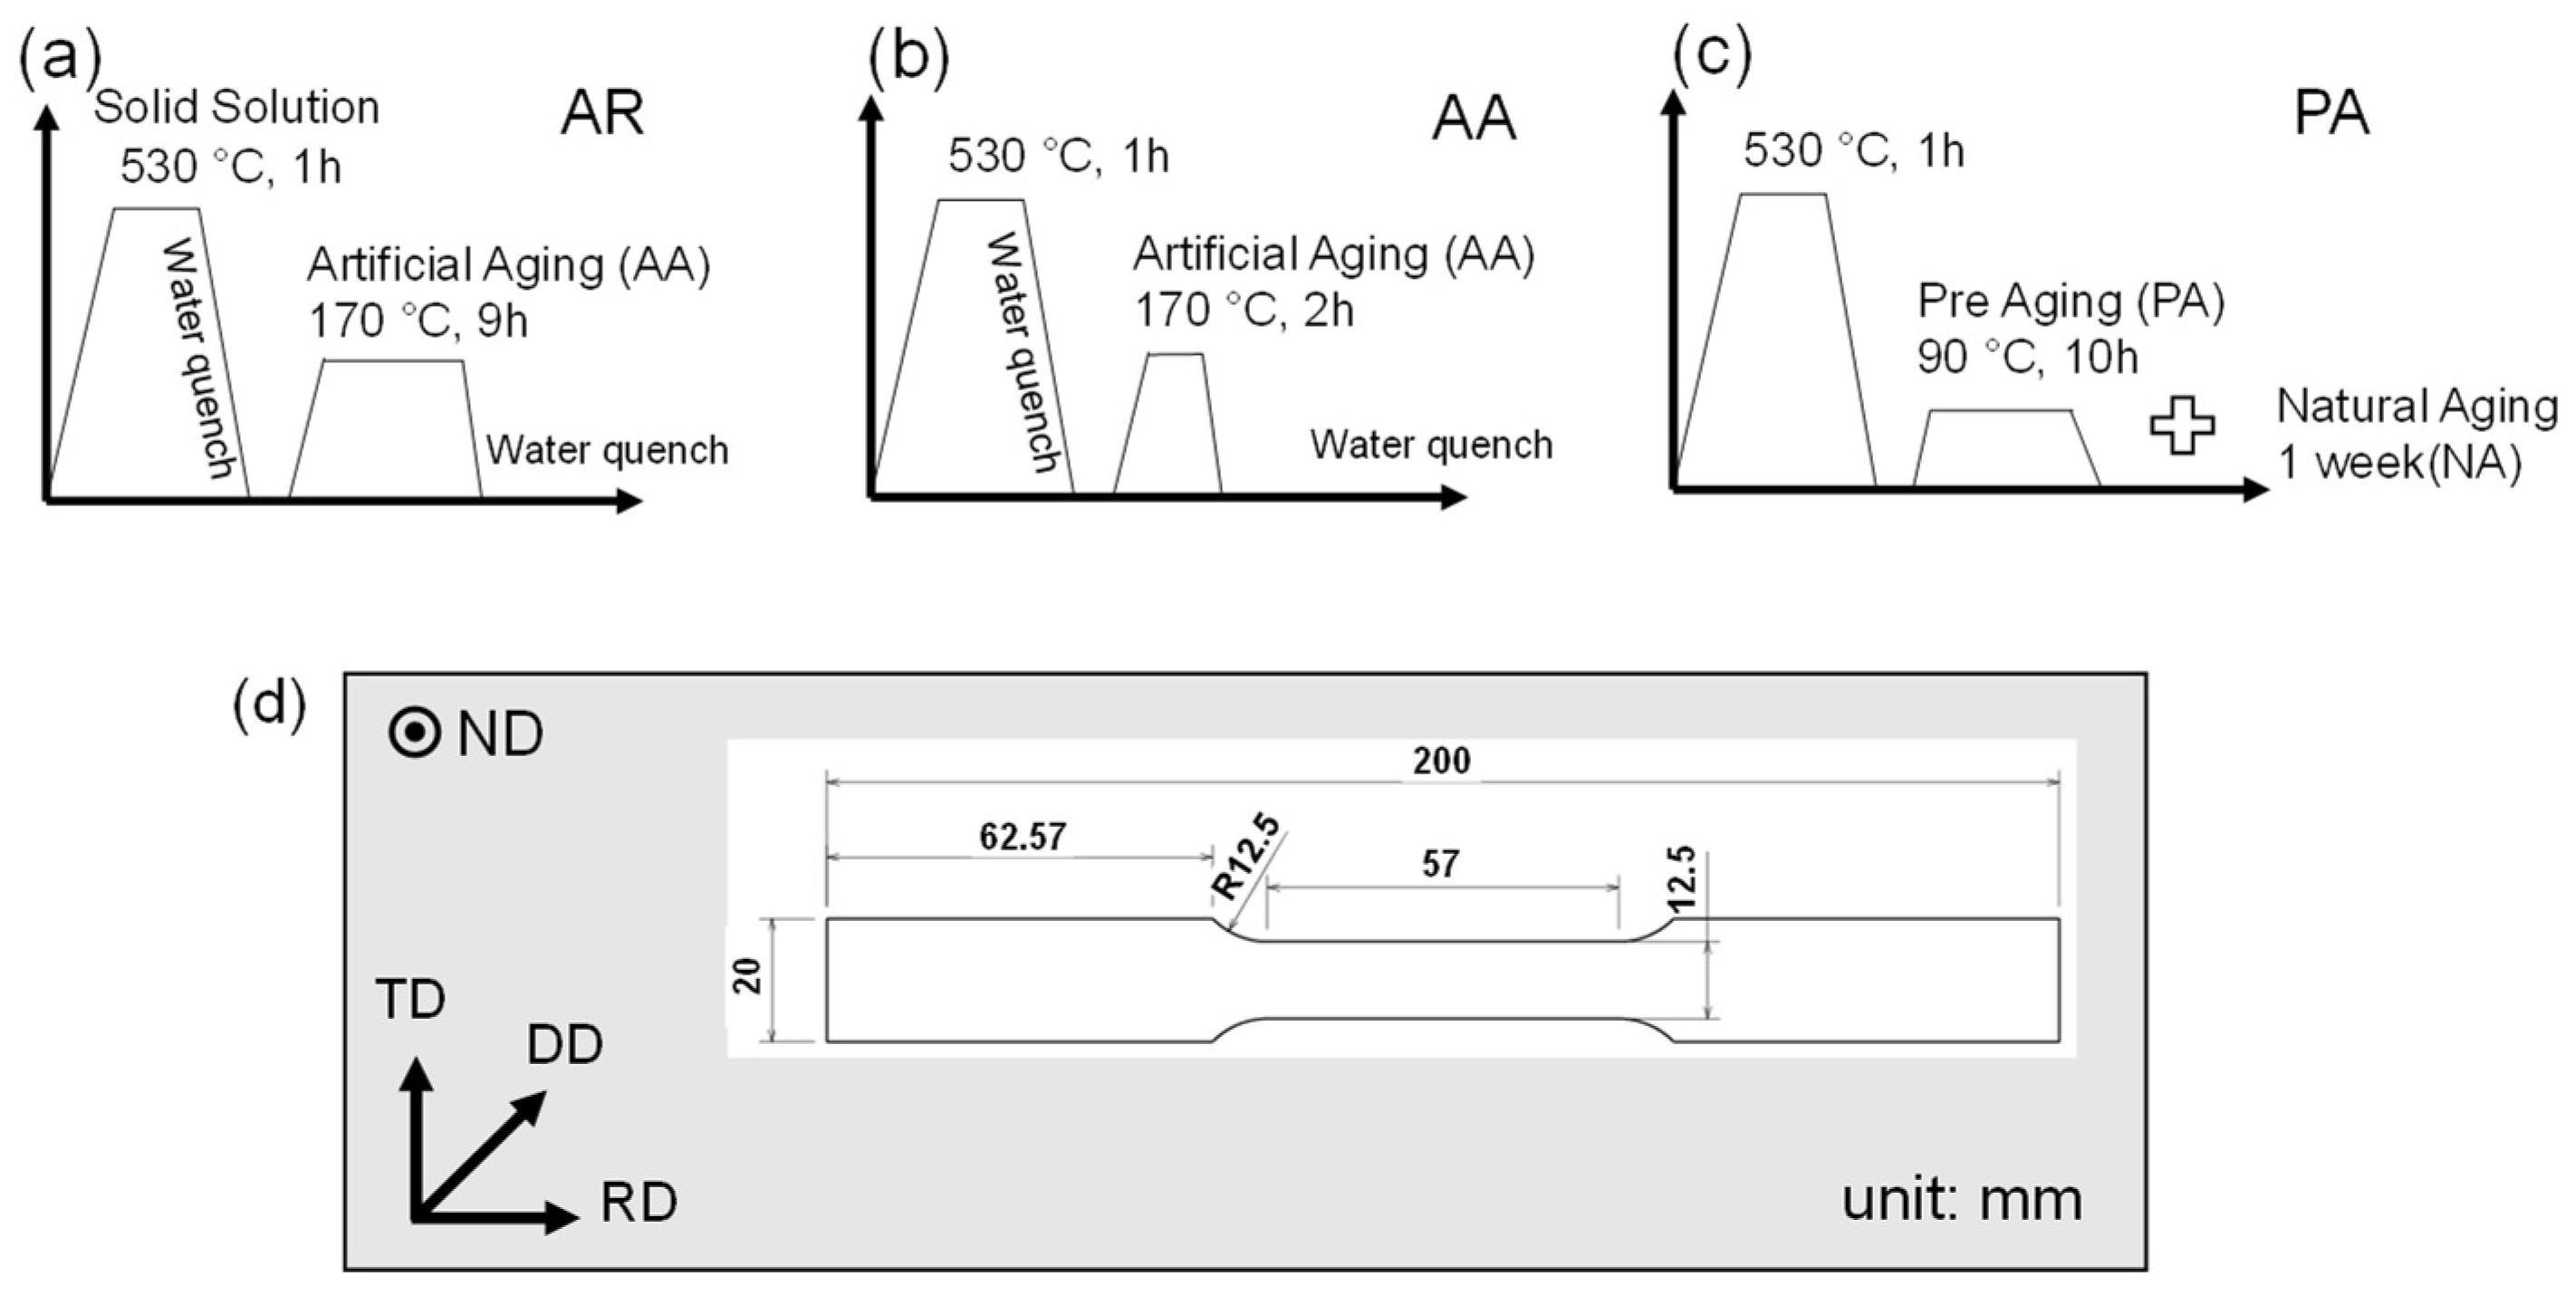
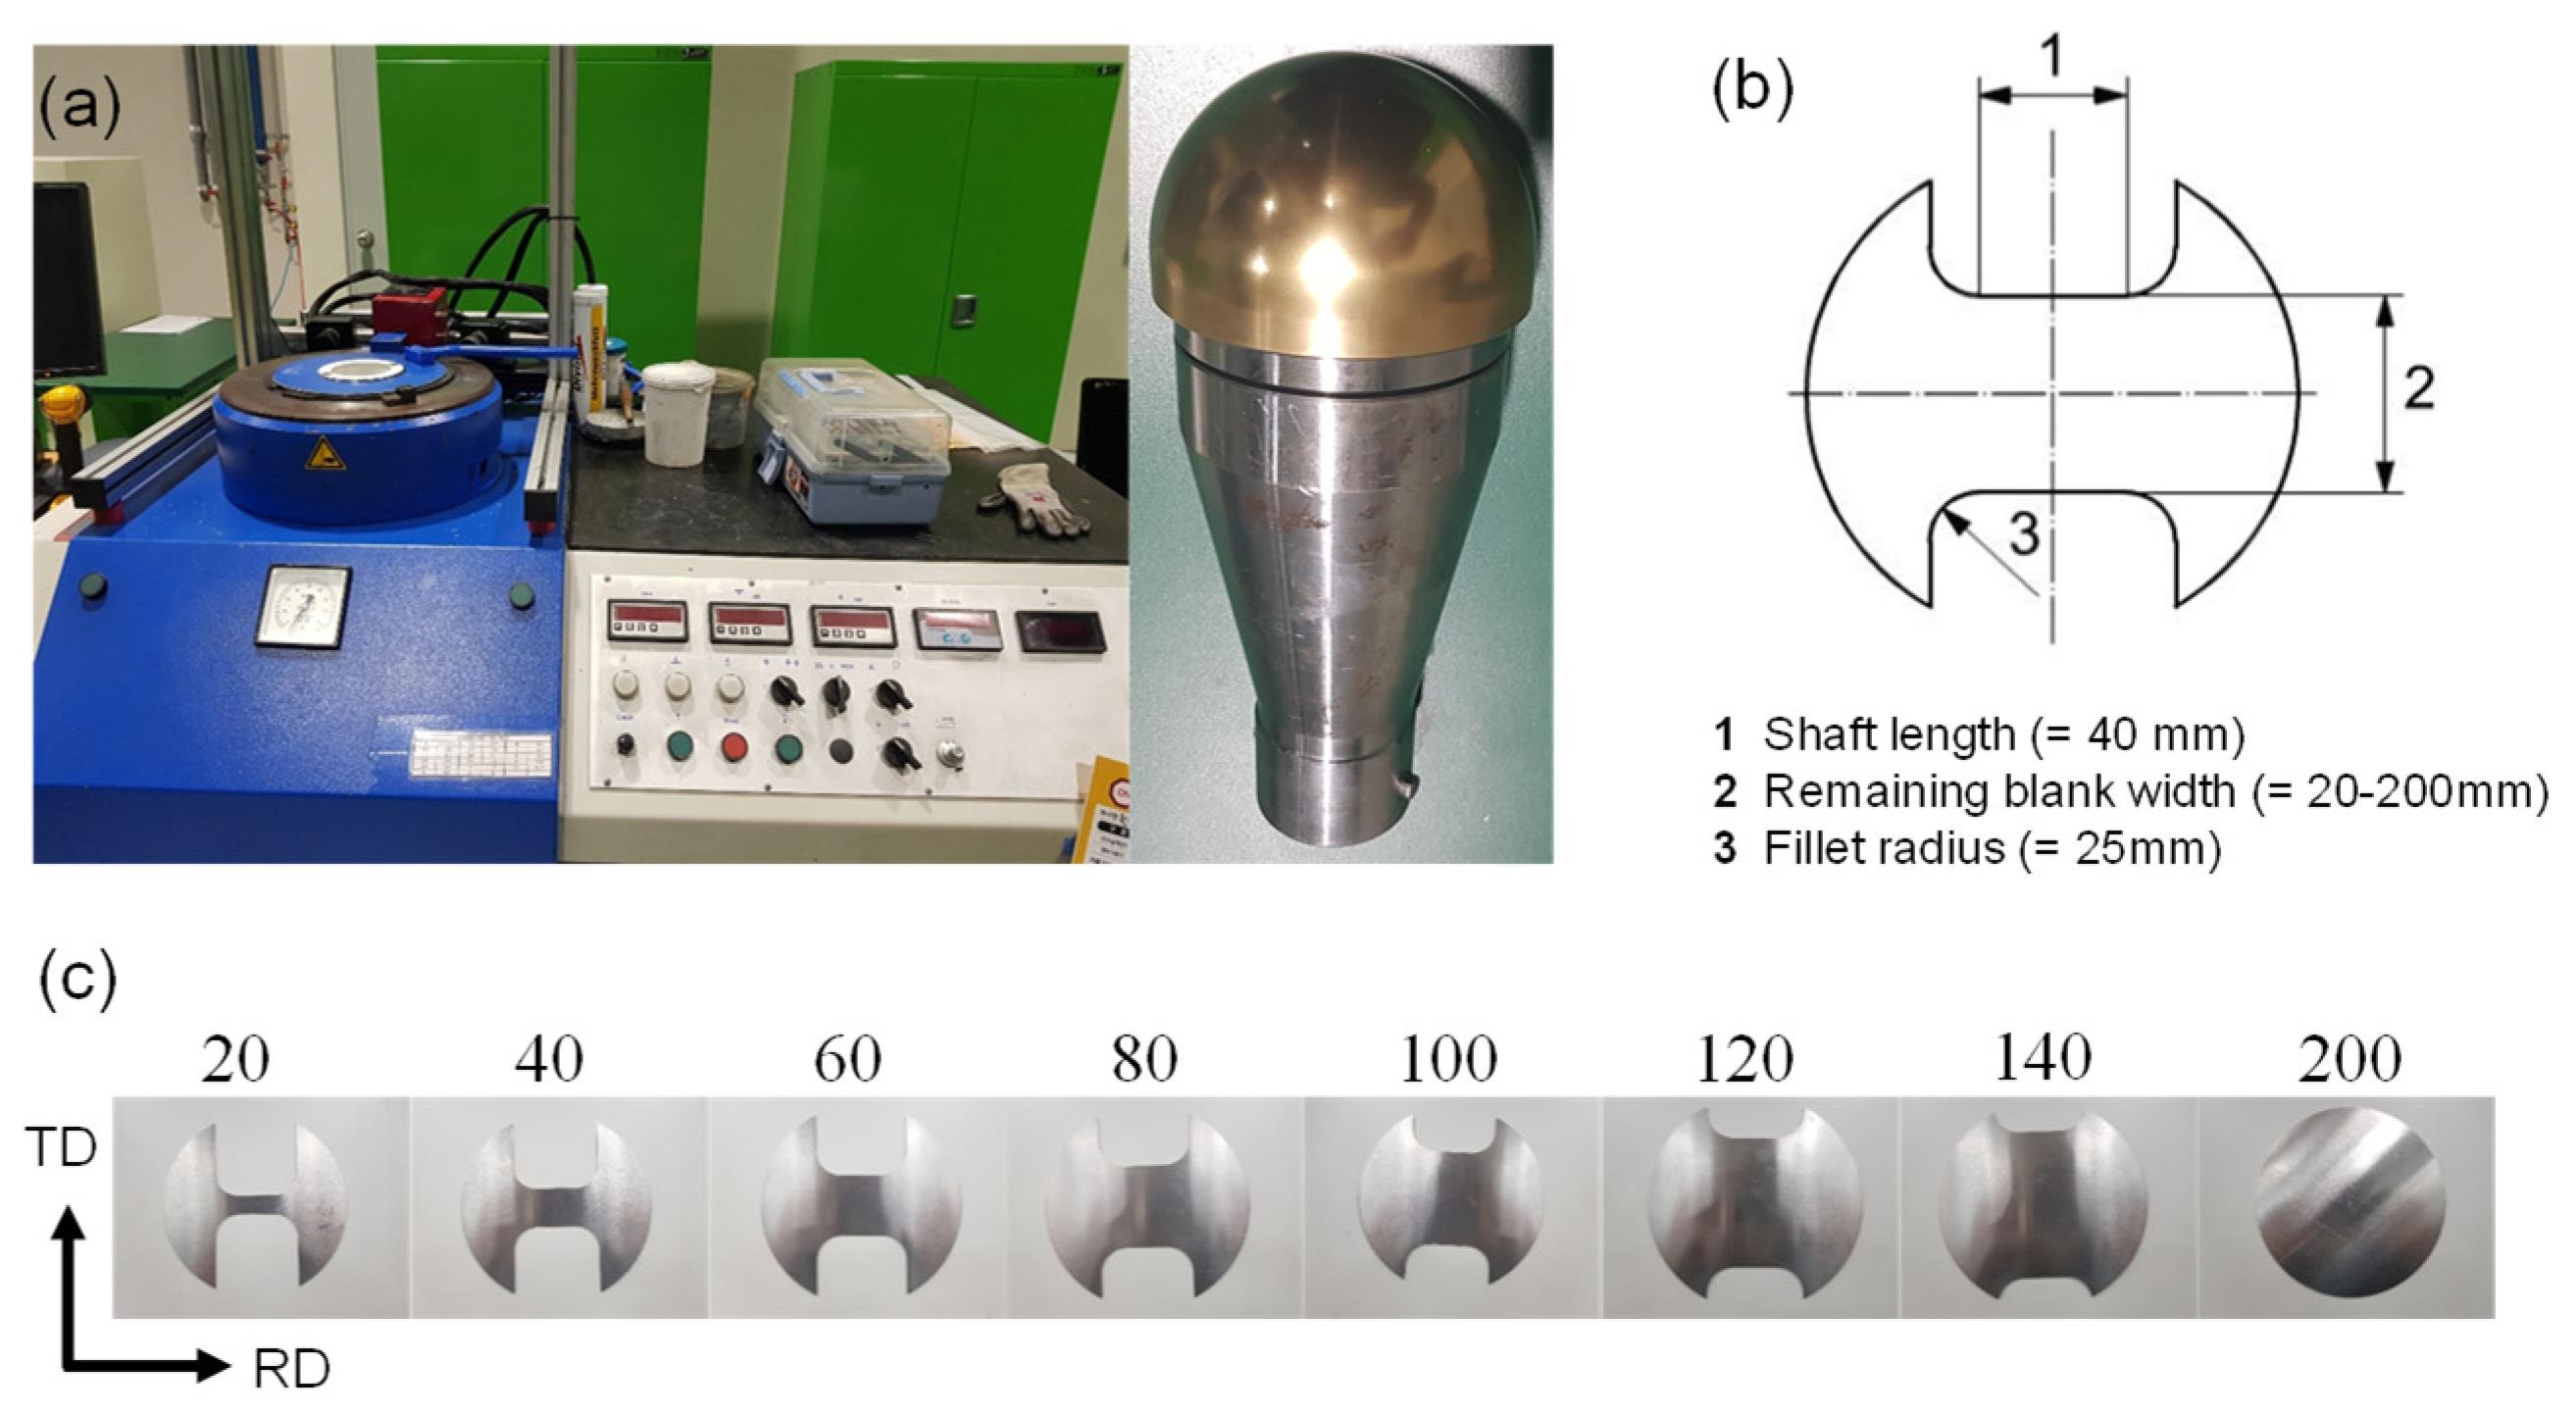
2. Experimental Procedure

The 2 mm-thick as-received AA6061 aluminum alloy sheet, denoted as AR (as-received), was in the peak-aged state, i.e., in the T6 heat treatment state, which was achieved through the heat treatment process depicted in Figure 1a, which involved solid solution homogenization at 530 °C for 1 h, followed by artificial ageing at 170 °C for 9 h and subsequent water quenching. According to the ASTM-E8 standard [33], the plate-form specimens, with a thickness of 2 mm, for the uniaxial tensile tests were extracted from the sheet along the RD, TD, and DD, respectively, as shown in Figure 1d. Figure 1b,c illustrate the detailed processes for the two different ageing treatments, denoted as AA (artificially aged for 2 h, after the solution heat treatment, also known as under-aged in the literature), and PA (pre-aged for 10 h, after the solution heat treatment, followed by natural ageing for 1 week). The AA alloy differs from the AR alloy only in the time of artificial ageing, and the PA alloy experiences a pre-ageing treatment, intended to mitigate the detrimental effects of natural ageing. After the ageing treatments, uniaxial tensile tests were performed in a quasi-static manner with displacement control and a starting strain rate of 0.001 s−1 at room temperature, using the prepared specimens for the three alloys. For each alloy, the tensile tests were repeated three times in each direction to verify the repeatability.
The microstructures and crystallographic textures of the three alloys were measured using the EBSD technique inside a field emission scanning electron microscope (FE-SEM). The analyses were performed in an EBSD system (Hitachi SU-6600, Tokyo, Japan) with step sizes of 1.5 μm on the plane perpendicular to the TD. For each alloy, the sample was resin-mounted and polished using SiC papers, diamond suspensions up to 1 μm, and colloidal silica. The original EBSD data were treated using a clean-up step, consisting of grain confidence index standardization and grain dilation, with a grain misorientation of 5° and a minimum equivalent grain size of 4 pixels. As a consequence, the orientations of the isolated pixels around the identified grains were changed to match those of the adjacent neighbors. Then, the cleaned EBSD data for the tested alloys were analyzed using the EDAX TSL OIM Analysis ver.7.2.
As depicted in Figure 2a, the Erichsen machine for universal sheet testing was utilized to determine the FLC of the AR alloy using the Nakazima test according to the ISO12004-2 (2008) standard [34]. Figure 2b shows the geometric dimensions of the eight specimens that were used to determine the FLC curves in the tests. They were prepared to have different blank widths in the range of 20–200 mm, allowing for different biaxial loading conditions. The room temperature formability tests were performed using a hemisphere punch with a moving speed of 0.5 mm/s and a blank holding force of ~200 kN. Before each measurement, the specimen was sprayed with a speckle pattern, using black and white paint on the surface of the specimens. Graphite-teflon-graphite was used to minimize the friction between the punch and the tested sheet in the tests. Two digital image correlation (DIC) cameras were mounted on the top of the tested sheet to measure and analyze the deformation of the specimens. Following the recommended method in ISO12004-2 (2008), the three planes with intervals of 2 mm perpendicular to the fracture line in the DIC analysis were defined to calculate the major and minor strains for constructing the FLC of the alloy [28].

3. Numerical Modeling

3.1. Crystal Plasticity Model

The crystal plasticity constitutive model developed in this study follows the framework originally proposed by Rice [31] and Asaro and Needleman [32], which is briefly mentioned below. In the rate-dependent crystal plasticity model, the total deformation of a crystallite is contributed to by two distinct physical mechanisms, i.e., the crystallographic slip, due to the dislocation motion on the active slip systems, and the elastic distortion of the crystal lattice. The elastic constitutive equation for a single crystal is specified by
σ = C D σ ˙ 0 σ t r D
where σ is the Jaumman rate of the Cauchy stress, D represents the strain rate tensor, C is the fourth-order tensor of the elastic moduli, and σ ˙ 0 is a viscoplastic-type stress rate that is determined by the slip rates on the various slip systems in the crystal.
The slip rate on the α t h slip system is assumed to obey Schmid’s law, and is driven by the resolved shear stress, τ α , as follows:
γ ˙ α = γ ˙ 0 α τ α / τ c α 1 / m s g n τ α
where γ ˙ 0 α is the reference shear rate, taken to be the same for all slip systems, τ c α represents the critical resolved shear stress (CRSS) for the system, and m is the coefficient of the strain rate sensitivity.
The strain hardening of the slip system is characterized by the evolution of the CRSS and is determined by
τ ˙ c α = β h α β γ ˙ β
where h α β is the hardening matrix that considers the interactions among the slip systems including self hardening ( α = β ) and latent hardening ( α β ). It can be expressed as
h α β = q h α α + 1 q h α α δ α β
where h α α is the self-hardening modulus, δ α β is the Kronecker delta, and q is the latent hardening rate due to the slip activity on other slip systems. The hardening law for a slip system is defined as follows [35]:
h α α = h 0 1 τ c α τ s a

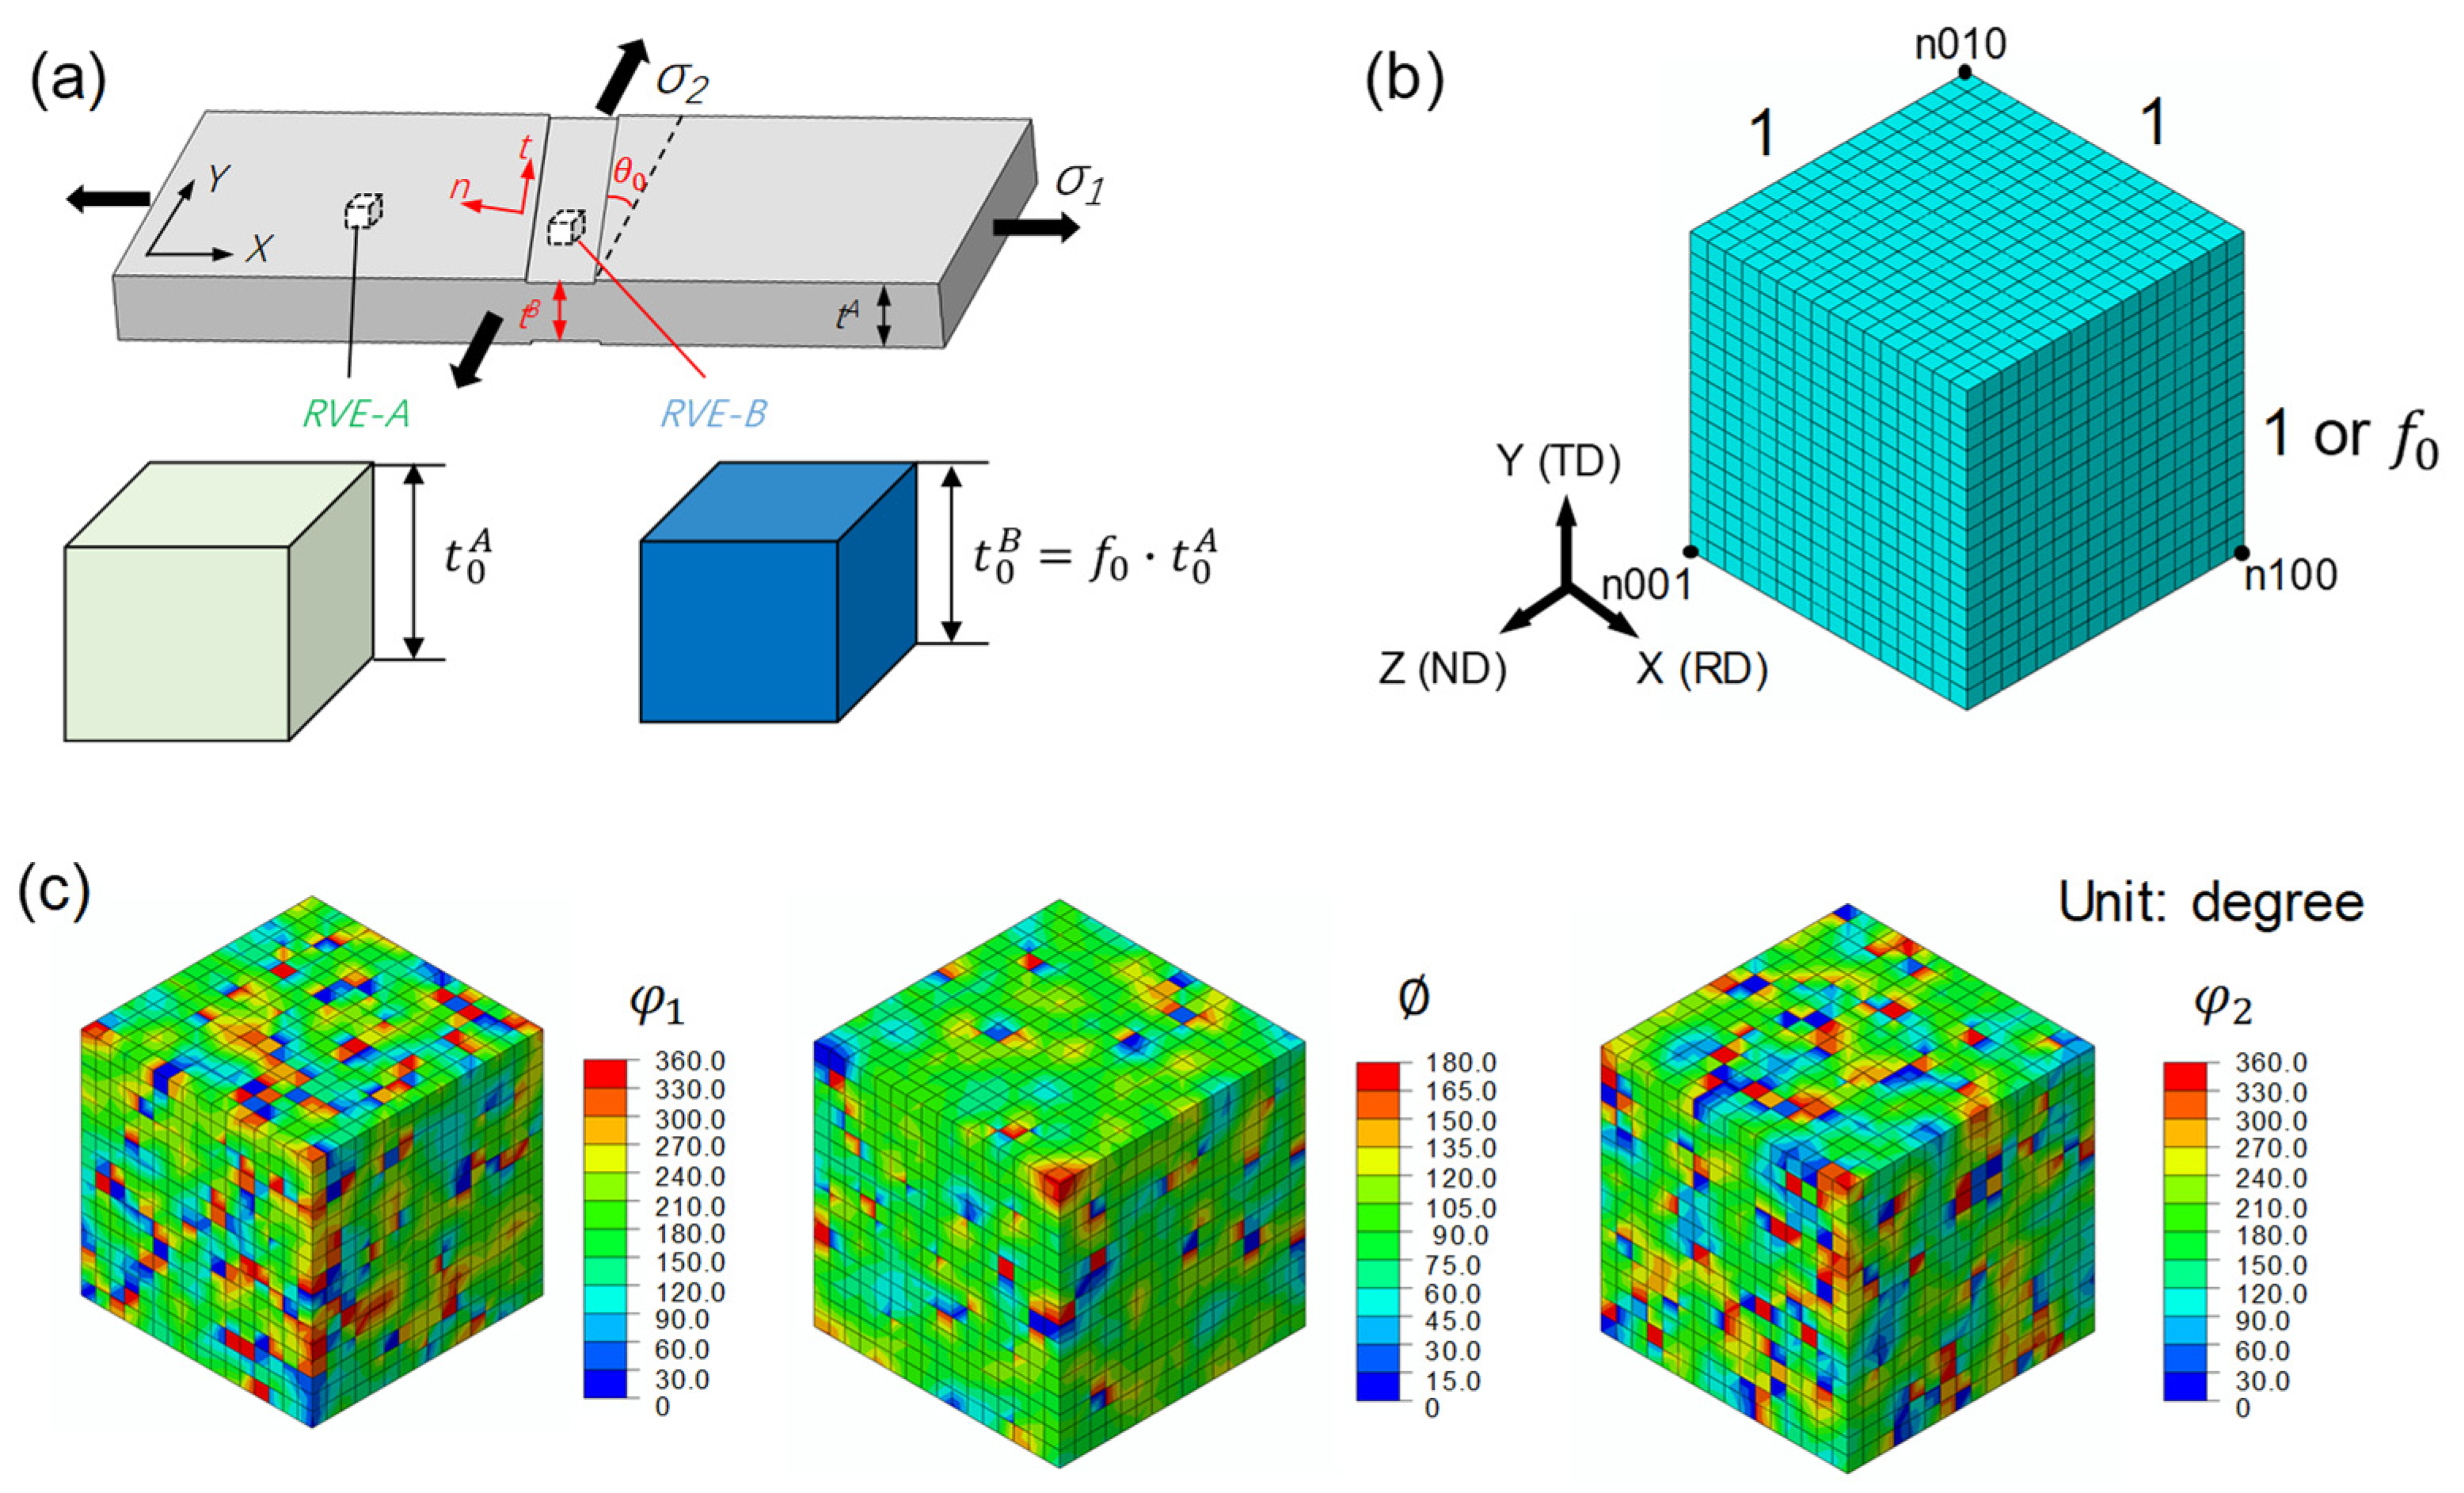
3.2. Implementation of the M-K Approach

The basic assumption of the M-K approach is the existence of initial material imperfections in the form of a groove or band that is inclined at an angle θ 0 with respect to the major loading direction. For the sake of simplifying the calculation and reducing the computational cost, we follow the original M-K approach, where the initial imperfection is perpendicular to the major loading axis, corresponding to the case of θ 0 = 0°. As shown in Figure 3a, two different characteristic regions are assigned as follows: a homogeneous region A, and an initial imperfection region B, with a reduced thickness. The initial imperfection factor is defined by
f 0 = t 0 B / t 0 A
where t 0 A and t 0 B are the initial thickness outside and inside the imperfect region, respectively.
Due to the force equilibrium and the strain compatibility across the imperfection, the strain increment inside region B is greater than that inside region A during loading, and, therefore, a localized necking develops from region B. In the outer region, a state of proportional biaxial stretching, with no in-plane shear strain, is imposed [26,27]:
ρ = ε ˙ X A / ε ˙ Y A   with   ( 0.5 ρ 1.0 )
where ρ is the strain ratio corresponding to the loading path, and ε is the total strain. The subscripts X and Y stand for the normal strain components along the X and Y axes. The deformation imposed on region A is not affected by the imperfection, whereas region B satisfies the following equilibrium and compatibility conditions:
F X A = F X B ,   F n t A = F n t B   and   d ε t t A = d ε t t B
where F is the section load, and t and n represent the in-plane directions both normal and parallel to the groove, respectively.
As shown in Figure 3a, two representative volume elements (RVEs) are created to simulate the deformation behavior of region A and region B, respectively. Both RVEs have the same initial configuration, except for their thicknesses; therefore, they undergo different deformation states as the neck develops. To obtain the FLC, the following procedure is repeated for each loading path ( ρ is taken to be −0.5, −0.3, −0.1, 0, 0.2, 0.4, 0.6, 0.8, and 1.0):
(i) the boundary conditions corresponding to the loading path ρ are imposed on the RVE-A, and the finite element simulation for the RVE-A is executed for a sufficient amount of deformation.
(ii) after the simulation for the RVE-A is completed, the load F X A can be calculated using the X component of the reaction force at node n 100 A , and the strain ε Y A can be calculated using the Y component of the displacement at node n 010 A .
(iii) the boundary conditions for the RVE-B are imposed using Equation (8) as follows: the X component of the force at node n 010 B is F X B , and the Y component of the displacement at node n 010 B is equal to ε Y A . The finite element calculation for the RVE-B is performed until a forming limit criterion is met. In this study, the forming limit criterion is given by
ε ˙ Z Z B > r c × ε ˙ Z Z A
where r c is the critical strain rate ratio in the thickness direction of the sheet.

3.3. Finite Element Model

The crystal plasticity constitutive model outlined in Section 3.1 was adapted as a user material subroutine (UMAT), and was implemented, in conjunction with the M–K approach described in Section 3.2, into the commercial finite element program ABAQUS 6.14 in order to predict the FLCs of the studied alloys. For each alloy, the initial crystallographic texture measured through EBSD was used to calculate the orientation distribution function (ODF) of the alloy, which was discretized into 4096 individual orientations. As shown in Figure 3b, voxel-typed RVEs were created through considering the measured texture, and a total of 4096 (16 × 16 × 16) crystallographic orientations were randomly assigned to the RVEs composed of 4096 C3D8R (8-node solid element with reduced integration) elements. Figure 3c shows the input texture information, represented by the Euler angles, of the AR alloy. The geometric dimension of the RVE-A was prescribed to be 1 × 1 × 1 (arbitrary unit). The only geometric difference of the RVE-B to that of the RVE-A is its thickness, which equaled to the initial imperfection factor, as defined by Equation (6).
To simulate a large part of the material through the use of the RVE, periodic boundary conditions were imposed on both RVEs following the method described in [26,28]. The displacement vector of a node on the positive X plane (whose outward normal direction is the positive X direction) of the RVE is related to that of the corresponding node on the negative X plane by
u X + = u X + F · n 100 n 000
where F is the deformation gradient, and n 100 and n 000 represent the position vectors of nodes n 100 and n 00 , which are, respectively, located at the vertice point and the origin point of the RVE. Similarly, for the paired nodes on the Y and Z planes, we have
u Y + = u Y + F · n 010 n 000
u Z + = u Z + F · n 001 n 000
Equations (10)–(12) were defined using the keyword ‘equation’ in the ABAQUS input file. The origin point was prescribed to be fixed in order to avoid rigid body motion in the CPFE simulations.
In this study, the CPFE analyses consist of two parts: (1) the calibration of the CPFE model using the RVE-A; and (2) the prediction of the FLCs of the materials using both the RVE-A and RVE-B. In all simulations, the RD is aligned with the X axis, and the X-Y planes of the RVEs correspond to the ND plane of the sheet material. To simulate the uniaxial tensile test along the DD, the rotation matrix, calculated from its relevant Euler angles read in by the UMAT, of each discrete single crystal (element) is multiplied by a rotation matrix with an in-plane angle of 45°, and an opposite rotation was applied for updating the Euler angles of the discrete single crystals.

4. Results and Discussion

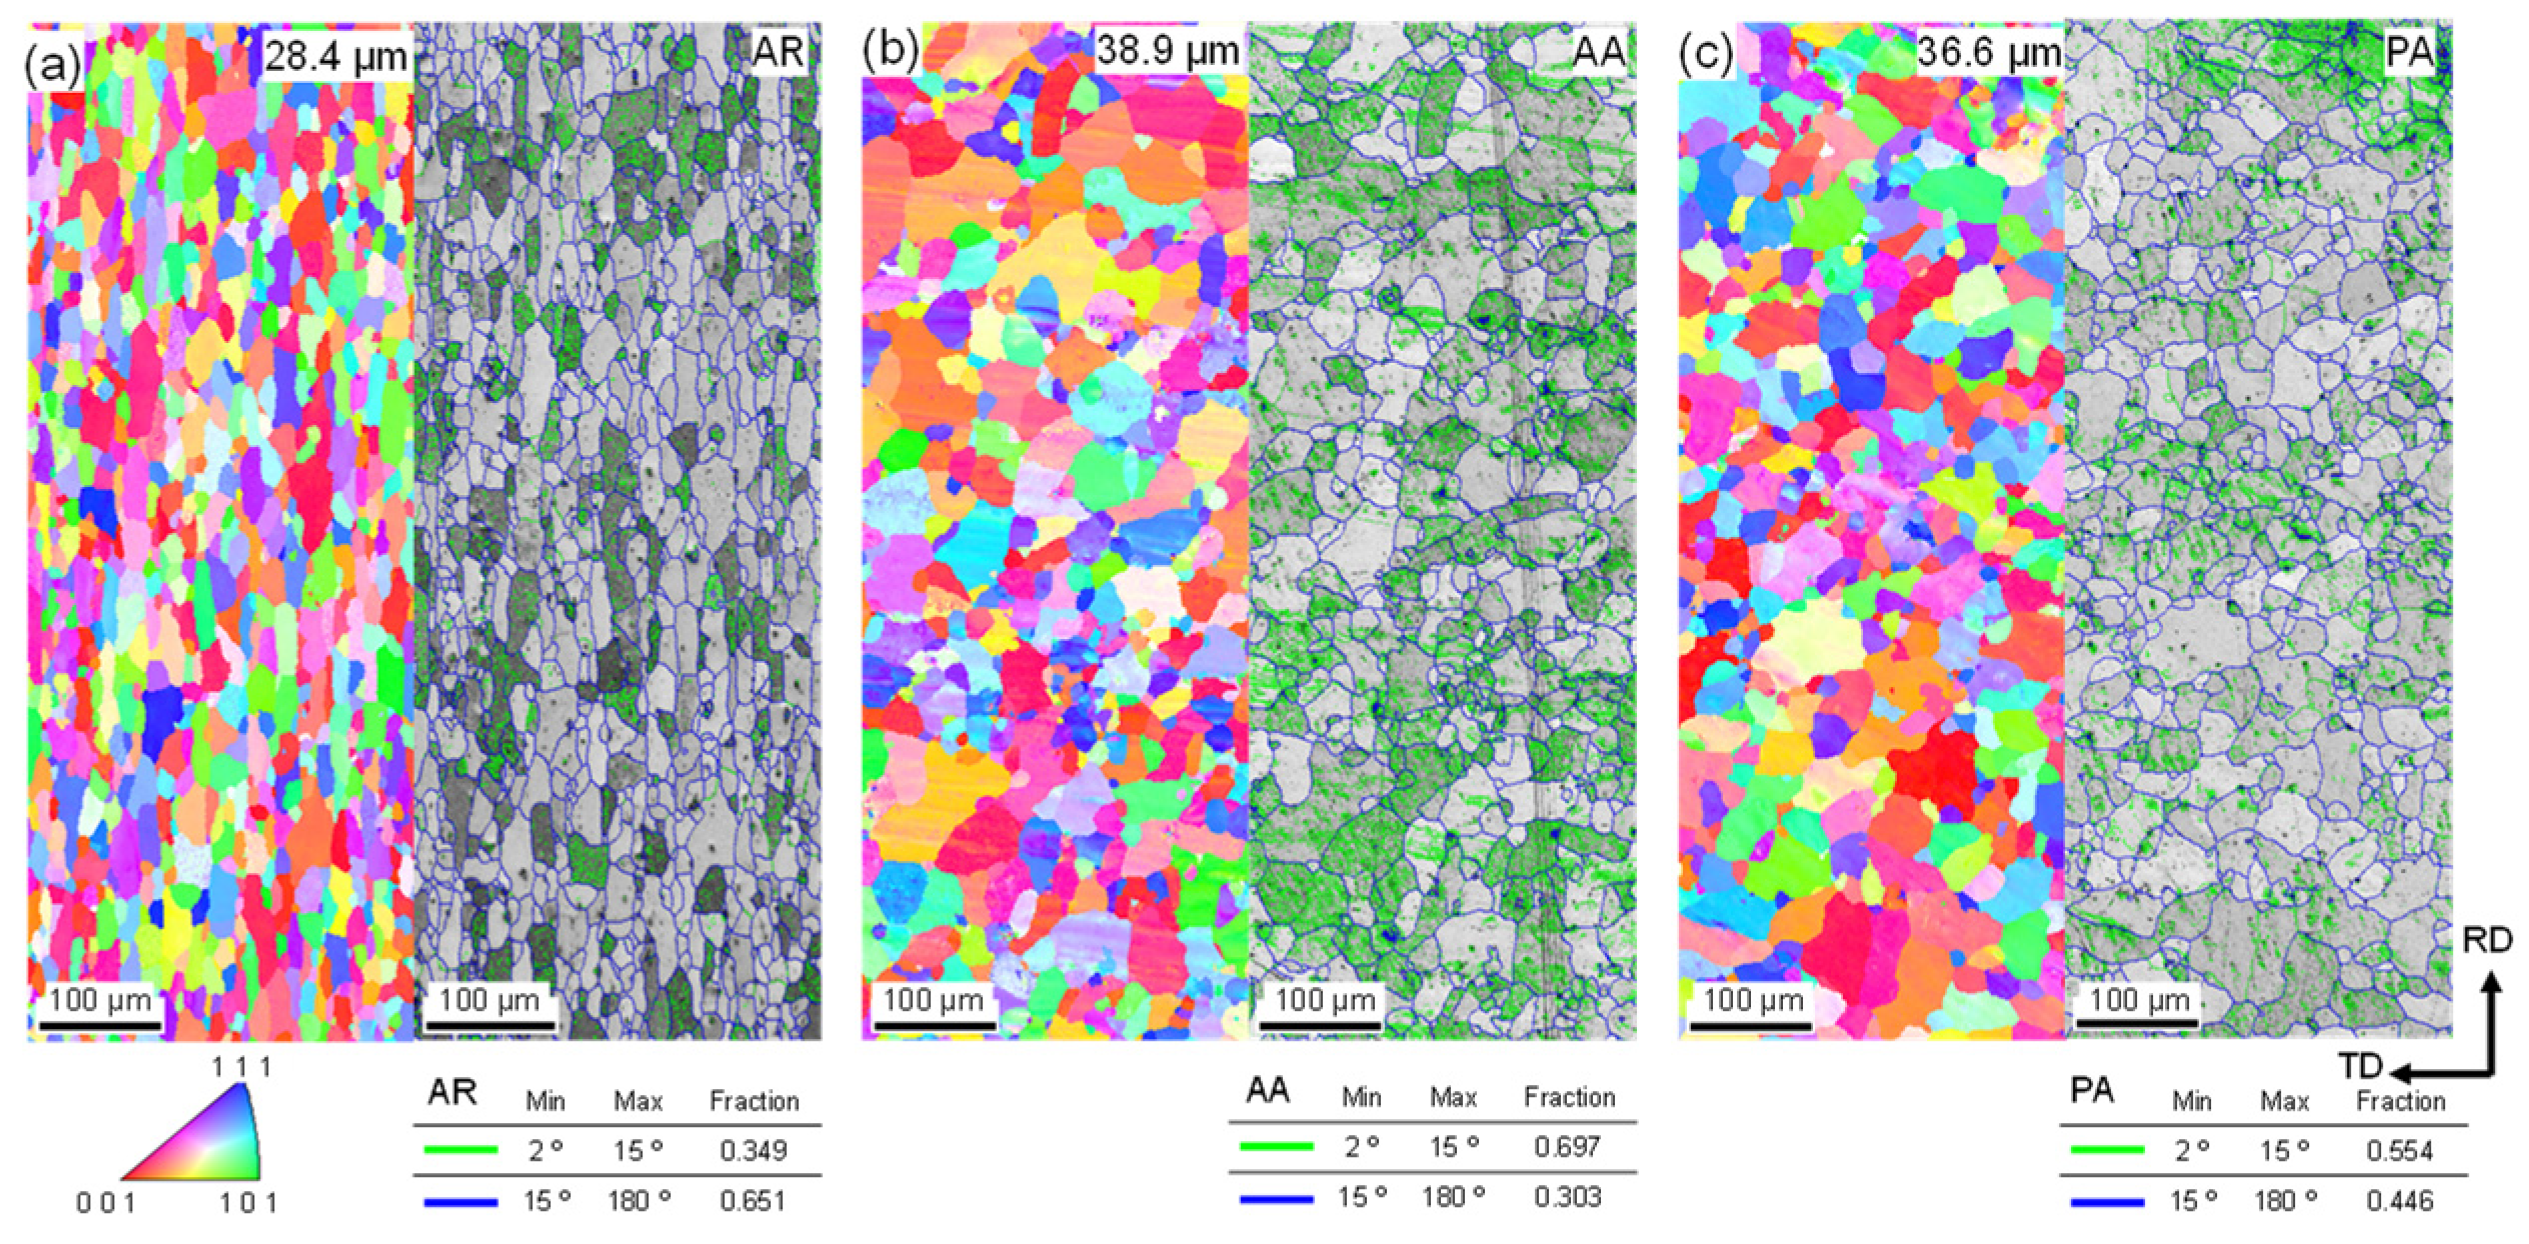
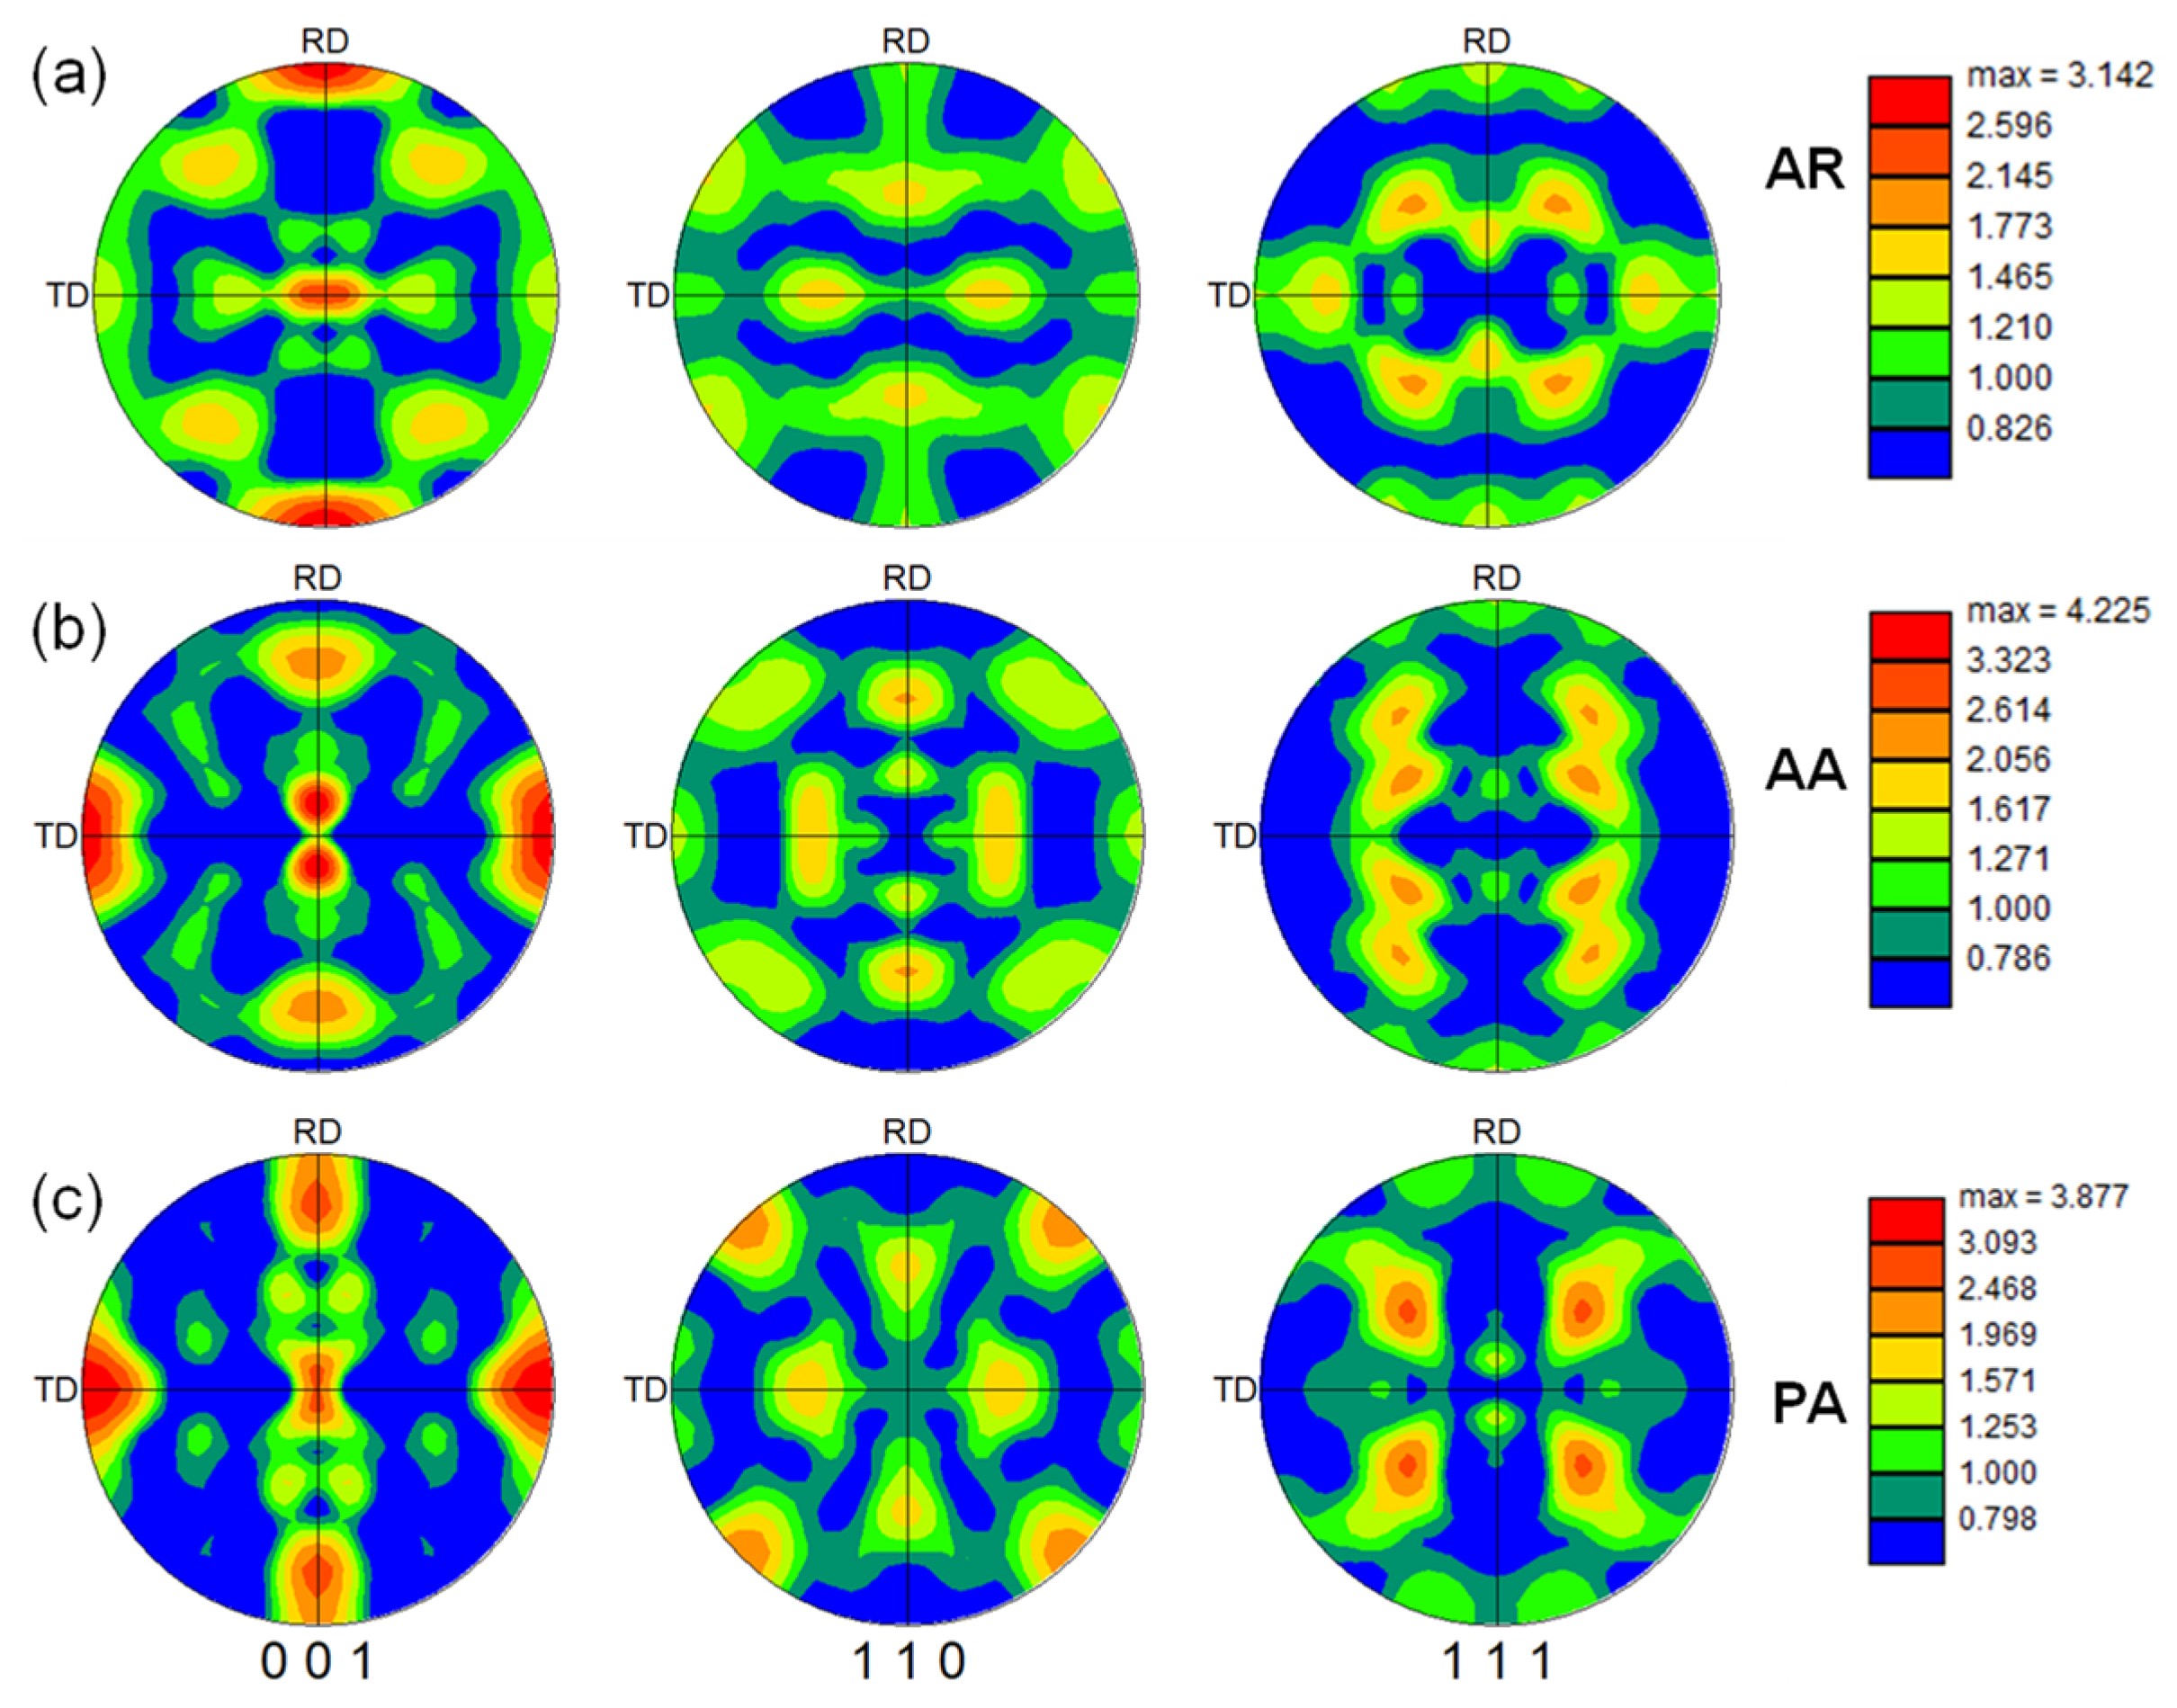
4.1. Initial Microstructure and Crystallographic Texture

Figure 4 presents the initial microstructures of the differently age-treated alloys, which indicate fully recrystallized equi-axis grain morphology in the alloys, and the grain sizes for the AR, AA, and PA alloys are 28.4 µm, 38.9 µm, and 36.6 µm, respectively. The grain sizes of the latter two are slightly larger than the AR alloy, and the misorientation angles are also reduced because the solution heat treatments of the two alloys were performed on the AR alloy. Figure 5 shows the crystallographic textures, represented by the {001}, {110}, and {111} pole figures, of the alloys. It can be seen that the texture of the AR alloy features a dominant cubic texture component combined with the S texture component. The texture of the PA alloy is generally similar to that of the AR alloy, while the original S texture component in the AA alloy slightly changes into a non-ideal orientation towards the RD due to the solution heat treatments.

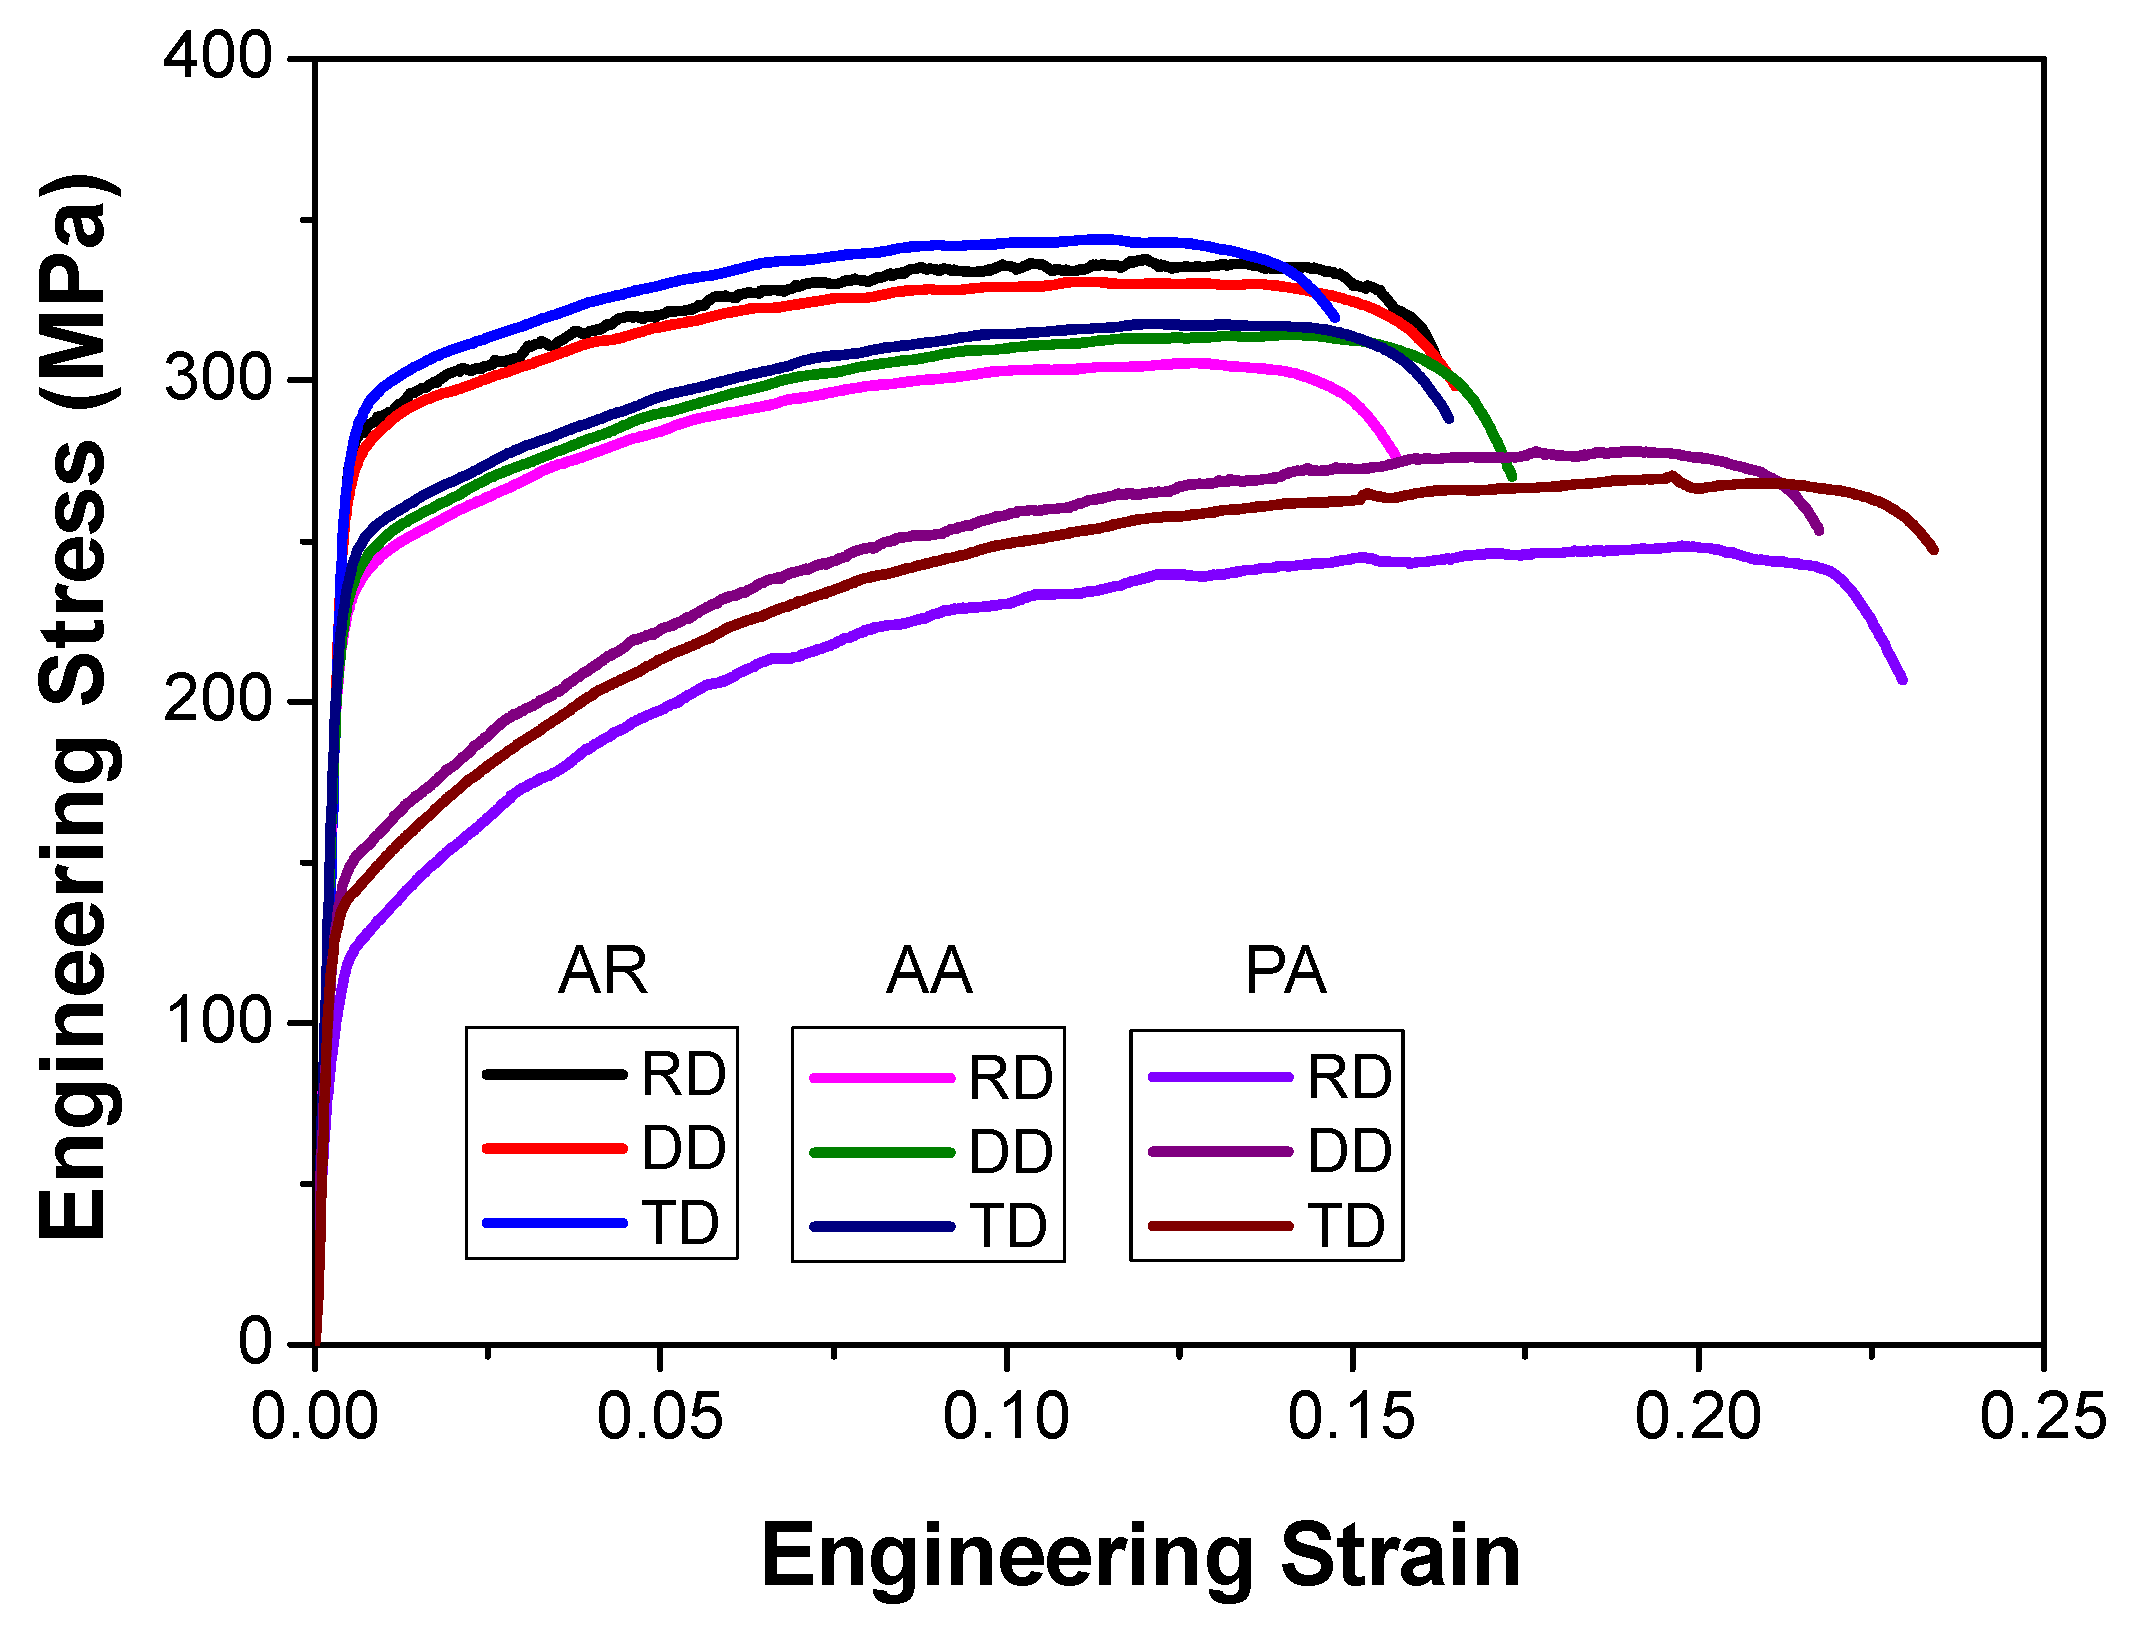
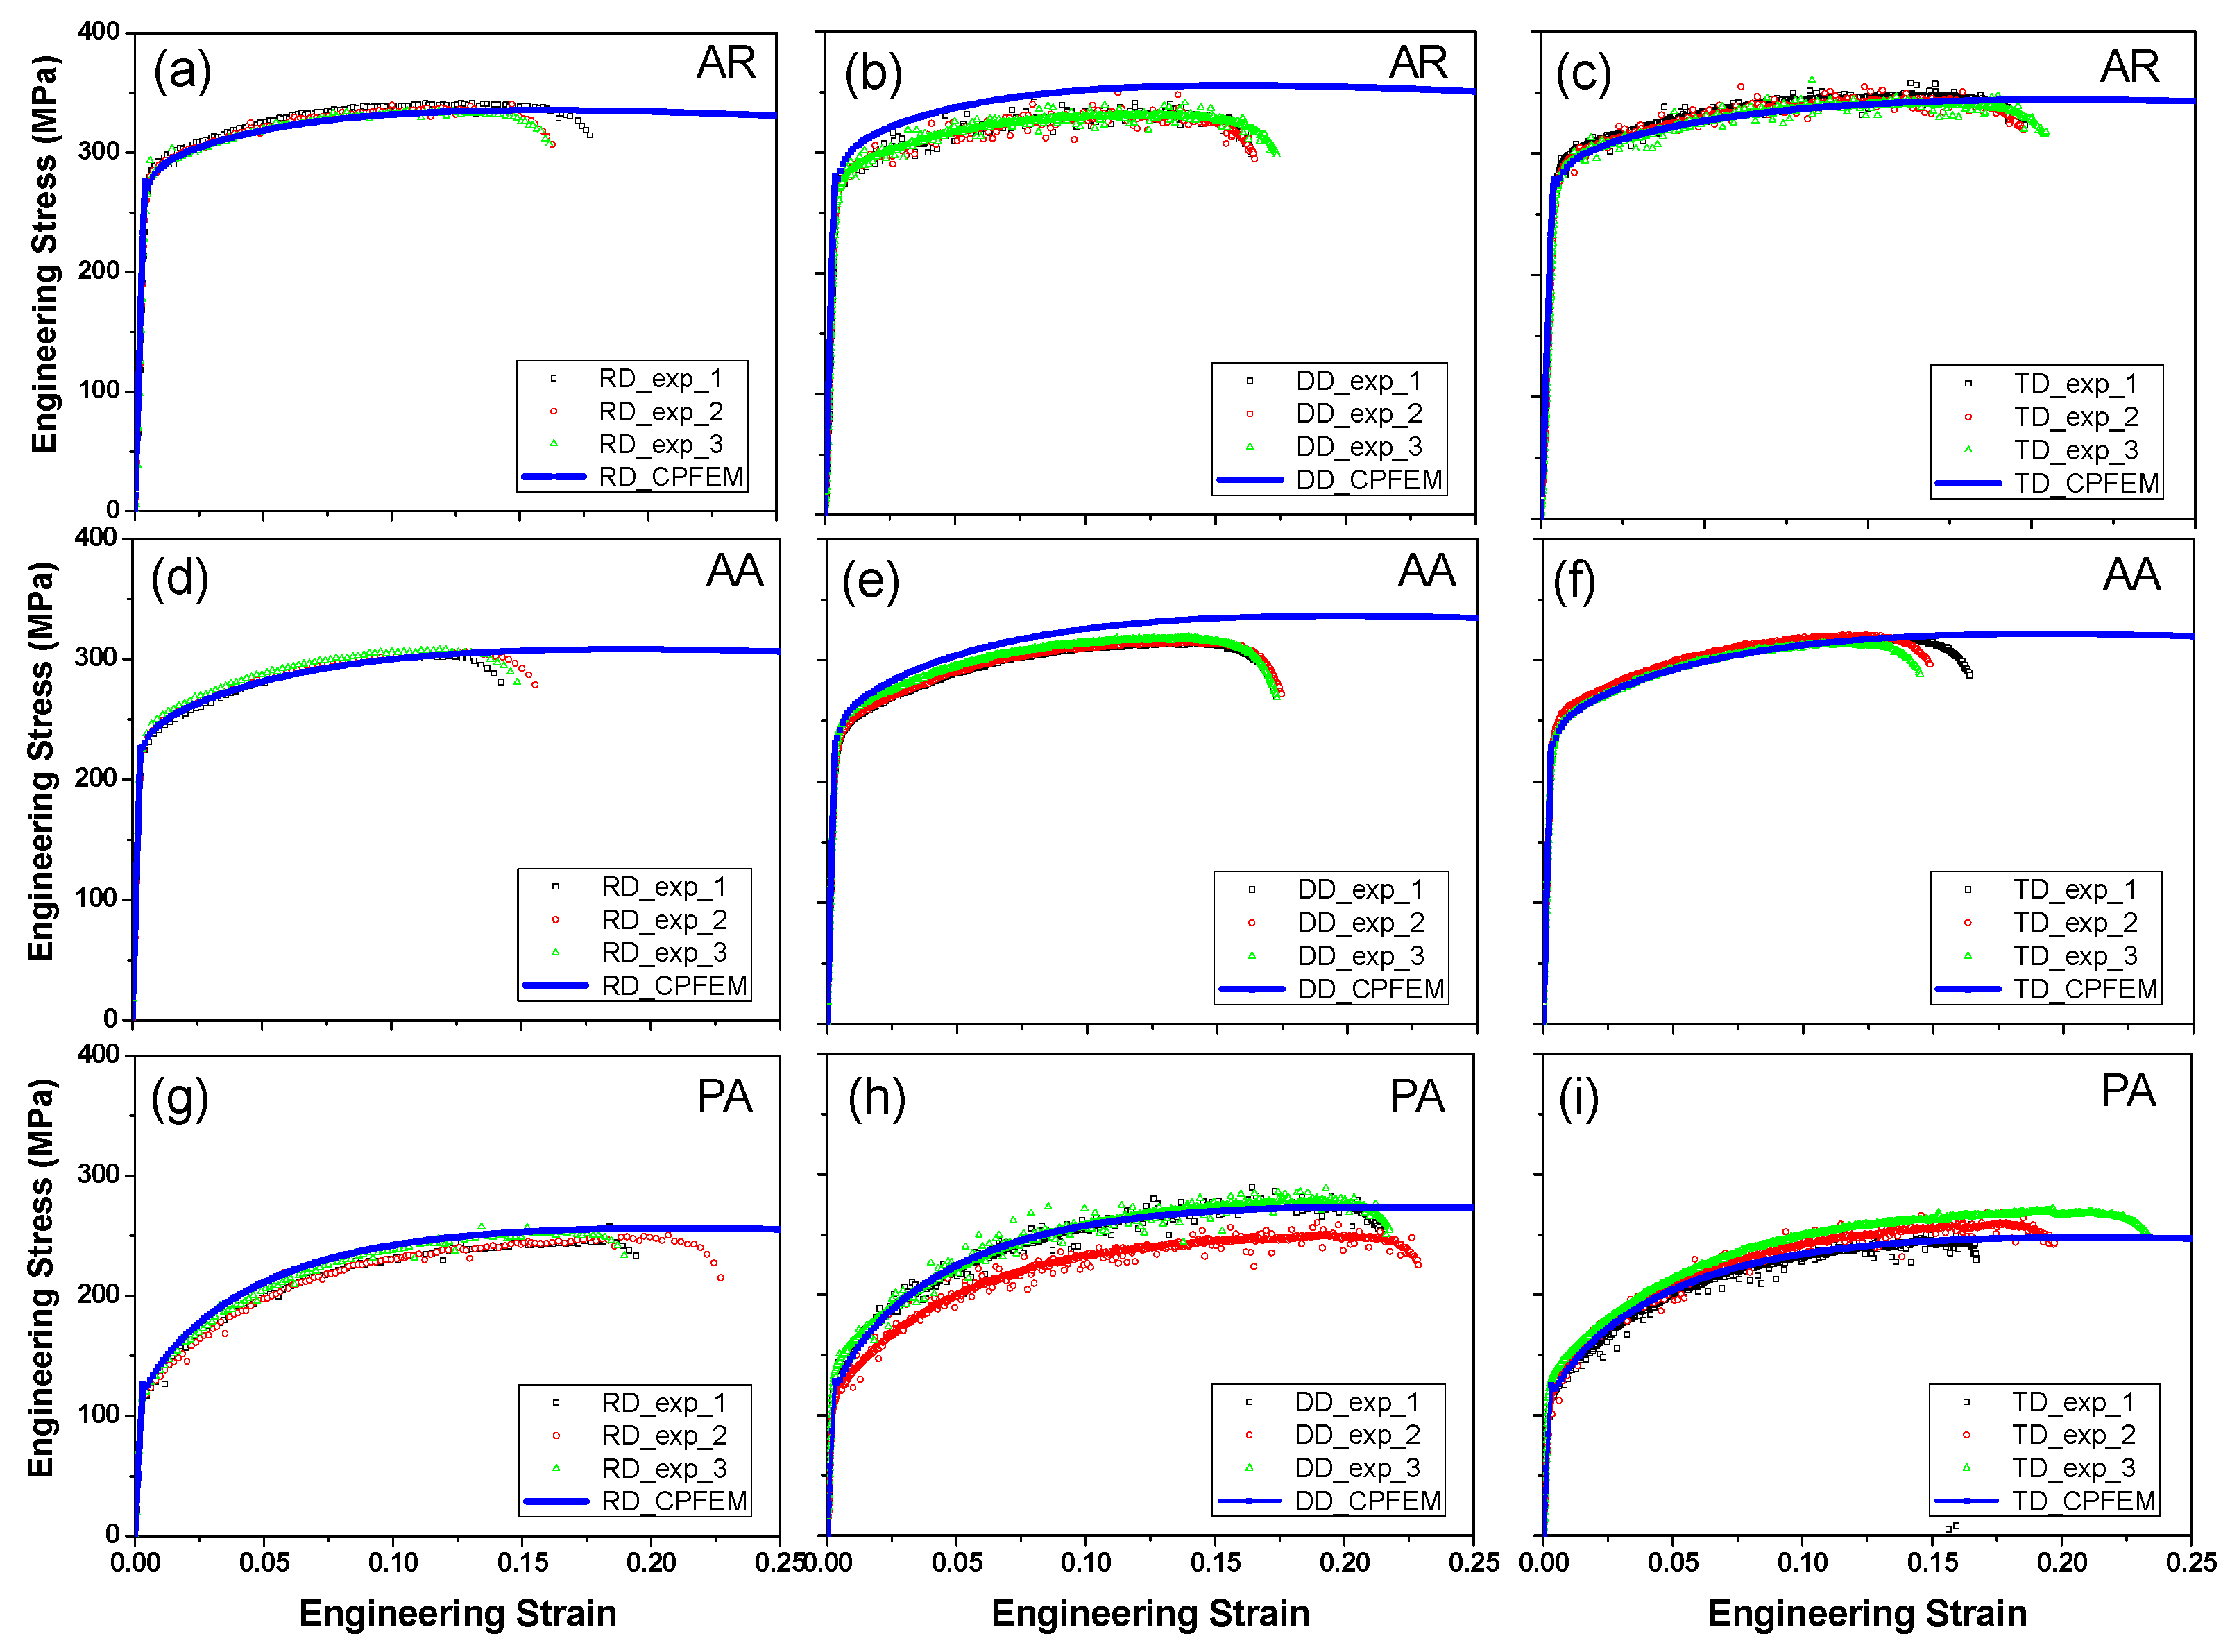
4.2. Stress–Strain Behavior and Parameter Calibration
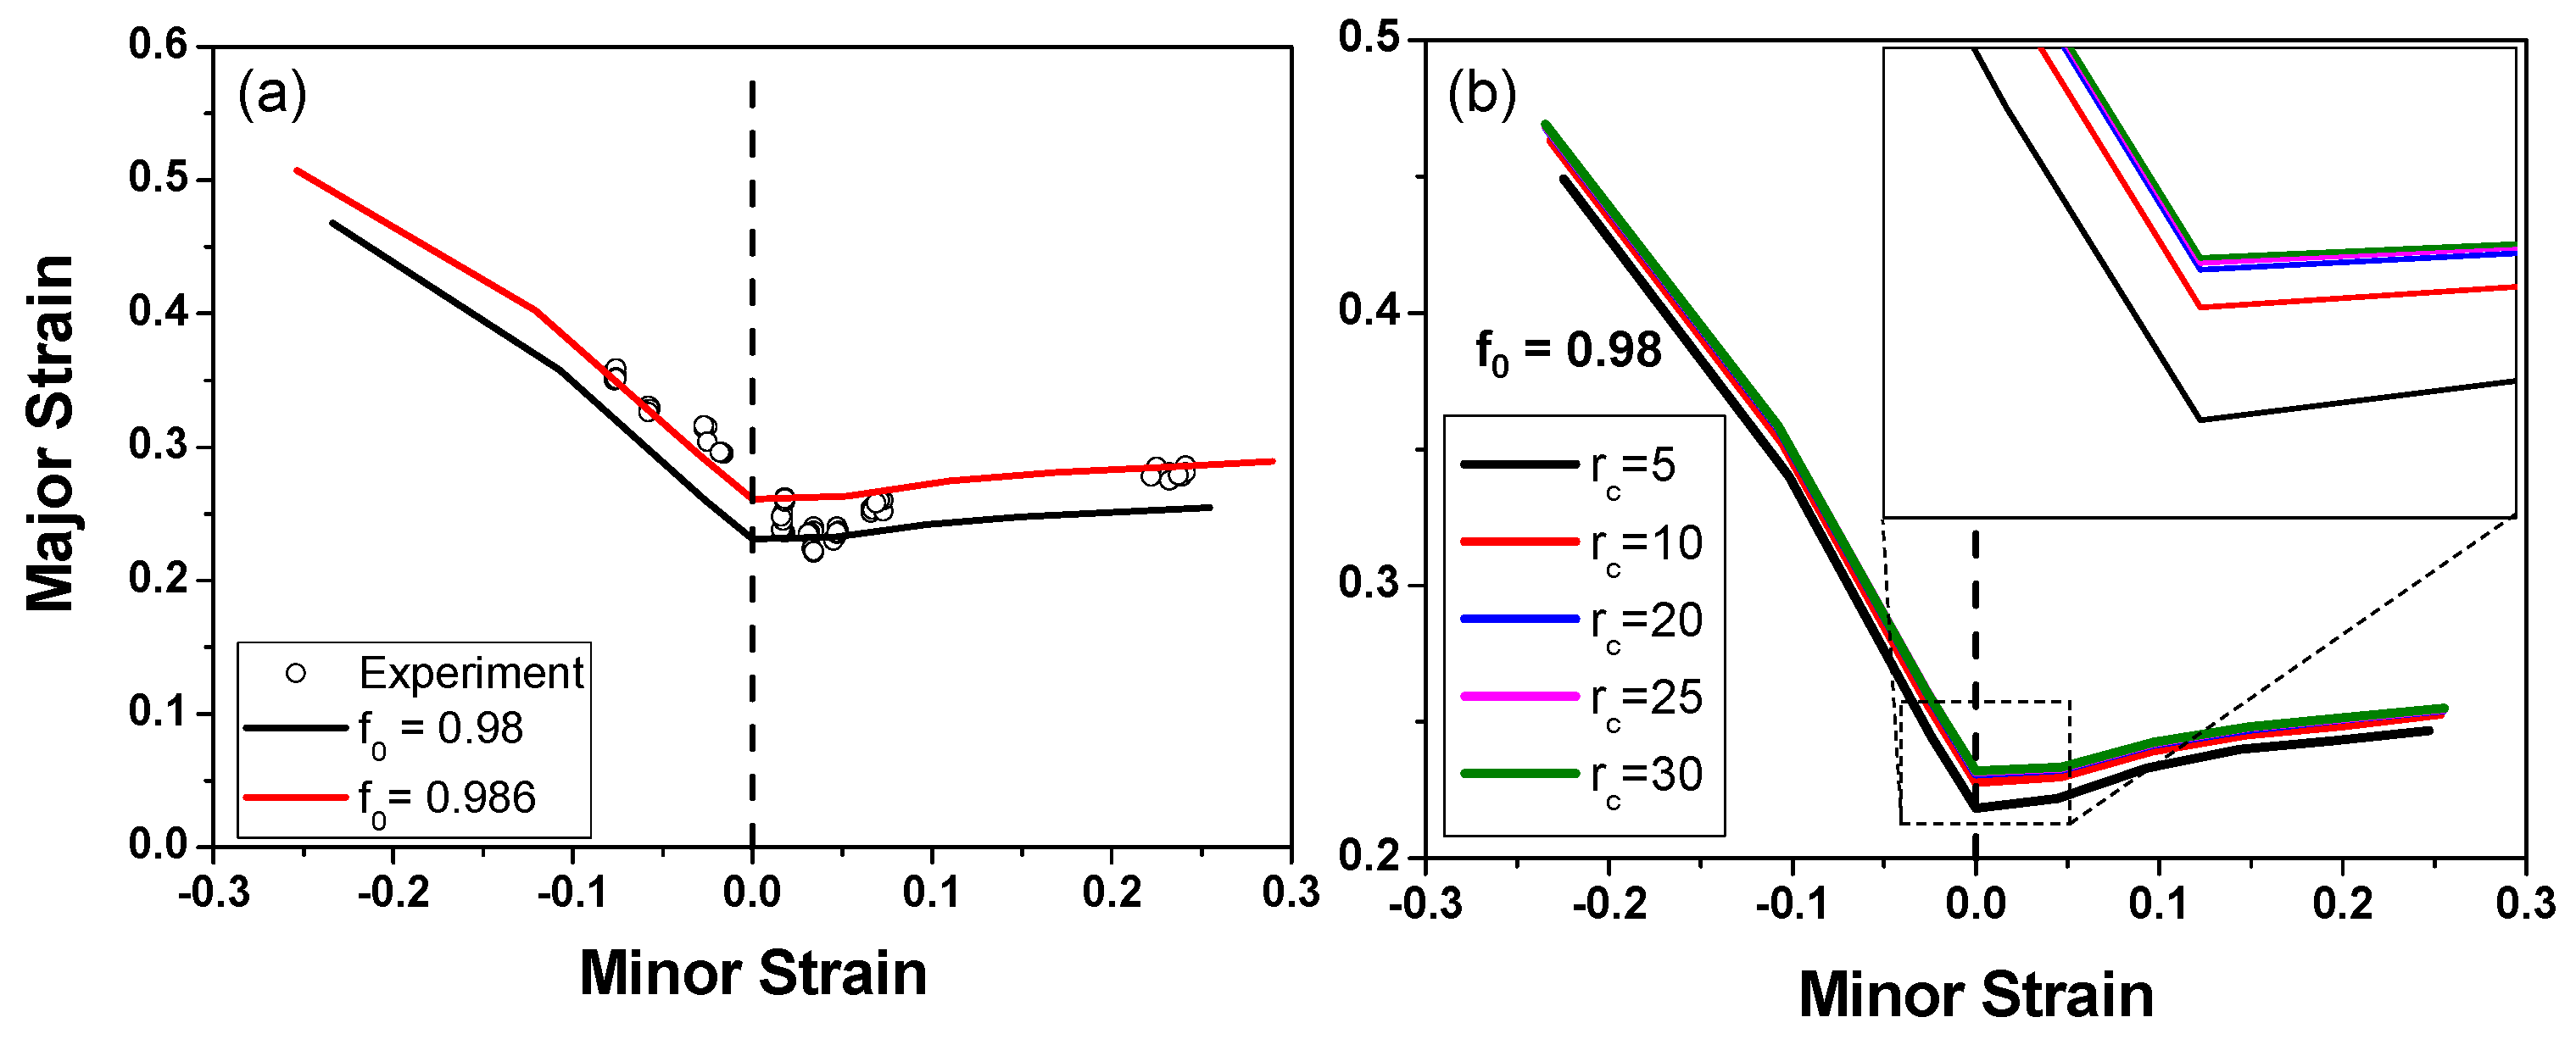
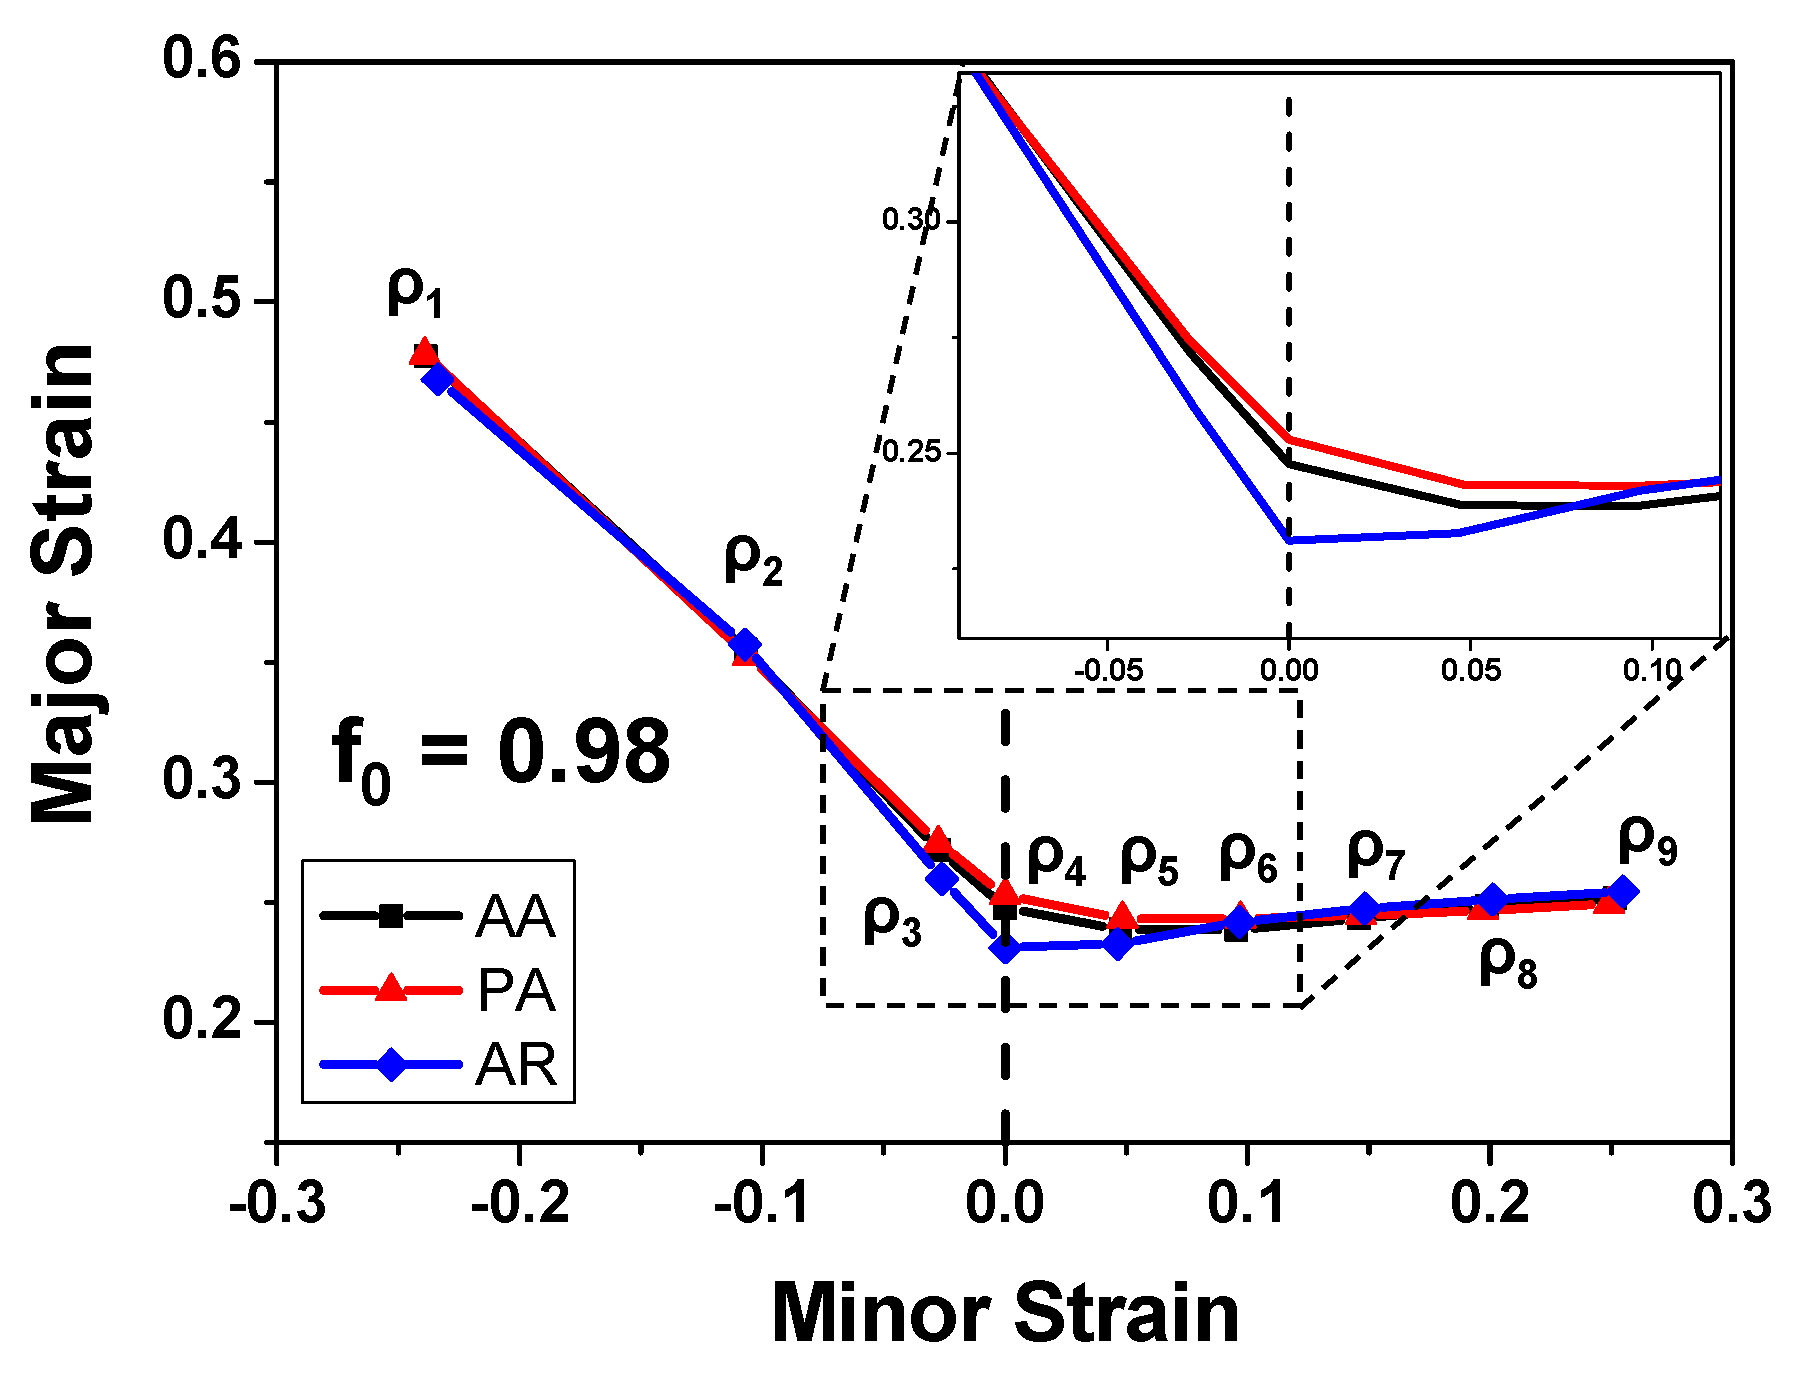
Figure 6 shows the engineering stress–strain curves obtained from the uniaxial tensile tests along the RD, TD, and DD of the alloys. Intuitively, the AR alloy has the highest strength among the studied alloys, the strength of the AA alloy is in the middle, and that of the PA alloy is the lowest. Table 1 lists the 0.2% yield strength (YS) and the ultimate tensile strength (UTS) of the alloys. Despite the grain size difference, the main reason for the strength difference among them is due to the different states of precipitation in the alloys [4]. The AR alloy is in the T6 peak-aged state, so the largest amount of precipitates embedded in the Al matrix is expected to be effective in increasing the strength of the material. The AA alloy experiences a shorter artificial aging time than the AR alloy, allowing the strength to be lower due to a reduced amount of precipitate distributed in the Al matrix. The basic microstructure of the PA alloy is in the solution treatment state, and the precipitation-hardening effect from the natural aging process was mainly due to the solute atoms and atomic clusters in the Al matrix, thus contributing little to the hardening of the alloy [36].
It is noted that the PA alloy exhibits strong work hardening because the solute atoms and atomic clusters act as obstacles for the dislocation slip and reduce the dynamic recovery rate, thus increasing the dislocation density and contributing both to strength and work hardening [37]. Morover, the maximum strength difference of the alloys along the RD, DD, and TD is 13 MPa for the AR alloy, 11 MPa for the AA alloy, and 34 MPa for the PA alloy, which indicates a higher level of in-plane plastic anisotropy in the PA alloy. The elongations of the alloys, represented by the failure strain, ε f , are also given in Table 1. The AA and AR alloys have a similar elongation of ~0.15, while the elongation of the PA alloy is ~0.2.
The stress–strain curves presented above were used to calibrate the hardening parameters of the slip systems necessary for modeling the mechanical behavior of the alloys, using the CPFE model described in Section 3.1. In the CPFE simulations, for the face-center-cubic (FCC) crystal structure, the three elastic constants for the AR alloy were taken from [38] as follows: C11 = 123.32 GPa, C12 = 70.65 GPa, and C44 = 31.21 GPa, and only the {111}<110> slip system was assumed to be responsible for the plastic deformation of the alloys. For simplification, the elastic constants for the PA and AA alloys were obtained via multiplying those for the AR alloy, with the ratio of their macroscopic elastic modulus to that for the AR alloy retrieved from the macroscopic stress–strain curves. The reference plastic shearing rate for the slip system γ ˙ 0 was assumed to be 0.001 s−1, while the coefficient of the slip rate sensitivity m was prescribed to be 20 [28]. The hardening parameters of the slip system have been calibrated to reproduce the stress–strain behavior of the alloys, and the parameters for the alloys after calibration are listed in Table 2.
Figure 7 compares the predicted stress–strain curves and the corresponding experimental results for the alloys, where open symbols are the experimental results from the three repeated tensile tests and the thick blue lines are the modeling results. The results indicate that the developed CPFE model can accurately predict the anisotropic stress–strain behavior for each alloy by considering the initial crystallographic texture and the elastic and plastic properties of the single crystals.

4.3. FLC Prediction

The calibrated parameters in Table 2 were used in the FLC predictions for the alloys via the model described in Section 3. Different values of the initial imperfection factor f0 and critical thickness reduction rate ratio rc have been examined to well reproduce the experimentally determined FLC of the AR alloy. Figure 8a presents the estimated FLCs using two imperfection factors, i.e., f0 = 0.98 and f0 = 0.986, with rc equaling 20, which are plotted together with the experimental FLC of the AR alloy for comparison. It shows that the developed CPFE-MK model can well predict the forming limits of the material along different loading paths, and a small change in the imperfection factor is possible to result in a clear discrepancy in the FLC prediction. To evaluate the predicting accuracy of the developed framework, the relative error between the modeling and experimental results are calculated using the following equation:
E r r o r = 1 N 1 N ε i , m a j o r m o d e l ε i , m a j o r e x p ε i , m a j o r e x p × 100 %
where ε i , m a j o r m o d e l and ε i , m a j o r e x p are, respectively, the predicted and experimental major strains, and N is the total number of strain paths (N = 9).
With an f0 of 0.986, the relative error of predictions is 5.0%, and the developed model can accurately predict the forming limit of the alloy when the loading path is close to uniaxial tension (ρ = −0.5) and balanced biaxial tension (ρ = 1.0), while it overestimates the forming limit if the loading path is approaching the plane strain tension state (ρ = 0). This is possibly due to the assumption that the major strain is along the RD direction, which makes it the weakest direction in the material. However, the weakest in-plane direction of the material might exist with a non-zero imperfection angle [25,27]. For an f0 of 0.98, the relative error is 8.1%, and the model underestimates the forming limit in most loading cases as compared to the case with an f0 of 0.986. The sensitivity of the predicted FLC to the critical strain rate ratio is presented in Figure 8b with the identical imperfection factor of 0.98. It reveals that the change in the predicted FLC resulting from the model is negligible when the ratio increases from 20 to 30, while obvious discrepancies can be maintained when it is smaller than 20. Thereafter, rc is set to be 20 for all the remaining predictions of the FLC for the PA and AA alloys.
It is well known that the deformation behavior is dependent on the loading paths, and therefore the texture evolution of the alloy will vary along different loading paths. Figure 9 presents the deformed textures, represented by the {111} pole figure, of the RVE-A and the RVE-B at the corresponding forming limit of the AR alloy along three typical loading paths, i.e., uniaxial tension (ρ = −0.5), plane strain tension (ρ = 0), and balanced biaxial tension (ρ = 1.0). Note that the initial texture is identical for these cases, as shown in Figure 9a. For the case of uniaxial tension, due to the load direction (RD), the {111} intensity around the RD pole increases as this orientation is hard to deform with a Schmid factor of 0, and a minor difference exists between the RVE-A and the RVE-B since the stress acting on region B is also uniaxially along the RD. For the case of plane strain tension, the texture changes of the RVE-A and the RVE-B are different. In the RVE-A, the S texture is maintained; however, a small amount of grains moves towards the Goss texture component. In the RVE-B, the intensity decrease in the S component is more severe, and the Goss texture component is the dominant texture component in the material. For the case of balanced biaxial tension, a lot of grains in the RVE-A move towards the 45° direction between the RD and TD due to the biaxial loading and the homogeneity of the material, while the tendency is slightly different due to the existence of the initial imperfection in the RVE-B; therefore, the {111} plane normal has a smaller angle of ~14° with the RD, when compared with the angle with the TD.

4.4. Effect of Heat Treatment and Initial Texture

Figure 10 plots the FLCs of the three alloys with the same f0 (=0.98) and rc (=20). It can be seen that the dependency of the FLC on the ageing treatment conditions is distinct along different loading paths. Towards the uniaxial tension condition (ρ = −0.5), the AR alloy has a major strain of 0.468, which is lower than those of the AA (0.477) and PA (0.478) alloys. For ρ = −0.3, the difference becomes negligible, while it becomes larger and reaches its maximum at the plane strain tension condition (ρ = 0), where the major strains for the AR, AA, and PA alloys are 0.231, 0.248, and 0.253, respectively. It is important to evaluate the case of plane strain tension, since, in the stamping of automotive panels, many failures occur at the strain paths near the plane strain mode. For this stretching mode, the forming limits are known to depend primarily on the work-hardening behavior, i.e., the higher the work-hardening rate of a material, the higher the forming limit [39]. Since the PA alloy exhibits a higher work-hardening rate than the other two alloys, as mentioned in Section 4.2, it has the highest forming limit strain in this loading condition. As ρ continues to increase to positive values, the difference becomes smaller again before ρ = 0.4. After that, the AR alloy has the highest forming limit, and the PA alloy has the lowest value. However, the difference between them is quite small. For the case of balanced biaxial tension (ρ = 1.0), the major strains for the AR, AA, and PA alloys are, respectively, 0.255, 0.252, and 0.249.
Figure 11 compares the FLCs of the AR alloy with the measured texture and a random texture with an imperfection factor of 0.98. The real texture yields a higher forming limit than a random texture for all of the loading paths considered in the model. The difference in the major strain is observed to be largest for the case of uniaxial tension (ρ = −0.5), and it decreases with ρ, reaching its minimum of 0.013 for the case of plane strain tension (ρ = 0), while it increases again as ρ increases to 1.0 (the case of balanced biaxial tension), with a value of 0.024. Considering that the examined AR alloy has a dominant cube texture component, this finding is consistent with the modeling results presented in [39], where a cubic texture component in rolled aluminum alloy sheets was found to yield forming limits much higher than those for a random texture in a biaxial stretch range based on the numerical analysis of the effects of the typical texture components, which are observed in rolled aluminum alloy sheets (i.e., copper, brass, S, cube, and Goss texture components), on the forming limit strains via the M–K approach combined with a Taylor-type polycrystal model.

5. Conclusions

In this study, a CPFE model was developed and combined with the M-K approach in order to analyze the effects of the ageing treatment on the mechanical properties and formability of the AA6061 aluminum alloy. Based on a series of experimental and numerical analyses, the main conclusions are drawn as follows:
(1)
The microstructures of the differently heat-treated alloys exhibit fully recrystallized equi-axis grain morphology, and the grain size of the PA and AA alloys is slightly higher than that of the AR alloy. When compared to the AR alloy, which has a dominant cubic texture component and S component, the texture of the PA and AA alloys is also slightly modified due to the solution heat treatment process.
(2)
Due to the different aging treatment processes, the AR alloy has the highest yield strength (290 MPa along the TD) and moderate elongation (0.152 along the DD), and the PA alloy shows a good ductility (0.21 along the RD and TD) with a low yield strength (149 MPa along the DD) and high work hardening. The AA alloy is in the mediate between the other two.
(3)
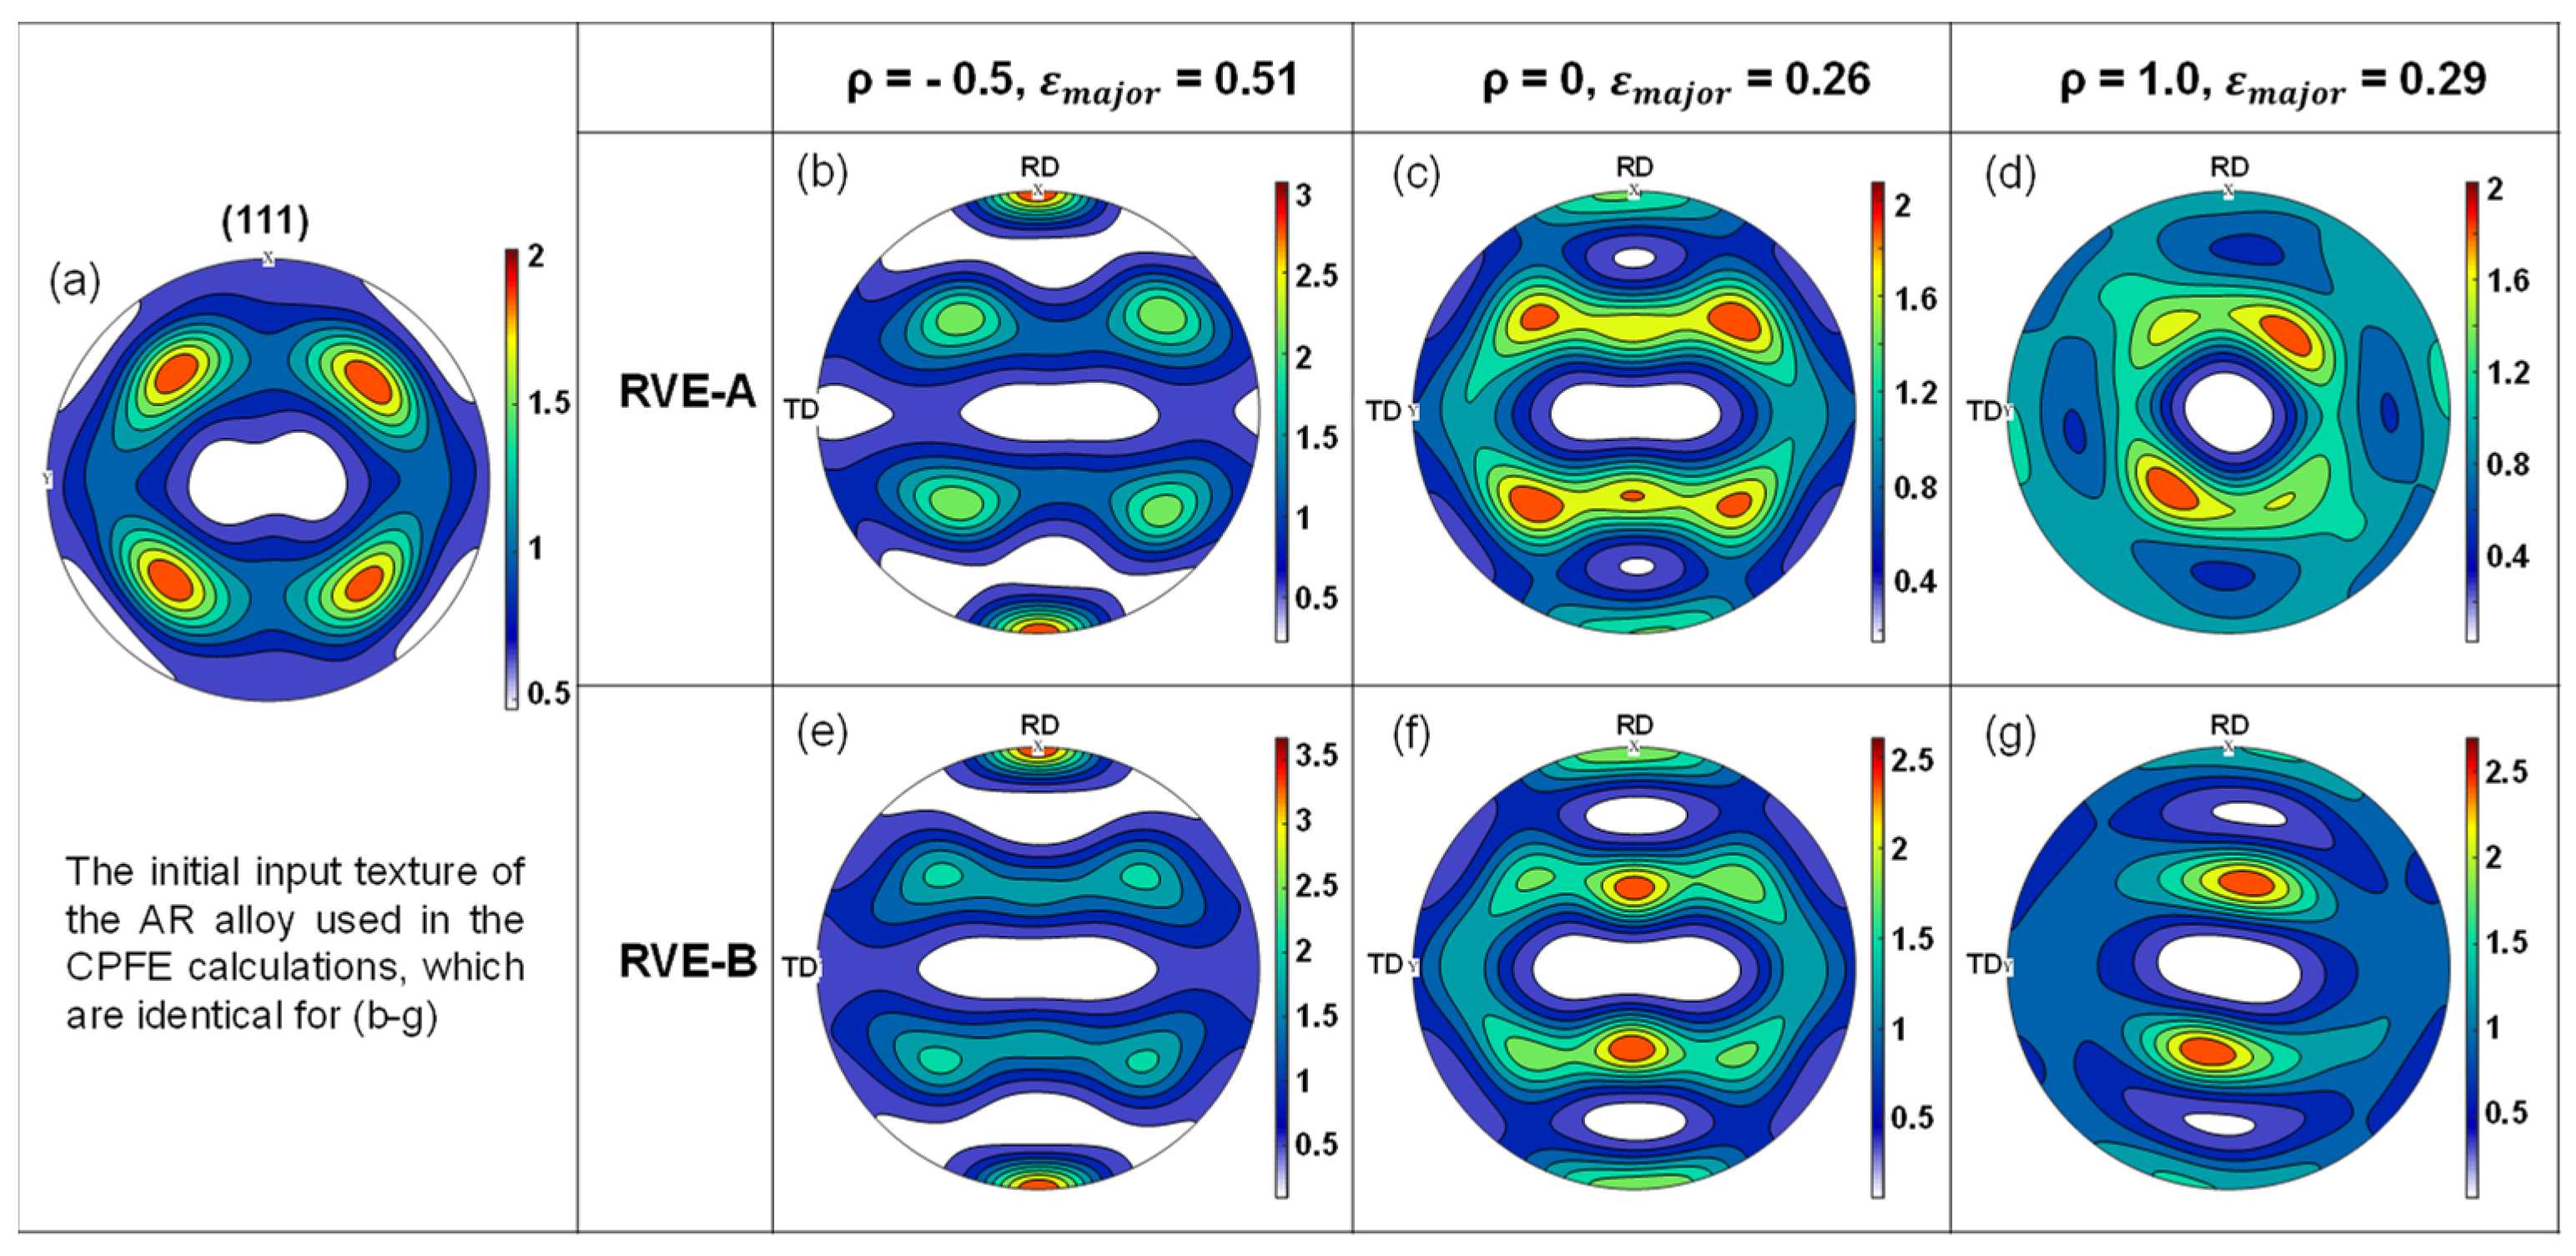
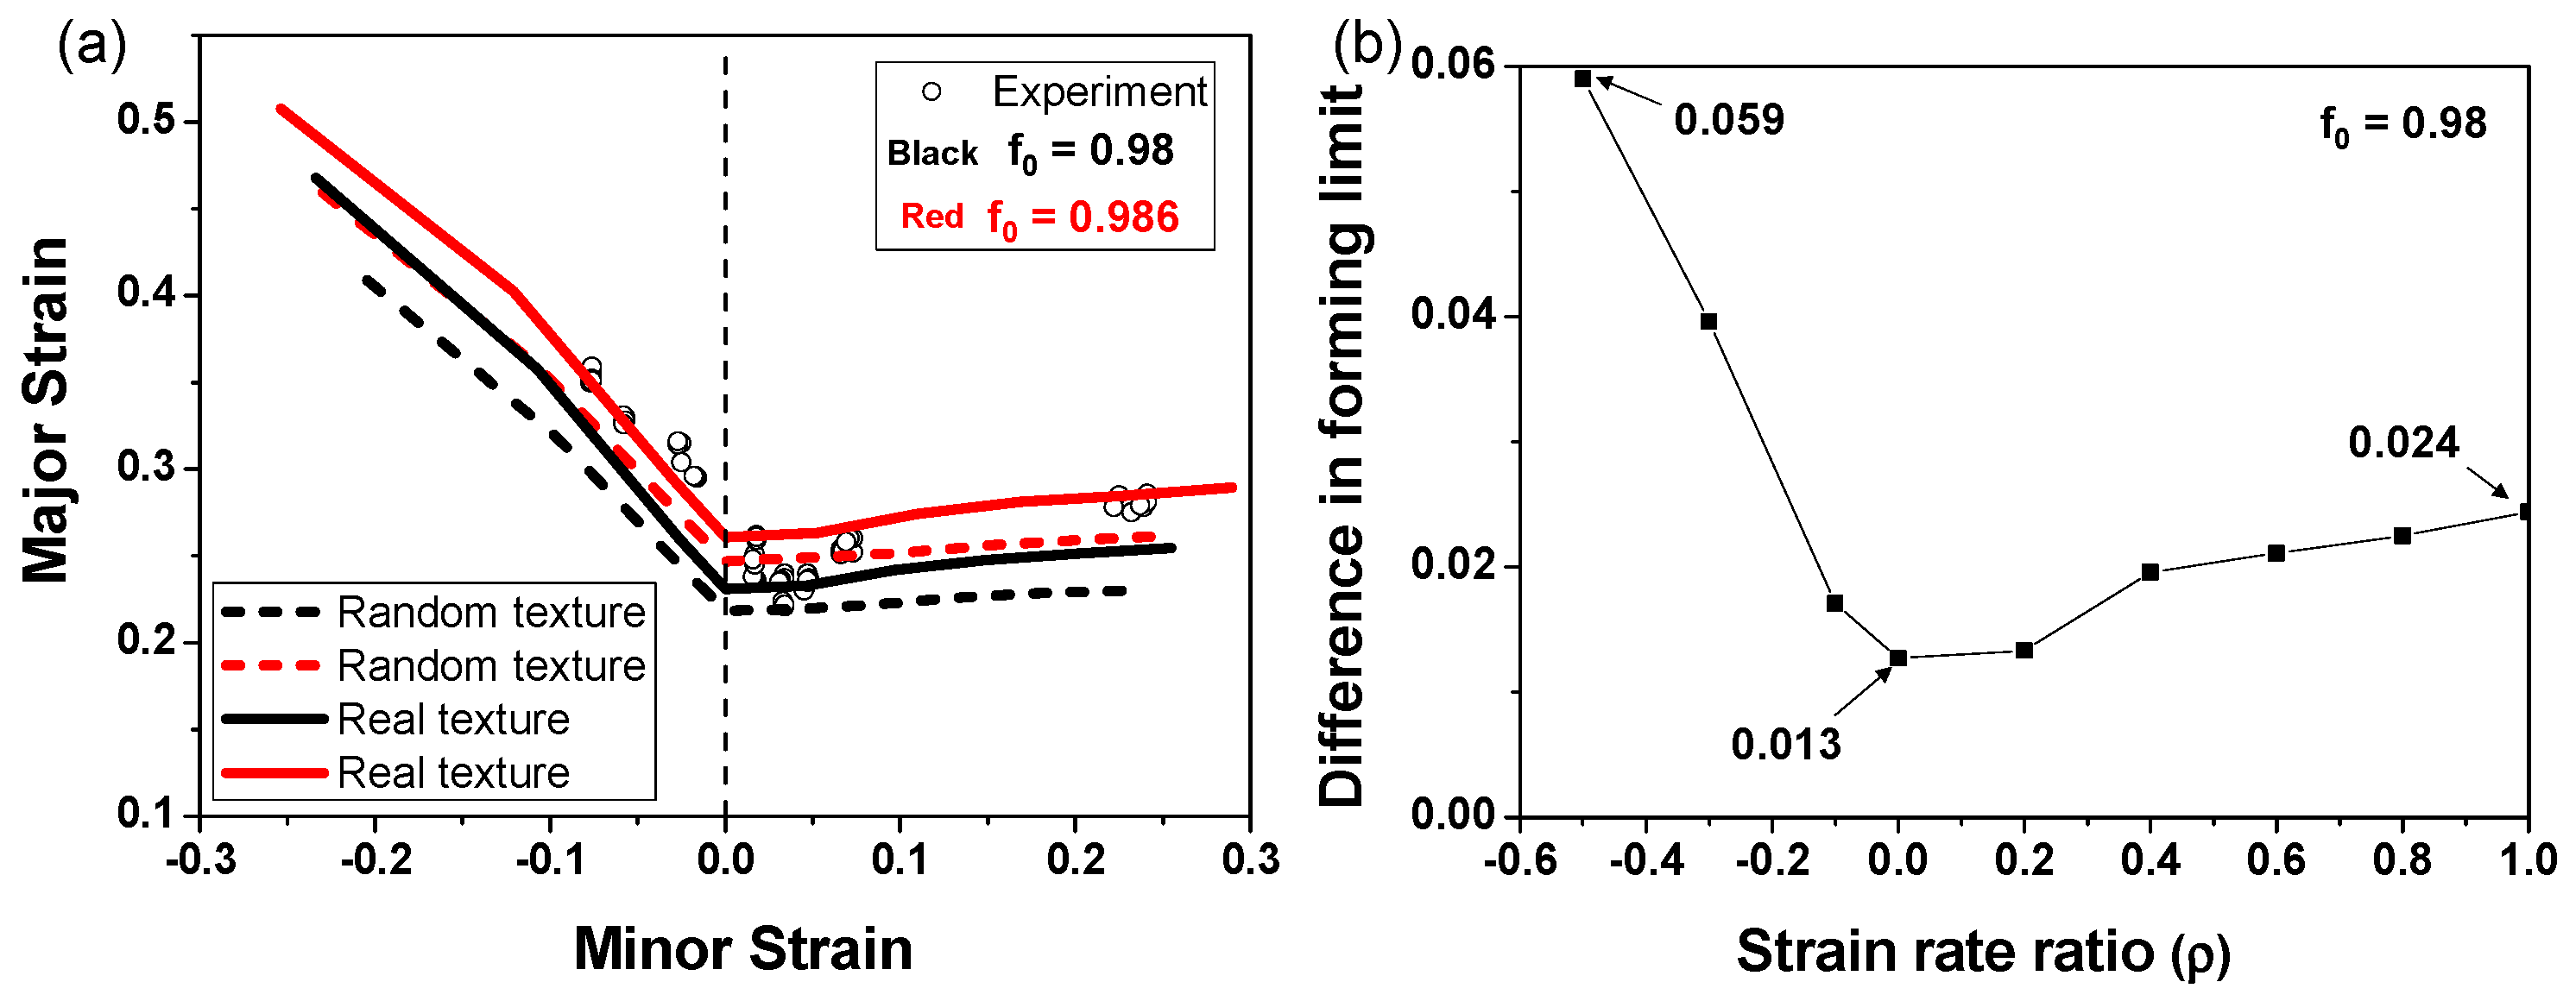
A CPFE model was successfully combined with the M-K approach, which can precisely predict the stress–strain behavior and the forming limits of the alloys using only a small set of modeling parameters. It is revealed that a slight change in the imperfection factor could lead to a large discrepancy in the predicted FLC of the material, and the deformed textures of the RVE-A and the RVE-B are similar in uniaxial tension and balanced biaxial tension, but are quite different in plane strain tension.
(4)
The ageing treatment effect on the FLC exhibits a clear dependency on the loading paths. The highest difference in the forming limit strain is observed to happen in the case of plane strain tension, where the PA alloy exhibits better formability than the other two, owing to its high work hardening. The random texture is found to yield lower forming limits than the real texture, which is dominated by the cubic texture component in the AR alloy.

Author Contributions

Conceptualization, H.W. and H.-W.L.; methodology, H.W.; software, H.W.; validation, H.-W.L., S.-H.K. and D.-K.K.; formal analysis, H.W.; investigation, H.W.; resources, H.-W.L.; data curation, H.W.; writing—original draft preparation, H.W.; writing—review and editing, H.-W.L., D.-K.K. and S.-H.K.; visualization, H.W.; supervision, H.-W.L.; funding acquisition, H.W. and H.-W.L. All authors have read and agreed to the published version of the manuscript.

Funding

This research was funded by the Technology Innovation Program (P0022331) funded by the Ministry of Trade, Industry and Energy (MOTIE, Republic of Korea), and the Natural Science Foundation of Shandong Province, China (No. ZR2022QE206).

Data Availability Statement

The raw data supporting the conclusions of this article will be made available by the authors on request.

Conflicts of Interest

The authors declare no conflicts of interest.

References

  1. Burger, G.B.; Gupta, A.K.; Jeffrey, P.W.; Lloyd, D.J. Microstructural Control of Aluminum Sheet Used in Automotive Applications. Mater. Charact. 1995, 35, 23–39. [Google Scholar] [CrossRef]
  2. Polmear, I.; StJohn, D.; Nie, J.-F.; Qian, M. (Eds.) 4—Wrought Aluminium Alloys. In Light Alloys, 5th ed.; Butterworth-Heinemann: Boston, MA, USA, 2017; pp. 157–263. ISBN 978-0-08-099431-4. [Google Scholar]
  3. Andersen, S.J.; Marioara, C.D.; Friis, J.; Wenner, S.; Holmestad, R. Precipitates in Aluminium Alloys. Adv. Phys. X 2018, 3, 1479984. [Google Scholar] [CrossRef]
  4. Robson, J.D.; Engler, O.; Sigli, C.; Deschamps, A.; Poole, W.J. Advances in Microstructural Understanding of Wrought Aluminum Alloys. Metall. Mater. Trans. A 2020, 51, 4377–4389. [Google Scholar] [CrossRef]
  5. Marioara, C.D.; Andersen, S.J.; Zandbergen, H.W.; Holmestad, R. The Influence of Alloy Composition on Precipitates of the Al-Mg-Si System. Metall. Mater. Trans. A 2005, 36, 691–702. [Google Scholar] [CrossRef]
  6. Liu, L.; Hou, Y.; Ye, T.; Zhang, L.; Huang, X.; Gong, Y.; Liu, C.; Wu, Y.; Duan, S. Effects of Aging Treatments on the Age Hardening Behavior and Microstructures in an Al-Mg-Si-Cu Alloy. Metals 2024, 14, 238. [Google Scholar] [CrossRef]
  7. Remøe, M.S.; Marthinsen, K.; Westermann, I.; Pedersen, K.; Røyset, J.; Marioara, C. The Effect of Alloying Elements on the Ductility of Al–Mg–Si Alloys. Mater. Sci. Eng. A 2017, 693, 60–72. [Google Scholar] [CrossRef]
  8. Zhu, S.; Shih, H.-C.; Cui, X.; Yu, C.-Y.; Ringer, S.P. Design of Solute Clustering during Thermomechanical Processing of AA6016 Al–Mg–Si Alloy. Acta Mater. 2021, 203, 116455. [Google Scholar] [CrossRef]
  9. Ozturk, F.; Sisman, A.; Toros, S.; Kilic, S.; Picu, R.C. Influence of Aging Treatment on Mechanical Properties of 6061 Aluminum Alloy. Mater. Des. 2010, 31, 972–975. [Google Scholar] [CrossRef]
  10. Engler, O.; Marioara, C.D.; Aruga, Y.; Kozuka, M.; Myhr, O.R. Effect of Natural Ageing or Pre-Ageing on the Evolution of Precipitate Structure and Strength during Age Hardening of Al–Mg–Si Alloy AA 6016. Mater. Sci. Eng. A 2019, 759, 520–529. [Google Scholar] [CrossRef]
  11. Birol, Y. Pre-Aging to Improve Bake Hardening in a Twin-Roll Cast Al–Mg–Si Alloy. Mater. Sci. Eng. A 2005, 391, 175–180. [Google Scholar] [CrossRef]
  12. Österreicher, J.A.; Nebeling, D.; Grabner, F.; Cerny, A.; Zickler, G.A.; Eriksson, J.; Wikström, G.; Suppan, W.; Schlögl, C.M. Secondary Ageing and Formability of an Al–Cu–Mg Alloy (2024) in W and under-Aged Tempers. Mater. Des. 2023, 226, 111634. [Google Scholar] [CrossRef]
  13. Wang, Y.; Zhao, H.; Chen, X.; Gault, B.; Brechet, Y.; Hutchinson, C. The Effect of Shearable Clusters and Precipitates on Dynamic Recovery of Al Alloys. Acta Mater. 2024, 265, 119643. [Google Scholar] [CrossRef]
  14. Zhong, H.; Rometsch, P.A.; Wu, X.; Cao, L.; Estrin, Y. Influence of Pre-Ageing on the Stretch Formability of Al–Mg–Si Automotive Sheet Alloys. Mater. Sci. Eng. A 2017, 697, 79–85. [Google Scholar] [CrossRef]
  15. Hodžić, E.; Domitner, J.; Thum, A.; Sabet, A.S.; Müllner, N.; Fragner, W.; Sommitsch, C. Influence of Natural Aging on the Formability of Al–Mg–Si Alloy Blanks. J. Manuf. Process. 2023, 94, 228–239. [Google Scholar] [CrossRef]
  16. Wang, X.; Guo, M.; Moliar, O.; Peng, W.; Xie, C.; Chen, J.; Wang, Y. Enhanced Grain Refinement and Texture Weakening in Al–Mg–Si Alloy through a Novel Thermomechanical Processing. J. Alloys Compd. 2022, 925, 166654. [Google Scholar] [CrossRef]
  17. Keeler, S.P.; Backofen, W.A. Plastic Instability and Fracture in Sheets Stretched over Rigid Punches. ASM Trans. Q. 1963, 56, 25–48. [Google Scholar]
  18. Goodwin, G.M. Application of Strain Analysis to Sheet Metal Forming Problems in the Press Shop; SAE International: Warrendale, PA, USA, 1968. [Google Scholar]
  19. Banabic, D.; Barlat, F.; Cazacu, O.; Kuwabara, T. Advances in Anisotropy of Plastic Behaviour and Formability of Sheet Metals. Int. J. Mater. Form. 2020, 13, 749–787. [Google Scholar] [CrossRef]
  20. Marciniak, Z.; Kuczyński, K. Limit Strains in the Processes of Stretch-Forming Sheet Metal. Int. J. Mech. Sci. 1967, 9, 609–620. [Google Scholar] [CrossRef]
  21. Yu, K.; Li, Q.; Wu, Y.; Guo, M.; Li, D.; Liu, C.; Zhuang, L.; Wu, P. An Improved Marciniak-Kuczynski Approach for Predicting Sheet Metal Formability. Int. J. Mech. Sci. 2022, 221, 107200. [Google Scholar] [CrossRef]
  22. Banabic, D.; Kami, A.; Comsa, D.-S.; Eyckens, P. Developments of the Marciniak-Kuczynski Model for Sheet Metal Formability: A Review. J. Mater. Process. Technol. 2021, 287, 116446. [Google Scholar] [CrossRef]
  23. Butuc, M.C.; Teodosiu, C.; Barlat, F.; Gracio, J.J. Analysis of Sheet Metal Formability through Isotropic and Kinematic Hardening Models. Eur. J. Mech.-A/Solids 2011, 30, 532–546. [Google Scholar] [CrossRef]
  24. Nagra, J.S.; Brahme, A.; Mishra, R.; Lebensohn, R.A.; Inal, K. An Efficient Full-Field Crystal Plasticity-Based M–K Framework to Study the Effect of 3D Microstructural Features on the Formability of Polycrystalline Materials. Model. Simul. Mater. Sci. Eng. 2018, 26, 075002. [Google Scholar] [CrossRef]
  25. Jeong, Y.; Pham, M.-S.; Iadicola, M.; Creuziger, A.; Foecke, T. Forming Limit Prediction Using a Self-Consistent Crystal Plasticity Framework: A Case Study for Body-Centered Cubic Materials. Model. Simul. Mater. Sci. Eng. 2016, 24, 055005. [Google Scholar] [CrossRef] [PubMed]
  26. Kim, J.H.; Lee, M.-G.; Kang, J.-H.; Oh, C.-S.; Barlat, F. Crystal Plasticity Finite Element Analysis of Ferritic Stainless Steel for Sheet Formability Prediction. Int. J. Plast. 2017, 93, 26–45. [Google Scholar] [CrossRef]
  27. Bong, H.J.; Lee, J. Crystal Plasticity Finite Element–Marciniak-Kuczynski Approach with Surface Roughening Effect in Predicting Formability of Ultra-Thin Ferritic Stainless Steel Sheets. Int. J. Mech. Sci. 2021, 191, 106066. [Google Scholar] [CrossRef]
  28. Tran, M.T.; Wang, H.; Lee, H.W.; Kim, D.-K. Crystal Plasticity Finite Element Analysis of Size Effect on the Formability of Ultra-Thin Ferritic Stainless Steel Sheet for Fuel Cell Bipolar Plate. Int. J. Plast. 2022, 154, 103298. [Google Scholar] [CrossRef]
  29. Li, Z.; Zhou, G.; Li, D.; Jain, M.K.; Peng, Y.; Wu, P. Forming Limits of Magnesium Alloy AZ31B Sheet at Elevated Temperatures. Int. J. Plast. 2020, 135, 102822. [Google Scholar] [CrossRef]
  30. Signorelli, J.W.; Bertinetti, M.A.; Roatta, A. A Review of Recent Investigations Using the Marciniak-Kuczynski Technique in Conjunction with Crystal Plasticity Models. J. Mater. Process. Technol. 2021, 287, 116517. [Google Scholar] [CrossRef]
  31. Rice, J.R. Inelastic Constitutive Relations for Solids: An Internal-Variable Theory and Its Application to Metal Plasticity. J. Mech. Phys. Solids 1971, 19, 433–455. [Google Scholar] [CrossRef]
  32. Peirce, D.; Asaro, R.J.; Needleman, A. Material Rate Dependence and Localized Deformation in Crystalline Solids. Acta Metall. 1983, 31, 1951–1976. [Google Scholar] [CrossRef]
  33. ASTM E8/E8M-16a; Standard Test Methods for Tension Testing of Metallic Materials. ASTM International: West Conshohocken, PA, USA, 2016.
  34. ISO/DIS 12004-2:2008; Metallic Materials—Sheet and Strip—Determination of Forming Limit Curves—Part 2: Determination of Forming Limit Curves in the Laboratory. International Organization for Standardization: Geneva, Switzerland, 2008.
  35. Brown, S.; Kim, K.; Anand, L. An Internal Variable Constitutive Model for Hot Working of Metals. Int. J. Plast. 1989, 5, 95–130. [Google Scholar] [CrossRef]
  36. Khadyko, M.; Myhr, O.R.; Hopperstad, O.S. Work Hardening and Plastic Anisotropy of Naturally and Artificially Aged Aluminium Alloy AA6063. Mech. Mater. 2019, 136, 103069. [Google Scholar] [CrossRef]
  37. Mecking, H.; Kocks, U.F. Kinetics of Flow and Strain-Hardening. Acta Metall. 1981, 29, 1865–1875. [Google Scholar] [CrossRef]
  38. Hu, P.; Liu, Y.; Zhu, Y.; Ying, L. Crystal Plasticity Extended Models Based on Thermal Mechanism and Damage Functions: Application to Multiscale Modeling of Aluminum Alloy Tensile Behavior. Int. J. Plast. 2016, 86, 1–25. [Google Scholar] [CrossRef]
  39. Yoshida, K.; Ishizaka, T.; Kuroda, M.; Ikawa, S. The Effects of Texture on Formability of Aluminum Alloy Sheets. Acta Mater. 2007, 55, 4499–4506. [Google Scholar] [CrossRef]
Figure 1. (ac) A schematic of the ageing treatment schemes and (d) the dimension and orientation of the tensile test specimens.
Metals 14 00503 g001
Figure 2. (a) experimental set-up and (b,c) sample geometries for the measurement of the FLC.
Metals 14 00503 g002
Figure 3. (a) schematic illustration of the M-K approach, (b) the FE mesh of the RVE model used in the finite element analysis, and (c) the initial texture of the AR alloy represented by the Euler angles.
Metals 14 00503 g003
Figure 4. Initial inverse pole figure and grain boundary maps of the differently age-treated alloys. (a) AR (b) AA (c) PA.
Metals 14 00503 g004
Figure 5. Initial crystallographic textures of the differently age-treated alloys. (a) AR (b) AA (c) PA.
Metals 14 00503 g005
Figure 6. Engineering stress–strain curves along different in-plane loading directions.
Metals 14 00503 g006
Figure 7. Comparison of the predicted stress–strain curves with the experimental ones. (a) AR (RD) (b) AR (DD) (c) AR (TD) (d) AA (RD) (e) AA (DD) (f) AA (TD) (g) PA (RD) (h) PA (DD) (i) PA (TD).
Metals 14 00503 g007
Figure 8. (a) comparison of the predicted FLDs with the experimental results, and (b) the effect of the critical strain rate ratio on the FLD.
Metals 14 00503 g008
Figure 9. Deformed textures at the forming limit along three typical loading paths. (a) initial texture (b) RVE-A (ρ = −0.5) (c) RVE-A (ρ = 0) (d) RVE-A (ρ = 1.0) (e) RVE-B (ρ = −0.5) (f) RVE-B (ρ = 0) (g) RVE-B (ρ = 1.0).
Metals 14 00503 g009
Figure 10. The effect of the heat treatment on the FLDs of the AA6061 aluminum alloy.
Metals 14 00503 g010
Figure 11. Effect of random and real textures on the FLC of the AR alloy. (a) comparison with experimental results (b) difference in the predicted FLC as a function of strain rate ratio.
Metals 14 00503 g011
Table 1. Anisotropic mechanical properties of the studied materials (unit of YS and UTS: MPa).
ARAAPA
YSUTS ε f YSUTS ε f YSUTS ε f
RD2853830.152333450.1451152980.207
DD2773760.1522373590.161493320.197
TD2903860.1372443620.1521393250.21
Table 2. Calibrated hardening parameters for the {111}<110> slip system of the alloys.
h 0 (MPa) τ c α (MPa) τ s (MPa) a q
AR15001151992.61.4
AA1000981852.11.4
PA1400501502.41.4
Disclaimer/Publisher’s Note: The statements, opinions and data contained in all publications are solely those of the individual author(s) and contributor(s) and not of MDPI and/or the editor(s). MDPI and/or the editor(s) disclaim responsibility for any injury to people or property resulting from any ideas, methods, instructions or products referred to in the content.

