Review

Review of In Situ Detection and Ex Situ Characterization of Porosity in Laser Powder Bed Fusion Metal Additive Manufacturing

1
Department of Industrial Engineering, J.B. Speed School of Engineering, University of Louisville, Louisville, KY 40292, USA
2
Bayburt University, Bayburt 69000, Turkey
*
Author to whom correspondence should be addressed.
Metals 2024, 14(6), 669; https://doi.org/10.3390/met14060669
Submission received: 26 April 2024 / Revised: 31 May 2024 / Accepted: 3 June 2024 / Published: 5 June 2024
(This article belongs to the Special Issue Advances in Additive Manufacturing Technology of Metals and Alloys)

Abstract

:
Over the past decade, significant research has focused on detecting abnormalities in metal laser powder bed fusion (L-PBF) additive manufacturing. Effective online monitoring systems are crucial for enhancing process stability, repeatability, and the quality of final components. Therefore, the development of in situ detection mechanisms has become essential for metal L-PBF systems, making efficient closed-loop control strategies to adjust process parameters in real time vital. This paper presents an overview of current in situ monitoring systems used in metal L-PBF, complemented by ex situ characterizations. It discusses in situ techniques employed in L-PBF and evaluates the applicability of commercial systems. The review covers optical, thermal, acoustic, and X-ray in situ methods, along with destructive and non-destructive ex situ methods like optical, Archimedes, and X-ray characterization techniques. Each technique is analyzed based on the sensor used for defect detection and the type or size of defects. Optical in situ monitoring primarily identifies large defects from powder bed abnormalities, while thermal methods detect defects as small as 100 µm and keyholes. Thermal in situ detection techniques are notable for their applicability to commercial devices and efficacy in detecting subsurface defects. Computed tomography scanning excels in locating porosity in 3D space with high accuracy. This study also explores the advantages of multi-sensor in situ techniques, such as combining optical and thermal sensors, and concludes by addressing current research needs and potential applications of multi-sensor systems.

1. Introduction

Among the various metal additive manufacturing (AM) technologies, laser powder bed fusion (L-PBF) is the most widely adopted process for fabricating fully functional components. In the metal L-PBF process, a powder layer is selectively melted and solidified by a laser heat source, and this procedure is repeated layer-by-layer to build the three-dimensional object [1]. The final product remains within the bed of powder, which must be removed. Typically, parts are retained within the powder bed to reduce thermal stresses and maintain specified dimensions [2]. L-PBF is commonly employed in industry for low-volume manufacturing and prototyping. This technique offers the ability to reduce mass through the utilization of lattice structures [3] and/or via topology optimization. Moreover, manufacturing steps can be streamlined by fabricating assembled parts. In the L-PBF process, the powder is spread atop the build plate in layers, and the laser selectively melts specific sections. This process is iterated for each layer. However, the complex interactions between the laser, powder, and melt pool during laser–material interaction sometimes lead to defects in the final product [2,4,5]. The lifecycle of parts remains a major concern due to the formation of defects during or after the fabrication process. Due to the highly dynamic and complex physical phenomena related to the process, the technology still suffers from a lack of quality, stability, and repeatability. During the printing process, the input laser energy is fixed, with constant laser power and scanning speed. However, the complex dynamics of the melt pool, spatters, vapor plume, and powder entrainment strongly influence the absorbed energy of the system, and heat conduction varies depending on the local part geometry [6]. Numerous studies have investigated the effects of process parameters on porosity and defect formation in L-PBF. Common defects include balling, lack of fusion (LOF), keyholes, and spatters, with processing-related defects playing a crucial role in the occurrence of these abnormalities.
The powder spreading stage represents the initial phase of fabrication processes. Irregular distribution of powder during the spreading stage often leads to defects owing to change the interaction between the laser and powder particles [2,7], thereby augmenting the level of porosity and other imperfections [8,9,10]. Various issues related to the powder bed have been elucidated by researchers, encompassing diverse phenomena such as recoater hopping and streaking, debris accumulation, part elevation, and incomplete spreading [2,11]. Additionally, the size and shape of the powder particles significantly influence the distribution within the powder bed. A comprehensive examination of the effects of the recoater mechanism, as well as the size and packing density of the powder, can be found in the literature [2,12,13,14,15,16].
Balling refers to the height fluctuation along the melted region. It is highly correlated with power, velocity, laser spot size, and the material’s laser absorptivity. Several different process parameters can lead to balling [2,17,18,19,20]. Balling is considered one of the potential sources of porosity and limits the build rate of L-PBF at higher powers due to issues of accordance.
Another common defect in metal L-PBF is LOF, characterized by irregular unmelted particles or sections inside the fabricated sample [21,22,23,24]. LOF may occur when there is not enough overlap between melt pools [22,24,25]. Another common reason for its occurrence is inadequate laser energy density [2,21,26,27]. The shape and size of the melt pool also affect LOF [2,24]. Additionally, powder quality plays a role in LOF defects [2,28,29,30].
Keyhole porosity occurs during keyhole melting when the material vaporizes and becomes trapped inside the molten area [2,31,32,33]. This phenomenon is highly correlated with processing parameters. It is important to note that not all instances of keyhole melting result in porosity. The formation mechanism of the keyhole is illustrated in Figure 1. Keyhole porosity has been extensively investigated in the literature under various material and processing conditions. Researchers have studied its formation mechanisms, the influence of different laser parameters (such as power, speed, and beam quality), powder characteristics, and environmental factors on the occurrence and characteristics of keyhole porosities [2,22,27,28,34,35,36,37,38]. These studies aim to improve the understanding of keyhole porosity formation and develop strategies to minimize or eliminate its occurrence in laser-based additive manufacturing processes.
Spatter can be described as the ejection of droplets from the melt pool, which can cause undesirable irregularities leading to porosity and/or LOF [2]. In-depth studies on the mechanics underlying spatter generation and its connection to faults have been published in the literature. They have investigated the formation of spatter during the laser melting process, taking into account the effects of variables including laser power, scanning speed, powder properties, and ambient circumstances. Furthermore, studies have looked at how spatter impacts the manufactured components’ quality and how it contributes to the development of flaws such as porosity and LOF [23,29,30,40,41,42,43].
The aforementioned defects impact both the fabricability of the sample and its overall fatigue performance. Defects formed within the sample significantly reduce the mechanical properties of the final part, as these defects often serve as crack initiation points. Therefore, the fabrication of defect-free samples is critical. Under constantly changing boundary conditions, melt pool fluctuations can occur, potentially resulting in porosity defects due to a LOF or keyhole porosity, which deteriorate the mechanical properties of the fabricated part. Consequently, an efficient closed-loop control strategy for adjusting process parameters on-the-fly is crucial in the metal L-PBF process. High-frequency melt pool signatures during the scanning process, such as optical, thermal, and acoustic signals, are important factors reflecting not only the current state of the melt pool but also the overall build. These signatures provide essential feedback to adjust the laser parameters accordingly to maintain the ideal processing regime. However, the lack of confidence in monitoring signals indicating the current state of the melt pool remains a primary challenge in melt pool control. Therefore, an efficient and accurate online monitoring system is vital for improving process stability, repeatability, and the quality of the final printed components. In situ monitoring of the process is a key strategy for identifying and resolving defects in advance, a topic extensively studied by researchers.

2. Porosity/Defect Detection

2.1. In Situ Porosity Measurement

Despite extensive optimization of L-PBF, pore formation in this process is based on stochastic factors, e.g., spattering. Therefore, online monitoring of the process is essential, especially for on-the-fly parameter correction and optimization. Several techniques have been developed during the past few years to give this capability to manufacturers. These approaches may be different depending on the process, material properties, defect type, data type, available equipment, project budget, etc., and are discussed in the following sub-sections.
Grasso and Colosimo [7] and Grasso et al. [44] elucidated the in situ monitoring of powder bed fusion (PBF) samples, wherein the authors explicated and demonstrated levels of in situ monitoring systems tailored for PBF processes. Level 1 is characterized by the monitoring of irregularities in the powder bed, which may result in porosity and/or insufficient fusion [44,45,46,47,48]. The subsequent level is defined as the measurement of quantities with higher temporal resolutions, encompassing the observation of the interaction between the beam and material, the thermal history of the process, and the examination of by-products such as spatters and plume emissions [49,50,51]. Moving to Level 3, the focus shifts to observing the melt pool, a pivotal aspect for achieving local fusion of the material within the PBF process [52,53]. The final level involves the collection of information pertaining to phenomena occurring in the current layer. This includes employing techniques such as X-ray imaging, ultrasound, and the monitoring of acoustic emissions caused by elastic energy and plastic deformations in the solidified material [54,55,56]. While the aforementioned approaches are specific to PBF, many of these techniques are also applicable to metal L-PBF. These techniques can be categorized into optical, thermal, acoustic, and X-ray-based in situ monitoring methods, as illustrated in Figure 2.

2.1.1. Optical-Based Techniques

In the sub-field of monitoring in L-PBF, the optical and/or thermal signatures of the melt pool and the acoustic signatures have been by far the most commonly monitored objects. Optical signatures such as infrared, ultraviolet emission, and visible light emitted from the melt pool have been captured and analyzed in a time/spatial domain to derive the fluctuations in the melt pool dimensions and temperature [57,58,59,60,61] and to estimate the cooling dynamics and temperature gradient [62,63]. One of the disadvantages of the optical approach is that only the surface of the melt pool or layer can be directly analyzed, and sub-surface phenomena such as the melt pool depth and defects such as cracks and porosity remain unresolved. Recent use of in situ X-ray radiography has visualized just how unstable sub-surface phenomena (melt pool depth, vapor depression depth, pore formation, cracking) are [5,64]. While such advanced characterization techniques are highly valuable to increase our understanding of process–material interactions, they are not suitable for commercial monitoring and control systems. To overcome the line-of-sight limitation while utilizing economical L-PBF monitoring equipment, Goossens and Van Hooreweder [57] developed a virtual sensing approach combining high-speed (HS) co-axial melt pool width monitoring with an analytical thermal simulation to simultaneously capture the melt pool width and predict the melt pool depth. Even then, this virtual sensing approach is still unable to detect sub-surface defects such as porosity and cracks. To successfully deploy optical-based melt pool monitoring, the entire optical train of the AM system needs to be modified to dynamically track the melt pool rather than focusing on a fixed field of view on the powder bed. In addition, depending on the processing zones, the accuracy of the monitored data is heavily affected by the noise caused by hot spatter ejection, plasma formation, and laser attenuation. From the melt pool monitoring point of view, the ejected hot spatter is usually considered to be noise and is eliminated or filtered out [58]. However, hot spatter signatures such as size, ejection angle, and ejection speed have been proven to have a strong correlation to energy density [57], melt pool depth [65,66,67], and the quality of the built part [68]. The AM research group at KU Leuven has utilized the same co-axial camera setup as in [57] for spatter detection. However, due to the co-axial setup, the ejection angle of the spatters with respect to the build plate plane remains unresolved. Hence, an off-axis setup for the acquisition of the ejection angle is necessary. In situ monitoring of the hot spatter signature such as velocity, angle, and size will significantly add to the accuracy of the prediction of the current melt pool state and the current processing regime. However, plasma and vapor plume formation and laser attenuation remain the main sources of noise affecting the accuracy of the optical-based monitoring data.
Montazeri et al. [69] employed multispectral photodiode sensors that were previously developed and enhanced [70,71,72]. The method involved two photodiode sensors collecting the same data with different bandpass filters, specifically at 530 and 520 nm (Figure 3). One sensor was utilized for continuum signal measurement, while the other captures line signals. The ratio of line to continuum signals was employed to mitigate the magnitude changes in signals based on location. By monitoring emissions specific to chromium (Cr I) around 520 nm, this study posited that these emissions serve as meaningful indicators of defects in components manufactured through powder bed fusion [70]. Montazeri et al. [69] utilized various machine learning (ML) techniques, comparing them to identify porosities using post-CT data as the ground truth. Instead of employing machine learning on raw data, Fourier transform coefficients were used to analyze the dataset. It was noted that this technique resulted in a 10% improvement in classification accuracy in less than 0.5 s. However, the technique is still in the development stage and is effective only with specific materials and simple geometries. The specific emissions identified may be related to defect generation in Cr-related alloys, particularly IN718. Other materials warrant further investigation.
Scholars have adopted an alternative approach by capturing optical images during intervals between melting stages, instead of continuously imaging the melt pool. Imani et al. [73] employed varied lighting settings and captured images both pre- and post-powder-coating through the utilization of a DSLR camera. Various machine learning techniques were employed to analyze the acquired data, leading to the determination that the support vector machine yielded promising results with a feature recognition rate of up to 90%. The study acknowledged the limitation of the camera resolution in directly identifying pores and suggested combining data from multiple sensors for better defect detection.
Bartlett et al. [74] employed a novel methodology, employing in situ three-dimensional digital image correlation (3D-DIC), to discern and quantify irregularities within the powder bed during the processing stage (Figure 4). The quantified data from 3D-DIC, coupled with the ex situ identification of physical defects, were incorporated into a Naïve-Bayes classification algorithm. This algorithm was utilized to predict the probability of defect formation based on errors within the powder bed. To validate the accuracy of defect localization, scanning electron microscopy (SEM) was employed. The researchers achieved a detection accuracy of at least 66%. However, their system operated on a binary outcome, categorizing defects as either detected or not detected. Furthermore, the detectable defect size was established to be 250 microns and above, corresponding to defects associated with LOF.
Lough et al. [75] employed in situ optical emission spectroscopy (OES) measurements to scrutinize the impact of laser power and the ambient atmosphere within the build chamber on signals generated during the selective laser melting (SLM) process. This investigative approach aligns with the methodology adopted by Montazeri et al. [69]. The observed correlation between the intensity of chromium emission and the size of the melt pool suggests the potential utility of OES in qualifying and controlling SLM parts. The outcomes of this investigation revealed that the optical emission signals exhibited sensitivity to variations in the build chamber atmosphere, both in terms of type and pressure. Specifically, elevated pressures yielded heightened signal intensities, whereas reduced pressures constrained the measurement capability.
Snow et al. [76] accumulated a series of high-resolution images using a DSLR camera before and after recoating. Various lighting conditions (frontal, lateral, and top illumination) were applied to capture diverse images. Within the study, XCT was utilized as a benchmark, and two distinct machine learning methods were implemented. Convolutional neural networks (CNNs) notably outperformed neural networks (NNs) in detecting flaws in layerwise images of additive manufacturing builds.
Snow et al. [77] expanded their investigation by integrating additional sensors such as melt pool photodiodes and Commanded Machine Vectors (representing the XY position of the laser, commanded laser power, scan speed, hatch spacing, and layer height) to correlate with the images. This inclusion of extra sensors escalated their flaw detection accuracy from approximately 93.5% to 98.9%. However, both studies were confined to a singular geometry and only capable of detecting flaws exceeding 200 microns. Moreover, the machine necessitated pauses between layers for image collection, consequently elongating the overall fabrication time. Their anticipated future directions are outlined in Figure 5.

2.1.2. Temperature-Based Techniques

Pyrometers and cameras are commonly selected in the context of additive manufacturing processes due to their capacity to facilitate real-time monitoring of the melt pool profile. This preference arises from the inherent advantage of these instruments, which enable direct observation of the evolving melt pool dynamics without necessitating a suspension of the operational workflow for hardware modifications. This approach underscores the importance of seamless and continuous observation to glean valuable insights into the thermal behavior of the additive manufacturing process. Forien et al. [52] introduced a probabilistic link between pore creation and pyrometer signals, enabling the prediction of keyhole pore formation. Additionally, the study identified unique pyrometer signal distributions at different energy densities, offering a means to discern the L-PBF process operating mode and predict defect formation. Pyrometer data were collected with a mirror position of the laser, achieving a spatiotemporal accuracy of 10 microns similar to other studies [78,79] (Figure 6). In addition to pyrometers, a high-speed camera was employed with a sampling rate of 1000 Hz to capture the dimensions of the melt pool. Subsequently, single-track fabrications were scanned using X-ray techniques to identify porosities. A high correlation was observed between pyrometer signals and the presence of pores. However, the study did not extend to detect the keyhole porosities. Furthermore, the utilization of single-track fabrications implies that samples with multiple tracks would introduce increased complexity in establishing correlations with pyrometer data and keyhole porosities.
Similar to Forien et al. [52], Lough et al. [81] employed a Short Wave Infrared (SWIR) camera with a frame rate of 2585 Hz to systematically capture spatiotemporal melt pool emission data layer-by-layer. Two distinct geometries were fabricated: one exhibiting a simple structure and the other a complex configuration. Micro CT post-processing techniques were applied to delineate the actual porosities arising from varying process parameters. Rather than delineating precise porosity values, the researchers generated a porosity probability map using thermal data in conjunction with CT results. Remarkably, they achieved approximately 94% accuracy in predicting porosity within the internal regions of the complex sample. However, this accuracy diminished to 81% for supported regions and further declined to 69% for overhang regions. The reduction in accuracy was attributed to the geometric dependency of the prediction. Furthermore, the accuracy of the utilized system, which collected data in arbitrary units, was compromised by its calibration based on the assumption of constant emissivity, and the oversight of neglecting phase and temperature dependency. These factors have implications for the generalizability of the technique.
Smoqi et al. [80] employed a dual-wavelength pyrometer to detect porosity and assess its intensity. They fabricated a single sample with varying parameters at different levels and utilized XCT scans as the ground truth for their experiments. The dual-wavelength pyrometer was utilized to account for changes in thermal emissivity. This was achieved by measuring radiation intensity at two different wavelengths, allowing for the estimation of the temperature of the object. In comparison to temperature measurements obtained using an infrared thermal camera or a single-wavelength pyrometer, the dual-wavelength imaging pyrometer used in this study provided a temperature measurement closer to the absolute melt pool temperature [80]. Various machine learning techniques were applied, including logistic regression (LR), support vector machine (SVM), K-nearest neighbors (KNNs), and convolutional neural network (CNN). Among these techniques, KNN yielded favorable results compared to others, demonstrating a 95% confidence level. The schematic representation of the workflow is depicted in Figure 7.
Yavari et al. [82] employed a digital twin strategy, amalgamating physics-based modeling and data integration, to identify flaws in parts produced through L-PBF. This approach utilized a combination of theoretical predictions and in situ process signatures connected through data analytics and machine learning algorithms. The authors employed a graph-theoretic computational heat transfer approach, demonstrating a tenfold acceleration in temperature distribution calculations compared to Finite Element (FE) analysis [50,83,84,85,86]. Three photodiodes were utilized, two of which incorporated band-pass filters (650–700 nm), while the third collected broadband energy emission (Figure 8). Similar to Smoqi et al. [80], the authors utilized the ratio of filtered wavelength data to mitigate the influence of thermal emissivity, which also exhibited correlation to melt pool temperature. X-ray Computed Tomography (XCT) was utilized as the ground truth, and planted defects with a diameter of 100 microns and above were detected using this methodology.
Moving on, Bartlett et al. [87] employed a long-wave infrared camera positioned atop the build chamber, providing a field of view measuring 250 by 250 mm. Relative temperature was utilized for the identification of irregularities. In their study, a validation system was implemented through destructive porosity analysis. Three random cross-sectional SEM images were utilized, and the collected data underwent image processing and reconstruction in 3D using Matlab R2017B. The application of full-field infrared thermography enabled the detection of LOF with 100% accuracy. However, the detection accuracy exhibited a 50% decline for defects below 50 microns.
Williams et al. [88] employed an infrared (IR) camera and a high-speed camera simultaneously to monitor the L-PBF fabrication process of stainless steel 316L. The primary focus of their study centered on the measurement of surface temperatures and their consequential impact on both porosity and microstructure. Lower temperatures were indicative of increased porosity, attributed to inadequate melting during the fabrication process. The high-speed camera was utilized to observe the size and shape of the melt pool, while inter-layer cooling time served as a metric for identifying irregularities. The correlation established by the researchers between the LOF porosities and changes in surface temperature was found to be associated with the formation of spatter. It is important to note that this methodology is only applicable to a particular experimental setup and material. Furthermore, variations in inter-layer cooling times, influenced by changes in build intensity, result in alterations to the distribution of surface heat. Consequently, the applicability of the technique is constrained.
Gaikwad et al. [89] employed a pyrometer and a high-speed camera operating at 1 kHz to observe a single track, as depicted in Figure 9. The pyrometer data, without temperature value conversion, were utilized, and the statistical features of the dataset were analyzed. Melt pool dimensions were collected from the high-speed camera. Various machine learning techniques were applied to analyze the dataset, with the Sequential Decision Analysis Neural Network (SeDANN) model outperforming other models such as support vector machines (SVMs), convolutional neural networks (CNNs), and artificial neural networks (ANNs). The width of the single track was utilized as a metric for defining defects, including keyholing, LOF, and balling. The models were employed to predict linear energy density and average single track width, which were then mapped to different process parameter defects. The technique leans more towards the machine learning aspect of defect detection.
Foster et al. [90] developed correlations between data acquired through in situ and ex situ characterization techniques and phenomenological models. These correlations offer insights into the comprehensive process flow and its impact on the evolution of defects, microstructures, and material properties. The authors employed an IR camera for in situ detection, yet the applied technique was constrained by its ability to identify potential irregularities in the constructed material. Optical methods were used for porosity measurements.
Mitchell et al. [91] utilized in situ two-color pyrometer data collected during the laser powder bed fusion (L-PBF) process of 316L stainless steel to predict the locations of potential pores. To achieve this, intentional cavities were incorporated into the CAD file to create a basis for establishing correlations between the CT-scanned data and the pyrometer dataset. The researchers employed advanced machine learning strategies and algorithms to analyze the gathered data. These algorithms were designed to identify and predict instantaneous anomalous conditions, which were hypothesized to be indicative of void formation during the L-PBF additive manufacturing process. The effectiveness of this method was demonstrated by its ability to successfully detect voids with a size of 120 microns or larger.
Gaikwad et al. [92] employed two high-speed cameras equipped with different bandpass filters in their study (Figure 10). In addition to these cameras, they utilized the wavelength intensity ratio, developed by Hooper [62], for estimating melt pool temperature. XCT and Archimedes methods were employed as nondestructive techniques for defect identification. The data were analyzed using multiple machine learning methods that incorporate melt pool morphology and temperature distribution. The correlation revealed the detection of LOF and keyhole porosities. In defect identification, practical, physics-informed process signatures in basic machine learning models, such as SVM and multilayer perceptrons (MLPs), demonstrated comparable success to sophisticated, black-box deep learning convolutional neural networks (CNNs). This approach achieved high true positive rates (>90%) and low false positive rates (<1%) for porosity detection, comparable to more complex deep learning models.

2.1.3. Acoustic-Based Techniques

Acoustic emission (AE) monitoring approaches for the L-PBF process stand out as an effective, cheap, and easy-to-install system which has recently started to gain attention from researchers in the field, and the reason is two-fold [93]. Firstly, they can capture the volumetric signatures of the process such as the formation of porosity, the formation and propagation of cracks, and keyhole vapor depression formation [93]. Secondly, compared to optical approaches that require hardware modification, the installation of an AE monitoring system is much simpler due to the three-dimensional nature of sound wave propagation [93]. AE monitoring systems have been used in laser welding for almost 30 years. Duley and Mao [94] found out that the formation of the keyhole would generate the frequency components in the 3–9 kHz range. Shevchik et al. [95] have notably leveraged the derivatives of shockwaves induced within the workpiece during welding to assess weld line quality. In the realm of acoustic emissions within the welding process, two distinct categories, structure-borne acoustic emission (SBAE) and air-borne acoustic emission (ABAE), play a pivotal role. Notably, SBAE possesses a broader frequency spectrum in comparison to ABAE, primarily due to the heightened damping observed in the air, as elucidated by [96]. While SBAE demonstrates great potential for laser welding, its industrial application is constrained by the challenge of reliably coupling the sensor to the workpiece, thereby sparking more extensive research into ABAE. This acoustic monitoring approach proves highly effective in laser welding, with ABAE serving as a valuable tool for evaluating process conditions associated with plasma formation, while SBAE excels in the assessment of internal defects such as penetration deficiencies or porosity. Rieder et al. [97] adopted a different approach by analyzing ultrasonic propagation during the welding process to qualitatively evaluate residual stress and predict porosity within printed parts. Despite its advantages in providing volumetric information and its simplicity, AE approaches confront considerable challenges arising from environmental noise, interference from the additive manufacturing system, and inherent process-generated noise. Consequently, the development of a robust and efficient signal processing algorithm is imperative to filter out these disturbances in real-time.
A recent study by Tempelmen et al. [98] achieved a complete integration of an acoustic system into the L-PBF process. Tempelmen et al. [98] harnessed the airborne acoustic method for the identification of keyhole porosity in L-PBF fabricated 316L samples. Their methodology involved positioning acoustic sensors approximately 25–30 cm above the base plate and utilizing CT scans as a ground truth identification method. The experimental process encompassed the controlled melting of single-layer patches of varying sizes, with a range of laser powers and scan velocities, guided by randomized settings on the build plate. To achieve precise spatiotemporal alignment of the acoustic data, simultaneous measurements of the scan head’s mirror locations were carefully executed. CT data served as the basis for training a SVM machine learning model, which proved instrumental in keyhole porosity detection. The SVM models emphasized the significance of features within the 20–50 kHz frequency range within the spectral data. These findings were underpinned by the dynamic interaction between the melt pool and vaporization plume during keyhole formation, giving rise to broad-band acoustic bursts within the 10–50 kHz range [98]. This discovery facilitated the utilization of frequency-based characteristics for the accurate prediction of pores. It is imperative to underscore that, despite the presence of melt pool conditions, porosity formation is not guaranteed, as multiple contributing factors are at play. To further augment the efficacy of this approach, the integration of additional acoustic signatures linked to various failure modes, such as balling and delamination, holds promise for further enhancement.

2.1.4. Synchrotron X-ray Imaging

X-ray imaging is utilized in various fields, from medical diagnostics to materials characterization, and as a means of non-destructive evaluation. Despite the challenges of accommodating X-ray systems to L-PBF systems, researchers have found ways to implement X-ray as an in situ system. Sinclair et al. [99] explored the impact of processing parameters on thin-wall components of Ti-6Al-4V manufactured through additive processes in multilayer builds. This investigation utilized in situ high-speed synchrotron X-ray imaging operating at a frequency of 40 kHz. The utilized systems are demonstrated in Figure 11. The authors established correlations between in situ X-ray images and ex situ micro CT measurements to delineate the underlying mechanisms responsible for pore formation. Notably, keyhole porosities at the 10- to 60-micron level were identified as part of the findings. It is crucial to highlight, however, that the scope of the study was confined to the observation of single-track melt pools.
Lhuissier et al. [54] designed a custom-built chamber for in situ three-dimensional (3D) imaging, as illustrated in Figure 12. Images of the built plate were captured both before and after the melting process, with a focus on single-track fabrication. The authors effectively identified and characterized LOF defects, demonstrating both partial and complete healing of these defects. The study asserted the showcasing of self-healing within the AM process through inter-layer imaging. However, it is noteworthy that the investigation did not delve further into elucidating the physics underlying defect formation. Instead, it primarily served as a proof of concept for the proposed technique.
Leung et al. [100] employed a laser additive manufacturing (LAM) process replicator capable of accommodating X-ray imaging to capture images of both virgin and oxidized powder. The authors verified that an excess of oxygen in the powder feedstock leads to the formation of defects in LAM. However, it is important to note that the study falls short of delivering a comprehensive analysis encompassing all potential mechanisms and conditions contributing to defect formation in laser additive manufacturing. Moreover, Soundarapandiyan et al. [101] conducted a study employing a Ti64 alloy to investigate the effects of oxidation through high-speed X-ray imaging. The results indicated that oxidized Ti64 powder exhibits lower porosity in cases with higher laser energy density (LED), attributed to a reduction in the laser absorptivity of the powder. It is asserted that the virgin build exhibits a higher prevalence of spherical porosities, similar in size to keyhole porosities. This phenomenon is attributed to increased laser absorption and turbulence within the melt pool during the virgin build process.
Schwerz et al. [102] investigated the in situ detectability of spatter redeposits, which are responsible for defect formation in L-PBF. The study compared the LOF defects identified through Optical Tomography (OT) in situ monitoring with those detected via X-ray. It was acknowledged in the study that the proposed in situ detection method utilizing OT exhibited a false discovery rate of 16%, attributed to the full incorporation of spatters into the bulk and erroneous detections at specimen edges. It is important to note that the study exclusively focused on the detection of LOF defects driven by spatter and did not delve into other potential defect types that may manifest in L-PBF components.

2.1.5. Multi-Sensor-Based Techniques

Researchers sometimes reach the limits of a single sensing mechanism. In such cases, a combination of multiple sensing mechanisms is employed. Recent studies have demonstrated improvements in defect detection. Wang et al. [103] employed simultaneous high-speed X-ray imaging and IR thermal imaging to establish correlations. Two filters were utilized in the high-speed IR camera: one for monitoring vapor at low temperatures and another for observing the melt pool at high temperatures. Additionally, a high-specialized IR camera was employed. The setup is depicted in Figure 13. The study posited that keyhole porosity demonstrated a greater correlation with laser power than with energy input. Furthermore, it was observed that vapor formation in the low-temperature IR camera and fringe patterns in the high-spatial camera were highly correlated with keyhole formation. Additionally, the dimensions of the melt pool were predicted using high-speed IR data, with X-ray data serving as the ground truth. However, it is essential to note that the paper predominantly focused on the phenomena of single spot melting and solidification. This emphasis may introduce limitations regarding the generalizability and applicability of the findings to traditional line scanning methods.
Mohr et al. [49] employed a mid-wave infrared camera and a near-infrared camera to monitor the L-PBF system. The mid-wave camera collected data at a rate of 900 Hz. Optical tomography was utilized to collect single-image data for each layer, with an extended exposure time. The system setup is depicted in Figure 14. Micro CT served as the ground truth for defects larger than 14 microns. Process variations were identified and correlated with LOF void clusters using the time-over-threshold (TOT) concept, employing non-calibrated thermography temperatures. This approach provided insights into the L-PBF system, offering a comprehensive understanding of defects and process variations.
Overall, in situ monitoring systems can complement each other when combined. Their respective advantages and limitations are summarized in Table 1. By integrating multiple monitoring systems, a more comprehensive assessment of the process can be achieved, leveraging the strengths of each system to mitigate their individual limitations.

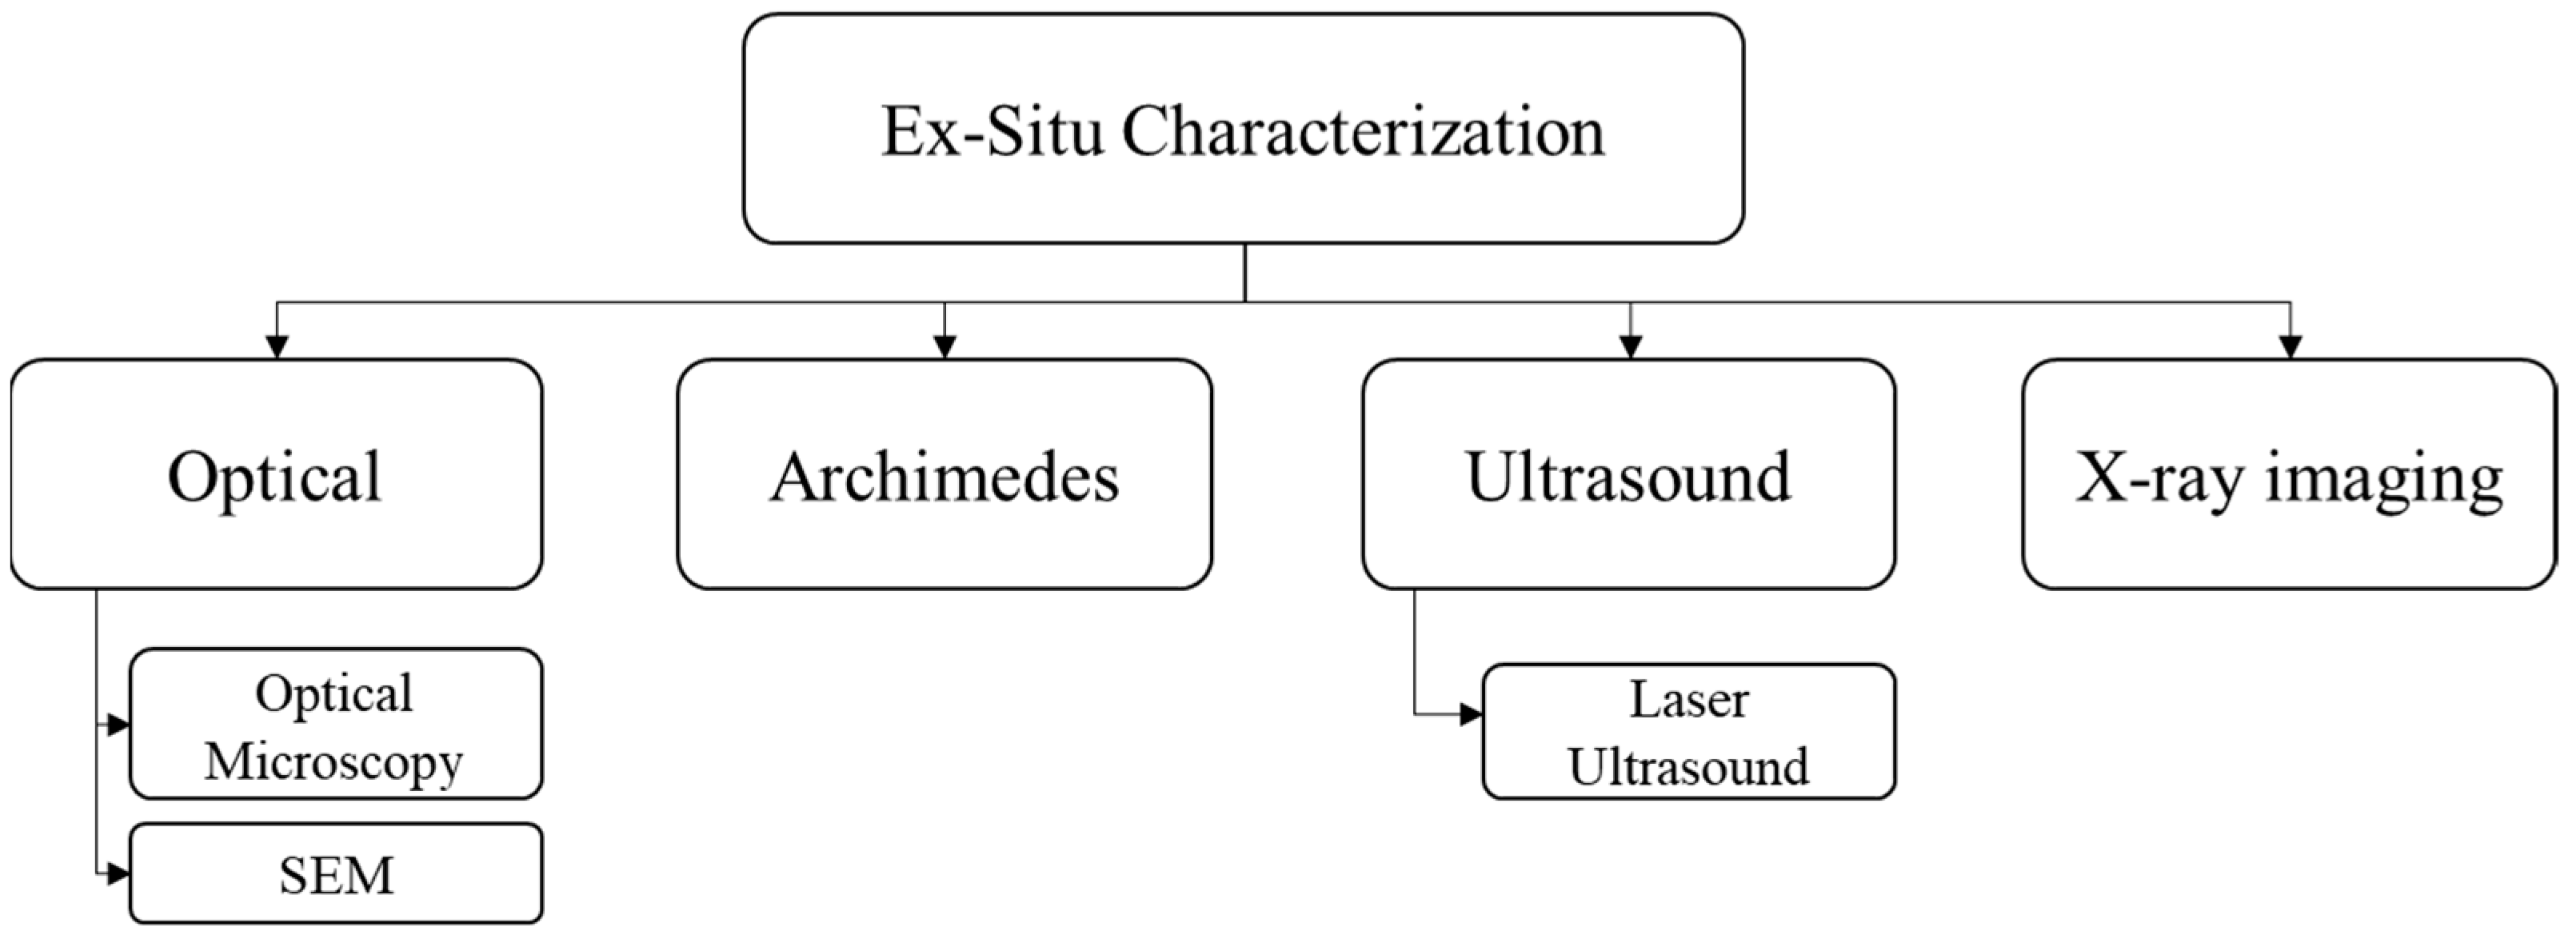
2.2. Ex Situ Porosity Measurement

The post-characterization of AM-fabricated samples has been subjected to thorough investigation, given the ease of application of conventional quality control measurements. Two primary methods are employed to identify porosities in L-PBF: destructive and non-destructive techniques. In destructive porosity measurements, coupons are harvested by slicing the sample. The harvested coupon is then ground and mirror-polished for imaging purposes. Optical microscopy and/or electron microscopy are common imaging techniques utilized in this context. This rigorous examination allows for a detailed analysis of porosities and provides valuable insights into the quality of the AM-fabricated components. A schematic representation of ex situ characterization methods capable of detecting porosities and defects in metal LPBF is illustrated in Figure 15.
Researchers have employed destructive techniques to characterize defects in additively manufactured metal specimens [74,87]. However, the application of these techniques has been confined to specific cross-sectional areas, with the assumption that the polished region accurately represents the entire sample. It is noteworthy that selected areas may exhibit no discernible defects while concealing numerous defects beneath the surface. In contrast, nondestructive testing offers the advantage of analyzing the sample without causing any damage. The Archimedes method, for instance, leverages changes in weight both in air and within a fluid medium. This phenomenon is employed for assessing irregularities or the overall density of the material. The method is facile to implement and does not necessitate costly equipment. Spierings et al. [104] applied the Archimedes method to estimate the density of additively manufactured metals. Their comparison of this method with X-ray analysis revealed a deviation of approximately up to 3% between X-ray density results and Archimedes estimations. Moreover, the Archimedes method has been utilized for measuring density of irregular shapes and geometries [92,105,106]. Even though it is easy to apply, it does not identify any porosity type or shape.
Several other non-destructive techniques are employed for the detection of defects in AM parts. Magnetic particle testing is one such method. In this approach, magnetic particles are evenly sprayed onto ferromagnetic materials to identify surface discontinuities [107,108]. However, it is imperative to note that this method is confined to ferromagnetic materials and exclusively identifies defects that are open to the surface, rendering it incapable of detecting internal defects. Similarly, dye penetrant testing is another method utilized for the identification of surface discontinuities. This technique involves the application of dye by spraying [107,108,109]. Analogous to magnetic particle testing, dye penetrant testing shares the same limitation, as it is only capable of detecting defects that are accessible from the surface. Eddy current testing is another non-destructive evaluation method based on Faraday’s law of electromagnetic induction. It involves oscillating electrical currents induced in a conductive medium by an alternating magnetic field [107,110]. The presence of material defects disrupts the flow of eddy currents, generating a secondary magnetic field that opposes the main field. The receiver monitors and detects these irregularities [107,111]. However, the technique is limited by the specific material, type of defect, its orientation, the depth of the defect, and the surface quality of the material [107]. This method can only detect surface and near-surface discontinuities. An alternative approach involves the use of ultrasonic evaluation to identify material defects. Ultrasonic inspection is a well-established non-destructive testing technique that employs ultrasonic waves to assess material integrity. This assessment is achieved by measuring the transmitted and reflected energies resulting from inhomogeneities within the material [107,112,113]. Moreover, laser ultrasound possesses the capability of detecting abnormalities as small as 100-micron embedded defects and is utilized on metal AM parts [114,115,116]. However, ultrasonic testing is confronted with a considerable amount of noise, thereby affecting the detection of porosities. Furthermore, the signal sensitivity to surface roughness imposes limitations on its applicability.
Researchers have extensively employed CT for its three-dimensional accuracy in detecting porosity and locating defects [113,117,118,119,120,121,122]. X-ray is extensively employed in various engineering applications for non-destructive analyses. Within the realm of additive manufacturing, it is utilized for the detection of porosity and/or defects. XCT is employed as a reference for pore location and size determination in machine learning applications due to its high accuracy. However, the precision of the scan is contingent upon resolution, necessitating additional time. This results in increased time and financial investments [123]. Despite the minor variations in results observed with different scanning parameters affecting pore detection [123], the technique remains steadfast as a reliable method for defect detection. The overall comparison of the ex situ techniques is summarized in Table 2.

3. Summary

Porosity is regarded as a primary factor contributing to the reduction in the sample life cycle. Despite extensive studies on parameter optimization, porosity remains a challenge. Over the last decade, many scholars have investigated defect detection systems for L-PBF. Due to the compact nature of L-PBF systems, implementing or modifying in situ monitoring systems is challenging, especially with small build chamber configurations. Most monitoring systems require specific environments and space, making it difficult to place the equipment inside the build chamber. Scholars have circumvented this issue by using an external screening window, either in the front or on top of the monitoring section, if available. Optical methods represent one of the straightforward approaches for monitoring system abnormalities in additive manufacturing. These methods involve capturing images of powder bed abnormalities between layers using regular optical cameras with various lighting settings. In general, optical techniques employ two primary methods: image-based and signal-based approaches. One image-based approach involves utilizing a DSLR camera [76,77] with different light settings, which can result in a slowdown of the process. Instead, dual digital image correlation (DIC) cameras are also utilized for the same purpose. The dual DIC [74] approach presents an opportunity as it does not require system interruption. Improvements to the dual DIC system can be achieved through the integration of machine input data and extensive machine learning processes. On the other hand, the signal-based approach utilizes photodiodes and explores the potential relationship between defect generation and Cr I emission [69]. These in situ monitoring systems may offer faster optical detection. However, it is important to note that Cr I emission, which relates to the vaporization of Cr in the melt pool, does not always lead to defects. Optical systems are unable to identify subsurface defects, and most monitoring systems only provide information regarding the presence or absence of defects. it is important to note that powder bed abnormalities can lead to larger defects, such as LOF or delamination, resulting in failures. While these monitoring systems are effective for detecting large defects, they may not be as sensitive to smaller abnormalities.
The acoustic method is one of the easiest to implement in powder bed fusion. There are two main approaches for acoustic techniques: structural-borne and airborne signal collection. For the structural-borne approach, surface contact is required to collect data, whereas for airborne, it is not necessary, making it more easily applicable. However, specific data still need to be collected and matched with time. By utilizing 3D acoustic signals and matching them with laser input locations, detection can be achieved. Even though these systems only require one microphone (acoustic receiver) inside the build chamber, they show promise in detecting keyholes. They detect keyhole porosities by correlating labeled keyholes with acoustic signals [98]. However, keyhole porosities are stochastic, making detection challenging for every in situ technique. Having a labeled keyhole signal in a specific location may not always result in a pore in the final product due to the remelting and healing aspects of L-PBF. The acoustic techniques are in the development stage, and more study is required, especially on multi-track large samples.
Synchrotron X-ray in situ monitoring systems require a specifically designed and modified powder bed to accommodate the X-ray source. These systems provide a comprehensive understanding of the physics underlying defect morphology. The X-ray synchrotron provides a detailed explanation of the underlying physics of defect formation steps. However, significant modifications to the machine and/or build chamber are required to accommodate X-ray scanning. These systems are expensive to modify and operate. Additionally, the collected data need to be post-processed, which is time-consuming and computationally intensive. This makes X-ray in situ techniques more of a grand truth method rather than a fully applicable in situ technique.
Temperature-based techniques offer more robust and precise defect detection by monitoring the melt pool in real-time. Pyrometers are utilized to collect data at each layer. High-speed thermal data and/or pyrometer data have proven to be valuable for defect analysis. The thermal in situ system, focusing on monitoring melt pool geometry, has been found to be highly correlated with the formation of most defects. Keyhole porosities and low vapor temperatures have been observed to be correlated in single-track imaging [103]. The main bottleneck for thermal-based models is the thermal emissivity of the material, which varies with temperature. Thus, thermal emissivity needs to be precisely defined, making it challenging to generalize the thermal method for every material. Scholars tackle this problem by employing two pyrometers with different wavelength filters. Instead of using a single wavelength to predict the melt pool temperature, the ratio of two wavelengths is utilized. This approach renders the emissivity of the material irrelevant, enhancing its generalizability.
Overall, in situ monitoring systems have their limitations, which sometimes stem from the techniques themselves. However, defect formation mechanisms in metal L-PBF significantly affect detection capabilities. Large and open surface defects are relatively easy to detect. For instance, LOF defects caused by insufficient melting result in significant changes in melt pool geometry, which can be easily detected by most aforementioned monitoring systems. In contrast, subsurface defects involve more complex thermodynamic phenomena. For example, keyhole porosities occur when Marangoni forces exceed the buoyancy force on entrapped gas inside the melt pool. Detecting keyhole melting is challenging, and identifying entrapped gas within the structure adds further complexity. Fortunately, these thermodynamic phenomena favor thermal in situ detection methods.
When it comes to ex situ detection systems, destructive techniques lag behind non-destructive ones in terms of mapping porosity in 3D. Destructive techniques also depend on the specific location of the harvested sample. This makes non-destructive techniques more appealing. However, not all non-destructive detection systems are capable of 3D-mapping porosity. The Archimedes method, while easy to apply, falls short when it comes to locating the porosity. Ultrasonic detection methods are emerging as inexpensive means of pore and defect detection. However, ultrasonic testing (UT) signals are sensitive to surface finish and even microstructural inhomogeneities [124], posing a challenging problem to tackle. It should be noted that UT is still in the development stage for these applications. On the other hand, XCT is considered the gold standard for detecting porosity size and location. CT data need to be processed, and pores and defects need to be identified (labeled) so that machine learning algorithms can learn from these labels. Labeling is performed using certain threshold values, either automatically or manually. Even though it is a time- and money-consuming operation, it is still the most acceptable porosity detection system. All in situ and ex situ methods mentioned in this review, which are utilized in L-PBF, are presented in Table 3.

4. Outlook

The future of in situ monitoring and ex situ characterization is promising for implementation in real L-PBF machines. Current research shows that the integration of ML is becoming a key aspect of in situ monitoring. Various ML techniques have been applied to improve the prediction models of in situ monitoring. Although some studies have reported that certain ML techniques perform better than others, the same technique may perform poorly in other research findings. The choice of ML technique depends on the approach and dataset. However, regardless of the selected in situ technique, ML is necessary for a better understanding of the dataset. Additionally, most studies detect porosity in either single tracks or simple geometries. Further studies are needed to implement more complex geometries, which may be more challenging due to the healing process of keyhole pores.
For in situ monitoring systems, a comprehensive exploration of multi-sensor configurations is essential. Integrating various sensing systems can help mitigate individual limitations. For instance, optical methods employing DIC cameras excel at detecting powder bed irregularities, while thermal techniques are adept at monitoring melt pool geometries. The thermal emissivity of materials can be overcome using two thermal sensors and their ratio. By combining DIC cameras with a dual pyrometer setup, data on both powder bed abnormalities and melt pool characteristics can be obtained. Alternatively, dual high-speed thermal cameras can be utilized. Additionally, machine inputs can be leveraged, as mentioned earlier. The combinations are endless for multi-sensor applications. For instance, airborne acoustic methods require only one microphone located inside the build chamber, which will not interfere with any optical and thermal monitoring systems. In such cases, a combination of optical (DIC), thermal (dual pyrometer or HS thermal camera), and acoustic sensors will not impede each other but rather enhance the detection accuracy. Moreover, these multi-sensor setups can be integrated into closed-loop systems with the assistance of machine learning, leading to significant time and resource savings in the long term. With a multi-fail check system like drastic failure, possible failure, etc., multi-sensors will verify or correct false positives and train the closed-loop system to the ultimate fail-safe level. However, implementing a closed-loop system is not straightforward. Closed-loop systems rely on real-time data collection. When monitoring systems generate large amounts of data, such as high-speed cameras, executing closed-loop systems requires very high computational power. Since one of the end goals of a closed-loop system is to adjust process parameters on the fly to eliminate or reduce defects, computational power becomes a significant bottleneck. Signal-based monitoring systems are advantageous in this context because processing signal data requires less computational power. Closed-loop systems may lead to process optimization at a different level. The ability to change process parameters on the fly may result in different parameters throughout the build. This can create another problem with stakeholders needing to be convinced. Thus, a closed-loop system needs to be robust in terms of process validation and free from false positives. As mentioned earlier, for ex situ characterization, X-ray CT remains the ground truth method.

Author Contributions

Conceptualization, B.A. and K.C.; methodology, B.A.; investigation, B.A.; writing—original draft preparation, B.A.; writing—review and editing, B.A. and K.C.; supervision, K.C. All authors have read and agreed to the published version of the manuscript.

Funding

This research received no external funding.

Data Availability Statement

Not applicable.

Conflicts of Interest

The authors declare no conflicts of interest.

References

  1. AF42 Committee. Terminology for Additive Manufacturing—General Principles—Terminology; ASTM International: West Conshohocken, PA, USA, 2022. [Google Scholar] [CrossRef]
  2. Mostafaei, A.; Zhao, C.; He, Y.; Reza Ghiaasiaan, S.; Shi, B.; Shao, S.; Shamsaei, N.; Wu, Z.; Kouraytem, N.; Sun, T.; et al. Defects and Anomalies in Powder Bed Fusion Metal Additive Manufacturing. Curr. Opin. Solid State Mater. Sci. 2022, 26, 100974. [Google Scholar] [CrossRef]
  3. Yan, C.; Hao, L.; Hussein, A.; Raymont, D. Evaluations of Cellular Lattice Structures Manufactured Using Selective Laser Melting. Int. J. Mach. Tools Manuf. 2012, 62, 32–38. [Google Scholar] [CrossRef]
  4. Gunenthiram, V.; Peyre, P.; Schneider, M.; Dal, M.; Coste, F.; Fabbro, R. Analysis of Laser–Melt Pool–Powder Bed Interaction during the Selective Laser Melting of a Stainless Steel. J. Laser Appl. 2017, 29, 022303. [Google Scholar] [CrossRef]
  5. Leung, C.L.A.; Marussi, S.; Atwood, R.C.; Towrie, M.; Withers, P.J.; Lee, P.D. In Situ X-Ray Imaging of Defect and Molten Pool Dynamics in Laser Additive Manufacturing. Nat. Commun. 2018, 9, 1355. [Google Scholar] [CrossRef]
  6. Bitharas, I.; Burton, A.; Ross, A.J.; Moore, A.J. Visualisation and Numerical Analysis of Laser Powder Bed Fusion under Cross-Flow. Addit. Manuf. 2021, 37, 101690. [Google Scholar] [CrossRef]
  7. Grasso, M.; Colosimo, B.M. Process Defects and in Situ Monitoring Methods in Metal Powder Bed Fusion: A Review. Meas. Sci. Technol. 2017, 28, 044005. [Google Scholar] [CrossRef]
  8. Chen, H.; Wei, Q.; Zhang, Y.; Chen, F.; Shi, Y.; Yan, W. Powder-Spreading Mechanisms in Powder-Bed-Based Additive Manufacturing: Experiments and Computational Modeling. Acta Mater. 2019, 179, 158–171. [Google Scholar] [CrossRef]
  9. Ziegelmeier, S.; Christou, P.; Wöllecke, F.; Tuck, C.; Goodridge, R.; Hague, R.; Krampe, E.; Wintermantel, E. An Experimental Study into the Effects of Bulk and Flow Behaviour of Laser Sintering Polymer Powders on Resulting Part Properties. J. Mater. Process. Technol. 2015, 215, 239–250. [Google Scholar] [CrossRef]
  10. Olatunde Olakanmi, E.; Dalgarno, K.W.; Cochrane, R.F. Laser Sintering of Blended Al-Si Powders. Rapid Prototyp. J. 2012, 18, 109–119. [Google Scholar] [CrossRef]
  11. Scime, L.; Beuth, J. Anomaly Detection and Classification in a Laser Powder Bed Additive Manufacturing Process Using a Trained Computer Vision Algorithm. Addit. Manuf. 2018, 19, 114–126. [Google Scholar] [CrossRef]
  12. Lee, Y.S.; Nandwana, P.; Zhang, W. Dynamic Simulation of Powder Packing Structure for Powder Bed Additive Manufacturing. Int. J. Adv. Manuf. Technol. 2018, 96, 1507–1520. [Google Scholar] [CrossRef]
  13. Nan, W.; Ghadiri, M. Numerical Simulation of Powder Flow during Spreading in Additive Manufacturing. Powder Technol. 2019, 342, 801–807. [Google Scholar] [CrossRef]
  14. Haeri, S.; Wang, Y.; Ghita, O.; Sun, J. Discrete Element Simulation and Experimental Study of Powder Spreading Process in Additive Manufacturing. Powder Technol. 2017, 306, 45–54. [Google Scholar] [CrossRef]
  15. Nan, W.; Pasha, M.; Bonakdar, T.; Lopez, A.; Zafar, U.; Nadimi, S.; Ghadiri, M. Jamming during Particle Spreading in Additive Manufacturing. Powder Technol. 2018, 338, 253–262. [Google Scholar] [CrossRef]
  16. Meier, C.; Weissbach, R.; Weinberg, J.; Wall, W.A.; Hart, A.J. Critical Influences of Particle Size and Adhesion on the Powder Layer Uniformity in Metal Additive Manufacturing. J. Mater. Process. Technol. 2019, 266, 484–501. [Google Scholar] [CrossRef]
  17. Kruth, J.-P.; Levy, G.; Klocke, F.; Childs, T.H.C. Consolidation Phenomena in Laser and Powder-Bed Based Layered Manufacturing. CIRP Ann. Manuf. Technol. 2007, 56, 730–759. [Google Scholar] [CrossRef]
  18. Yadroitsev, I.; Gusarov, A.; Yadroitsava, I.; Smurov, I. Single Track Formation in Selective Laser Melting of Metal Powders. J. Mater. Process. Technol. 2010, 210, 1624–1631. [Google Scholar] [CrossRef]
  19. Tolochko, N.K.; Mozzharov, S.E.; Yadroitsev, I.A.; Laoui, T.; Froyen, L.; Titov, V.I.; Ignatiev, M.B. Balling Processes during Selective Laser Treatment of Powders. Rapid Prototyp. J. 2004, 10, 78–87. [Google Scholar] [CrossRef]
  20. Gu, D.; Shen, Y. Balling Phenomena in Direct Laser Sintering of Stainless Steel Powder: Metallurgical Mechanisms and Control Methods. Mater. Eng. 2009, 30, 2903–2910. [Google Scholar] [CrossRef]
  21. Kimura, T.; Nakamoto, T. Microstructures and Mechanical Properties of A356 (AlSi7Mg0.3) Aluminum Alloy Fabricated by Selective Laser Melting. Mater. Des. 2016, 89, 1294–1301. [Google Scholar] [CrossRef]
  22. Aboulkhair, N.T.; Everitt, N.M.; Ashcroft, I.; Tuck, C. Reducing Porosity in AlSi10Mg Parts Processed by Selective Laser Melting. Addit. Manuf. 2014, 1–4, 77–86. [Google Scholar] [CrossRef]
  23. Sames, W.J.; List, F.A.; Pannala, S.; Dehoff, R.R.; Babu, S.S. The Metallurgy and Processing Science of Metal Additive Manufacturing. Int. Mater. Rev. 2016, 61, 315–360. [Google Scholar] [CrossRef]
  24. Tang, M.; Pistorius, P.C.; Beuth, J.L. Prediction of Lack-of-Fusion Porosity for Powder Bed Fusion. Addit. Manuf. 2017, 14, 39–48. [Google Scholar] [CrossRef]
  25. Mukherjee, T.; Zuback, J.S.; De, A.; DebRoy, T. Printability of Alloys for Additive Manufacturing. Sci. Rep. 2016, 6, 19717. [Google Scholar] [CrossRef] [PubMed]
  26. Darvish, K.; Chen, Z.W.; Pasang, T. Reducing Lack of Fusion during Selective Laser Melting of CoCrMo Alloy: Effect of Laser Power on Geometrical Features of Tracks. Mater. Des. 2016, 112, 357–366. [Google Scholar] [CrossRef]
  27. Gong, H.; Rafi, K.; Gu, H.; Starr, T.; Stucker, B. Analysis of Defect Generation in Ti–6Al–4V Parts Made Using Powder Bed Fusion Additive Manufacturing Processes. Addit. Manuf. 2014, 1–4, 87–98. [Google Scholar] [CrossRef]
  28. Zhao, C.; Fezzaa, K.; Cunningham, R.W.; Wen, H.; De Carlo, F.; Chen, L.; Rollett, A.D.; Sun, T. Real-Time Monitoring of Laser Powder Bed Fusion Process Using High-Speed X-Ray Imaging and Diffraction. Sci. Rep. 2017, 7, 3602. [Google Scholar] [CrossRef] [PubMed]
  29. Guo, Q.; Zhao, C.; Escano, L.I.; Young, Z.; Xiong, L.; Fezzaa, K.; Everhart, W.; Brown, B.; Sun, T.; Chen, L. Transient Dynamics of Powder Spattering in Laser Powder Bed Fusion Additive Manufacturing Process Revealed by In-Situ High-Speed High-Energy x-Ray Imaging. Acta Mater. 2018, 151, 169–180. [Google Scholar] [CrossRef]
  30. Ly, S.; Rubenchik, A.M.; Khairallah, S.A.; Guss, G.; Matthews, M.J. Metal Vapor Micro-Jet Controls Material Redistribution in Laser Powder Bed Fusion Additive Manufacturing. Sci. Rep. 2017, 7, 4085. [Google Scholar] [CrossRef]
  31. Bobel, A.; Hector, L.G., Jr.; Chelladurai, I.; Sachdev, A.K.; Brown, T.; Poling, W.A.; Kubic, R.; Gould, B.; Zhao, C.; Parab, N.; et al. In Situ Synchrotron X-Ray Imaging of 4140 Steel Laser Powder Bed Fusion. Materialia 2019, 6, 100306. [Google Scholar] [CrossRef]
  32. DebRoy, T.; David, S.A. Physical Processes in Fusion Welding. Rev. Mod. Phys. 1995, 67, 85–112. [Google Scholar] [CrossRef]
  33. Matsunawa, A.; Kim, J.-D.; Seto, N.; Mizutani, M.; Katayama, S. Dynamics of Keyhole and Molten Pool in Laser Welding. J. Laser Appl. 1998, 10, 247–254. [Google Scholar] [CrossRef]
  34. Zhao, C.; Parab, N.D.; Li, X.; Fezzaa, K.; Tan, W.; Rollett, A.D.; Sun, T. Critical Instability at Moving Keyhole Tip Generates Porosity in Laser Melting. Science 2020, 370, 1080–1086. [Google Scholar] [CrossRef] [PubMed]
  35. Cunningham, R.; Zhao, C.; Parab, N.; Kantzos, C.; Pauza, J.; Fezzaa, K.; Sun, T.; Rollett, A.D. Keyhole Threshold and Morphology in Laser Melting Revealed by Ultrahigh-Speed x-Ray Imaging. Science 2019, 363, 849–852. [Google Scholar] [CrossRef]
  36. Panwisawas, C.; Qiu, C.L.; Sovani, Y.; Brooks, J.W.; Attallah, M.M.; Basoalto, H.C. On the Role of Thermal Fluid Dynamics into the Evolution of Porosity during Selective Laser Melting. Scr. Mater. 2015, 105, 14–17. [Google Scholar] [CrossRef]
  37. King, W.E.; Barth, H.D.; Castillo, V.M.; Gallegos, G.F.; Gibbs, J.W.; Hahn, D.E.; Kamath, C.; Rubenchik, A.M. Observation of Keyhole-Mode Laser Melting in Laser Powder-Bed Fusion Additive Manufacturing. J. Mater. Process. Technol. 2014, 214, 2915–2925. [Google Scholar] [CrossRef]
  38. Thijs, L.; Kempen, K.; Kruth, J.-P.; Van Humbeeck, J. Fine-Structured Aluminium Products with Controllable Texture by Selective Laser Melting of Pre-Alloyed AlSi10Mg Powder. Acta Mater. 2013, 61, 1809–1819. [Google Scholar] [CrossRef]
  39. Gordon, J.V.; Narra, S.P.; Cunningham, R.W.; Liu, H.; Chen, H.; Suter, R.M.; Beuth, J.L.; Rollett, A.D. Defect Structure Process Maps for Laser Powder Bed Fusion Additive Manufacturing. Addit. Manuf. 2020, 36, 101552. [Google Scholar] [CrossRef]
  40. Fabbro, R. Melt Pool and Keyhole Behaviour Analysis for Deep Penetration Laser Welding. J. Phys. D Appl. Phys. 2010, 43, 445501. [Google Scholar] [CrossRef]
  41. Nassar, A.R.; Gundermann, M.A.; Reutzel, E.W.; Guerrier, P.; Krane, M.H.; Weldon, M.J. Formation Processes for Large Ejecta and Interactions with Melt Pool Formation in Powder Bed Fusion Additive Manufacturing. Sci. Rep. 2019, 9, 5038. [Google Scholar] [CrossRef]
  42. King, W.E.; Anderson, A.T.; Ferencz, R.M.; Hodge, N.E.; Kamath, C.; Khairallah, S.A.; Rubenchik, A.M. Laser Powder Bed Fusion Additive Manufacturing of Metals; Physics, Computational, and Materials Challenges. Appl. Phys. Rev. 2015, 2, 041304. [Google Scholar] [CrossRef]
  43. Zhao, C.; Guo, Q.; Li, X.; Parab, N.; Fezzaa, K.; Tan, W.; Chen, L.; Sun, T. Bulk-Explosion-Induced Metal Spattering during Laser Processing. Phys. Rev. X. 2019, 9, 021052. [Google Scholar] [CrossRef]
  44. Grasso, M.; Remani, A.; Dickins, A.; Colosimo, B.M.; Leach, R.K. In-Situ Measurement and Monitoring Methods for Metal Powder Bed Fusion: An Updated Review. Meas. Sci. Technol. 2021, 32, 112001. [Google Scholar] [CrossRef]
  45. Scime, L.; Siddel, D.; Baird, S.; Paquit, V. Layer-Wise Anomaly Detection and Classification for Powder Bed Additive Manufacturing Processes: A Machine-Agnostic Algorithm for Real-Time Pixel-Wise Semantic Segmentation. Addit. Manuf. 2020, 36, 101453. [Google Scholar] [CrossRef]
  46. Angelone, R.; Caggiano, A.; Teti, R.; Spierings, A.; Staub, A.; Wegener, K. Bio-Intelligent Selective Laser Melting System Based on Convolutional Neural Networks for in-Process Fault Identification. Procedia CIRP 2020, 88, 612–617. [Google Scholar] [CrossRef]
  47. Tan Phuc, L.; Seita, M. A High-Resolution and Large Field-of-View Scanner for in-Line Characterization of Powder Bed Defects during Additive Manufacturing. Mater. Des. 2019, 164, 107562. [Google Scholar] [CrossRef]
  48. Barrett, C.; MacDonald, E.; Conner, B.; Persi, F. Micron-Level Layer-Wise Surface Profilometry to Detect Porosity Defects in Powder Bed Fusion of Inconel 718. JOM 2018, 70, 1844–1852. [Google Scholar] [CrossRef]
  49. Mohr, G.; Altenburg, S.J.; Ulbricht, A.; Heinrich, P.; Baum, D.; Maierhofer, C.; Hilgenberg, K. In-Situ Defect Detection in Laser Powder Bed Fusion by Using Thermography and Optical Tomography—Comparison to Computed Tomography. Metals 2020, 10, 103. [Google Scholar] [CrossRef]
  50. Gaikwad, A.; Yavari, R.; Montazeri, M.; Cole, K.; Bian, L.; Rao, P. Toward the Digital Twin of Additive Manufacturing: Integrating Thermal Simulations, Sensing, and Analytics to Detect Process Faults. IISE Trans. 2020, 52, 1204–1217. [Google Scholar] [CrossRef]
  51. Heigel, J.C.; Lane, B.; Levine, L.; Phan, T.; Whiting, J. In Situ Thermography of the Metal Bridge Structures Fabricated for the 2018 Additive Manufacturing Benchmark Test Series (AM-Bench 2018). J. Res. Natl. Inst. Stand. Technol. 2020, 125, 125005. [Google Scholar] [CrossRef]
  52. Forien, J.-B.; Calta, N.P.; DePond, P.J.; Guss, G.M.; Roehling, T.T.; Matthews, M.J. Detecting Keyhole Pore Defects and Monitoring Process Signatures during Laser Powder Bed Fusion: A Correlation between in Situ Pyrometry and Ex Situ X-Ray Radiography. Addit. Manuf. 2020, 35, 101336. [Google Scholar] [CrossRef]
  53. Haines, M.P.; Peter, N.J.; Babu, S.S.; Jägle, E.A. In-Situ Synthesis of Oxides by Reactive Process Atmospheres during L-PBF of Stainless Steel. Addit. Manuf. 2020, 33, 101178. [Google Scholar] [CrossRef]
  54. Lhuissier, P.; Bataillon, X.; Maestre, C.; Sijobert, J.; Cabrol, E.; Bertrand, P.; Boller, E.; Rack, A.; Blandin, J.-J.; Salvo, L.; et al. In Situ 3D X-Ray Microtomography of Laser-Based Powder-Bed Fusion (L-PBF)—A Feasibility Study. Addit. Manuf. 2020, 34, 101271. [Google Scholar] [CrossRef]
  55. Schmeiser, F.; Krohmer, E.; Schell, N.; Uhlmann, E.; Reimers, W. Experimental Observation of Stress Formation during Selective Laser Melting Using in Situ X-Ray Diffraction. Addit. Manuf. 2020, 32, 101028. [Google Scholar] [CrossRef]
  56. Young, Z.A.; Guo, Q.; Parab, N.D.; Zhao, C.; Qu, M.; Escano, L.I.; Fezzaa, K.; Everhart, W.; Sun, T.; Chen, L. Types of Spatter and Their Features and Formation Mechanisms in Laser Powder Bed Fusion Additive Manufacturing Process. Addit. Manuf. 2020, 36, 101438. [Google Scholar] [CrossRef]
  57. Goossens, L.R.; Van Hooreweder, B. A Virtual Sensing Approach for Monitoring Melt-Pool Dimensions Using High Speed Coaxial Imaging during Laser Powder Bed Fusion of Metals. Addit. Manuf. 2021, 40, 101923. [Google Scholar] [CrossRef]
  58. Le, T.-N.; Lee, M.-H.; Lin, Z.-H.; Tran, H.-C.; Lo, Y.-L. Vision-Based in-Situ Monitoring System for Melt-Pool Detection in Laser Powder Bed Fusion Process. J. Manuf. Process. 2021, 68, 1735–1745. [Google Scholar] [CrossRef]
  59. Cheng, B.; Lydon, J.; Cooper, K.; Cole, V.; Northrop, P.; Chou, K. Melt Pool Dimension Measurement in Selective Laser Melting Using Thermal Imaging. In Proceedings of the 2017 International Solid Freeform Fabrication Symposium, Austin, TX, USA, 7–9 August 2017. [Google Scholar]
  60. Craeghs, T.; Clijsters, S.; Yasa, E.; Bechmann, F.; Berumen, S.; Kruth, J.-P. Determination of Geometrical Factors in Layerwise Laser Melting Using Optical Process Monitoring. Opt. Lasers Eng. 2011, 49, 1440–1446. [Google Scholar] [CrossRef]
  61. Craeghs, T.; Clijsters, S.; Kruth, J.-P.; Bechmann, F.; Ebert, M.-C. Detection of Process Failures in Layerwise Laser Melting with Optical Process Monitoring. Phys. Procedia 2012, 39, 753–759. [Google Scholar] [CrossRef]
  62. Hooper, P.A. Melt Pool Temperature and Cooling Rates in Laser Powder Bed Fusion. Addit. Manuf. 2018, 22, 548–559. [Google Scholar] [CrossRef]
  63. Whiting, J.; Lane, B.; Chou, K.; Cheng, B. Thermal Property Measurement Methods and Analysis for Additive Manufacturing Solids and Powders. In Proceedings of the 2017 International Solid Freeform Fabrication Symposium, Austin, TX, USA, 7–9 August 2017. [Google Scholar]
  64. Simonds, B.J.; Tanner, J.; Artusio-Glimpse, A.; Williams, P.A.; Parab, N.; Zhao, C.; Sun, T. The Causal Relationship between Melt Pool Geometry and Energy Absorption Measured in Real Time during Laser-Based Manufacturing. Appl. Mater. Today 2021, 23, 101049. [Google Scholar] [CrossRef]
  65. Bidare, P.; Bitharas, I.; Ward, R.M.; Attallah, M.M.; Moore, A.J. Fluid and Particle Dynamics in Laser Powder Bed Fusion. Acta Mater. 2018, 142, 107–120. [Google Scholar] [CrossRef]
  66. Wang, D.; Dou, W.; Ou, Y.; Yang, Y.; Tan, C.; Zhang, Y. Characteristics of Droplet Spatter Behavior and Process-Correlated Mapping Model in Laser Powder Bed Fusion. J. Mater. Res. Technol. 2021, 12, 1051–1064. [Google Scholar] [CrossRef]
  67. Tsubouchi, K.; Furumoto, T.; Yamaguchi, M.; Ezura, A.; Yamada, S.; Osaki, M.; Sugiyama, K. Evaluation of Spatter Particles, Metal Vapour Jets, and Depressions Considering Influence of Laser Incident Angle on Melt Pool Behaviour. Int. J. Adv. Manuf. Technol. 2022, 120, 1821–1830. [Google Scholar] [CrossRef]
  68. Yin, J.; Wang, D.; Yang, L.; Wei, H.; Dong, P.; Ke, L.; Wang, G.; Zhu, H.; Zeng, X. Correlation between Forming Quality and Spatter Dynamics in Laser Powder Bed Fusion. Addit. Manuf. 2020, 31, 100958. [Google Scholar] [CrossRef]
  69. Montazeri, M.; Nassar, A.R.; Dunbar, A.J.; Rao, P. In-Process Monitoring of Porosity in Additive Manufacturing Using Optical Emission Spectroscopy. IISE Trans. 2020, 52, 500–515. [Google Scholar] [CrossRef]
  70. Dunbar, A.J.; Nassar, A.R. Assessment of Optical Emission Analysis for In-Process Monitoring of Powder Bed Fusion Additive Manufacturing. Virtual Phys. Prototyp. 2018, 13, 14–19. [Google Scholar] [CrossRef]
  71. Seltzer, D.; Schiano, J.L.; Nassar, A.R.; Reutzel, E.W. Illumination and Image Processing for Real-Time Control of Directed Energy Deposition Additive Manufacturing. In Proceedings of the 2016 International Solid Freeform Fabrication Symposium, Austin, TX, USA, 8–10 August 2016. [Google Scholar]
  72. Nassar, A.R.; Starr, B.; Reutzel, E.W. Process Monitoring of Directed-Energy Deposition of Inconel-718 via Plume Imaging. In Proceedings of the 2015 International Solid Freeform Fabrication Symposium, Austin, TX, USA, 10–12 August 2015. [Google Scholar]
  73. Imani, F.; Gaikwad, A.; Montazeri, M.; Rao, P.; Yang, H.; Reutzel, E. Layerwise In-Process Quality Monitoring in Laser Powder Bed Fusion. In Proceedings of the ASME 2018 13th International Manufacturing Science and Engineering Conference, College Station, TX, USA, 18–22 June 2018. Volume 1: Additive Manufacturing; Bio and Sustainable Manufacturing; American Society of Mechanical Engineers. [Google Scholar]
  74. Bartlett, J.L.; Jarama, A.; Jones, J.; Li, X. Prediction of Microstructural Defects in Additive Manufacturing from Powder Bed Quality Using Digital Image Correlation. Mater. Sci. Eng. A Struct. Mater. 2020, 794, 140002. [Google Scholar] [CrossRef]
  75. Lough, C.S.; Escano, L.I.; Qu, M.; Smith, C.C.; Landers, R.G.; Bristow, D.A.; Chen, L.; Kinzel, E.C. In-Situ Optical Emission Spectroscopy of Selective Laser Melting. J. Manuf. Process. 2020, 53, 336–341. [Google Scholar] [CrossRef]
  76. Snow, Z.; Diehl, B.; Reutzel, E.W.; Nassar, A. Toward In-Situ Flaw Detection in Laser Powder Bed Fusion Additive Manufacturing through Layerwise Imagery and Machine Learning. J. Manuf. Syst. 2021, 59, 12–26. [Google Scholar] [CrossRef]
  77. Snow, Z.; Reutzel, E.W.; Petrich, J. Correlating In-Situ Sensor Data to Defect Locations and Part Quality for Additively Manufactured Parts Using Machine Learning. J. Mater. Process. Technol. 2022, 302, 117476. [Google Scholar] [CrossRef]
  78. Yuan, B.; Guss, G.M.; Wilson, A.C.; Hau-Riege, S.P.; DePond, P.J.; McMains, S.; Matthews, M.J.; Giera, B. Machine-learning-based Monitoring of Laser Powder Bed Fusion. Adv. Mater. Technol. 2018, 3, 1800136. [Google Scholar] [CrossRef]
  79. DePond, P.J.; Guss, G.; Ly, S.; Calta, N.P.; Deane, D.; Khairallah, S.; Matthews, M.J. In Situ Measurements of Layer Roughness during Laser Powder Bed Fusion Additive Manufacturing Using Low Coherence Scanning Interferometry. Mater. Des. 2018, 154, 347–359. [Google Scholar] [CrossRef]
  80. Smoqi, Z.; Gaikwad, A.; Bevans, B.; Kobir, M.H.; Craig, J.; Abul-Haj, A.; Peralta, A.; Rao, P. Monitoring and Prediction of Porosity in Laser Powder Bed Fusion Using Physics-Informed Meltpool Signatures and Machine Learning. J. Mater. Process. Technol. 2022, 304, 117550. [Google Scholar] [CrossRef]
  81. Lough, C.S.; Liu, T.; Wang, X.; Brown, B.; Landers, R.G.; Bristow, D.A.; Drallmeier, J.A.; Kinzel, E.C. Local Prediction of Laser Powder Bed Fusion Porosity by Short-Wave Infrared Imaging Thermal Feature Porosity Probability Maps. J. Mater. Process. Technol. 2022, 302, 117473. [Google Scholar] [CrossRef]
  82. Yavari, R.; Riensche, A.; Tekerek, E.; Jacquemetton, L.; Halliday, H.; Vandever, M.; Tenequer, A.; Perumal, V.; Kontsos, A.; Smoqi, Z.; et al. Digitally Twinned Additive Manufacturing: Detecting Flaws in Laser Powder Bed Fusion by Combining Thermal Simulations with in-Situ Meltpool Sensor Data. Mater. Des. 2021, 211, 110167. [Google Scholar] [CrossRef]
  83. Yavari, M.R.; Cole, K.D.; Rao, P. Thermal Modeling in Metal Additive Manufacturing Using Graph Theory. J. Manuf. Sci. Eng. 2019, 141, 071007. [Google Scholar] [CrossRef]
  84. Yavari, R.; Williams, R.; Riensche, A.; Hooper, P.A.; Cole, K.D.; Jacquemetton, L.; Halliday, H.s.; Rao, P.K. Thermal Modeling in Metal Additive Manufacturing Using Graph Theory—Application to Laser Powder Bed Fusion of a Large Volume Impeller. Addit. Manuf. 2021, 41, 101956. [Google Scholar] [CrossRef]
  85. Cole, K.D.; Yavari, M.R.; Rao, P.K. Computational Heat Transfer with Spectral Graph Theory: Quantitative Verification. Int. J. Therm. Sci. 2020, 153, 106383. [Google Scholar] [CrossRef]
  86. Yavari, R.; Smoqi, Z.; Riensche, A.; Bevans, B.; Kobir, H.; Mendoza, H.; Song, H.; Cole, K.; Rao, P. Part-Scale Thermal Simulation of Laser Powder Bed Fusion Using Graph Theory: Effect of Thermal History on Porosity, Microstructure Evolution, and Recoater Crash. Mater. Des. 2021, 204, 109685. [Google Scholar] [CrossRef]
  87. Bartlett, J.L.; Heim, F.M.; Murty, Y.V.; Li, X. In Situ Defect Detection in Selective Laser Melting via Full-Field Infrared Thermography. Addit. Manuf. 2018, 24, 595–605. [Google Scholar] [CrossRef]
  88. Williams, R.J.; Piglione, A.; Rønneberg, T.; Jones, C.; Pham, M.-S.; Davies, C.M.; Hooper, P.A. In Situ Thermography for Laser Powder Bed Fusion: Effects of Layer Temperature on Porosity, Microstructure and Mechanical Properties. Addit. Manuf. 2019, 30, 100880. [Google Scholar] [CrossRef]
  89. Gaikwad, A.; Giera, B.; Guss, G.M.; Forien, J.-B.; Matthews, M.J.; Rao, P. Heterogeneous Sensing and Scientific Machine Learning for Quality Assurance in Laser Powder Bed Fusion—A Single-Track Study. Addit. Manuf. 2020, 36, 101659. [Google Scholar] [CrossRef]
  90. Foster, S.J.; Carver, K.; Dinwiddie, R.B.; List, F., III; Unocic, K.A.; Chaudhary, A.; Babu, S.S. Process-Defect-Structure-Property Correlations during Laser Powder Bed Fusion of Alloy 718: Role of in Situ and Ex Situ Characterizations. Metall. Mater. Trans. A 2018, 49, 5775–5798. [Google Scholar] [CrossRef]
  91. Mitchell, J.A.; Ivanoff, T.A.; Dagel, D.; Madison, J.D.; Jared, B. Linking Pyrometry to Porosity in Additively Manufactured Metals. Addit. Manuf. 2020, 31, 100946. [Google Scholar] [CrossRef]
  92. Gaikwad, A.; Williams, R.J.; de Winton, H.; Bevans, B.D.; Smoqi, Z.; Rao, P.; Hooper, P.A. Multi Phenomena Melt Pool Sensor Data Fusion for Enhanced Process Monitoring of Laser Powder Bed Fusion Additive Manufacturing. Mater. Des. 2022, 221, 110919. [Google Scholar] [CrossRef]
  93. Pandiyan, V.; Drissi-Daoudi, R.; Shevchik, S.; Masinelli, G.; Le-Quang, T.; Logé, R.; Wasmer, K. Semi-Supervised Monitoring of Laser Powder Bed Fusion Process Based on Acoustic Emissions. Virtual Phys. Prototyp. 2021, 16, 481–497. [Google Scholar] [CrossRef]
  94. Duley, W.W.; Mao, Y.L. The Effect of Surface Condition on Acoustic Emission during Welding of Aluminium with CO2 Laser Radiation. J. Phys. D Appl. Phys. 1994, 27, 1379–1383. [Google Scholar] [CrossRef]
  95. Shevchik, S.; Le-Quang, T.; Meylan, B.; Farahani, F.V.; Olbinado, M.P.; Rack, A.; Masinelli, G.; Leinenbach, C.; Wasmer, K. Supervised Deep Learning for Real-Time Quality Monitoring of Laser Welding with X-Ray Radiographic Guidance. Sci. Rep. 2020, 10, 3389. [Google Scholar] [CrossRef]
  96. Eschner, N.; Weiser, L.; Häfner, B.; Lanza, G. Classification of Specimen Density in Laser Powder Bed Fusion (L-PBF) Using in-Process Structure-Borne Acoustic Process Emissions. Addit. Manuf. 2020, 34, 101324. [Google Scholar] [CrossRef]
  97. Rieder, H.; Spies, M.; Bamberg, J.; Henkel, B. On- and Offline Ultrasonic Characterization of Components Built by SLM Additive Manufacturing. In Proceedings of the Review of Progress in Quantitative Nondestructive Evaluation, Minneapolis, Minnesota, 26–31 July 2015; AIP Publishing LLC: Long Island, NY, USA, 2016. [Google Scholar]
  98. Tempelman, J.R.; Wachtor, A.J.; Flynn, E.B.; Depond, P.J.; Forien, J.-B.; Guss, G.M.; Calta, N.P.; Matthews, M.J. Detection of Keyhole Pore Formations in Laser Powder-Bed Fusion Using Acoustic Process Monitoring Measurements. Addit. Manuf. 2022, 55, 102735. [Google Scholar] [CrossRef]
  99. Sinclair, L.; Leung, C.L.A.; Marussi, S.; Clark, S.J.; Chen, Y.; Olbinado, M.P.; Rack, A.; Gardy, J.; Baxter, G.J.; Lee, P.D. In Situ Radiographic and Ex Situ Tomographic Analysis of Pore Interactions during Multilayer Builds in Laser Powder Bed Fusion. Addit. Manuf. 2020, 36, 101512. [Google Scholar] [CrossRef]
  100. Leung, C.L.A.; Marussi, S.; Towrie, M.; Atwood, R.C.; Withers, P.J.; Lee, P.D. The Effect of Powder Oxidation on Defect Formation in Laser Additive Manufacturing. Acta Mater. 2019, 166, 294–305. [Google Scholar] [CrossRef]
  101. Soundarapandiyan, G.; Leung, C.L.A.; Johnston, C.; Chen, B.; Khan, R.H.U.; McNutt, P.; Bhatt, A.; Atwood, R.C.; Lee, P.D.; Fitzpatrick, M.E. In Situ Monitoring the Effects of Ti6Al4V Powder Oxidation during Laser Powder Bed Fusion Additive Manufacturing. Int. J. Mach. Tools Manuf. 2023, 190, 104049. [Google Scholar] [CrossRef]
  102. Schwerz, C.; Bircher, B.A.; Küng, A.; Nyborg, L. In-Situ Detection of Stochastic Spatter-Driven Lack of Fusion: Application of Optical Tomography and Validation via Ex-Situ X-Ray Computed Tomography. Addit. Manuf. 2023, 72, 103631. [Google Scholar] [CrossRef]
  103. Wang, R.; Garcia, D.; Kamath, R.R.; Dou, C.; Ma, X.; Shen, B.; Choo, H.; Fezzaa, K.; Yu, H.Z.; Kong, Z. In Situ Melt Pool Measurements for Laser Powder Bed Fusion Using Multi Sensing and Correlation Analysis. Sci. Rep. 2022, 12, 13716. [Google Scholar] [CrossRef]
  104. Spierings, A.B.; Schneider, M.; Eggenberger, R. Comparison of Density Measurement Techniques for Additive Manufactured Metallic Parts. Rapid Prototyp. J. 2011, 17, 380–386. [Google Scholar] [CrossRef]
  105. Li, Y.; Jahr, H.; Pavanram, P.; Bobbert, F.S.L.; Puggi, U.; Zhang, X.-Y.; Pouran, B.; Leeflang, M.A.; Weinans, H.; Zhou, J.; et al. Additively Manufactured Functionally Graded Biodegradable Porous Iron. Acta Biomater. 2019, 96, 646–661. [Google Scholar] [CrossRef]
  106. Al-Maharma, A.Y.; Patil, S.P.; Markert, B. Effects of Porosity on the Mechanical Properties of Additively Manufactured Components: A Critical Review. Mater. Res. Express 2020, 7, 122001. [Google Scholar] [CrossRef]
  107. Lu, Q.Y.; Wong, C.H. Applications of Non-Destructive Testing Techniques for Post-Process Control of Additively Manufactured Parts. Virtual Phys. Prototyp. 2017, 12, 301–321. [Google Scholar] [CrossRef]
  108. Segovia Ramírez, I.; García Márquez, F.P.; Papaelias, M. Review on Additive Manufacturing and Non-Destructive Testing. J. Manuf. Syst. 2023, 66, 260–286. [Google Scholar] [CrossRef]
  109. Strantza, M.; Aggelis, D.; de Baere, D.; Guillaume, P.; van Hemelrijck, D. Evaluation of SHM System Produced by Additive Manufacturing via Acoustic Emission and Other NDT Methods. Sensors 2015, 15, 26709–26725. [Google Scholar] [CrossRef]
  110. García-Martín, J.; Gómez-Gil, J.; Vázquez-Sánchez, E. Non-Destructive Techniques Based on Eddy Current Testing. Sensors 2011, 11, 2525–2565. [Google Scholar] [CrossRef]
  111. Raj, B.; Jayakumar, T.; Thavasimuthu, M. Practical Nondestructive Testing; Narosa Publishing House: New Delhi, India, 1997; ISBN 9788173191268. [Google Scholar]
  112. Schmerr, L.W. Fundamentals of Ultrasonic Nondestructive Evaluation, 2nd ed.; Springer Series in Measurement Science and Technology; Springer International Publishing: Cham, Switzerland, 2016; ISBN 9783319304618. [Google Scholar]
  113. Davis, G.; Nagarajah, R.; Palanisamy, S.; Rashid, R.A.R.; Rajagopal, P.; Balasubramaniam, K. Laser Ultrasonic Inspection of Additive Manufactured Components. Int. J. Adv. Manuf. Technol. 2019, 102, 2571–2579. [Google Scholar] [CrossRef]
  114. Lévesque, D.; Bescond, C.; Lord, M.; Cao, X.; Wanjara, P.; Monchalin, J.-P. Inspection of Additive Manufactured Parts Using Laser Ultrasonics. In Proceedings of the Review of Progress in Quantitative Nondestructive Evaluation, Minneapolis, Minnesota, 26–31 July 2015; AIP Publishing LLC: Long Island, NY, USA, 2016. [Google Scholar]
  115. Honarvar, F.; Varvani-Farahani, A. A Review of Ultrasonic Testing Applications in Additive Manufacturing: Defect Evaluation, Material Characterization, and Process Control. Ultrasonics 2020, 108, 106227. [Google Scholar] [CrossRef]
  116. Monchalin, J.-P. Laser-Ultrasonics: Principles and Industrial Applications. Available online: https://www.ndt.net/article/ndtnet/papers/laser-ultrasonics-principles-and-industrial-applications.pdf (accessed on 24 May 2024).
  117. Chauveau, D. Review of NDT and Process Monitoring Techniques Usable to Produce High-Quality Parts by Welding or Additive Manufacturing. Weld. World 2018, 62, 1097–1118. [Google Scholar] [CrossRef]
  118. Slotwinski, J.A.; Garboczi, E.J.; Hebenstreit, K.M. Porosity Measurements and Analysis for Metal Additive Manufacturing Process Control. J. Res. Natl. Inst. Stand. Technol. 2014, 119, 494. [Google Scholar] [CrossRef]
  119. Peralta, A.D.; Enright, M.; Megahed, M.; Gong, J.; Roybal, M.; Craig, J. Towards Rapid Qualification of Powder-Bed Laser Additively Manufactured Parts. Integr. Mater. Manuf. Innov. 2016, 5, 154–176. [Google Scholar] [CrossRef]
  120. Zenzinger, G.; Bamberg, J.; Ladewig, A.; Hess, T.; Henkel, B.; Satzger, W. Process Monitoring of Additive Manufacturing by Using Optical Tomography. In Proceedings of the Review of Progress in Quantitative Nondestructive Evaluation, Boise, ID, USA, 20–25 July 2014; AIP Publishing LLC: Long Island, NY, USA, 2015. [Google Scholar]
  121. Waller, J.M.; Parker, B.H.; Hodges, K.L.; Burke, E.R.; Walker, J.L. Nondestructive Evaluation of Additive Manufacturing State-of-the-Discipline Report; NASA: Washington, DC, USA, 2014. [Google Scholar]
  122. Senck, S.; Happl, M.; Reiter, M.; Scheerer, M.; Kendel, M.; Glinz, J.; Kastner, J. Additive Manufacturing and Non-Destructive Testing of Topology-Optimised Aluminium Components. Nondestruct. Test. Eval. 2020, 35, 315–327. [Google Scholar] [CrossRef]
  123. du Plessis, A.; Tshibalanganda, M.; le Roux, S.G. Not All Scans Are Equal: X-Ray Tomography Image Quality Evaluation. Mater. Today Commun. 2020, 22, 100792. [Google Scholar] [CrossRef]
  124. Miles, Z.; Aydogan, B.; Huanes-Alvan, G.; Sahasrabudhe, H.; Chakrapani, S.K. Characterizing the As-Fabricated State of Additively Fabricated IN718 Using Ultrasonic Nondestructive Evaluation. Appl. Sci. 2023, 13, 8137. [Google Scholar] [CrossRef]
Figure 1. The formation mechanism of the keyhole. Reprinted with permission from ref. [39], 2020, Elsevier Ltd.
Metals 14 00669 g001
Figure 2. A schematic illustration of in situ techniques utilized in metal LPBF, where HS stands for high speed, DIC represents digital image correlation, and DSLR refers to digital single-lens reflex.
Metals 14 00669 g002
Figure 3. Schematic of multispectral photodiode sensor system. Adopted from ref. [69], 2024, Taylor & Francis Ltd.
Metals 14 00669 g003
Figure 4. Three-dimensional DIC setup and working principle. Reprinted with permission from ref. [74], 2020, Elsevier Ltd.
Metals 14 00669 g004
Figure 5. Outline of the future direction for a potential optical in situ monitoring system. Reprinted with permission from ref. [77], 2020, Elsevier Ltd.
Metals 14 00669 g005
Figure 6. Schematic representation of the off-axis dual wavelength imaging pyrometer setup. Reprinted with permission from ref. [80], 2020, Elsevier Ltd.
Metals 14 00669 g006
Figure 7. Workflow of detection mechanisms utilized by Smoqi et al. Reprinted with permission from ref. [80], 2020, Elsevier Ltd.
Metals 14 00669 g007
Figure 8. Schematic representation of the dual pyrometer setup. The diagram illustrates the instrumented on-axis sensor configuration for an EOS M290 LPBF system. The system comprises three photodetectors. Thermal Energy Planck (TEP) signatures are obtained by bandpass filtering two of the photodetectors. The third photodetector, which is unfiltered, measures the Thermal Energy Density (TED), capturing broadband emissions from the chamber. Reprinted with permission from ref. [82], 2020, Elsevier Ltd.
Metals 14 00669 g008
Figure 9. Schematics of pyrometer and high-speed camera monitoring system. Reprinted with permission from ref. [89], 2020, Elsevier Ltd.
Metals 14 00669 g009
Figure 10. The diagram illustrates the high-speed video camera sensing setup using two wavelengths (a). Representative high-speed video camera frames captured at 700 nm and 950 nm are shown in (b,c), respectively. The temperature field image produced by combining high-speed video camera frames captured at the two wavelengths is represented in (d). Reprinted with permission from ref. [92], 2020, Elsevier Ltd.
Metals 14 00669 g010
Figure 11. (a) An experimental construction chamber with labeled components. (b) A simplified outline of the sample container during in situ melting. (c) Schematics of the substrate, powder particles, and melt track. (d) Schematic of the μCT sample scan. (e) Techniques for image processing. Reprinted with permission from ref. [99], 2020, Elsevier Ltd.
Metals 14 00669 g011
Figure 12. Design of a custom-built chamber for in situ three-dimensional (3D) imaging. Reprinted with permission from ref. [54], 2020, Elsevier Ltd.
Metals 14 00669 g012
Figure 13. Multi-sensor set up involving high-speed IR and X-ray camera. (a) Equipment arrangement at Beamline 32-ID-B, APS, Argonne National Laboratory. (b) Design of the testing room at Argonne National Laboratory’s Beamline 32-ID-B, APS. (c) Diagram showing the viewing angles for high-spatial, high-speed IR, and high-speed X-ray imaging, illustrating an increase in aspect ratio. Adapted from Ref. [103].
Metals 14 00669 g013
Figure 14. Schematic demonstration of a multi-sensor system involving optical and thermal monitoring. Adapted from Ref. [49].
Metals 14 00669 g014
Figure 15. An illustration of ex situ characterization methods capable of detecting porosities and defects in metal LPBF includes techniques such as scanning electron microscopy (SEM).
Metals 14 00669 g015
Table 1. Advantages and limitations of in situ monitoring systems.
Detectable
Minimum Size
AdvantagesLimitations
Optical methods>200 µ
-
Easily applicable to commercial machines
-
Effective for large defect detection
-
High spatial resolution
-
Unable to detect sub-surface defects.
Pyrometer
(thermal)
Keyhole size
-
Detection of sub-surface porosity
-
High correlation between thermodynamical phenomena and porosity enhances the effectiveness of this method
-
Unable to detect healed defects.
Acoustic methods (airborne)Keyhole size
-
3D pore detection
-
Ease of implementation into the powder bed chamber
-
Cost-effectiveness
-
Currently limited to a single-track dataset.
-
Unable to detect healed defects.
Synchrotron X-ray imagingAs low as the resolution of the machine
-
3D pore detection
-
Detection of sub-surface porosity
-
Capable of detecting the formation of defects.
-
Capable of detecting subsurface non-healed defects.
-
Relatively expensive compared to alternative methods.
-
Time-consuming.
-
Challenging to implement on commercial machines.
-
Limited to use with specifically designed powder bed systems.
Table 2. Summary of ex situ techniques utilized in metal L-PBF.
Detectable
Minimum Size
AdvantagesLimitations
Optical and SEMAs low as the resolution achievable with microscopy.Can provide a detailed characterization of the defect.
-
Subjected to cross-sectional analysis
-
Destructive
Archimedes-
-
Simple, rapid, and cost-effective to apply
-
Non-destructive
Only gives overall density and the sum of concealed voids
Laser Ultrasound100 micron above
-
Non-destructive
-
3D pore detection
Currently limited to simple geometries
X-rayAs low as the resolution of the machine.
-
-3D detection of defects
-
Capable of scanning complex geometries.
-
Relatively expensive compared to alternative methods.
-
Time-consuming.
Table 3. An overview of the monitoring techniques used in L-PBF.
In situ
Monitoring Techniques
Observable Defect TypesPore Size Range (µm)Ex situSensorMLRefs.
Optical methodsLOF>200XCTDSLRCNN[76,77]
--XCTPhotodiode-[69]
--XCTDSLR-[73]
LOF>250SEMDIC-[74]
---Spectroscopy-[75]
Pyrometer (thermal)--XCTPyrometer-[52]
LOF-XCTPyrometerKNN[80]
LOF-SEMLWIR-[87]
--XCTSWIR-[81]
Planted>100XCTPhotodiodes-[82]
Irregularities-OpticalIR-[88]
--OpticalPyrometerSeDANN[89]
Irregularities-OpticalIR-[90]
Planted>120XCTPyrometer-[91]
Keyhole-XCTHS CameraSVM + MLP[92]
Acoustic methodsKeyhole-XCTMicrophoneSVM[98]
Synchrotron X-ray imagingKeyhole10–60XCTHS X-Ray-[99]
LOF--X-Ray-[54]
Keyhole--HS X-Ray-[100]
Spatter--CT–OT-[102]
Multi-sensor methodsKeyhole--HS X-ray + IR-[103]
LOF-XCTNIR + MWIR-[49]
Disclaimer/Publisher’s Note: The statements, opinions and data contained in all publications are solely those of the individual author(s) and contributor(s) and not of MDPI and/or the editor(s). MDPI and/or the editor(s) disclaim responsibility for any injury to people or property resulting from any ideas, methods, instructions or products referred to in the content.

