Abstract
During continuous slab casting, strand electromagnetic stirring (S-EMS) has a significant effect on improving the slab quality. In the current work, a numerical model based on the practical slab continuous casting machine and coupled electromagnetic field, flow field, solidification, and solute transport was established to investigate and evaluate the effect of the S-EMS installation position with various current intensities on metallurgical behavior. The model was verified by magnetic field measurement, infrared camera, and nail shooting experiments. The results show that moving the S-EMS installation position to the solidification end reduces the stirring effect due to the skin effect and the increasing thickness of the slab shell. A higher installation position is beneficial for improving the equiaxed grain rate, while a lower one is beneficial for reducing carbon segregation. The maximum segregation index and range decrease from 1.26 to 1.2 and from 0.42 to 0.36 with the installation position being decreased from −3 m to −12.8 m, respectively. The industrial trials show that S-EMS installed at 3 m has a significant effect on expanding the equiaxed grain zone and a deteriorating effect on reducing carbon segregation.
1. Introduction
During the continuous casting (CC) process of steel, central segregation at the strand center has a detrimental effect on the final steel product properties, which usually results from an uneven solute distribution [1,2,3]. Thus, reducing or eliminating the center segregation of strand is a key measure to improve final quality. Based on the mechanism of center segregation, many technologies such as electromagnetic stirring (EMS) [4,5], light or hard reduction [6,7,8], and low superheat pouring have been proposed and have achieved positive results.
As a non-contact flow control method, EMS technology has been widely used in the CC process [9,10,11]. According to the various installation positions, it can be classified into mold electromagnetic stirring (M-EMS) [12,13], strand electromagnetic stirring (S-EMS) [14], and final electromagnetic stirring (F-EMS) [15]. For the slab caster, S-EMS is an important way to increase the equiaxed grain rate and reduce center segregation. Nowadays, many studies, especially using numerical simulations, have been conducted to investigate the effect of S-EMS on metallurgical behavior. Xiao et al. [16] numerically studied the effect of roll-type EMS on thermal and flow fields, finding that the strong washing effect reduced the solidification rate of the slab shell and enhanced the dissipation of superheated molten steel. Wang et al. [17] also found the remelting phenomenon of the billet shell and the slow solidification rate in the center of the stirrer. Gong et al. [14] analyzed the transient electromagnetic features of roll-type EMS, finding that the transient induced electromagnetic force (EMF) travels toward the magnetic flux shifting direction and that there is an optimum frequency to achieve the best stirring effect. Dong et al. [18] found that M-EMS only homogenized the solute in mold and has a little effect on reducing center segregation. They believed that S-EMS and F-EMS were required to improve center segregation.
Song et al. [19] carried out a transient analysis based on a slab caster to investigate the turbulent flow, temperature field, and solidification of molten steel during the process of CC with S-EMS, finding that S-EMS quickly makes the temperature uniform in a liquid pool of strand. Liu et al. [20] conducted a study on the flow pattern and solidification process in a continuous caster equipped with EMS. They examined the effect of stirring parameters and installation position of EMS on flow behavior and solidification. Their findings revealed that the thickness of the solidified shell plays a crucial role in determining the stirring position and the tangential velocity at a given stirring intensity. Wang et al. [21] analyzed the variation of shell thickness and the central solid fraction in strand, pointing out that the location of S-EMS and F-EMS was crucial for improving macro-segregation.
Recently, significant attention has been dedicated to solute diffusion, which is a key transport phenomenon and has a significant influence on alleviating central segregation of slabs. Jiang et al. [22] investigated the slab columnar grain growth behavior by a numerical model comprising electromagnetic, fluid/dynamic, heat, and solute transport analyses, finding that the rotating EMS mode is more suitable than linear stirring for alleviating central segregation for slab continuous casting. Li et al. [23] studied the effect of industrial S-EMS on the solidification behavior of grain-oriented silicon steel and pointed out that EMS can refine the grain. However, the centerline segregation of carbon and silicon increases with the increase in S-EMS current intensity. They also pointed out that a larger columnar crystal region and a lower equiaxed crystal region are beneficial for improving central segregation. Chen et al. [11] found that the equiaxed crystal zone increased from 13.04% to 43.69% and the secondary dendrite arm spacing decreased from 245 μm to 179μm with the current intensity increasing from 0 A to 300 A. Wang et al. [9] also found that when the current intensity increased from 100 A to 390 A, the equiaxed grain ratio increased from 20.4% to 25.7% and the deflection angle of columnar grain increased from 25.0 to 32.49 degrees in many industrial trials.
Although EMS technology, especially for S-EMS, has been applied in many plants, the influence of the installation position on metallurgical behavior has been rarely reported in the literature. Therefore, our work aimed to investigate the effect of the S-EMS installation position with various current intensities on the flow field, temperature field, solidification, and segregation behavior of molten steel during the slab continuous casting process. Firstly, a three-dimensional numerical model based on a real S-EMS continuous casting machine of Pangang Group was built to investigate the electromagnetic field and verify the model. Then, numerical coupled electromagnetic, fluid/dynamic, heat, and solute transport analyses were conducted to investigate the influence of the S-EMS installation position with various current intensities on metallurgical behavior. Finally, the industrial trials based on steel grade E355 were conducted to investigate the equiaxed grain ratio and center segregation.
2. Model Description
In order to simplify the numerical model and reduce the calculation time, the following assumptions are made:
- The effect of molten steel on the electromagnetic field is ignored due to the low magnetic Reynolds number. Joule heat is ignored due to a low stirring frequency (<10 Hz) [24].
- The molten steel is regarded as incompressible fluid with constant physical parameters.
- The curved section of the continuous casting machine is assumed to be vertical, where the inner and outer arcs have the same drawing speed.
- The slag phase and mold oscillation are ignored.
2.1. Mathematical Model Description
2.1.1. Fluid/Dynamic Model
The flow of molten steel during continuous casting can be described by the following governing equations:
where ρ is the molten steel density, kg/m3; t is time, s; u is the velocity vector of molten steel, m/s; p is the local pressure, Pa; μ is the molecular viscosity, kg·m−1·s−1; μt is the turbulent viscosity, kg·m−1·s−1; g is the gravitational acceleration, m·s−2; S is the momentum source term, and it is written in the current study as
where, on the right side, are thermal buoyance, momentum sink, and EMF, in order; βT is thermal expansion coefficient, m3/K; T is the local temperature, K; Tl is the liquidus temperature, K; fl is the liquid fraction, non-dimensional; Amush is the mushy zone constant, which is set to 5 × 10⁸ in this simulation; uc is the pulling speed, m/s; Femf is calculated by solving Maxwell’s equations, N/m3.
The standard k-ε model with scalable wall functions is adopted to describe the turbulent behavior, where the transport equation for turbulent kinetic energy k and its dissipation rate ε can be written as
where G is the generation of turbulent kinetic energy due to the mean velocity gradients.
C1, C2, Cμ, σk, and σε are the empirical constants, whose values are 1.44, 1.92, 0.09, 1.0 and 1.3, respectively.
2.1.2. Heat Transfer Model
The enthalpy equation is adopted to describe the heat transfer model, and it can be written as follows:
where H is the total enthalpy, J; keff is the effectively thermal conductivity, W·m−1·K−1; SH is the source term, W·m−3; href is the reference enthalpy, J; cp is the specific heat, J·kg−1·K−1; L is the latent heat of molten steel, kJ/kg. The liquid fraction, fl, can be defined as
where Tl and Ts in K are the liquidus and solidus temperatures, respectively, which can be defined as
where mi is the liquidus slope of solute element i; ki is the equilibrium partition coefficient of element i.
2.1.3. Solute Transport Model
The carbon distribution during the casting process is solved based on the species transport model, which can be written as
where C is carbon concentration; Dla is the laminar diffusive coefficient; Sct is the turbulent Schmidt number, 0.7; Ss,dif and Ss,con are the molecular diffusion and the convection diffusion, respectively, and they are defined as
where Ds and Dl are the diffusion coefficients in solid and liquid states, respectively. The locally averaged concentration in solid Cs and in liquid Cl are given as follows:
2.1.4. Electromagnetic Model
The analysis of the harmonic electromagnetic field including the distribution of Lorentz force, magnetic flux density, and induced current density is obtained by solving the Maxwell equations and constitutive equations [25], and they can be rewritten as follows:
where E is the electric field intensity, V m−1; B is the magnetic flux density, T; H is the magnetic intensity, A m−1; J is the current density, A m−2; σ is the electric conductivity, S m−1; and η is the magnetic permeability, H m−1. The time-averaging Lorentz force density resulting from the interaction of induced current with magnetic field can be obtained with the following equation:
where Re denotes the real part of a complex number.
2.2. Numerical Model and Boundary Conditions
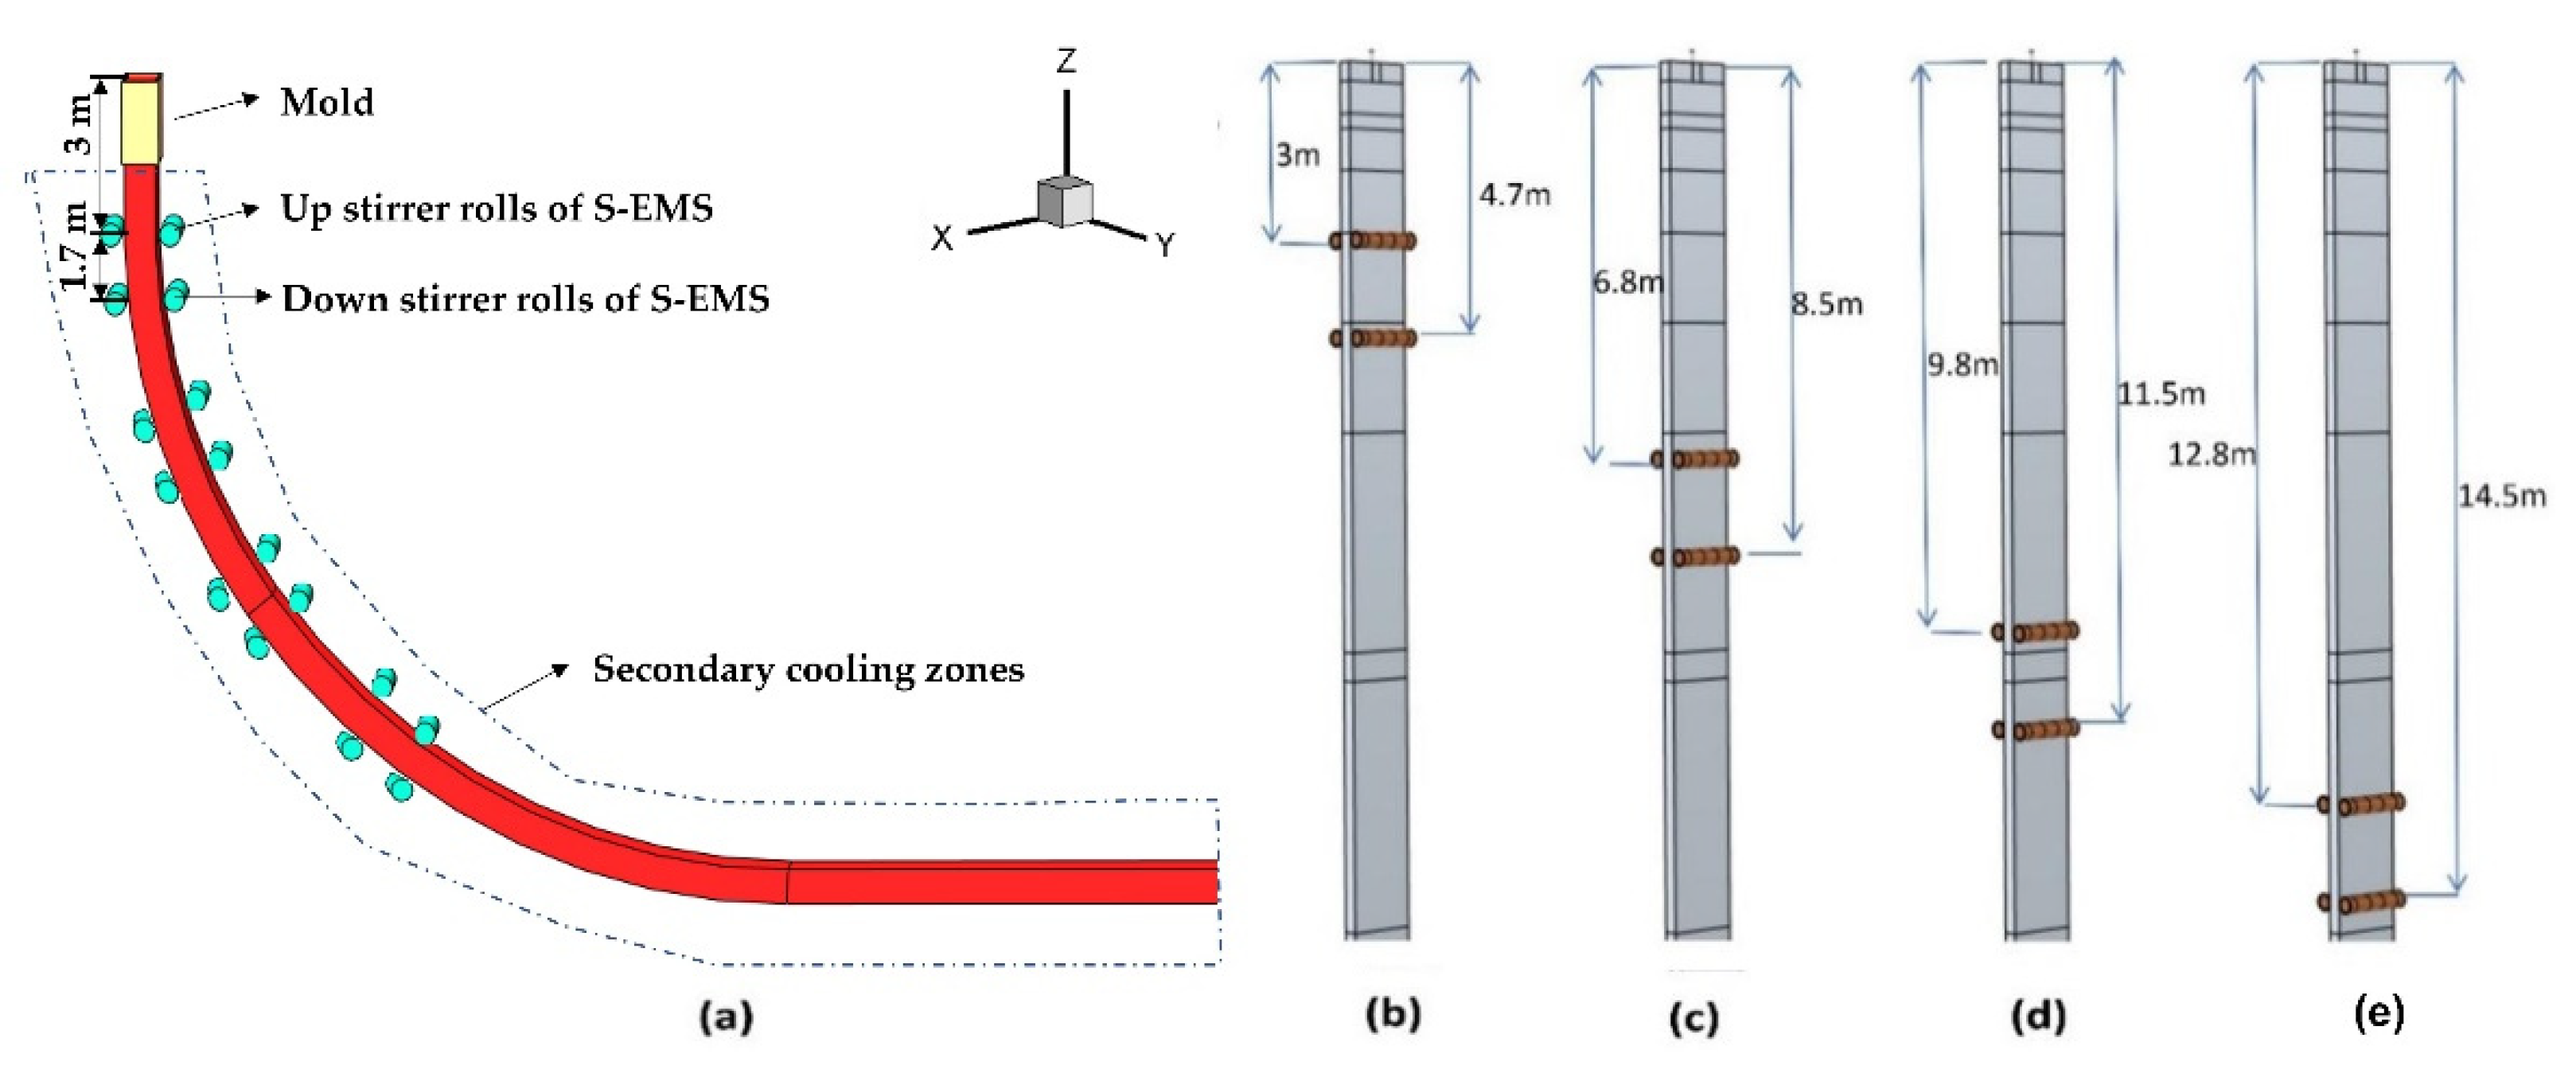
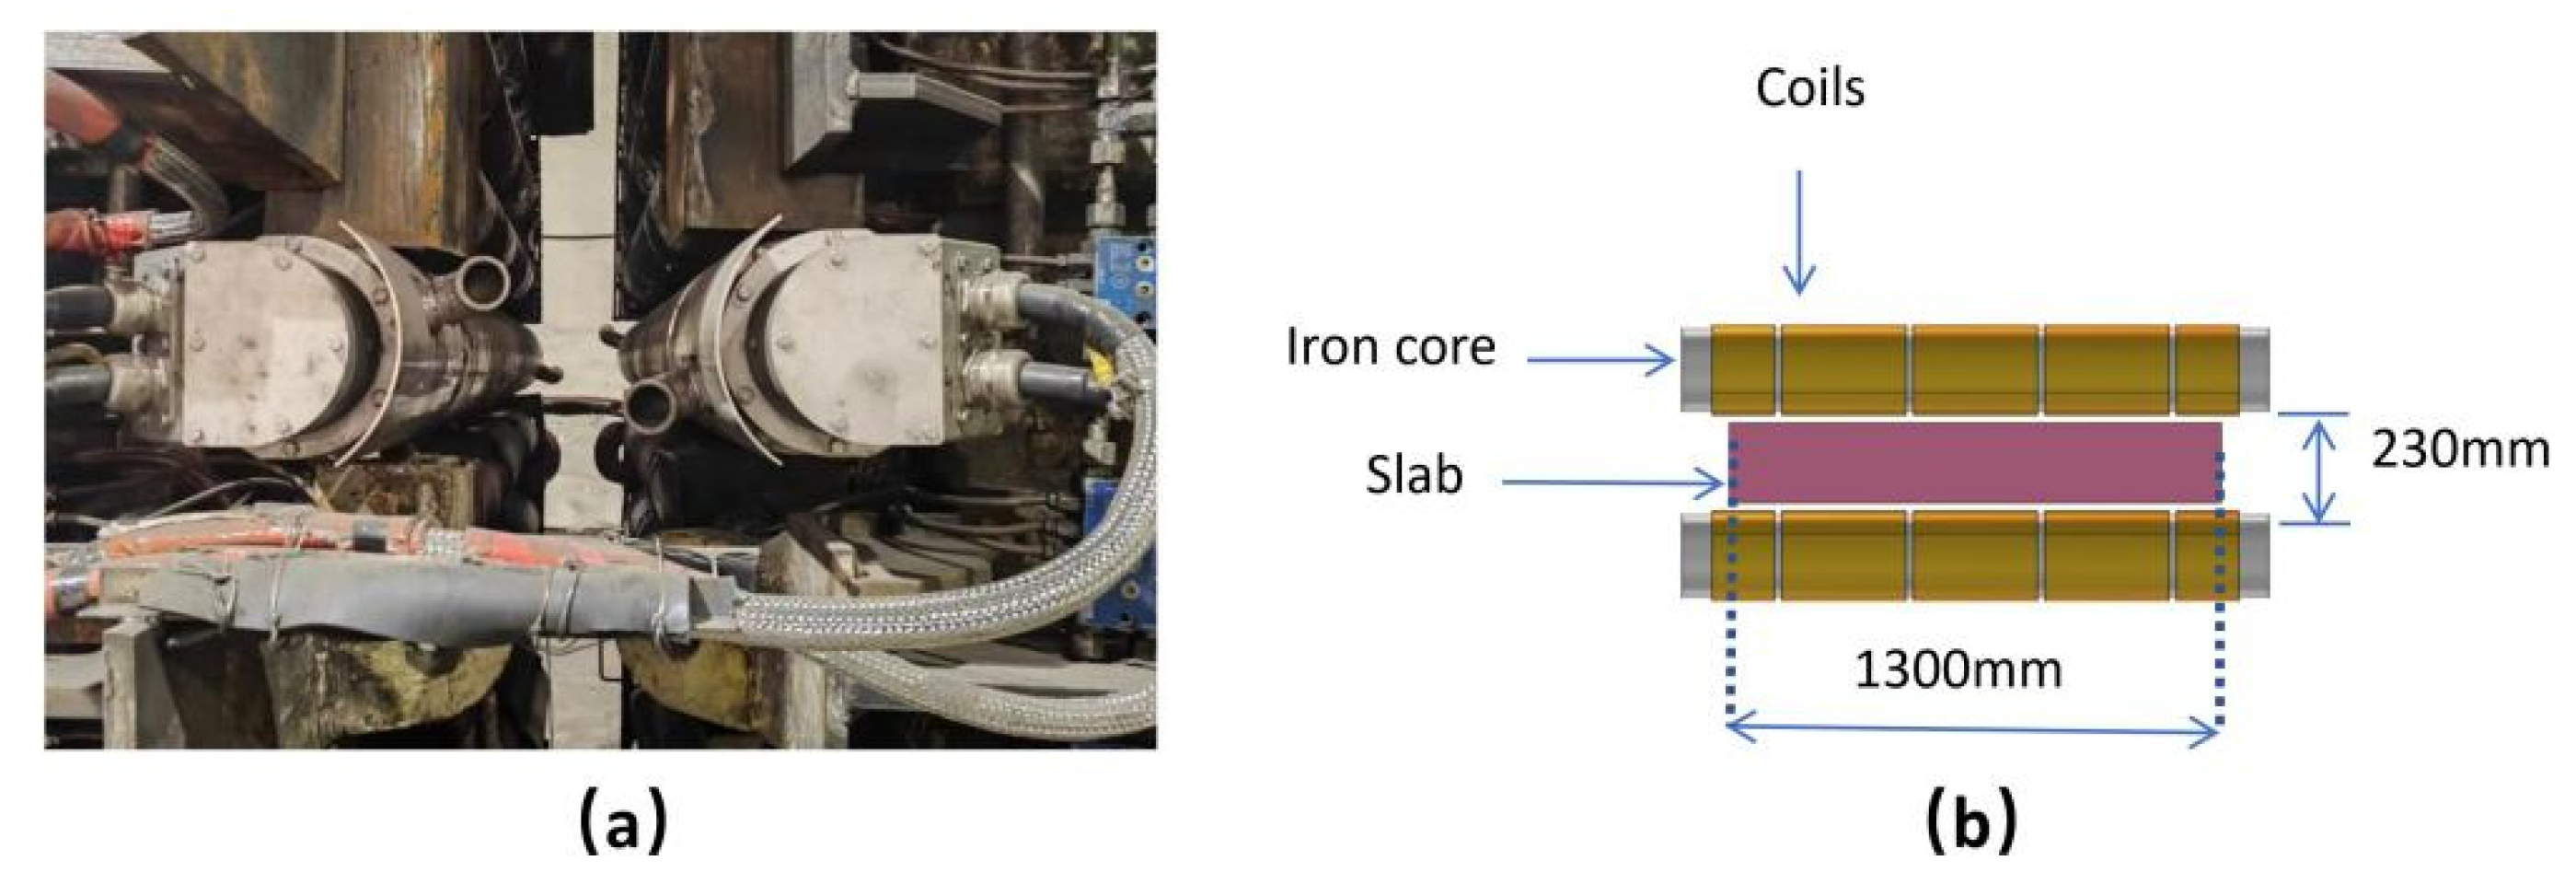
Figure 1 shows the geometry diagram of a real continuous caster with S-EMS and S-EMS roller installation positions that are analyzed in the current study. The cross-section of the slab is 1300 × 230 (mm × mm), and the pulling speed is 1.2 m/min. The structure of S-EMS rollers is shown in Figure 2. The coils of the rollers adopt Kramer winding with five magnetic poles, and each pair of poles has a phase angle difference of 90°.
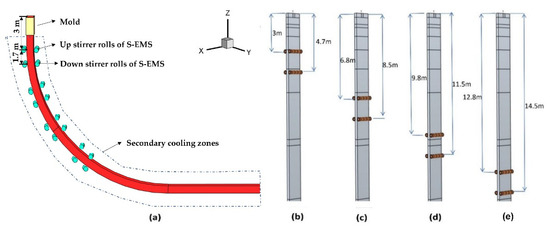
Figure 1.
Geometry diagram of continuous caster with S-EMS (a) and installation position of S-EMS rollers (b–e).

Figure 2.
Diagram of S-EMS rollers (a) and roller structure (b).
Figure 1 shows the geometry diagram of a real continuous caster, with the four selectable positions for the installation of the S-EMS rolls being clearly marked. Experimental results indicate that the segregation and grain structure differences between the inner arc side and the outer arc side of the strand in the curved caster are minimal, showing a certain symmetry [26]. Therefore, in this study, we simplified the curved caster to a vertical caster. The slab cross-section is 1300 × 230 mm², and the casting speed is 1.2 m per minute. The structure of the S-EMS roll is shown in Figure 2. The coil of the roll uses Kramer winding, with five magnetic poles, and the current phase angle of each pair of magnetic poles differs by 90°.
A three-dimensional model with the whole size of a real slab continuous caster was established, as shown in Figure 3. The computational domain is 24.8 m from mold to the estimated solidification end and is divided into hexahedral grids, totaling 3,370,836 grids. A rectangular nozzle with a cross-section of 86 × 45 (mm × mm) is used, and the immersion depth and angle are 210 mm and −15°, respectively. The mold length is 800 mm, and the coordinate origin is located at the center of the top face of the mold.
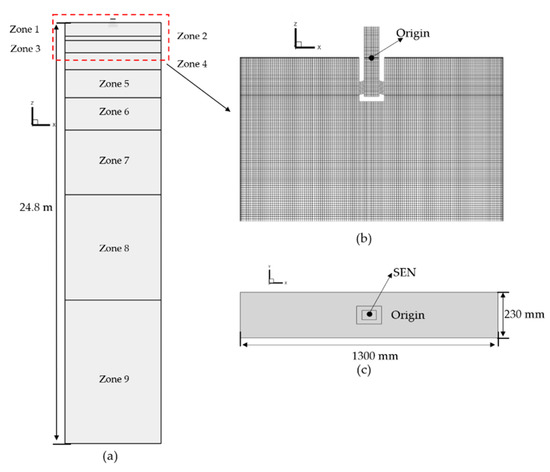
Figure 3.
Diagram of numerical model (a); mesh (b); and nozzle (c).
The cooling conditions of the mold and slab are crucial for accurately simulating the solidification, flow field, and segregation behavior of molten steel. In order to model the actual cooling conditions, the computational domain shown in Figure 2a is divided into 9 zones with different equivalent heat transfer coefficients, where zone 1 is for the mold region and zones 2–9 are for the different water cooling and radiation regions. The heat transfer coefficients for zone 1 and zones 2–9 are as follows:
where hequ is the equivalent heat transfer coefficient, w·m−2·k−1; Tw is the ambient temperature, and it is set to 30 °C (303 K); Tf is the shell temperature that is decided by the thermal transport inner slab, K.
During the calculation, the velocity inlet boundary condition was applied to the SEN inlet, and the outflow boundary was calculated at the outlet. The non-slip wall boundary was used for the SEN wall, as well as for the narrow and wide sides of the mold. The meniscus was defined as free-slip wall boundary condition. The SIMPLEC algorithm was adopted to solve the complicated transient problem. To achieve better convergence, a dynamic timestep was adopted, which increased from 0.001 s in the initial stage to 0.05 s in the steady stage. Calculation convergence was achieved when all residuals were lower than 10−4. The computational procedure is shown in Figure 4. The electromagnetic field was analyzed by ANSYS APDL. The EMF density was abstracted and interpolated in the momentum equation of the flow field by means of a user-defined function. The analyses, including electromagnetic, fluid/dynamic, heat, and solute transport, were conducted using ANSYS 2021 R1(ANSYS Inc., Canonsburg, PA, USA).
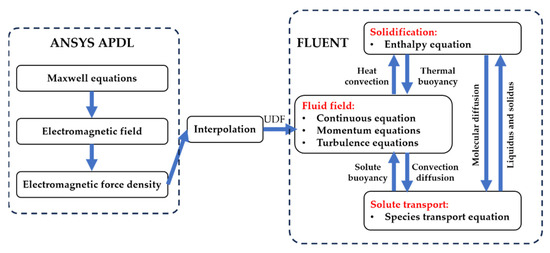
Figure 4.
Computational procedures for the transient problem.
E355 (C: 0.17 wt%, Si: 0.23 wt%, Mn: 0.55 wt%, P: 0.013 wt%, S: 0.007 wt%) was chosen as the testing steel grade. The pouring temperature was 1827 K; the physical parameters and other related continuous casting processes are summarized in Table 1.

Table 1.
Parameters of molten steel and calculation conditions.
2.3. Model Validation
The magnetic induction intensity was chosen to verify the reliability of the electromagnetic simulation. The upper stirring rollers were selected as the measurement object, and the stirring mode was codirectional, which implied the stirring rollers on both sides of the slab produced EMF in the same direction. The central magnetic field was measured by a KANETEC TM-701 Gauss meter. Figure 5 shows the comparison between the measured values and the calculated values when the current is 320 A and the frequency is 5 Hz. As shown in Figure 5, the calculated values agree well with the measured values, which indicates that the electromagnetic model is accurate and reliable.
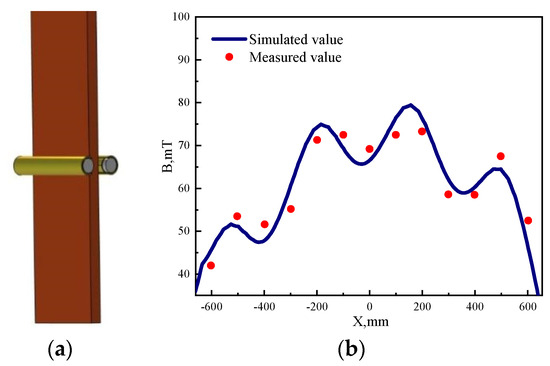
Figure 5.
Single pair of stirring rolls model (a) and magnetic induction intensity comparison between measured values and calculated values (b).
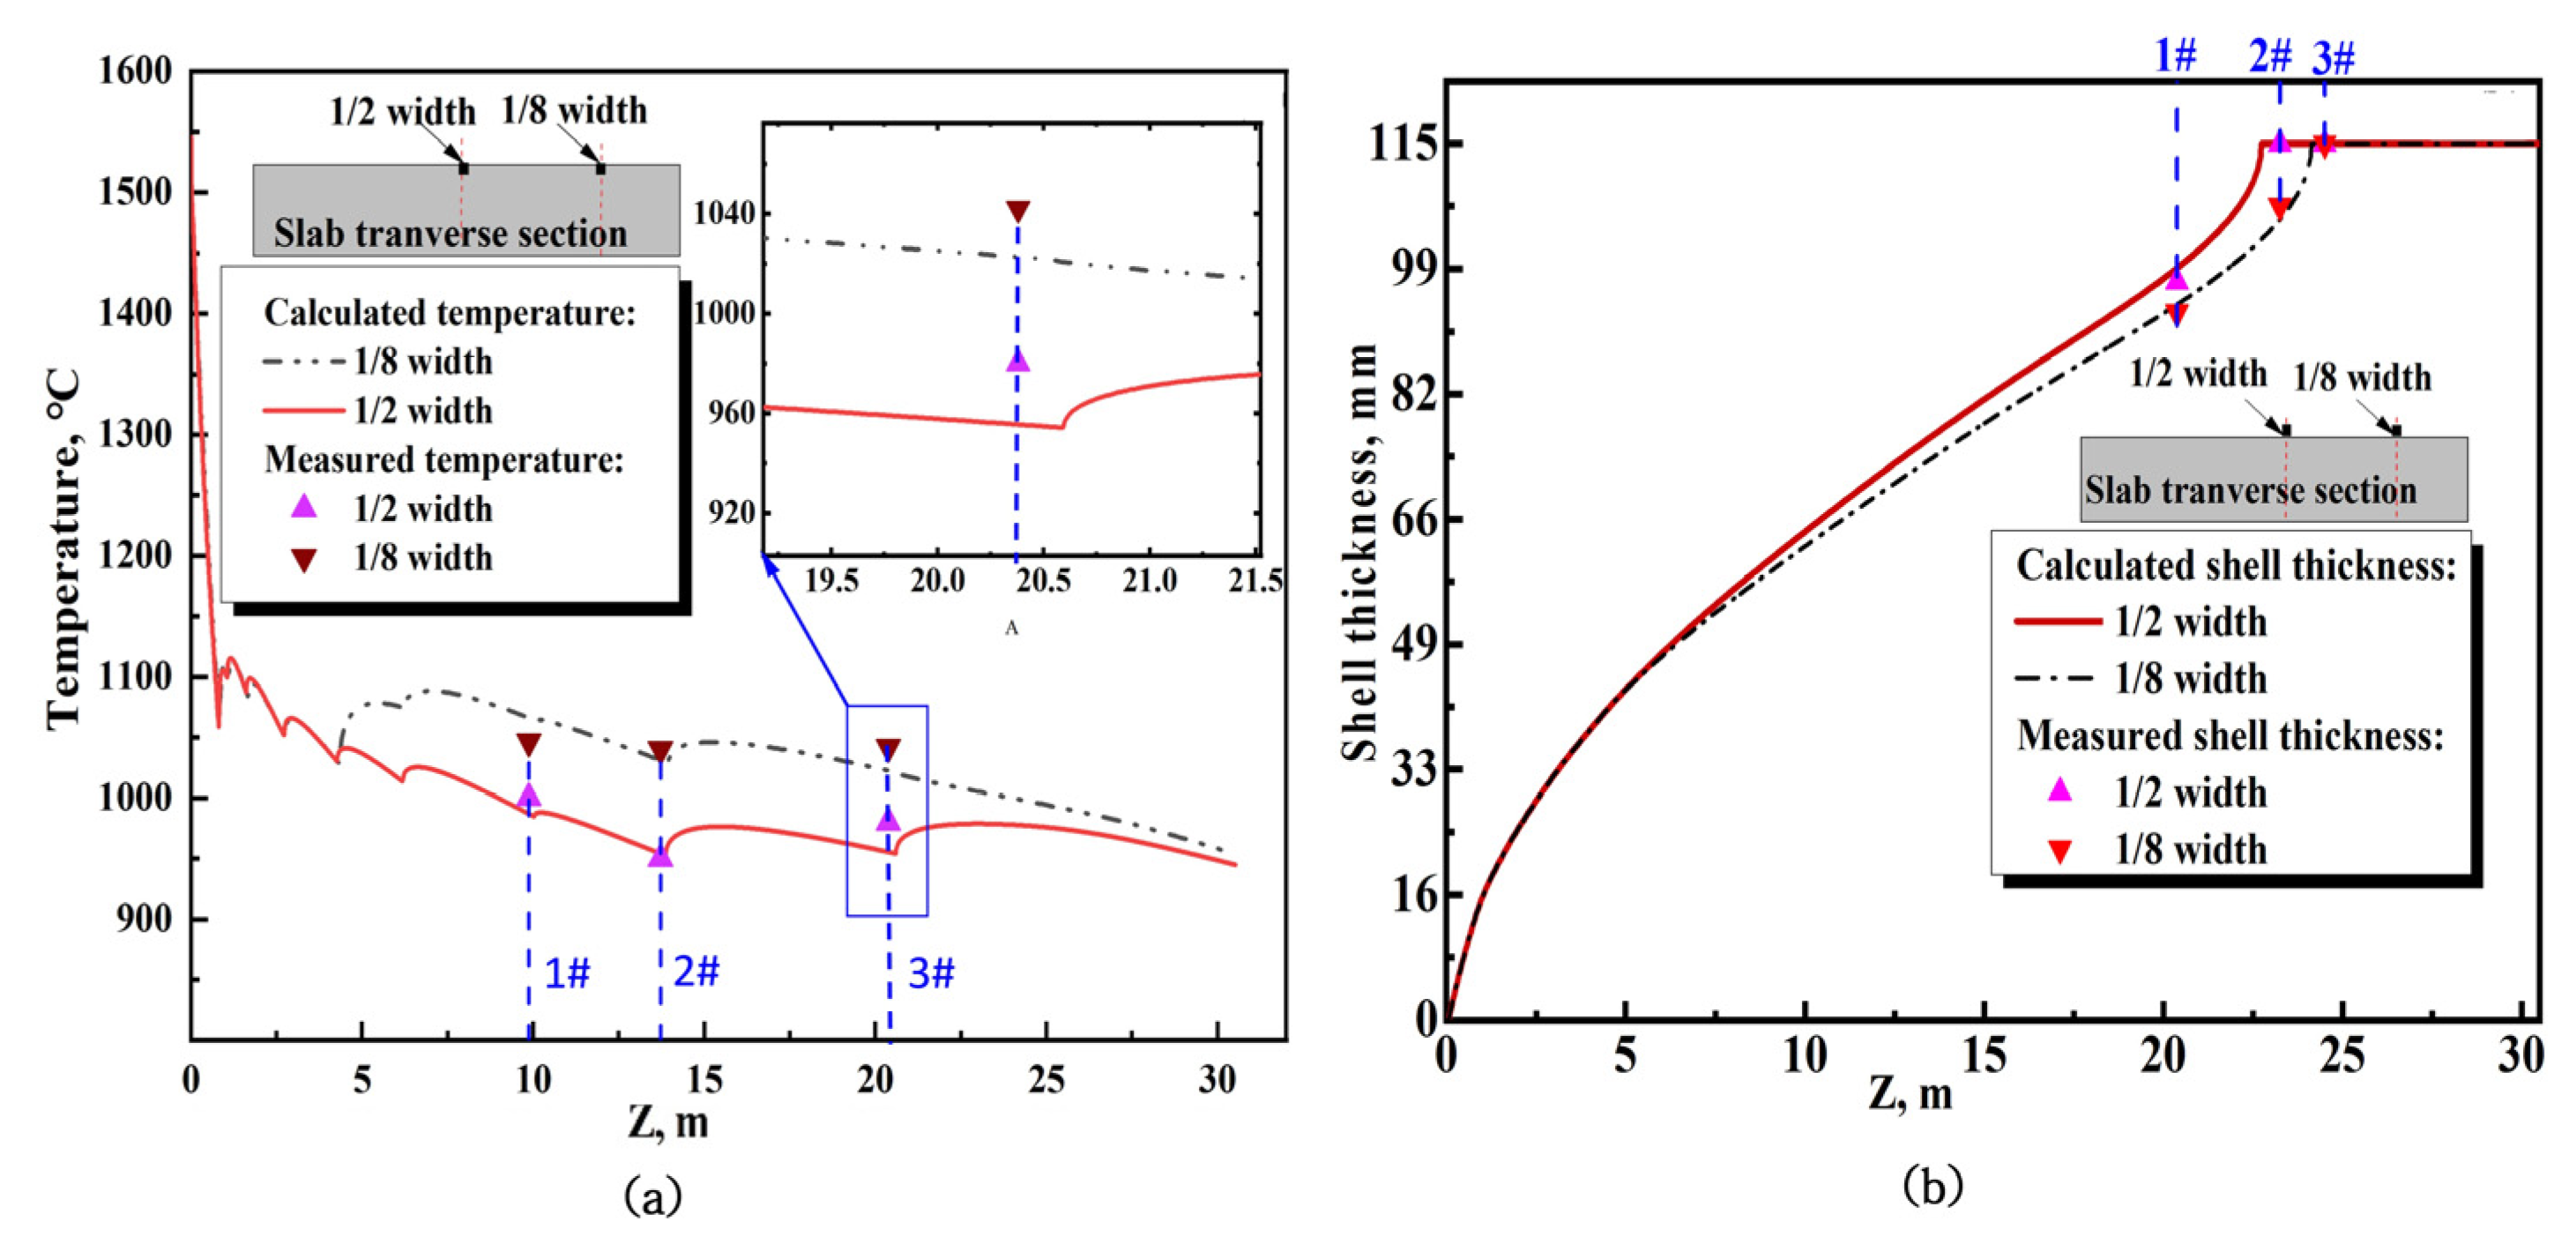
The heat transfer and solidification model was also validated by measuring the slab temperature and shell thickness at different locations on the inner curved face of the continuous caster using an infrared camera and nail shooting experiments. As shown in Figure 6, in which the temperature measurements of 1#, 2#, and 3# positions were 9.87 m, 13.72 m, and 20.38 m from the curved inner surface, respectively, and the thickness of billet shells was measured at the positions of 1#, 2#, and 3# from the curved inner surface as 20.38 m, 23.25 m, and 24.50 m. The calculation of shell thickness is based on the solidus temperature. Figure 6 shows the comparison between the measured values and the calculated values, which shows good agreement.

Figure 6.
Comparison between measured values and calculated values of slab temperature (a) and shell thickness (b).
3. Results and Discussion
3.1. Electromagnetic Field Analysis
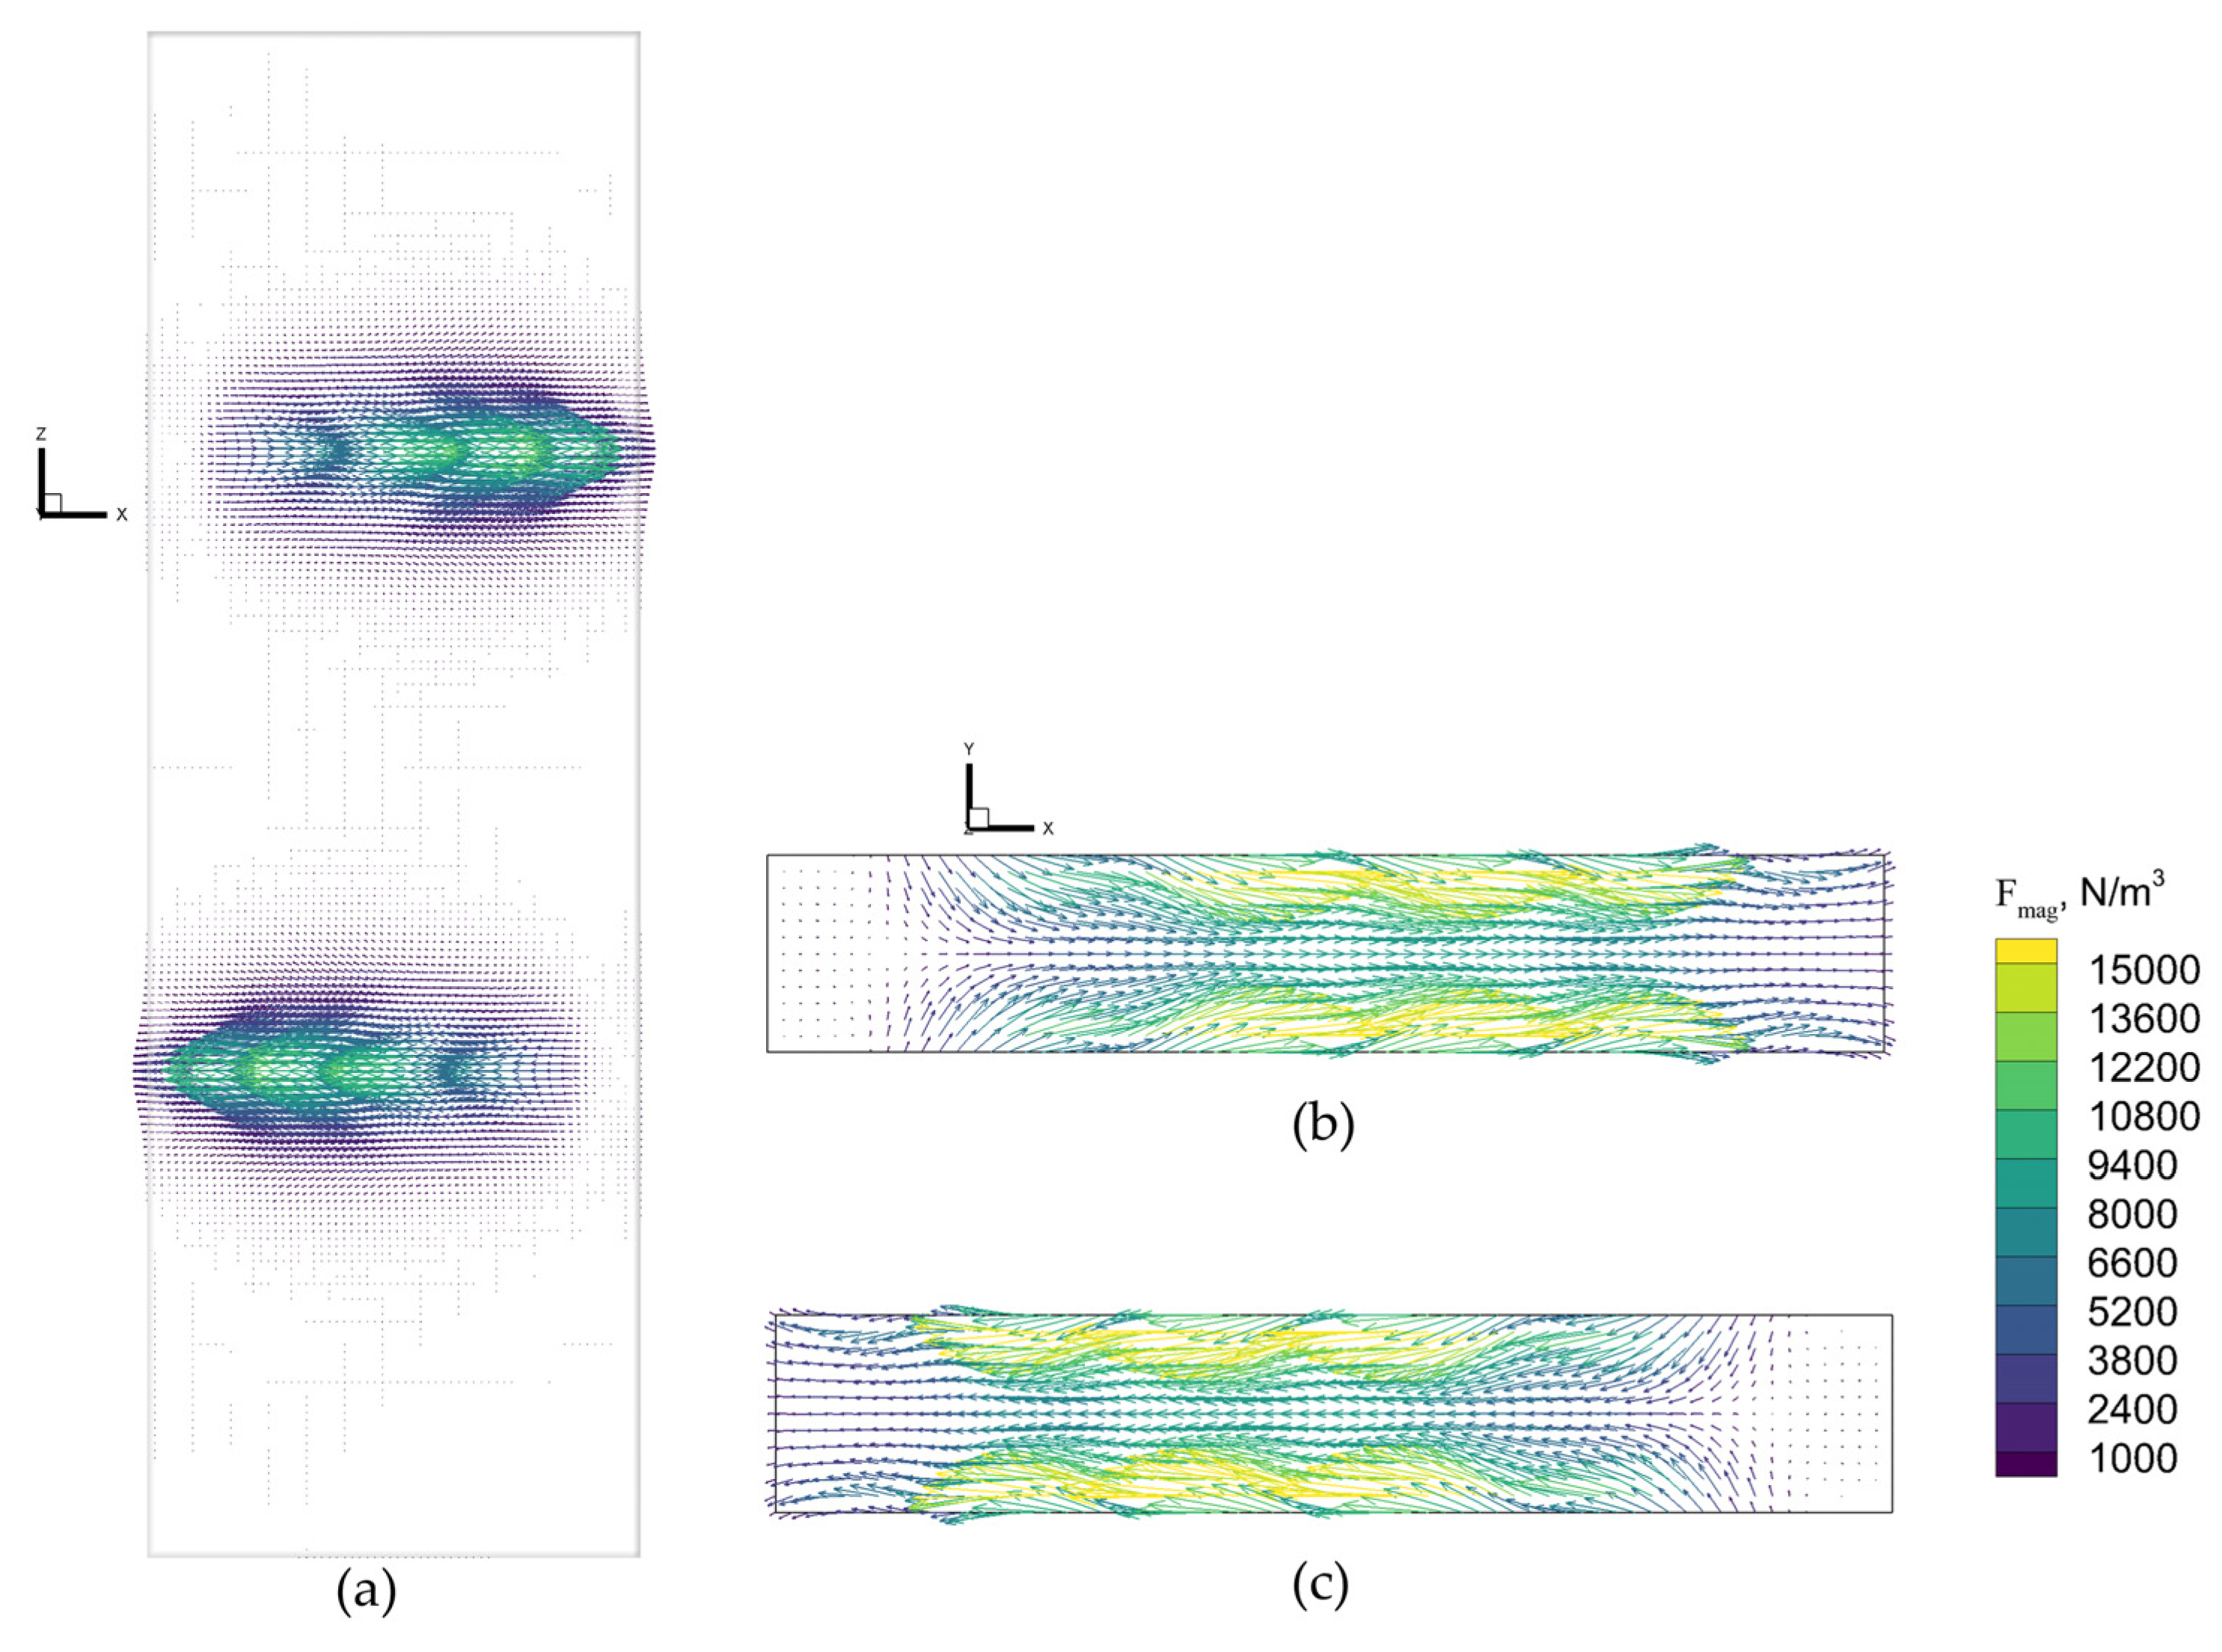
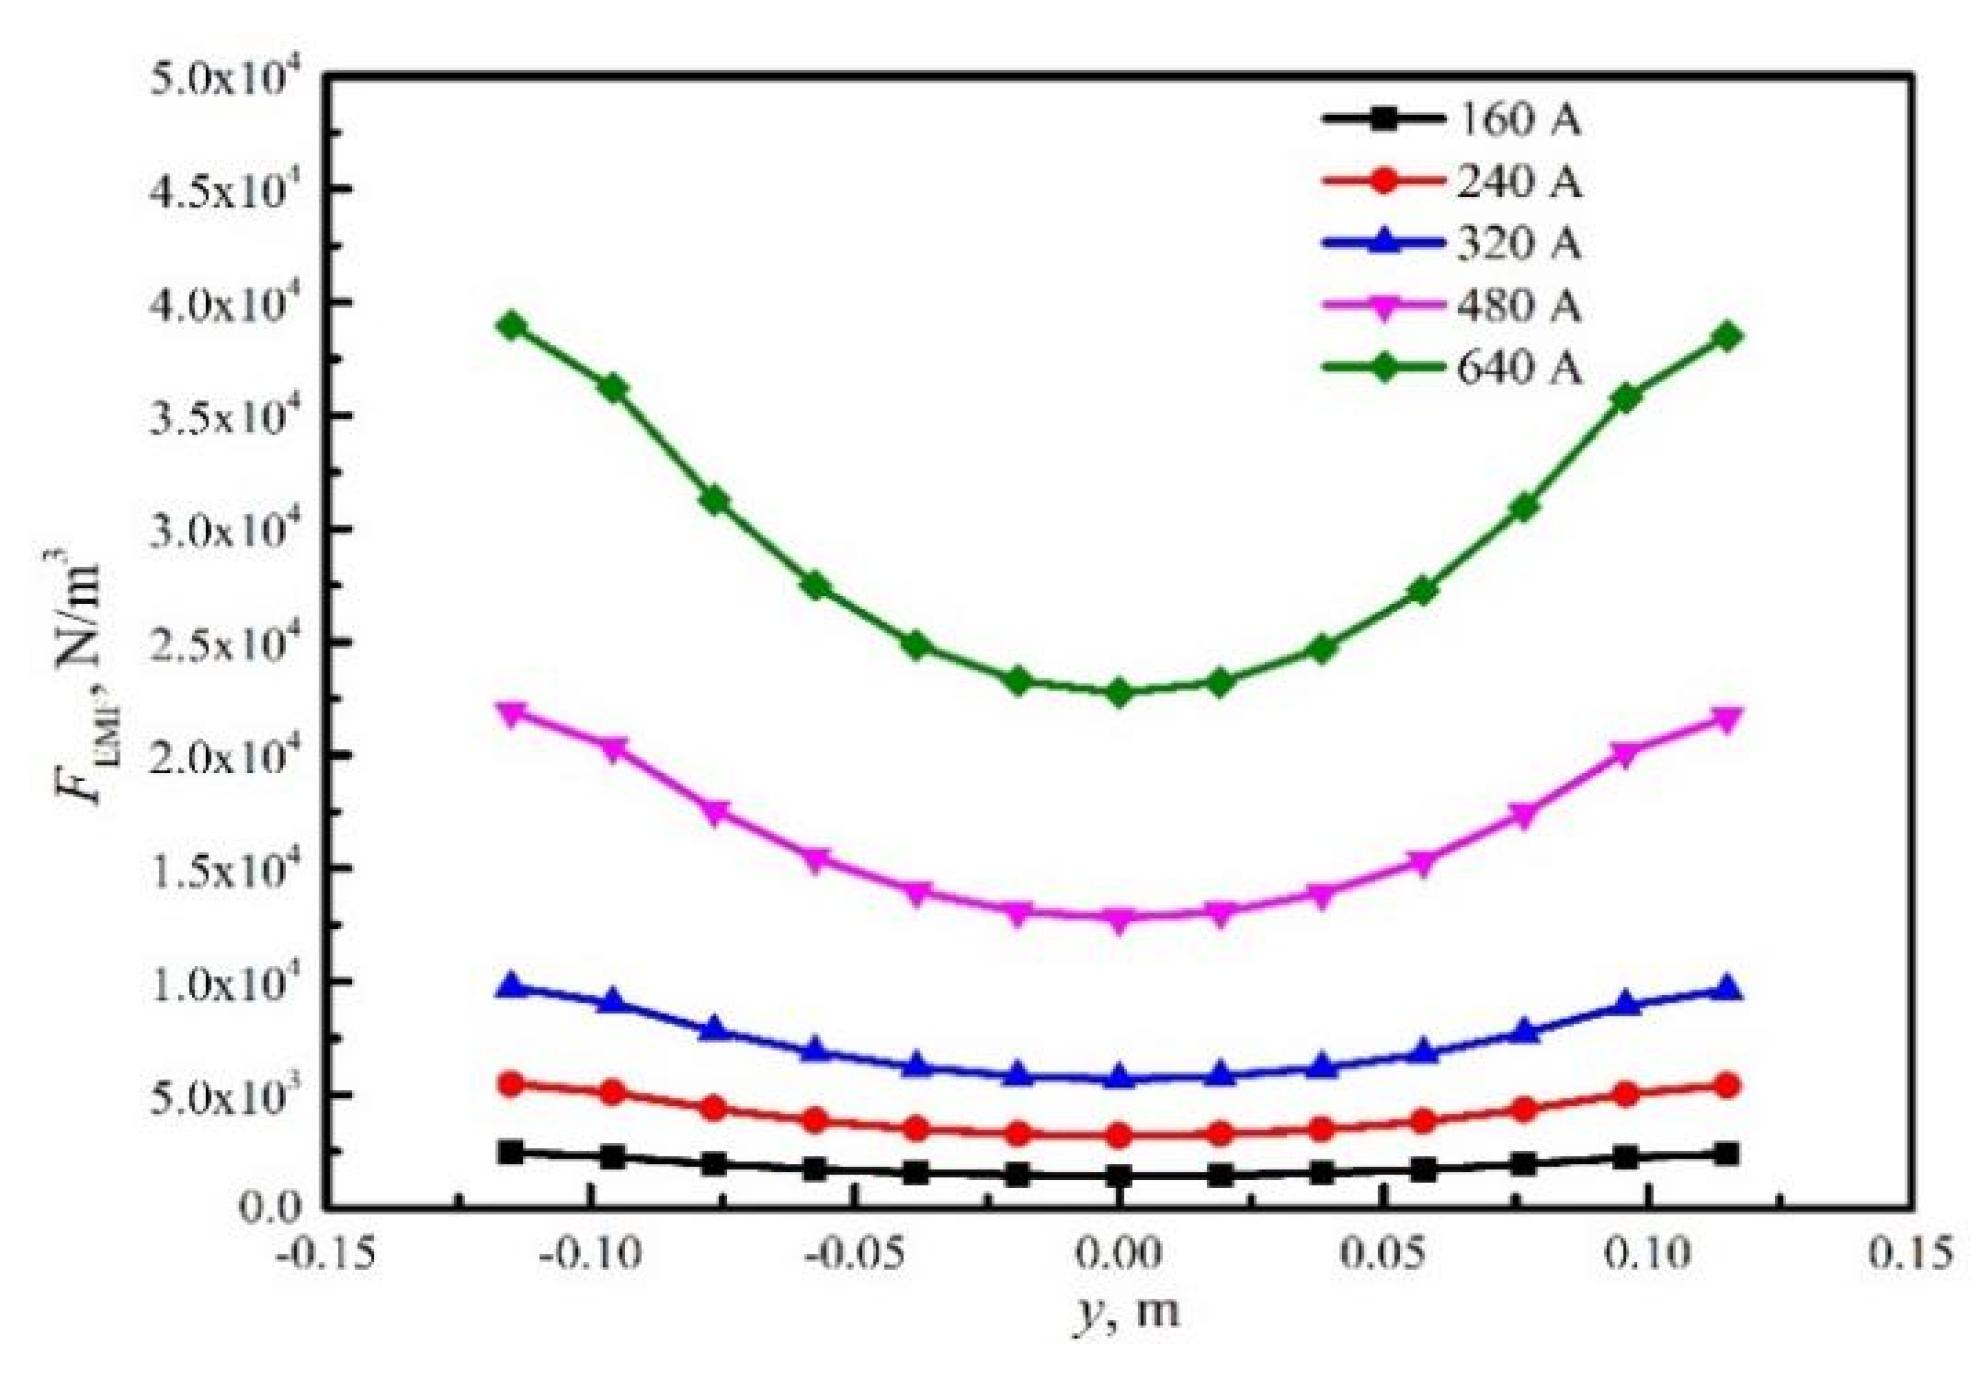
Figure 7 shows the distribution of EMF near the stirring rollers. The EMF induced by the upper stirring rollers points to the positive x-direction, while the lower stirring roller has an opposite direction. This will result in a circulating flow of molten steel between the two stirring rollers and improve the flow field in the slab. According to its distribution on the x-y section, EMF is mainly concentrated at the edges due to the skin effect. Figure 8 shows that the distribution of EMF along the y-direction varies with the current, where the maximum EMF increases from 2.5 × 10³ N/m3 to 3.8 × 10⁴ N/m3 with the increase in the stirring current from 160 A to 640 A, which will enhance the stirring effect in the slab.
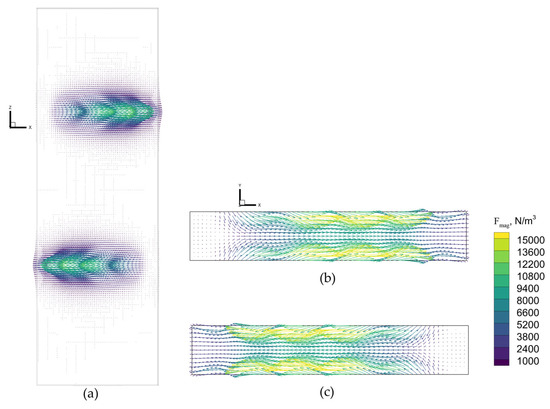
Figure 7.
Distribution of EMF on x-z section (a). Upper (b) and lower (c) EMS rollers on x-y section.
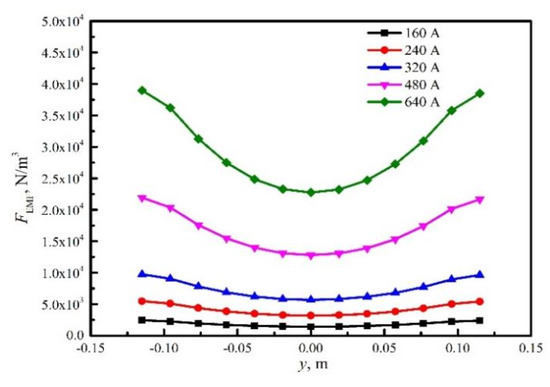
Figure 8.
Distribution of EMF under different current intensities along y direction at z = −3 m and x = 0 m.
3.2. Influence of S-EMS Position on Metallurgical Behavior
3.2.1. Flow Field and Temperature Field
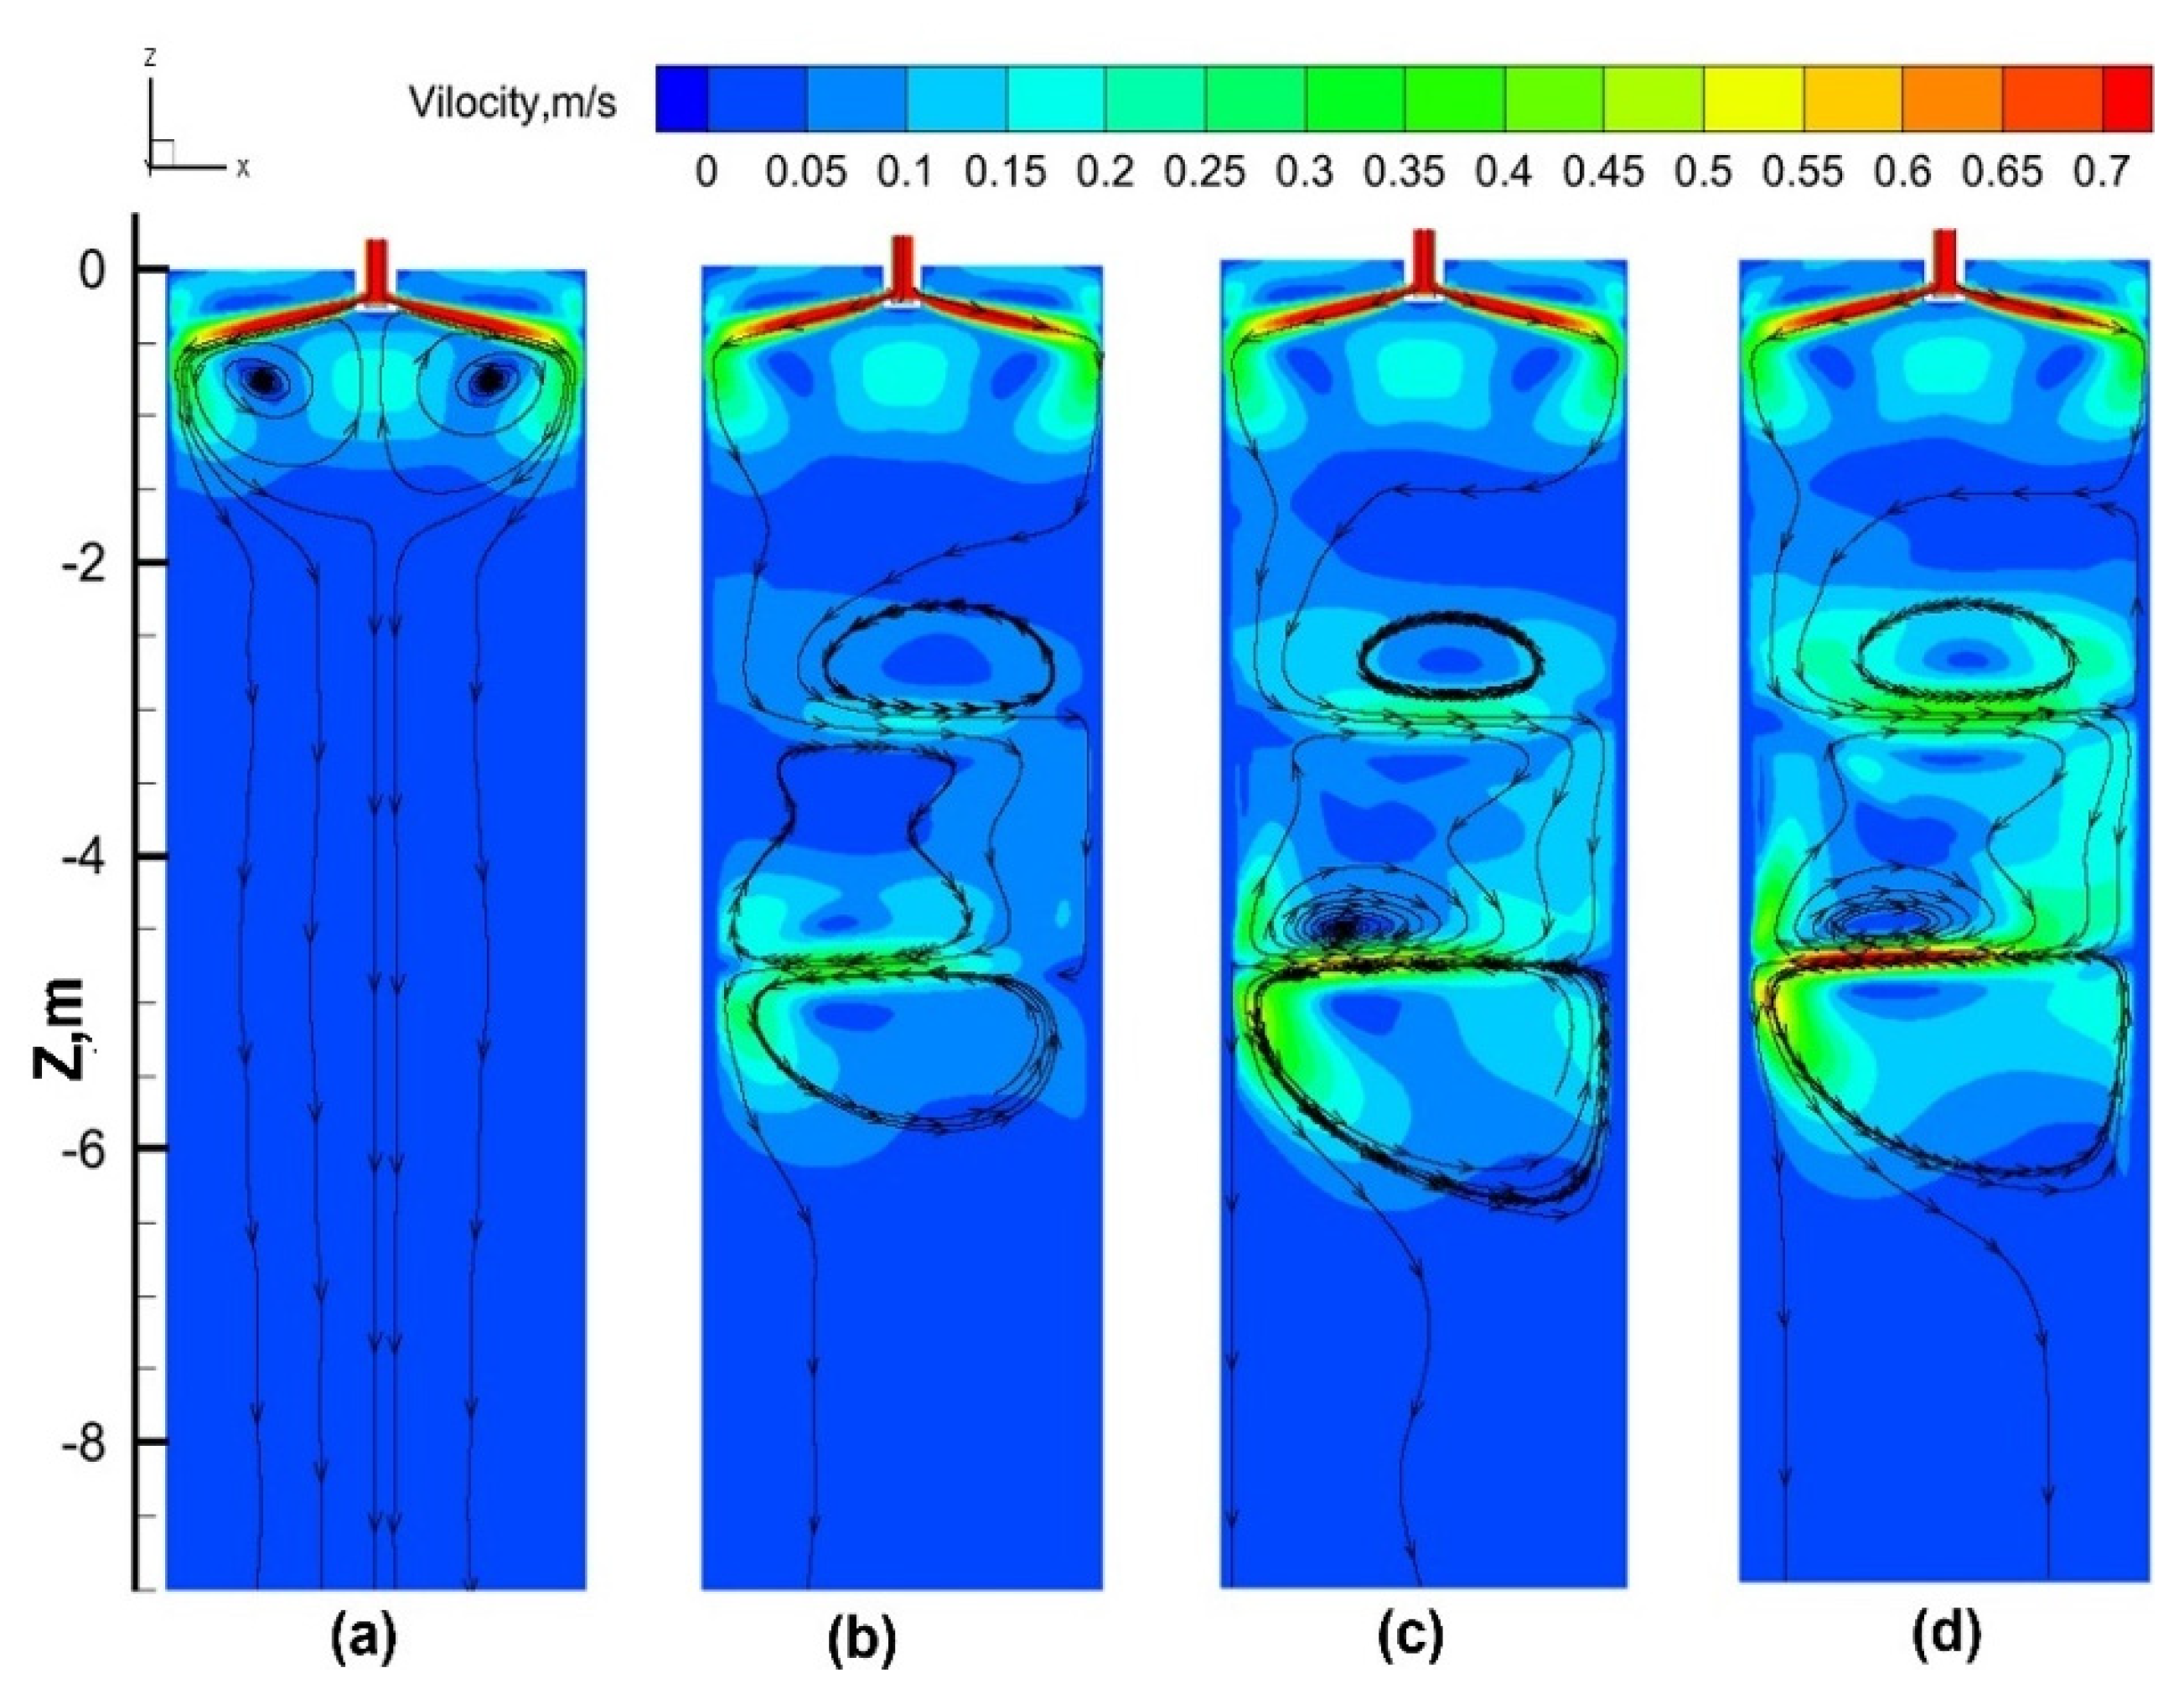
Figure 9 shows the velocity contour and streamlines of molten steel with different stirring currents when S-EMS is installed at 3.0 m. As shown in Figure 9a, when S-EMS is not applied, the molten steel with a high velocity is mainly concentrated in the mold, where the backflow formed by the jet impingements from SEN enhances the flow within the mold. Below the mold zone, the velocity of molten steel is relatively small and close to the pulling speed, which can easily cause segregation. With S-EMS applied, the velocity within the stirring zone is enhanced, and it increases with the increase in the stirring current. It is worth noting that the velocity near the upper stirring rollers is lower than that near the lower stirring rollers, because the backflow formed by the jet impingements enhances the dissipation of kinetic energy and weakens the directional flow driven by EMF. The center velocity near the upper and lower stirring rollers is extracted and shown in Figure 10. The molten steel velocity near the lower stirring rollers is 0.2 m/s higher than that near the upper stirring rollers.

Figure 9.
Comparison of the flow filed without stirring (a) and with EMS at 160 A (b); with EMS at 240 A (c); and with EMS at 320 A (d).
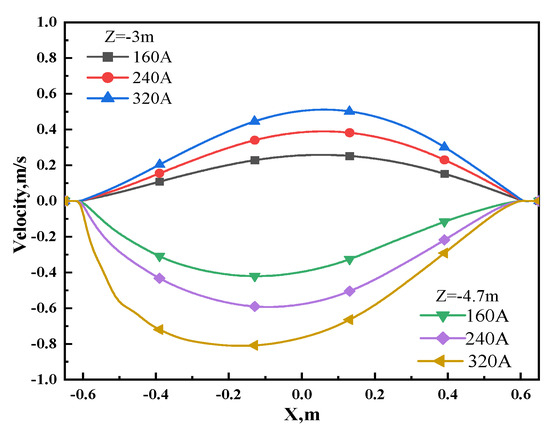
Figure 10.
Central velocity near upper and lower stirring rollers under different currents.
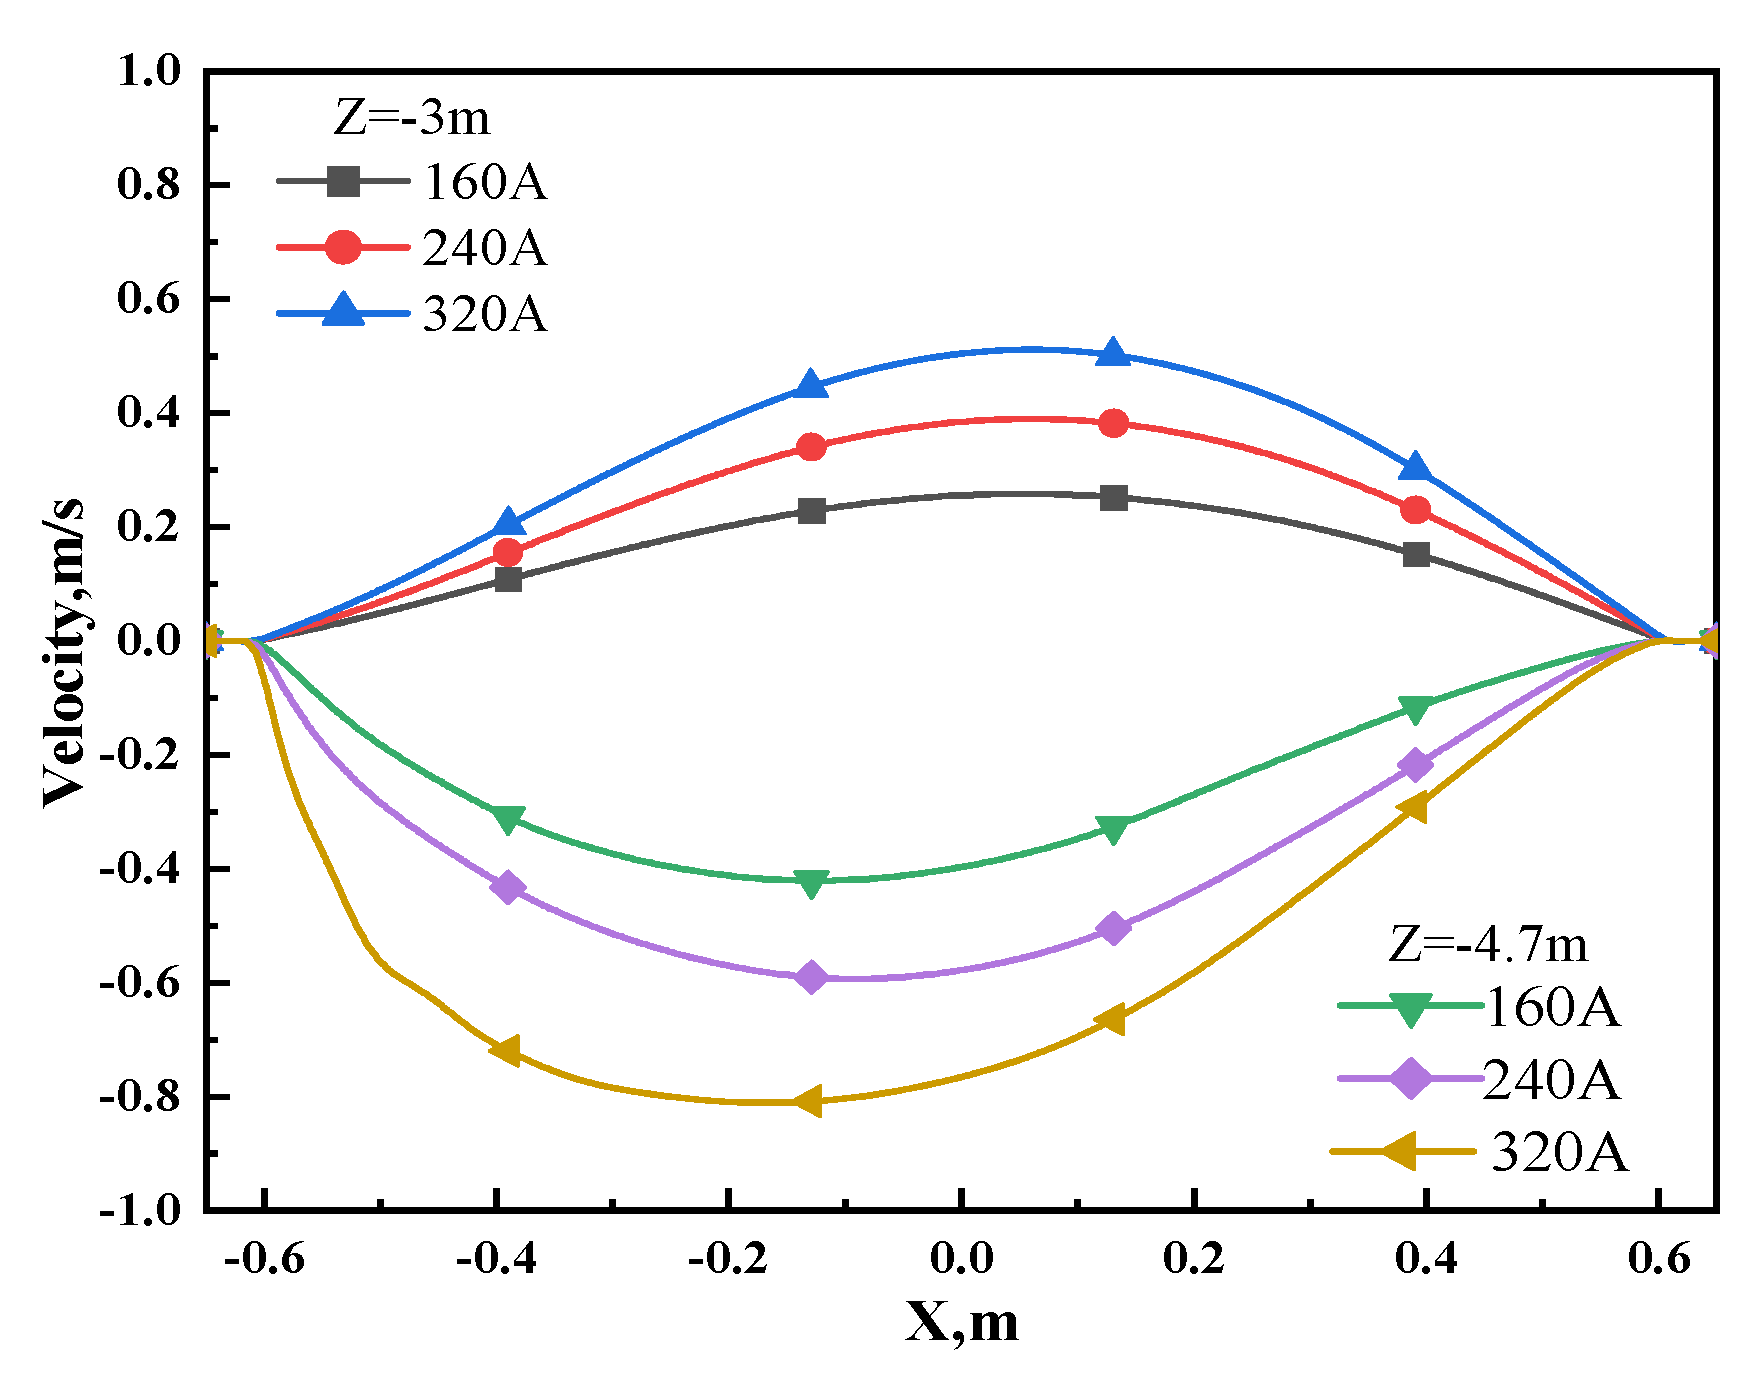
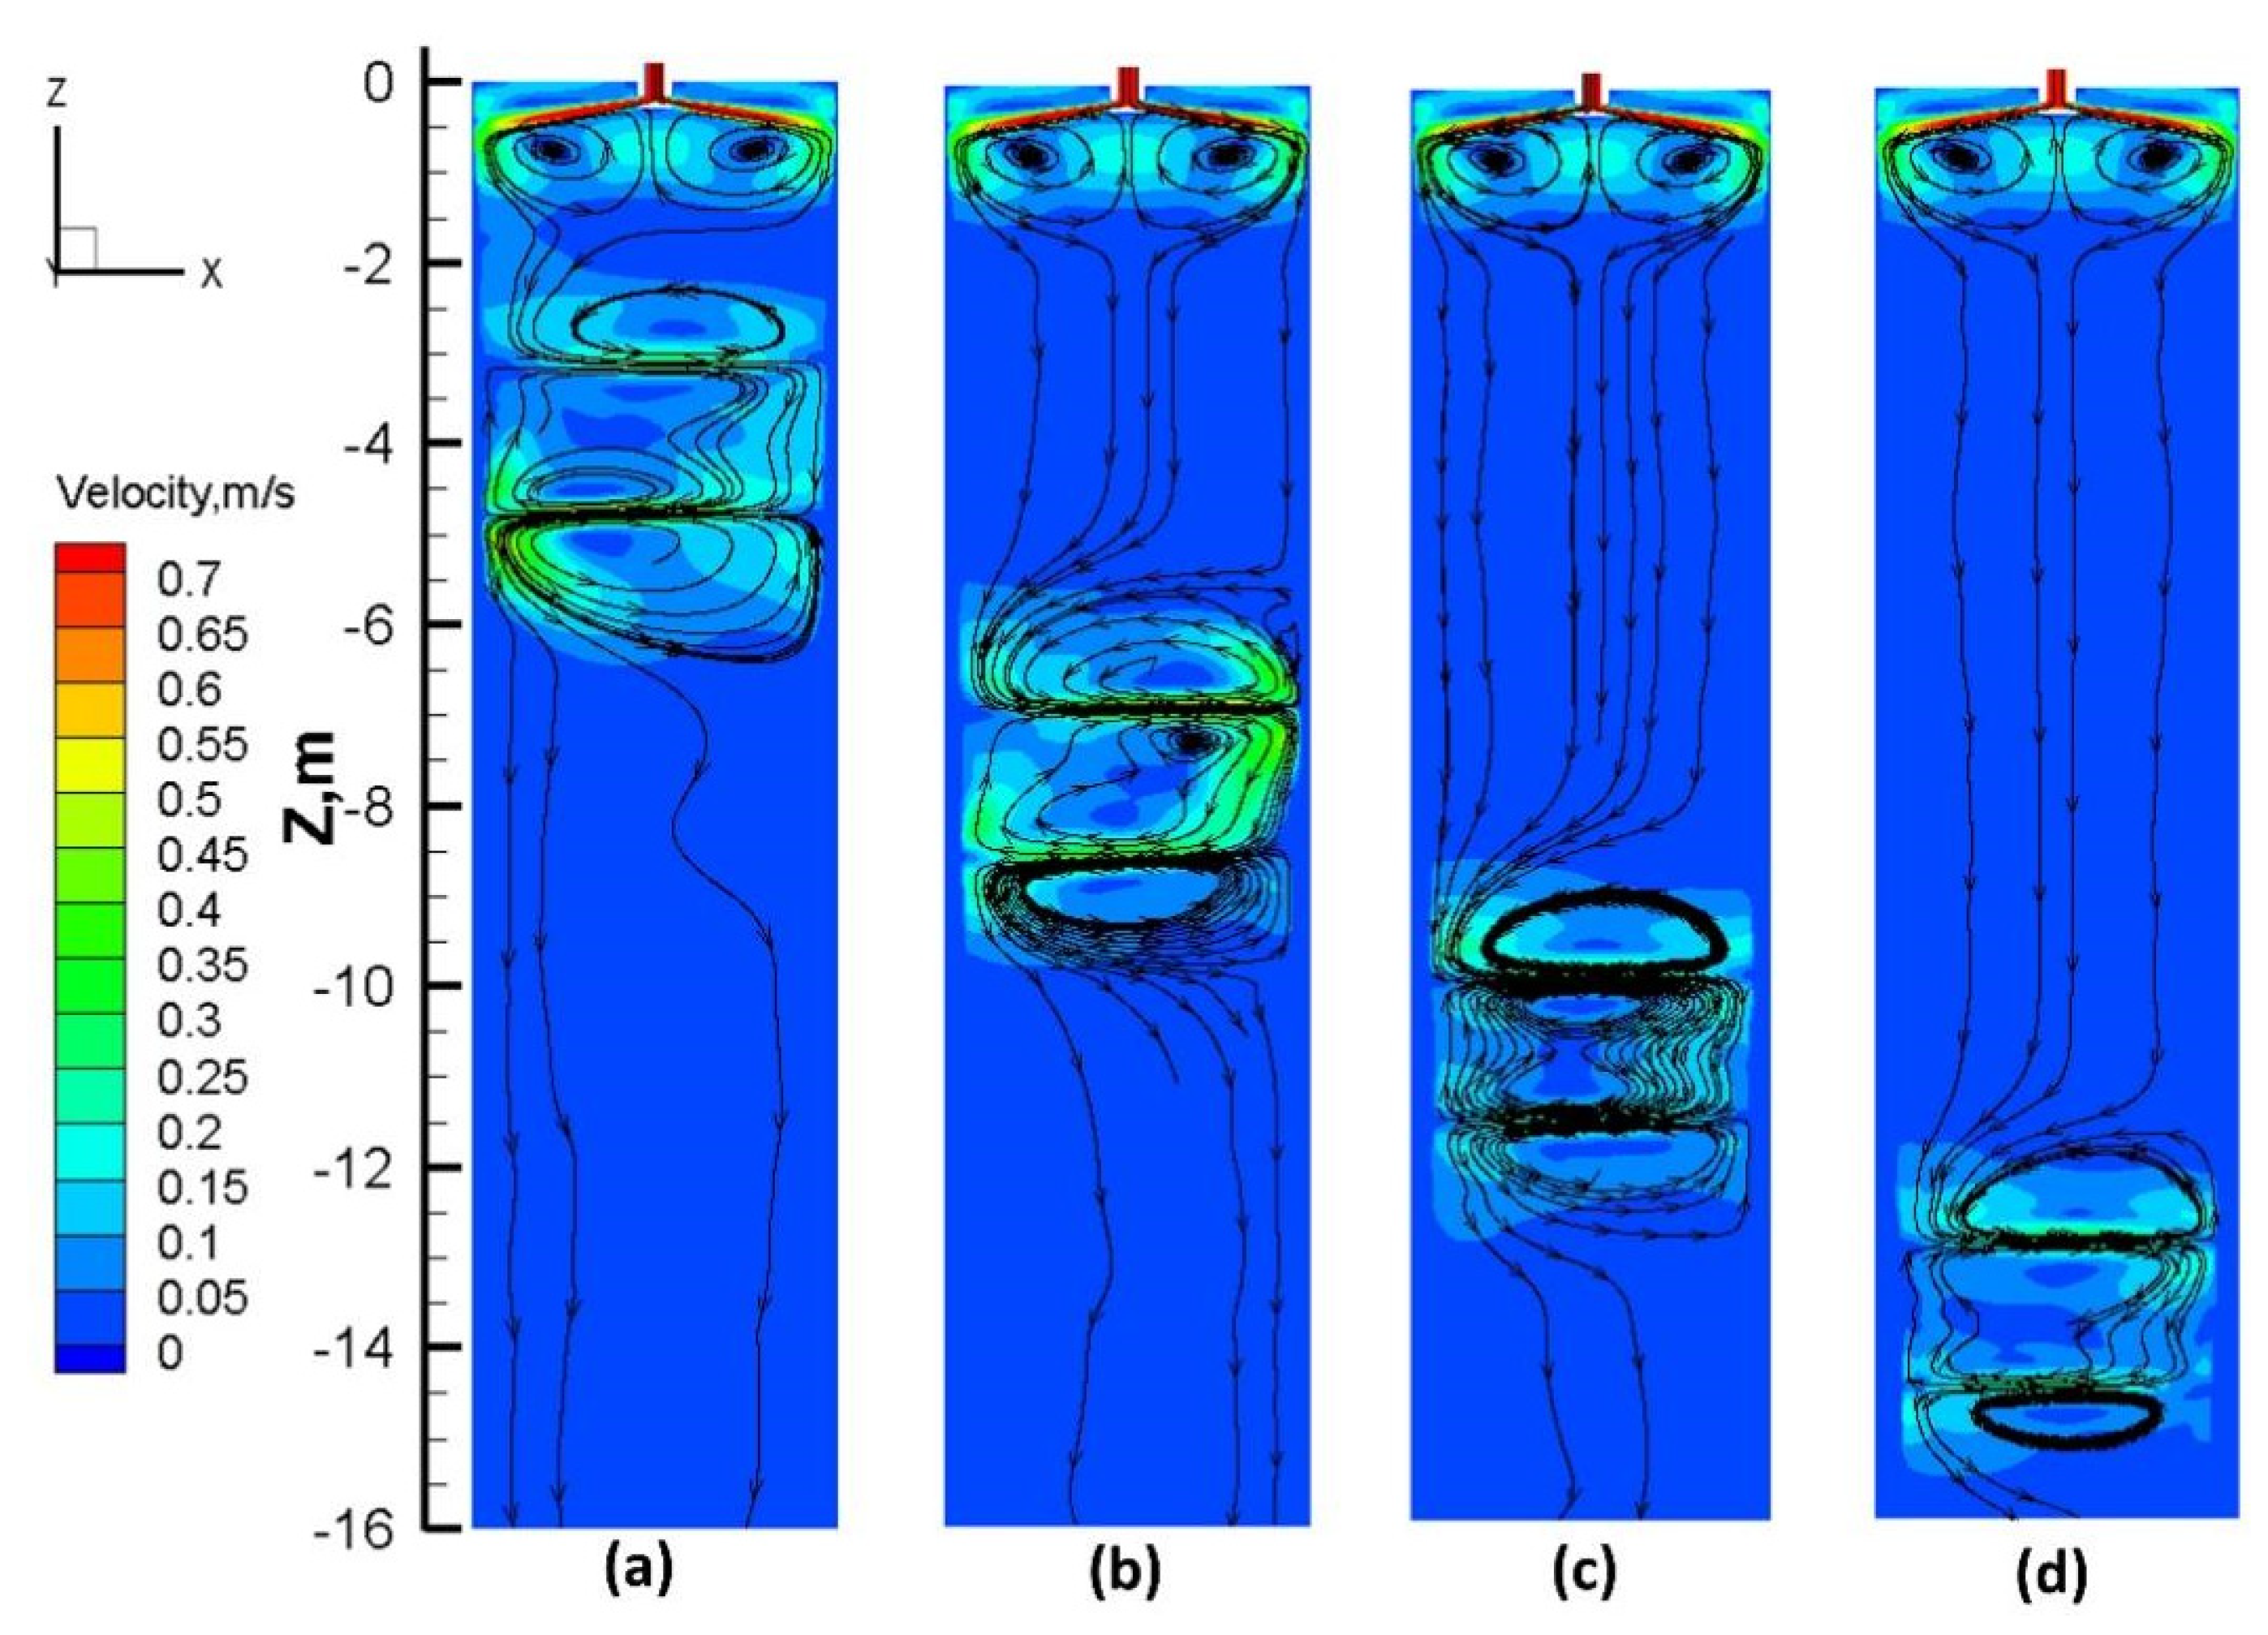
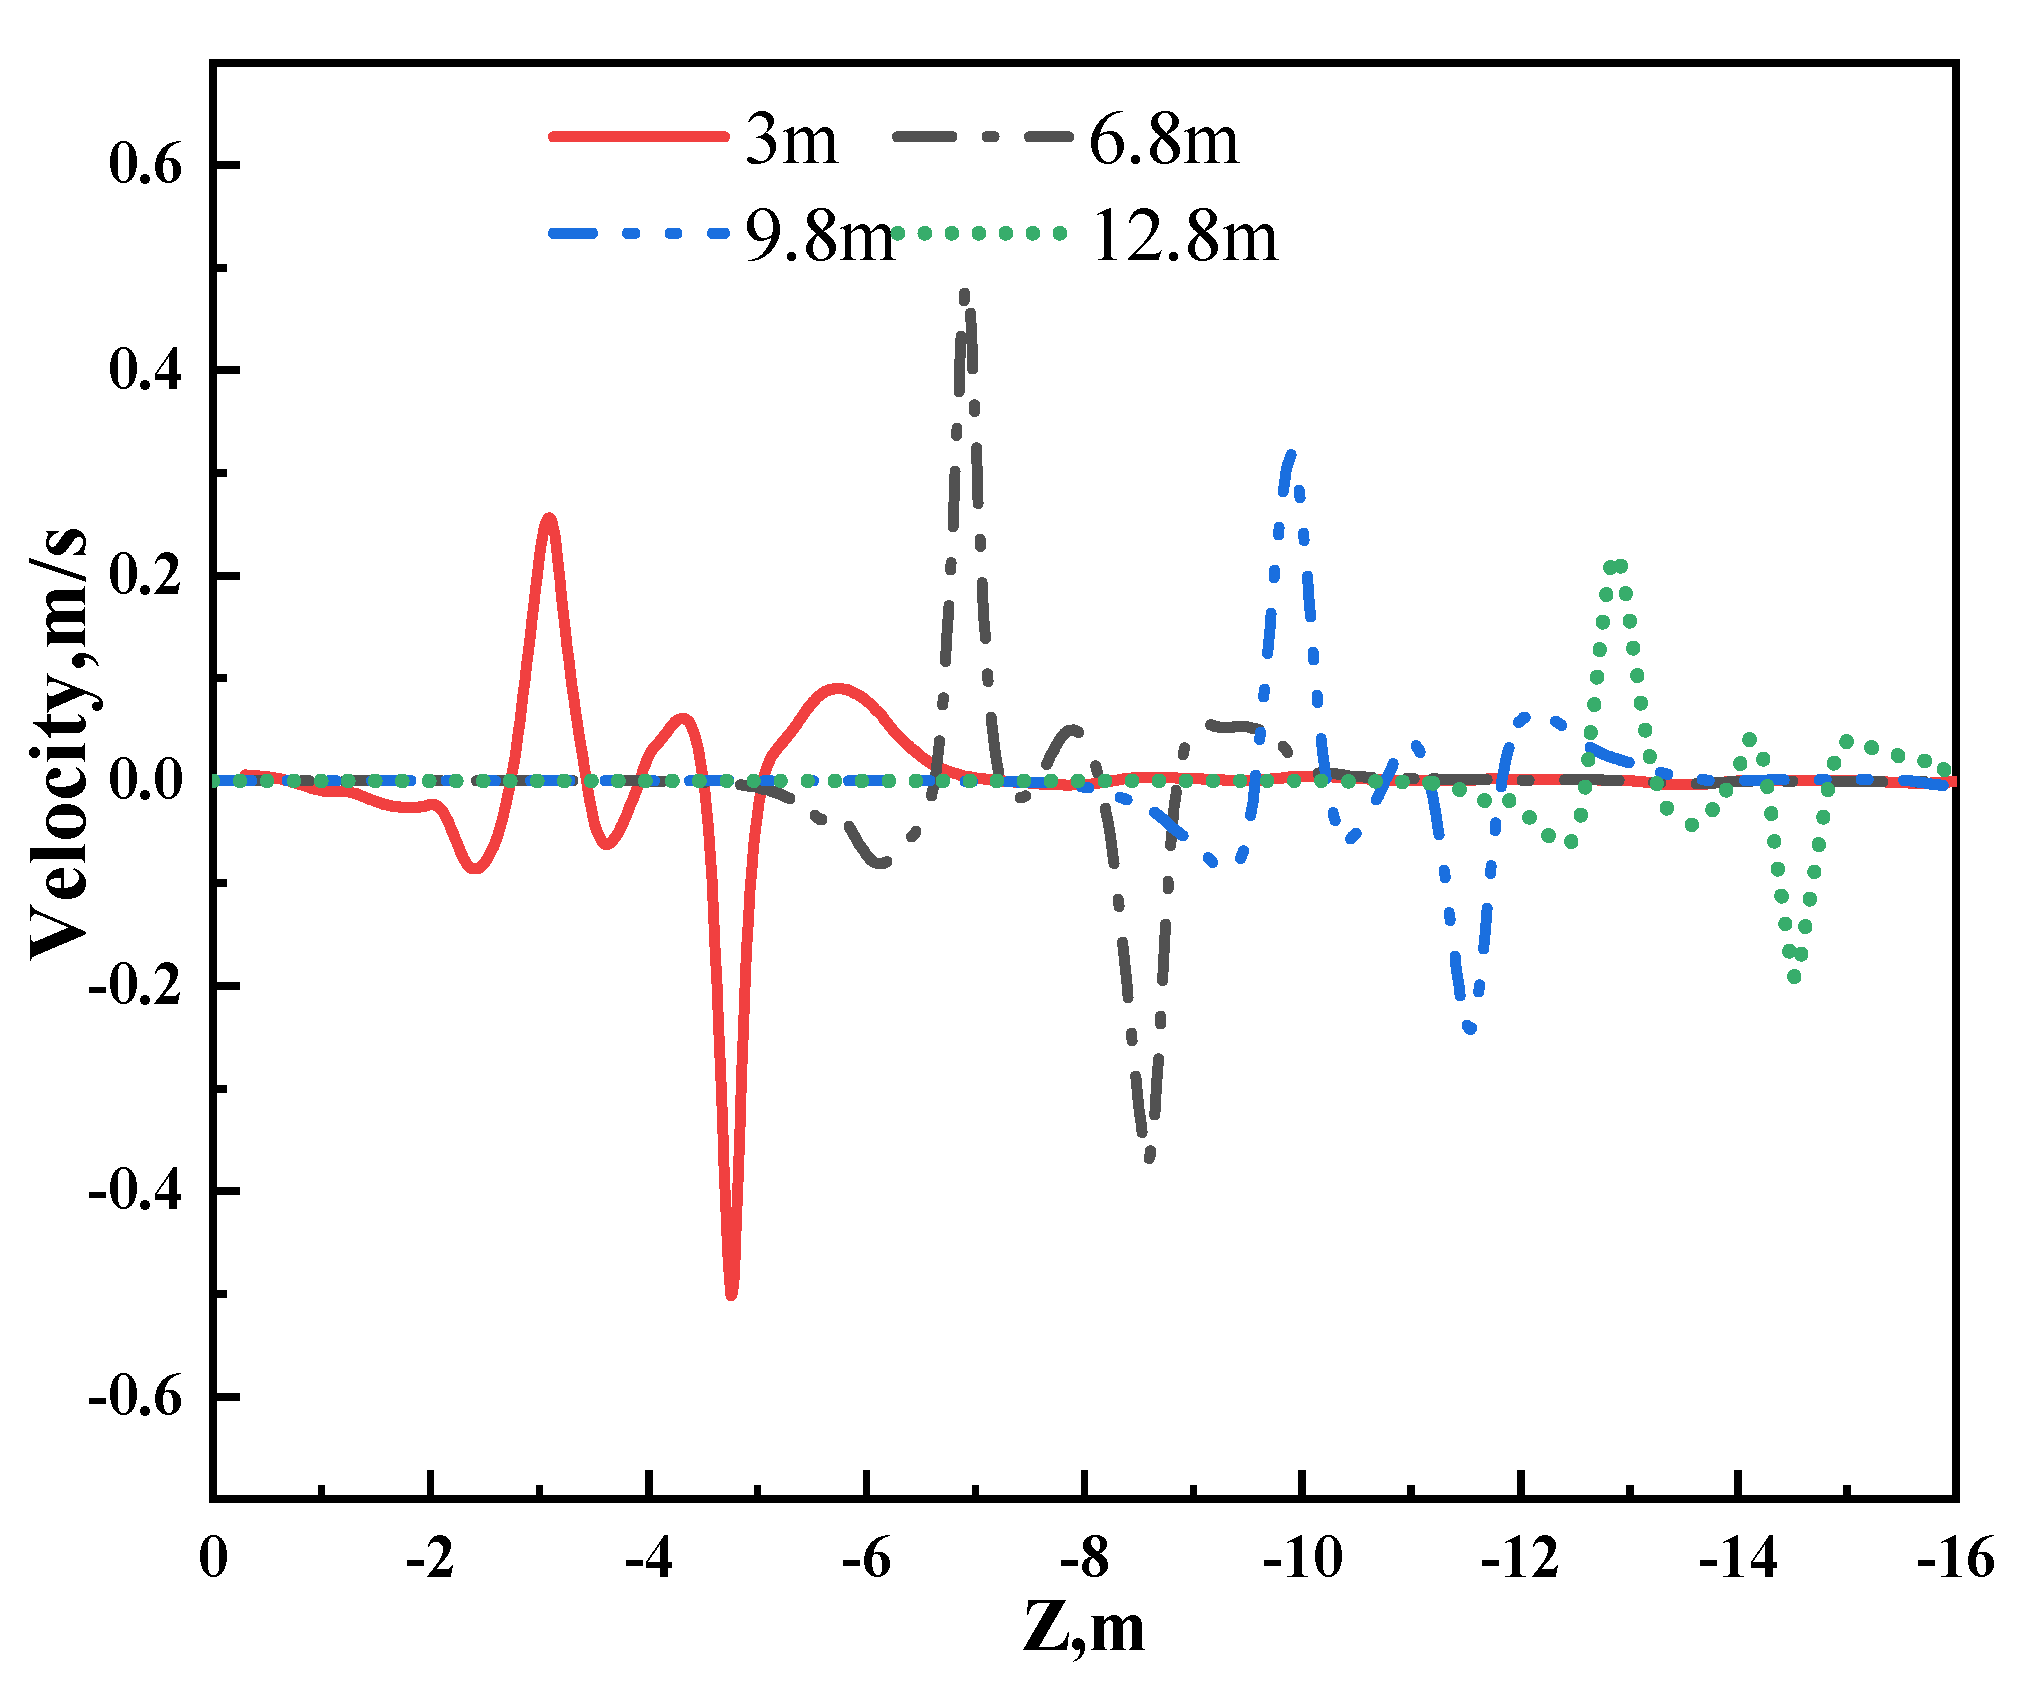
Figure 11 shows the velocity contour and streamlines under different S-EMS installation positions with a stirring current of 240 A. As shown in the figure, three eddy flows are formed inside the slab at different S-EMS stirring positions, namely the upper eddy flow above the upper stirring rollers, the middle eddy flow between the upper and lower stirring rollers, and the lower eddy flow below the lower stirring rollers. The velocity of eddy flows gradually weakens as the rollers move away from the installation position of S-EMS, which is caused due to the skin effect of the electromagnetic field and the thickening of the slab shell, which weaken the EMF acting on the liquid core of the slab and decrease the stirring effect. Figure 12 shows the central velocity distribution along the −z direction with a stirring current of 240 A and different S-EMS installation positions. Except for the case of an installation position of 3 m, the velocity within the upper and lower roller zones is close. This results from the fact that the liquid core flow far from the mold is piston-like, with a value close to the pull velocity, and it has a little effect on the directional flow driven by EMF. When the installation position of the mixing roller is increased from 6.8 m to 12.8 m, the maximum velocity driven by EMF is reduced from 0.4 m/s to 0.2 m/s.

Figure 11.
Velocity contour and streamlines of molten steel under different S-EMS installation positions: (a) 3 m, (b) 6.8 m, (c) 9.8 m, and (d) 12.8 m.
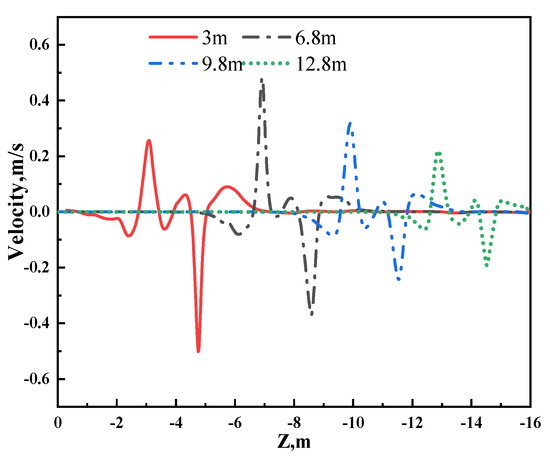
Figure 12.
Velocity distribution along -z direction under different S-EMS installation positions.
Figure 13 shows the temperature contour in the central section with the S-EMS position installed at 3.0 m. For the secondary cooling region of z < −3 m, the temperature distribution is uniform, with a value of 1797 K when S-EMS is not adopted. The temperature decreases when S-EMS is applied because the stirred flow field enhances the heat transfer between the solidification front and the liquid core, making the temperature field more uniform. As the stirring current increases to 320 A, the temperature in this region is 1795 K and has great uniformity. The uniform temperature, namely the weaker temperature gradient, in the liquid core of the slab is beneficial for inhibiting the growth of columnar grains and improving equiaxed grain formation.

Figure 13.
Temperature comparison of center longitudinal section without EMS (a) and with EMS at 160 A (b); with EMS at 240 A (c); and with EMS at 320 A (d).
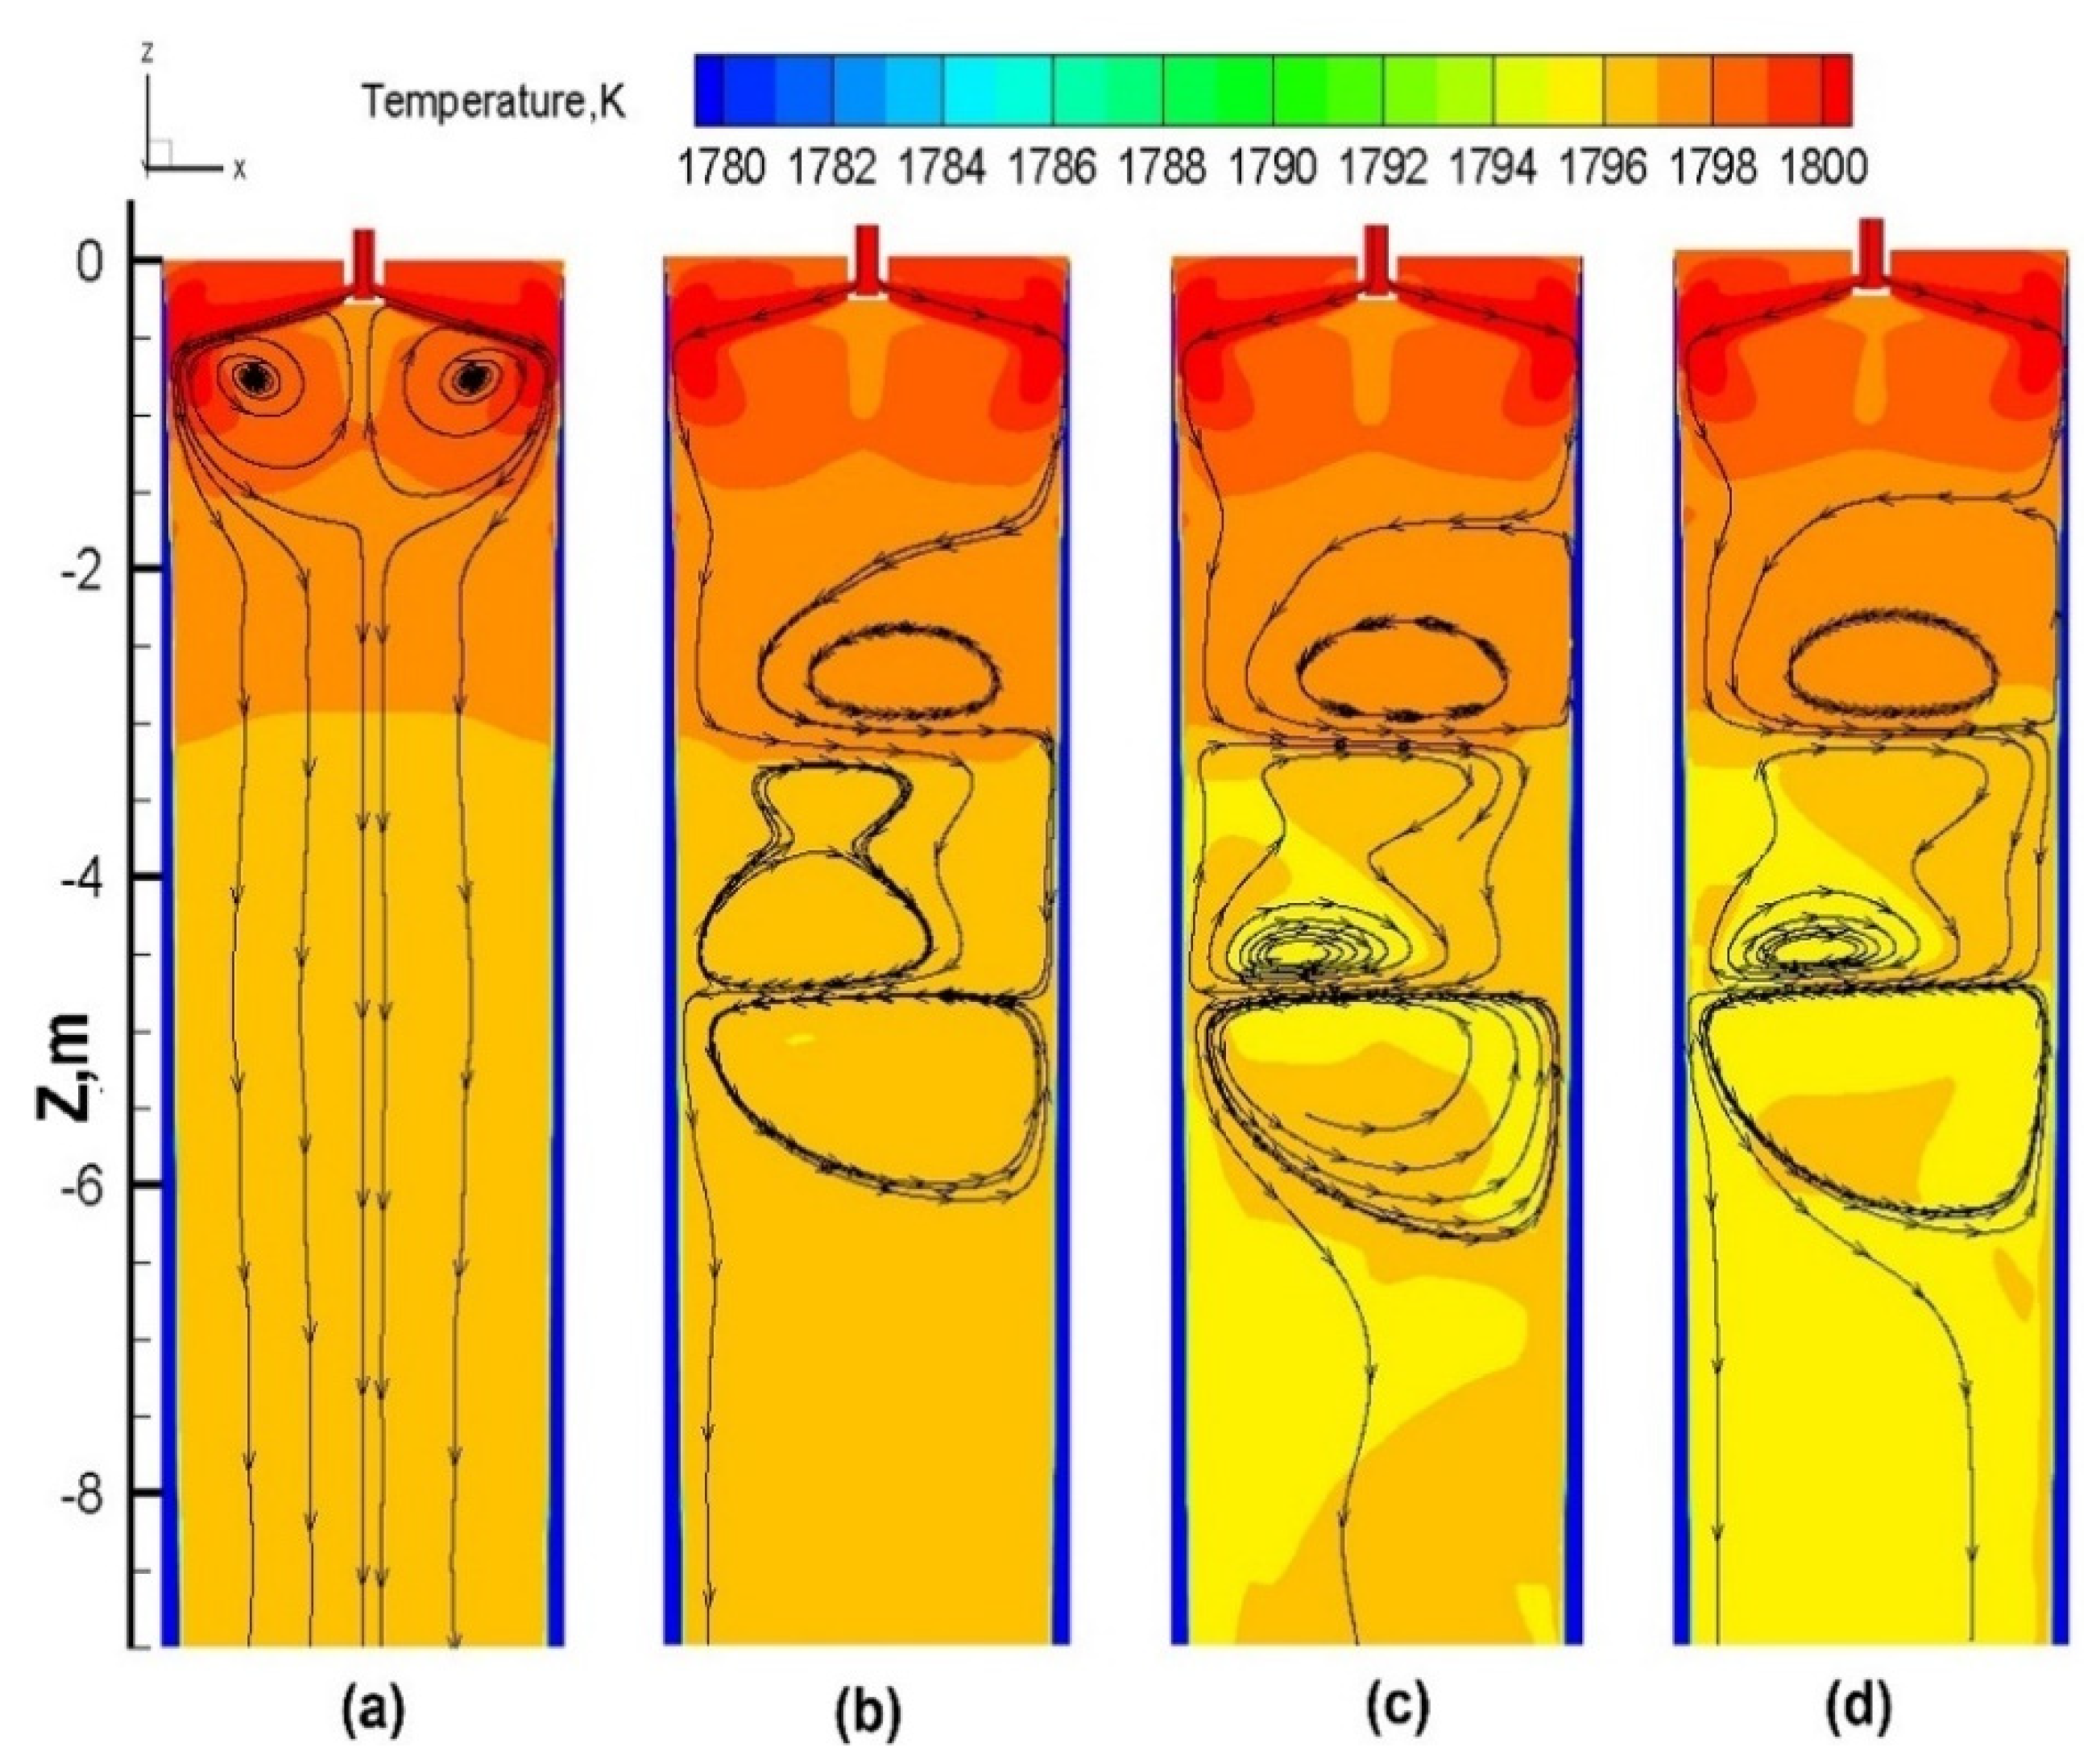
Figure 14 shows the temperature contour under different S-EMS installation positions with a current of 240 A. As shown in the figure, when the S-EMS position is installed at 3 m, the stirred molten steel improves temperature uniformity. The improved region ranges from the position of the EMF down to the solidification end. However, the improvement is strong in the region where the EMS is acting and is weak in the region far away from the EMS. As the installation position moves downwards, the region that the EMS acts on moves towards the solidification end, which helps to reduce the temperature gradient at the solidification end. Based on the slab shell thickness, moving the S-EMS installation position downwards does not favor the equiaxed grain zone expansion due to the gradually decreasing region caused by the action of the EMS.

Figure 14.
Temperature contours on the central section with different S-EMS installation positions: (a) 3 m, (b) 6.8 m, (c) 9.8 m, and (d) 12.8 m.
3.2.2. Solute Distribution and Segregation Behavior
The dimensionless carbon segregation index, CInd, defined as the ratio of the local to the initial mass fraction of carbon, is adopted to evaluate the carbon segregation and distribution behavior. Figure 15 shows the CInd contours with different stirring currents when S-EMS is installed at 3 m. As shown in the figure, when S-EMS is not applied, an evident CInd gradient along the pull direction is formed, where the maximum value of CInd increases from 1.025 at z = −3 m to 1.13 at z = −8.5 m. The formation of the gradient results from the partition of carbon during the solidification process and is the main cause that leads to segregation. With S-EMS applied, the CInd gradient is decreased. The uniformity of CInd increases with the increase in the stirring current, and when the stirring current is 320 A, a more homogeneous C distribution can be obtained in the stirring area between the two rolls, with its segregation index being around 1.1.

Figure 15.
Contours of carbon segregation index with S-EMS installed at 3 m, (a) without S-EMS, and with S-EMS of 160 A (b); 240 A (c); and 320 A (d).
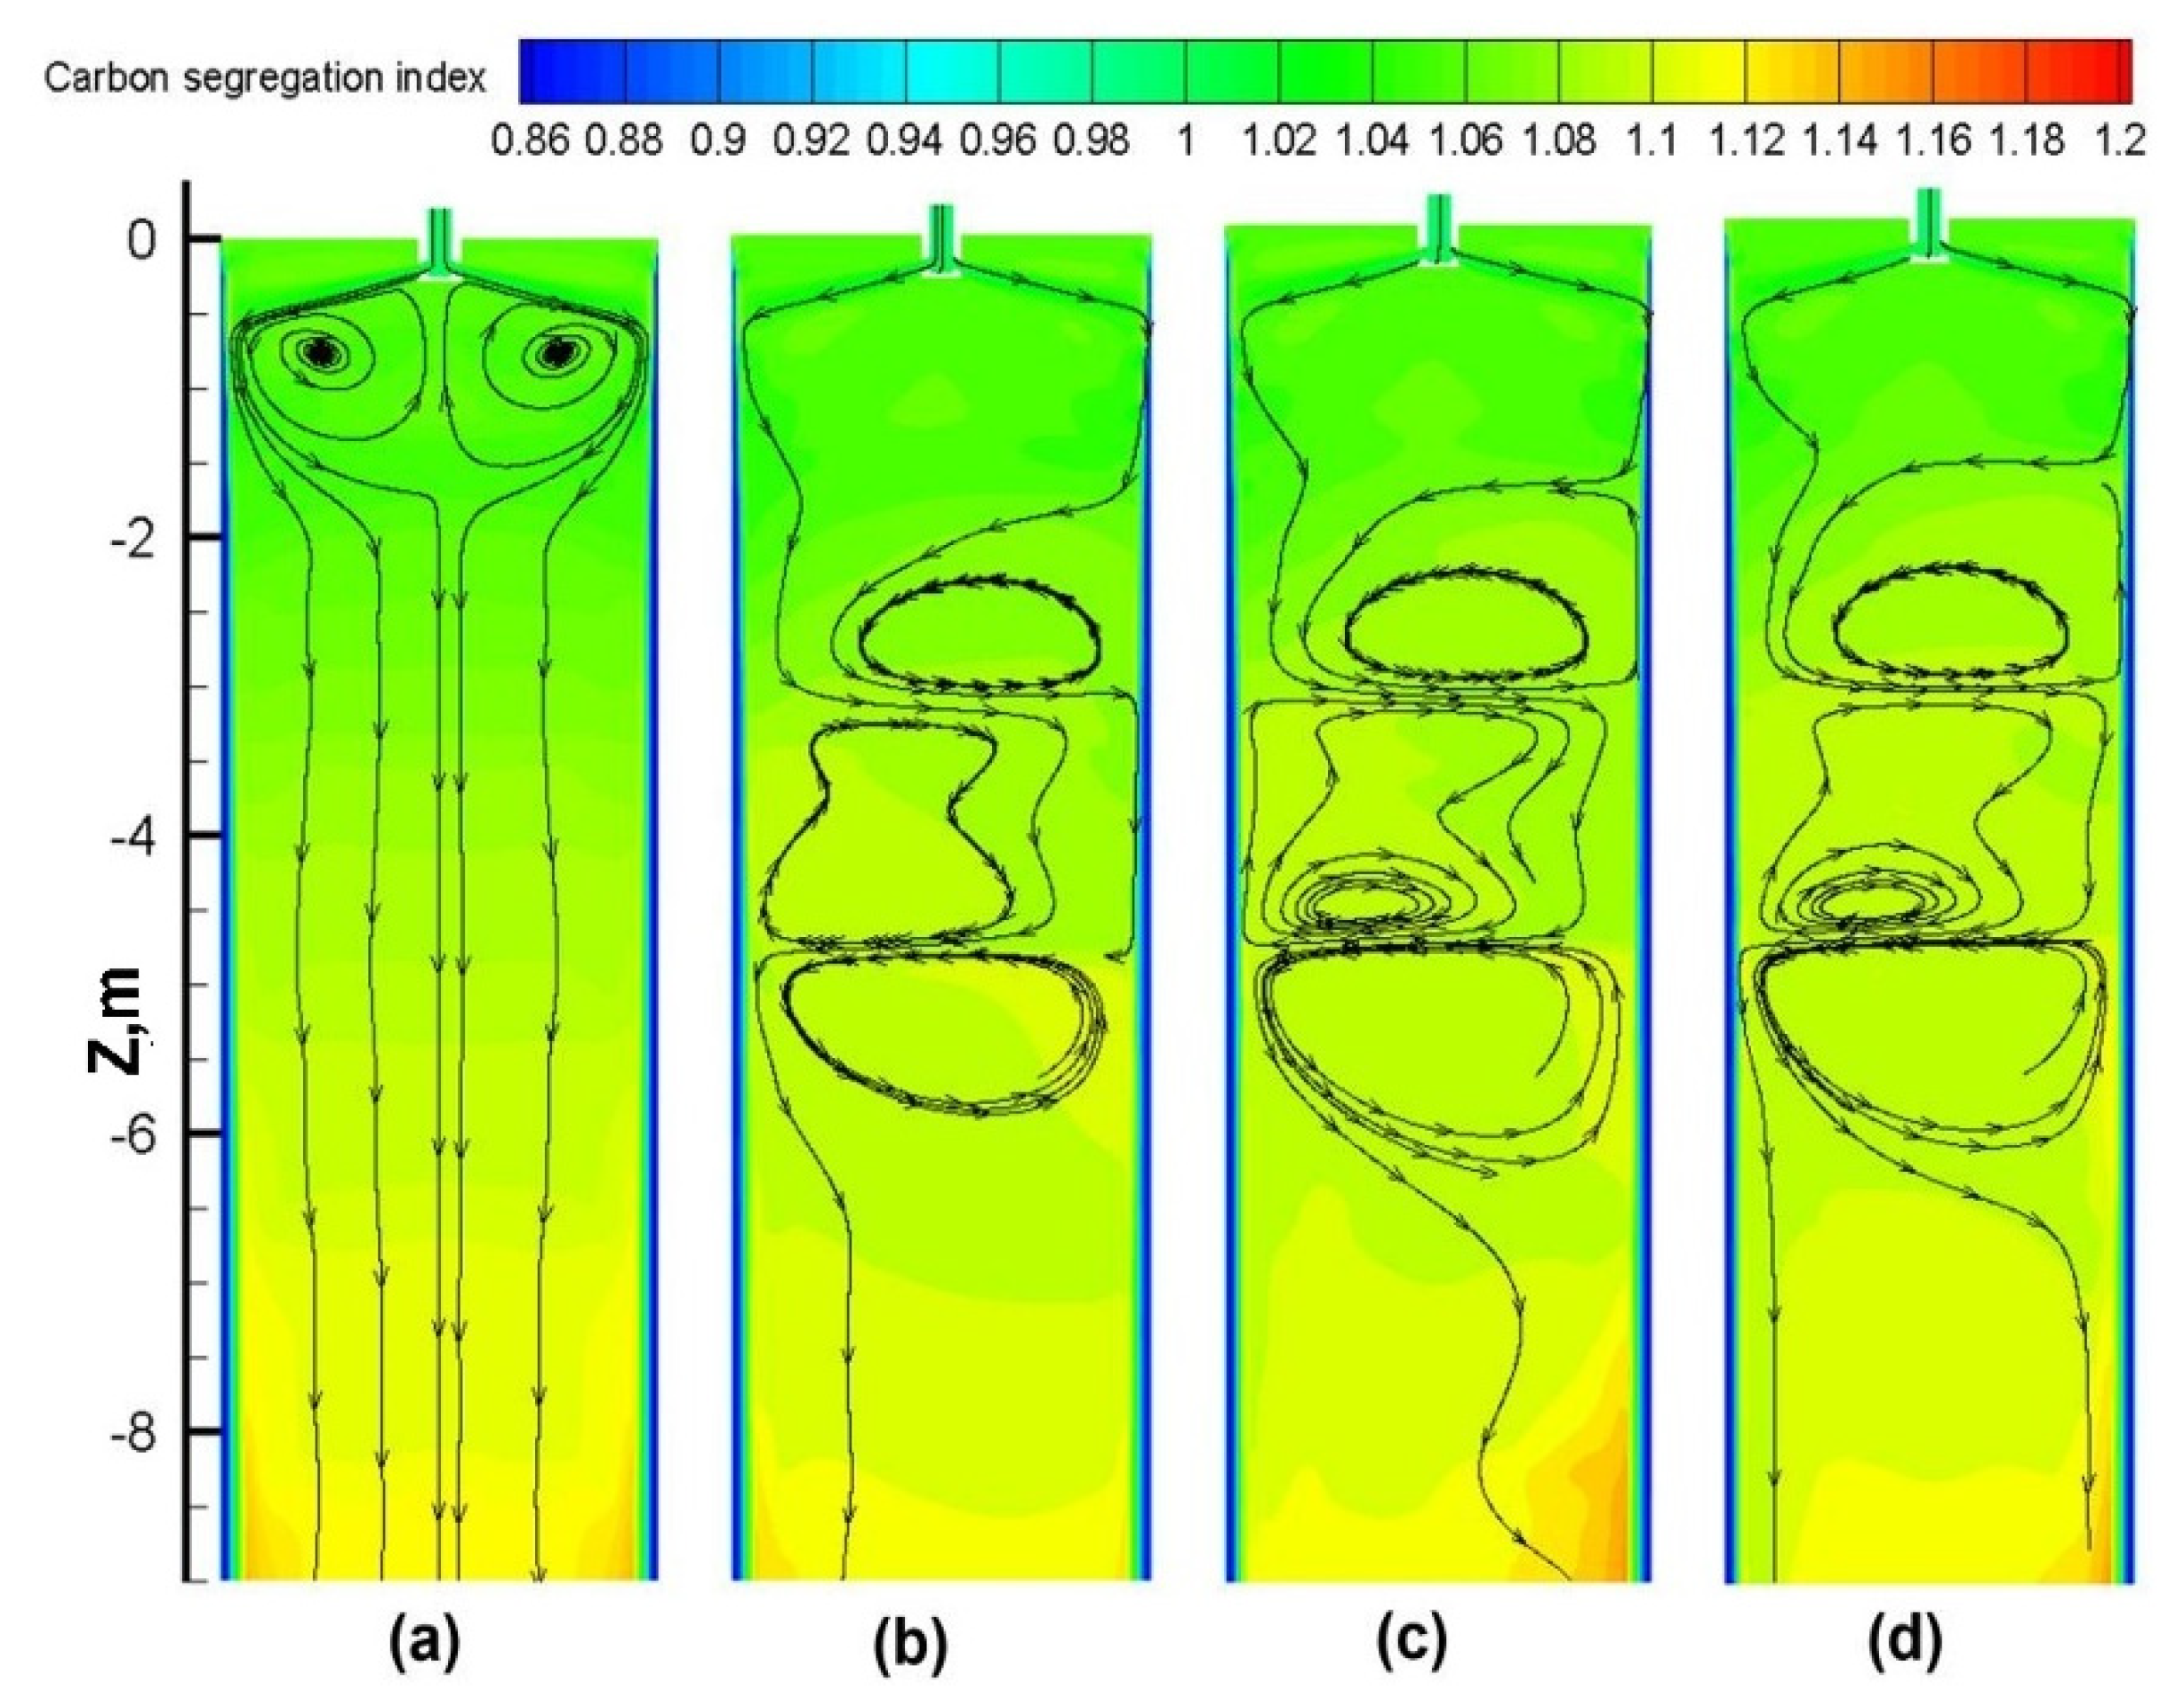
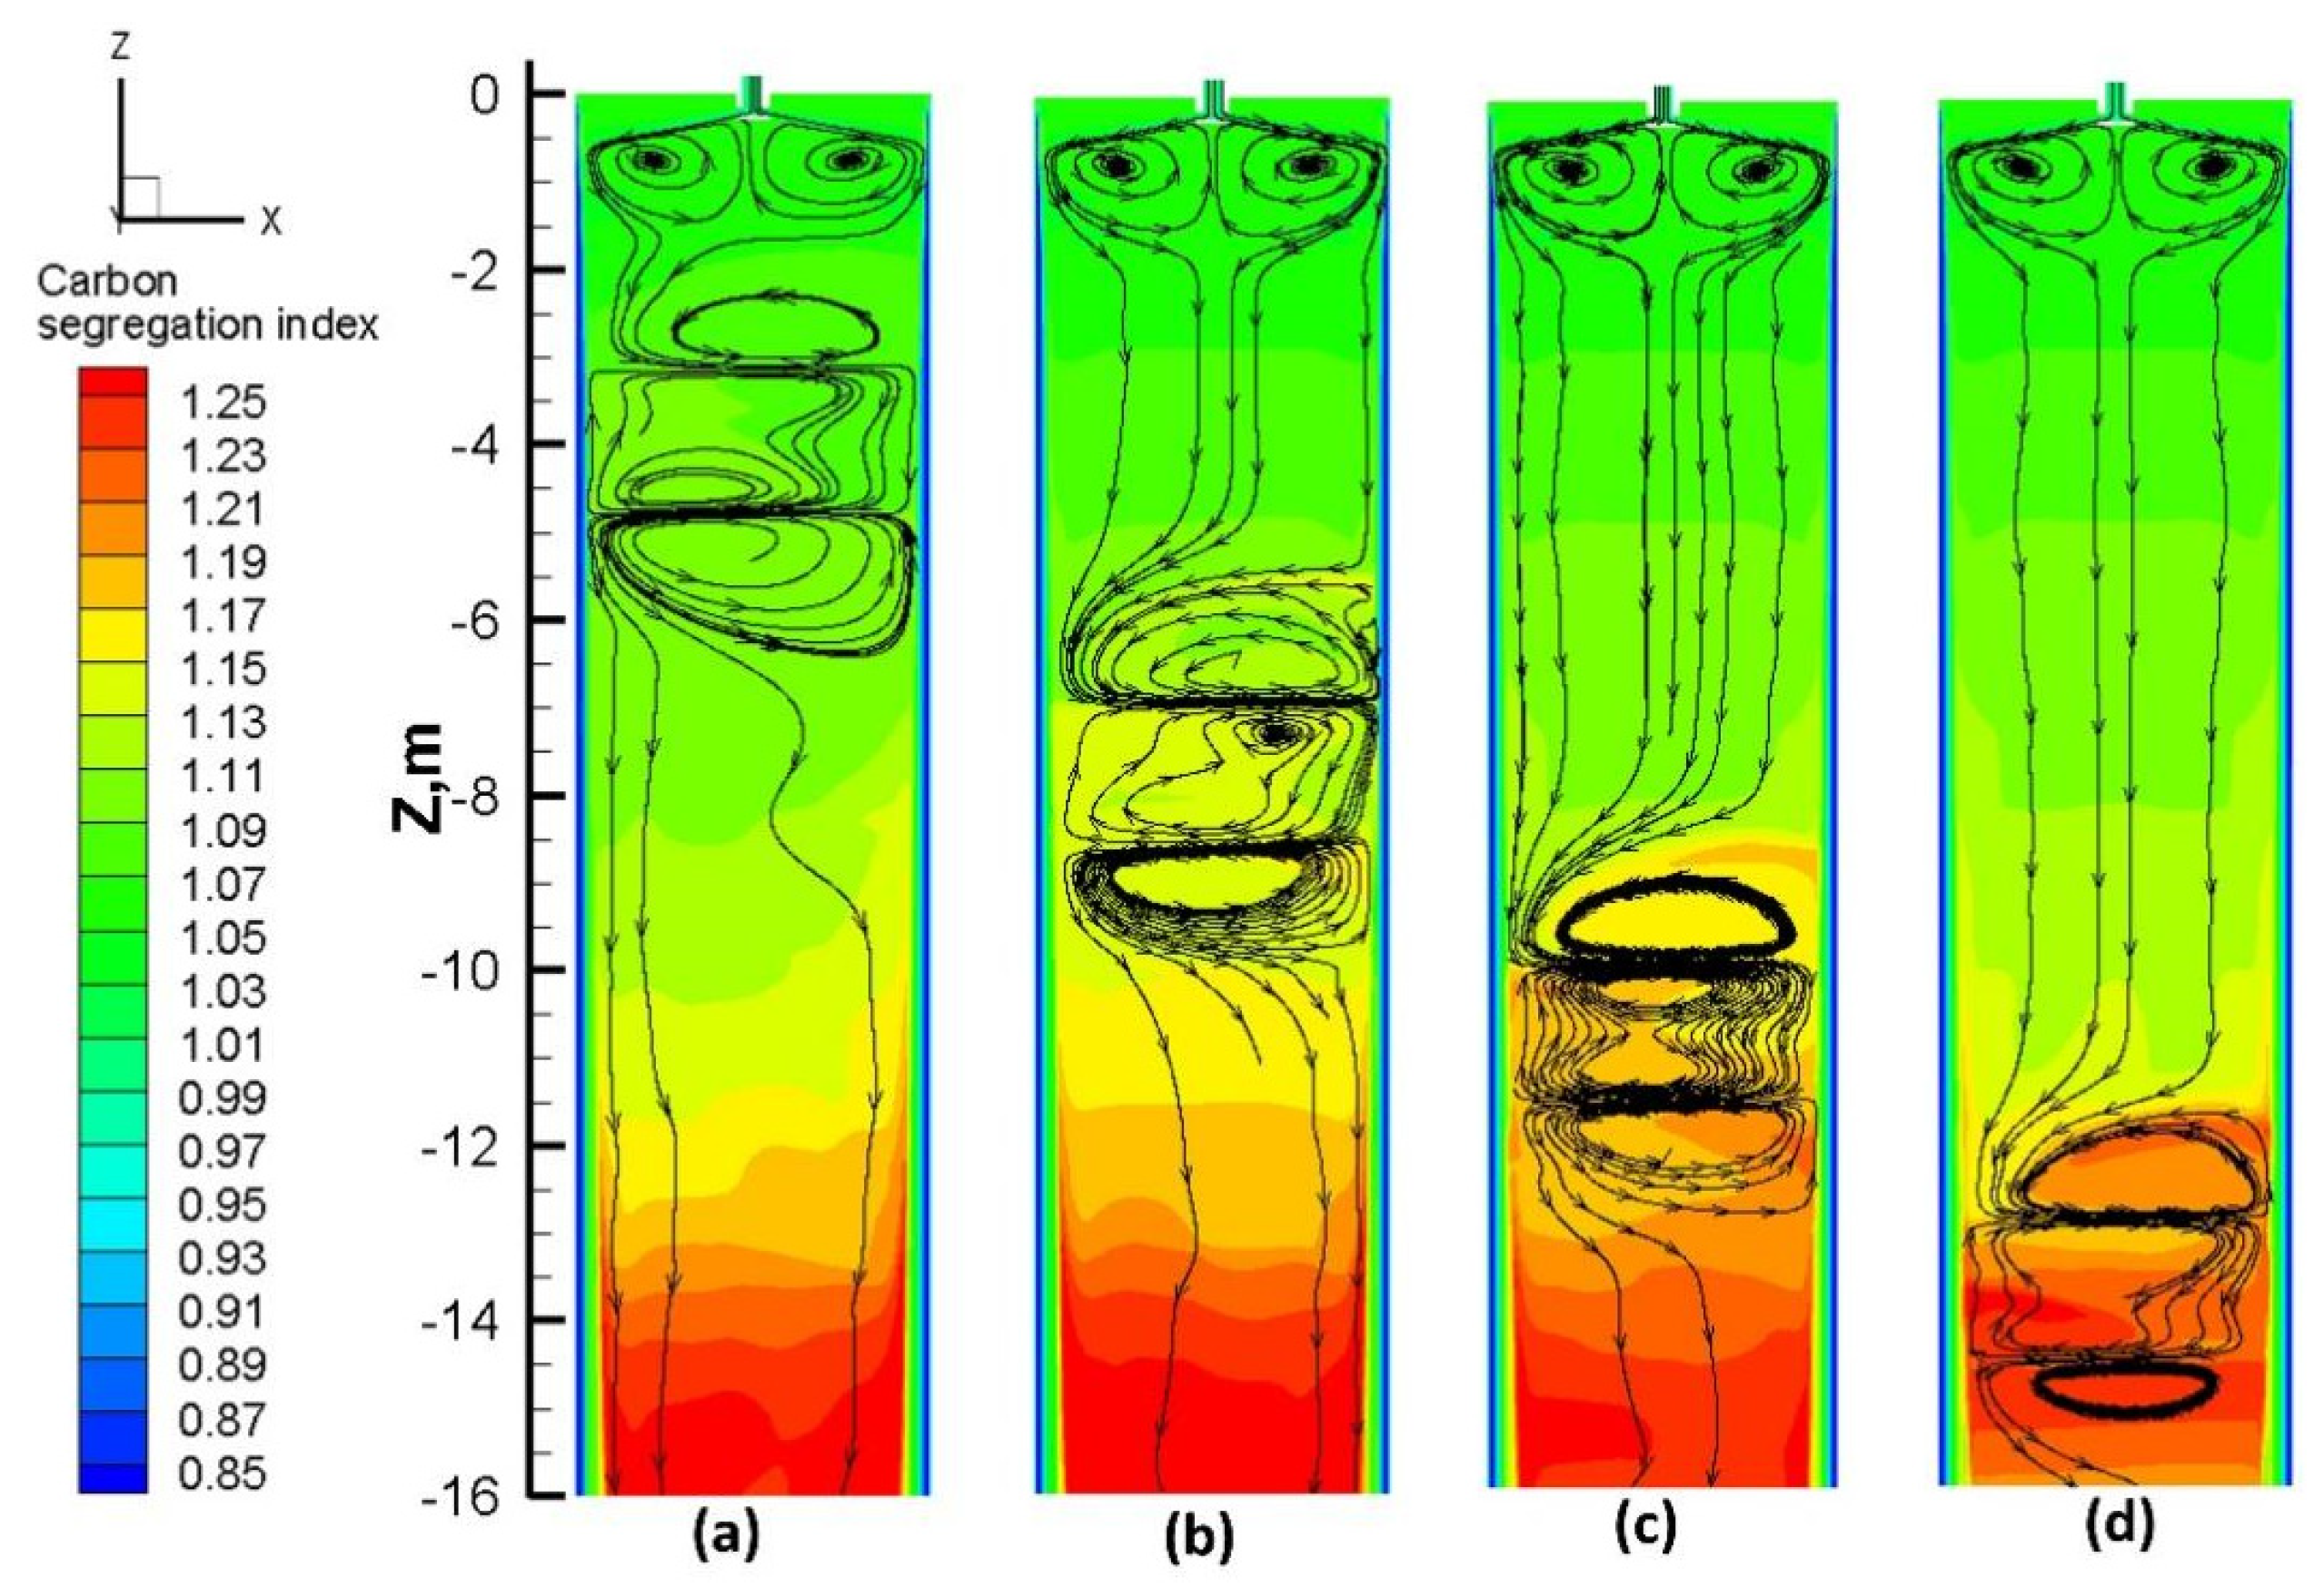
Figure 16 shows the CInd contours with a current of 240 A and different S-EMS installation positions. As shown in the figure, when S-EMS is installed at 3 m, its effect on improving the CInd gradient is minimal due to the weak action of EMS at the solidification end. With the installation position gradually moving downwards, the strong flow region affected by EMS also moves downwards, which is beneficial for improving the flow field near the region of the solidification end and reducing the CInd gradient.
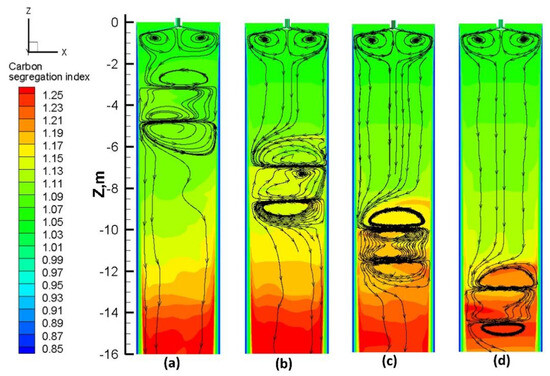
Figure 16.
Contours of carbon segregation index with the current of 240 A and different S-EMS installation positions: (a) 3.0 m, (b) 6.8 m, (c) 9.8 m, and (d) 12.8 m.
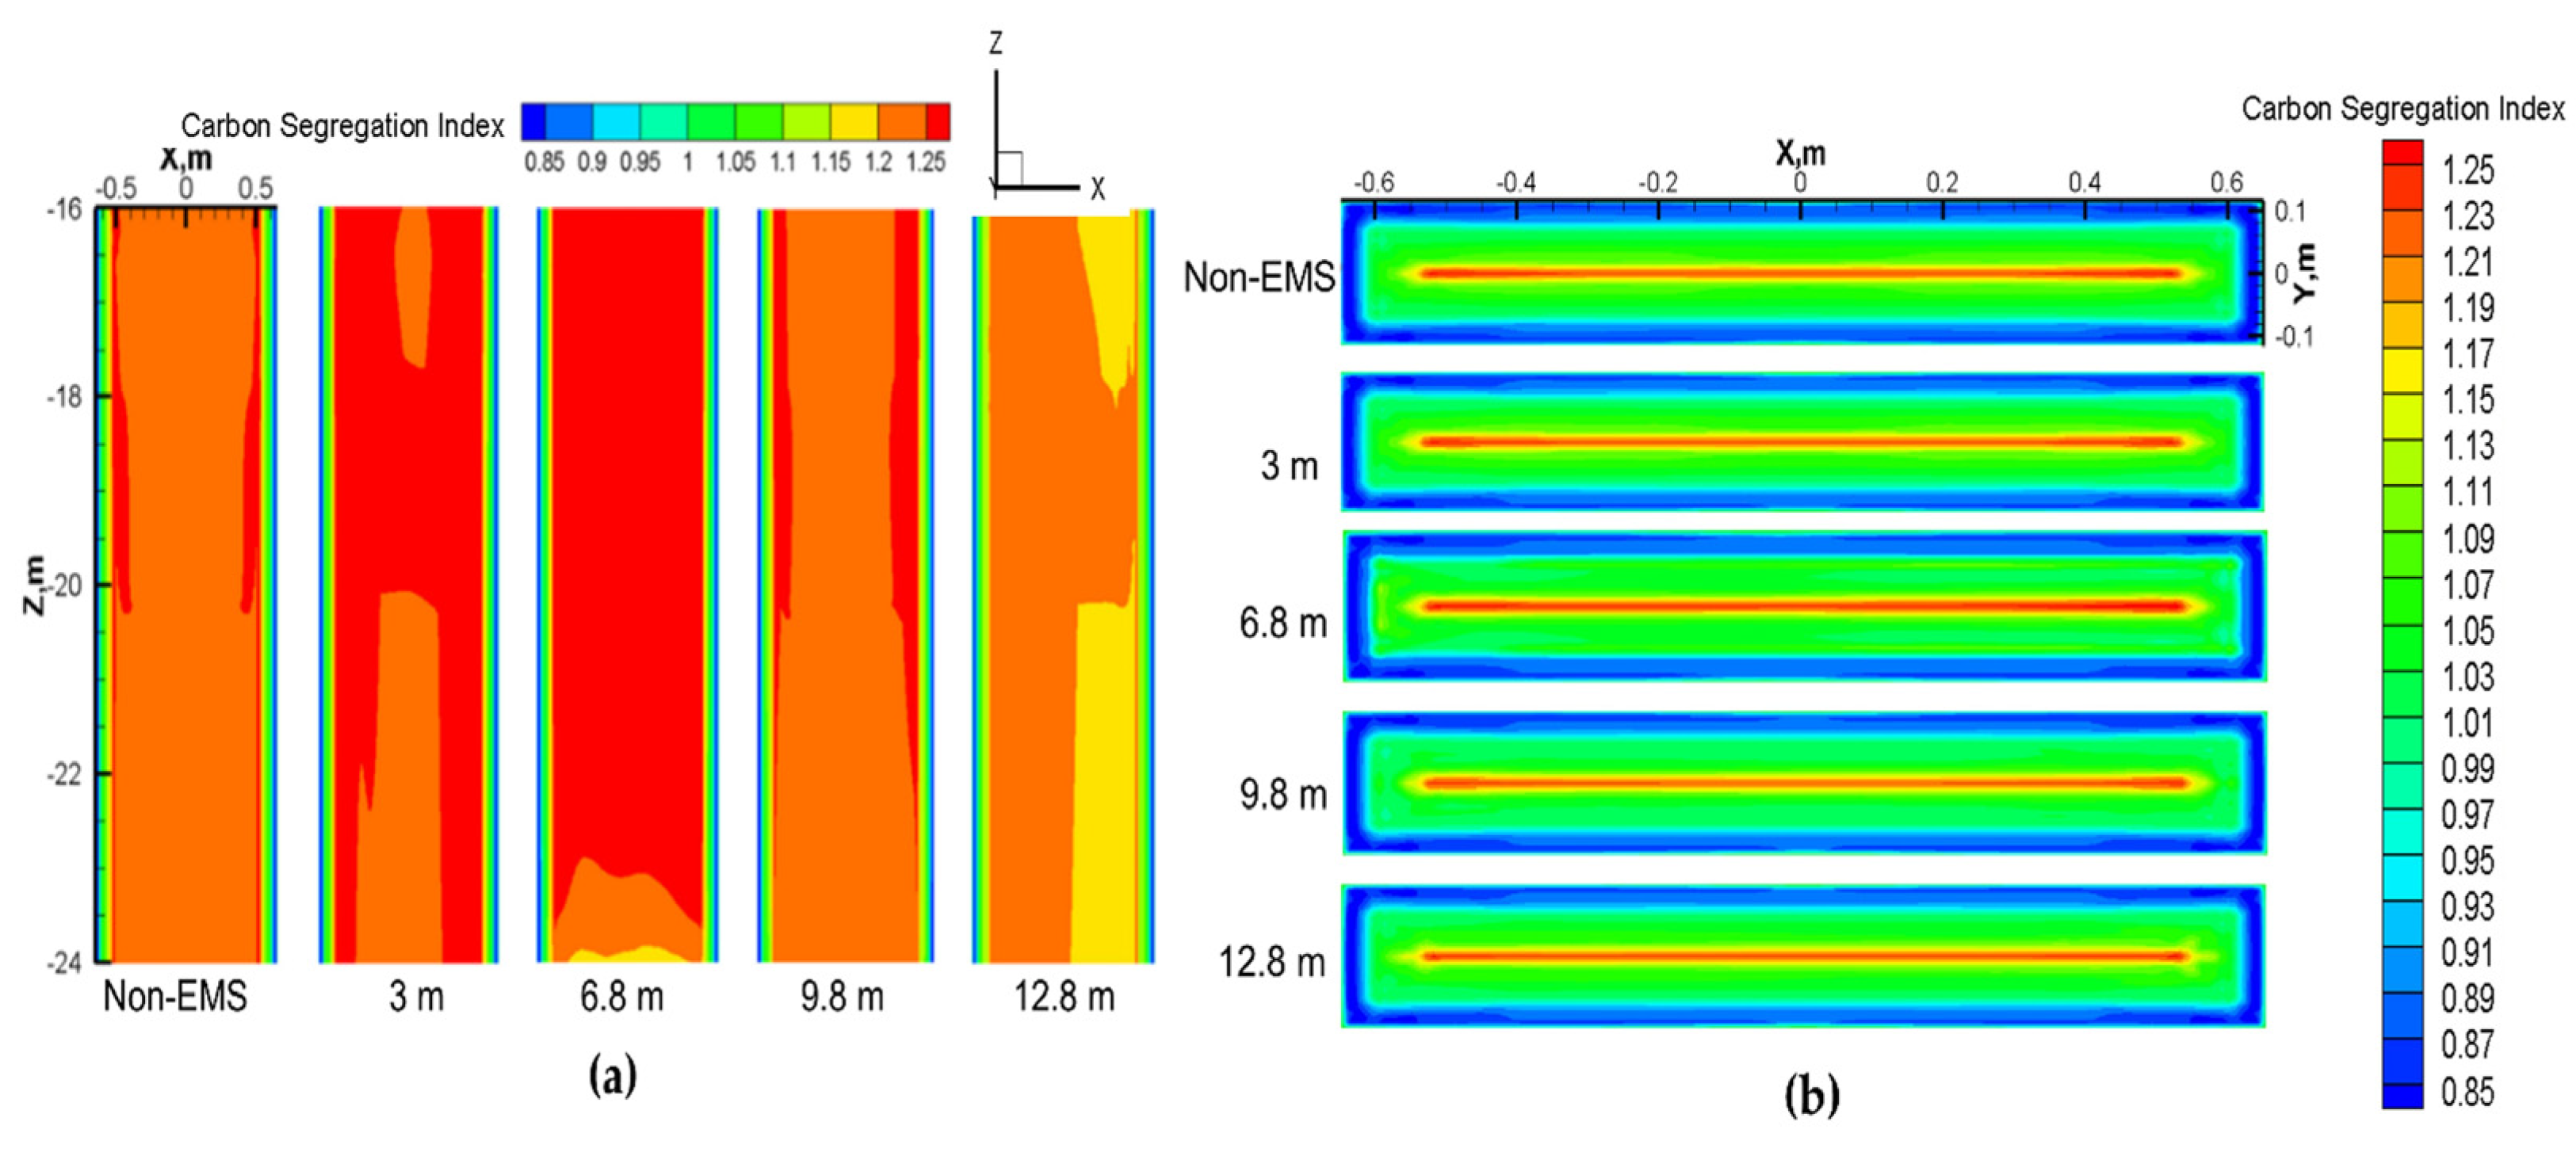
Figure 17a shows the contours of CInd on the central section near the solidification end. As shown in the figure, there is a symmetrical distribution of CInd without S-EMS, which conforms to the segregation law during the natural solidification process. However, when S-EMS is applied, the distribution of CInd varies with the installation position. When S-EMS is installed at 3 m, the distribution of CInd shows a deteriorating trend, while moving the installation position downwards has a significant impact on improving CInd. Similar conclusions can be withdrawn from the cross-sectional contour of CInd (z = −24 m) shown in Figure 17b. The distribution of CInd can be divided into three regions: a lower region near the slab shell, a uniformly distributed region from the slab shell to the central region, and an enriched region in the central region. As the installation position moves downwards, the central segregation gradually reduces, with a maximal reduction occurring when S-EMS is installed at 12.8 m.
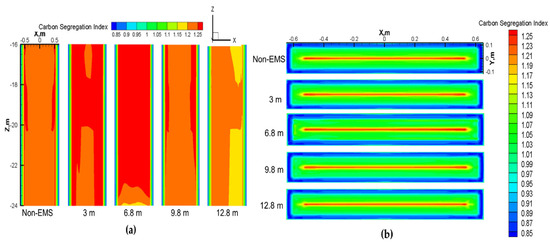
Figure 17.
Contours of CInd with different installation position at the center section (a) and cross-section of z = −24 m (b).
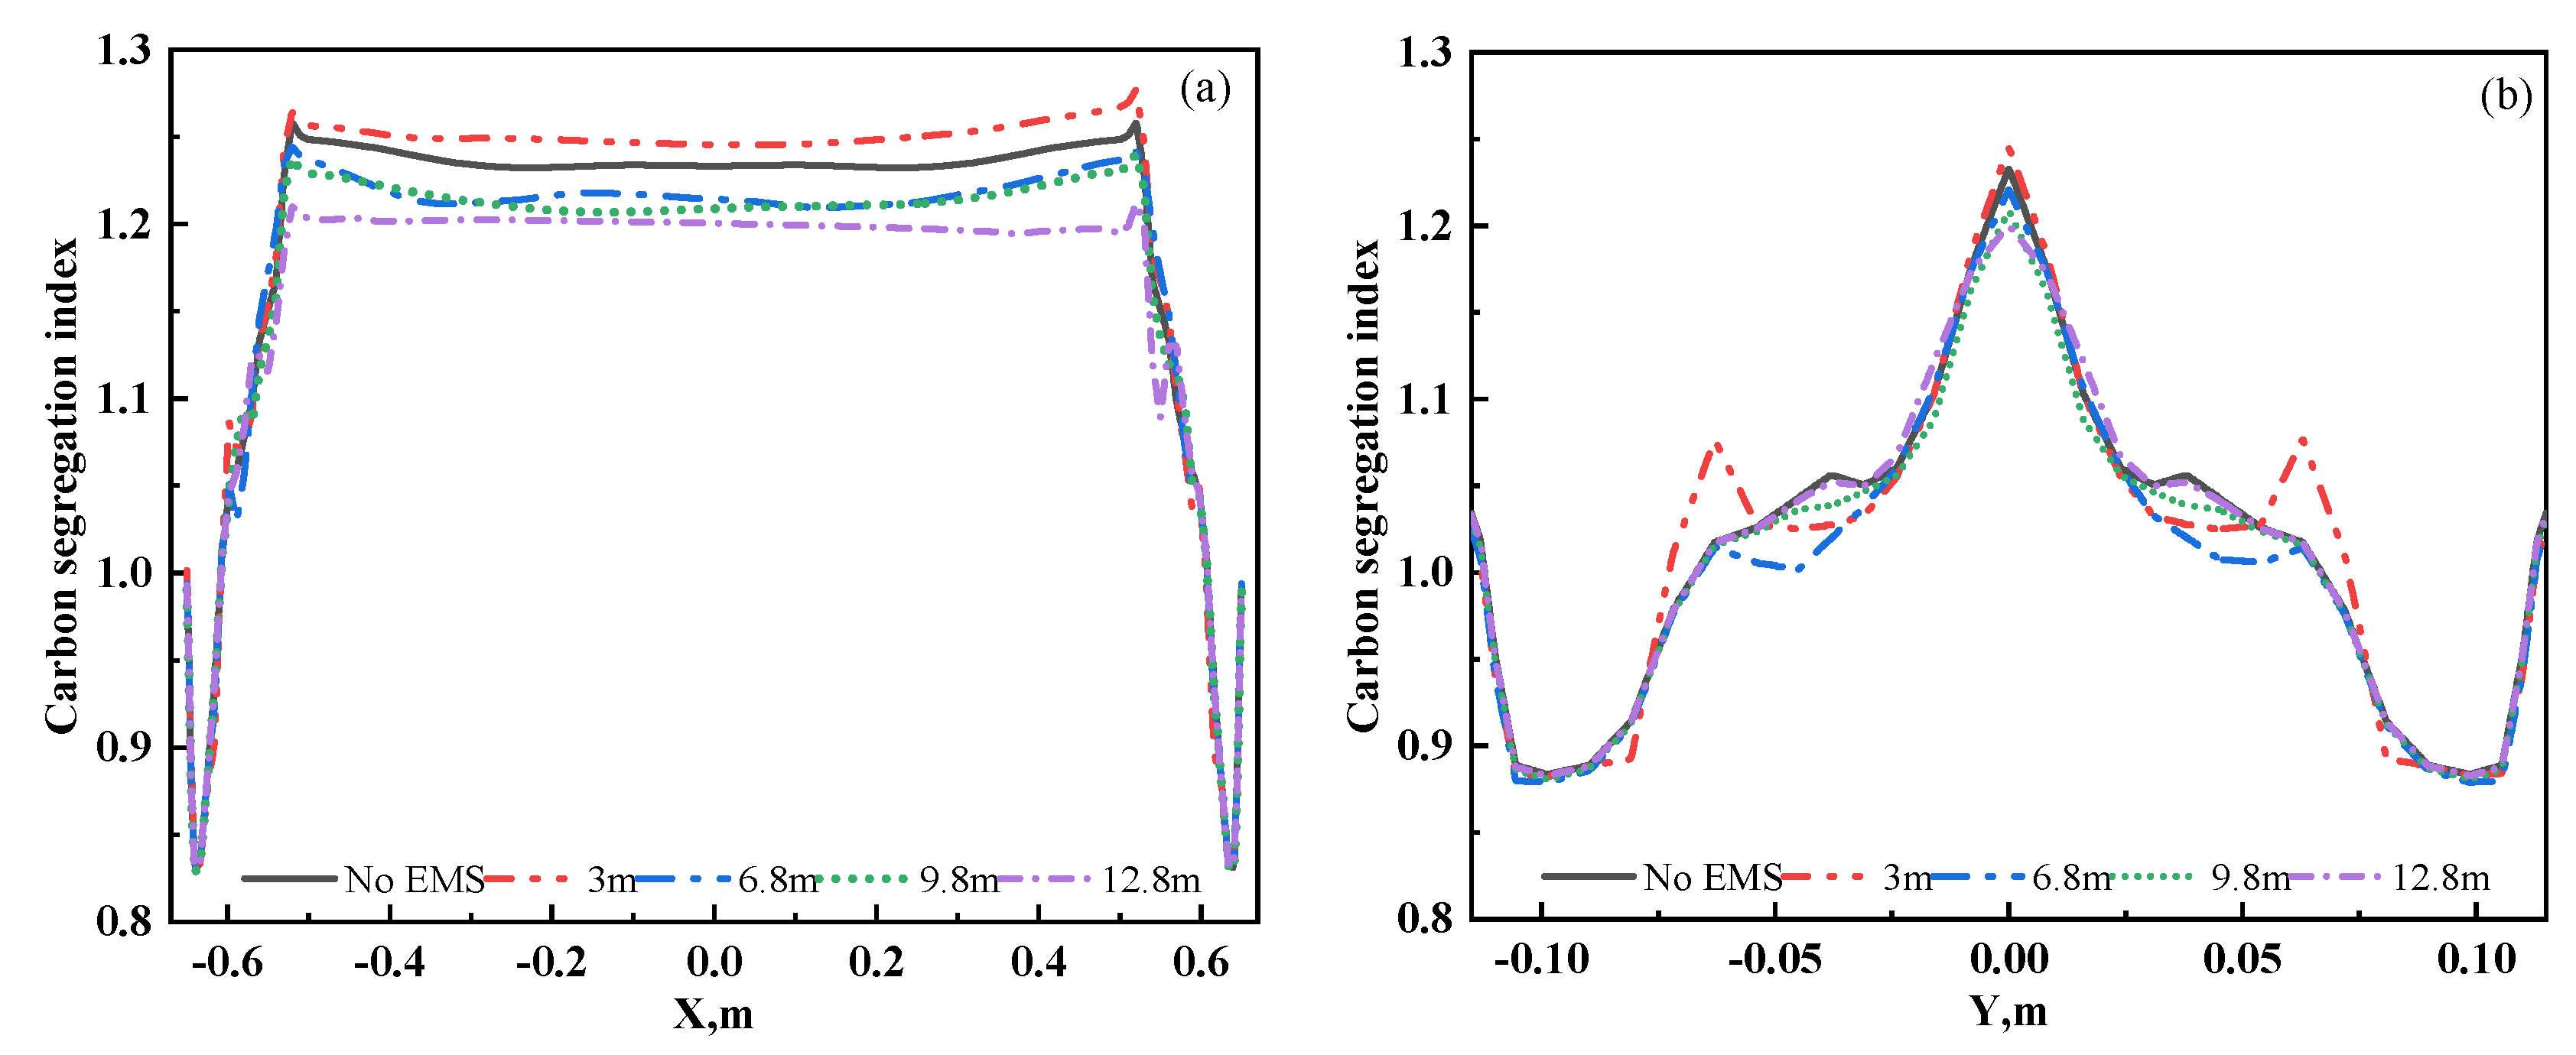
Figure 18 shows the distribution of CInd along the width direction at the section z = −24 m. From the figure, the distribution of CInd is similar with and without electromagnetic stirring in the region of the slab shell. With S-EMS applied, the maximal CInd value in the central region decreases from 1.26 to 1.2, and its range decreases from 0.42 to 0.36. Therefore, moving the installation position of S-EMS to the solidification end is beneficial for reducing segregation and improving component uniformity.
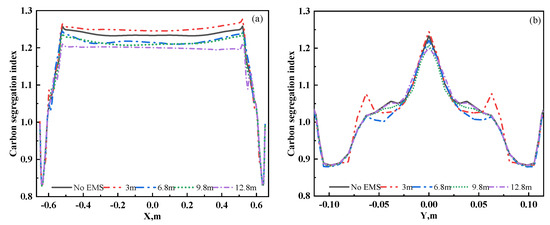
Figure 18.
Distribution of CInd along the width direction (a) and along the width direction (b) for different inbound locations on the z = −24 m section.
3.3. Industrial Trial
Industrial trials were also carried out, but the installation of S-EMS at 3 m was only analyzed due to the limitation of the facility. Grain structure and carbon segregation were compared with and without applying S-EMS. Figure 19 shows the grain structures with and without S-EMS. As shown in Figure 19, the grain structure shows a typical as-cast grain when S-EMS is not applied. The fine grain region caused by rapid cooling is focused at the edge of slab, and the columnar crystals perpendicular to the edge are focused at the inner side of the slab. There is a lack of equiaxed grains in the current situation due to the high cooling intensity that was applied for achieving a high casting speed.
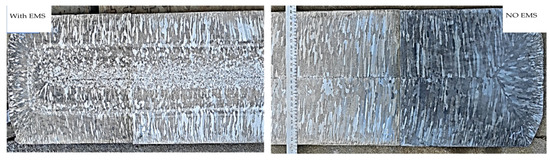
Figure 19.
Comparison of grain structure with EMS and without EMS (installed at 3 m).
Furthermore, the equiaxed grain zone was significantly increased when S-EMS was applied, as shown in Figure 19. The equiaxed grain ratio increased from 0% to 48%, with the current intensity increasing from 0 A to 350 A, which is summarized in Table 2. Figure 20 shows the segregation index distribution along the thickness direction with various current intensities. As shown in the figure, the fluctuation of CInd increases with the application of S-EMS, and its range increases from 0.34 to 0.38 with the increase in the stirring current from 0 A to 320 A. The industrial trials show that S-EMS installed at 3 m greatly increases the ratio of equiaxed grains, but it has a bad effect on alleviating carbon segregation. In the actual production process, the above two factors should be considered when selecting the appropriate stirrer installation position. In the current study, an installation position of 6.8 m should be the optimal installation position to achieve a larger equiaxed grain rate and lower segregation index.
Table 2.
Effect of current intensity on ratio of equiaxed grains.
Table 2.
Effect of current intensity on ratio of equiaxed grains.
| Current Intensity, A | Ratio of Equiaxed Grains, % |
| 0 | 30.9 |
| 200 | 32.7 |
| 250 | 44.7 |
| 300 | 46.3 |
| 350 | 46.5 |
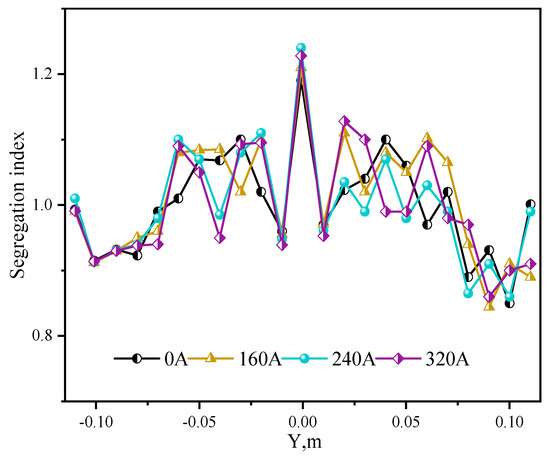
Figure 20.
Segregation index distribution along thickness direction under various current intensities.
Figure 20.
Segregation index distribution along thickness direction under various current intensities.

4. Conclusions
In this work, the effect of the S-EMS installation position on flow field, temperature, and segregation during the slab continuous casting period was investigated and evaluated through simulations and plant trials. The following conclusions can be drawn:
- (1)
- By comparing the numerical simulation results, it was found that moving the S-EMS installation position to the solidification end reduces the stirring effect due to the increased shell thickness of the slab.
- (2)
- A higher installation position of S-EMS is beneficial for increasing the equiaxed zone extension, while a lower installation position is advantageous for reducing segregation. In actual production, both factors should be considered when selecting the appropriate stirrer installation position. Based on the comparative analysis of the four installation positions studied in this paper, the 6.8 m position is selected as the optimal installation position.
- (3)
- The installation position has a great effect on central segregation. Simulation results indicate that as the installation position is reduced from 3 m to 12.8 m, the maximum segregation index and segregation range decrease from 1.26 and 0.42 to 1.2 and 0.36, respectively.
Author Contributions
Conceptualization, D.L. and G.Z.; experimental setup design, D.L., G.Z. and Y.L.; validation, D.L., J.Z. and Y.L.; analysis, G.Z., J.Z. and Y.L.; writing, D.L., G.Z., J.Z. and Y.L.; project administration, D.L. and G.Z.; funding acquisition, G.Z. All authors have read and agreed to the published version of the manuscript.
Funding
The work was supported by Hunan Zhongke Electric Co., Ltd., grant number “HZ2021F0529A”.
Data Availability Statement
Data are contained within the article.
Conflicts of Interest
Authors Jianhua Zeng and Yang Li were employed by the Pangang Group Research Institute Co., Ltd. The remaining authors declare that the research was conducted in the absence of any commercial or financial relationships that could be construed as a potential conflict of interest.
References
- Jiang, D.; Wang, W.; Luo, S.; Ji, C.; Zhu, M. Mechanism of Macrosegregation Formation in Continuous Casting Slab: A Numerical Simulation Study. Metall. Mater. Trans. B 2017, 48, 3120–3131. [Google Scholar] [CrossRef]
- Cho, S.-M.; Thomas, B.G. Electromagnetic Effects on Solidification Defect Formation in Continuous Steel Casting. JOM 2020, 72, 3610–3627. [Google Scholar] [CrossRef]
- Guan, R.; Ji, C.; Zhu, M.; Deng, S. Numerical Simulation of V-shaped Segregation in Continuous Casting Blooms Based on a Microsegregation Model. Metall. Mater. Trans. B 2018, 49, 2571–2583. [Google Scholar] [CrossRef]
- Kunstreich, S. Electromagnetic stirring for continuous casting (part 2). Rev. Metall. 2003, 100, 1043–1061. [Google Scholar] [CrossRef]
- Poole, G.M.; El-Kaddah, N. An Improved Model for the Flow in an Electromagnetically Stirred Melt during Solidification. Metall. Mater. Trans. B 2013, 44, 1531–1540. [Google Scholar] [CrossRef]
- Zeng, J.; Chen, W.; Wang, Q.; Wang, G. Improving Inner Quality in Continuous Casting Rectangular Billets: Comparison Between Mechanical Soft Reduction and Final Electromagnetic Stirring. Trans. Indian Inst. Met. 2016, 69, 1623–1632. [Google Scholar] [CrossRef]
- Guan, R.; Ji, C.; Wu, C.; Zhu, M. Numerical modelling of fluid flow and macrosegregation in a continuous casting slab with asymmetrical bulging and mechanical reduction. Int. J. Heat Mass Transf. 2019, 141, 503–516. [Google Scholar] [CrossRef]
- Jiang, D.; Wang, W.; Luo, S.; Ji, C.; Zhu, M. Numerical simulation of slab centerline segregation with mechanical reduction during continuous casting process. Int. J. Heat Mass Transf. 2018, 122, 315–323. [Google Scholar] [CrossRef]
- Wang, Y.; Zhang, L.; Yang, W.; Ji, S.; Ren, Y. Effect of Mold Electromagnetic Stirring and Final Electromagnetic Stirring on the Solidification Structure and Macrosegregation in Bloom Continuous Casting. Steel Res. Int. 2021, 92, 2000661. [Google Scholar] [CrossRef]
- Wang, F.; Wang, X.; Cui, J. Effect of Low-Frequency Electromagnetic Casting on Micro-Structure and Macro-Segregation of 5A90 Alloy Ingots. Materials 2020, 13, 2720. [Google Scholar] [CrossRef] [PubMed]
- Yao, C.; Wang, M.; Ni, Y.; Gong, J.; Xing, L.; Zhang, H.; Bao, Y. Effects of Secondary Cooling Segment Electromagnetic Stirring on Solidification Behavior and Composition Distribution in High-Strength Steel 22MnB5. JOM 2022, 74, 4823–4830. [Google Scholar] [CrossRef]
- Trindade, L.B.; Nadalon, J.E.A.; Contini, A.C.; Barroso, R.C. Modeling of Solidification in Continuous Casting Round Billet with Mold Electromagnetic Stirring (M-EMS). Steel Res. Int. 2017, 88, 1600319. [Google Scholar] [CrossRef]
- Guan, R.; Ji, C.; Zhu, M. Modeling the Effect of Combined Electromagnetic Stirring Modes on Macrosegregation in Continuous Casting Blooms. Metall. Mater. Trans. B 2020, 51, 1137–1153. [Google Scholar] [CrossRef]
- Gong, J.; Liu, H.; Wang, X.; Bao, Y. Numerical Simulation of Electromagnetic Field and Flow Pattern in a Continuous Slab Caster with In-roll Type Strand Electromagnetic Stirring. J. Iron Steel Res. Int. 2015, 22, 414–422. [Google Scholar] [CrossRef]
- Li, S.; Han, Z.; Zhang, J. Numerical Modeling of the Macrosegregation Improvement in Continuous Casting Blooms by Using F-EMS. JOM 2020, 72, 4117–4126. [Google Scholar] [CrossRef]
- Xiao, H.; Wang, P.; Yi, B.; Chen, X.; Li, A.; Tang, H.; Li, W.; Zhang, J. A Numerical and Experimental Study on the Solidification Structure of Fe-Cr-Ni Steel Slab Casting by Roller Electromagnetic Stirring. Metals 2021, 11, 6. [Google Scholar] [CrossRef]
- Xin, W.; Zheng, S.-G.; Zhu, M.-Y. Fluid flow, solidification and solute transport in billet continuous casting with different stirrer positions. Ironmak. Steelmak. 2022, 49, 343–353. [Google Scholar]
- Dong, Q.; Jiongming, Z.; Yin, Y.; Nagaumi, H. Numerical simulation of macrosegregation in billet continuous casting influenced by electromagnetic stirring. J. Iron Steel Res. Int. 2022, 29, 612–627. [Google Scholar] [CrossRef]
- Song, X.P.; Cheng, S.S.; Cheng, Z.J. Mathematical modelling of billet casting with secondary cooling zone electromagnetic stirrer. Ironmak. Steelmak. 2013, 40, 189–198. [Google Scholar] [CrossRef]
- Liu, H.; Wang, Z.; Qiu, H. Numerical Simulation of Fluid Flow and Solidification in a Vertical Round Bloom Caster Using a Four-port SEN with Mold and Strand Electromagnetic Stirring. ISIJ Int. 2022, 60, 1924–1937. [Google Scholar] [CrossRef]
- Wang, R.; Bao, Y.; Li, Y.; An, H. Optimization of strand and final electromagnetic stirrers of round bloom casters with multiple sections. Int. J. Miner. Metall. Mater. 2016, 23, 1150–1156. [Google Scholar] [CrossRef]
- Jiang, D.; Zhu, M.; Lifeng, Z. Numerical Simulation of Solidification Behavior and Solute Transport in Slab Continuous Casting with S-EMS. Metals 2019, 9, 452. [Google Scholar] [CrossRef]
- Li, X.; Wang, X.; Bao, Y.; Gong, J.; Pang, W.; Wang, M. Effect of Electromagnetic Stirring on the Solidification Behavior of High-Magnetic-Induction Grain-Oriented Silicon Steel Continuous Casting Slab. JOM 2020, 72, 3628–3633. [Google Scholar] [CrossRef]
- Li, Y.; Deng, A.; Yang, B.; Xu, H.; Wang, E. Inhibiting bulging deformation of liquid metal free surface by magnetic pressure. J. Iron Steel Res. Int. 2020, 28, 818–829. [Google Scholar] [CrossRef]
- Li, Y.; Deng, A.Y.; Li, H.; Yang, B.; Wang, E.G. Numerical Study on Flow, Temperature, and Concentration Distribution Features of Combined Gas and Bottom-Electromagnetic Stirring in a Ladle. Metals 2018, 8, 76. [Google Scholar] [CrossRef]
- Luo, S.; Li, K.; Wang, W.; Zhu, M. Numerical simulation of macro-segregation in continuously cast slab with application of S-EMS and MR. J. Mater. Res. Technol. 2023, 24, 6893–6907. [Google Scholar] [CrossRef]


Disclaimer/Publisher’s Note: The statements, opinions and data contained in all publications are solely those of the individual author(s) and contributor(s) and not of MDPI and/or the editor(s). MDPI and/or the editor(s) disclaim responsibility for any injury to people or property resulting from any ideas, methods, instructions or products referred to in the content. |
© 2024 by the authors. Licensee MDPI, Basel, Switzerland. This article is an open access article distributed under the terms and conditions of the Creative Commons Attribution (CC BY) license (https://creativecommons.org/licenses/by/4.0/).