Article

Fracture Model of Al–Cu Alloys with Gradient Crystals Based on Crystal Plasticity

The Department of Engineering Mechanics, Kunming University of Science and Technology, Kunming 650000, China
*
Authors to whom correspondence should be addressed.
Metals 2024, 14(6), 694; https://doi.org/10.3390/met14060694
Submission received: 17 April 2024 / Revised: 3 June 2024 / Accepted: 6 June 2024 / Published: 12 June 2024

Abstract

:
Gradient grain structure materials with superior mechanical properties of high strength and high toughness have attracted widespread attention. Gradient materials can effectively improve toughness by constructing a microstructure from fine to coarse crystals inside the material, which has gradually become a hotspot of attention in the academic and engineering communities. In this paper, based on the crystal plasticity intrinsic theory, dislocation density is introduced as a characterization quantity, and cohesive units are added at grain boundaries to simulate damage fractures. The results of this study reveal the fracture damage mechanism of gradient crystal structure materials, providing new ideas and methods for the design of gradient materials.

1. Introduction

Al–Cu is widely used in aerospace, sheet metal, machining, and other fields; it is particularly necessary to study the strength and fracture properties of this kind of alloy. Gradient crystals combine the strength advantage of nanocrystals and the plastic deformation advantage of coarse crystals to construct the microstructure from fine crystals to coarse crystals, which can effectively improve the strength (yield strength) of the material while maintaining a considerable degree of toughness, and gradually become a hotspot of interest in academia and the engineering community [1,2,3,4,5,6]. Thanks to the rapid development of microstructure modeling, computer computation, micro- and nano-scale microscopy, and finite element calculation software, multi-scale modeling methods based on crystal plasticity (CP) theory have been widely used.
A large amount of work has been reported on the preparation, characterization, and mechanical property testing of gradient grain-structured materials. Wang Chenglin et al. [7] studied and analyzed gradient nano-metals and found that gradient nano-materials have better strain hardening. Aleksandr Korchuganov et al. [8] investigated the fracture behavior of single-phase (FCC) and two-phase (FCC, BCC) Fe95Ni5 specimens with a gradient crystalline structure under uniaxial tensile action. It was shown that fracture initiation and extension are always related to grain boundaries. Qi Wang et al. [9] investigated the effect of grain size and precipitation on creep properties, fracture toughness, and crack extension behavior, and showed that there were persistent and subtle compositional changes in the prepared gradient materials. A Xinlai et al. [10] conducted micro tensile tests on gradient nanostructures (GNSs) and three nanostructured layers, respectively, to investigate the interactions between the nanostructured layers constituting the GNS in Ni alloys with surface mechanical rolling treatment, and the results showed the enhancement of the strain gradient was caused by the incompatibility of the mechanical properties of the various nanostructured layers. M.N. Hasan et al. [11] used the rotary accelerated shot peening technique to introduce graded microstructures with different gradients in CoCrFeNiMn high-entropy alloys, and quantitative analyses showed that deformation twins (including hierarchical nano-twins) were more important in contributing to hardness and strain hardening capacity than dislocation slip. Yao Wang [12] and others found that the yield strength of polycrystalline metals with a gradient structure can be significantly increased without reducing the ductility. However, most of the above lacked theoretical models to effectively predict their mechanical properties and the optimal matching of strength and toughness of gradient grain-structured materials remains at the experimental attempt stage [13]. In addition, although a large number of experimental works have been carried out to investigate the strengthening theory of gradient grain structure materials, most of them are empirical inferences that lack an in-depth and comprehensive understanding of their fundamental sources. Due to this limitation, research on the fracture behavior of gradient grain structure is rarely reported, which limits the optimization of the performance and engineering service of gradient grain structure materials to a certain extent.
The multi-scale modeling approach to gradient crystals through crystal plasticity theory started late in 2015. Zeng et al. [14] studied the single tensile deformation behavior of gradient-grained copper for the first time using the crystal plasticity finite element method, and Qihong Fang et al. [15] used molecular dynamics simulations and found that the yield strength of gradient nanograin Fe exceeded that of random nanograin Fe. The cyclic deformation of Cu with a GNG surface layer exhibits a larger fatigue limit compared to the coarse grain structure. Li et al. [16] used molecular dynamics to simulate the deformation behavior and microstructural evolution of gradient nanograin alloys with a BCC structure and found that grain boundaries dominate the yield strength, while the back stress contributes the most to the strain hardening of nanograin materials. Hanxun Jin et al. [17] developed a gradient intrinsic model considering the interaction of dislocations between neighboring phases with different grain sizes and showed that simulations of gradient Cu and coarse-grained Cu considering the growth mechanism of nanograins agree well with the experimental data. The simulation results of gradient and coarse-grained copper with a nanograin growth mechanism are in good agreement with the experimental data. Jianfeng Zhao et al. [18] predicted the uniaxial tensile behavior of gradient nanostructured (GNG) interstitial-free (IF) atomic steel plates using a multi-mechanism ontological model and finite element simulations based on the microstructure. The simulation results showed that the GND and back stress at the specimen level have little effect on the strengthening effect of GNG IF steels, while the back stress caused by stacked GND contributes about 35% to the flow stress. He Chen-Yun et al. [19] used molecular dynamics simulations to investigate the tensile properties of GNG copper structures and their associated deformation mechanisms. The results showed that the inhomogeneity of grain size leads to the inhomogeneity of stress distribution, and the larger gradient has higher strength in the scale range. Li-Ya Liu [20] and others even combined the crystal plasticity finite element method and cohesive unit to study the cracking mechanism of polycrystalline aluminum with different grain gradient structures under tensile loading, and determined the parameters of the cohesive unit by using the molecular dynamics method, finding that the initial microcracks at different locations, numbers, and angles have a great influence on the cracking mechanism and effective properties of the whole material. Simulation work for the deformation of gradient grain structure materials at fine microscopic scales can effectively help us understand the fracture mechanism and prediction of gradient grain structure materials. Xu Like et al. [21] investigated the plasticity inhomogeneity in three different GNG-structured face-centered cubic metals (Cu, Al, Ni) from the plasticity perspectives of dislocations, deformation twins, and grain boundaries through large-scale molecular dynamics simulations. It was found that the plasticity based on dislocations and deformation twins exhibits a significant metal type dependence. Sedaghat et al. [22] implemented two methods for determining the geometrically necessary dislocation density in a finite element model of crystal plasticity with low-order strain gradients, and the results showed that the difference between the grain-scale stresses calculated by the two methods is very small and is close to that of the measured results. However, the magnitude and distribution of the dislocation density calculated by the two methods are quite different. In conclusion, the multi-scale modeling method reveals the deformation patterns of different grain sizes in the gradient grain structure materials, indicating that the strength of gradient grain structure materials is even higher than that of the smallest sized nanocrystals in them. Finite element simulation considers the dependence of model parameters on grain size and analyzes the gradient stress and strain fields introduced by the gradient microstructure as well as the mechanical properties of the gradient grain-structured material, which provides a simple prediction of the mechanical behavior of the gradient grain-structured material.
In this paper, based on the crystal plasticity finite element method [23,24,25] (CPFEM), which is a combination of crystal plasticity theory and the finite element method, an intrinsic model based on dislocation density [26,27,28] is established to provide a reasonable description of the deformation behavior of materials with gradient grain structures and the deformation damage of the gradient grain structure is simulated by adding the cohesive unit at the grain boundary to simulate the fracture damage of gradient grain structure materials. The related research results will reveal the fracture damage mechanism of gradient crystal structure materials in depth and detail and realize the breakthrough of gradient crystal structure materials as well as similar non-homogeneous structure materials, which will provide new ideas for the design of gradient crystal structures.

2. Methods and Materials

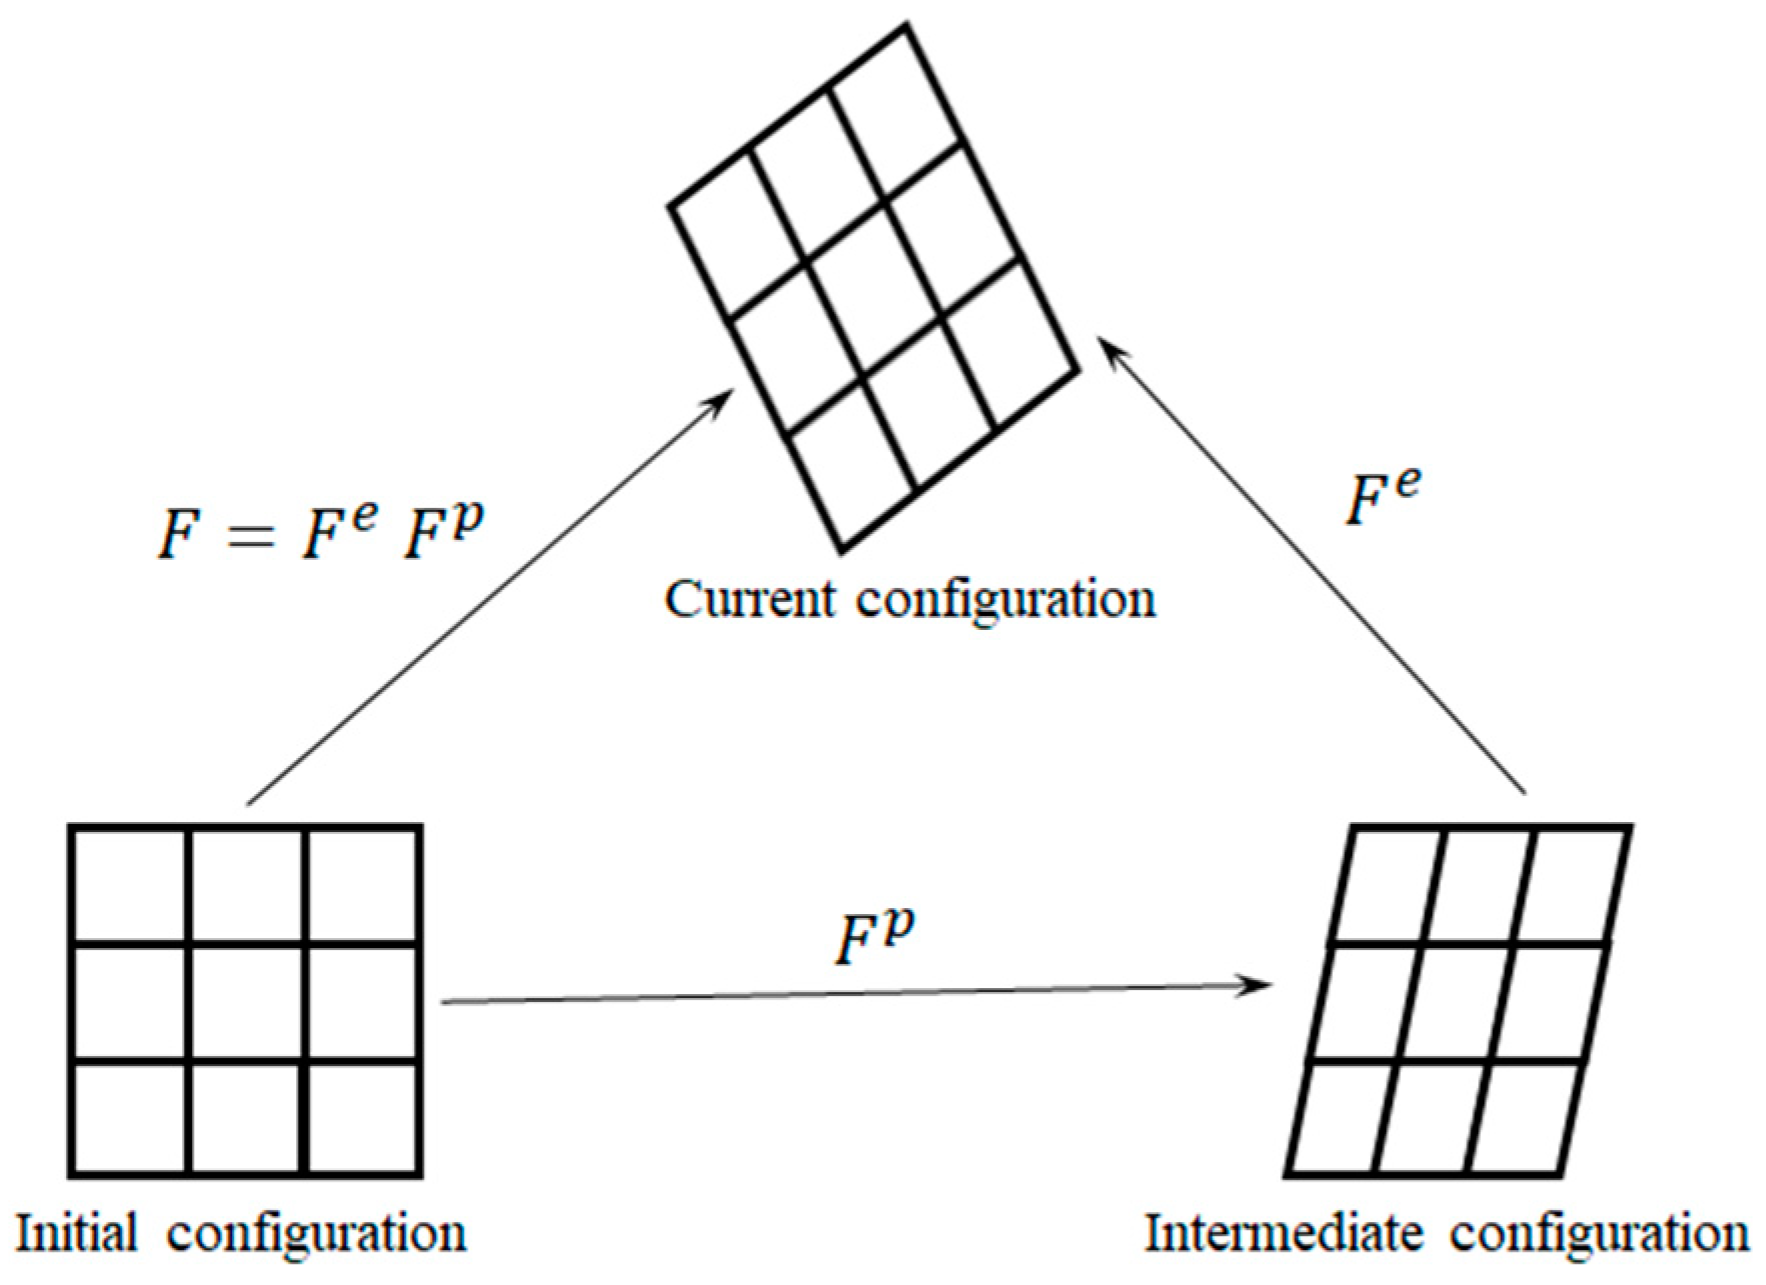
2.1. Crystal Plasticity Finite Element Model
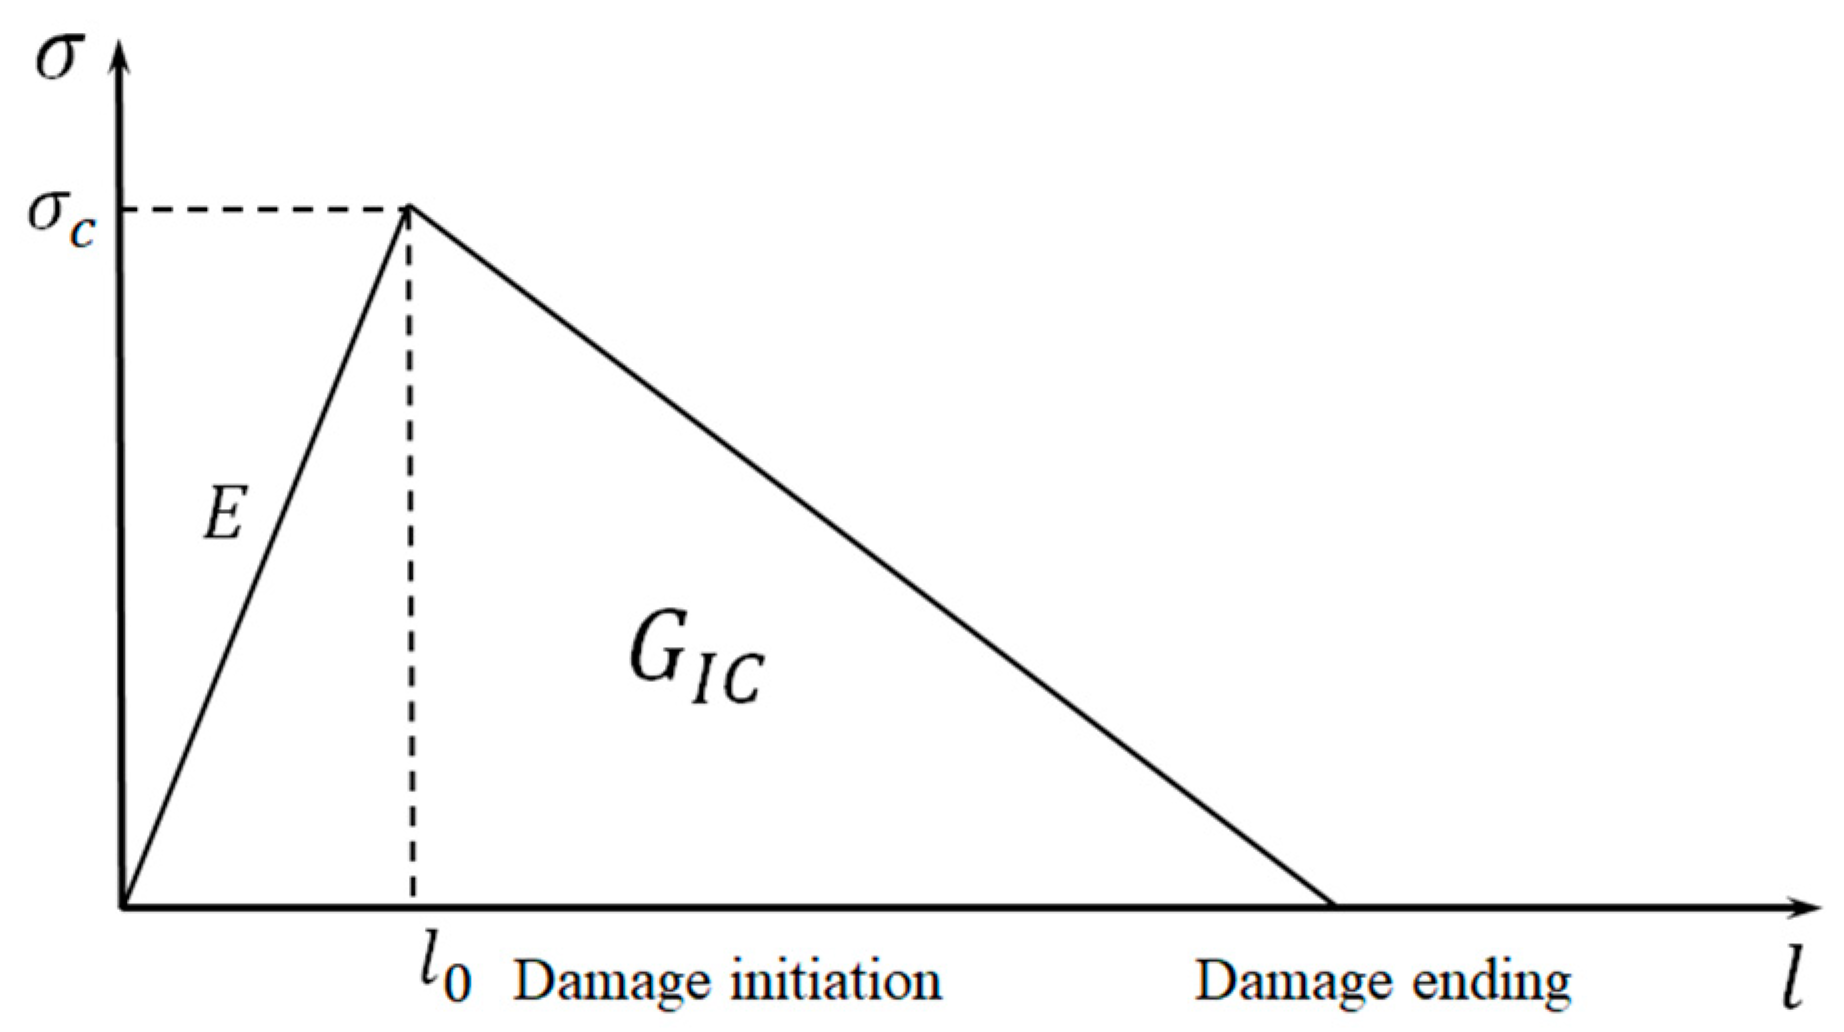
The traditional Crystal Plastic Constitutive Model (CPCM) is mainly based on the Taylor model, and Hill and Rice et al. [29] have given a rigorous description of the plastic deformation of crystals from a mechanical point of view. Refer to Table 1 for symbol explanation (Table 1).
As shown in Figure 1, the lattice reaches the intermediate configuration from the initial configuration by plastic deformation, and then the lattice elastic distortion makes it possible to reach the current configuration from the intermediate configuration. The deformation gradient can be expressed in Equation (1).
F = F e F p
where F e and F p represent elastic and plastic deformation, respectively.
The velocity gradient can be decomposed as
L = F ˙ F 1 = L e + L p
where L e and L p represent elastic and velocity gradient, respectively.
The plastic deformation of the crystal is partly caused by dislocation slip, then the plastic velocity gradient can be expressed as
L p = α n s s γ ˙ s n
nss denotes the number of slip systems, s and n denote the slip direction and slip surface normal, respectively. γ ˙ is the shear rate of the slip system and is expressed as
γ ˙ = γ ˙ 0 ( τ τ r e f ) 1 / m
γ ˙ 0 denotes the initial plastic slip rate for each slip regime. τ r e f is the initial shear strength of the slip system.
In 1934, Taylor [30], through the deformation of metal single crystals and rock salts, found that most of the shear deformation is along the crystal axial direction. It was deduced that the plastic deformation of crystals is the shear deformation caused by dislocation slippage, and the following equation was obtained:
τ r e f = G | b α | d α = G | b α | ρ i m α
where G is the shear modulus, b α is Burgers vector. ρ i m α is immobile dislocation density. Zikry [31] proposed the evolution of dislocation density.
ρ ˙ m = | γ ˙ | ( g s ρ i m ( ρ m 1 ) g m 0 ρ m g i m 0 ρ i m )
ρ ˙ i m = | γ ˙ | ( g m 1 ρ m + g i m 1 ρ i m g r ρ i m exp ( Δ H k T ( 1 ρ i m ρ i m s a t ) ) )

2.2. Cohesive Model

A cohesive model to describe the evolution of interfacial damage [28] is shown in Figure 2.
Figure 2 is divided into two phases. An ascending phase is a linear phase with a slope related to the stiffness of the cohesive unit, that is, E and G in Formula (10); the stress and displacement of the highest point are the critical stress and critical displacement, which are represented by σ 0 , ε 0 in Formulas (11) and (12), G I C stands for fracture energy, which is visually represented in the diagram as the triangular area, the stress and displacement product. A descending phase is the damage phase of the model. The highest point of the model indicates the point where the damage starts.
Assuming that n, s, and t are the normal direction of the cohesive unit as well as the two tangential directions, respectively, the relationship between the strain and the relative separation displacements is
{ δ n δ s δ t } = T { ε n ε s ε t }
Here is the thickness of the cohesive unit, which is the intrinsic thickness in cohesive calculations and usually takes the value of 1. The real thickness of the cohesive unit is often very small and almost 0. Meanwhile, the relationship between the strain and the stress of the cohesive unit is linear elasticity:
{ σ n σ s σ t } = [ C 1 0 0 0 C 2 0 0 0 C 3 ] { ε n ε s ε t }
σ n ,   σ s , and σ t are the stresses. C1, C2, and C3 are the stiffness. Stiffness and thickness satisfy the relationship
C 1 = E T , C 2 = G T , C 3 = G T
The Cohesive damage criterion in ABAQUS 6.14 can be divided into the maximum (secondary) nominal stress (variation) criterion as follows
max { σ n σ 0 , σ s σ 0 , σ t σ 0 } = 1
( σ n σ 0 ) 2 + ( σ s σ 0 ) 2 + ( σ t σ 0 ) 2 = 1
max { ε n ε 0 , ε s ε 0 , ε t ε 0 } = 1
( ε n ε 0 ) 2 + ( ε s ε 0 ) 2 + ( ε t ε 0 ) 2 = 1
The maximum nominal stress (change) criterion means that the damage starts when the stress (change) in any of the three directions reaches the critical stress (change), while the secondary nominal stress (change) criterion means that the damage occurs when the sum of the squares of the three directions reaches 1. In this paper, the secondary nominal stress criterion is adopted, and the relevant parameters are shown in Table 2.

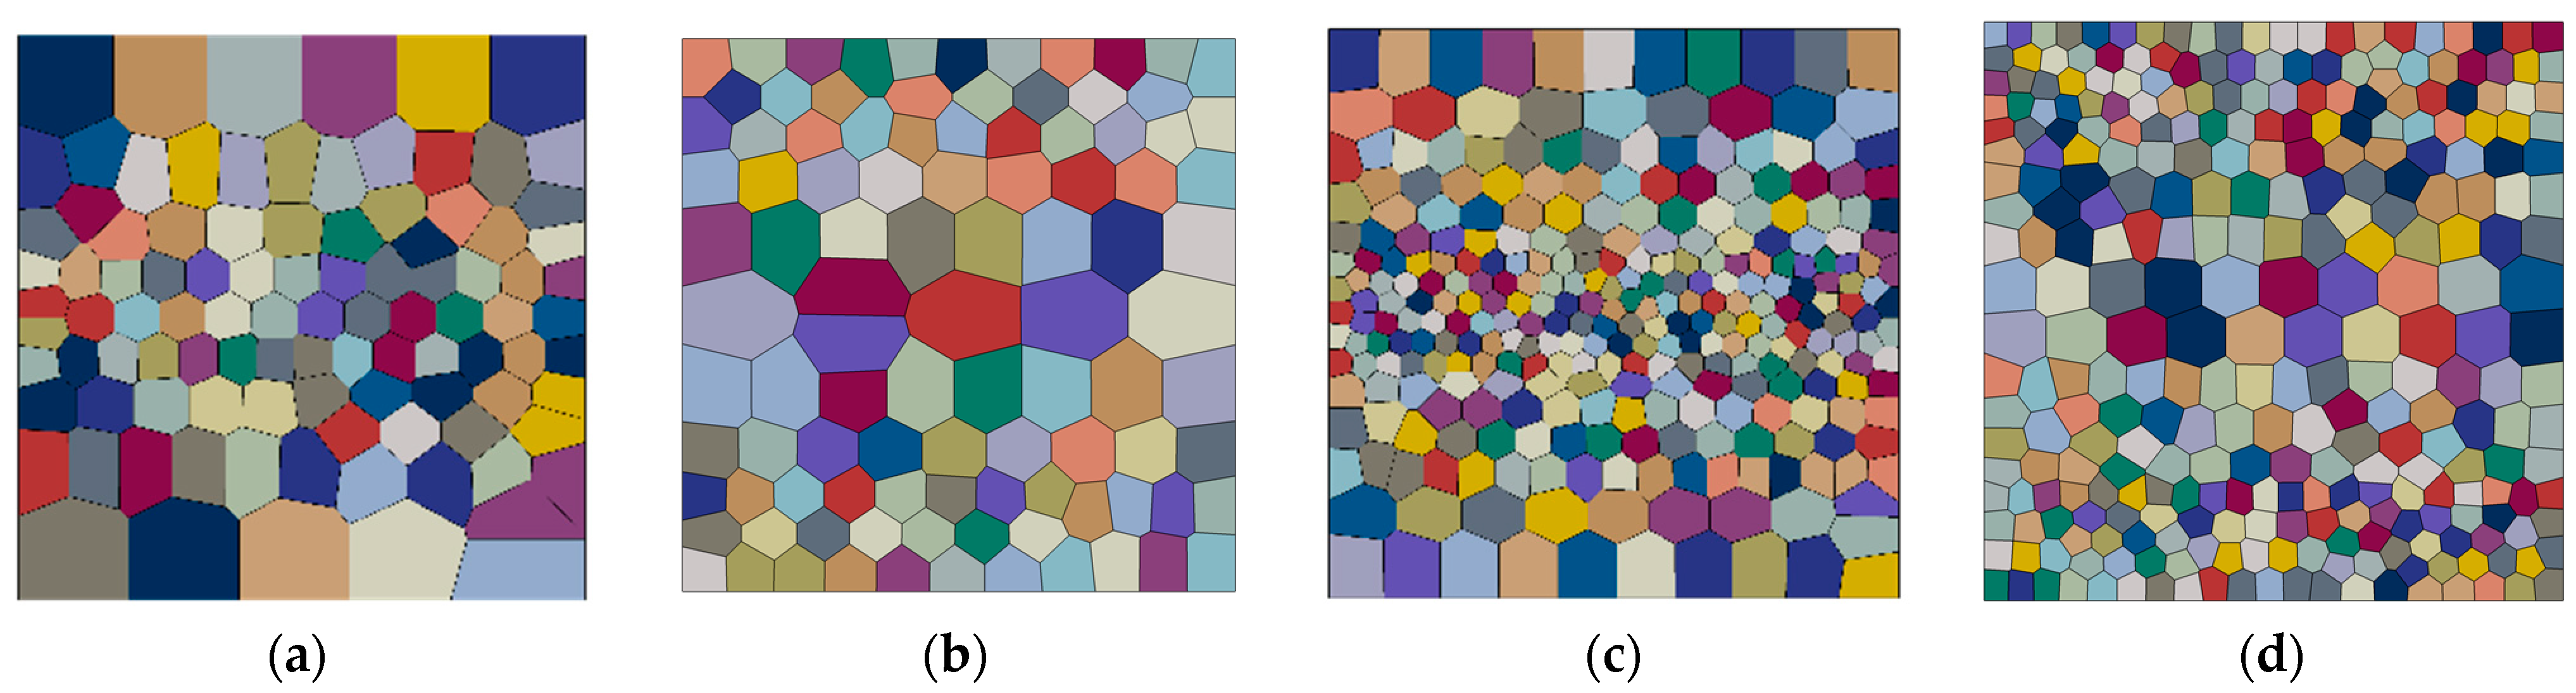
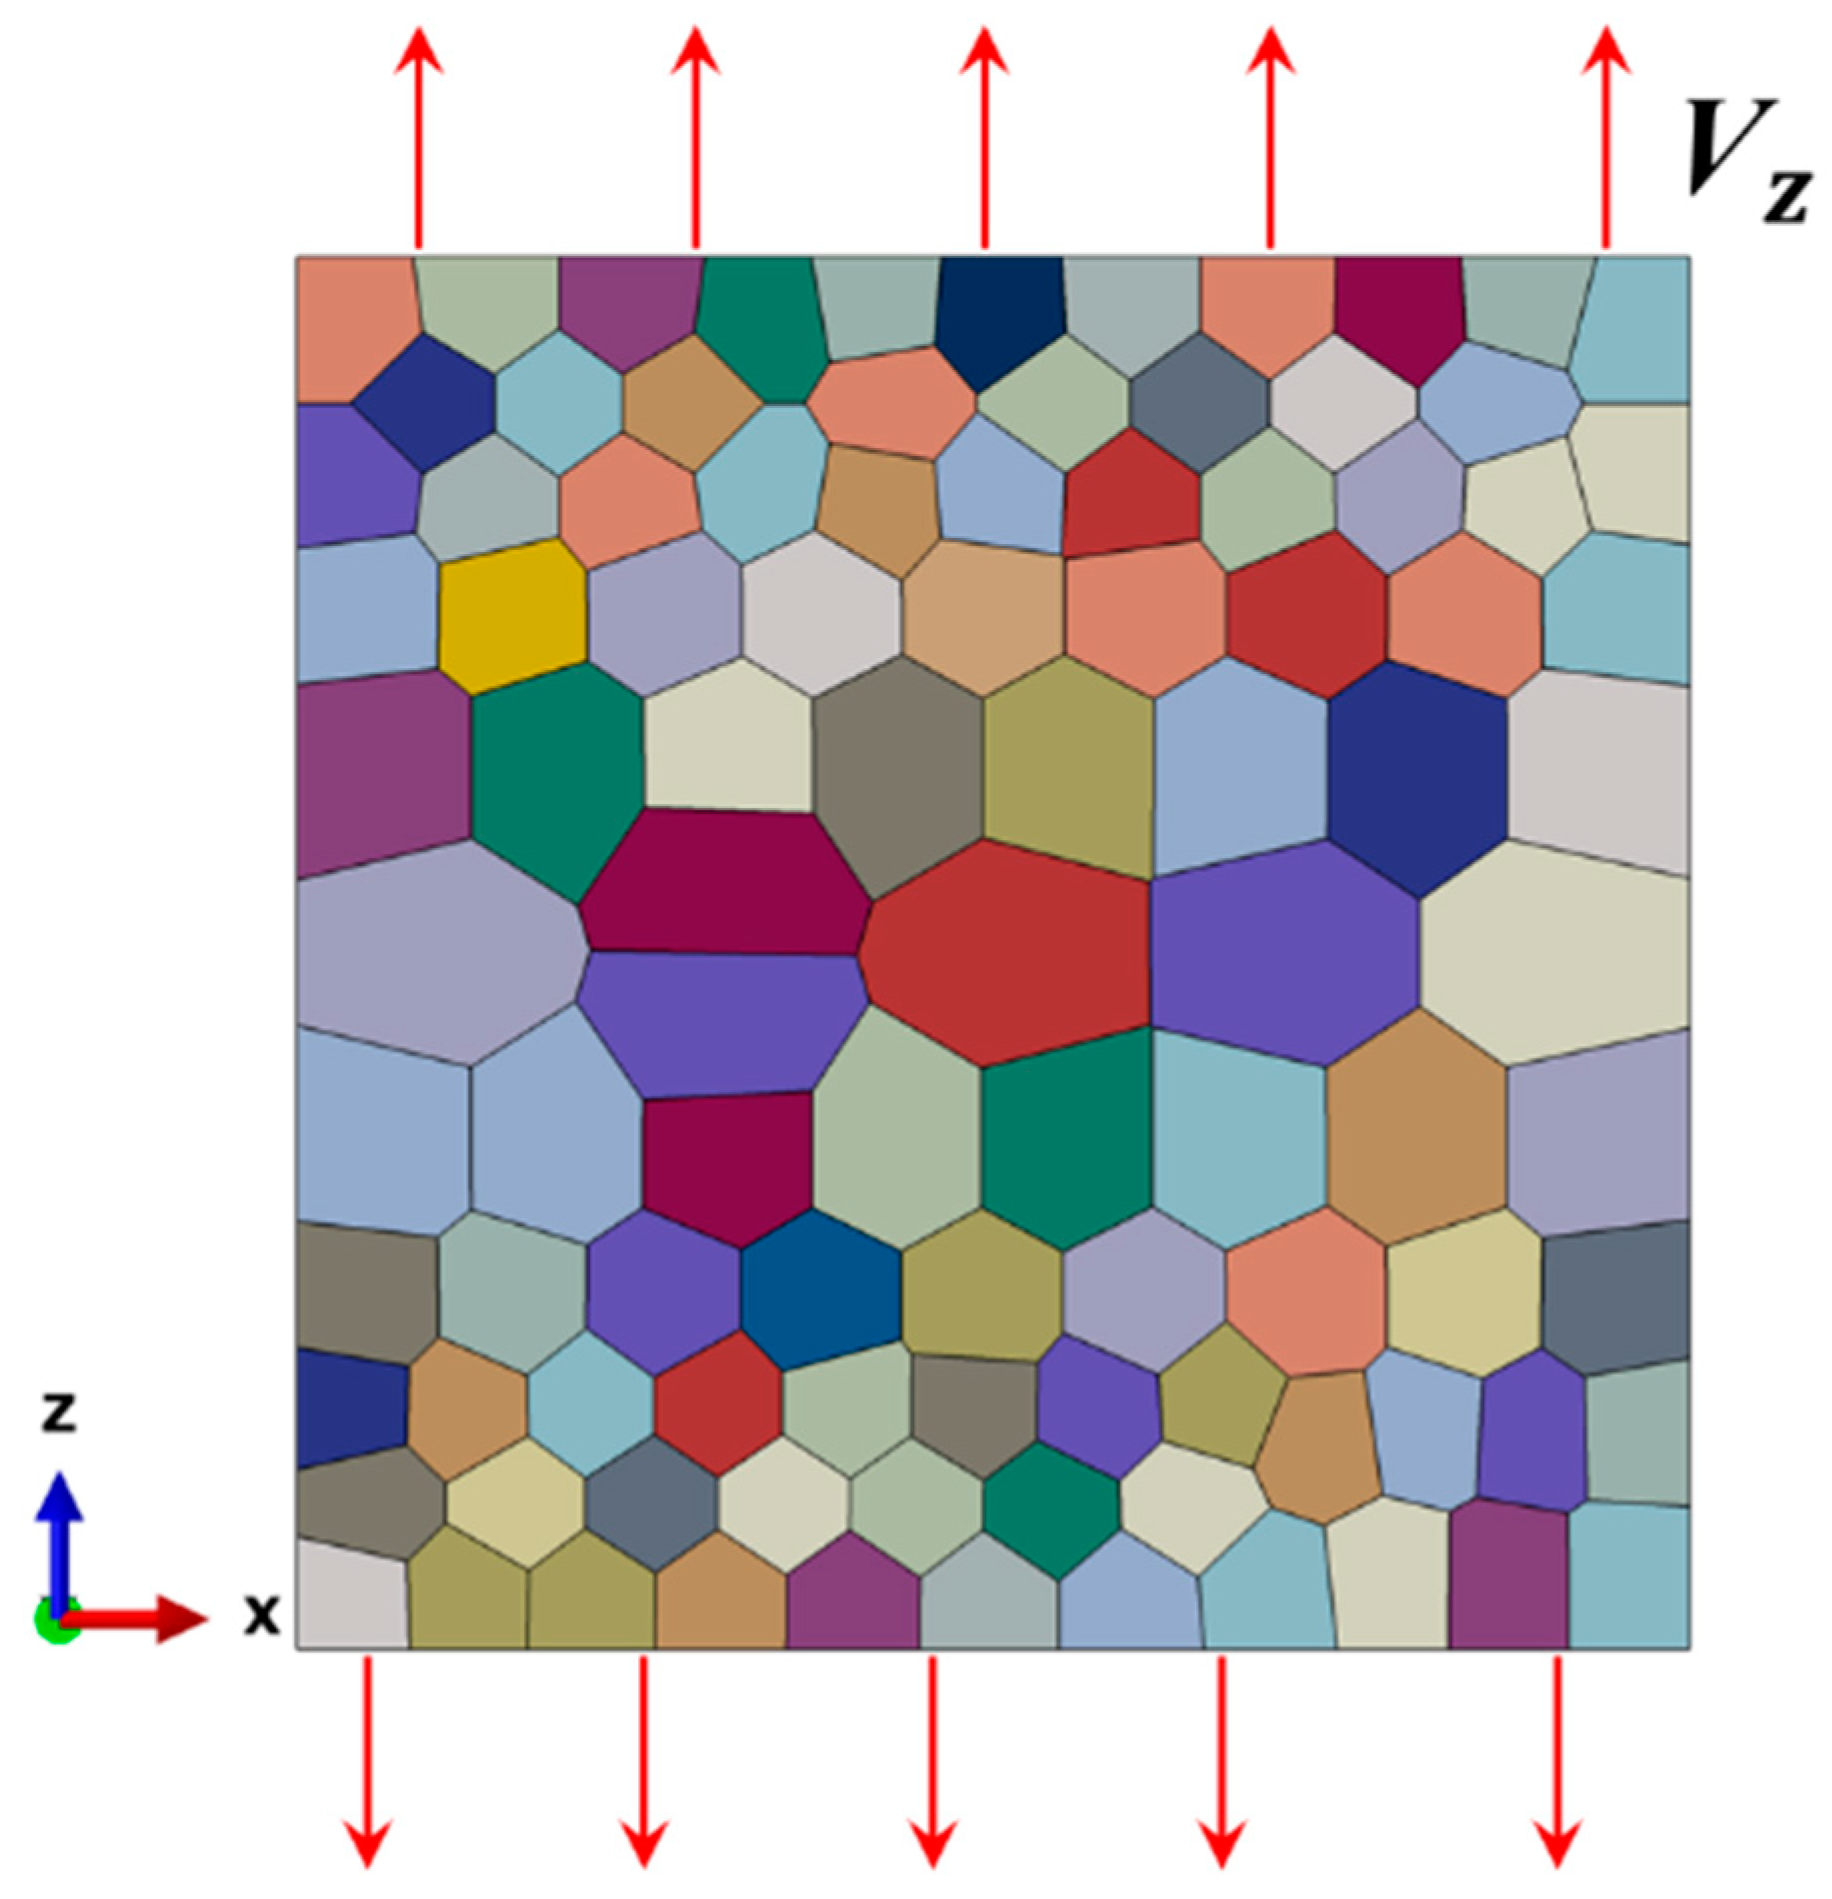
2.3. Finite Element Modeling and Materials

In this paper, the Neper is used to generate two gradient structures with 100 grains as well as 300 grains, which are middle-gradient (MG) and both sides-gradient (BG), respectively. The dimensions of the model are 10 micron*10 micron. As shown in Figure 3, grain boundaries are simultaneously generated, and cohesive units are inserted, which are used to simulate the tensile fracture behavior of the polycrystalline model, with random grain orientations, keeping the same number of grains in the same orientation.
As shown in the Figure 4. Velocity boundary conditions are applied at both ends of the model in the z-direction and the strain rate is set to 0.0001/s. The calculation efficiency of the eight-node element is higher than that of the higher-order element, and it is found that the calculation accuracy is not much different after comparing the units of different order. The cohesive unit we use at the grain boundary is the linear eight-node element of COH3D8, and the unit unity of the overall model can be guaranteed by using C3D8R. C3D8R cells are used at grains, hourglass control, as well as reduced integrals, and COH3D8 cells are used at grain boundaries, with the number of cells controlled to be around 7000–10,000 (Figure 4).
The parameters of materials are shown in Table 2. In order to improve calculation efficiency, all parameters are dimensionless, and the specific values can also be referred to in Table 3.

3. Results

In this subsection, the fracture behavior of crystals with two different gradients, MG and BG, will be investigated, mainly including the curve of stress and strain, fracture strain, and SDEG.

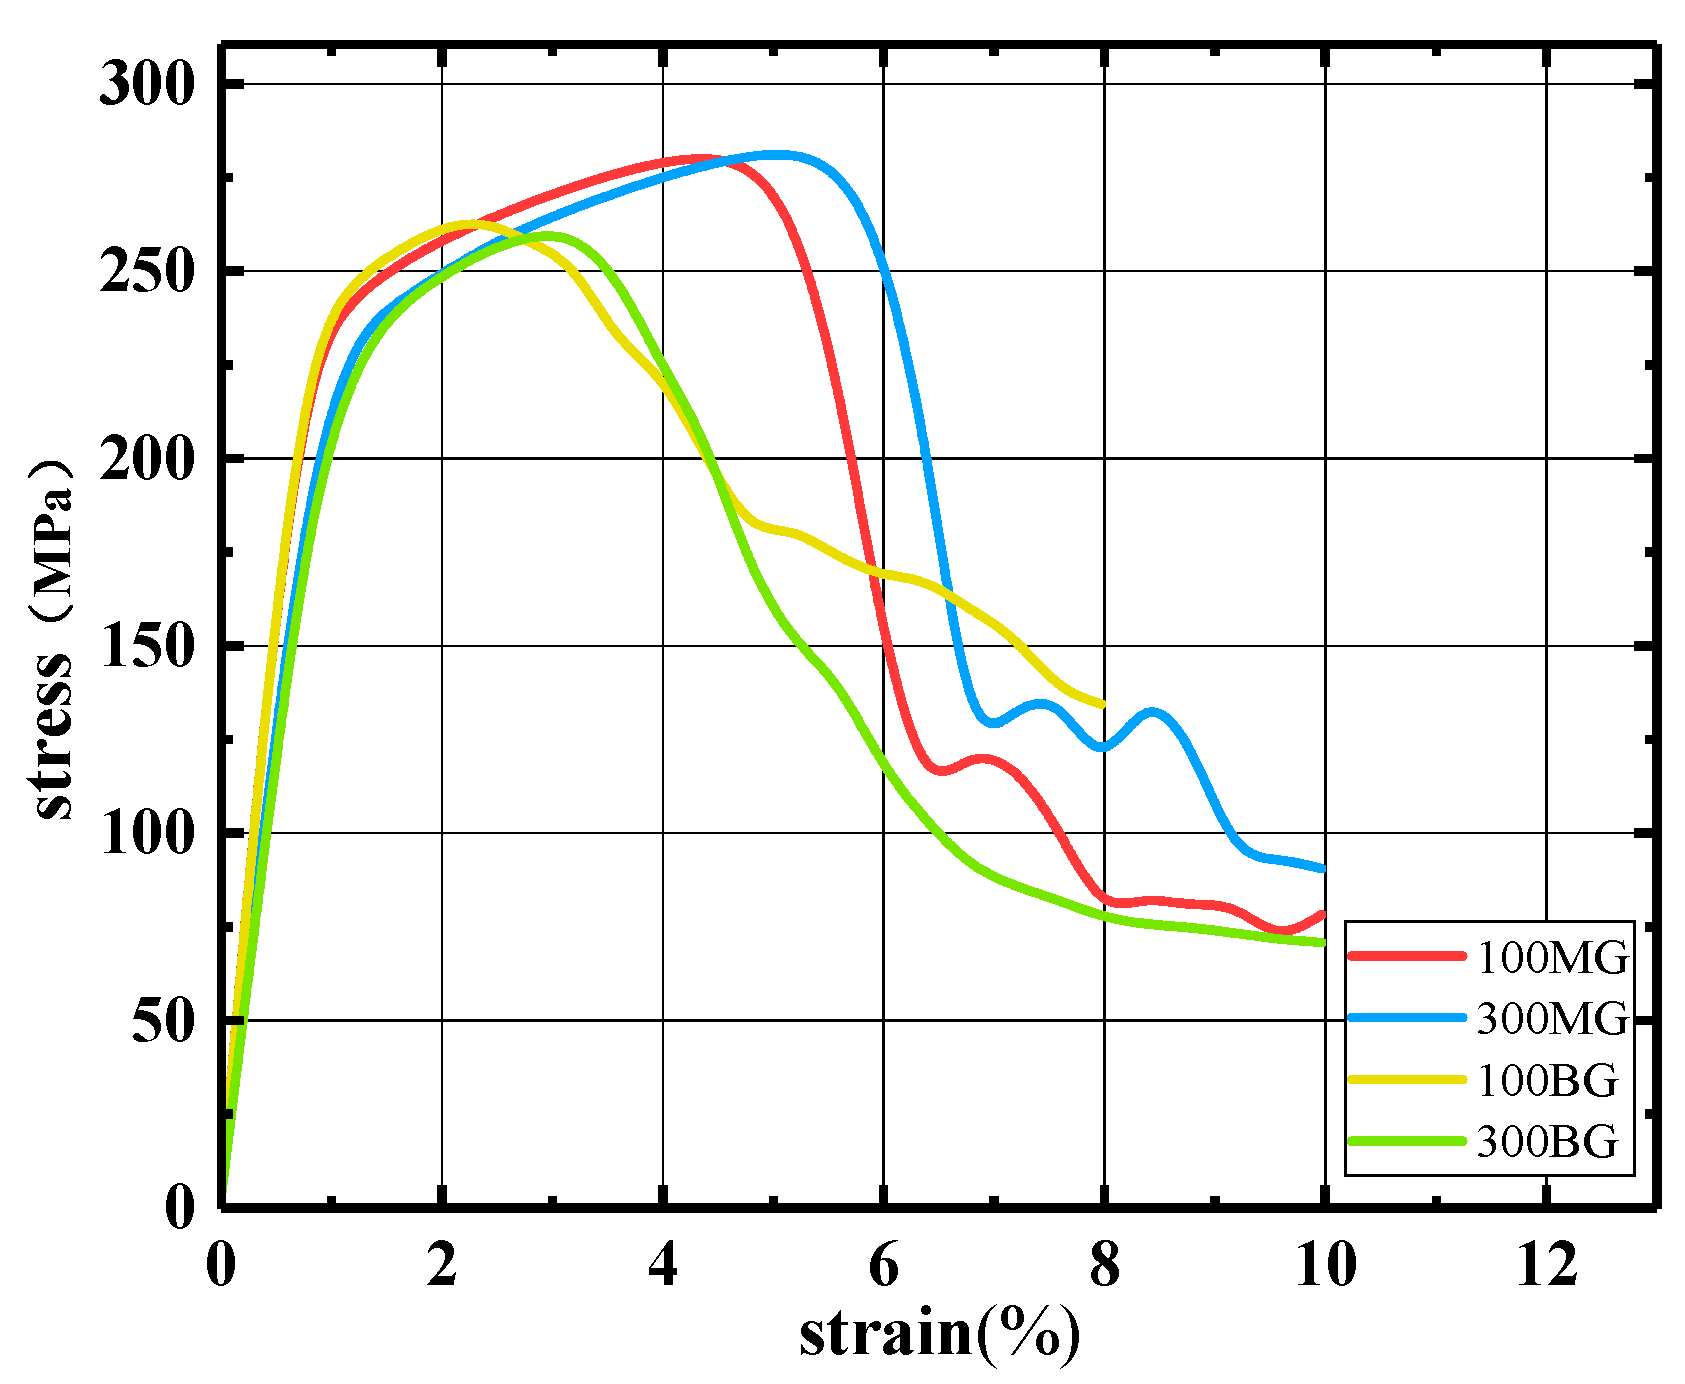
3.1. Stress–Strain Curves of Different Graded Crystals

Figure 5 shows the polycrystalline stress–strain curves for different grains and gradient shapes. The stress–strain shown in the figure is the average Mises stress of the finite element and the ratio of the displacement of the loading surface element to the length. The toughness of the MG distribution structure is much higher than that of the BG. This is because the damage starts in the coarse crystal region and gradually extends to the gradient region, and the nanocrystals make it difficult for damage to occur due to their high strength.

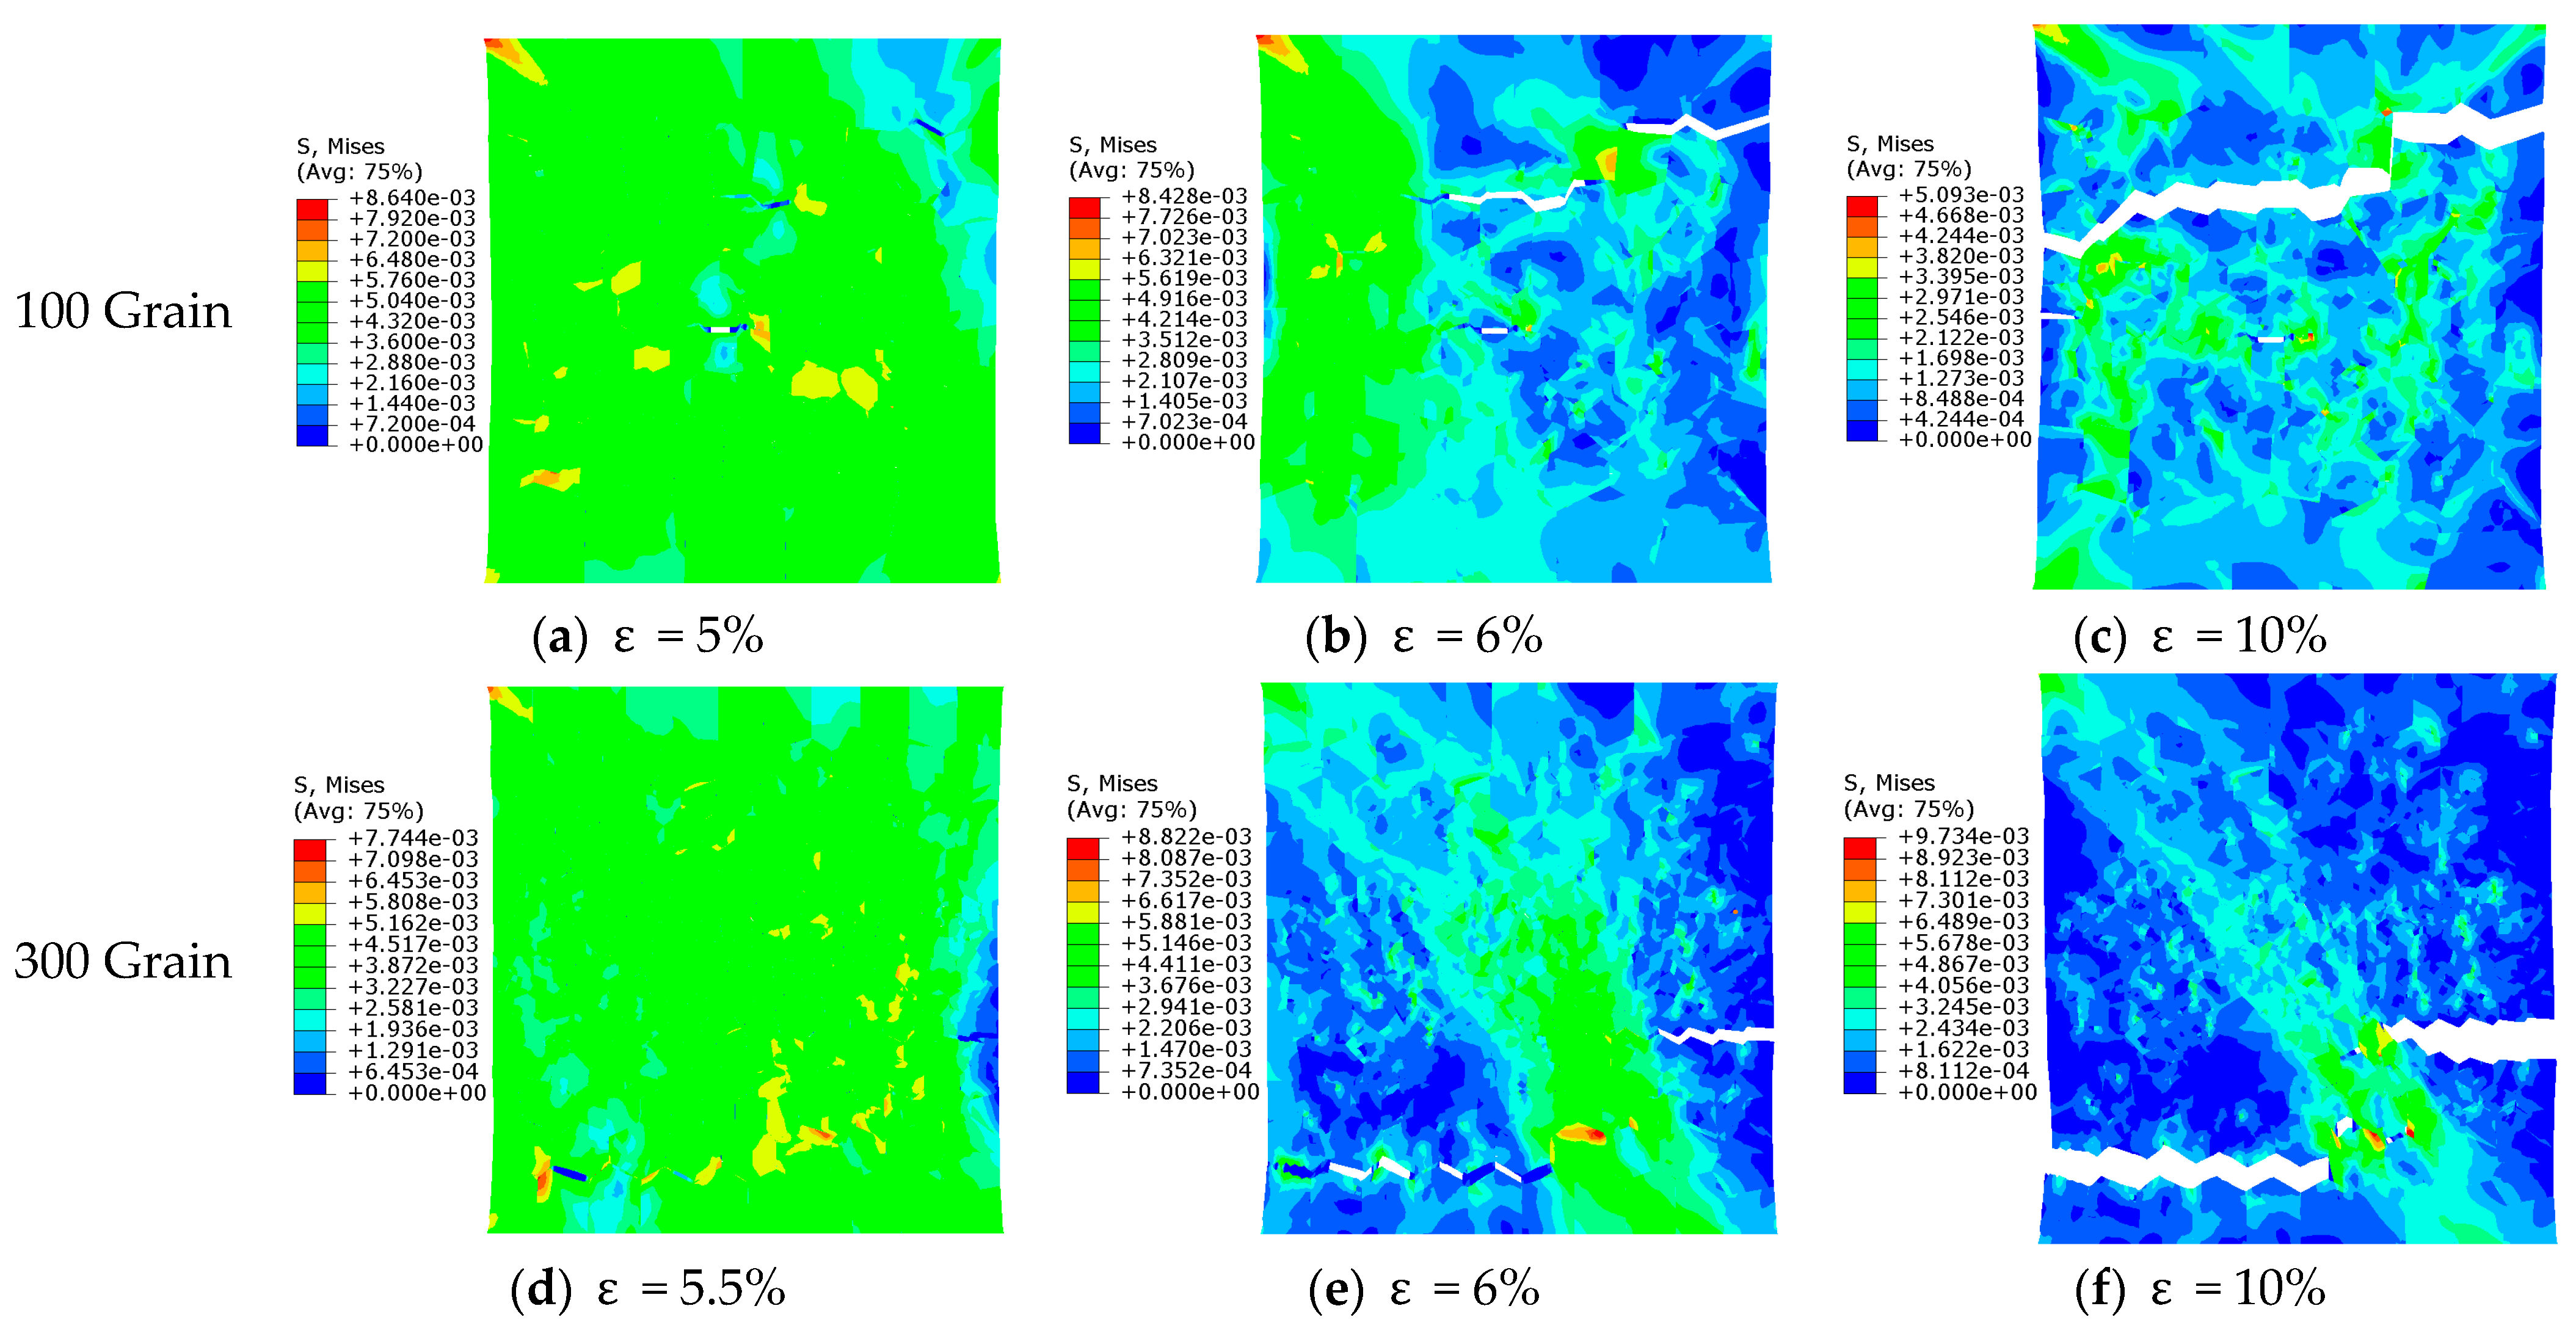
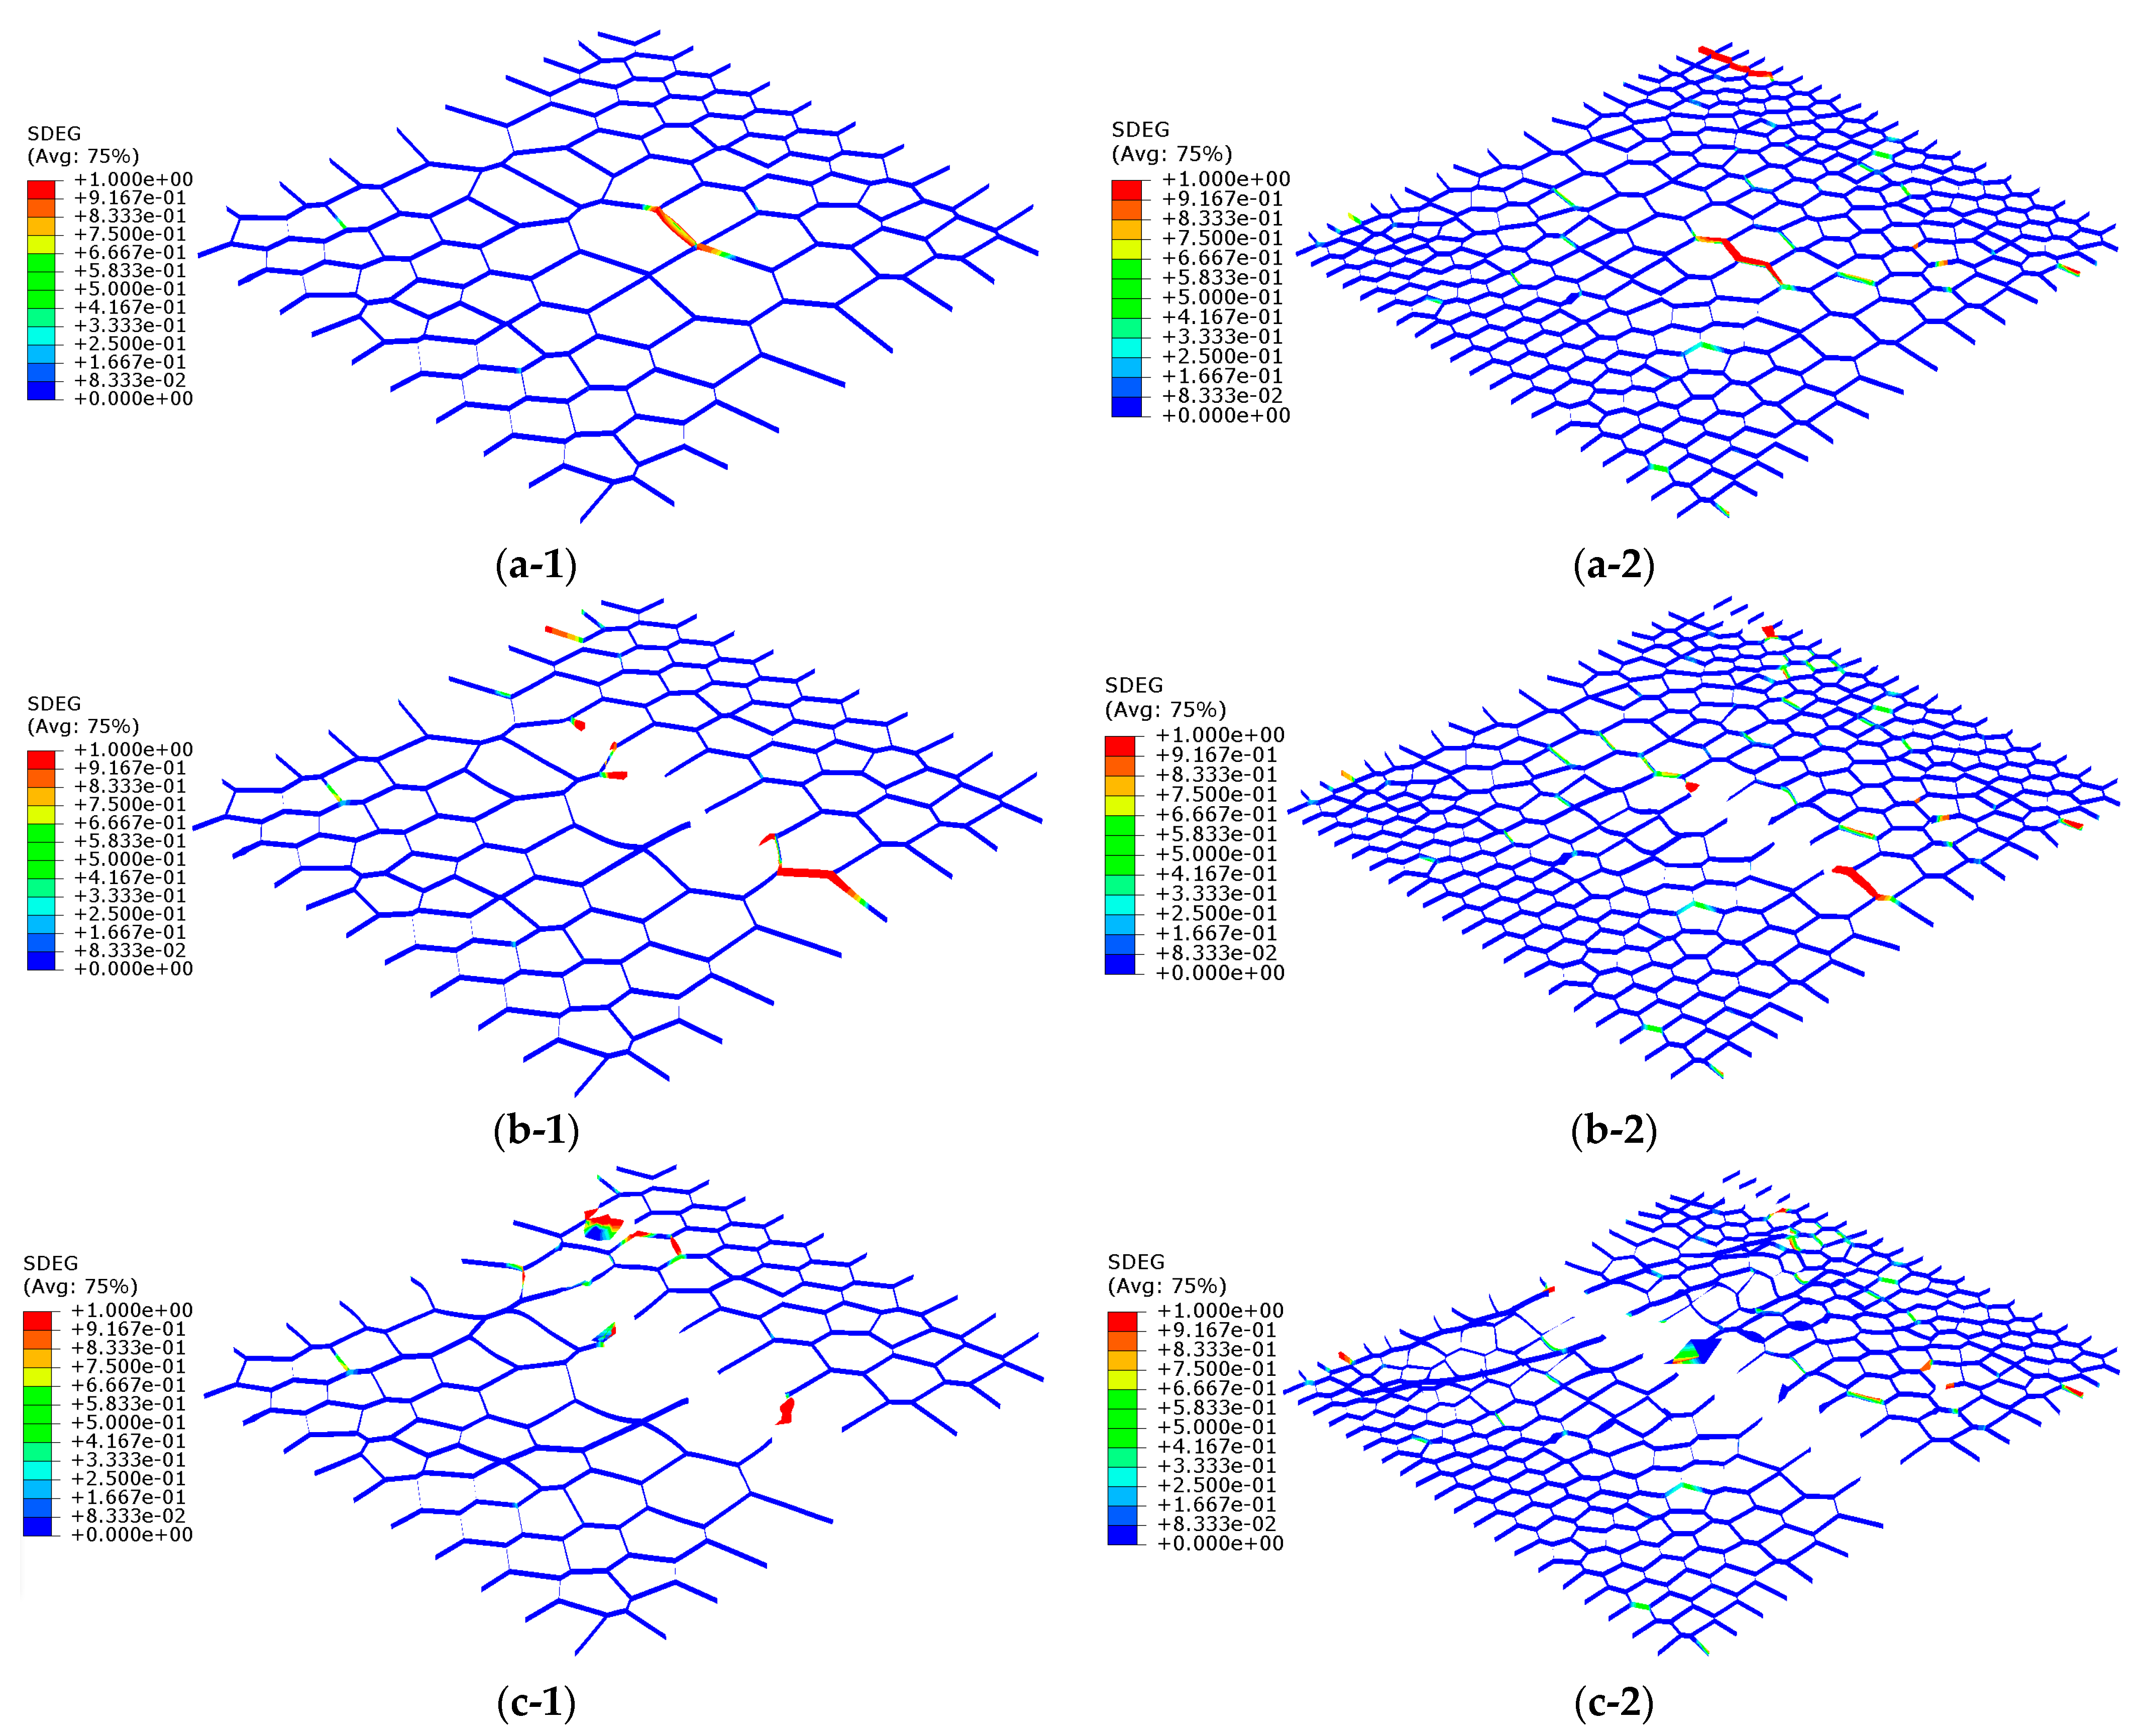
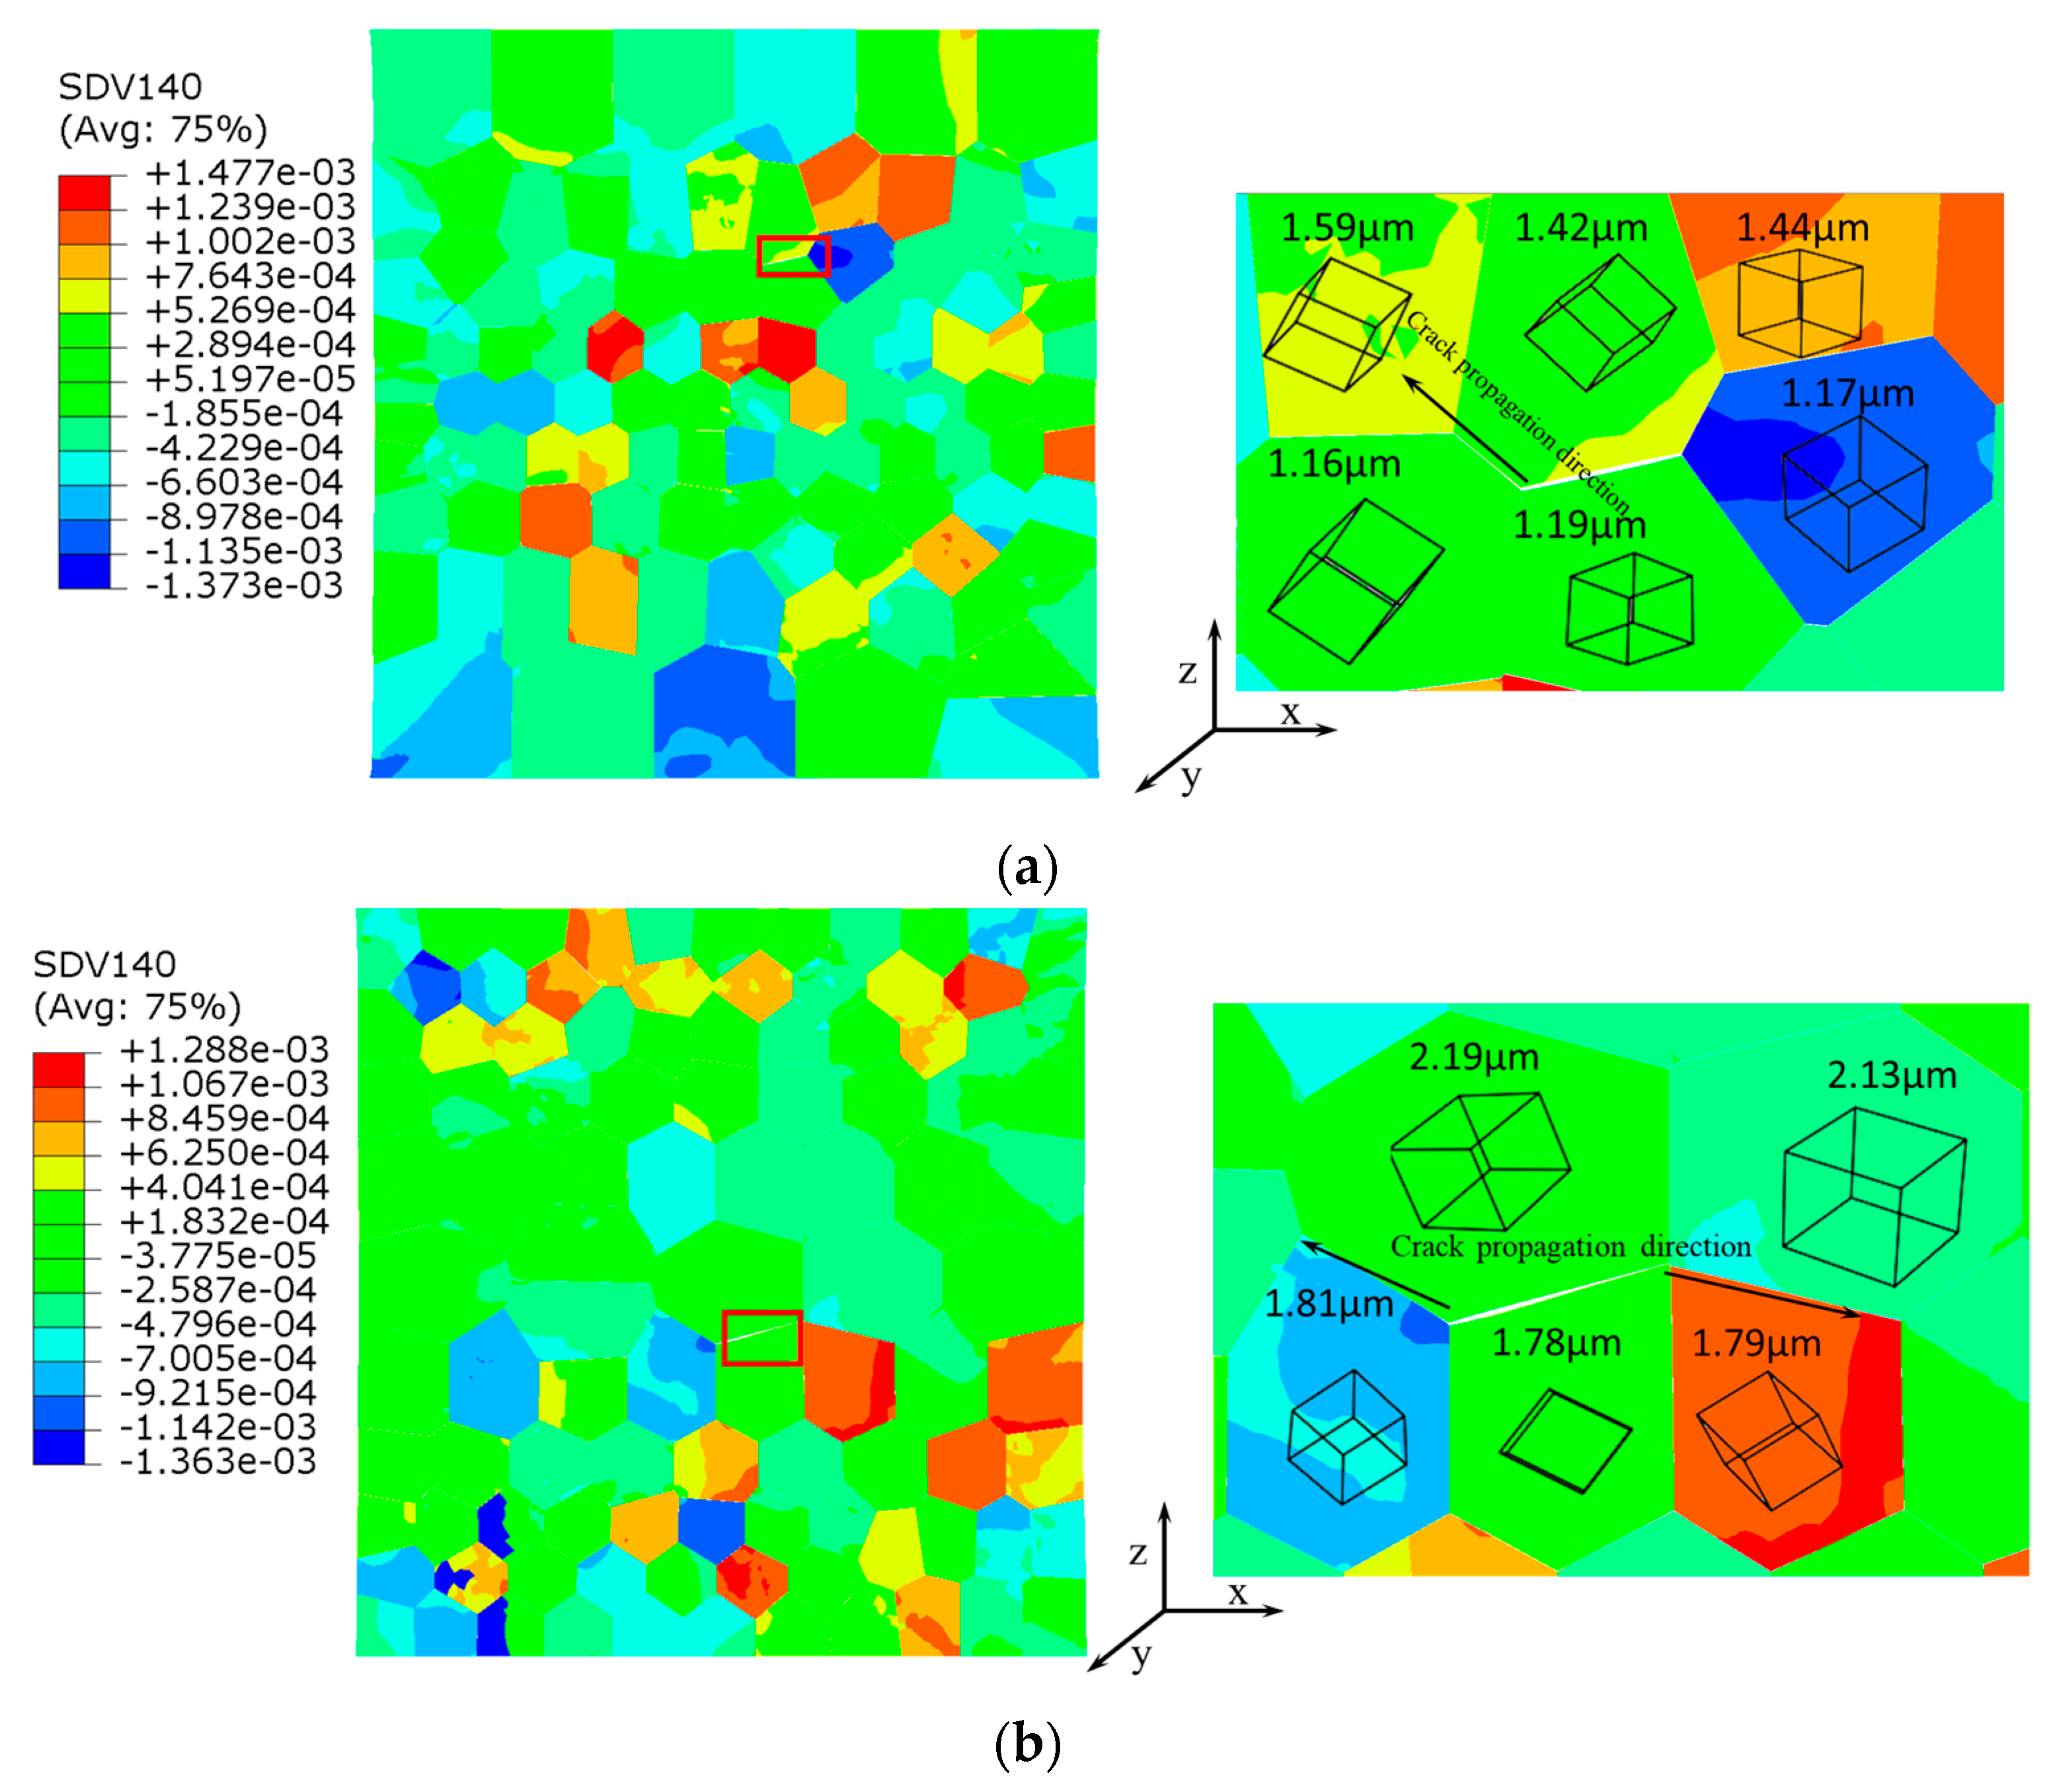
3.2. The Results of MG Crystals

Figure 6 shows the stress and crack evolution of MG crystals. Since the parameters are dimensionless, the Mises stress here should be unitless. According to the dimensionless rule adopted in this paper, the actual unit of Mises stress can be obtained by multiplying the stress value by 69 Gpa. Cracking starts at 5% and 5.5% strain for the 100-MG gradient crystal and 300-MG crystal, respectively. The crack then expands in the direction of the smaller grain size.
From Figure 6a–c, it can be known that there is a local stress concentration at the location of crack formation, and as the crack continues to expand, the cohesive unit is destroyed when the stress magnitude around the crack tends to 0, and penetration cracks form when the strain reaches 10 percent.
From Figure 6d,e, the crack sprouts at a strain of 5.5%, and the local stress near the crack tends to 0. At a strain of 6.5%, a local shear zone is formed between the left and right cracks, which prevents the crack from expanding further, so that the gradient crystal model does not break completely when the crack finally fractures.
To study the process of crack initiation, extension, and evolution of gradient structures under tension, the stiffness degradation rate (SDEG) at grain boundary interfaces is targeted. The stiffness degradation rate (SDEG) indicates whether the unit is damaged; SDEG equals 0 indicates that the unit is not damaged, and SDEG equals 1 indicates that the unit is completely damaged. Figure 7 shows the SDEG evolution of MG crystals. The earliest occurrence of 100-MG crystals is where the grain size is 1.42 micron from Figure 7(a-1). Currently, the crack sprouts in the three-crystal junction, and at this time the sprouting location is in the high-stress zone. As the strain increases, the crack pattern expands from the germination position, in the direction of small grain size, shown in Figure 7(b-1). Figure 7(c-1) shows the final state of cracking, where the cohesive unit out of the grain boundary is destroyed, the grain boundary disappears, and the material fails.
A comparative study revealed that cracks in 300-MG crystal first appeared at grains of 1.59 micron, slightly smaller than in 100-MG crystal. Since the grain size of B is much smaller than that of 100-MG crystal, it results in the intermediate grains of the B structure hindering the crack extension, and thus the crack in 300-MG crystal extends downwards. This is the reason why different crack evolutions occur at the same strain.

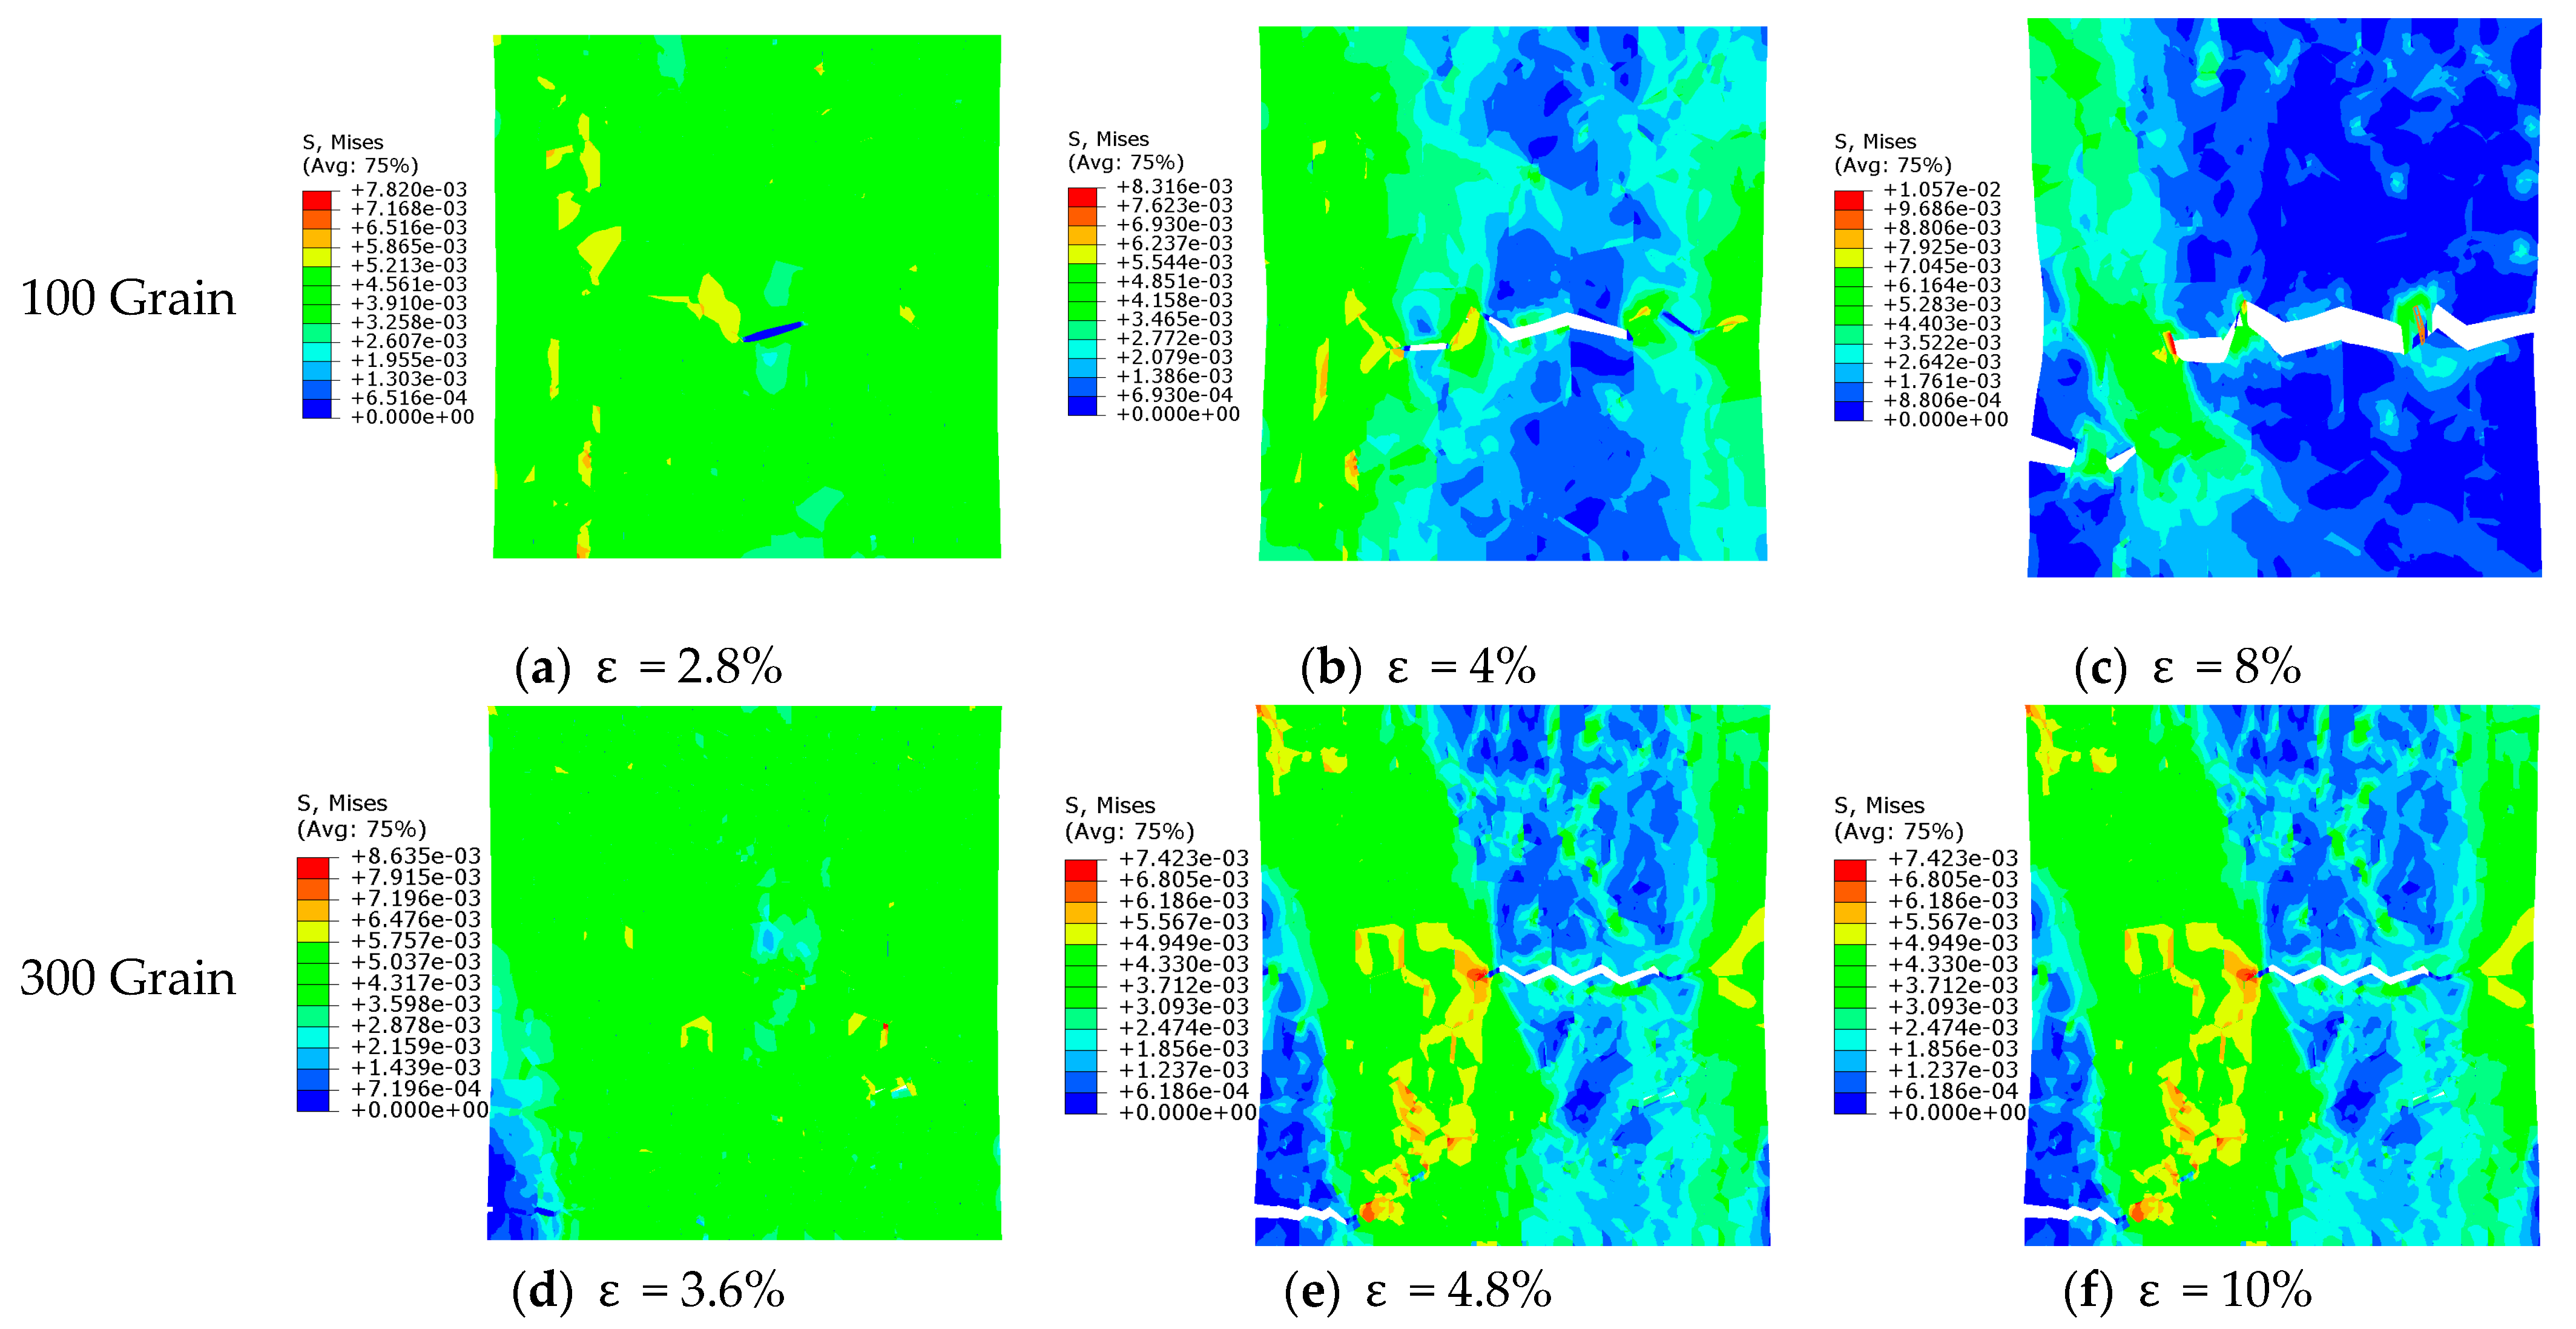
3.3. The Results of BG Crystals

Figure 8 shows the stress and crack evolution of BG crystals. BG crystals have large grains in the center and small grains on both sides. The grains were evaluated at sizes of 1.45 micron and 1.53 micron in 100-BG crystals and 300-BG crystals, respectively. BG crystals showed an intermediate crack. The strains for the initial crack of BG crystals are 2.8% and 3.6%, which are much smaller than the MG crystals. This it is why the elongation of BG crystals is much smaller than MG crystals in Figure 5. Due to the smaller grain size on both sides, the cracks extend horizontally to both sides.
Similarly, we investigated the changes in the SDEG of BG crystals during stretching, as shown in Figure 9. It shows the crack evolution of the BG crystals more clearly. Thus, it is verified that the nanograins will hinder the crack extension, and the correctness of the theoretical model proposed in this paper is also verified.

4. Discussion

Based on the above finite element results, there are two main parts that affect the mechanics and fracture performance of gradient crystals. One is the number of gradient crystals. In the two gradient crystal distributions, the increase in the number of grains leads to the gradient crystals being more difficult to fracture and better in strength. The strain of the 300-grain gradient crystal is larger than that of the 100-grain gradient crystal, and the crack length of the 300-grain gradient crystal is smaller than that of the 100-grain gradient crystal in the SDEG cloud map.
The second is the gradient crystal arrangement, in which two gradient crystal distributions, BG and MG, are set. MG distribution has better crack resistance and strength. Both the 100-grain and the 300-grain gradient crystal models show that the stress and strain of MG distribution when damage occurs are greater than that of BG distribution, while the crack length of MG distribution is shorter than that of BG distribution. The above results are consistent with materials science.
In order to better understand the initiation and propagation of cracks, the cracks are further analyzed. The shear stress affects the grain slip, which in turn affects the initiation and propagation path of cracks. The average shear stress cloud maps of 12 groups of slip systems at the beginning of the crack were output. The Euler Angle orientations of different grains also affected the initiation and expansion of cracks. The Bunge representation was used to describe the grain orientations, and the x, z, and x axes were rotated in turn.
It can be seen from Figure 10a that the crack will expand to the upper left end for several reasons. First, the upper end grain size is large and the strength (shear stress) is low, while the lower end grain size is small and the strength is high, and the crack will expand along the large grain size; second, the adjacent grain orientation is poor, and the grain with a smaller orientation difference is more likely to promote crack growth.
A similar conclusion can also be obtained in Figure 10b, where the shear stresses distributed by MG and BG are significantly graded. The shear stresses of the intermediate grains distributed by MG are larger, and those of the grains distributed at both ends of BG are larger.

5. Conclusions

The tensile fracture behavior of aluminum alloys with two gradient crystals at both ends was investigated based on the finite element theory of crystal plasticity and the Cohesive unit. Through the uniaxial tensile calculations on the crystal models of the two different gradient structures, the number and arrangement of graded crystals are both important factors affecting the mechanical properties of graded crystals. The increase in the number of grains makes the strength of graded crystals better, and a more reasonable arrangement also significantly increases the strength of graded crystals. Mechanical properties of MG-distributed gradient crystals are better than those of BG-distributed gradient crystals. This is reflected in that the strain of MG-distributed gradient crystals when crack occurs is greater than that of BG-distributed gradient crystals; MG is 5%, 5.5%, and BG is 2.8%, 3.6%. Based on the above research conclusions, increasing the number of grains and a reasonable arrangement of graded crystals can be considered in engineering work to improve the strength of graded crystals. Further research may include setting up a variety of gradient arrangements, considering three-dimensional anisotropic gradient crystals, and gradient crystal damage models in complex environments.

Author Contributions

Conceptualization, writing—review and editing, M.X.; methodology, investigation, resources, C.H. and J.Y.; funding acquisition, C.H. All authors have read and agreed to the published version of the manuscript.

Funding

This research was funded by the Fundamental Research Project of Yunnan Province (Project No. 202401CF070118).

Data Availability Statement

The raw data supporting the conclusions of this article will be made available by the authors on request.

Conflicts of Interest

The authors declare no conflicts of interest.

References

  1. Yang, X.; Ma, X.; Moering, J.; Zhou, H.; Wang, W.; Gong, Y.; Tao, J.; Zhu, Y.; Zhu, X. Influence of gradient structure volume fraction on the mechanical properties of pure copper. Mater. Sci. Eng. A 2015, 645, 280–285. [Google Scholar] [CrossRef]
  2. Yin, Z.; Yang, X.; Ma, X.; Moering, J.; Yang, J.; Gong, Y.; Zhu, Y.; Zhu, X. Strength and ductility of gradient structured copper obtained by surface mechanical attrition treatment. Mater. Des. 2016, 105, 89–95. [Google Scholar] [CrossRef]
  3. Wu, X.L.; Yang, M.X.; Yuan, F.P.; Chen, L.; Zhu, Y.T. Combining gradient structure and TRIP effect to produce austenite stainless steel with high strength and ductility. Acta Mater. 2016, 112, 337–346. [Google Scholar] [CrossRef]
  4. Tan, X.; Kok, Y.; Tan, Y.J.; Descoins, M.; Mangelinck, D.; Tor, S.B.; Leong, K.F.; Chua, C.K. Graded microstructure and mechanical properties of additive manufactured Ti–6Al–4V via electron beam melting. Acta Mater. 2015, 97, 1–16. [Google Scholar] [CrossRef]
  5. Chen, W.; You, Z.S.; Tao, N.R.; Jin, Z.H.; Lu, L. Mechanically-Induced grain coarsening in gradient nano-Grained copper. Acta Mater. 2017, 125, 255–264. [Google Scholar] [CrossRef]
  6. Wu, X.; Zhu, Y. Heterogeneous materials: A new class of materials with unprecedented mechanical properties. Mater. Res. Lett. 2017, 5, 527–532. [Google Scholar] [CrossRef]
  7. Wang, C.; Ding, L.; Shi, S.; Liu, J.; Zhou, W.; Liu, Q.; Fu, X.; Jia, Z. Origin mechanism of heterostructure nanograins with gradient grain size suppressing strain localization. Mater. Sci. Eng. A 2023, 885, 145584. [Google Scholar] [CrossRef]
  8. Korchuganov, A.; Kryzhevich, D.; Zolnikov, K. Fracture of Fe 95 Ni 5Alloys with Gradient-Grained Structure under Uniaxial Tension. Metals 2023, 13, 1308. [Google Scholar] [CrossRef]
  9. Wang, Q.; Chen, R.; Yang, Y.; Guo, J.; Su, Y.; Ding, H.; Fu, H. Effects of grain size and precipitated phases on mechanical properties in TiAl gradient materials. Mater. Sci. Eng. A 2018, 731, 634–641. [Google Scholar] [CrossRef]
  10. An, X.; Bao, W.; Zhang, Z.; Jiang, Z.; Yuan, S.; You, Z.; Zhang, Y. Gradient Enhanced Strain Hardening and Tensile Deformability in a Gradient-Nanostructured Ni Alloy. Nanomaterials 2021, 11, 2437. [Google Scholar] [CrossRef]
  11. Hasan, M.; Liu, Y.; An, X.; Gu, J.; Song, M.; Cao, Y.; Li, Y.; Zhu, Y.; Liao, X. Simultaneously enhancing strength and ductility of a high-entropy alloy via gradient hierarchical microstructures. Int. J. Plast. 2019, 123, 178–195. [Google Scholar] [CrossRef]
  12. Wang, Y.; Yang, G.; Wang, W.; Wang, X.; Li, Q.; Wei, Y. Optimal stress and deformation partition in gradient materials for better strength and tensile ductility: A numerical investigation. Sci. Rep. 2017, 7, 10954. [Google Scholar] [CrossRef] [PubMed]
  13. Lee, H.H.; Park, H.K.; Jung, J.; Hwang, K.J.; Kim, H.S. Microstructural tailoring in reverse gradient-structured copper sheet using single-roll angular-rolling and subsequent annealing. Mater. Sci. Eng. A 2019, 764, 138258. [Google Scholar] [CrossRef]
  14. Zeng, Z.; Li, X.; Xu, D.; Lu, L.; Gao, H.; Zhu, T. Gradient plasticity in gradient nano-grained metals. Extrem. Mech. Lett. 2016, 8, 213–219. [Google Scholar] [CrossRef]
  15. Fang, Q.; Li, L.; Li, J.; Wu, H. Strengthening mechanism of gradient nanostructured body-centred cubic iron film: From inverse Hall-Petch to classic Hall-Petch. Comput. Mater. Sci. 2018, 152, 236–242. [Google Scholar] [CrossRef]
  16. Li, L.; Fang, Q.; Li, J.; Wu, H. Origin of strengthening-softening trade-off in gradient nanostructured body-centred cubic alloys. J. Alloys Compd. 2019, 775, 270–280. [Google Scholar] [CrossRef]
  17. Jin, H.; Zhou, J.; Chen, Y. Grain size gradient and length scale effect on mechanical behaviors of surface nanocrystalline metals. Mater. Sci. Eng. A 2018, 725, 1–7. [Google Scholar] [CrossRef]
  18. Zhao, J.; Lu, X.; Yuan, F.; Kan, Q.; Qu, S.; Kang, G.; Zhang, X. Multiple mechanism based constitutive modeling of gradient nanograined material. Int. J. Plast. 2020, 125, 314–330. [Google Scholar] [CrossRef]
  19. He, C.Y.; Yang, X.F.; Chen, H.; Zhang, Y.; Yuan, G.J.; Jia, Y.F.; Zhang, X.C. Size-dependent deformation mechanisms in copper gradient nano-grained structure: A molecular dynamics simulation. Mater. Today Commun. 2022, 31, 145584. [Google Scholar] [CrossRef]
  20. Liu, L.Y.; Yang, Q.S.; Liu, X.; Nian, X.C. Crystal Cracking of Grain-Gradient Aluminum by a Combined CPFEM-CZM Method. Eng. Fract. Mech. 2020, 242, 107507. [Google Scholar] [CrossRef]
  21. Xu, L.; Huang, Z.; Shen, Q.; Chen, F. Atomistic Simulations of Plasticity Heterogeneity in Gradient Nano-Grained FCC Metals. Mater. Des. 2022, 221, 110929. [Google Scholar] [CrossRef]
  22. Omid, S.; Hamidreza, A. Strain-Gradient Crystal Plasticity Finite Element Modeling of Slip Band Formation in α-Zirconium. Crystals 2021, 11, 1382. [Google Scholar] [CrossRef]
  23. Huang, Y. A User-Material Subroutine Incorporating Single Crystal Plasticity in the ABAQUS Finite Element Program; Harvard University: Cambridge, UK, 1991. [Google Scholar]
  24. Roters, F.; Diehl, M.; Shanthraj, P.; Eisenlohr, P.; Reuber, C.; Wong, S.L.; Maiti, T.; Ebrahimi, A.; Hochrainer, T.; Fabritius, H.-O. DAMASK–The Düsseldorf Advanced MaterialSimulation Kit for modeling multi-physics crystal plasticity, thermal, and damagephenomena from the single crystal up to the component scale. Comput. Sci. 2019, 158, 420–478. [Google Scholar]
  25. Kreyca, J.F. State Parameter Based Modelling of Stress-Straincurves in Aluminium Alloys. Ph.D. Thesis, Vienna University of Technology, Vienna, Austria, 2017. [Google Scholar]
  26. Li, J.; Yi, M.; Wu, H.; Fang, Q.; Liu, Y.; Liu, B.; Zhou, K.; Liaw, P.K. Fine-grain-embedded dislocation-cellstructures for high strength and ductility in additively manufactured steels. Mater. Sci. Eng. A 2020, 790, 139736. [Google Scholar] [CrossRef]
  27. Hunter, A.; Preston, D.L. Analytic model of dislocation density evolution in fcc polycrystals accounting for dislocation generation storage and dynamic recovery mechanisms. Int. J. Plast. 2022, 151, 103178. [Google Scholar] [CrossRef]
  28. Rohith, P.; Sainath, G.; Srinivasan, V.S. Effect of size temperature and strain rate on dislocation density and deformation mechanisms in Cu nanowires. Phys. B Condens. Matter 2019, 561, 136–140. [Google Scholar] [CrossRef]
  29. Hill, R.; Rice, J.R. Constitutive Analysis of Elastic-Plastic Crystals at Arbitrary Strain. J. Mech. Phys. Solids 1972, 151, 401–413. [Google Scholar] [CrossRef]
  30. Taylor, G.I. The mechanism of plastic deformation of crystals. Part I—Theoretical. Proc. R. Soc. Lond. 1934, 145, 362–387. [Google Scholar]
  31. Shanthraj, P.; Zikry, M. Dislocation density evolution and interactions in crystalline materials. Acta Mater. 2011, 59, 7695–7702. [Google Scholar] [CrossRef]
  32. Zheng, Z.; Fei, S.; Liao-Liang, K.A. dislocation density-based crystal plasticity damage model for rolling contact fatigue of gradient grained structures. Int. J. Fatigue 2024, 179, 108038. [Google Scholar] [CrossRef]
  33. Wu, Q.; Zikry, M.A. Dynamic fracture predictions of microstructural mechanisms and characteristics in martensitic steels. Eng. Fract. Mech. 2015, 145, 54–66. [Google Scholar] [CrossRef]
  34. Hatem, T.M.; Zikry, M.A. Dislocation density crystalline plasticity modeling of lath martensitic microstructures in steel alloys. Philos. Mag. 2009, 89, 3087–3109. [Google Scholar] [CrossRef]
  35. Khanikar, P.; Liu, Y.; Zikry, M.A. Experimental and computational investigation of the dynamic behavior of Al–Cu–Li alloys. Mater. Sci. Eng. A 2014, 604, 67–77. [Google Scholar] [CrossRef]
Figure 1. Different configurations of crystal deformation.
Metals 14 00694 g001
Figure 2. Cohesive model schema.
Metals 14 00694 g002
Figure 3. Gradient crystal finite element model. (a) 100 grains of MG; (b) 100 grains of BG; (c) 300 grains of MG; (d) 300 grains of BG.
Metals 14 00694 g003
Figure 4. Gradient crystal loading diagram.
Metals 14 00694 g004
Figure 5. Stress–strain curve.
Metals 14 00694 g005
Figure 6. The stress and crack evolution of MG crystals.
Metals 14 00694 g006
Figure 7. The SDEG evolution of MG crystals. (a-1) ε = 5%; (a-2) ε = 5.5%; (b-1) ε = 6%; (b-2) ε = 6%; (c-1) ε = 10%; (c-2) ε = 10%.
Metals 14 00694 g007
Figure 8. The stress and crack evolution of BG crystals.
Metals 14 00694 g008
Figure 9. The SDEG evolution of BG crystals. (a-1) ε = 2.8%; (a-2) ε = 3.6%; (b-1) ε = 4.8%; (b-2) ε = 4.8%; (c-1) ε = 10%; (c-2) ε = 10%.
Metals 14 00694 g009
Figure 10. 100-grain shear stress nephogram. (a) 100-grain MG; (b) 100-grain BG.
Metals 14 00694 g010
Table 1. Main symbol comparison table.
F Deformation gradient
F e , F p Elastic and plastic deformation gradients
L Velocity gradient
L e , L p Elastic and plastic velocity gradients
γ ˙ Shear strain rate
s , n Slip direction and normal direction of slip plane
b α Burgers vector
τ r e f Reference shear stress
ρ i m , ρ m Movable and immovable dislocation density
Δ H Ration of activation enthalpy
k Boltzmann constant
g s , g m 0 , g i m 0 , g m 1 , g r Dislocation evolution correlation coefficient
ρ i m s a t Saturation value for immobile dislocation density
G I C Breaking energy
C 1 , C 2 , C 3 cohesive element stiffness
δ n , δ s , δ t n, s, t direction displacement
σ n , σ s , σ t n, s, t directional stress
ε n , ε s , ε t n, s, t direction strain
σ 0 , ε 0 critical stress and critical strain
Table 2. Material parameters of cohesive element, adapted from Ref. [20].
Parameters GIC [J/mm]C1 [MPa]C2C3 σ n [MPa] σ s σ t
Value3569,00069,00069,000345345345
Table 3. Material parameters of aluminum alloy, adapted from Refs. [32,33,34,35].
ParametersValueDimensionless
E [GPa]691
ν 0.340.34
τ y   [ MPa ] 355.07246 × 10⁻⁴
ρ   [ g / cm 3 ] 2.71
Cp [J/kgK]9020.0103416
H 0 [k/K]25008.53242
γ ˙ ref   [ s 1 ] 0.0011.97814 × 10−13
|b| [m]3 × 10¹⁰ 0.0003
ρ im 0   [ m 2 ] 10 12 1
ρ im sat   [ m 2 ] 10 16 104
ρ m 0 0   [ m 2 ] 10 10 0.01
T 0 [K]2931
m 0.0250.025
ζ 0.50.5
χ 0.90.9
g s 2.76 × 10−52.76 × 10−5
g r 6.69 × 1046.69 × 104
g mo ,   g m 1 5.53 × 1045.53 × 104
g im 0 ,     g im 1 0.01270.0127
Disclaimer/Publisher’s Note: The statements, opinions and data contained in all publications are solely those of the individual author(s) and contributor(s) and not of MDPI and/or the editor(s). MDPI and/or the editor(s) disclaim responsibility for any injury to people or property resulting from any ideas, methods, instructions or products referred to in the content.

