
Effect of Copper and Nickel Content on the Corrosion Mechanisms in Ferritic Matrix Gray Cast Irons under Simulated Marine Environments

 , ,
, ,  and
and
Abstract
1. Introduction
2. Materials and Methods
2.1. Materials
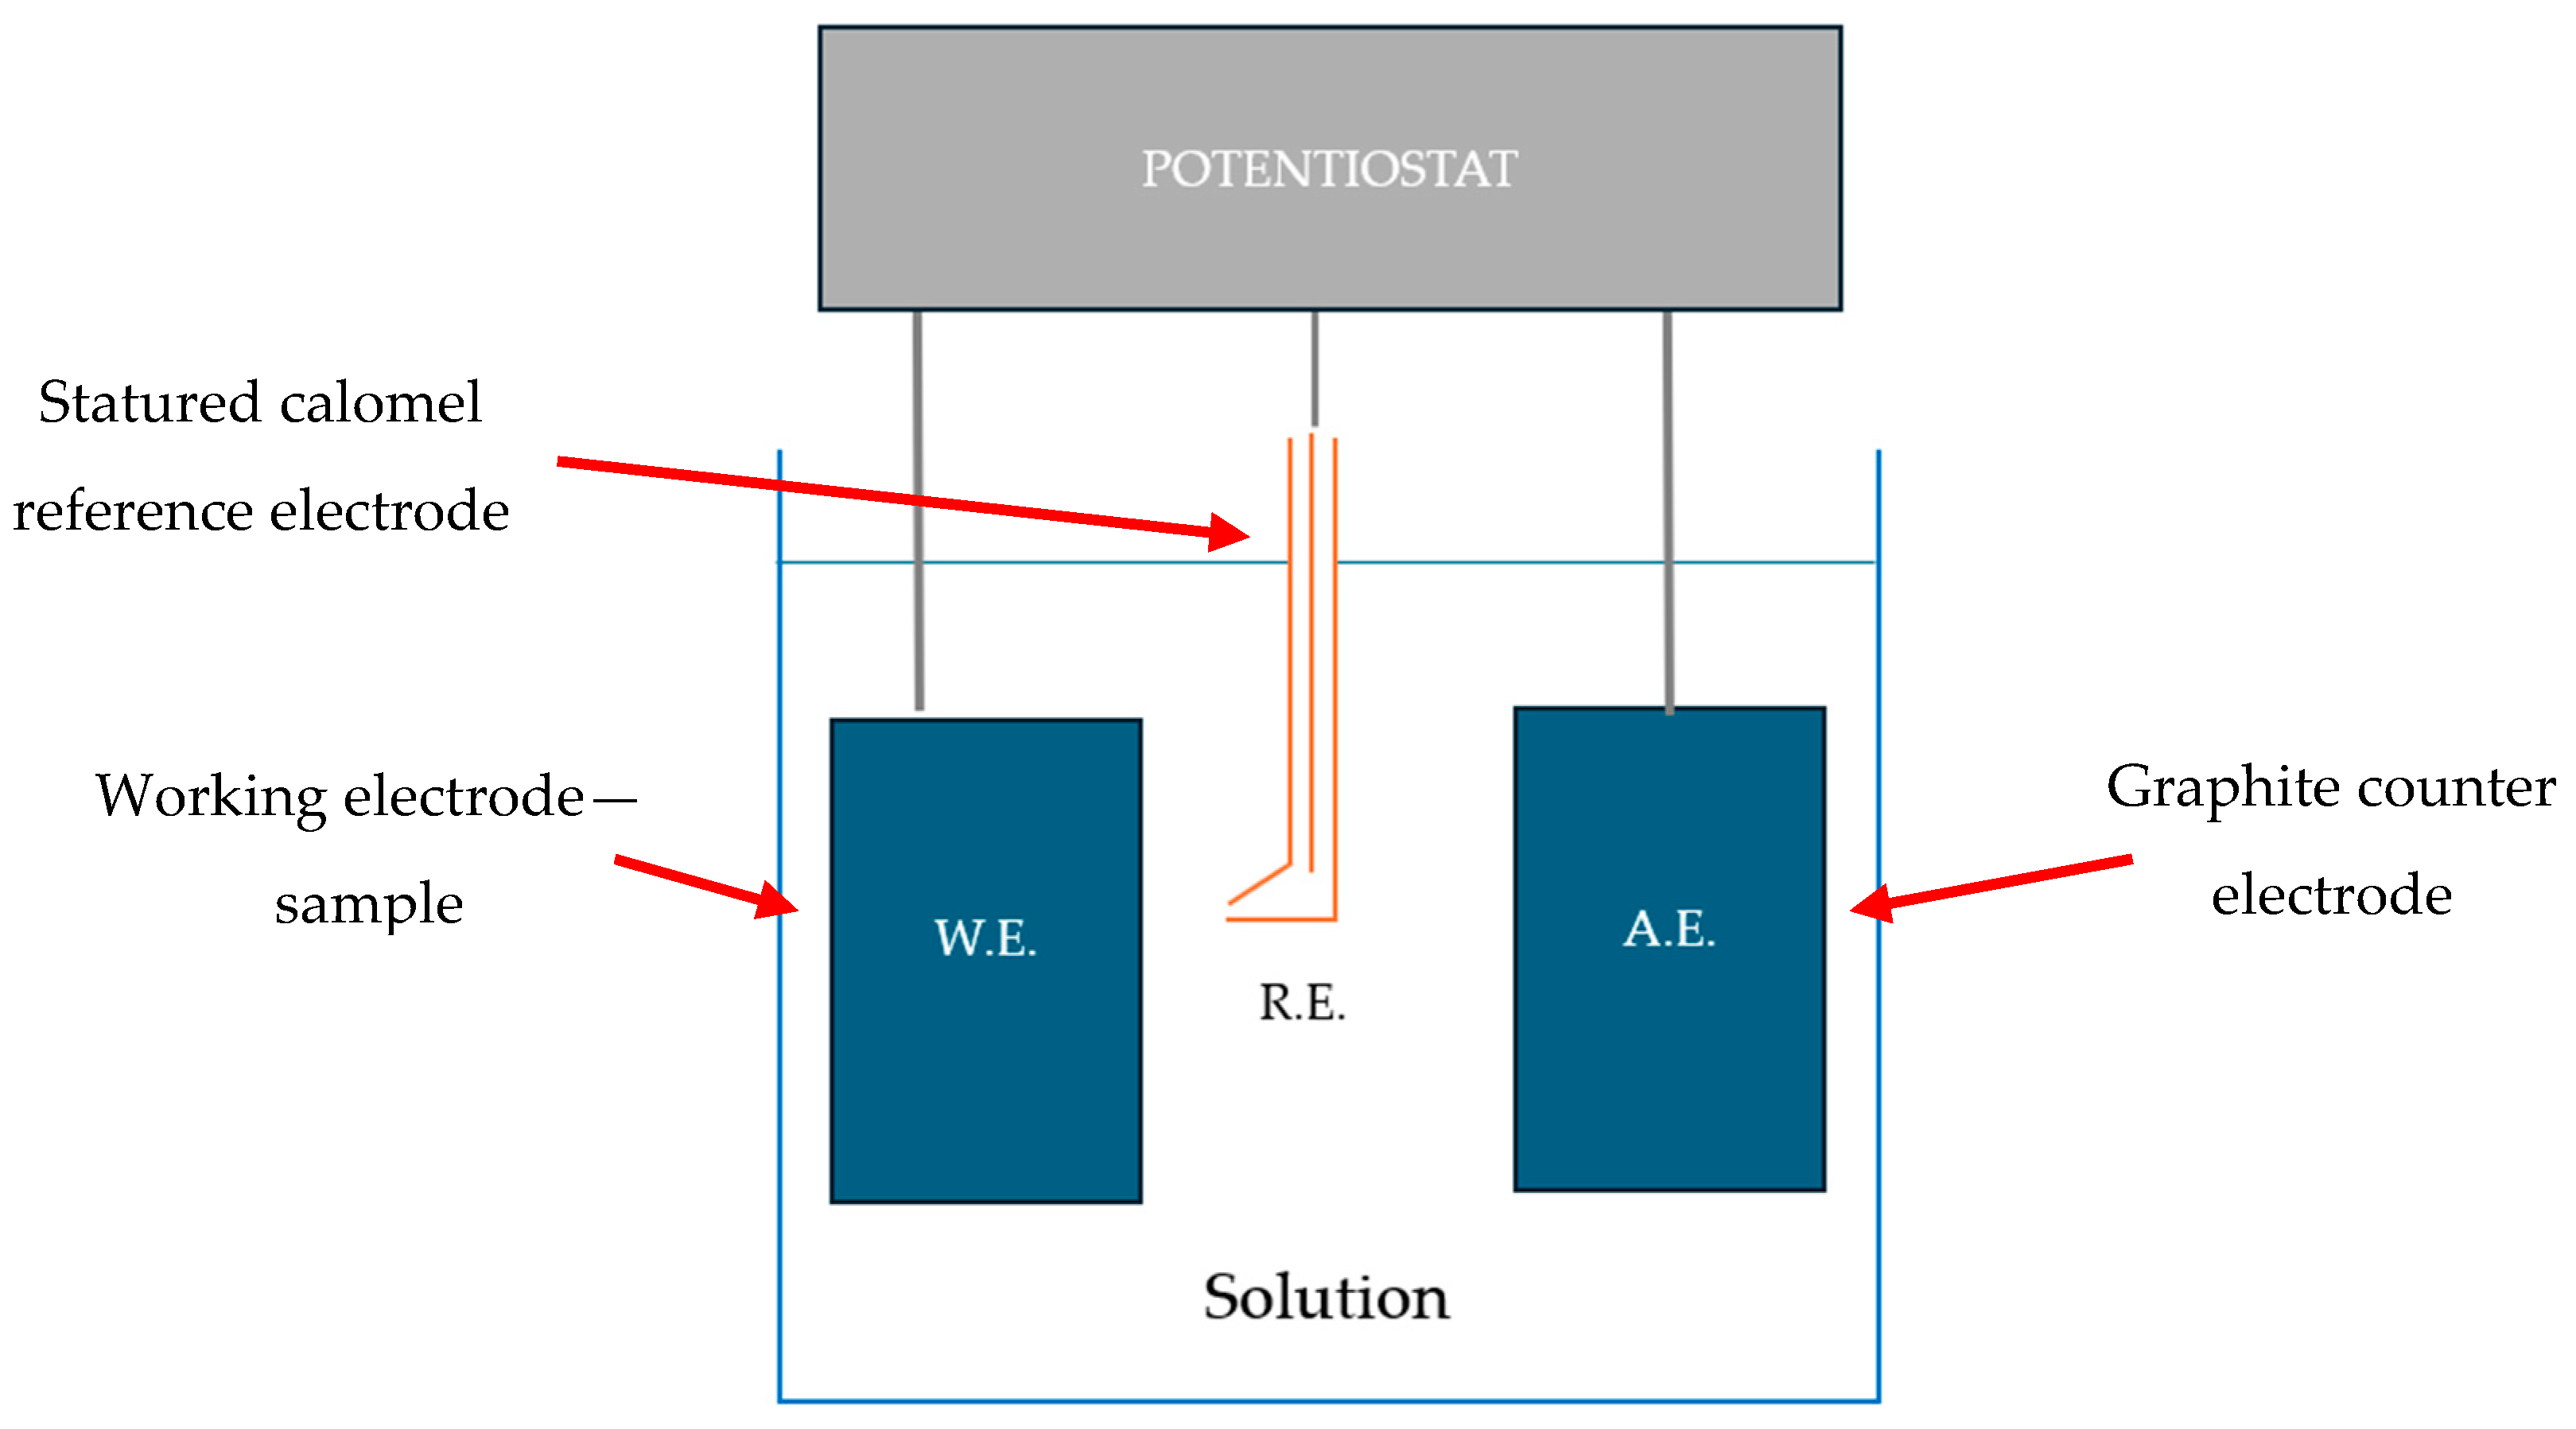
2.2. Methods
3. Results
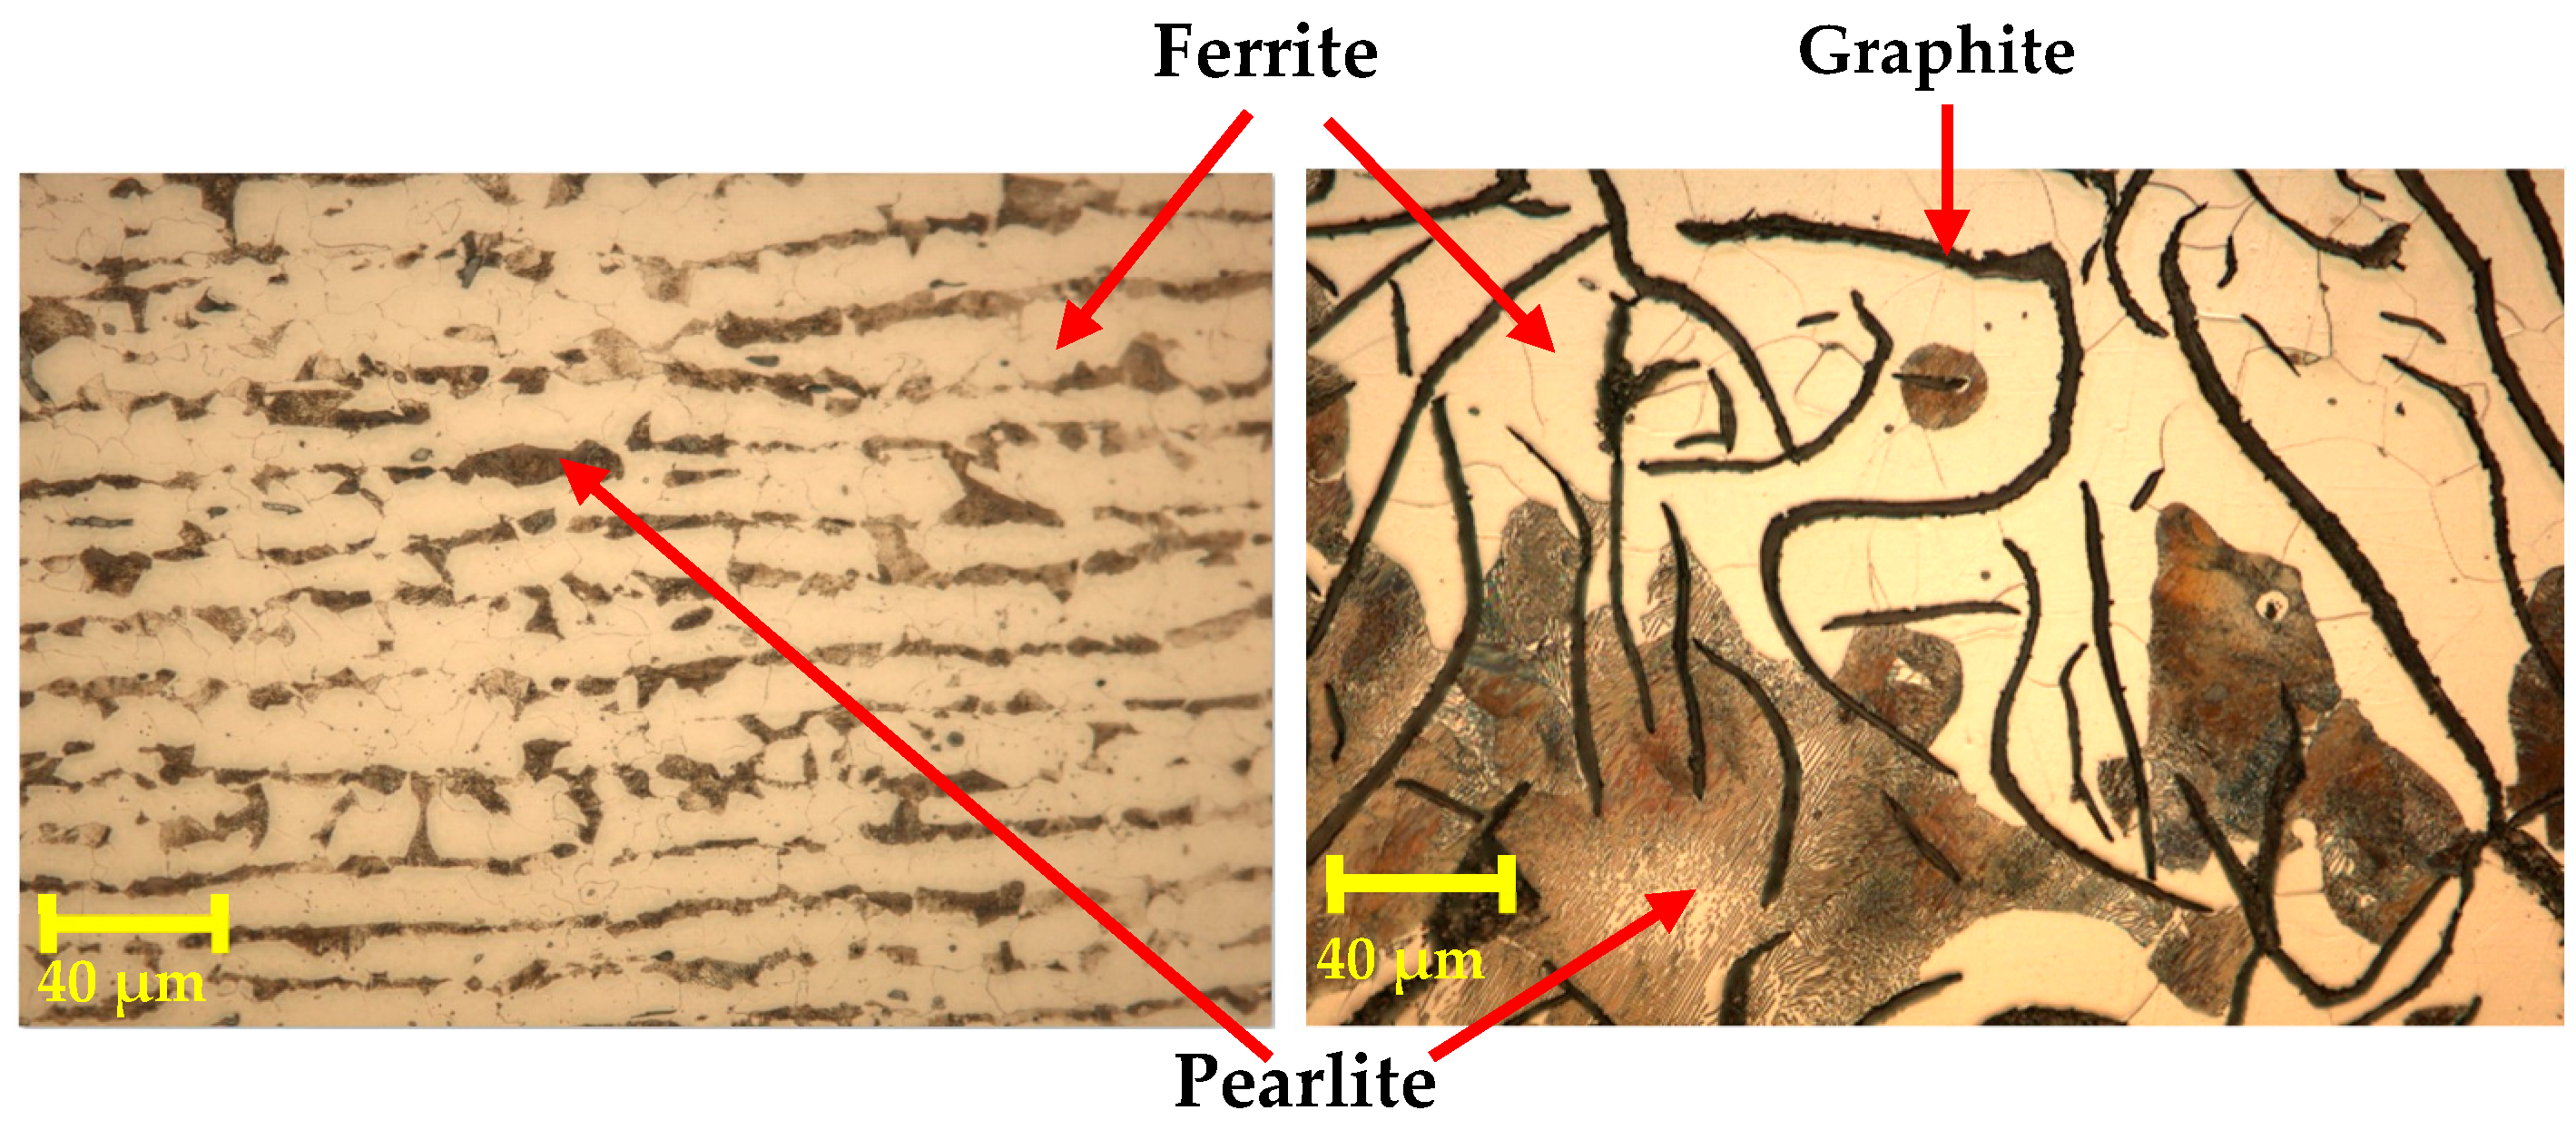
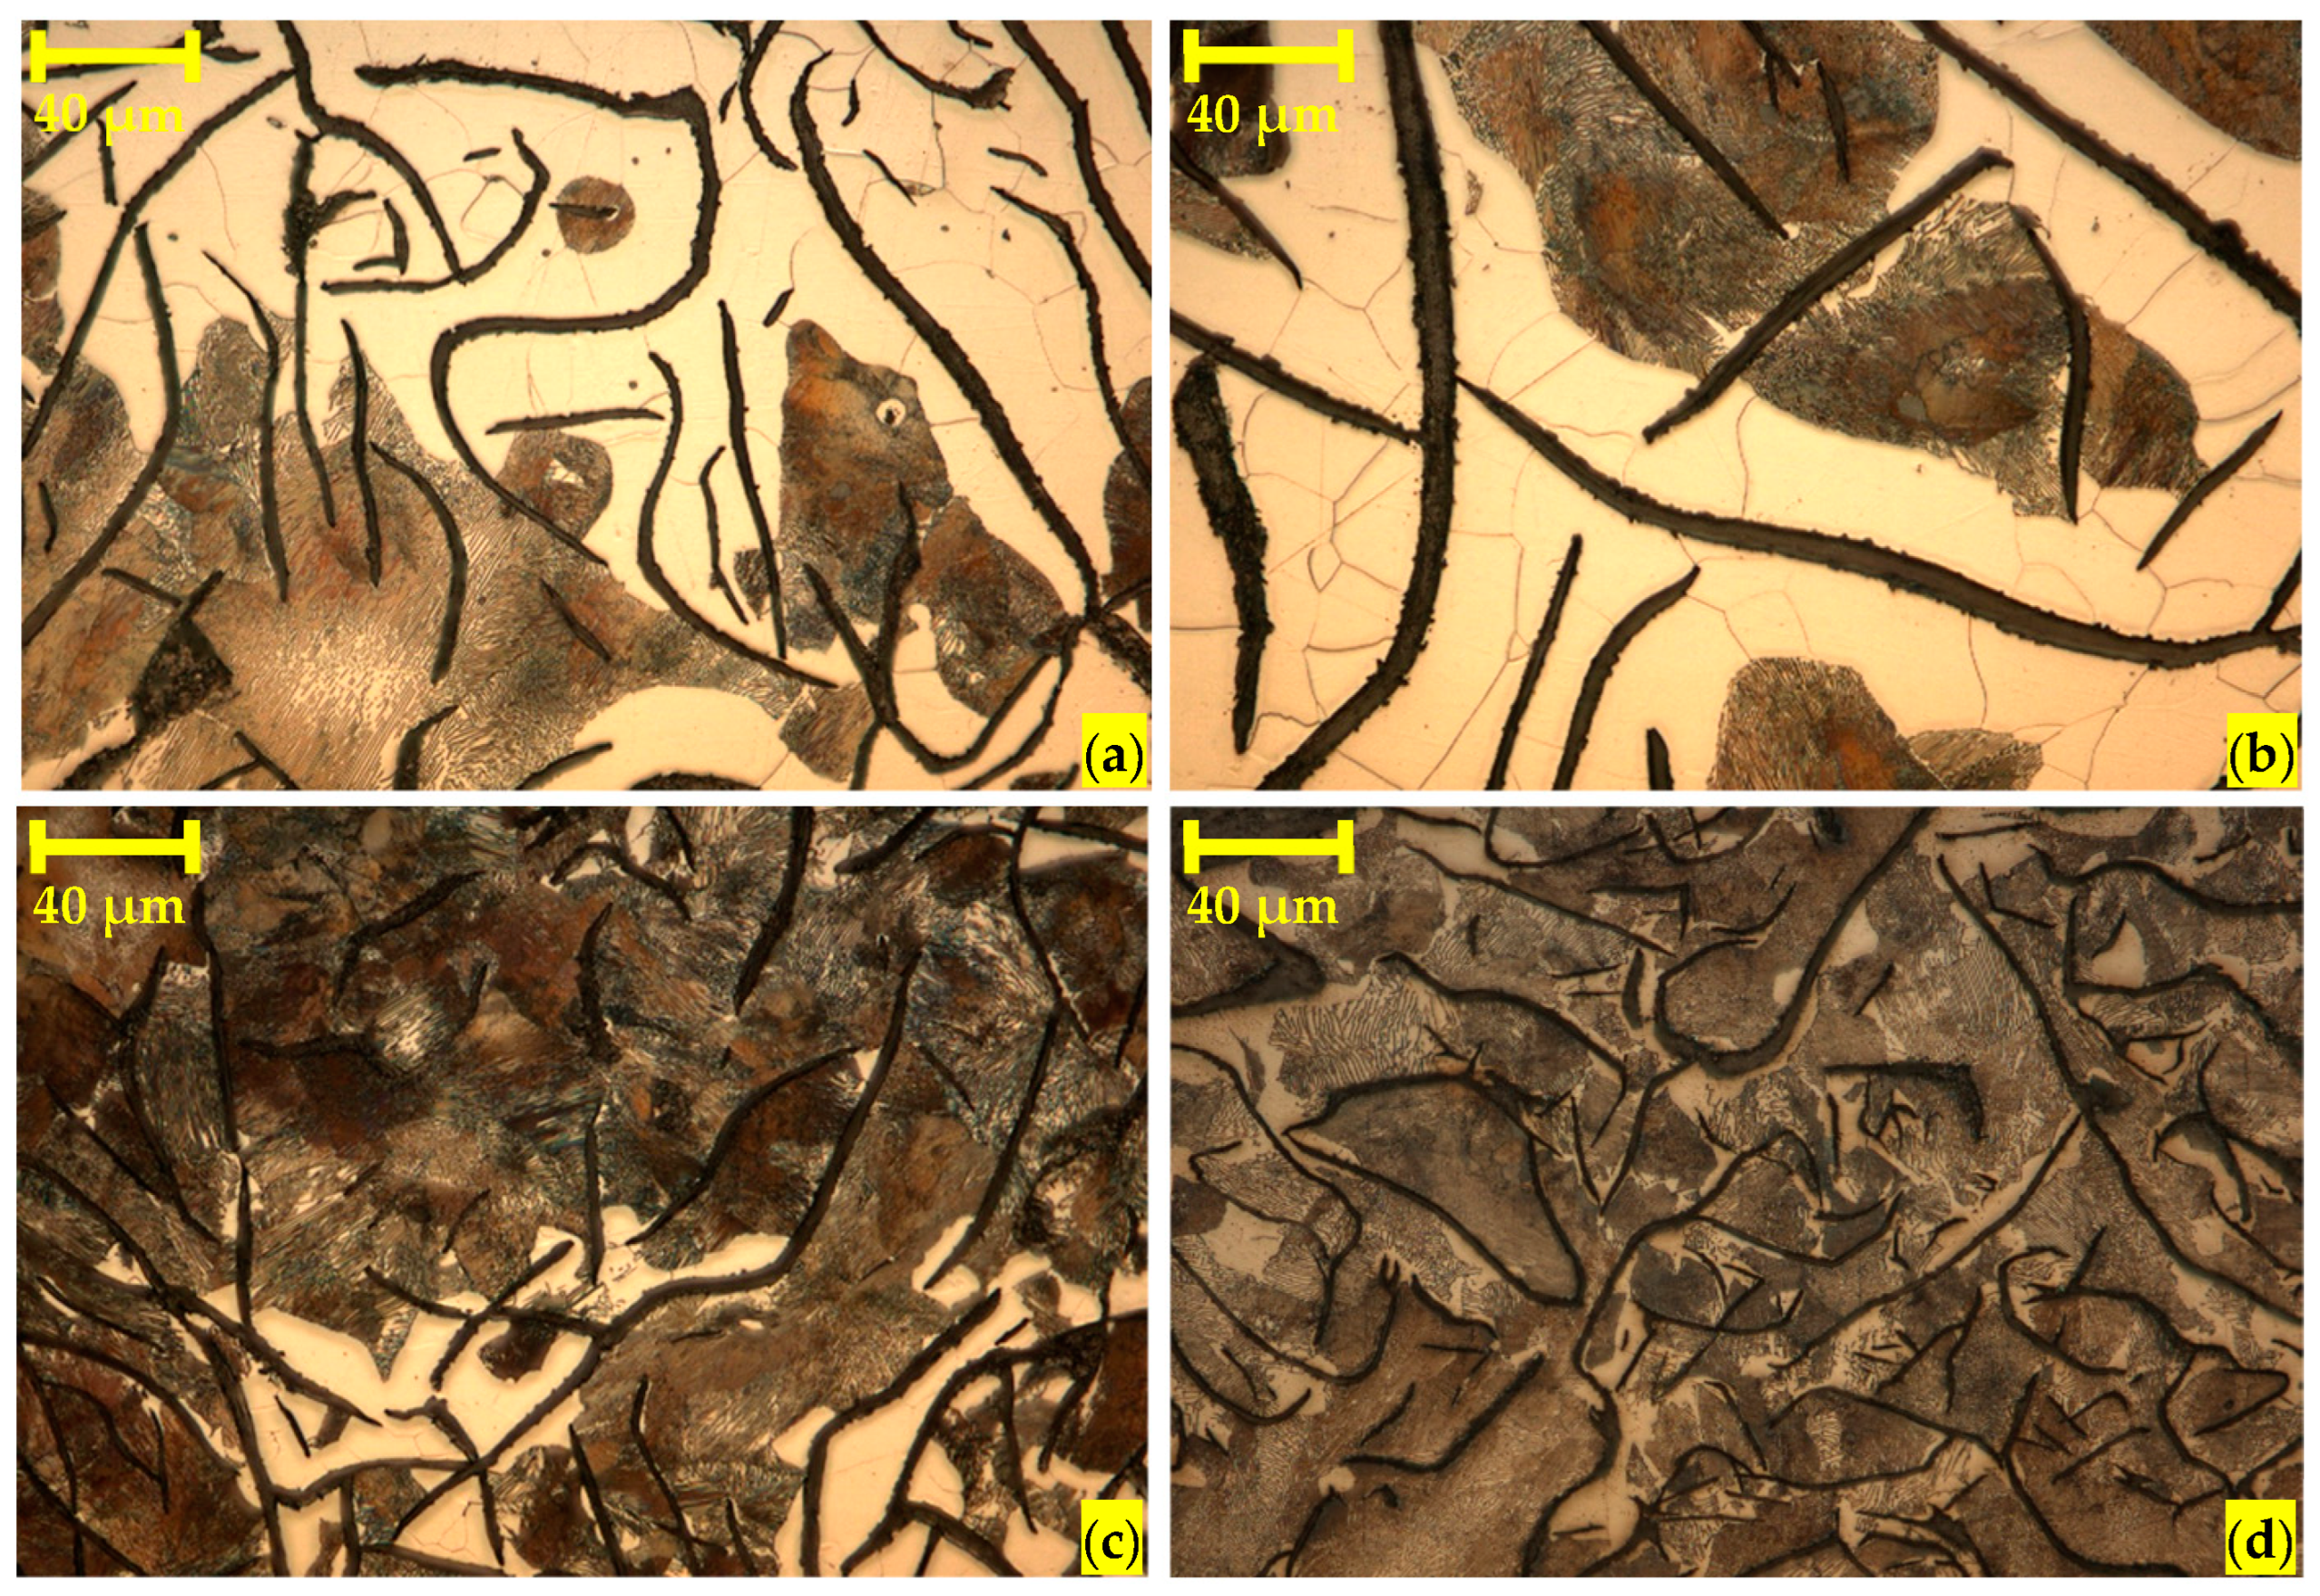
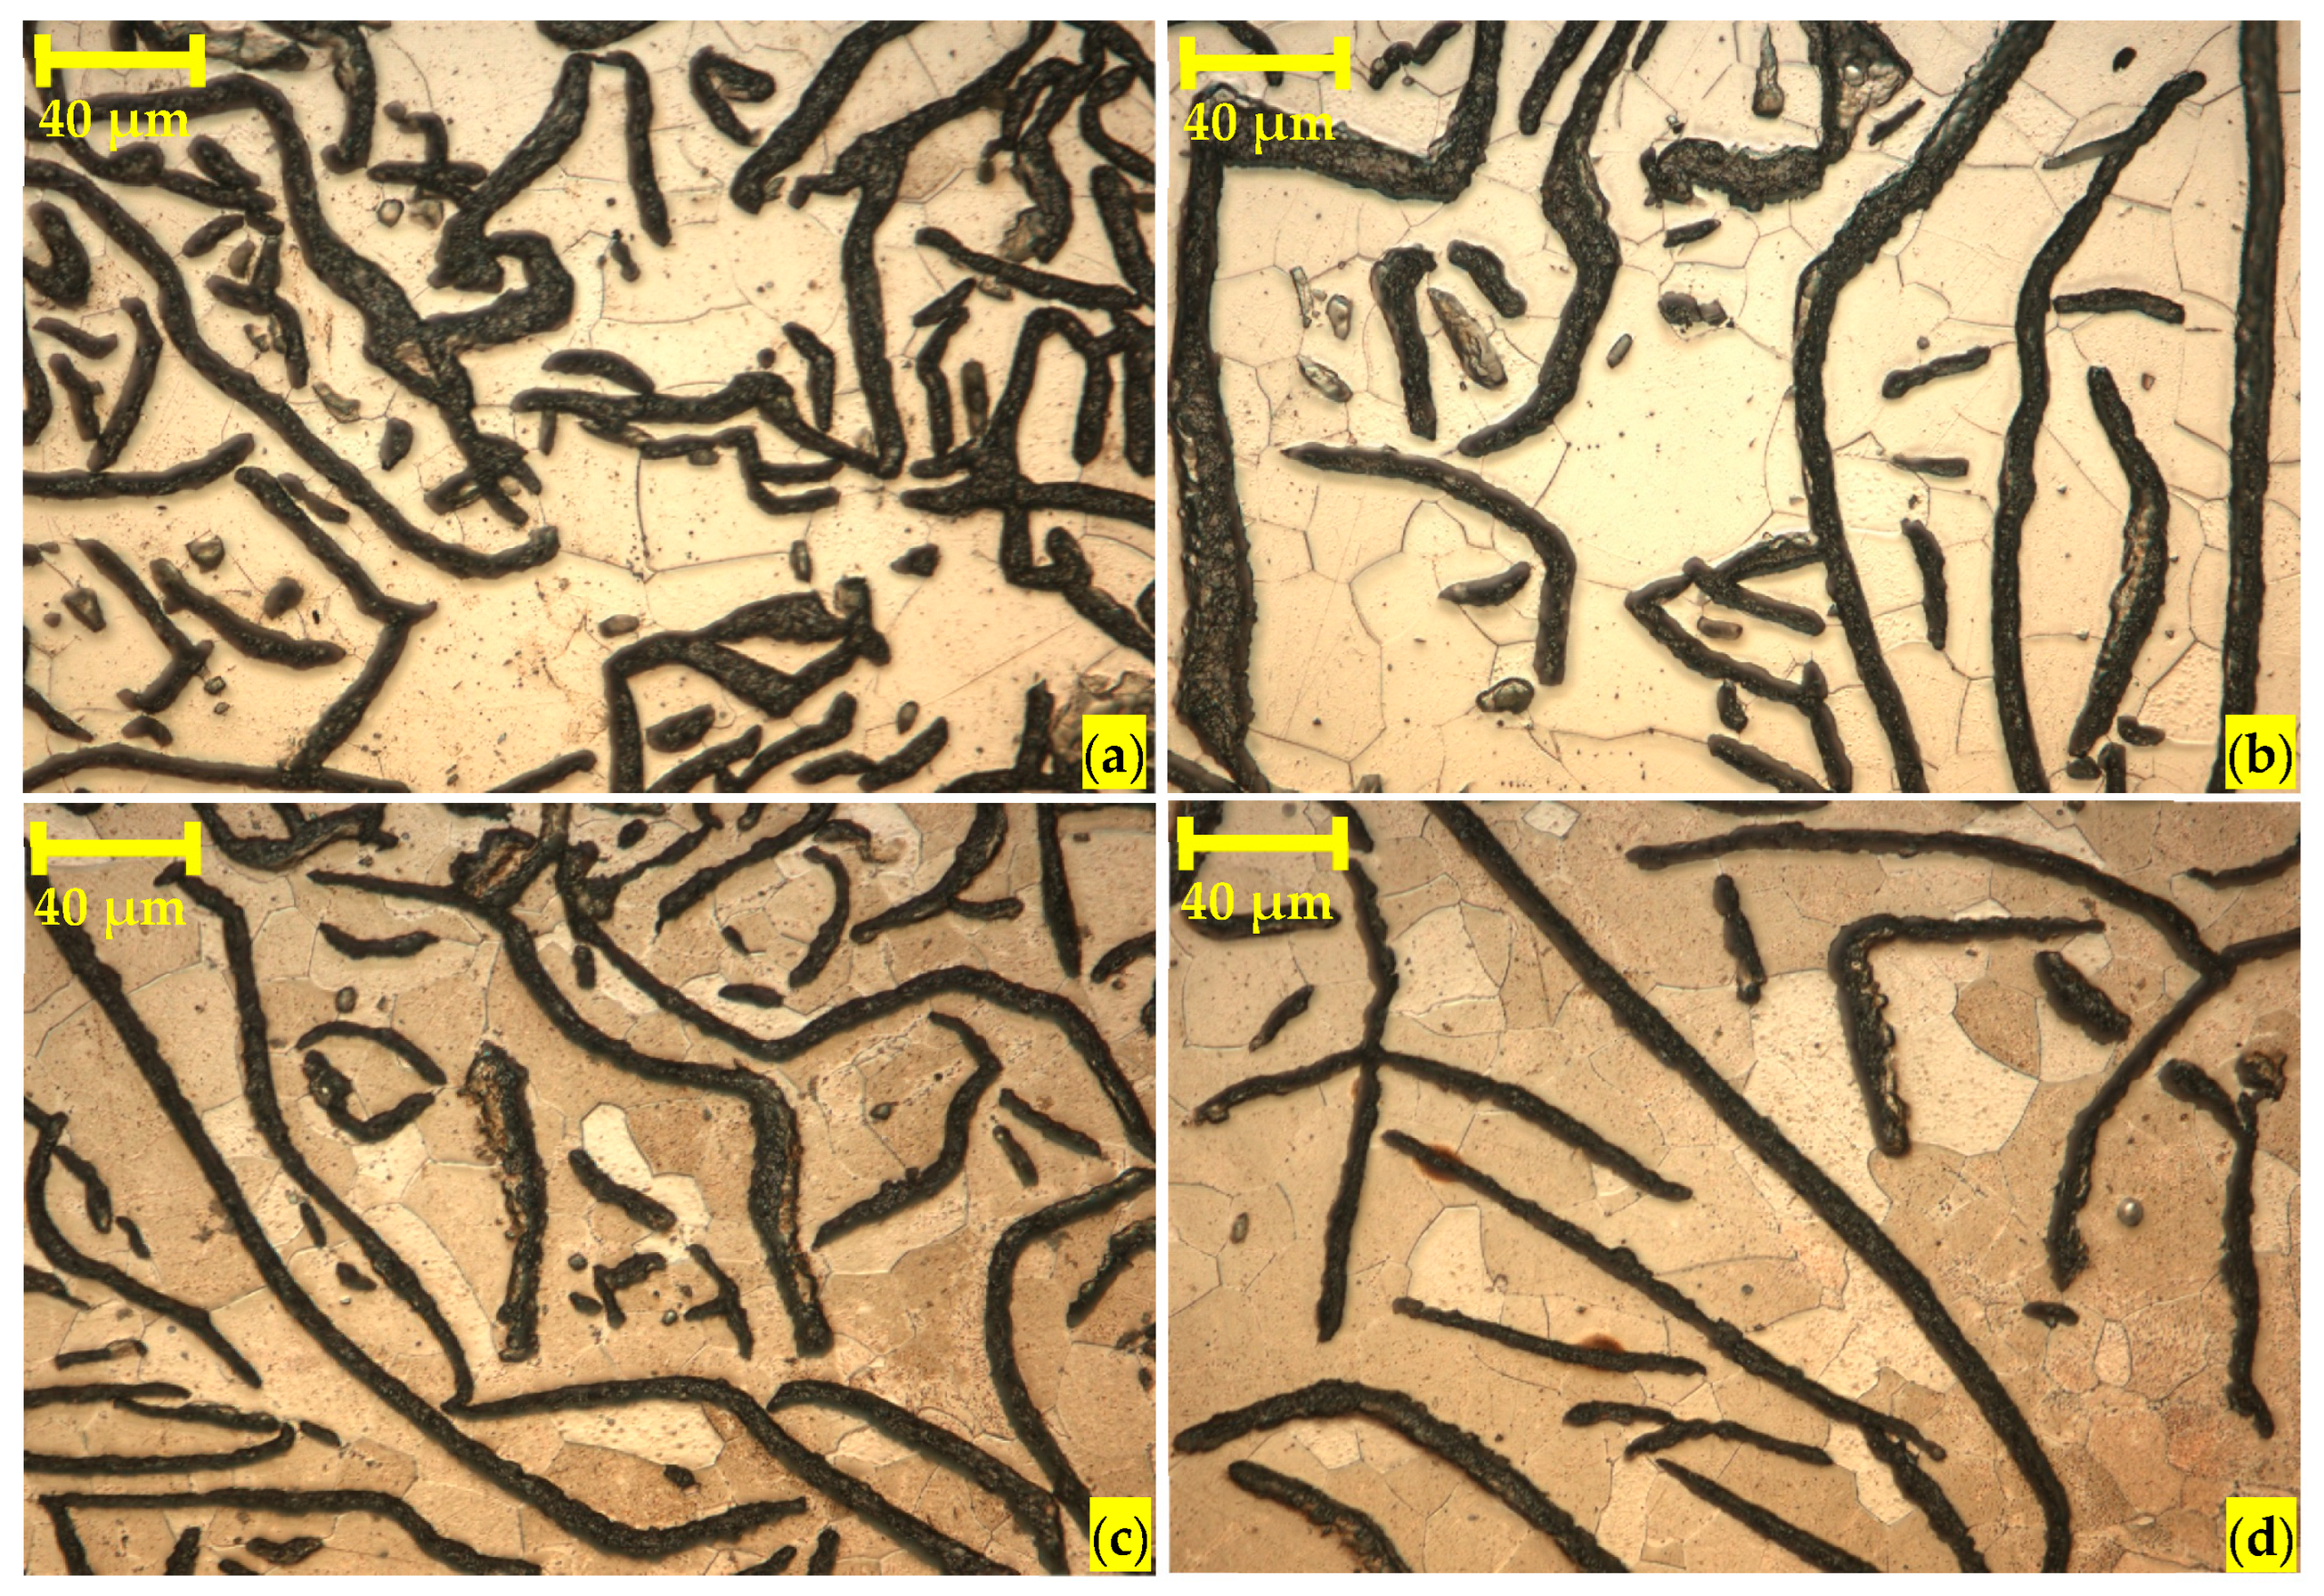
3.1. Heat Treatments and Metallographic Analysis
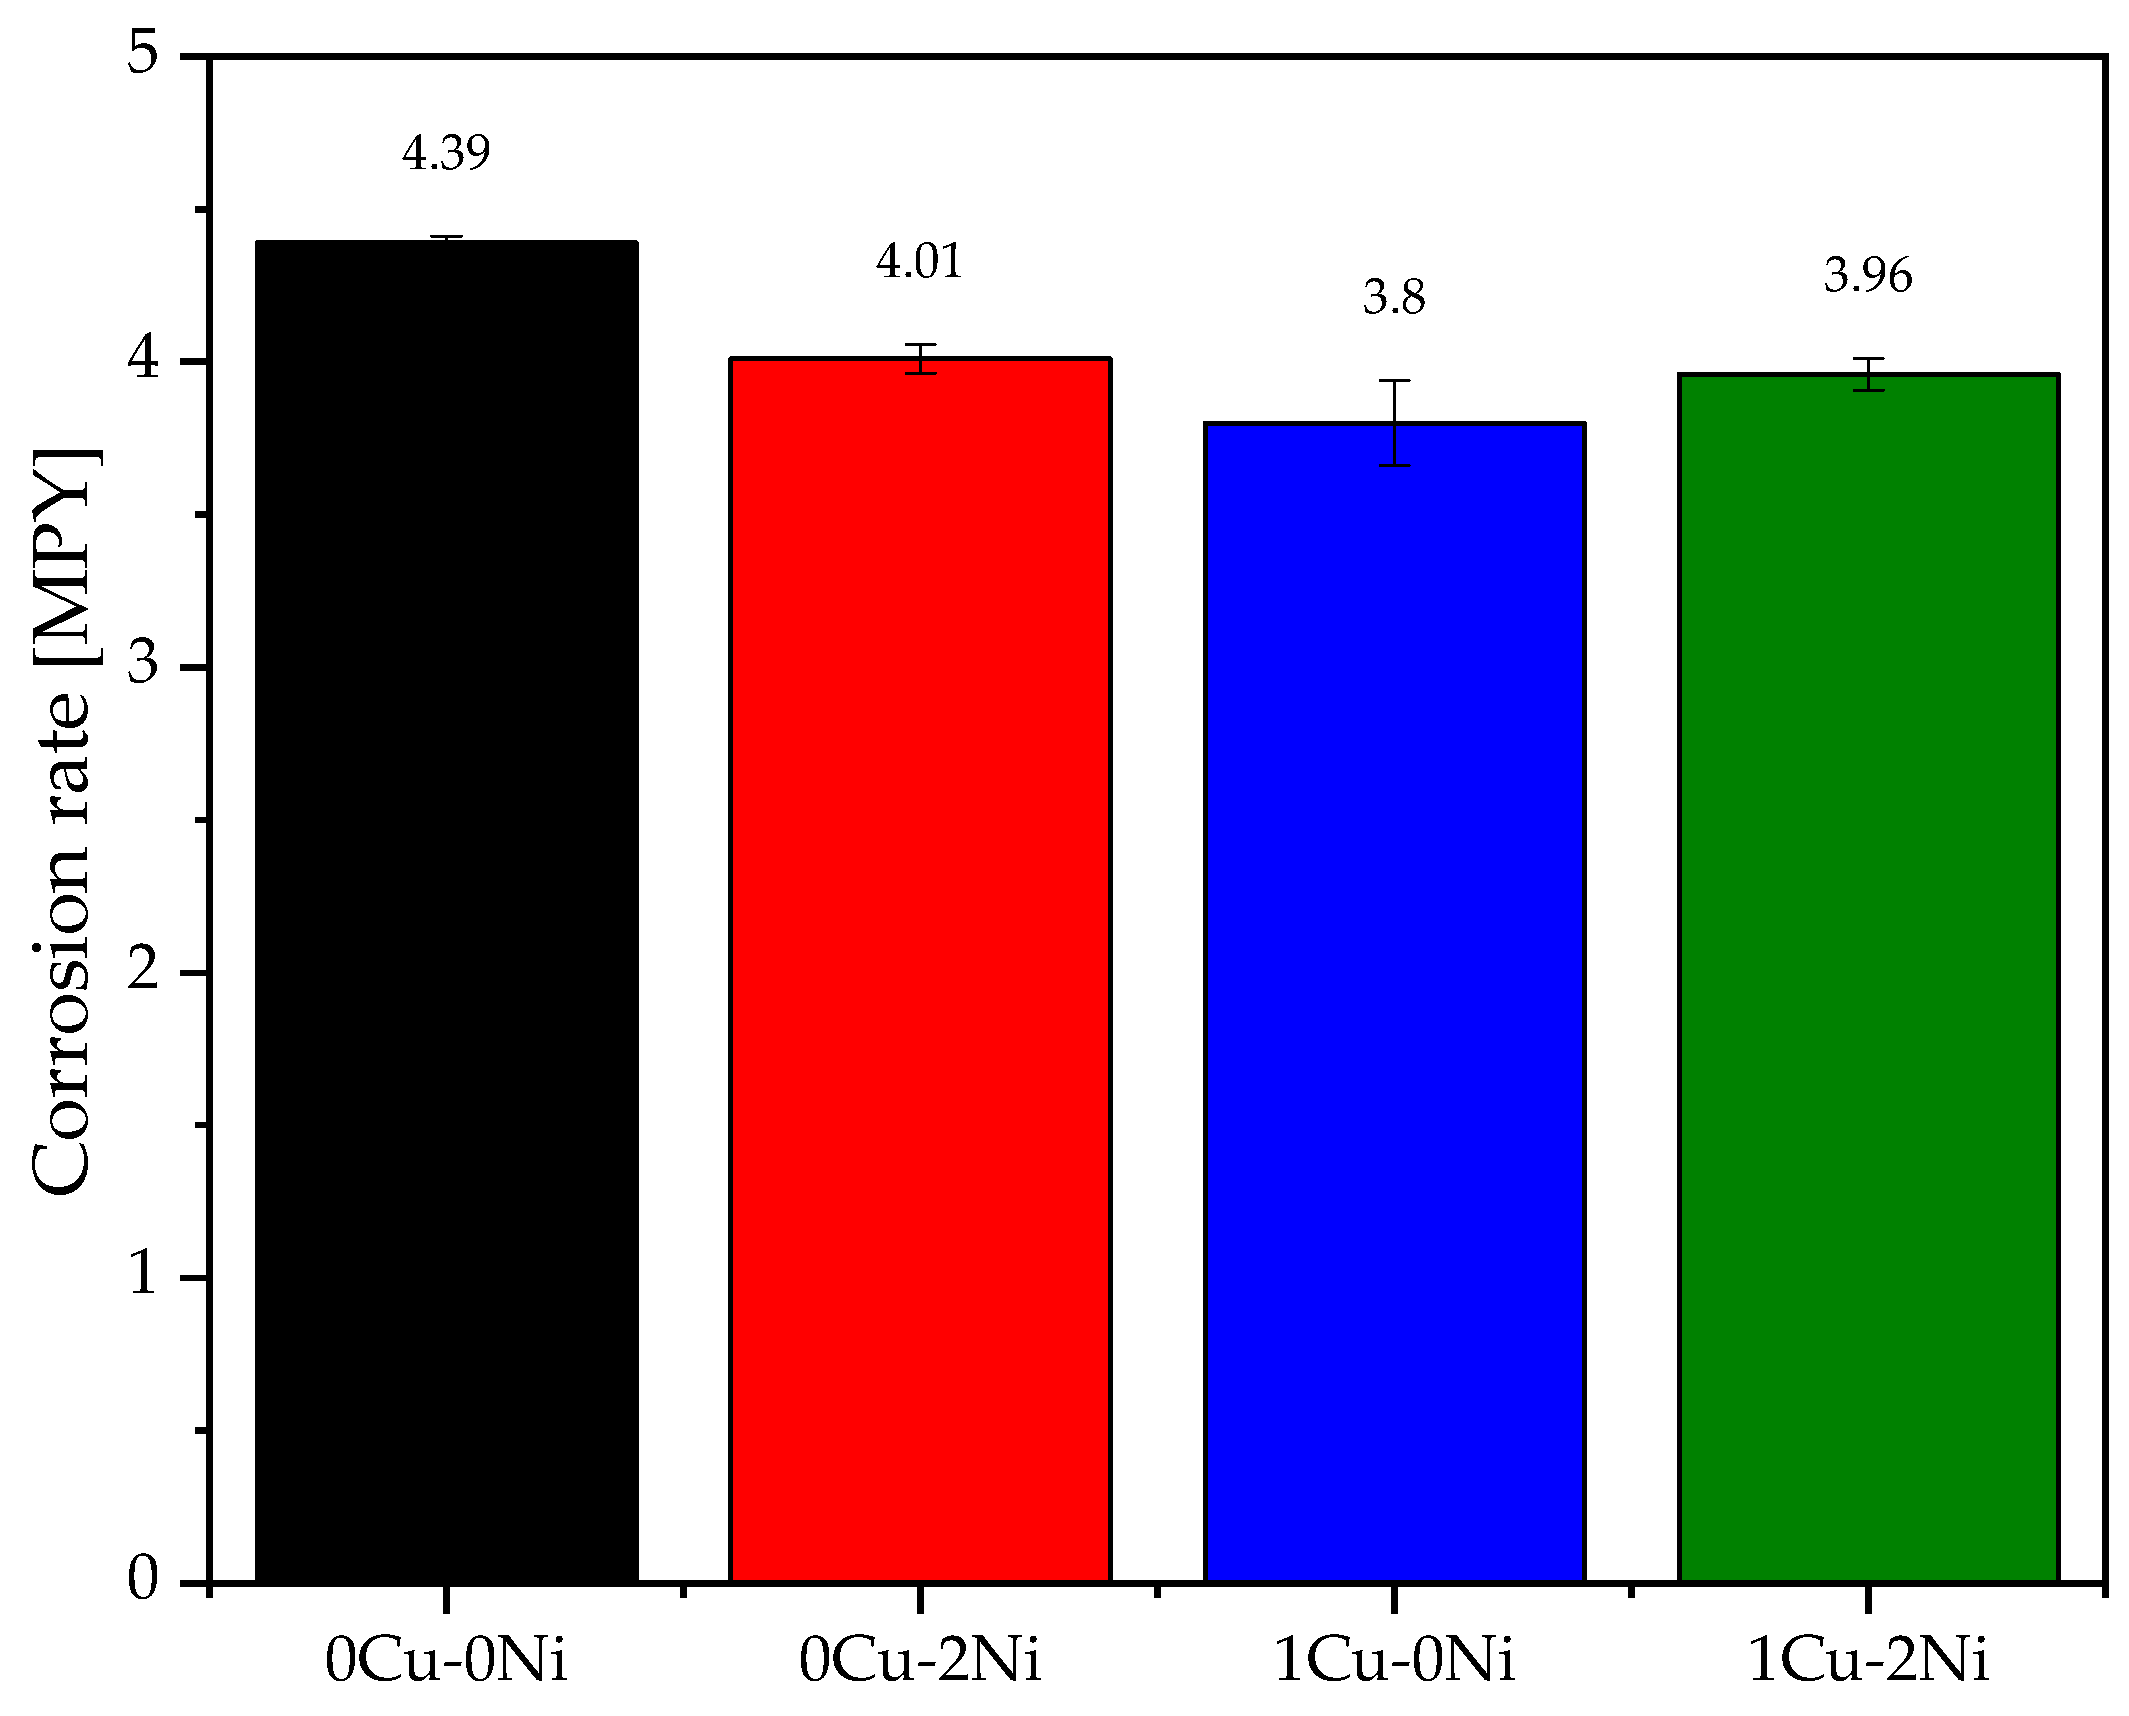
3.2. Polarization Curves
3.3. Determination of Corroded Thickness
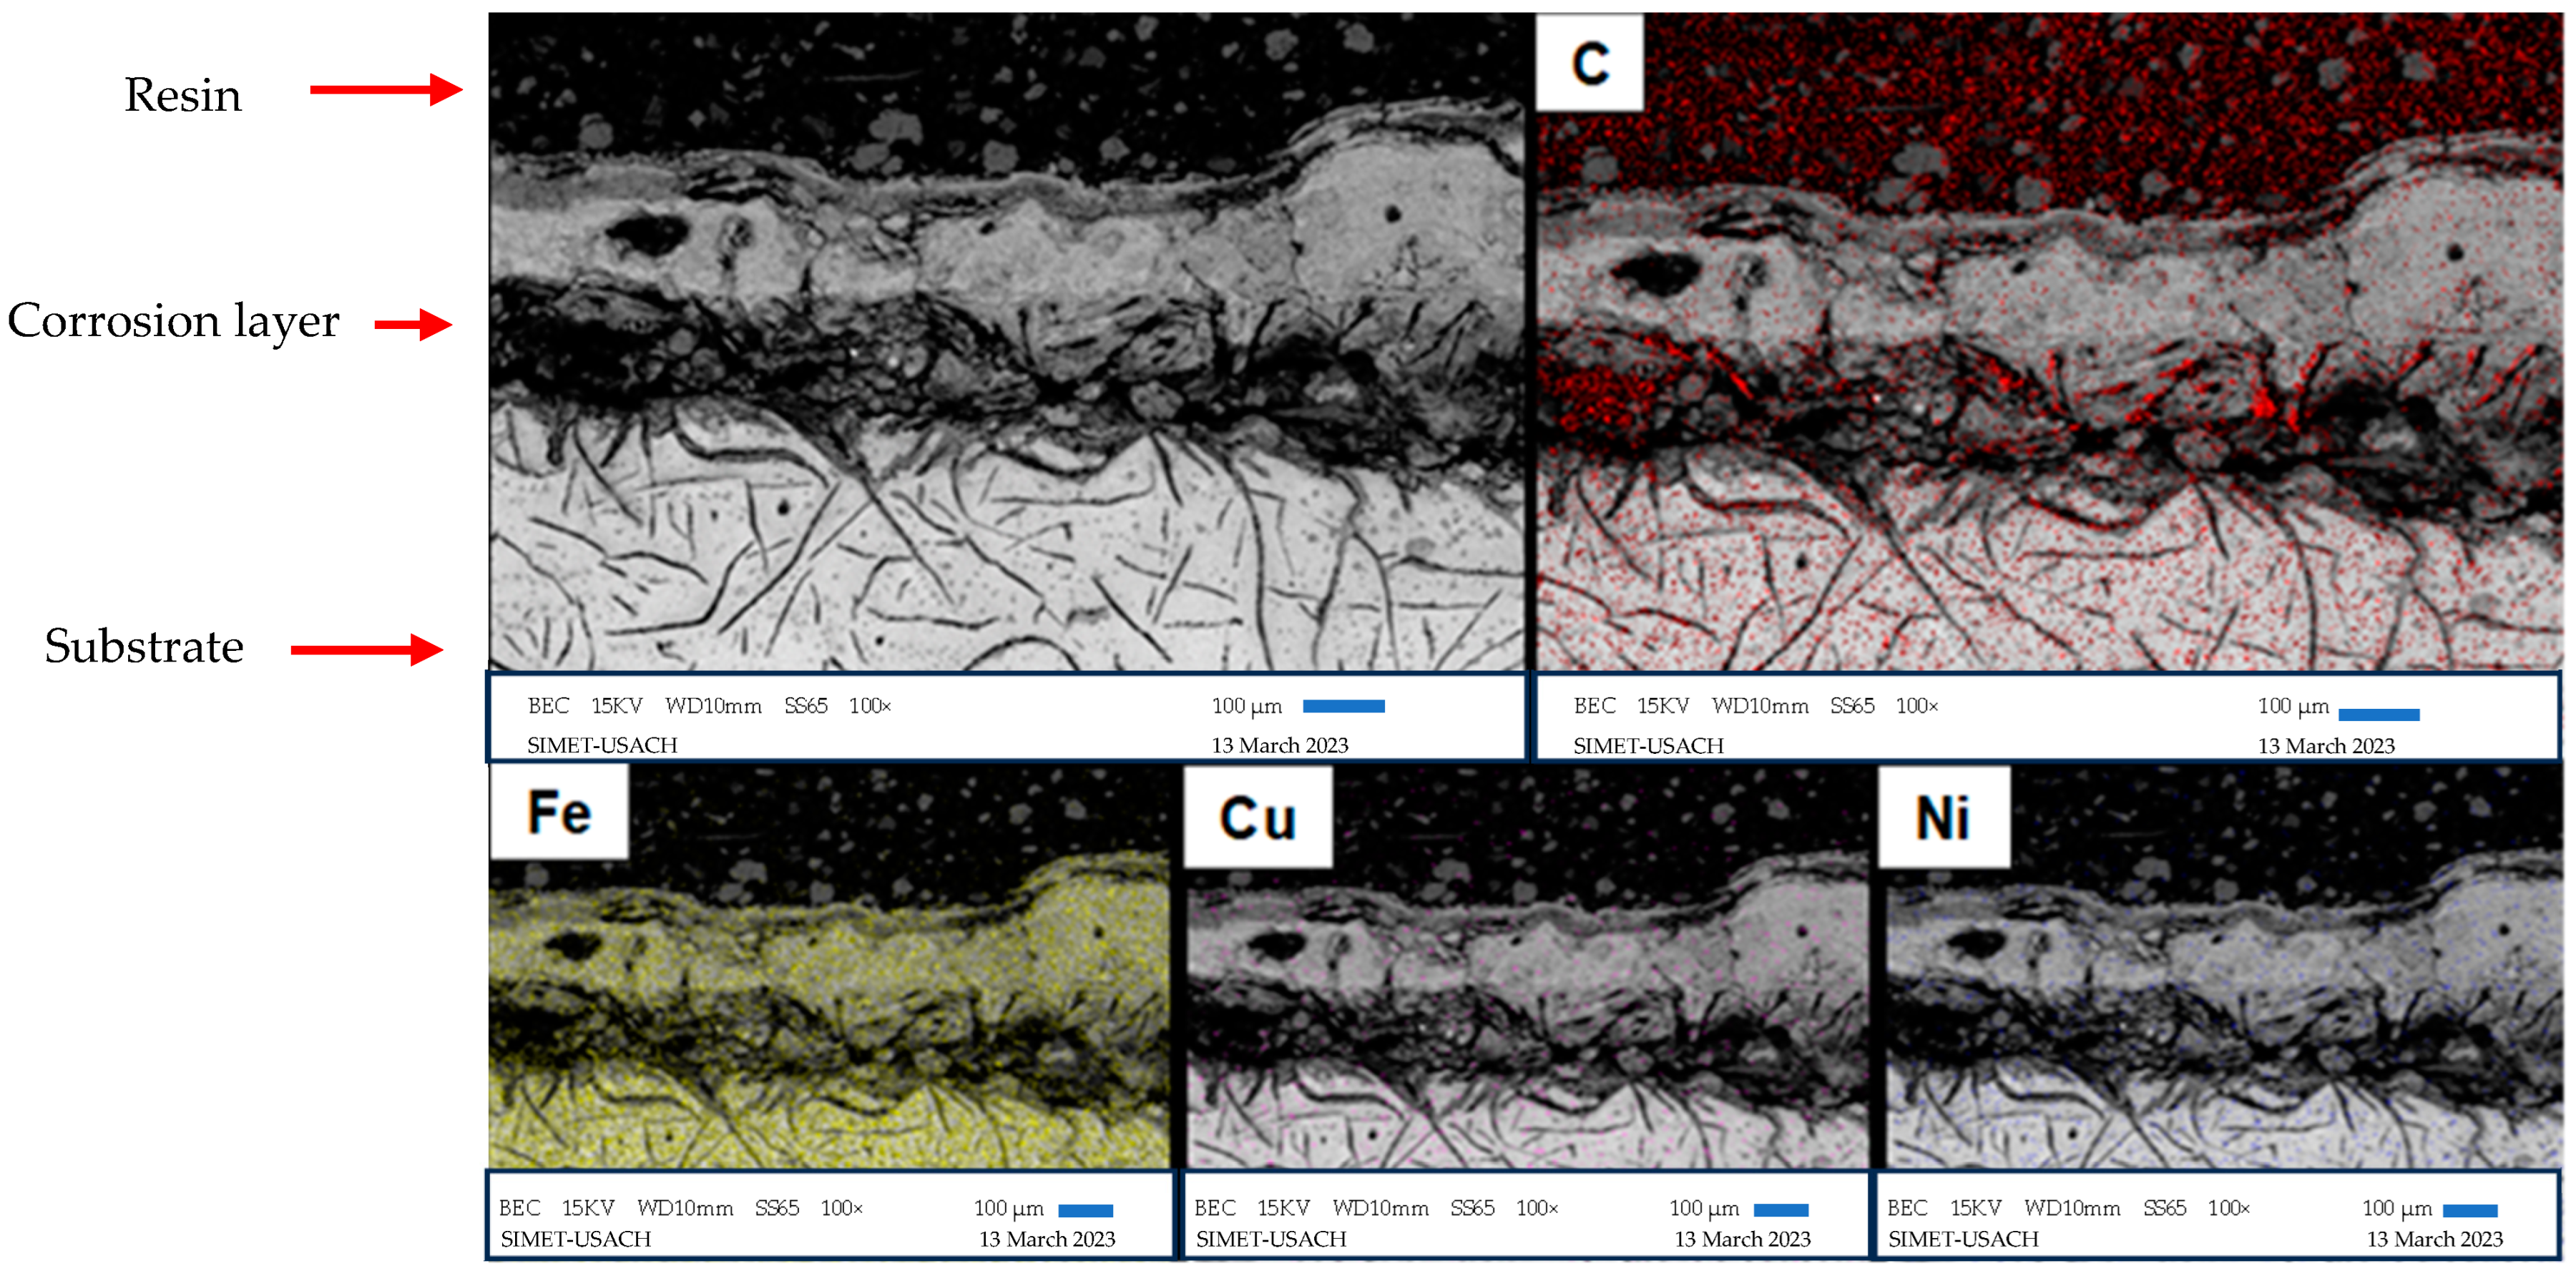
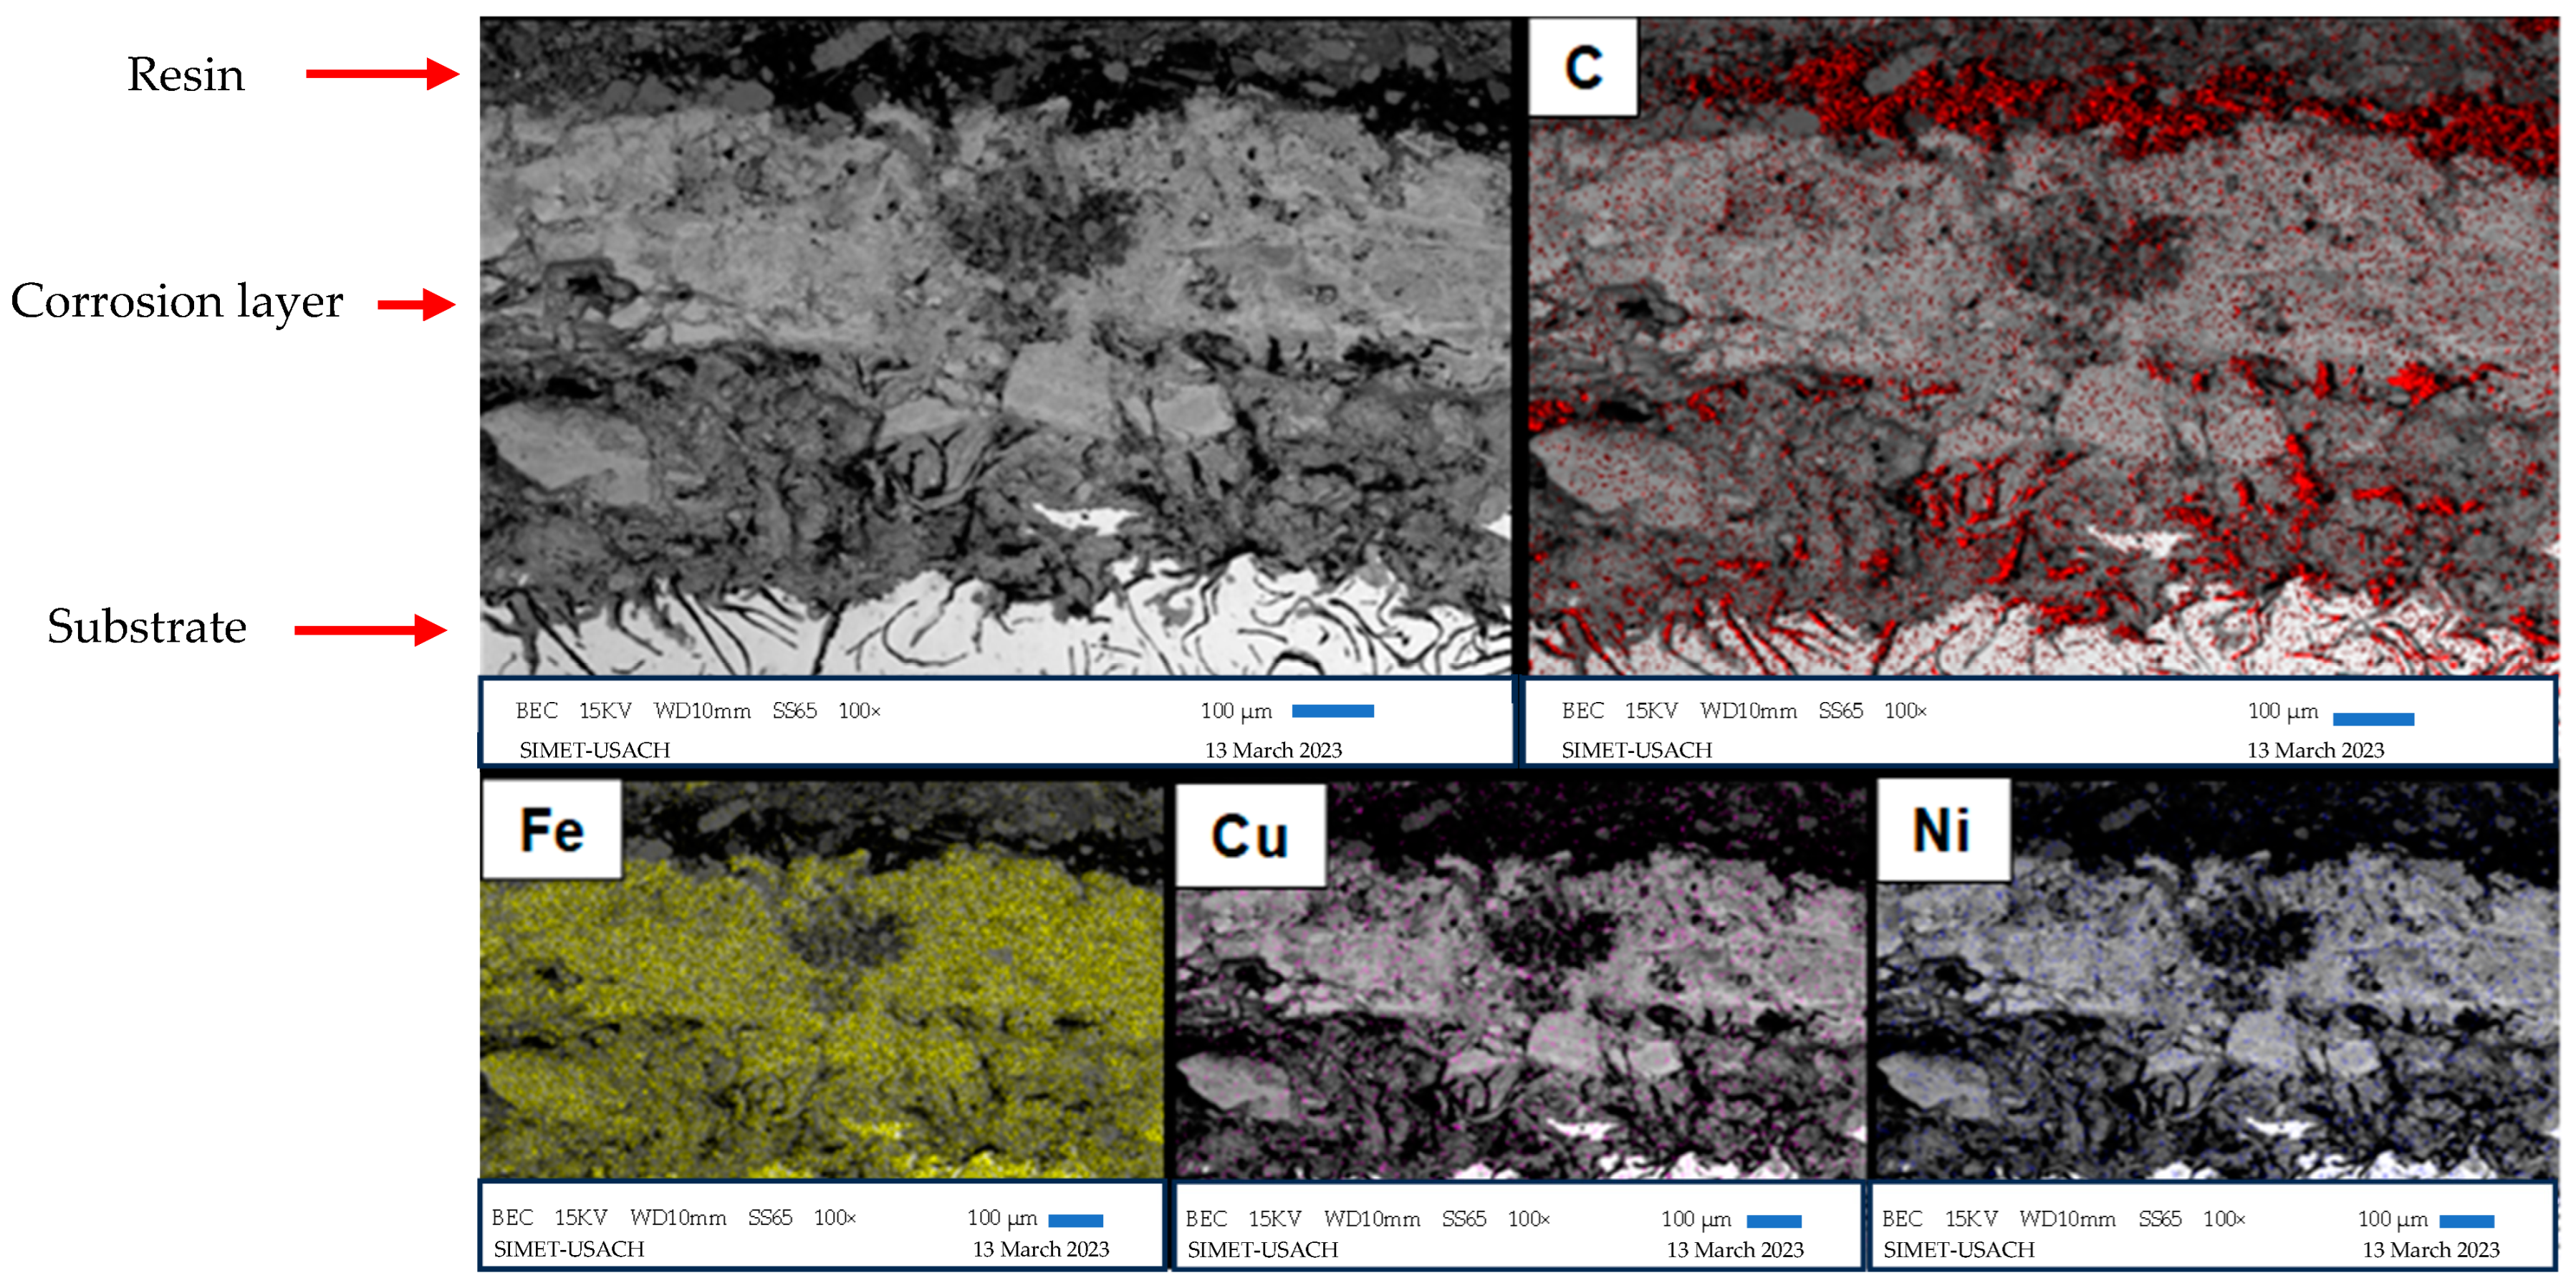
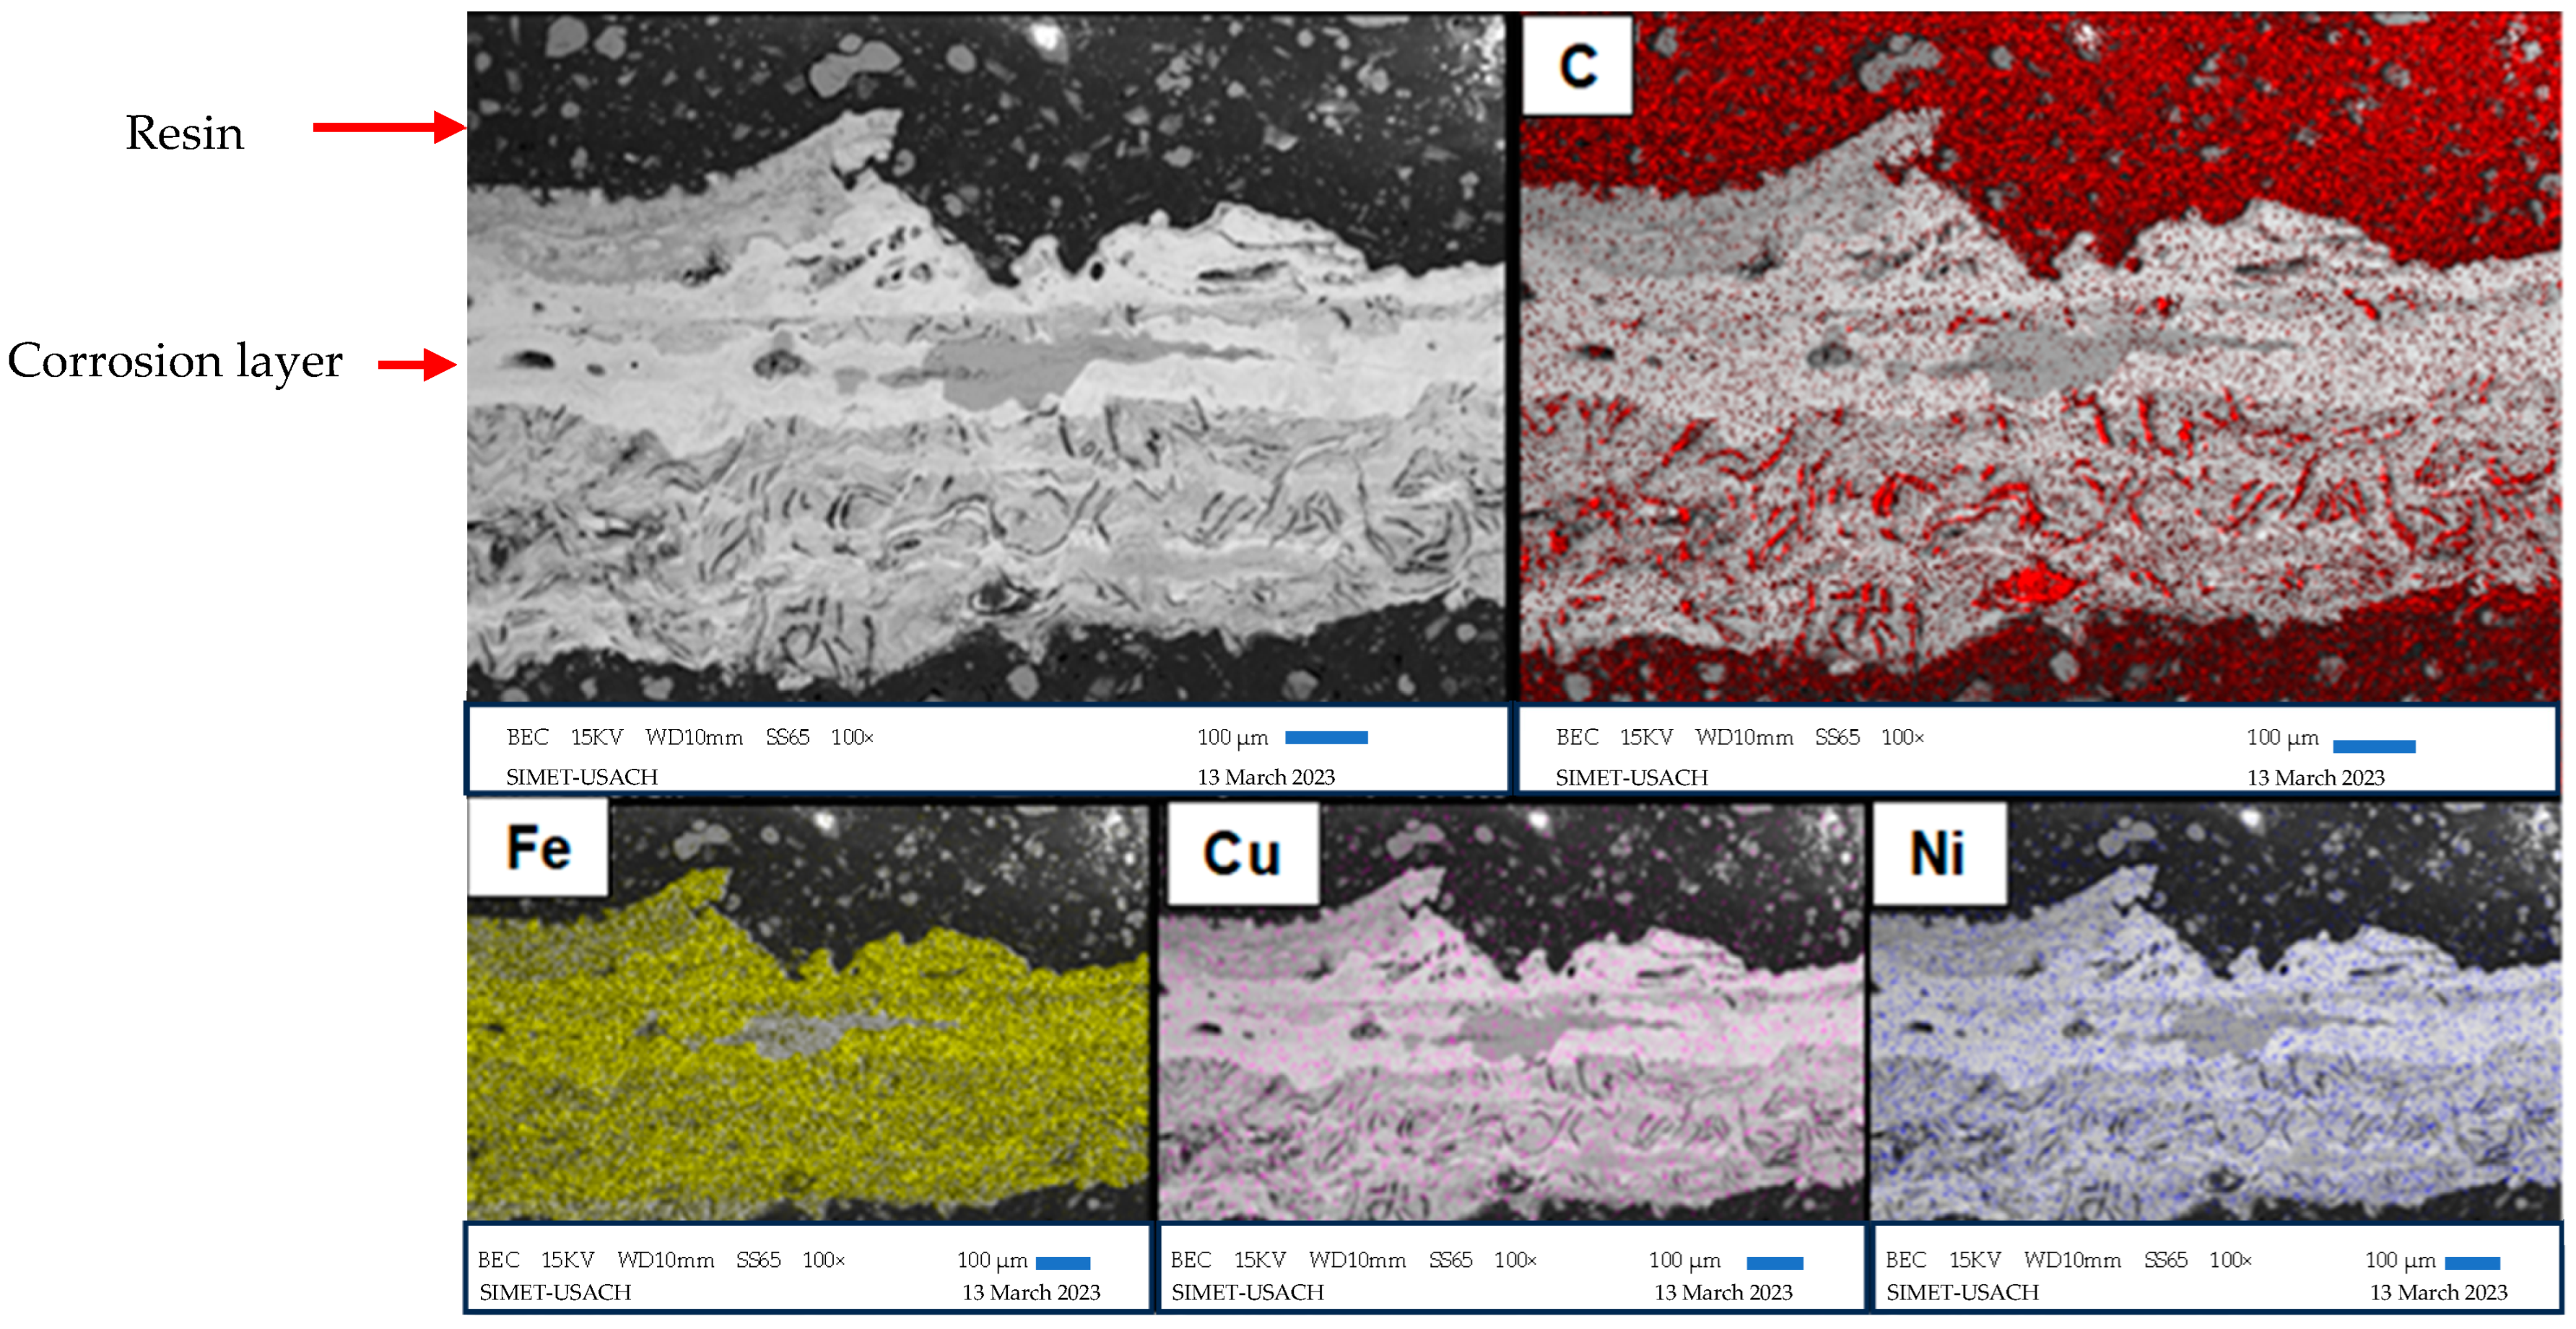
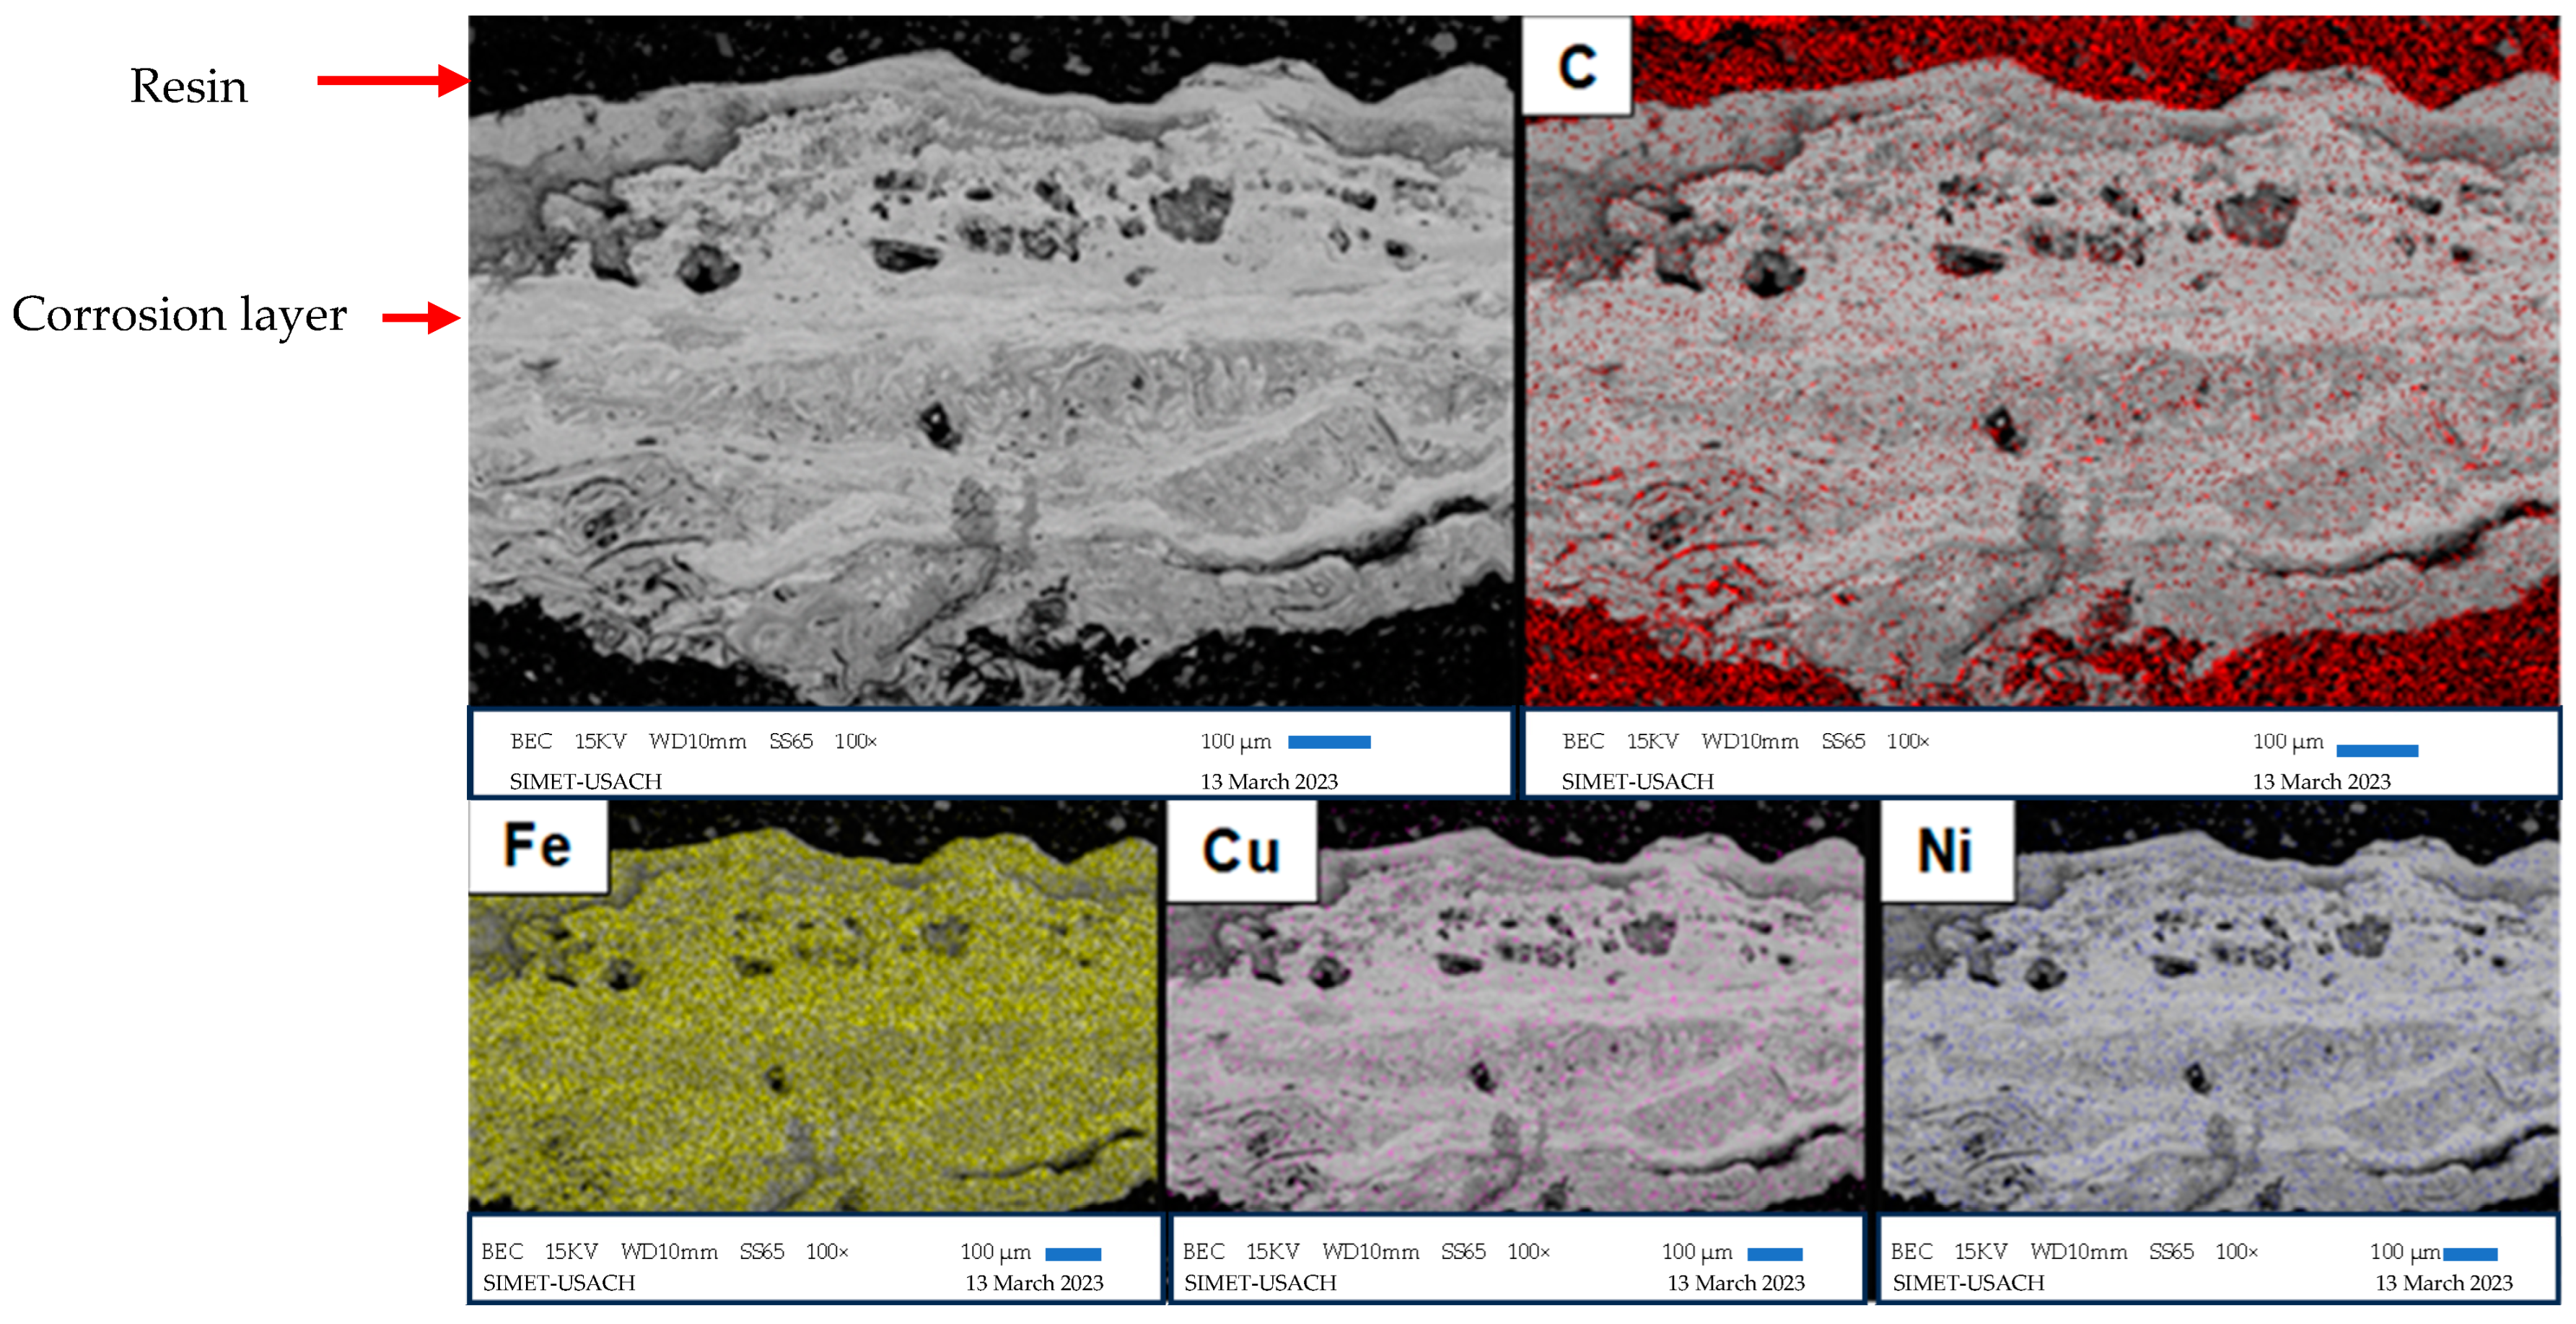
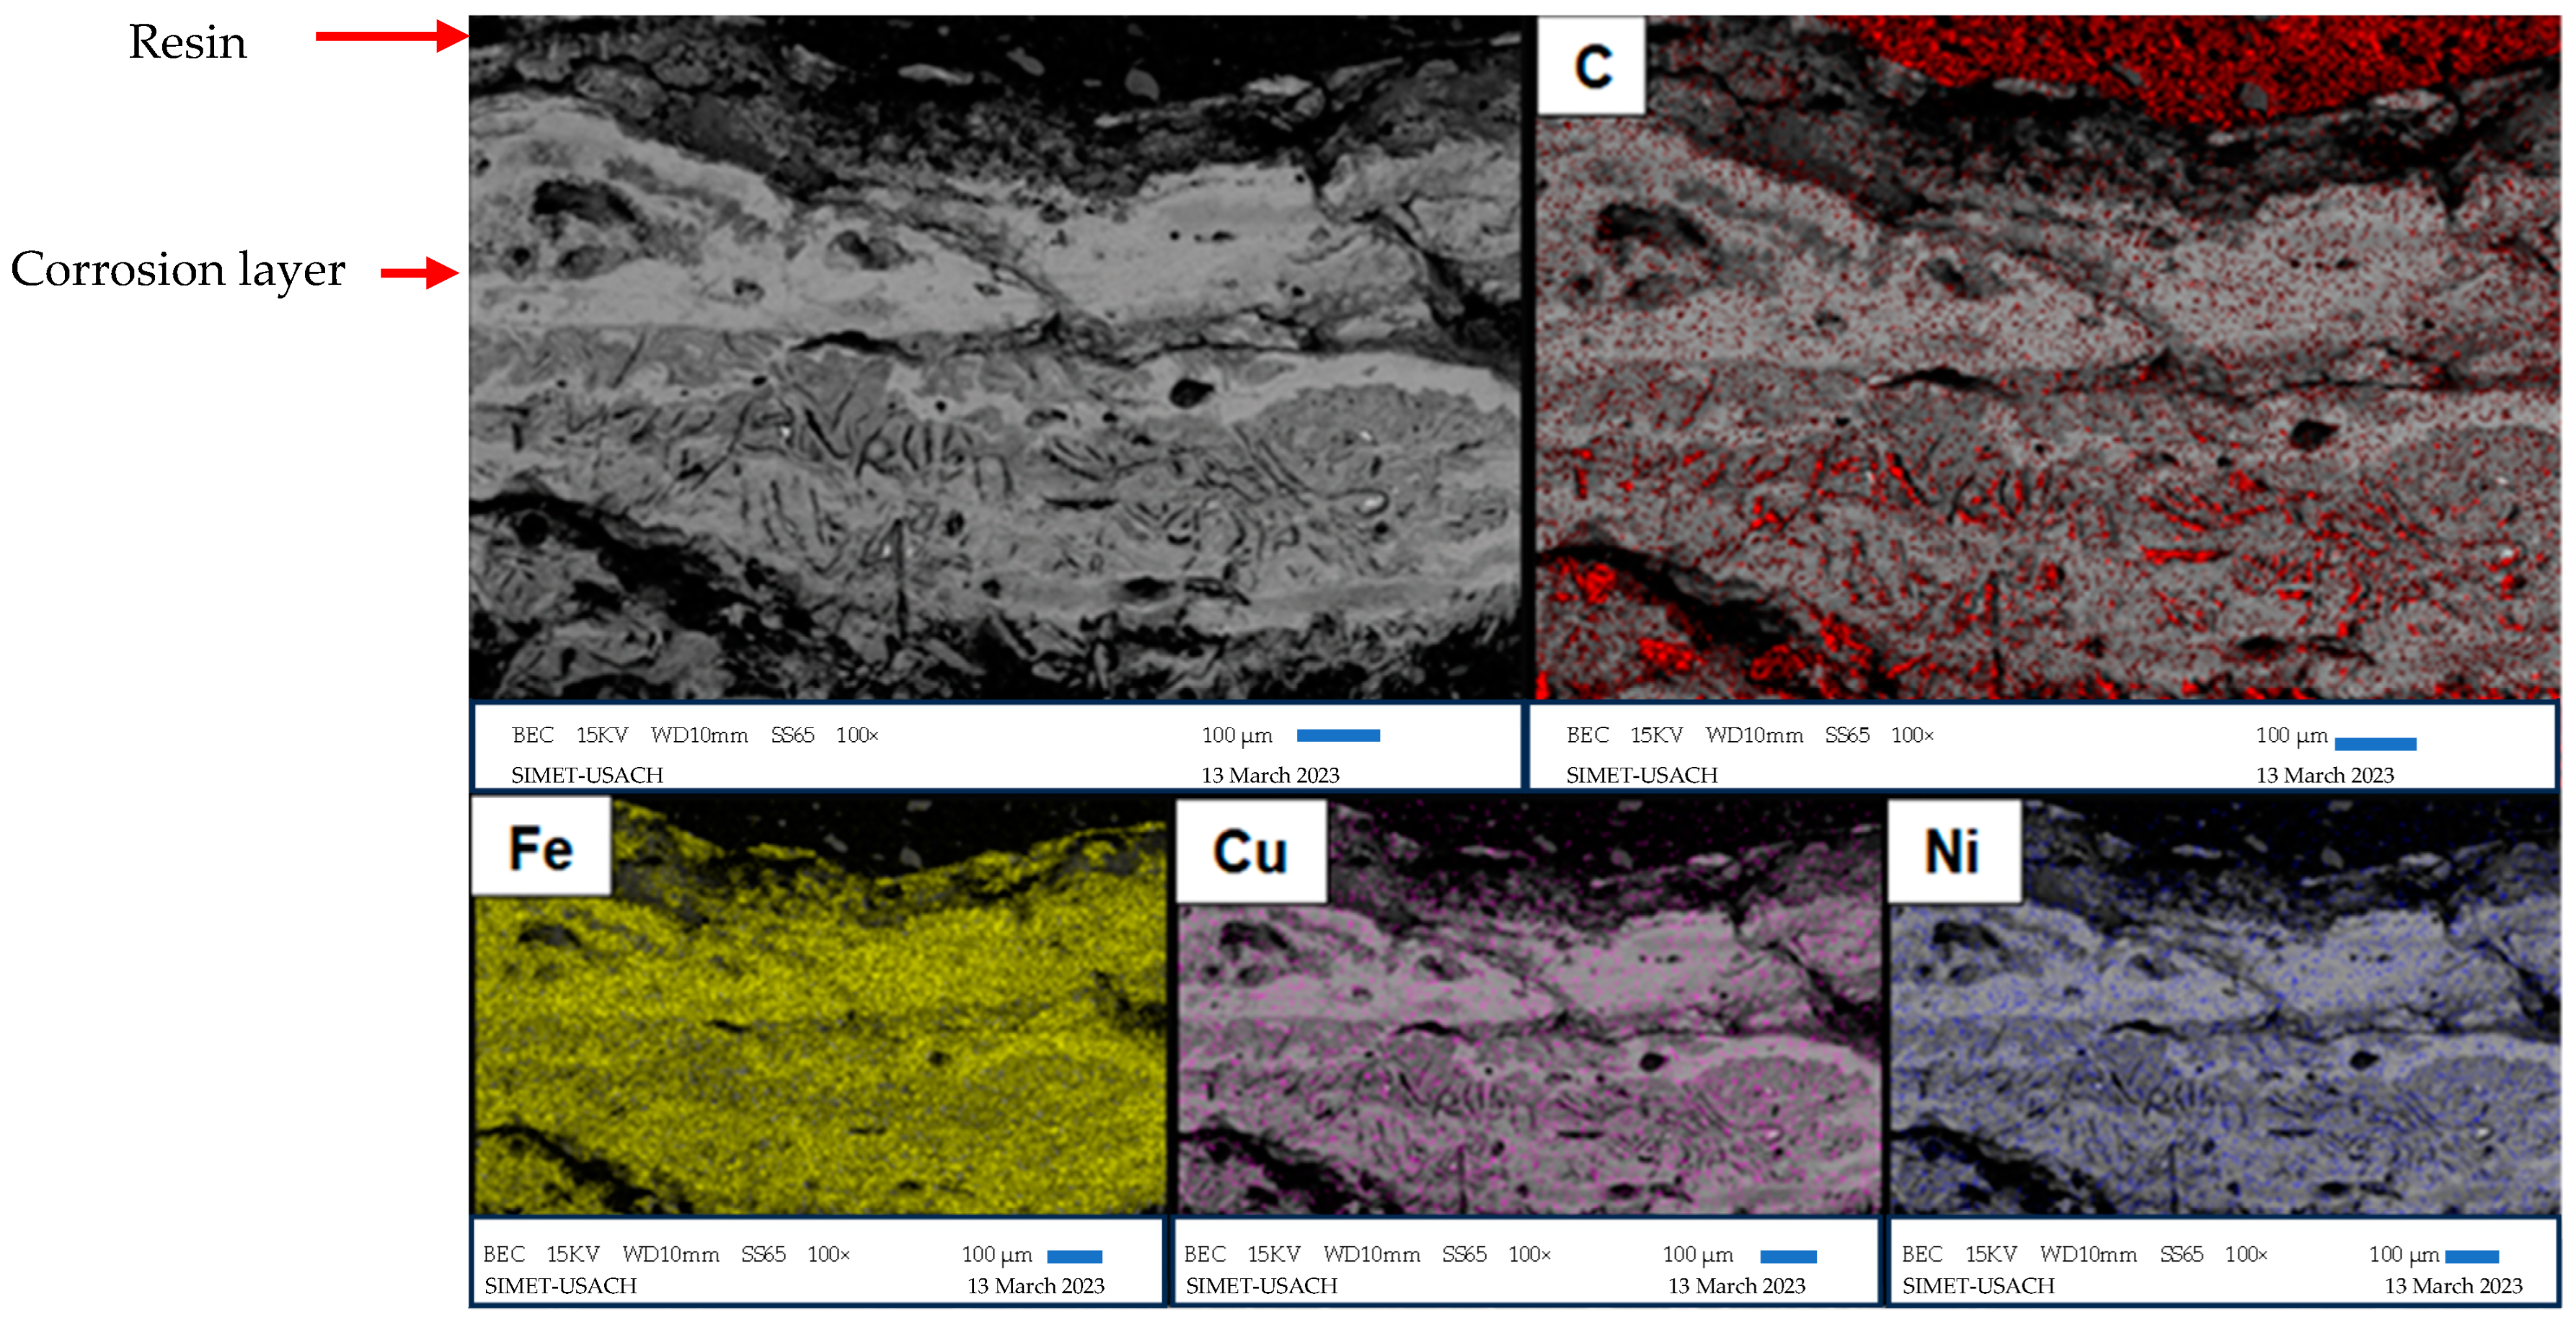
3.4. Scanning Electron Microscopy
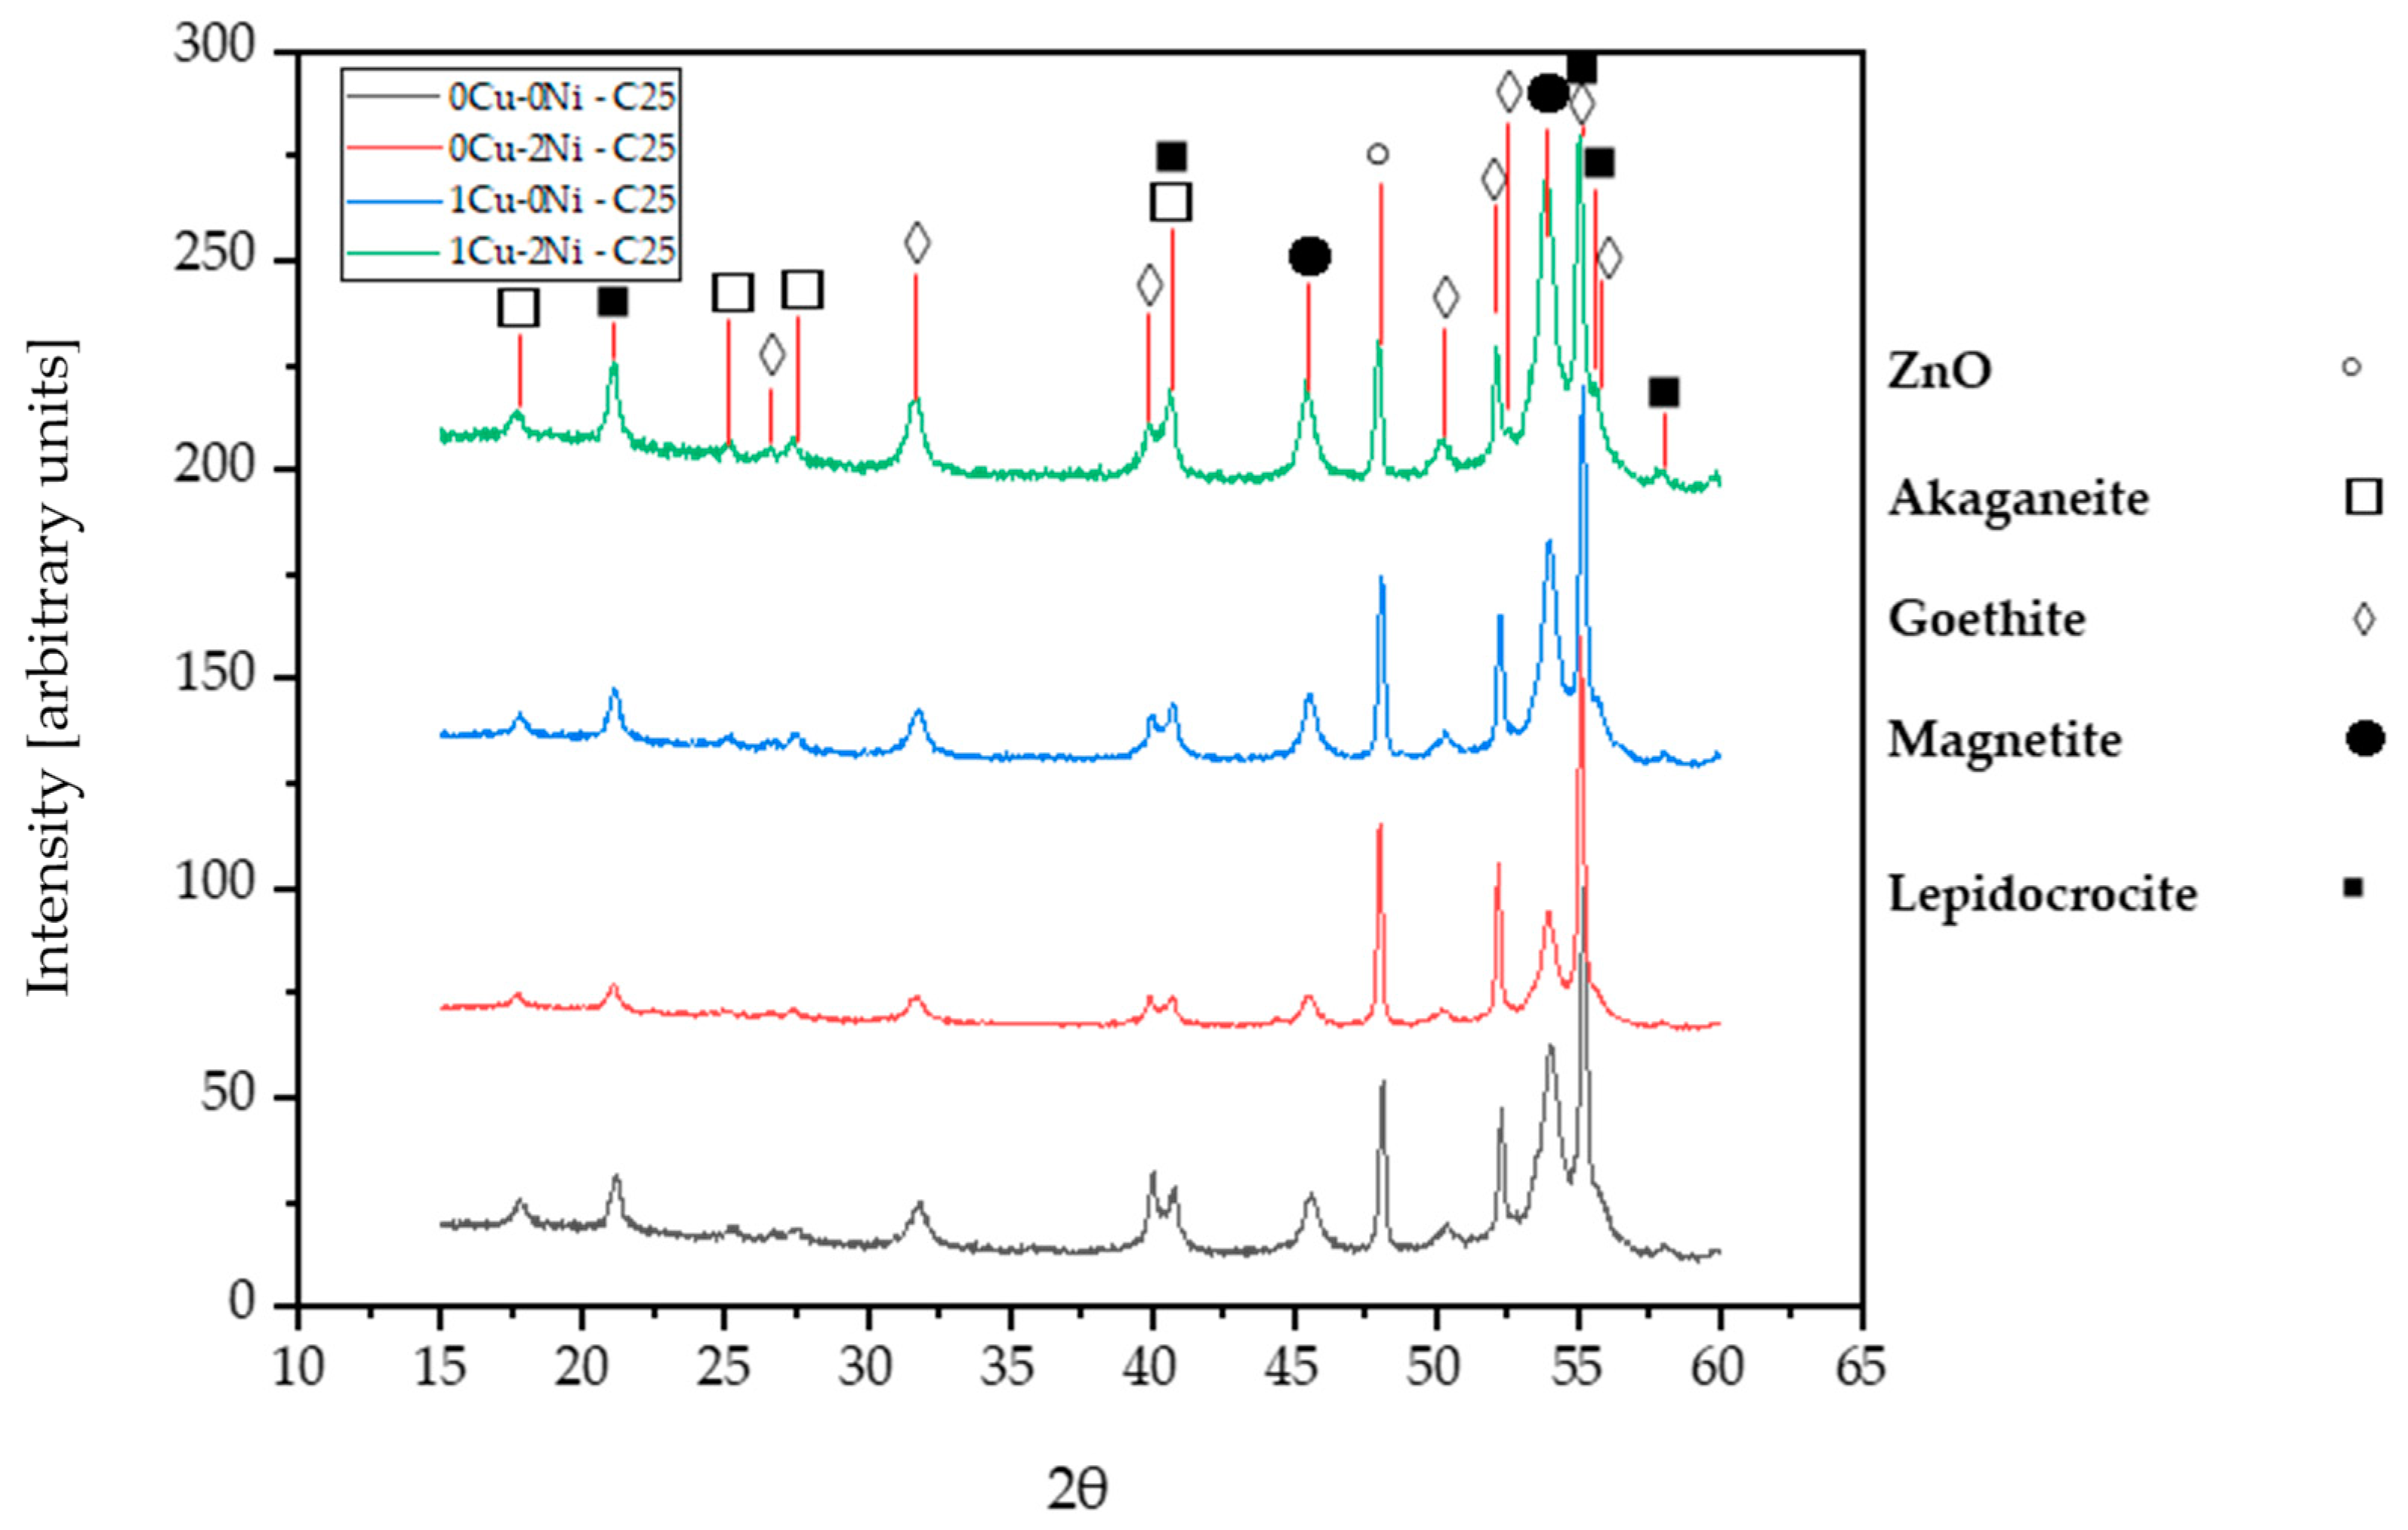
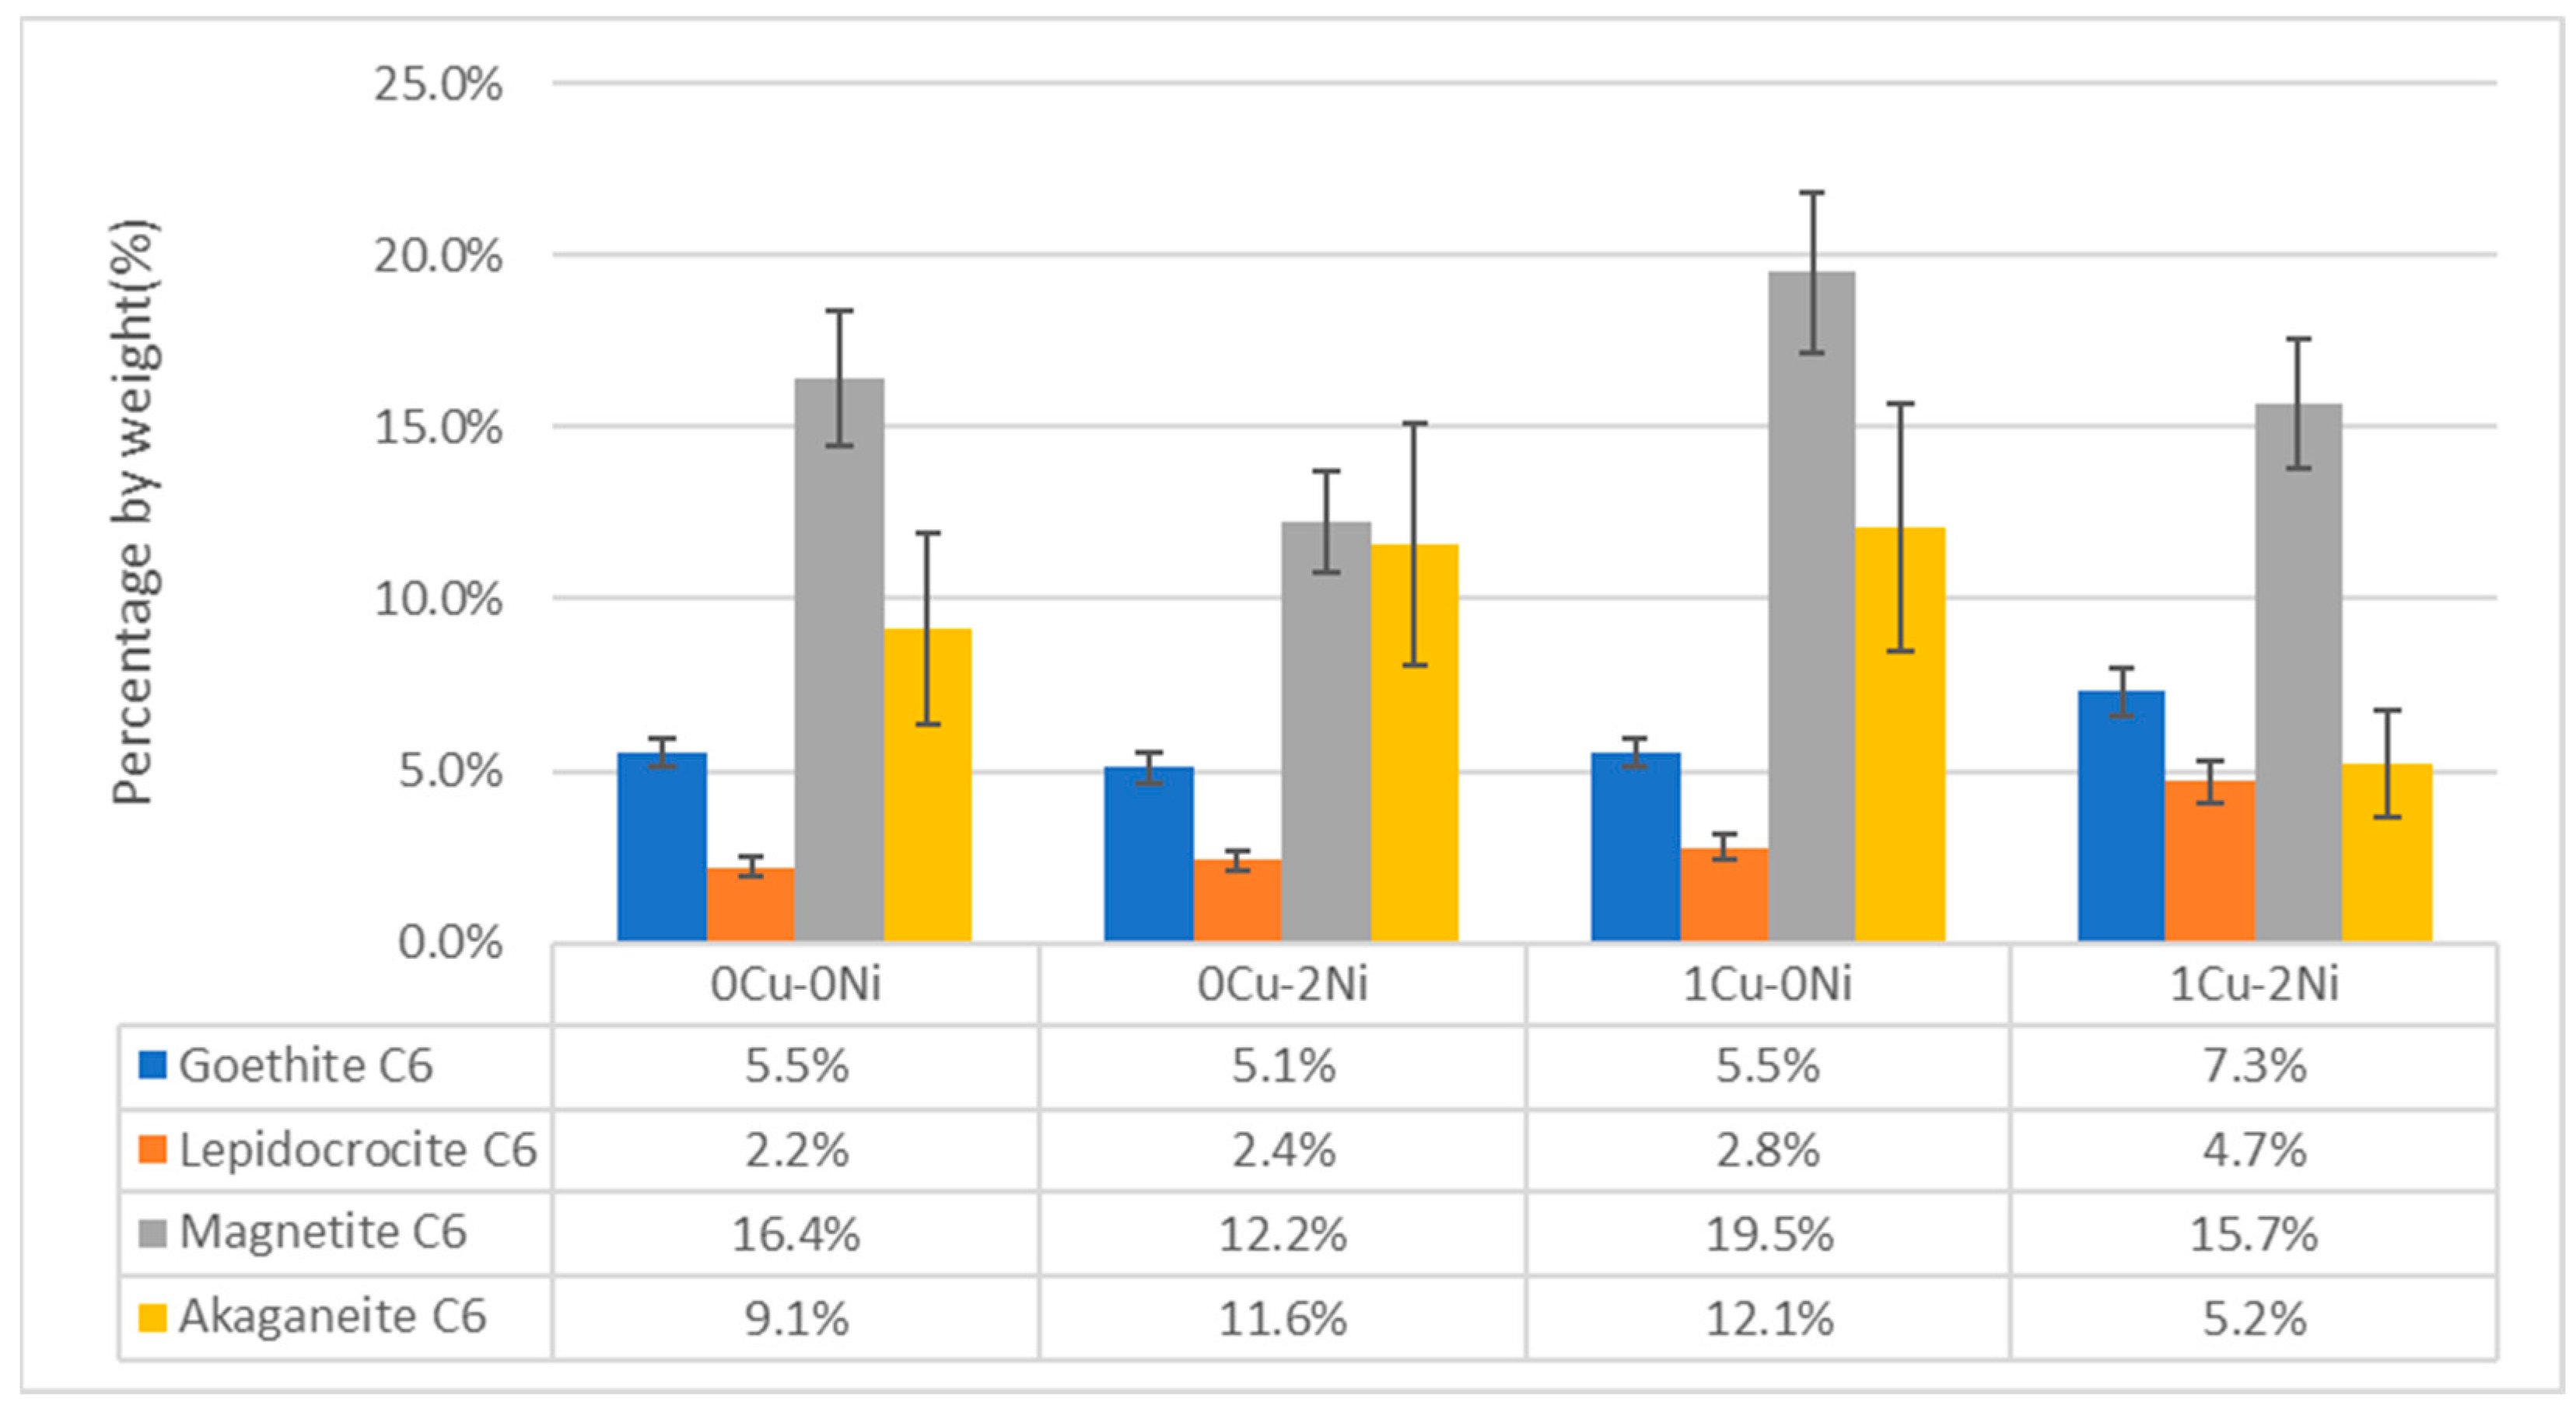
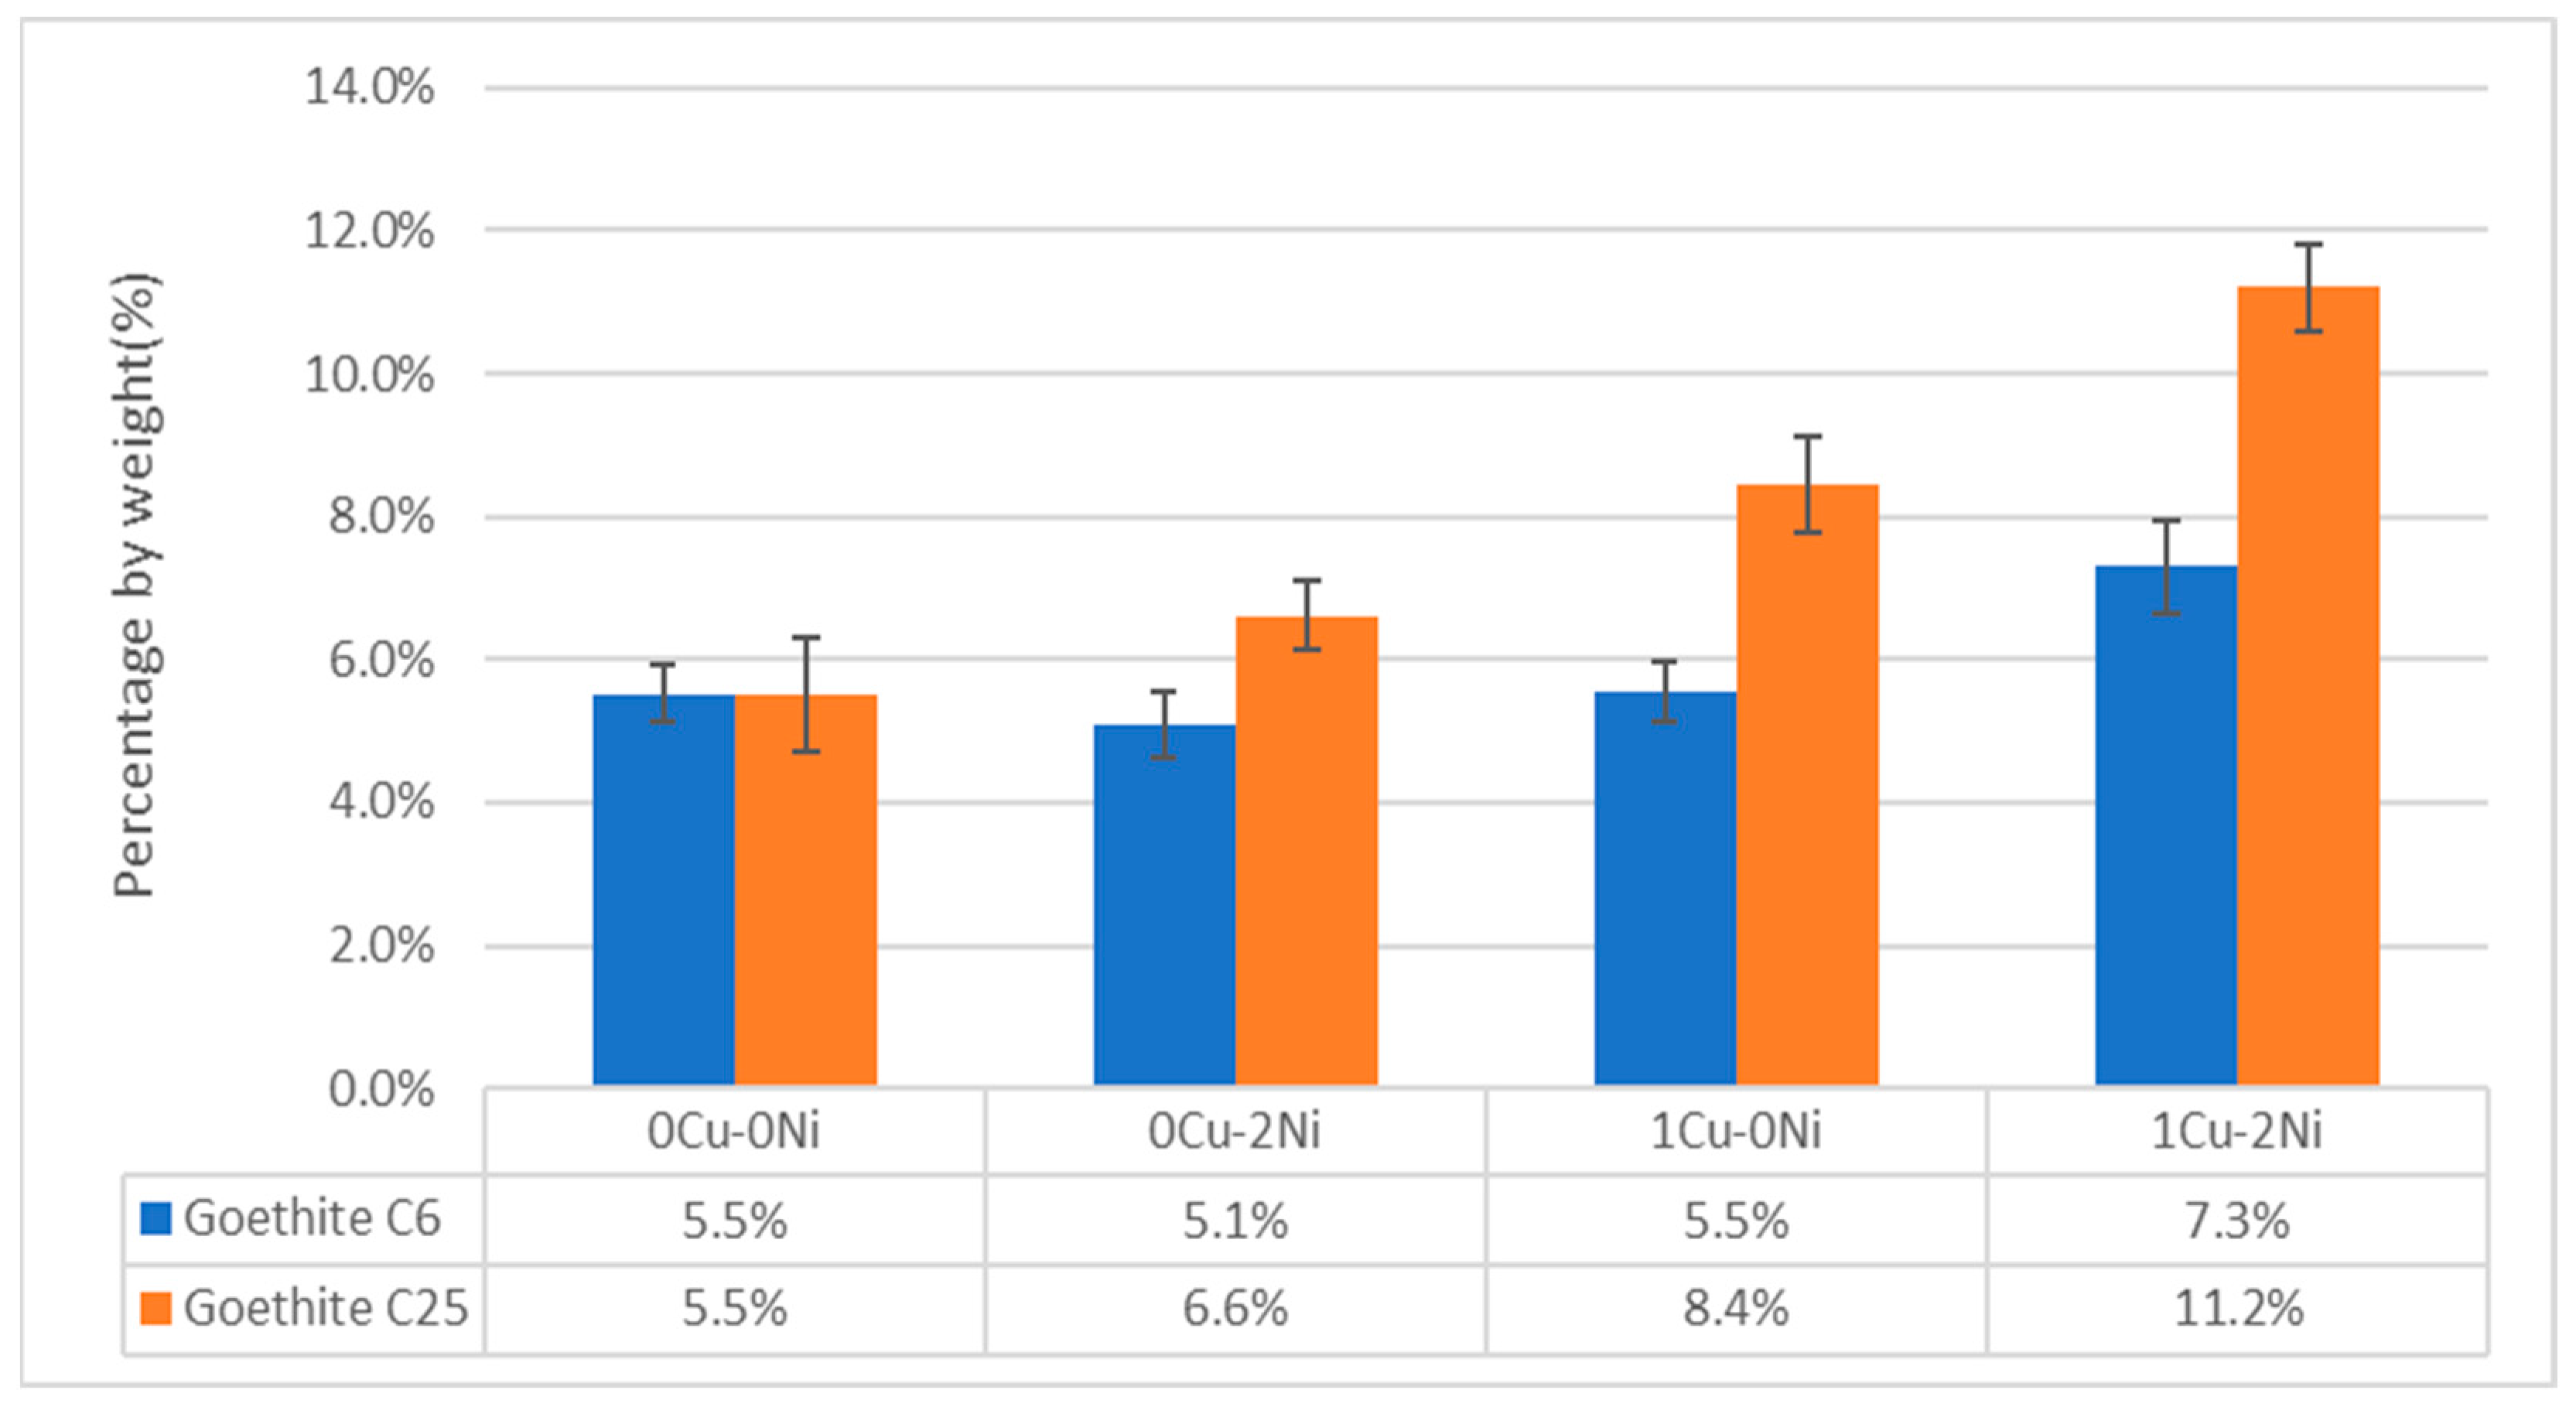
3.5. X-ray Diffraction
4. Discussion
5. Conclusions
- The influence of Cu and Ni on the corrosion mechanisms in gray cast irons impacts the corrosion rates in a different way from that of weathering steels.
- It has been estimated that in the initial stages of corrosion, the alloys exhibit a behavior like that reported in the literature. However, the presence of a second inflection point in the corroded thickness vs. time curves suggests the presence of a third distinct mechanism. This new mechanism has been characterized with the parameter “tB”.
- The effect of copper and nickel on the marine corrosion process of gray iron with flake graphite has been evaluated. The addition of copper shows an increase in the goethite phase in the long-term, while adding nickel infers a behavior that contributes to the formation of oxyhydroxides like lepidocrocite, which have a negative charge. This disfavors interaction with the chloride ion, hence delaying the corrosion processes like what occurs in weathering steels.
- In samples with a combined content of copper and nickel, it is observed that the effect of the alloying elements is practically independent. That is, in the short-term, there is a decrease in corroded thickness due to nickel’s contribution to the formation of oxyhydroxides like lepidocrocite, while in the long-term, the copper content favors the appearance of the goethite phase, which increases corrosion resistance. Therefore, the combined effect does not show synergy.
- The presence of a third mechanism could indicate that the alloy’s behavior is not the same as that of weathering steels. This behavior is attributed to the graphite phase.
- Regarding the observed corrosion rates, it is possible to say that there is no superior material. This should be evaluated based on the duration of exposure to the atmosphere. If the material is exposed to an aggressive environment for a short time, the best alternative would be a nickel-rich alloy. However, if the samples will be exposed for a long time, then the best option would be an alloy with a high copper content.
Author Contributions
Funding
Data Availability Statement
Acknowledgments
Conflicts of Interest
References
- Koch, G.; Varney, J.; Thompson, N.; Moghissi, O.; Gould, M.; Payer, J. International Measures of Prevention, Application, and Economics of Corrosion Technology; NACE International Impact Park Ten Place: Houston, TX, USA, 2016. [Google Scholar]
- Morcillo, M.; Chico, B.; Díaz, I.; Cano, H.; de la Fuente, D. Atmospheric Corrosion Data of Weathering Steels. A Review. Corros. Sci. 2013, 77, 6–24. [Google Scholar] [CrossRef]
- Modern Casting. Census of World Casting Production. 2019. Available online: https://www.moderncasting.com/census-world-casting-production (accessed on 19 April 2024).
- LaQue, F.L. The corrosion resistance of ductile irons. Corrosion 1958, 14, 485t–492t. [Google Scholar] [CrossRef]
- Mohebbi, H.; Li, C.Q. Experimental Investigation on Corrosion of Cast Iron Pipes. Int. J. Corros. 2011, 2011, 506501. [Google Scholar] [CrossRef]
- Melchers, R.E. Long-Term Corrosion of Cast Irons and Steel in Marine and Atmospheric Environments. Corros. Sci. 2013, 68, 186–194. [Google Scholar] [CrossRef]
- Melchers, R.E. Microbiological and Abiotic Processes in Modelling Longer-Term Marine Corrosion of Steel. Bioelectrochemistry 2013, 97, 89–96. [Google Scholar] [CrossRef] [PubMed]
- Melchers, R.E. Corrosion at the Steel–Medium Interface. CMD 2024, 5, 52–72. [Google Scholar] [CrossRef]
- Wang, H.; Hu, C.; Zhang, L.; Li, X.; Zhang, Y.; Yang, M. Effects of Microbial Redox Cycling of Iron on Cast Iron Pipe Corrosion in Drinking Water Distribution Systems. Water Res. 2014, 65, 362–370. [Google Scholar] [CrossRef] [PubMed]
- Fan, Y.; Liu, W.; Sun, Z.; Chowwanonthapunya, T.; Zhao, Y.; Dong, B.; Zhang, T.; Banthukul, W. Effect of Chloride Ion on Corrosion Resistance of Ni-Advanced Weathering Steel in Simulated Tropical Marine Atmosphere. Constr. Build. Mater. 2021, 266, 120937. [Google Scholar] [CrossRef]
- Rossi, E. Analysis of Naturally-Generated Corrosion Products Due to Chlorides in 20-Year Old Reinforced Concrete: An Elastic Modulus-Mineralogy Characterization. Corros. Sci. 2021, 184, 109356. [Google Scholar] [CrossRef]
- Han, C. Corrosion Behavior and Mechanical Performance of Weathering Steel in Industrial and Rural Atmospheric Environments. Constr. Build. Mater. 2024, 411, 134284. [Google Scholar] [CrossRef]
- Guo, Q. Corrosion Evolution and Mechanical Property Deterioration of Q355NH Weathering Steel in Long-Term Neutral Salt Spray Environment. Constr. Build. Mater. 2024, 411, 134193. [Google Scholar] [CrossRef]
- Hu, Q. Corrosion Failure Analysis of Engineering Structural Steels in Tropical Marine Atmospheres: A Comparative Study of Ordinary and New Weathering Steels. Eng. Fail. Anal. 2024, 156, 107830. [Google Scholar] [CrossRef]
- Motta, M.; Fedrizzi, L.; Andreatta, F. Corrosion Stiction in Automotive Braking Systems. Materials 2023, 16, 3710. [Google Scholar] [CrossRef]
- Arceo-Gómez, D.E.; Reyes-Trujeque, J.; Balderas-Hernández, P.; Carmona-Hernández, A.; Espinoza-Vázquez, A.; Galván-Martínez, R.; Orozco-Cruz, R. Performance and Surface Modification of Cast Iron Corrosion Products by a Green Rust Converter (Mimosa tenuiflora Extract). Surfaces 2024, 7, 143–163. [Google Scholar] [CrossRef]
- Sun, M.; Du, C.; Liu, Z.; Liu, C.; Li, X.; Wu, Y. Fundamental Understanding on the Effect of Cr on Corrosion Resistance of Weathering Steel in Simulated Tropical Marine Atmosphere. Corros. Sci. 2021, 186, 109427. [Google Scholar] [CrossRef]
- Seechurn, Y.; Surnam, B.Y.R.; Wharton, J.A. Marine Atmospheric Corrosion of Carbon Steel in Mauritius. Mater. Today Proc. 2023; in press. [Google Scholar] [CrossRef]
- Artigas, A.; Bustos, O.; Sipos, K.; Garza-Montes-de-Oca, N.F.; Seco, R.; Monsalve, A.; Mena, J. Influencia de Ni y Ti en la respuesta a la corrosión marina simulada de un acero autopatinable A242. Matéria (Rio J.) 2015, 20, 646–652. [Google Scholar] [CrossRef]
- Díaz, I.; Cano, H.; Lopesino, P.; De La Fuente, D.; Chico, B.; Jiménez, J.A.; Medina, S.F.; Morcillo, M. Five-Year Atmospheric Corrosion of Cu, Cr and Ni Weathering Steels in a Wide Range of Environments. Corros. Sci. 2018, 141, 146–157. [Google Scholar] [CrossRef]
- Fras, E.; José, L.; Serrano, T.; Anastacio Bustos, A. Fundiciones de Hierro: Estructuras—Propiedades—Fabricación; Instituto Tecnológico de Saltillo—ITS: Saltillo, Mexico, 1990; pp. 10–11, 83. [Google Scholar]
- ASTM B117-19; Standard Practice for Operating Salt Spray (Fog) Apparatus. ASTM International: West Conshohocken, PA, USA, 2023.
- Artigas, A.; Monsalve, A.; Sipos, K.; Bustos, O.; Mena, J.; Seco, R.; Garza-Montes-de-Oca, N. Development of Accelerated Wet–Dry Cycle Corrosion Test in Marine Environment for Weathering Steels. Corros. Eng. Sci. Technol. 2015, 50, 628–632. [Google Scholar] [CrossRef]
- ASTM G1-03(2019); Standard Practice for Preparing, Cleaning, and Evaluating Corrosion Test Specimens. ASTM International: West Conshohocken, PA, USA, 2019.
- Zhang, Z.; Studer, P.; Angst, U. A Multi-technique Study of Corrosion Products at the Steel Concrete Interface under two exposure conditions. J. Microsc. 2022, 286, 191–197. [Google Scholar] [CrossRef]
- Melchers, R.E. A New Interpretation of the Corrosion Loss Processes for Weathering Steels in Marine Atmospheres. Corros. Sci. 2008, 50, 3446–3454. [Google Scholar] [CrossRef]
- Cook, D.C.; Oh, S.J.; Balasubramanian, R.; Yamashita, M. The Role of Goethite in the Formation of the Protective Corrosion Layer on Steels. Hyperfine Interact. 1999, 122, 59–70. [Google Scholar] [CrossRef]
- Kimura, M.; Shigesato, G.; Tanabe, K.; Suzuki, T.; Kihira, H. Fe(O,OH)6 Network Structure of Rust Formed on Weathering Steel Surfaces and Its Relationship with Corrosion Resistancee. Surf. Interface Anal. 2003, 35, 66–71. [Google Scholar] [CrossRef]
- Jiang, S. Effect of Ni on the Oxidation Behavior of Corrosion Products That Form on Low Alloy Steel Exposed to a Thin Electrolyte Layer Environment. Corros. Sci. 2022, 206, 110471. [Google Scholar] [CrossRef]
- Crespo, A.; Pérez, G.; Jiménez, J.A.; Llorente, I.; Martínez-Ramírez, S.; Cano, E.; Díaz, I. Evolution and Evaluation of Aesthetic Properties in Weathering Steel Accelerated Patinas: The Role of Lepidocrocite. Metals 2022, 12, 977. [Google Scholar] [CrossRef]


| Alloy | %C | %Si | %Mn | %S | %P | %Cr | %Ni | %Cu | %Fe |
|---|---|---|---|---|---|---|---|---|---|
| 0Cu-0Ni | 4.22 | 3.300 | 0.550 | 0.010 | 0.005 | 0.170 | 0.030 | 0.010 | Balance |
| 0Cu-2Ni | 4.240 | 3.280 | 0.670 | 0.015 | 0.012 | 0.171 | 2.040 | 0.020 | |
| 1Cu-0Ni | 4.250 | 3.150 | 0.660 | 0.016 | 0.016 | 0.188 | 0.030 | 1.030 | |
| 1Cu-2Ni | 4.230 | 3.000 | 0.610 | 0.012 | 0.009 | 0.158 | 2.030 | 1.020 |
Disclaimer/Publisher’s Note: The statements, opinions and data contained in all publications are solely those of the individual author(s) and contributor(s) and not of MDPI and/or the editor(s). MDPI and/or the editor(s) disclaim responsibility for any injury to people or property resulting from any ideas, methods, instructions or products referred to in the content. |
© 2024 by the authors. Licensee MDPI, Basel, Switzerland. This article is an open access article distributed under the terms and conditions of the Creative Commons Attribution (CC BY) license (https://creativecommons.org/licenses/by/4.0/).
Share and Cite
Bruna, H.; Allende-Seco, R.; Artigas, A.; Monsalve, A.; Sánchez, C. Effect of Copper and Nickel Content on the Corrosion Mechanisms in Ferritic Matrix Gray Cast Irons under Simulated Marine Environments. Metals 2024, 14, 696. https://doi.org/10.3390/met14060696
Bruna H, Allende-Seco R, Artigas A, Monsalve A, Sánchez C. Effect of Copper and Nickel Content on the Corrosion Mechanisms in Ferritic Matrix Gray Cast Irons under Simulated Marine Environments. Metals. 2024; 14(6):696. https://doi.org/10.3390/met14060696
Chicago/Turabian StyleBruna, Hector, Rodrigo Allende-Seco, Alfredo Artigas, Alberto Monsalve, and Christian Sánchez. 2024. "Effect of Copper and Nickel Content on the Corrosion Mechanisms in Ferritic Matrix Gray Cast Irons under Simulated Marine Environments" Metals 14, no. 6: 696. https://doi.org/10.3390/met14060696
APA StyleBruna, H., Allende-Seco, R., Artigas, A., Monsalve, A., & Sánchez, C. (2024). Effect of Copper and Nickel Content on the Corrosion Mechanisms in Ferritic Matrix Gray Cast Irons under Simulated Marine Environments. Metals, 14(6), 696. https://doi.org/10.3390/met14060696